UC Santa Cruz Tesla at Freedom SCIPP UC Santa Cruz UC Santa Cruz Tesla at Freedom E.S.
FIRST 5 SANTA CRUZ COUNTY
July 1, 2014 - June 30, 2015
October 2015
ANNUAL EVALUATION REPORT
Acknowledgements
First 5 Santa Cruz County would like to acknowledge Applied Survey Research for their evaluation
support and assistance. First 5 Santa Cruz County also thanks Nicole Young, of Optimal Solutions
Consulting, for the close collaboration in crafting the procedures necessary to successfully evaluate
the Triple P program.
First 5 Santa Cruz County would also like to thank the staff and participants of the funded partner
agencies whose commitment to data collection has facilitated the gathering of the robust data
included in this report.
First 5 Santa Cruz County Applied Survey Research Optimal Solutions Consulting
David G. Brody Stephanie Bluford Vicki Boriack Barbara Dana Alicia Fernandez Irene Freiberg Holly Maclure Christine Sieburg Karen Sullivan Xochitl Ybarra Alicia Zenteno
Lisa Colvig-Niclai Kim Carpenter Javier Salcedo Emmeline Taylor
Nicole M. Young
FIRST 5 SANTA CRUZ COUNTY 2014-2015 ANNUAL EVALUATION REPORT TABLE OF CONTENTS
FIRST 5 SANTA CRUZ COUNTY i
Table of Contents
Executive Summary ........................................................................ 1
Overall Well-Being of Children in the County ............................................................................ 3
A Profile of First 5 Participants ................................................................................................. 5
Healthy Children ...................................................................................................................... 6
Strong Families ........................................................................................................................ 8
Children Learning and Ready for School ................................................................................. 10
Service Integration & Community Strengthening .................................................................... 14
Summary ............................................................................................................................... 15
Part 1: Strategic Framework Results ............................................ 17
First 5 Santa Cruz County’s Strategic Framework .................................................................... 18
Overall Well-Being of Children in the County .................................................................... 19
A Profile of Santa Cruz County’s Youngest Children ................................................................ 19
County-Wide Trends in Indicators of Child and Family Well-Being .......................................... 20
Profile of Participants ......................................................................................................... 21
Number of Children and Families Served ................................................................................ 21
Increase Services into Communities with the Highest Needs .................................................. 23
Early Childhood Educators Served by First 5 Partners ............................................................. 26
Healthy Children ................................................................................................................ 27
Increase Insurance Coverage .................................................................................................. 27
Increase Use of Medical/Dental Homes .................................................................................. 31
Increase Use of Preventive Health Services ............................................................................ 33
Increase Number of Children Reaching Developmental Milestones ........................................ 34
Strong Families .................................................................................................................. 37
Decrease Child Abuse and Neglect ......................................................................................... 37
Improve Parent and Caregiver Practices that Support Children’s Social and Emotional Development ......................................................................................................................... 39
Children Learning and Ready for School ........................................................................... 47
Increase the Quality of Early Learning Programs ..................................................................... 47
Improve Early Literacy Skills of Children ................................................................................. 52
Service Integration & Community Strengthening ................................................................ 69
First 5 Service Integration ....................................................................................................... 69
First 5 Fiscal Status and Sustainability .................................................................................... 70
Community Strengthening ..................................................................................................... 72
TABLE OF CONTENTS FIRST 5 SANTA CRUZ COUNTY 2014-2015 ANNUAL EVALUATION REPORT
ii FIRST 5 SANTA CRUZ COUNTY
Part 2: Partner Profiles ................................................................ 75
Healthy Children ................................................................................................................. 77
Healthy Kids Initiative ............................................................................................................ 77
Stanford Neurodevelopmental Foster Care Clinic ................................................................... 81
Strong Families ................................................................................................................... 86
Families Together .................................................................................................................. 86
Triple P – Positive Parenting Program .................................................................................... 97
Triple P Highlights ................................................................................................................................... 99
Population Served ................................................................................................................................. 111
Details of Program Participation .......................................................................................................... 114
Building a Population-Based System of Parent Education ................................................................... 121
La Manzana Community Resources ...................................................................................... 124
Mountain Community Resources ......................................................................................... 131
Side-by-Side ......................................................................................................................... 138
Children Learning and Ready for School .......................................................................... 141
Quality Early Learning Initiative ........................................................................................... 141
Race to the Top – Early Learning Challenge ......................................................................................... 141
Child Signature Program (CSP) ............................................................................................................. 143
Starlight Children’s Center ................................................................................................... 147
Early Literacy Foundations (ELF) Initiative ............................................................................ 151
SEEDS of Early Literacy ......................................................................................................................... 152
Santa Cruz Reading Corps..................................................................................................................... 154
Raising A Reader .................................................................................................................. 170
Summer Pre-K Academy ...................................................................................................... 173
Transition to Kindergarten ................................................................................................... 175
Transition to Kindergarten Workshops ................................................................................................ 175
Appendices ................................................................................ 177
Appendix A: First 5 Santa Cruz County Strategic Framework ................................................ 179
Appendix B: Race to the Top–Hybrid Quality Continuum Framework and Tiers Matrix ......... 181
Appendix C: Measurement Tools ......................................................................................... 183

FIRST 5 SANTA CRUZ COUNTY 2014-2015 ANNUAL EVALUATION REPORT TABLE OF FIGURES
FIRST 5 SANTA CRUZ COUNTY iii
Table of Figures
Figure 1: Number of County Children ages 0-5 .................................................................................................................. 19
Figure 2: Ethnicity of County Children ages 0-5 (2015) ..................................................................................................... 19
Figure 3: English Language Proficiency of County Kindergarteners (2014-15) .................................................................. 19
Figure 4: Number of Services to Children and Parents, by Goal Area (2014-2015) ........................................................... 21
Figure 5: Percentage of Children 0-5 in Santa Cruz County Served by First 5 .................................................................... 22
Figure 6: Demographics of Children Participating in First 5 Programs, by Year ................................................................. 23
Figure 7: Levels of Children’s Vulnerability in Santa Cruz County, by ZIP code .................................................................. 24
Figure 8: Distribution of County Children Who Received Services, by ZIP Code (2014-2015) ............................................... 25
Figure 9: Number of County Children Who Received Services, by ZIP Code (2014-2015) ................................................ 25
Figure 10: Percentage of Children Ages 0-5 Estimated to be Insured .................................................................................. 27
Figure 11: Number of Children (Ages 0-5) Newly Enrolled in Publicly-Funded Health Insurance Programs (with Assistance from First 5-funded CAAs) ................................................................................................................. 29
Figure 12: Newborn Enrollment Project Statistics (2014-2015) ........................................................................................... 30
Figure 13: Percentage of County Children Enrolled in Healthy Kids (Ages 2-6) Who Had Access to a Primary Care Practitioner .................................................................................................................................... 31
Figure 14: Percentage of Children (Ages 0-5) Who Utilized Health Care Prior to Renewal in an Insurance Program (renewed through First 5-funded CAAs) ............................................................................................................. 31
Figure 15: Percentage of County Children Receiving Dental Care ....................................................................................... 32
Figure 16: Rate of California Children Visiting the ED for Preventable Dental Conditions (per 100,000, Ages 0-5) ............ 32
Figure 17: Percentage of County Children (Ages 3-6) the County Enrolled in Healthy Kids Who Received a Well-Child Visit .................................................................................................................................................... 33
Figure 18: Number of Emergency Department Visits (Infants Less Than One Year Old) ..................................................... 34
Figure 19: Percentage of County Children in Kindergarten Enrolled in Special Education .................................................. 34
Figure 20: Demographics of the Children (Ages 0-5) Participating in the SNDFCC (2011-2015) .......................................... 35
Figure 21: Percentage of Children in SNDFCC (Ages 0-5) With These Diagnoses and Services, at Intake (2011-2015) ....... 36
Figure 22: Percentage of Children in SNDFCC (Ages 0-5) Provided With These Referrals (2011-2015) ............................... 36
Figure 23: Rate of Substantiated Allegations of Child Maltreatment in Santa Cruz County and California (per 1,000)....... 37
Figure 24: Change in Families’ Risk Levels During Participation in the Families Together Program (July 2007 – June 2015) ....................................................................................................................................... 38
Figure 25: Impact of Triple P on Parents with More Serious Parenting Issues..................................................................... 41
Figure 26: Parents’ Use of Positive Parenting Styles (2010-2015) ....................................................................................... 44
Figure 27: Number of Child Behaviors Perceived to Be a Problem (2010-2015) .................................................................. 46
Figure 28: Ratings of QRIS Sites in Santa Cruz County ......................................................................................................... 49
Figure 29: Percentage of 3rd Grade Students Performing at the Proficient/Advanced Levels In English/Language Arts ..... 52
Figure 30: Achievement Levels of 3rd Grade Students In English Language Arts/Literacy (2015) ........................................ 53
Figure 31: Percentage of 3rd Grade Students—Who are English Learners—Performing at the Early Advanced/Advanced Levels In English Language Development ................................................................. 54
Figure 32: Number of Early Childhood Educators Who Have Completed SEEDS Trainings ........................................................ 58
Figure 33: Number of SEEDS-Trained Early Childhood Educators in Licensed Programs, by type of classroom (2007-2015) ......................................................................................................................................................... 59
Figure 34: Key Demographics of SEEDS-Trained Early Childhood Educators in Licensed Programs (2007-2015) ................ 59
Figure 35: Number of Children Participating in Raising A Reader (2014-2015) ................................................................... 60
Figure 36: Reading Corps Classrooms: Children Ages 4+ Who Are At/Above Targets for Later Reading Success, in English (2012-2015) ............................................................................................................................................ 63
Figure 37: Children in Reading Corps Classrooms: Average Scores and Average Growth in Scores (Fall to Spring) – in English .......................................................................................................................................................... 64

TABLE OF FIGURES FIRST 5 SANTA CRUZ COUNTY 2014-2015 ANNUAL EVALUATION REPORT
iv FIRST 5 SANTA CRUZ COUNTY
Figure 38: Impact of Tailored Interventions on Children’s Proficiency in Key Pre-Literacy Skills (2014-2015) – in English .......................................................................................................................................................... 66
Figure 39: Impact of Tailored Interventions: Average Scores and Average Growth in Scores (Fall to Spring) ..................... 67
Figure 40: Changes in Students’ Letter Sound Recognition Skills After Participation in the Migrant Education Summer Pre-K Academy (2015) .......................................................................................................................... 68
Figure 41: Percentage of Children Receiving Services from Multiple First 5 Partners ......................................................... 69
Figure 42: Statement of Activities, Fiscal Year 2014-2015 ................................................................................................... 70
Figure 43: Amount of Funding Leveraged by Partners, by Type (2014-2015) ...................................................................... 71
Figure 44: Total Amount of First 5 Funding and Leveraged Investments (2014-2015) ........................................................ 71
Figure 45: Number of 2-1-1 Callers, Needs, and Service Referrals ...................................................................................... 72
Figure 46: Types of 2-1-1 Callers’ Needs (2011-2015) ......................................................................................................... 73
Figure 47: Types of 2-1-1 Service Referrals (2011-2015) ..................................................................................................... 73
Figure 48: Newborn Enrollment Project Statistics (2014-2015) ........................................................................................... 79
Figure 49: Number of Emergency Department Visits (Infants Less Than One Year Old) ..................................................... 80
Figure 50: Demographics of the Children (Ages 0-5) Participating in the SNDFCC (2011-2015) ................................................. 84
Figure 51: Percentage of Children in SNDFCC (Ages 0-5) With These Diagnoses and Services, at Intake (2011-2015) ....... 84
Figure 52: Percentage of Children in SNDFCC (Ages 0-5) Provided With These Referrals (2011-2015) ............................... 85
Figure 53: Case Flow Diagram (2014-2015) ......................................................................................................................... 88
Figure 54: Percentage of Families Together Participants Who Showed Decreased Risk of Child Maltreatment ................. 89
Figure 55: Change in Families’ Risk Levels During Participation in the Families Together Program (July 2007 – June 2015) ....................................................................................................................................... 90
Figure 56: Percentage of Families Together Participants Who Do Not Have a Substantiated Allegation of Maltreatment Within 6 Months After Case Closure ........................................................................................... 91
Figure 57: Child Welfare Issues Occurring After Exit from Families Together (2014) .......................................................... 91
Figure 58: Increases in Positive Parenting (Families Together: 2010-2015)......................................................................... 92
Figure 59: Parents’ Use of Positive Parenting Styles (Families Together: 2010-2015) ......................................................... 93
Figure 60: Number of Parenting Issues That Have Been a Source of Conflict Between Parents (Families Together: 2010-2015) .......................................................................................................................................................... 94
Figure 61: Level of Parental Depression, Anxiety, and Stress (Families Together: 2010-2015) ........................................... 95
Figure 62: Number of Child Behaviors Perceived to Be a Problem (Families Together: 2010-2015) ................................... 96
Figure 63: Parents’ Satisfaction with Various Aspects of the Triple P Program (Families Together: 2010-2015) ................ 96
Figure 64: Demographics of Triple P Parents/Guardians (2010-2015) ............................................................................... 112
Figure 65: Ages of Children Chosen as the “Index” Child (2010-2015) .............................................................................. 113
Figure 66: Types of Services Provided (2010-2015) ........................................................................................................... 113
Figure 67: How Participants First Heard about Triple P (2010-2015) ................................................................................. 114
Figure 68: Percentage of Participants Who First Heard about Triple P from Media and Advertisements ......................... 114
Figure 69: Percentage of Parents Who Completed Their Multi-Session Triple P Services (2010-2015) ............................. 115
Figure 70: Percentage of Parents Whose Satisfaction with Their Partner Improved, With and Without Participation with Another Adult (2010-2015) ....................................................................................................................... 116
Figure 71: Parents’ Satisfaction with the Triple P Program (2010-2015) ........................................................................... 117
Figure 72: Number and Types of Organizations with Accredited Triple P Practitioners, by Triple P Level (2014-2015) .... 121
Figure 73: Number of Accredited Triple P Practitioners .................................................................................................... 122
Figure 74: Types of Triple P Services Provided (LMCR: 2014-15) ....................................................................................... 125
Figure 75: Increases in Positive Parenting (LMCR: 2010-2015) .......................................................................................... 125
Figure 76: Parents’ Use of Positive Parenting Styles (LMCR: 2010-2015) .......................................................................... 126
Figure 77: Number of Parenting Issues That Have Been a Source of Conflict Between Parents (LMCR: 2010-2015) ........ 127
Figure 78: Level of Parental Depression, Anxiety, and Stress (LMCR: 2010-2015)............................................................. 127
Figure 79: Number of Child Behaviors Perceived to Be a Problem (LMCR: 2010-2015) .................................................... 129
FIRST 5 SANTA CRUZ COUNTY 2014-2015 ANNUAL EVALUATION REPORT TABLE OF FIGURES
FIRST 5 SANTA CRUZ COUNTY v
Figure 80: Parents’ Satisfaction with Various Aspects of the Triple P Program (LMCR: 2010-2015) ................................. 130
Figure 81: Types of Triple P Services Provided (MCR: 2014-15) ......................................................................................... 132
Figure 82: Parents’ Use of Positive Parenting Styles (MCR: 2010-2015) ............................................................................ 133
Figure 83: Number of Parenting Issues That Have Been a Source of Conflict Between Parents (MCR: 2010-2015) ......... 133
Figure 84: Level of Parental Depression, Anxiety, and Stress (MCR: 2010-2015) .............................................................. 134
Figure 85: Number of Child Behaviors Perceived to Be a Problem (MCR: 2010-2015) ...................................................... 136
Figure 86: Parents’ Satisfaction with Various Aspects of the Triple P Program (MCR: 2010-2015) ................................... 137
Figure 87: Distribution of RTT-ELC Sites in the County (2014-15) ...................................................................................... 142
Figure 88: Ratings of QRIS Sites in Santa Cruz County ....................................................................................................... 144
Figure 89: Changes in Levels in Key Developmental Areas (2014-15) ................................................................................ 149
Figure 90: Number of SEEDS-Trained Early Childhood Educators in Licensed Programs, by type of classroom (2007-2015) ....................................................................................................................................................... 156
Figure 91: Key Demographics of SEEDS-Trained Early Childhood Educators in Licensed Programs (2007-2015) .............. 157
Figure 92: Preschool and Transitional Kindergarten Classrooms: Support for Language and Literacy (2014-2015) ......... 158
Figure 93: Preschool and Transitional Kindergarten Classrooms: Key Language and Literacy Supports (2007-2015) ....... 159
Figure 94: Family Child Care Settings: Support for Language and Literacy (2007-2015) ................................................... 161
Figure 95: Reading Corps Classrooms: Children Ages 4+ Who Are At/Above Targets for Later Reading Success, in English (2012-2015) ....................................................................................................................................... 163
Figure 96: Children in Reading Corps Classrooms: Average Scores and Average Growth in Scores (Fall to Spring) – in English ........................................................................................................................................................ 164
Figure 97: Impact of Tailored Interventions on Children’s Proficiency in Key Pre-Literacy Skills (2014-2015) – in English ........................................................................................................................................................ 166
Figure 98: Impact of Tailored Interventions: Average Scores and Average Growth in Scores (Fall to Spring) ................... 168
Figure 99: Percentage of RAR Providers Who Noted These Key Pre-Literacy Findings (2014-15) ..................................... 171
Figure 100: Percentage of RAR Parents Who Practiced These Key Pre-Literacy Activities with Their Child (2014-15) ........ 172
Figure 101: Summer Pre-K Academy Letter Sound Recognition Results (2015) .................................................................. 174
Figure 102: Percentage of Summer Pre-K Academy Students who Increased Their Letter Sound Recognition By At Least 5 Letter Sounds ................................................................................................................................... 174
Figure 103: Average Increase in the Number of Letter Sounds Recognized by Summer Pre-K Academy Students ............. 174

TABLE OF FIGURES FIRST 5 SANTA CRUZ COUNTY 2014-2015 ANNUAL EVALUATION REPORT
vi FIRST 5 SANTA CRUZ COUNTY
FIRST 5 SANTA CRUZ COUNTY 2014-2015 ANNUAL EVALUATION REPORT EXECUTIVE SUMMARY
FIRST 5 SANTA CRUZ COUNTY 1
EXECUTIVE SUMMARY

EXECUTIVE SUMMARY FIRST 5 SANTA CRUZ COUNTY 2014-2015 ANNUAL EVALUATION REPORT
2 FIRST 5 SANTA CRUZ COUNTY

FIRST 5 SANTA CRUZ COUNTY 2014-2015 ANNUAL EVALUATION REPORT EXECUTIVE SUMMARY
FIRST 5 SANTA CRUZ COUNTY 3
EXECUTIVE SUMMARY
The Importance of Investing in Young Children
A growing body of scientific evidence points to the economic and societal impacts of wise
investments in the early years. The Harvard Center for the Developing Child states:
A vital and productive society with a prosperous and sustainable future is built on a foundation of
healthy child development. Health in the earliest years lays the groundwork for a lifetime of
vitality.
Experiences during the first few years of life – good and bad – literally
shape the architecture of the developing brain. Stable, positive
relationships with adults and growth-promoting experiences are keys to
the development of the architecture that forms the foundation for all
future learning, behavior, and health. When we invest wisely in children
and families, the next generation will pay that back through a lifetime of
productivity and responsible citizenship.1
First 5 Santa Cruz County is dedicated to giving children the opportunities
they need to reach their full potential.
Overview of this Report
The Strategic Plan for 2012-2015 articulates community goals and results
in goal areas of Healthy Children, Strong Families, Children Learning and
Ready for School, and Family Friendly Integrated Services.
This annual report summarizes findings of the First 5 Santa Cruz County
evaluation from July 1, 2014 to June 30, 2015. Many programs are multi-
year investments, and therefore some information presented reflects
multiple years of data.
Overall Well-Being of Children in the County First 5 Santa Cruz County invests in health, early learning, and family support to promote the well-
being of children. To help guide its investments and partnerships, First 5 monitors county-wide
trends that affect child well-being. The year 2014-2015 marks the third year of the 2012-2015
strategic plan, and the following data reflect the current status of the County:
Santa Cruz County has a growing and diverse population of young children. In 2015, there
were 18,824 children ages 0-5 in Santa Cruz County, the majority of whom were either
Hispanic (56%), or White (37%). This diversity continues into kindergarten, where in 2015
almost 43% of children had a primary language other than English.
1 http://developingchild.harvard.edu
First 5 Santa Cruz County’s Vision
All Santa Cruz County
children enter school
ready to achieve to
their greatest potential.
First 5 Santa Cruz County’s MissionTo help children
succeed in school and in
life, First 5 Santa Cruz
County invests in
health, early learning,
and family support to
promote optimal
development of Santa
Cruz County children.
EXECUTIVE SUMMARY FIRST 5 SANTA CRUZ COUNTY 2014-2015 ANNUAL EVALUATION REPORT
4 FIRST 5 SANTA CRUZ COUNTY
Unemployment Is falling, but varies greatly across the County. The County’s falling
unemployment rate reflects the slow recovery from the economic recession. With a current
unemployment rate in the County of 8%, it is lower than it was in 2011 (13%).2 Within the
County, the percent of unemployed residents differs greatly by
area; the average unemployment rate ranges from 4% in Felton
to 10% in Watsonville.
Salaries are rising, but many are still living in poverty. Although
the median family income has been rising, it is still not enough
for many in this County to make ends meet. Almost 17% of all
people in the County are earning less that the Federal Poverty
Level, and 18% of all children ages 0-5 are living in poverty.
When incomes are measured using the Self-Sufficiency Standard,
which is a more comprehensive measure of income adequacy
than the Federal Poverty Level, 60% of families in Santa Cruz
County are not able to meet their basic needs.
There is varying enrollment in public assistance programs. Over
the last five years there has been a 41% increase in the number
of residents participating in CalFresh (Food Stamps), and the number of County students
receiving Free and Reduced Price Meals has increased 12%. Interestingly, over the last five
years the enrollment in the Women, Infants, & Children Program slightly decreased (-8%),
and the number of County residents participating in CalWORKS decreased 20%.
Not enough young mothers are receiving prenatal care in the first trimester. In 2014, the
percentage of mothers who received prenatal care in their first trimester was high – 80% —
which exceeded the Healthy People 2020 target rate of 78%. However, younger mothers
(ages 24 and younger) tended to fall below this target rate, with only 68% receiving first
trimester care. Additionally, there were differences in receipt of early prenatal care based
upon the mother’s source of payment for the care. In 2014, only 72% of mothers with
Medi-Cal began receiving prenatal care during the first trimester, compared to 90% of
mothers with private insurance.
The percentage of births to teen mothers in the County is slowly decreasing. In 2014, the
percentage of births to teen mothers represented 6% of all births in Santa Cruz County, and there
was a teen birth rate of 18 per 1,000 (ages 15-19). In the last five years there was a slight decrease
both in births to teen mothers and in the teen birth rate. Taken together, the two measures
indicate a slowly decreasing proportion of teens in the County who are becoming mothers.
Over half of the births by women in the County were paid for by Medi-Cal. In 2014, 53% of
births, across all age groups, were paid for by Medi-Cal. However, Medi-Cal was utilized by
83% of the births to women under the age of 25.
2 In January 2015 the U.S. Bureau of Labor Statistics substantially changed the methodology used to calculate unemployment rates and
introduced population adjustments based upon the 2010 Census, which resulted in significant changes to unemployment rates. Only the years that were updated (2010-2015) are included in this report.
- National Center for Children in Poverty, 2014 < http://www.nccp.org>
“Poverty can impede children’s
ability to learn and contribute to
social, emotional, and behavioral
problems. Poverty also can
contribute to poor health and
mental health.
Risks are greatest for children who
experience poverty when they are
young and/or experience deep and
persistent poverty.
Research is clear that poverty is the
single greatest threat to children’s
well-being.”
FIRST 5 SANTA CRUZ COUNTY 2014-2015 ANNUAL EVALUATION REPORT EXECUTIVE SUMMARY
FIRST 5 SANTA CRUZ COUNTY 5
A Profile of First 5 Participants
First 5 Santa Cruz County reaches children who can make great gains with early and smart investments
First 5’s goal is to serve the most vulnerable children ages 0-5 and their families in Santa Cruz
County, including very low-income families, English language learners, and families who live in
higher risk zones of the County.
First 5-supported programs are wide-reaching: In 2014-15, First 5 partners served 6,328 children
ages 0-5 (unduplicated), representing 34% of all children these ages in Santa Cruz County.
First 5 serves a high number of dual language learners: Of the children served by First 5, 77%
were Latino, and 58% of children spoke Spanish in their household. Of all Latino children ages
0-5 in Santa Cruz County, 46% participated in services funded by First 5.
First 5 is serving children in the highest risk zones of the County. Of the children served who
had known ZIP codes, most (88%) lived in the areas of the County that rank highest on a
cumulative index of risk factors that included measures of linguistic isolation, family income,
birth statistics, parental education attainment, child maltreatment and family violence. These
areas include Watsonville, Freedom, Live Oak, and some areas in the city of Santa Cruz.
First 5 strengthens systems by enhancing the capacity of service providers
In addition to supporting direct services to children and families, First 5 aims to boost the capacity of
local systems in order to extend the reach of critical early education, family support, and health
services to a larger number of children and families. Systems enhancements help ensure better
services for years to come.
Examples of First 5’s capacity-building work in 2014-2015 include:
Skill development and coaching for early childhood educators. In 2014-15, 69 early
childhood educators from preschools and family child care homes received professional
development training from the SEEDS of Early Literacy program, 92 providers attended a
Race to the Top (RTT) Workshop and received a stipend, and 23 Family Child Care providers
received a stipend to participate in Race to the Top - Early Learning Challenge (RTT ELC). In
addition, staff in 57 state and federally funded classrooms and 23 Family Child Care homes
who participated in the Race to the Top – Early Learning Challenge quality improvement
efforts received professional development training; hundreds of early childhood educators
who provided the Raising A Reader program to children received training in promoting pre-
literacy skills; and 49 staff/child care providers received early childhood and mental health
training from Side-by-Side Clinician/Consultants.

EXECUTIVE SUMMARY FIRST 5 SANTA CRUZ COUNTY 2014-2015 ANNUAL EVALUATION REPORT
6 FIRST 5 SANTA CRUZ COUNTY
Development of a population-based system of parent education. In 2015, 24 new parent
education practitioners received training to deliver the Triple P – Positive Parenting Program,
an evidence-based curriculum shown to improve parental efficacy, parent-child interaction,
and child behaviors. A total of 165 Triple P practitioners have now been trained in Santa Cruz
County to provide these services.
Distribution of information to community service providers. Thirteen health, social services,
and early education providers received information through First 5’s “Achieving Excellence in
Customer Service” trainings, and 763 Kits for New Parents were shipped to clinics, hospitals,
service providers, and events throughout the County, for distribution to individuals.
Healthy Children
For the past several years, First 5 Santa Cruz County has invested in strategies to help ensure that all
children have access to care. Though coverage rates are high in the County, there are still children
who do not have health insurance.
First 5 Santa Cruz County insures children
First 5 helps uninsured children enroll in health plans: In 2004, First 5 Santa Cruz County
helped create a new children’s health initiative called Healthy Kids. Healthy Kids has Certified
Application Assisters who provide outreach and assistance to income-eligible families to help
them apply for public health insurance. Because Medi-Cal and Covered California cannot cover all
of the uninsured, First 5 also funds the premiums for children who qualify for the local Healthy
Kids health insurance plan.
Children are getting enrolled in public health insurance plans. Since the start of the Healthy
Kids Initiative in 2004, Certified Application Assistors (CAAs) have assisted with the
applications to enroll 16,111 children ages 0-5 in public health insurance.
The enrollment numbers in public health insurance plans have shown
dramatic changes as families take advantage of some new
opportunities and accommodate the changing eligibility requirements
of various plans.
Children are using their health insurance. During the 2014-2015
year, nearly all children (95%) who received renewal assistance
through First 5-funded CAAs in a public insurance program had
utilized their benefits prior to their renewal, continuing the trend
of high utilization across the years.
Santa Cruz County’s newborns are getting connected to medical care. During 2014-15, Baby
Gateway—the Newborn Enrollment Project—provided 87% of all mothers with a newborn
Since 2004, the Healthy Kids
Initiative has helped 16,111
children ages 0-5 apply for
public health insurance.
In 2014-15, Baby Gateway
assisted 70% of all mothers who
had Medi-Cal births to complete
a Medi-Cal application for their
new babies.
FIRST 5 SANTA CRUZ COUNTY 2014-2015 ANNUAL EVALUATION REPORT EXECUTIVE SUMMARY
FIRST 5 SANTA CRUZ COUNTY 7
visit while in the hospital. Baby Gateway also assisted 70% of all mothers who had Medi-Cal
births to complete a Medi-Cal application for their new babies, and 80% of these mothers
identified a preferred primary care provider (PCP) or clinic for their child before discharge
from the hospital.
First 5 Santa Cruz County supports children to get a medical home, preventive care, and dental care
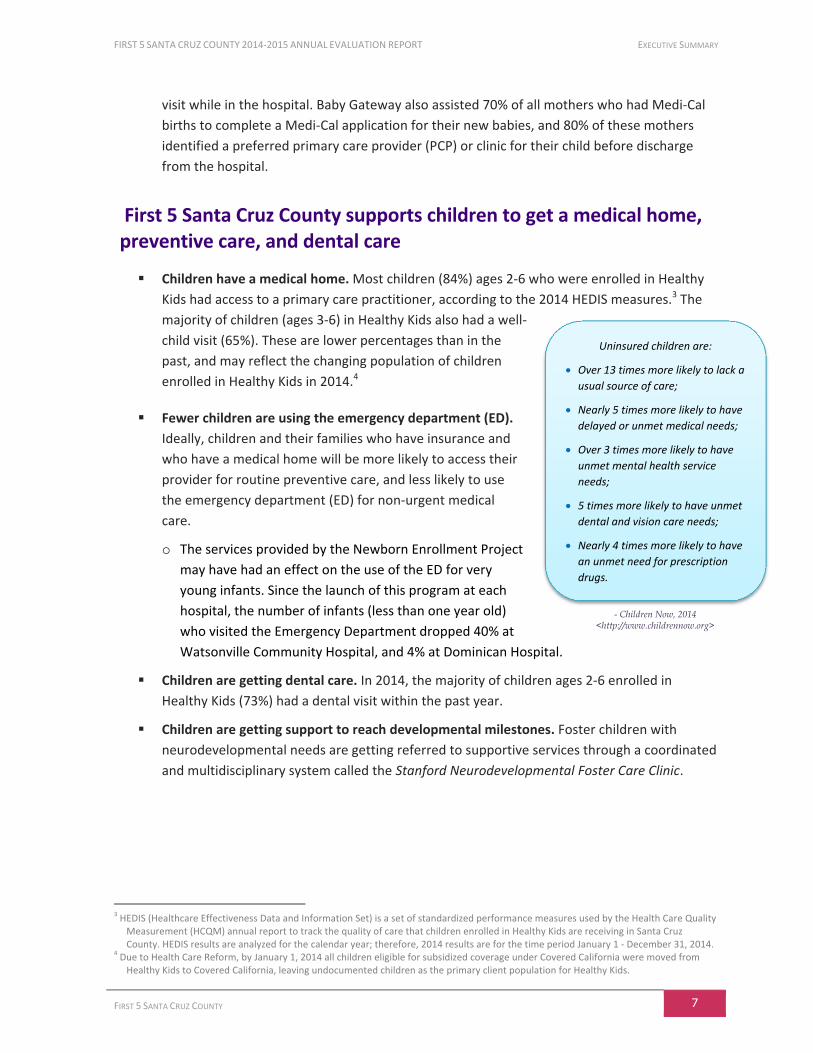
Children have a medical home. Most children (84%) ages 2-6 who were enrolled in Healthy
Kids had access to a primary care practitioner, according to the 2014 HEDIS measures.3 The
majority of children (ages 3-6) in Healthy Kids also had a well-
child visit (65%). These are lower percentages than in the
past, and may reflect the changing population of children
enrolled in Healthy Kids in 2014.4
Fewer children are using the emergency department (ED).
Ideally, children and their families who have insurance and
who have a medical home will be more likely to access their
provider for routine preventive care, and less likely to use
the emergency department (ED) for non-urgent medical
care.
o The services provided by the Newborn Enrollment Project
may have had an effect on the use of the ED for very
young infants. Since the launch of this program at each
hospital, the number of infants (less than one year old)
who visited the Emergency Department dropped 40% at
Watsonville Community Hospital, and 4% at Dominican Hospital.
Children are getting dental care. In 2014, the majority of children ages 2-6 enrolled in
Healthy Kids (73%) had a dental visit within the past year.
Children are getting support to reach developmental milestones. Foster children with
neurodevelopmental needs are getting referred to supportive services through a coordinated
and multidisciplinary system called the Stanford Neurodevelopmental Foster Care Clinic.
3 HEDIS (Healthcare Effectiveness Data and Information Set) is a set of standardized performance measures used by the Health Care Quality
Measurement (HCQM) annual report to track the quality of care that children enrolled in Healthy Kids are receiving in Santa Cruz County. HEDIS results are analyzed for the calendar year; therefore, 2014 results are for the time period January 1 - December 31, 2014.
4 Due to Health Care Reform, by January 1, 2014 all children eligible for subsidized coverage under Covered California were moved from
Healthy Kids to Covered California, leaving undocumented children as the primary client population for Healthy Kids.
Uninsured children are:
Over 13 times more likely to lack a
usual source of care;
Nearly 5 times more likely to have
delayed or unmet medical needs;
Over 3 times more likely to have
unmet mental health service
needs;
5 times more likely to have unmet
dental and vision care needs;
Nearly 4 times more likely to have
an unmet need for prescription
drugs.
- Children Now, 2014 <http://www.childrennow.org>
EXECUTIVE SUMMARY FIRST 5 SANTA CRUZ COUNTY 2014-2015 ANNUAL EVALUATION REPORT
8 FIRST 5 SANTA CRUZ COUNTY
Strong Families
Santa Cruz County historically has had higher rates of child abuse and neglect than other counties in
the Bay Area.5 Fortunately, the rates of child maltreatment are decreasing, and in 2014 the County
rate of substantiated allegations of child maltreatment was 6.8 per 1,000 , lower than the state-wide
rate (9.0 per 1,000).
First 5 Santa Cruz County helps strengthen parent-child relationships and reduce risk for child abuse and neglect
Through innovative programs, First 5 and its partners are helping to decrease the risk and incidence
of child abuse and neglect.
In partnership with the County’s Human Services Department-Family and Children’s Services
and Encompass Community Services, First 5 supports a program called
Families Together. Families Together is Santa Cruz County’s differential
response program, a strategy used to intervene early with families in which
there has been an allegation of abuse. This home visiting program includes
comprehensive intake and risk assessments, development of a tailored case
plan, parent support and education, child development activities, and
periodic assessments. Results of the program have been very encouraging:
○ Reduction of risk. Parents/primary caregivers receiving services
from Families Together had their levels of risk assessed while they were in
the program. Pre and post risk assessments for several years combined
indicated that families reduced their level of risk for future maltreatment.
o Reduced rates of child maltreatment. Results indicate that although some families are re-
referred to child welfare after exiting from Families Together, the rate of substantiated
abuse is low. This suggests that even though some families are still experiencing high risk
factors that lead to a child welfare report, they may have gained skills and resources
during their participation in Families Together that prevent court-mandated involvement
with child welfare.
First 5 continued the implementation of the Positive Parenting Program, or Triple P. The
program consists of five levels of intervention, from broad-based, universal efforts in the
community to more intensive, focused efforts with individual parents. The Triple P model is
an evidence-based program shown in numerous randomized studies to increase parental
confidence and efficacy, promote positive parent-child interactions and child behaviors, and
reduce rates of child maltreatment.
5 Center for Social Services Research, School of Welfare, U.C. Berkeley. Child Welfare Dynamic Report System, A California Department of
Social Services / University of California at Berkeley collaboration, 2013. The U.S. Office of Management and Budget defines the “Bay Area” as the 12 counties that comprise the San Jose-San Francisco-Oakland, CA Combined Statistical Area (CSA).
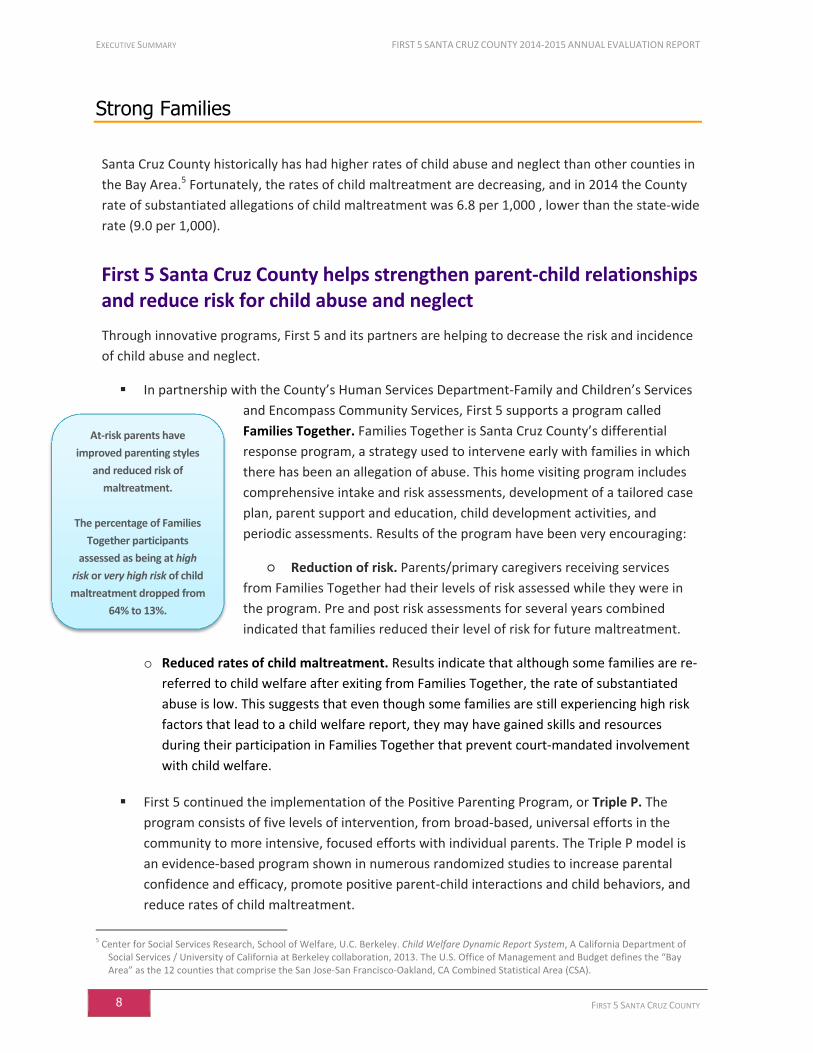
At-risk parents have
improved parenting styles
and reduced risk of
maltreatment.
The percentage of Families
Together participants
assessed as being at high
risk or very high risk of child
maltreatment dropped from
64% to 13%.
FIRST 5 SANTA CRUZ COUNTY 2014-2015 ANNUAL EVALUATION REPORT EXECUTIVE SUMMARY
FIRST 5 SANTA CRUZ COUNTY 9
Highlights of this program include:
o Evidence-based parenting support is available. First 5 has implemented all five levels of
Triple P in Santa Cruz County, ranging from a media campaign to intensive and focused
individual services. Between 2010-2015, approximately 7,331
parents with 13,246 children participated in the program.
o Parents are engaged and seek more opportunities. Over the
past several years, analyses have consistently shown that brief
services are an effective way of getting parents initially engaged
in the program, and gives them an opportunity to participate in
further services. Parents who attend Seminars and Workshops
frequently request follow-up services, and of parents who
participate in multiple services, those who begin with one or two brief consultations for
specific parenting concerns are likely to return later for in-depth consultations and multi-
session programs.
o Parenting skills and knowledge are improving along several domains. Parents who
completed assessments that measured their levels of parenting skills and knowledge along
several domains showed significant improvements in all domains, including:
Increased use of positive parenting styles Improved levels of confidence in
parenting Reduced levels of conflict over parenting Increased support in their role
as a parent Increased levels of satisfaction with their relationship with co-parents
Decreased levels of emotional difficulties Improvements in child behavior
Reduced levels of conflict between parents
o Parents with more serious parenting issues are making the greatest improvements.
There was also evidence that parents who began the program with more serious
parenting issues demonstrated the greatest improvements as a result of receiving in-
depth services (8 or more sessions). This is particularly true for both parents of
adolescents, and parents of children with special needs.
o Parents are satisfied with services. Parents have rated the quality of services very high, noting
that they had received the help they wanted, were dealing more effectively with problems in
their family, and would come back to the program if they needed to seek help again.
o Parents are continuing to use the skills they learned. On average, parents felt that the
Seminars and Workshops answered their questions, and that they would continue to use
the strategies they learned. In a survey of Triple P participants, the vast majority reported
experiencing significant and lasting benefits of Triple P services. On average, survey
participants had last participated in Triple P services 10 months prior to the interview. Of
these, 95% reported they continue to use strategies learned from Triple P.
Provision of early mental health services. The Side-by-Side program was created to address
the significant need for early mental health services for families with children ages 0-5 in
child care settings. Results indicate that children are greatly benefiting from their
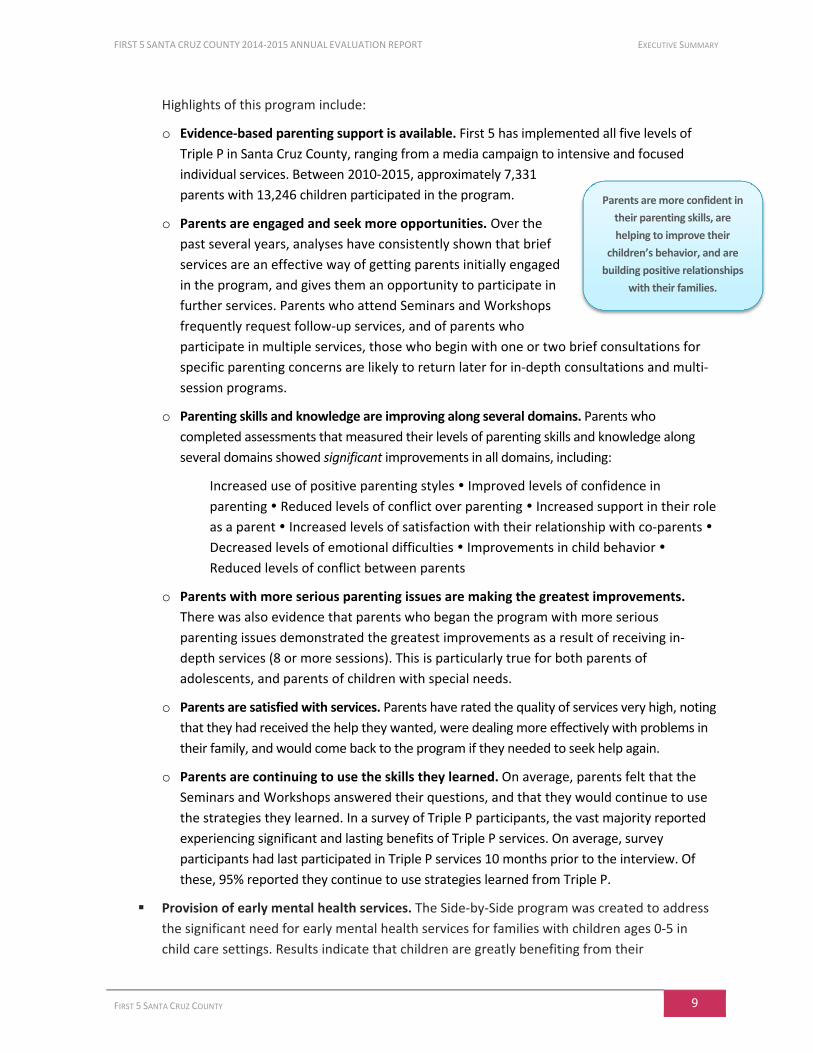
Parents are more confident in
their parenting skills, are
helping to improve their
children’s behavior, and are
building positive relationships
with their families.
EXECUTIVE SUMMARY FIRST 5 SANTA CRUZ COUNTY 2014-2015 ANNUAL EVALUATION REPORT
10 FIRST 5 SANTA CRUZ COUNTY
participation in Side-by-Side family-based services, and 100% of families that participated in
8-12 psychotherapy/counseling meetings and completed pre/post assessments reported
improvement in their children’s behavior.
Children Learning and Ready for School
First 5 is helping to improve the quality of early learning programs in Santa Cruz County
In 2012-13, First 5 Santa Cruz County launched its Quality Early Learning Initiative (QELI) in
collaboration with local partners, with the goal of improving the quality of early learning programs in
Santa Cruz County. First 5 established this pilot initiative as a result of receiving funding through
California’s Race to the Top - Early Learning Challenge (RTT-ELC) federal grant, and First 5 California’s
Child Signature Program (CSP), which share a common goal of increasing the quality of early learning
programs and closing the achievement gap for vulnerable young children.
A consortium of local partners has implemented a county-wide plan to improve the quality
of early learning programs. First 5 established the Santa Cruz County Quality Early Learning
Initiative (QELI) Consortium, which created a county-wide Quality Improvement Plan (QIP),
and adopted a local Quality Rating and Improvement System (QRIS) as a way to foster
ongoing improvement of early care and education programs in Santa Cruz County.
Provisional ratings and trainings have been conducted. During this past year, the Early Learning
System Specialist (ELSS) coordinated trainings related to CSP and RTT-ELC, provided technical
assistance to program directors, maintained centralized records, coordinated independent
assessments, and conducted the QRIS ratings. First 5 contracted with Go Kids, Inc. to lead the
QELI Consortium’s quality improvement activities for Family Child Care (FCC) homes. The Go
Kids, Inc. FCC manager recruited FCC providers to RTT-ELC, completed provisional baseline
ratings, and coordinated trainings and independent assessments.
Provisional ratings of all participating QRIS sites in Santa Cruz County were conducted in
December 2014. Based on the 5-tier scale (1=lowest tier; 5=highest tier):
o 23 sites received a Tier 2 provisional rating
o 17 sites received a Tier 3 provisional rating
o 28 sites received a Tier 4 provisional rating
o 1 site received a Tier 5 provisional rating
These ratings were considered “Provisional” rather than “Full” ratings, since no sites had
yet received both an independent Classroom Assessment Scoring System (CLASS) and
Environmental Rating Scale (ERS) assessment as of December 2014.
FIRST 5 SANTA CRUZ COUNTY 2014-2015 ANNUAL EVALUATION REPORT EXECUTIVE SUMMARY
FIRST 5 SANTA CRUZ COUNTY 11
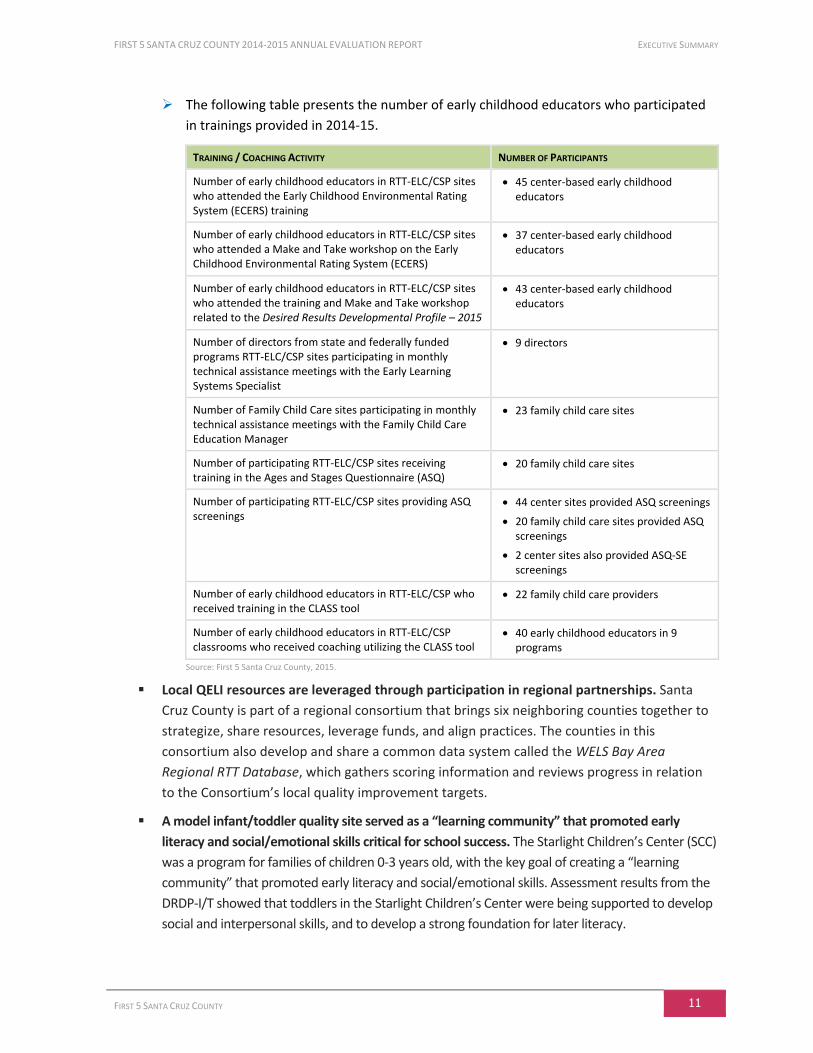
The following table presents the number of early childhood educators who participated
in trainings provided in 2014-15.
TRAINING / COACHING ACTIVITY NUMBER OF PARTICIPANTS
Number of early childhood educators in RTT-ELC/CSP sites who attended the Early Childhood Environmental Rating System (ECERS) training
45 center-based early childhood educators
Number of early childhood educators in RTT-ELC/CSP sites who attended a Make and Take workshop on the Early Childhood Environmental Rating System (ECERS)
37 center-based early childhood educators
Number of early childhood educators in RTT-ELC/CSP sites who attended the training and Make and Take workshop related to the Desired Results Developmental Profile – 2015
43 center-based early childhood educators
Number of directors from state and federally funded programs RTT-ELC/CSP sites participating in monthly technical assistance meetings with the Early Learning Systems Specialist
9 directors
Number of Family Child Care sites participating in monthly technical assistance meetings with the Family Child Care Education Manager
23 family child care sites
Number of participating RTT-ELC/CSP sites receiving training in the Ages and Stages Questionnaire (ASQ)
20 family child care sites
Number of participating RTT-ELC/CSP sites providing ASQ screenings
44 center sites provided ASQ screenings
20 family child care sites provided ASQ screenings
2 center sites also provided ASQ-SE screenings
Number of early childhood educators in RTT-ELC/CSP who received training in the CLASS tool
22 family child care providers
Number of early childhood educators in RTT-ELC/CSP classrooms who received coaching utilizing the CLASS tool
40 early childhood educators in 9 programs
Source: First 5 Santa Cruz County, 2015.
Local QELI resources are leveraged through participation in regional partnerships. Santa
Cruz County is part of a regional consortium that brings six neighboring counties together to
strategize, share resources, leverage funds, and align practices. The counties in this
consortium also develop and share a common data system called the WELS Bay Area
Regional RTT Database, which gathers scoring information and reviews progress in relation
to the Consortium’s local quality improvement targets.
A model infant/toddler quality site served as a “learning community” that promoted early
literacy and social/emotional skills critical for school success. The Starlight Children’s Center (SCC)
was a program for families of children 0-3 years old, with the key goal of creating a “learning
community” that promoted early literacy and social/emotional skills. Assessment results from the
DRDP-I/T showed that toddlers in the Starlight Children’s Center were being supported to develop
social and interpersonal skills, and to develop a strong foundation for later literacy.
EXECUTIVE SUMMARY FIRST 5 SANTA CRUZ COUNTY 2014-2015 ANNUAL EVALUATION REPORT
12 FIRST 5 SANTA CRUZ COUNTY
First 5 Santa Cruz County builds early literacy foundations by training early childhood educators to enhance language-rich practices in the classroom
One of the most powerful indicators of later success is a child’s reading proficiency at the end
of 3rd grade,6 and data show that Santa Cruz County children are struggling with their reading
skills. For example:
o In 2015, only 33% of 3rd grade students in Santa Cruz County met or exceeded standards in
English language arts/literacy on the new California Assessment of Student Performance and
Progress (CAASPP).
o In the two-year period 2013-15, only 21% of 3rd grade students—who were English
learners—were performing at the Early Advanced/Advanced Levels In English language
development (CELDT7).
First 5 Santa Cruz County is working to improve these long-term trends by encouraging
families to read together, providing language and literacy skill development for early
childhood educators, encouraging child assessments and individualized instruction, and
working to help children smoothly transition into kindergarten.
The SEEDS of Early Literacy curriculum is being used throughout Santa Cruz County child care
programs and preschools. Since the founding of the Early Literacy Foundations Initiative in
2006-07, 639 educators, tutors, and informal child care providers have been trained in the SEEDS
of Early Literacy curriculum. This includes 53 SEEDS Quality Coaches, 209 educators in state- and
federally-subsidized classrooms, 15 educators in public school
Transitional Kindergarten classrooms, 214 educators in licensed family
child care homes and private/non-profit centers, 155 Family, Friend or
Neighbor (FFN) informal child care providers, and 29 Reading Corps
tutors.
Classrooms and home-based settings of SEEDS-trained early
educators are being transformed into literacy-rich environments.
SEEDS-trained early childhood educators are working to ensure their
children are on target for kindergarten readiness by using evidence-
based early literacy strategies, receiving on-site coaching, and integrating materials into their
learning environments. Assessment results are showing that SEEDS-trained and coached
teachers are improving the quality of support they provide in their classrooms for children’s
development of early literacy:
o In preschool and transitional kindergarten (TK) classrooms taught by SEEDS-trained early
childhood educators, results from the Early Language and Literacy Classroom Observation
tool show that in 2014-15, the percentage of classrooms that provided high quality
6 Kidsdata.Org, Lucile Packard Foundation for Children's Health, Reading Proficiency, retrieved from http://www.kidsdata.org/, 2013.
7 California English Language Development Test (CELDT).
639 early child educators,
Reading Corps tutors, and
informal family child care
providers throughout the
county have been trained to
promote strong language and
literacy foundations for
children.
FIRST 5 SANTA CRUZ COUNTY 2014-2015 ANNUAL EVALUATION REPORT EXECUTIVE SUMMARY
FIRST 5 SANTA CRUZ COUNTY 13
support for early literacy increased from 20% at pre-assessment to 93% at
post-assessment.
o In home-based settings, results from the Child/Home Early Language and Literacy
Observation tool indicate that in 2014-15, the percentage of family child care settings that
were rated as having high quality support for early literacy increased from 44% to 89%.
First 5 Santa Cruz County helps children build the foundation for later reading success
Parents are getting involved in their children’s reading. SEEDS classrooms also implemented
Raising A Reader, a weekly rotating book bag program for families, to boost shared reading
practices and impact children’s early literacy skills. In the 2014-15 fiscal year, 4,129 children
and their families participated in the program throughout the county.
Children are developing skills in key areas of reading success. In 2014-15, the Santa Cruz
Reading Corps (SCRC) placed one AmeriCorps volunteer (called a Literacy Tutor) in each State
Preschool classroom in the Pajaro Valley Unified and Live Oak school districts, and also in a
growing number of Transitional Kindergarten classrooms in these
districts. As the majority of preschool students were dual language
learners, there was an emphasis on developing and improving
children’s vocabulary skills in English.
Results show that children who need the biggest boost in key early
literacy areas benefit when they receive “Response to
Intervention” individualized strategies.
o In State Pre-K and TK classrooms:
Children in these SEEDS-trained classrooms improved in all five pre-literacy skill
areas—in English—no matter what their primary language was.
When assessed in English, Spanish-speaking children on average started with lower scores
than English-speaking children, but by their last assessment they had increased their scores
by a higher amount than English-speaking children in Picture Naming and Rhyming, and
nearly equaled the English-speaking children’s increase in scores in Alliteration.
This improvement in English pre-literacy skills was particularly striking among primarily
Spanish-speaking children who had received tailored interventions. An analysis of
average scores on the Fall, Winter, and Spring benchmarks showed that when assessed
in English, Spanish-speaking children who were selected to receive tailored
interventions started with lower scores than Spanish-speaking children who did not
require tailored interventions. But by their last assessment they had increased their
scores by a higher amount in Picture Naming and Rhyming.
This last result is especially encouraging, as it suggests that these children are getting
the tailored help they need to increase their vocabulary and bring them up to a level
- Snow, Burns, & Griffin, 1998
“The seeds of literacy are planted
before children enter school.
Important literacy skills do not
develop spontaneously,
instruction shapes them.”

EXECUTIVE SUMMARY FIRST 5 SANTA CRUZ COUNTY 2014-2015 ANNUAL EVALUATION REPORT
14 FIRST 5 SANTA CRUZ COUNTY
where they can more fully benefit from the SEEDS of Early Literacy classroom
curriculum with the rest of their peers.
o In the Summer Pre-K Academy:
Children are learning letter sounds. In 2015, 68 children—with little to no prior
preschool experience—participated in the 4-week Migrant Education Summer Pre-K
Academy. Of those who participated in at least 14 sessions, 86% increased their letter
sound recognition by at least five letter sounds, and on average, they learned to
recognize 12 new letter sounds by the time they left the program.
First 5 Santa Cruz County helps children successfully transition to kindergarten
First 5 is investing in activities that help children successfully transition to kindergarten. Some ways
to do this are to encourage parents to visit the new school with their child, to meet the new
kindergarten teacher, and to attend parent orientations. The following highlights First 5’s work to
support successful transitions to kindergarten:
Parents are receiving kindergarten transition information. Approximately 314 parents
participated in Transition to Kindergarten Workshops where they learned about kindergarten
registration requirements, choices of language programs, how to support their child in school,
and ways to ensure that their child’s entry into school is a pleasant and smooth transition.
Service Integration & Community Strengthening
First 5 Santa Cruz County seeks to strengthen the system of care for families with children ages
0-5 in the County. In 2014-15, approximately 15% of children received services from multiple
First 5 partners. This occurs partly because First 5 partners cross-refer families, and also
because other agencies refer families into the coordinated network of First 5 services.
Many partners maximize First 5 funding by using their funds to match or leverage additional
funding. In 2014-15, First 5 Santa Cruz County had a total program investment of almost
$4.4 million (via Proposition 10 funding and other funding sources), and an additional
$1.6 million was leveraged by partners.
2-1-1 is a centralized point of contact for Santa Cruz County residents to get information on
local services, and is operated by the United Way of the Bay Area and funded by several local
agencies including First 5 Santa Cruz County. Since the 2-1-1 program began in Santa Cruz
County in 2010, a total of 27,212 people have called, with a total of 40,899 needs and 46,101
referrals provided. Results show how effective this program has been in helping residents
with their everyday needs and concerns, and during emergency situations.
FIRST 5 SANTA CRUZ COUNTY 2014-2015 ANNUAL EVALUATION REPORT EXECUTIVE SUMMARY
FIRST 5 SANTA CRUZ COUNTY 15
Summary
First 5 Santa Cruz County is serving 34% of children ages 0-5 in Santa Cruz County, and they are
serving the most vulnerable children, including those in families that are experiencing severe
poverty and are living in areas of the County with the highest risk factors.
First 5 and its partners are achieving results in helping these very vulnerable children and families:
In the Healthy Children goal area, data show that children are insured and using preventative
health care:
o Since 2004, 16,111 children ages 0-5 have been assisted to apply for public health insurance.
o In 2014, 84% of children (ages 2-6) in Healthy Kids had a medical home, and 65% of
children (ages 3-6) in Healthy Kids had a well-child visit in the last year.
o In 2014-15, Baby Gateway also assisted 70% of all mothers who had Medi-Cal births to
complete a Medi-Cal application for their new babies, and 80% of these mothers identified a
preferred primary care provider or clinic for their child before discharge from the hospital.
o Foster children with neurodevelopmental needs are getting referred to supportive
services through a coordinated and multidisciplinary system called the Stanford
Neurodevelopmental Foster Care Clinic.
In the Strong Families goal area, families are becoming more healthy and resilient, and it
benefits their children:
o Families who are at risk for child abuse and neglect are being helped to reduce that risk.
o 94% of families who received services from the Families Together program had no
substantiated allegations of maltreatment in the six months after their cases closed.
o First 5 has implemented all five levels of Triple P in Santa Cruz County, from an expanded
social marketing campaign to intensive and focused individual services.
o Parents participating in the Triple P parenting program significantly increased their
confidence in parenting, used more positive parenting styles, felt more supported, improved
their relationships with their families, and reduced the levels of conflict between parents.
o Parents who began the program with more serious parenting issues demonstrated the
greatest improvements as a result of receiving in-depth services (8 or more sessions).
o Parents of adolescents (Teen Triple P) and parents of children with special needs (Stepping
Stones Triple P) tended to report more serious parenting issues than parents in Core
Triple P, and demonstrated a greater degree of improvement by the end of the program.
o In a survey of Triple P participants, the vast majority reported experiencing significant and
lasting benefits of Triple P services. On average, survey participants had last participated in
Triple P services 10 months prior to the interview. Of these, 95% reported they continue to
use strategies learned from Triple P.
EXECUTIVE SUMMARY FIRST 5 SANTA CRUZ COUNTY 2014-2015 ANNUAL EVALUATION REPORT
16 FIRST 5 SANTA CRUZ COUNTY
o Early mental health services are being provided. Of families that participated in 8-12
psychotherapy/counseling meetings and completed pre/post assessments, 100% reported
improvement in their children's behavior.
In the Children Learning and Ready for School goal area, data show that First 5 is successfully
improving the quality of early learning programs and building teacher skills to develop
children’s early literacy skills:
o First 5 Cruz County has further developed its Quality Early Learning Initiative (QELI) in
collaboration with local partners, with the goal of improving the quality of early learning
programs in Santa Cruz County, and closing the achievement gap for vulnerable young
children. More sites have been added, provisional ratings and trainings have been
conducted, and the common data system called the WELS Bay Area Regional RTT
Database was further developed.
o A model infant/toddler quality site served as a “learning community” that promoted early
literacy and social/emotional skills critical for school success. Assessment results showed
that toddlers in the Starlight Children’s Center were being supported to develop social and
interpersonal skills, and to develop a strong foundation for later literacy.
o The SEEDS of Early Literacy approach is transforming early education settings in the
County. In 2014-15, the percentage of preschool classrooms taught by SEEDS-trained
participants assessed as providing high quality literacy support for children increased from
20% to 93%. Similarly, the percentage of family child care settings that were rated as
having high quality support increased from 44% to 89%.
o Children in classrooms taught by SEEDS-trained early childhood educators are developing
skills in key areas of reading success. In 2014-15 the Santa Cruz Reading Corps placed 14
Literacy Tutors with SEEDS training in 24 state preschool and TK classrooms, serving 601
children. Children in these classrooms showed improvement in all five pre-literacy skill
areas—in English—no matter what their primary language was, and Spanish-speaking
children particularly demonstrated improvement in their English language skills.
o This improvement in English pre-literacy skills was particularly striking among primarily
Spanish-speaking children who had received tailored interventions. Not only did these
Spanish-speaking children improve their skill levels, but by their last assessment they had
increased their scores by a higher amount in Picture Naming and Rhyming. This result
suggests that these children are getting the tailored help they need to increase their
vocabulary and bring them up to a level where they can more fully benefit from the SEEDS
of Early Literacy classroom curriculum with the rest of their peers.
First 5 partners are maximizing First 5 funding by leveraging their funds to bring in an
additional 1.6 million dollars. Because of First 5’s funding and this kind of additional support,
Santa Cruz County children will continue to get the support they need to become healthy,
strong, and ready for school.
FIRST 5 SANTA CRUZ COUNTY 2014-2015 ANNUAL EVALUATION REPORT STRATEGIC FRAMEWORK RESULTS
FIRST 5 SANTA CRUZ COUNTY 17
PART 1: STRATEGIC FRAMEWORK RESULTS
STRATEGIC FRAMEWORK RESULTS FIRST 5 SANTA CRUZ COUNTY 2014-2015 ANNUAL EVALUATION REPORT
18 FIRST 5 SANTA CRUZ COUNTY
First 5 Santa Cruz County’s Strategic Framework
First 5 Santa Cruz County has the great privilege and responsibility to act as the steward of
Proposition 10 (“tobacco tax”) resources for young children from prenatal to age 5 in Santa Cruz
County. Since its inception, the Commission has worked to establish a legacy through building a
coordinated and integrated system of care and support for children 0-5 and their families.
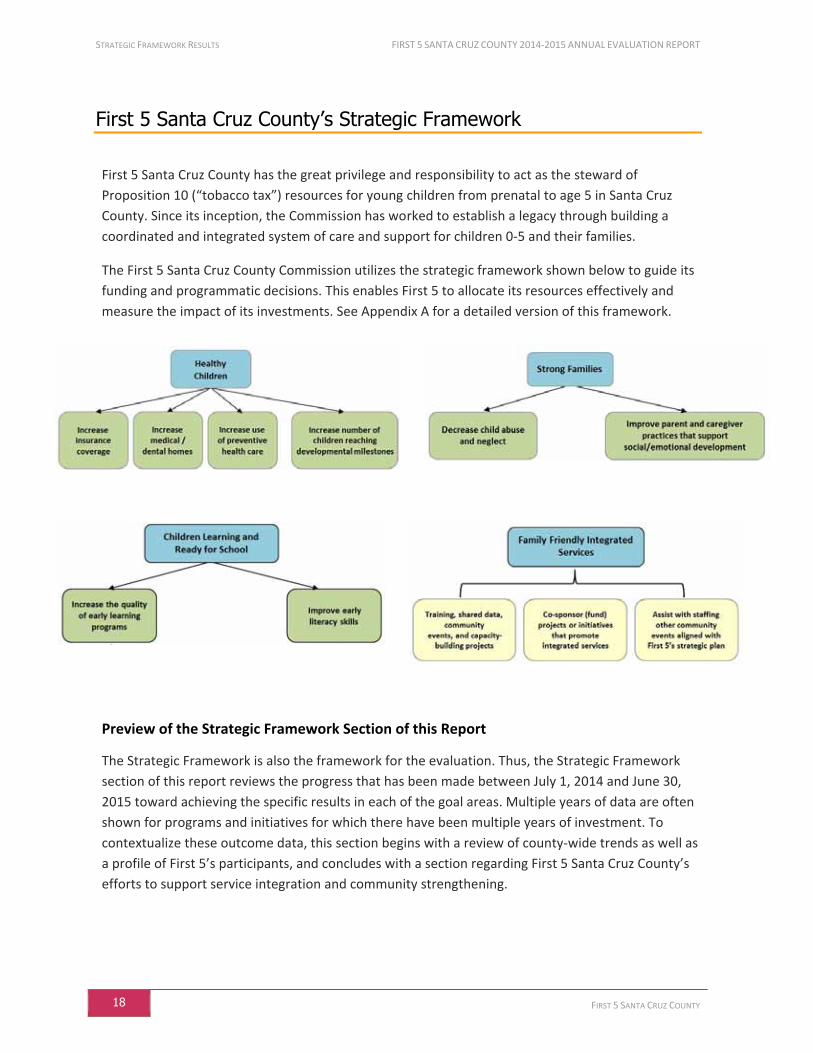
The First 5 Santa Cruz County Commission utilizes the strategic framework shown below to guide its
funding and programmatic decisions. This enables First 5 to allocate its resources effectively and
measure the impact of its investments. See Appendix A for a detailed version of this framework.
Preview of the Strategic Framework Section of this Report
The Strategic Framework is also the framework for the evaluation. Thus, the Strategic Framework
section of this report reviews the progress that has been made between July 1, 2014 and June 30,
2015 toward achieving the specific results in each of the goal areas. Multiple years of data are often
shown for programs and initiatives for which there have been multiple years of investment. To
contextualize these outcome data, this section begins with a review of county-wide trends as well as
a profile of First 5’s participants, and concludes with a section regarding First 5 Santa Cruz County’s
efforts to support service integration and community strengthening.
FIRST 5 SANTA CRUZ COUNTY 2014-2015 ANNUAL EVALUATION REPORT STRATEGIC FRAMEWORK RESULTS COUNTY TRENDS
FIRST 5 SANTA CRUZ COUNTY 19
Overall Well-Being of Children in the County
A Profile of Santa Cruz County’s Youngest Children
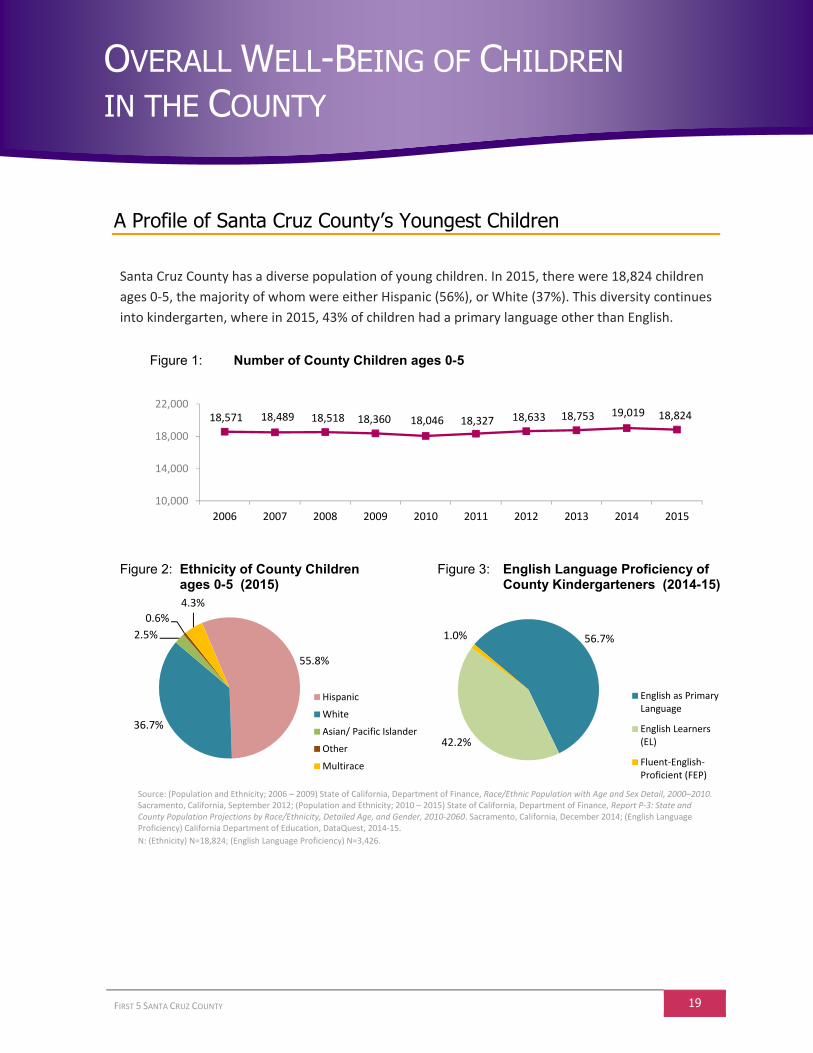
Santa Cruz County has a diverse population of young children. In 2015, there were 18,824 children
ages 0-5, the majority of whom were either Hispanic (56%), or White (37%). This diversity continues
into kindergarten, where in 2015, 43% of children had a primary language other than English.
Figure 1: Number of County Children ages 0-5
Figure 2: Ethnicity of County Children ages 0-5 (2015)
Figure 3: English Language Proficiency of County Kindergarteners (2014-15)
Source: (Population and Ethnicity; 2006 – 2009) State of California, Department of Finance, Race/Ethnic Population with Age and Sex Detail, 2000–2010. Sacramento, California, September 2012; (Population and Ethnicity; 2010 – 2015) State of California, Department of Finance, Report P-3: State and County Population Projections by Race/Ethnicity, Detailed Age, and Gender, 2010-2060. Sacramento, California, December 2014; (English Language Proficiency) California Department of Education, DataQuest, 2014-15.
N: (Ethnicity) N=18,824; (English Language Proficiency) N=3,426.
18,571 18,489 18,518 18,360 18,046 18,327 18,633 18,753 19,019 18,824
10,000
14,000
18,000
22,000
2006 2007 2008 2009 2010 2011 2012 2013 2014 2015
55.8%
36.7%
2.5%
0.6%
4.3%
Hispanic
White
Asian/ Pacific Islander
Other
Multirace
56.7%
42.2%
1.0%
English as PrimaryLanguage
English Learners(EL)
Fluent-English-Proficient (FEP)
OVERALL WELL-BEING OF CHILDREN IN THE COUNTY

STRATEGIC FRAMEWORK RESULTS FIRST 5 SANTA CRUZ COUNTY 2014-2015 ANNUAL EVALUATION REPORT COUNTY TRENDS
20 FIRST 5 SANTA CRUZ COUNTY
County-Wide Trends in Indicators of Child and Family Well-Being
INDICATOR COUNTY POPULATION CURRENT
DATA1
CHANGE OVER TIME3
1 YEAR 5 YEARS
FINANCIAL WELL-BEING
Unemployment Rate 2
Santa Cruz County (Average monthly rate; fiscal year July-June)
8.0% -1.5 net decrease -5.3
net decrease
(4 year trend)
Watsonville (Average monthly rate; fiscal year July-June)
10.3% -1.8 net decrease -6.5
net decrease
(4 year trend)
Felton (Average monthly rate; fiscal year July-June)
4.0% -0.8 net decrease -2.9
net decrease
(4 year trend)
Median Family Income 4 Families (with children under 18 years) $80,788 +8.2% +10.0%
Living Below the Federal Poverty Level 4
General population 16.8% +1.9 net increase +2.9 net
increase
Children (ages 0-5) 18.2% -1.7 net decrease -4.7 net
decrease
Living Below the Self-Sufficiency Standard 4, 5 Families 59.5% +1.4 net
increase +11.4 net increase
ENROLLMENT IN PUBLIC ASSISTANCE PROGRAMS
CalWORKS General population (Average monthly enrollment; fiscal year July-June)
4,290 -4.4% -20.1%
CalFresh Program (Food Stamps) General population (Average monthly enrollment; fiscal year July-June)
24,787 +5.9% +40.6%
Free and Reduced Price Meals Student population (Annual enrollment; school year July-June)
21,572 -2.2% +12.2%
Women, Infants, & Children Program (WIC) 4
General population (Average monthly enrollment, calendar year)
8,590 -4.8% -7.7%
PRENATAL CARE IN THE FIRST TRIMESTER
Prenatal Care in the First Trimester (by Mother’s Age) 4
All Mothers 80.0% -0.7 net decrease +0.5 net
increase
Mothers (ages 24 and under) 67.6% -0.4 net decrease -3.1 net
decrease
Prenatal Care in the First Trimester (by Payment Method) 4
Private insurance 89.7% -2.0 net decrease -1.3 net
decrease
Medi-Cal insurance 72.2% +0.4 net increase -0.8 net
decrease
TEEN PREGNANCY
Percentage of Births to Teen Mothers 4
Teen mothers (ages 19 and under) 5.6% -0.6 net decrease -4.1 net
decrease
Teen Birth Rate (per 1,000) 4 Teen mothers (ages 15-19) 17.9 +0.1 net increase -1.8 net
decrease
BIRTHS PAID BY MEDI-CAL
Births Paid by Medi-Cal 4 All Mothers 52.9% +1.4 net
increase +1.5 net increase
Mothers (ages 24 and under) 83.4% -0.6 net decrease +4.6 net
increase
1 Current data are for 2015, unless otherwise noted. 2 In January 2015 the U.S. Bureau of Labor Statistics substantially changed the methodology used to calculate unemployment rates and introduced population adjustments
based upon the 2010 Census, which resulted in significant changes to unemployment rates. Only the years that were updated (2010-2015) are included in this analysis. 3 For data that are quantities (e.g., enrollment numbers), change over time is calculated using a percent change. For data that are already percentages (e.g., unemployment
rates), change over time is calculated using a net change (subtraction of percentages). 4 Data are for 2014. 5 The Self-Sufficiency Standard is a more comprehensive measure of income adequacy than the Federal Poverty Level, as it takes into account the costs of housing, child
care, health care, transportation, food, and taxes, as well as economic differences between counties.
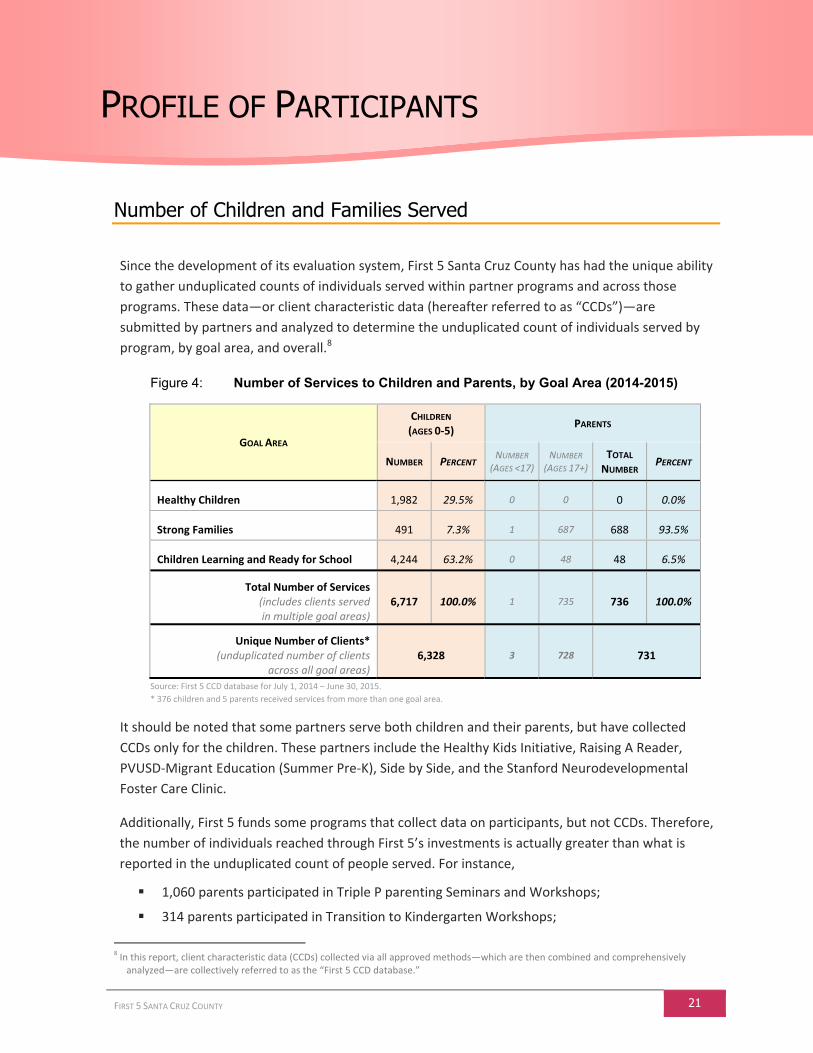
FIRST 5 SANTA CRUZ COUNTY 2014-2015 ANNUAL EVALUATION REPORT STRATEGIC FRAMEWORK RESULTS PROFILE OF PARTICIPANTS
FIRST 5 SANTA CRUZ COUNTY 21
Profile of Participants
Number of Children and Families Served
Since the development of its evaluation system, First 5 Santa Cruz County has had the unique ability
to gather unduplicated counts of individuals served within partner programs and across those
programs. These data—or client characteristic data (hereafter referred to as “CCDs”)—are
submitted by partners and analyzed to determine the unduplicated count of individuals served by
program, by goal area, and overall.8
Figure 4: Number of Services to Children and Parents, by Goal Area (2014-2015)
GOAL AREA
CHILDREN (AGES 0-5)
PARENTS
NUMBER PERCENT NUMBER
(AGES <17)NUMBER
(AGES 17+) TOTAL
NUMBER PERCENT
Healthy Children 1,982 29.5% 0 0 0 0.0%
Strong Families 491 7.3% 1 687 688 93.5%
Children Learning and Ready for School 4,244 63.2% 0 48 48 6.5%
Total Number of Services (includes clients served in multiple goal areas)
6,717 100.0% 1 735 736 100.0%
Unique Number of Clients* (unduplicated number of clients
across all goal areas) 6,328 3 728 731
Source: First 5 CCD database for July 1, 2014 – June 30, 2015.
* 376 children and 5 parents received services from more than one goal area.
It should be noted that some partners serve both children and their parents, but have collected
CCDs only for the children. These partners include the Healthy Kids Initiative, Raising A Reader,
PVUSD-Migrant Education (Summer Pre-K), Side by Side, and the Stanford Neurodevelopmental
Foster Care Clinic.
Additionally, First 5 funds some programs that collect data on participants, but not CCDs. Therefore,
the number of individuals reached through First 5’s investments is actually greater than what is
reported in the unduplicated count of people served. For instance,
1,060 parents participated in Triple P parenting Seminars and Workshops;
314 parents participated in Transition to Kindergarten Workshops;
8 In this report, client characteristic data (CCDs) collected via all approved methods—which are then combined and comprehensively
analyzed—are collectively referred to as the “First 5 CCD database.”
PROFILE OF PARTICIPANTS

STRATEGIC FRAMEWORK RESULTS FIRST 5 SANTA CRUZ COUNTY 2014-2015 ANNUAL EVALUATION REPORT PROFILE OF PARTICIPANTS
22 FIRST 5 SANTA CRUZ COUNTY
13 service providers participated in First 5’s “Achieving Excellence in Customer Service”
trainings;
763 Kits for New Parents were shipped to clinics, hospitals, service providers, and events
throughout the County, for distribution to individuals.
According to the 2015 population estimates for Santa Cruz County, there were approximately
18,824 children ages 0-5 residing in the County (including 10,508 Latino children).9
During the 2014-2015 fiscal year, partners funded by First 5 served 6,328 unique children,
approximately 34% of all children ages 0-5 in the County.
Among the Latino population, 46% of all children ages 0-5 participated in services funded by
First 5.
Figure 5: Percentage of Children 0-5 in Santa Cruz County Served by First 5
Source: (Children 0-5 served by First 5) Client counts are for fiscal years, taken from First 5 CCD database, July 1, 2006 – June 30, 2015. (County populations of children 0-5) State of California, Department of Finance, Report P-3: State and County Population Projections by Race/Ethnicity, Detailed Age, and Gender, 2010-2060. Sacramento, California, January 2014.
It is important to note that the percentage of children served in the County is actually higher if one
includes children who were indirectly supported by a First 5-funded program, such as children whose
child care providers received professional training through funded partner programs, children whose
parents received a Kit for New Parents or attended a parenting workshop, and children benefiting
from service providers who attended customer service trainings.
9 State of California, Department of Finance, Report P-3: State and County Population Projections by Race/Ethnicity, Detailed Age, and
Gender, 2010-2060. Sacramento, California, December 2014.
31% 30%35%
41%
62%54%
59%
50%46%
23%27% 26% 27%
44%39%
42%36% 34%
0%
20%
40%
60%
80%
2006-07 2007-08 2008-09 2009-10 2010-11 2011-12 2012-13 2013-14 2014-15
Percent of County'sLatino Children 0-5Served by First 5
Percent of County'sChildren 0-5 Servedby First 5
Indicator: Percentage of children in Santa Cruz County served by First 5

FIRST 5 SANTA CRUZ COUNTY 2014-2015 ANNUAL EVALUATION REPORT STRATEGIC FRAMEWORK RESULTS PROFILE OF PARTICIPANTS
FIRST 5 SANTA CRUZ COUNTY 23
Increase Services into Communities with the Highest Needs
As can be seen in the following figure, over the past several years funded partners have consistently
served Latino and Spanish-speaking children, and children who reside in South County.
Figure 6: Demographics of Children Participating in First 5 Programs, by Year
Source: First 5 CCD database for July 1, 2007 – June 30, 2015.
N: (2007-2008) Ethnicity = 4,235; Language = 4,192; Region of County = 5,214. (2008-2009) Ethnicity = 4,968; Language = 4,896; Region of County = 5,440. (2009-2010) Ethnicity = 5,620; Language = 5,563; Region of County = 5,276. (2010-2011) Ethnicity = 8,848; Language = 9,086; Region of County = 8,932. (2011-2012) Ethnicity = 8,046; Language = 8,235; Region of County = 8,082. (2012-2013) Ethnicity = 7,757; Language = 7,809; Region of County = 7,577. (2013-2014) Ethnicity = 6,811; Language = 6,807; Region of County = 6,573, (2014-2015) Ethnicity = 6,321; Language = 6,320; Region of County = 6,247.
69.3%
57.8%
76.8%
70.8%
63.8%
77.0%
72.0%
64.3%
79.0%
73.2%
64.9%
82.2%
75.2%
70.6%
85.1%
80.5%
74.9%
86.6%
65.8%
74.4%
83.0%
54.9%
73.7%
81.7%
0% 20% 40% 60% 80% 100%
South County
Spanish as Household Language
Latino
2007-08
2008-09
2009-10
2010-11
2011-12
2012-13
2013-14
2014-15
Indicator: Demographic trends in children participating in First 5 programs
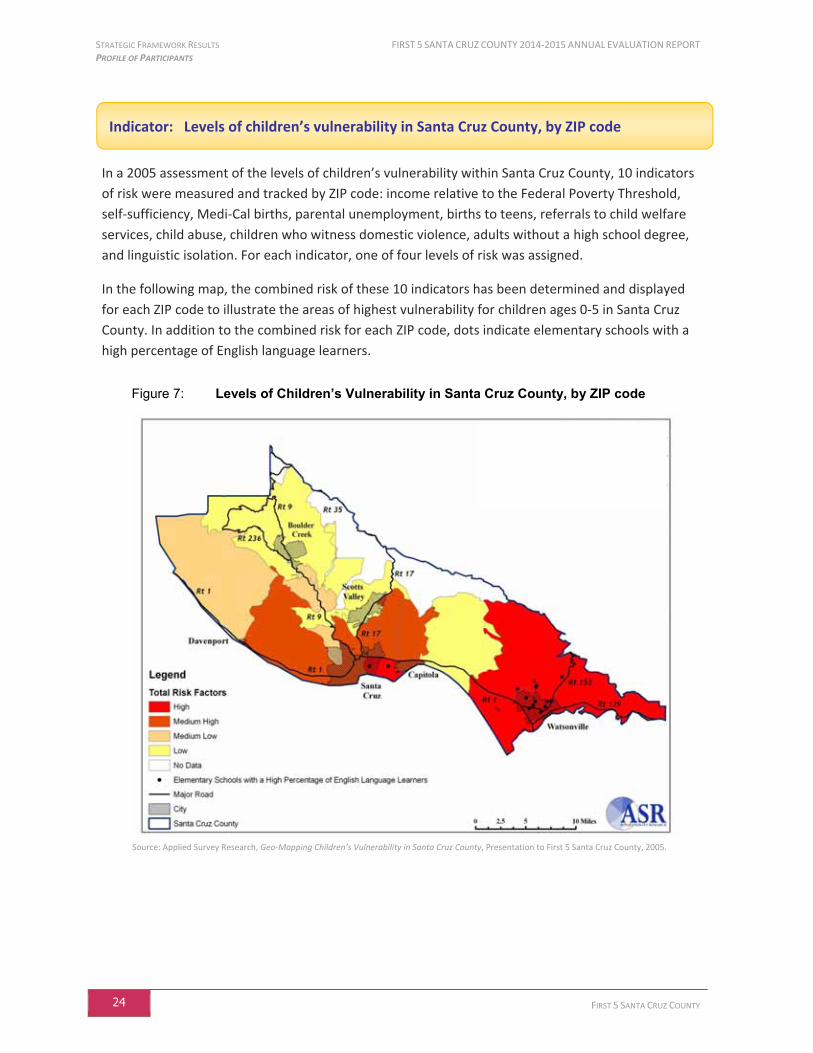
STRATEGIC FRAMEWORK RESULTS FIRST 5 SANTA CRUZ COUNTY 2014-2015 ANNUAL EVALUATION REPORT PROFILE OF PARTICIPANTS
24 FIRST 5 SANTA CRUZ COUNTY
In a 2005 assessment of the levels of children’s vulnerability within Santa Cruz County, 10 indicators
of risk were measured and tracked by ZIP code: income relative to the Federal Poverty Threshold,
self-sufficiency, Medi-Cal births, parental unemployment, births to teens, referrals to child welfare
services, child abuse, children who witness domestic violence, adults without a high school degree,
and linguistic isolation. For each indicator, one of four levels of risk was assigned.
In the following map, the combined risk of these 10 indicators has been determined and displayed
for each ZIP code to illustrate the areas of highest vulnerability for children ages 0-5 in Santa Cruz
County. In addition to the combined risk for each ZIP code, dots indicate elementary schools with a
high percentage of English language learners.
Figure 7: Levels of Children’s Vulnerability in Santa Cruz County, by ZIP code
Source: Applied Survey Research, Geo-Mapping Children’s Vulnerability in Santa Cruz County, Presentation to First 5 Santa Cruz County, 2005.
Indicator: Levels of children’s vulnerability in Santa Cruz County, by ZIP code

FIRST 5 SANTA CRUZ COUNTY 2014-2015 ANNUAL EVALUATION REPORT STRATEGIC FRAMEWORK RESULTS PROFILE OF PARTICIPANTS
FIRST 5 SANTA CRUZ COUNTY 25
In order to determine whether First 5 partners are serving children in the highest need areas of the
County, this second map displays the relative size of client populations, with darker colors indicating
more First 5 participants served than lighter colors. As seen in the following table, 88% of children
(with known ZIP codes) served by funded partners lived in the areas of the County that ranked
highest on a cumulative index of risk factors (the Live Oak area of Santa Cruz, the city of Santa Cruz,
Watsonville and Freedom), showing that First 5 partners are reaching the most vulnerable children.
Figure 8: Distribution of County Children Who Received Services, by ZIP Code (2014-2015)
Figure 9: Number of County Children Who Received Services, by ZIP Code (2014-2015)
AREA ZIP
CODE
CHILDREN SERVED
AREA ZIP
CODE
CHILDREN SERVED
NUMBER PERCENTAGE NUMBER PERCENTAGE
Aptos, Rio Del Mar* 95003 167 2.7% Mt. Hermon 95041 3 0.0%
Ben Lomond 95005 40 0.7% Santa Cruz* 95060 568 9.3%
Boulder Creek 95006 48 0.8% Santa Cruz (Live Oak)* 95062 638 10.5%
Brookdale 95007 2 0.0% Santa Cruz 95064 25 0.4%
Capitola 95010 115 1.9% Santa Cruz 95065 112 1.8%
Davenport 95017 26 0.4% Scotts Valley* 95066 107 1.8%
Felton 95018 41 0.7% Soquel 95073 49 0.8%
Freedom 95019 233 3.8% Watsonville* 95076 3,927 64.4%
Total - 6,101 100% Source: First 5 CCD database for July 1, 2014 – June 30, 2015.
* Children with Post Office mailing addresses in these areas were included in the area totals.
Legend
Frequency
Data unavailable
25.00 – 40.999
41.00 – 109.499
109.50 – 232.999
233.00 – 3,927.00
STRATEGIC FRAMEWORK RESULTS FIRST 5 SANTA CRUZ COUNTY 2014-2015 ANNUAL EVALUATION REPORT PROFILE OF PARTICIPANTS
26 FIRST 5 SANTA CRUZ COUNTY
Early Childhood Educators Served by First 5 Partners
First 5 Santa Cruz County helps support the professional development of early childhood educators
in the community. In 2014-15, 69 early childhood educators from preschools and family child care
homes received professional development training from the SEEDS of Early Literacy program, 92
providers attended a Race to the Top (RTT) Workshop and received a stipend, and 23 Family Child
Care providers received a stipend to participate in Race to the Top - Early Learning Challenge
(RTT-ELC). These programs collected enough information to create a Unique ID for each client,
thereby allowing these early childhood educators to be enumerated and tracked across multiple
services.
There were additional early childhood educators who participated in funded programs and received
professional development training, but who were not tracked using a Unique ID. These include staff
in 57 state and federally funded classrooms and 23 Family Child Care homes who participated in the
Race to the Top – Early Learning Challenge quality improvement efforts; the hundreds of early
childhood educators who provided the Raising A Reader program to children; and the 49 staff/child
care providers who received early childhood and mental health training from Side-by-Side
Clinician/Consultants.

FIRST 5 SANTA CRUZ COUNTY 2014-2015 ANNUAL EVALUATION REPORT STRATEGIC FRAMEWORK RESULTS HEALTHY CHILDREN
FIRST 5 SANTA CRUZ COUNTY 27
Healthy Children
This portion of First 5 Santa Cruz County’s Strategic
Framework analysis includes data regarding the
current estimates of children without health
insurance, enrollment outcomes from the Healthy
Kids Initiative, results from the Newborn Enrollment Project, and health insurance utilization data.
Additional information about partners’ efforts to support Healthy Children can be found in the
Partner Profiles section of this report.
Increase Insurance Coverage
The majority of children ages 0-5 in Santa Cruz County have health insurance, according to federal,
state, and local surveys, but some families are still experiencing challenges getting insurance for all
of their young children. Over the past year First 5 Santa Cruz County continued providing assistance
to families to enroll in public health insurance programs, so that every child ages 0-5 is insured.
Figure 10: Percentage of Children Ages 0-5 Estimated to be Insured
Source: (2001-2005) UCLA Center for Health Policy Research, California Health Interview Survey (CHIS); (2009-2014) United State Census Bureau, American Community Survey (ACS), Table B27001, 2014.
93.9%
96.2%94.4% 95.2%
97.2%
91.9%
95.3%
98.7%
93.7%94.5%
93.0% 93.6% 94.2%
94.4%
94.8%96.1%
80%
85%
90%
95%
100%
2001 2005 2009 2010 2011 2012 2013 2014
Santa Cruz County
California
Indicator: Percentage of children in Santa Cruz County with health insurance coverage
HEALTHY CHILDREN
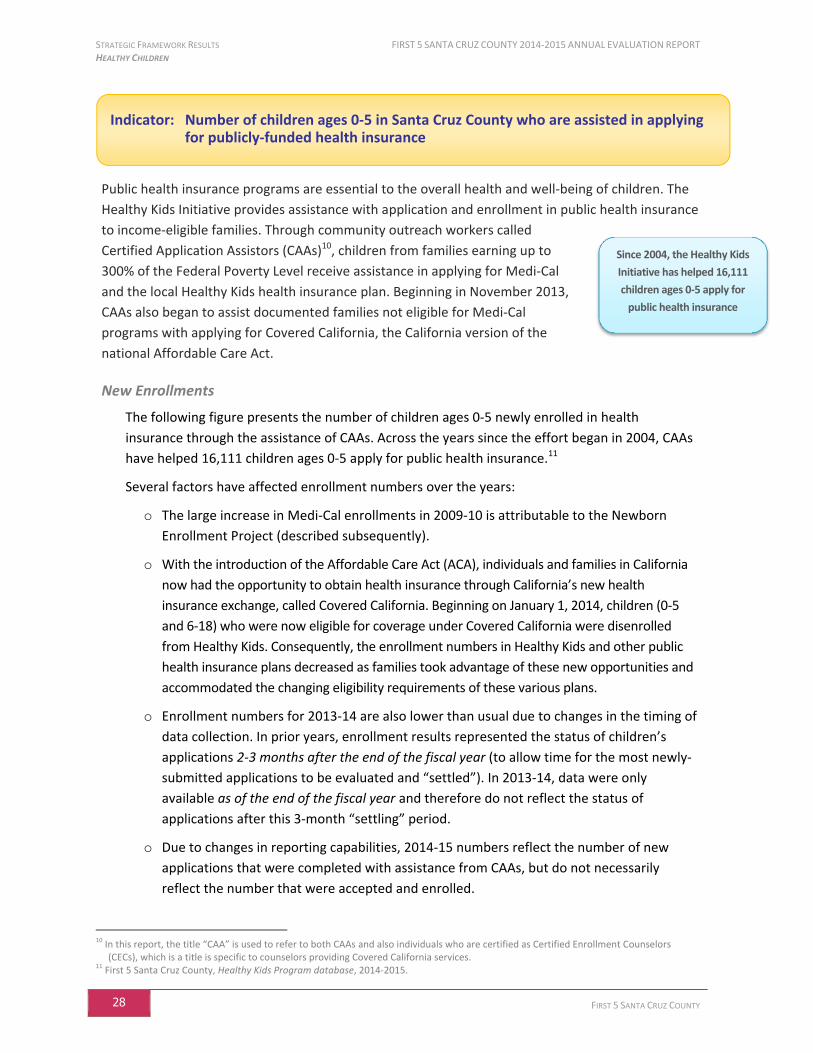
STRATEGIC FRAMEWORK RESULTS FIRST 5 SANTA CRUZ COUNTY 2014-2015 ANNUAL EVALUATION REPORT HEALTHY CHILDREN
28 FIRST 5 SANTA CRUZ COUNTY
Since 2004, the Healthy Kids
Initiative has helped 16,111
children ages 0-5 apply for
public health insurance
Public health insurance programs are essential to the overall health and well-being of children. The
Healthy Kids Initiative provides assistance with application and enrollment in public health insurance
to income-eligible families. Through community outreach workers called
Certified Application Assistors (CAAs)10, children from families earning up to
300% of the Federal Poverty Level receive assistance in applying for Medi-Cal
and the local Healthy Kids health insurance plan. Beginning in November 2013,
CAAs also began to assist documented families not eligible for Medi-Cal
programs with applying for Covered California, the California version of the
national Affordable Care Act.
New Enrollments
The following figure presents the number of children ages 0-5 newly enrolled in health
insurance through the assistance of CAAs. Across the years since the effort began in 2004, CAAs
have helped 16,111 children ages 0-5 apply for public health insurance.11
Several factors have affected enrollment numbers over the years:
o The large increase in Medi-Cal enrollments in 2009-10 is attributable to the Newborn
Enrollment Project (described subsequently).
o With the introduction of the Affordable Care Act (ACA), individuals and families in California
now had the opportunity to obtain health insurance through California’s new health
insurance exchange, called Covered California. Beginning on January 1, 2014, children (0-5
and 6-18) who were now eligible for coverage under Covered California were disenrolled
from Healthy Kids. Consequently, the enrollment numbers in Healthy Kids and other public
health insurance plans decreased as families took advantage of these new opportunities and
accommodated the changing eligibility requirements of these various plans.
o Enrollment numbers for 2013-14 are also lower than usual due to changes in the timing of
data collection. In prior years, enrollment results represented the status of children’s
applications 2-3 months after the end of the fiscal year (to allow time for the most newly-
submitted applications to be evaluated and “settled”). In 2013-14, data were only
available as of the end of the fiscal year and therefore do not reflect the status of
applications after this 3-month “settling” period.
o Due to changes in reporting capabilities, 2014-15 numbers reflect the number of new
applications that were completed with assistance from CAAs, but do not necessarily
reflect the number that were accepted and enrolled.
10
In this report, the title “CAA” is used to refer to both CAAs and also individuals who are certified as Certified Enrollment Counselors (CECs), which is a title is specific to counselors providing Covered California services.
11 First 5 Santa Cruz County, Healthy Kids Program database, 2014-2015.
Indicator: Number of children ages 0-5 in Santa Cruz County who are assisted in applying for publicly-funded health insurance
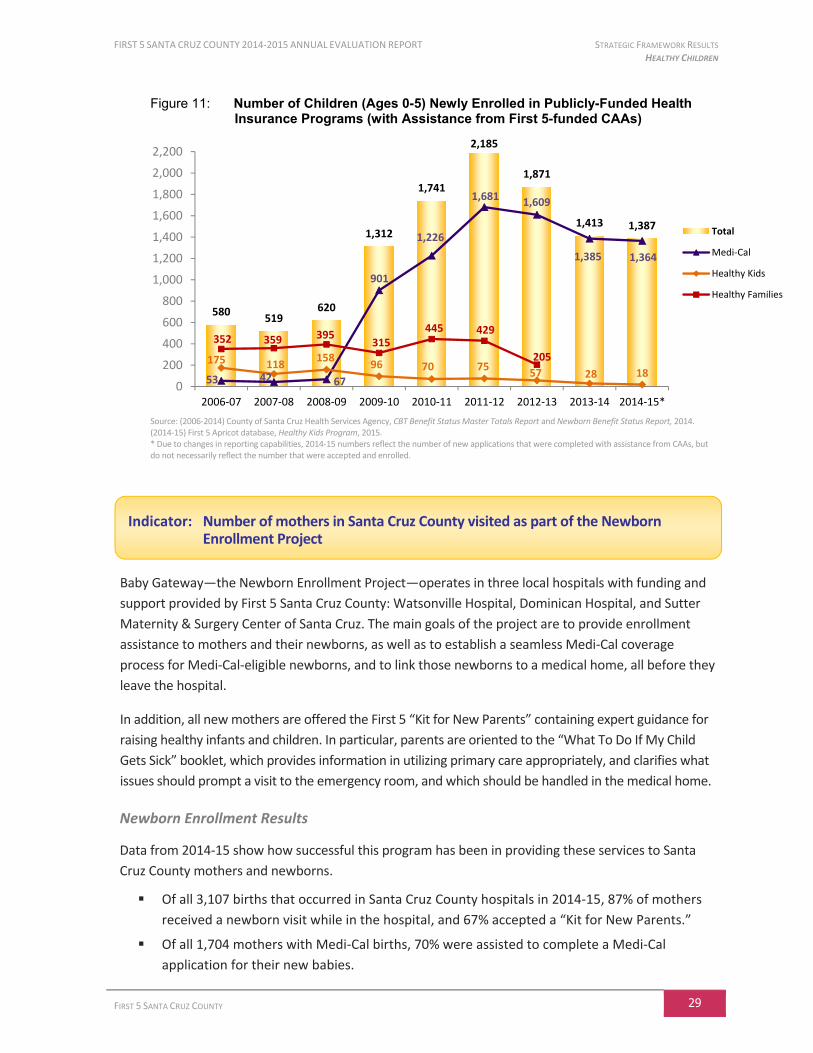
FIRST 5 SANTA CRUZ COUNTY 2014-2015 ANNUAL EVALUATION REPORT STRATEGIC FRAMEWORK RESULTS HEALTHY CHILDREN
FIRST 5 SANTA CRUZ COUNTY 29
Figure 11: Number of Children (Ages 0-5) Newly Enrolled in Publicly-Funded Health Insurance Programs (with Assistance from First 5-funded CAAs)
Source: (2006-2014) County of Santa Cruz Health Services Agency, CBT Benefit Status Master Totals Report and Newborn Benefit Status Report, 2014. (2014-15) First 5 Apricot database, Healthy Kids Program, 2015. * Due to changes in reporting capabilities, 2014-15 numbers reflect the number of new applications that were completed with assistance from CAAs, but do not necessarily reflect the number that were accepted and enrolled.
Baby Gateway—the Newborn Enrollment Project—operates in three local hospitals with funding and
support provided by First 5 Santa Cruz County: Watsonville Hospital, Dominican Hospital, and Sutter
Maternity & Surgery Center of Santa Cruz. The main goals of the project are to provide enrollment
assistance to mothers and their newborns, as well as to establish a seamless Medi-Cal coverage
process for Medi-Cal-eligible newborns, and to link those newborns to a medical home, all before they
leave the hospital.
In addition, all new mothers are offered the First 5 “Kit for New Parents” containing expert guidance for
raising healthy infants and children. In particular, parents are oriented to the “What To Do If My Child
Gets Sick” booklet, which provides information in utilizing primary care appropriately, and clarifies what
issues should prompt a visit to the emergency room, and which should be handled in the medical home.
Newborn Enrollment Results
Data from 2014-15 show how successful this program has been in providing these services to Santa
Cruz County mothers and newborns.
Of all 3,107 births that occurred in Santa Cruz County hospitals in 2014-15, 87% of mothers
received a newborn visit while in the hospital, and 67% accepted a “Kit for New Parents.”
Of all 1,704 mothers with Medi-Cal births, 70% were assisted to complete a Medi-Cal
application for their new babies.
580519
620
1,312
1,741
2,185
1,871
1,413 1,387
53 42 67
901
1,226
1,681 1,609
1,385 1,364
175 118158
96 70 7557 28 18
352 359 395315
445 429
205
0
200
400
600
800
1,000
1,200
1,400
1,600
1,800
2,000
2,200
2006-07 2007-08 2008-09 2009-10 2010-11 2011-12 2012-13 2013-14 2014-15*
Total
Medi-Cal
Healthy Kids
Healthy Families
Indicator: Number of mothers in Santa Cruz County visited as part of the Newborn Enrollment Project
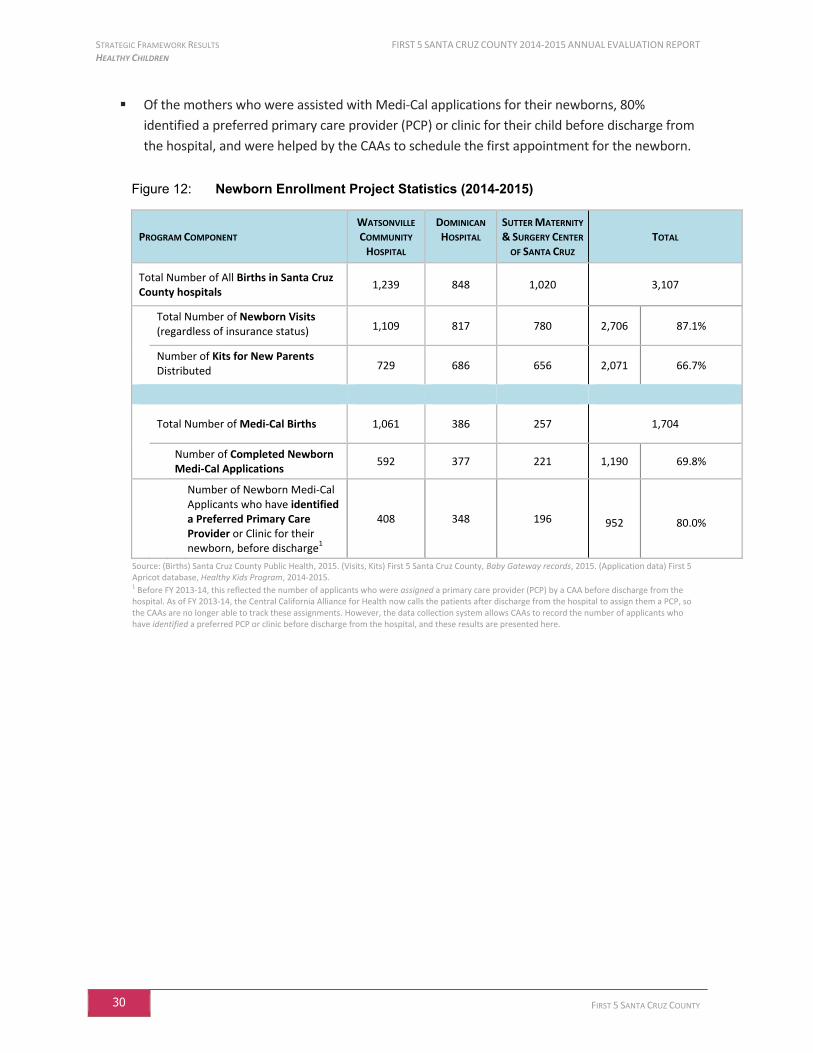
STRATEGIC FRAMEWORK RESULTS FIRST 5 SANTA CRUZ COUNTY 2014-2015 ANNUAL EVALUATION REPORT HEALTHY CHILDREN
30 FIRST 5 SANTA CRUZ COUNTY
Of the mothers who were assisted with Medi-Cal applications for their newborns, 80%
identified a preferred primary care provider (PCP) or clinic for their child before discharge from
the hospital, and were helped by the CAAs to schedule the first appointment for the newborn.
Figure 12: Newborn Enrollment Project Statistics (2014-2015)
PROGRAM COMPONENT WATSONVILLE
COMMUNITY
HOSPITAL
DOMINICAN
HOSPITAL SUTTER MATERNITY
& SURGERY CENTER
OF SANTA CRUZ TOTAL
Total Number of All Births in Santa Cruz County hospitals
1,239 848 1,020 3,107
Total Number of Newborn Visits (regardless of insurance status) 1,109 817 780 2,706 87.1%
Number of Kits for New Parents Distributed 729 686 656 2,071 66.7%
Total Number of Medi-Cal Births 1,061 386 257 1,704
Number of Completed Newborn Medi-Cal Applications
592 377 221 1,190 69.8%
Number of Newborn Medi-Cal Applicants who have identified a Preferred Primary Care Provider or Clinic for their newborn, before discharge
1
408 348 196 952 80.0%
Source: (Births) Santa Cruz County Public Health, 2015. (Visits, Kits) First 5 Santa Cruz County, Baby Gateway records, 2015. (Application data) First 5 Apricot database, Healthy Kids Program, 2014-2015. 1 Before FY 2013-14, this reflected the number of applicants who were assigned a primary care provider (PCP) by a CAA before discharge from the hospital. As of FY 2013-14, the Central California Alliance for Health now calls the patients after discharge from the hospital to assign them a PCP, so the CAAs are no longer able to track these assignments. However, the data collection system allows CAAs to record the number of applicants who have identified a preferred PCP or clinic before discharge from the hospital, and these results are presented here.
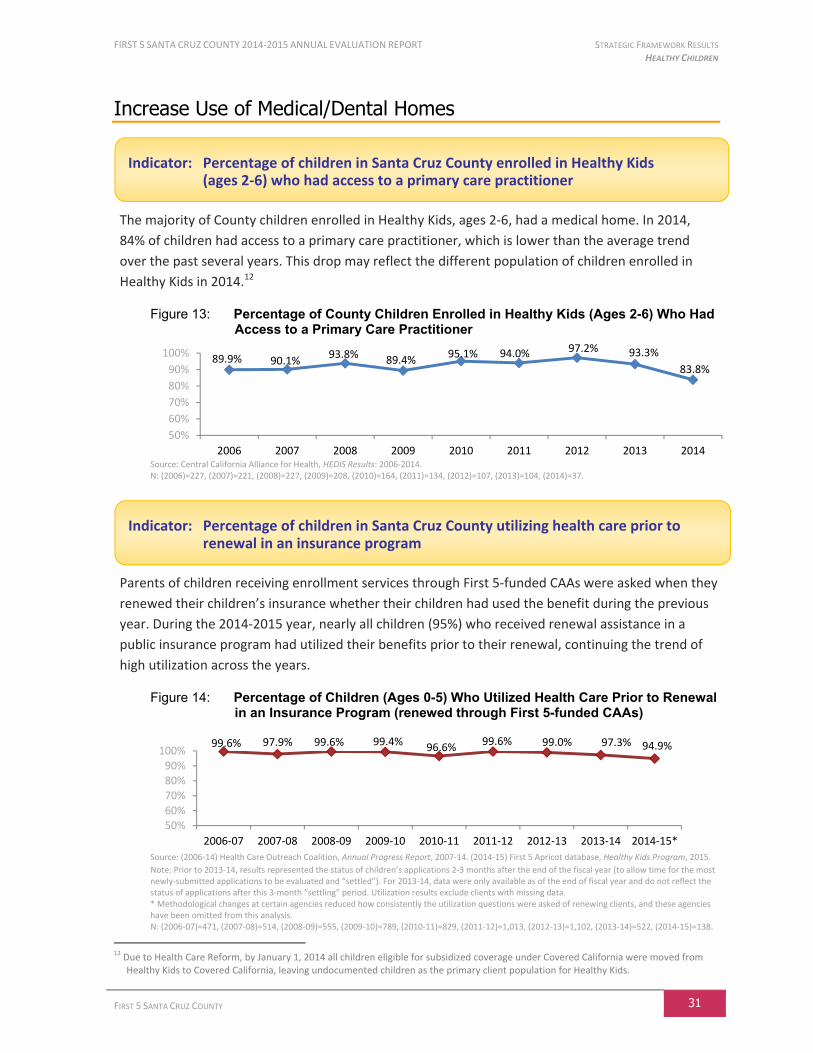
FIRST 5 SANTA CRUZ COUNTY 2014-2015 ANNUAL EVALUATION REPORT STRATEGIC FRAMEWORK RESULTS HEALTHY CHILDREN
FIRST 5 SANTA CRUZ COUNTY 31
Increase Use of Medical/Dental Homes
The majority of County children enrolled in Healthy Kids, ages 2-6, had a medical home. In 2014,
84% of children had access to a primary care practitioner, which is lower than the average trend
over the past several years. This drop may reflect the different population of children enrolled in
Healthy Kids in 2014.12
Figure 13: Percentage of County Children Enrolled in Healthy Kids (Ages 2-6) Who Had Access to a Primary Care Practitioner
Source: Central California Alliance for Health, HEDIS Results: 2006-2014. N: (2006)=227, (2007)=221, (2008)=227, (2009)=208, (2010)=164, (2011)=134, (2012)=107, (2013)=104, (2014)=37.
Parents of children receiving enrollment services through First 5-funded CAAs were asked when they
renewed their children’s insurance whether their children had used the benefit during the previous
year. During the 2014-2015 year, nearly all children (95%) who received renewal assistance in a
public insurance program had utilized their benefits prior to their renewal, continuing the trend of
high utilization across the years.
Figure 14: Percentage of Children (Ages 0-5) Who Utilized Health Care Prior to Renewal in an Insurance Program (renewed through First 5-funded CAAs)
Source: (2006-14) Health Care Outreach Coalition, Annual Progress Report, 2007-14. (2014-15) First 5 Apricot database, Healthy Kids Program, 2015.
Note: Prior to 2013-14, results represented the status of children’s applications 2-3 months after the end of the fiscal year (to allow time for the most newly-submitted applications to be evaluated and “settled”). For 2013-14, data were only available as of the end of fiscal year and do not reflect the status of applications after this 3-month “settling” period. Utilization results exclude clients with missing data. * Methodological changes at certain agencies reduced how consistently the utilization questions were asked of renewing clients, and these agencies have been omitted from this analysis. N: (2006-07)=471, (2007-08)=514, (2008-09)=555, (2009-10)=789, (2010-11)=829, (2011-12)=1,013, (2012-13)=1,102, (2013-14)=522, (2014-15)=138.
12
Due to Health Care Reform, by January 1, 2014 all children eligible for subsidized coverage under Covered California were moved from Healthy Kids to Covered California, leaving undocumented children as the primary client population for Healthy Kids.
89.9% 90.1%93.8% 89.4%
95.1% 94.0% 97.2% 93.3%
83.8%
50%
60%
70%
80%
90%
100%
2006 2007 2008 2009 2010 2011 2012 2013 2014
99.6% 97.9% 99.6% 99.4% 96.6%99.6% 99.0% 97.3% 94.9%
50%60%
70%80%90%
100%
2006-07 2007-08 2008-09 2009-10 2010-11 2011-12 2012-13 2013-14 2014-15*
Indicator: Percentage of children in Santa Cruz County enrolled in Healthy Kids (ages 2-6) who had access to a primary care practitioner
Indicator: Percentage of children in Santa Cruz County utilizing health care prior to renewal in an insurance program
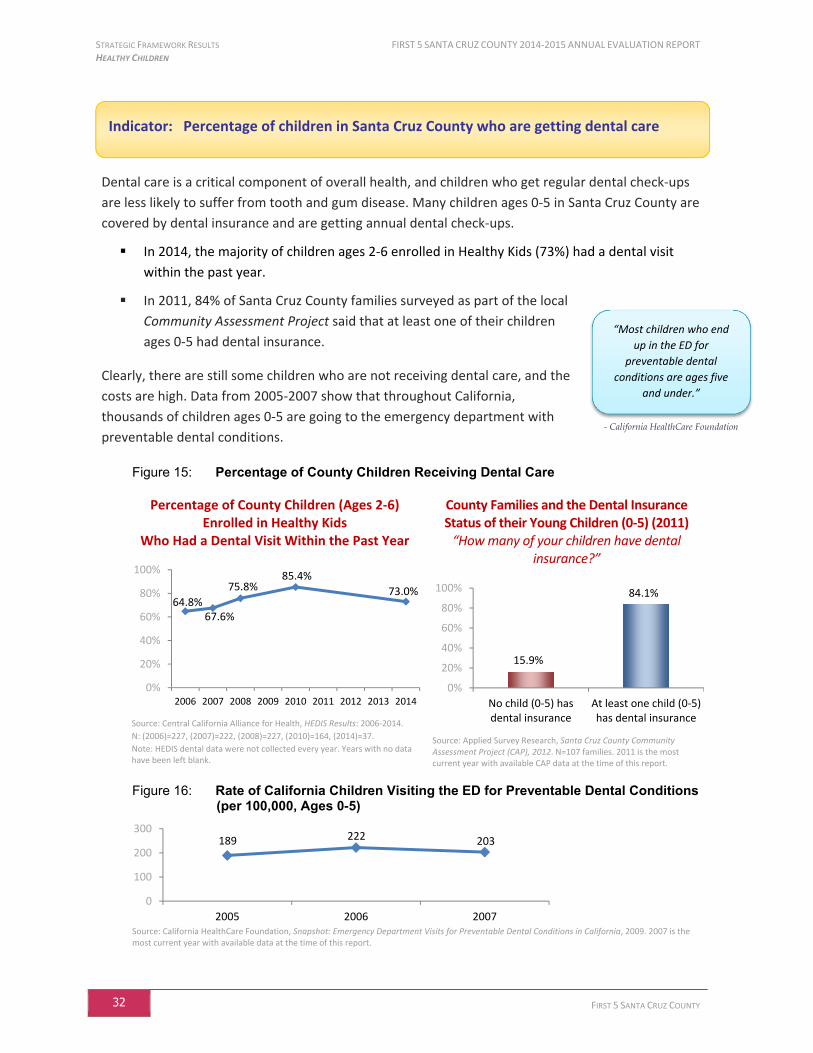
STRATEGIC FRAMEWORK RESULTS FIRST 5 SANTA CRUZ COUNTY 2014-2015 ANNUAL EVALUATION REPORT HEALTHY CHILDREN
32 FIRST 5 SANTA CRUZ COUNTY
Dental care is a critical component of overall health, and children who get regular dental check-ups
are less likely to suffer from tooth and gum disease. Many children ages 0-5 in Santa Cruz County are
covered by dental insurance and are getting annual dental check-ups.
In 2014, the majority of children ages 2-6 enrolled in Healthy Kids (73%) had a dental visit
within the past year.
In 2011, 84% of Santa Cruz County families surveyed as part of the local
Community Assessment Project said that at least one of their children
ages 0-5 had dental insurance.
Clearly, there are still some children who are not receiving dental care, and the
costs are high. Data from 2005-2007 show that throughout California,
thousands of children ages 0-5 are going to the emergency department with
preventable dental conditions.
Figure 15: Percentage of County Children Receiving Dental Care
Percentage of County Children (Ages 2-6) Enrolled in Healthy Kids
Who Had a Dental Visit Within the Past Year
Source: Central California Alliance for Health, HEDIS Results: 2006-2014.
N: (2006)=227, (2007)=222, (2008)=227, (2010)=164, (2014)=37.
Note: HEDIS dental data were not collected every year. Years with no data have been left blank.
County Families and the Dental Insurance Status of their Young Children (0-5) (2011)
“How many of your children have dental insurance?”
Source: Applied Survey Research, Santa Cruz County Community Assessment Project (CAP), 2012. N=107 families. 2011 is the most current year with available CAP data at the time of this report.
Figure 16: Rate of California Children Visiting the ED for Preventable Dental Conditions (per 100,000, Ages 0-5)
Source: California HealthCare Foundation, Snapshot: Emergency Department Visits for Preventable Dental Conditions in California, 2009. 2007 is the most current year with available data at the time of this report.
64.8%67.6%
75.8%85.4%
73.0%
0%
20%
40%
60%
80%
100%
2006 2007 2008 2009 2010 2011 2012 2013 2014
15.9%
84.1%
0%
20%
40%
60%
80%
100%
No child (0-5) hasdental insurance
At least one child (0-5)has dental insurance
189 222 203
0
100
200
300
2005 2006 2007
Indicator: Percentage of children in Santa Cruz County who are getting dental care
“Most children who end
up in the ED for
preventable dental
conditions are ages five
and under.”
- California HealthCare Foundation
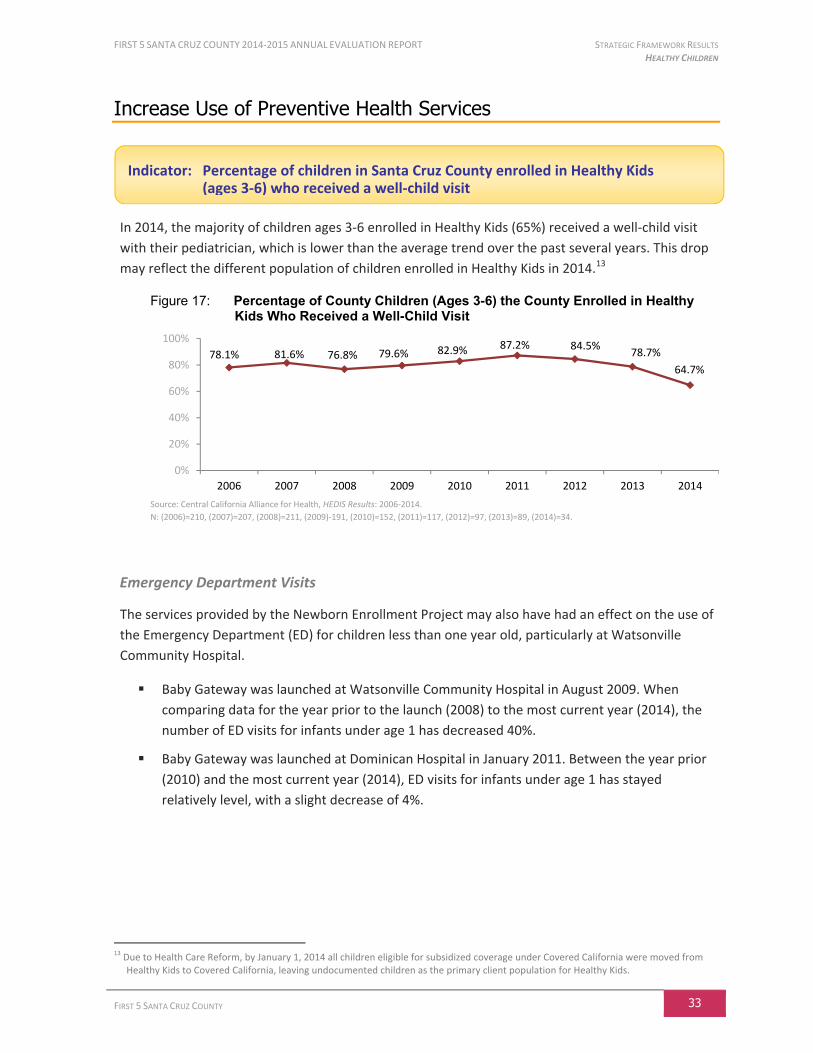
FIRST 5 SANTA CRUZ COUNTY 2014-2015 ANNUAL EVALUATION REPORT STRATEGIC FRAMEWORK RESULTS HEALTHY CHILDREN
FIRST 5 SANTA CRUZ COUNTY 33
Increase Use of Preventive Health Services
In 2014, the majority of children ages 3-6 enrolled in Healthy Kids (65%) received a well-child visit
with their pediatrician, which is lower than the average trend over the past several years. This drop
may reflect the different population of children enrolled in Healthy Kids in 2014.13
Figure 17: Percentage of County Children (Ages 3-6) the County Enrolled in Healthy Kids Who Received a Well-Child Visit
Source: Central California Alliance for Health, HEDIS Results: 2006-2014.
N: (2006)=210, (2007)=207, (2008)=211, (2009)-191, (2010)=152, (2011)=117, (2012)=97, (2013)=89, (2014)=34.
Emergency Department Visits
The services provided by the Newborn Enrollment Project may also have had an effect on the use of
the Emergency Department (ED) for children less than one year old, particularly at Watsonville
Community Hospital.
Baby Gateway was launched at Watsonville Community Hospital in August 2009. When
comparing data for the year prior to the launch (2008) to the most current year (2014), the
number of ED visits for infants under age 1 has decreased 40%.
Baby Gateway was launched at Dominican Hospital in January 2011. Between the year prior
(2010) and the most current year (2014), ED visits for infants under age 1 has stayed
relatively level, with a slight decrease of 4%.
13
Due to Health Care Reform, by January 1, 2014 all children eligible for subsidized coverage under Covered California were moved from Healthy Kids to Covered California, leaving undocumented children as the primary client population for Healthy Kids.
78.1% 81.6% 76.8% 79.6% 82.9% 87.2% 84.5%78.7%
64.7%
0%
20%
40%
60%
80%
100%
2006 2007 2008 2009 2010 2011 2012 2013 2014
Indicator: Percentage of children in Santa Cruz County enrolled in Healthy Kids (ages 3-6) who received a well-child visit
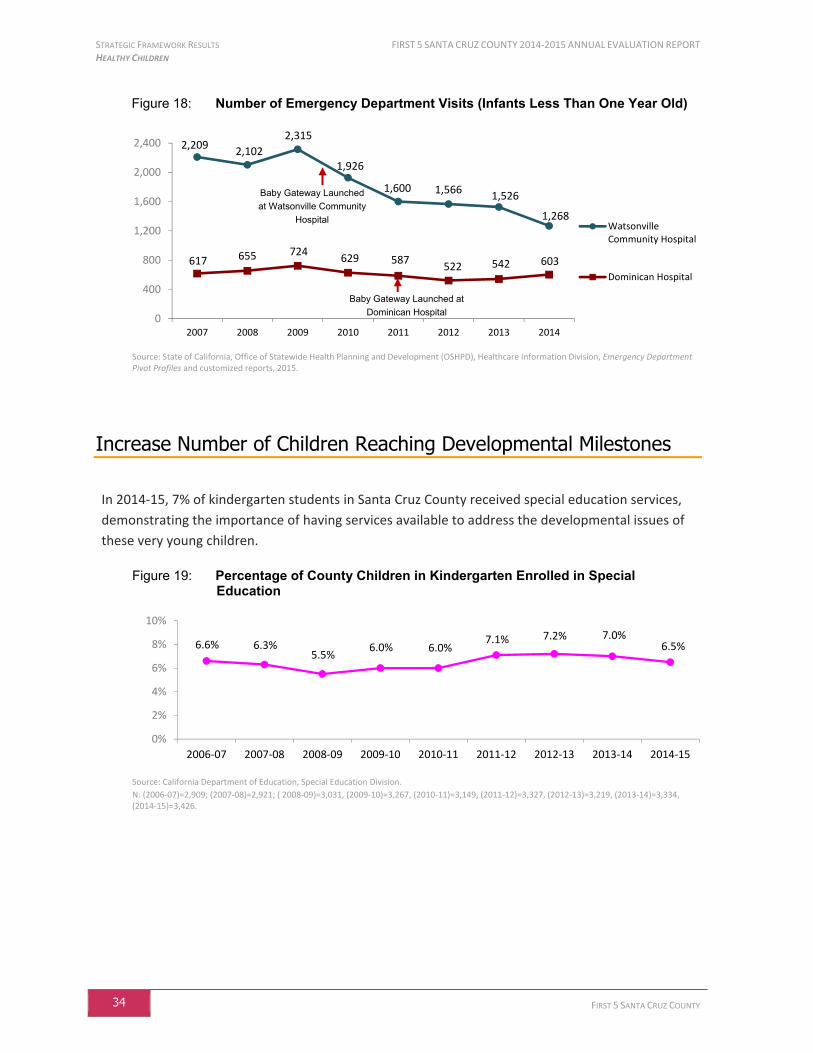
STRATEGIC FRAMEWORK RESULTS FIRST 5 SANTA CRUZ COUNTY 2014-2015 ANNUAL EVALUATION REPORT HEALTHY CHILDREN
34 FIRST 5 SANTA CRUZ COUNTY
Figure 18: Number of Emergency Department Visits (Infants Less Than One Year Old)
Source: State of California, Office of Statewide Health Planning and Development (OSHPD), Healthcare Information Division, Emergency Department Pivot Profiles and customized reports, 2015.
Increase Number of Children Reaching Developmental Milestones
In 2014-15, 7% of kindergarten students in Santa Cruz County received special education services,
demonstrating the importance of having services available to address the developmental issues of
these very young children.
Figure 19: Percentage of County Children in Kindergarten Enrolled in Special Education
Source: California Department of Education, Special Education Division.
N: (2006-07)=2,909; (2007-08)=2,921; ( 2008-09)=3,031, (2009-10)=3,267, (2010-11)=3,149, (2011-12)=3,327, (2012-13)=3,219, (2013-14)=3,334, (2014-15)=3,426.
2,2092,102
2,315
1,926
1,600 1,5661,526
1,268
617 655 724629 587
522 542 603
0
400
800
1,200
1,600
2,000
2,400
2007 2008 2009 2010 2011 2012 2013 2014
WatsonvilleCommunity Hospital
Dominican Hospital
6.6% 6.3%5.5%
6.0% 6.0%7.1% 7.2% 7.0%
6.5%
0%
2%
4%
6%
8%
10%
2006-07 2007-08 2008-09 2009-10 2010-11 2011-12 2012-13 2013-14 2014-15
Baby Gateway Launched at
Dominican Hospital
Baby Gateway Launched
at Watsonville Community
Hospital
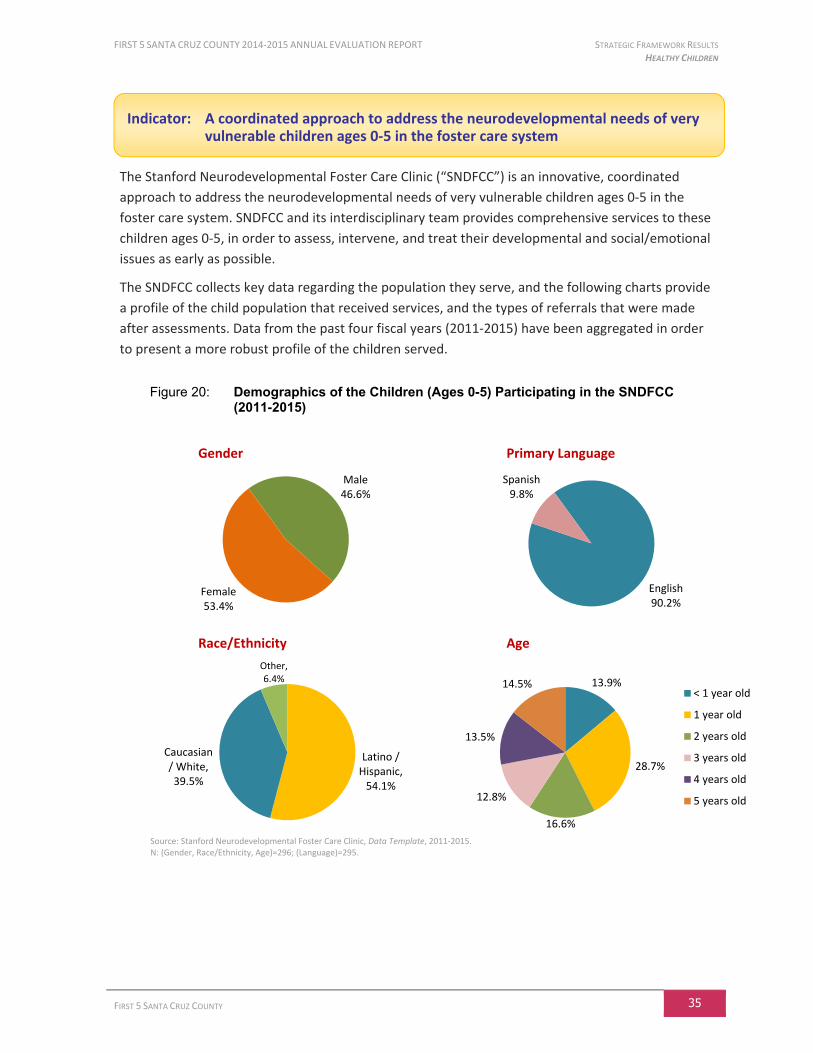
FIRST 5 SANTA CRUZ COUNTY 2014-2015 ANNUAL EVALUATION REPORT STRATEGIC FRAMEWORK RESULTS HEALTHY CHILDREN
FIRST 5 SANTA CRUZ COUNTY 35
The Stanford Neurodevelopmental Foster Care Clinic (“SNDFCC”) is an innovative, coordinated
approach to address the neurodevelopmental needs of very vulnerable children ages 0-5 in the
foster care system. SNDFCC and its interdisciplinary team provides comprehensive services to these
children ages 0-5, in order to assess, intervene, and treat their developmental and social/emotional
issues as early as possible.
The SNDFCC collects key data regarding the population they serve, and the following charts provide
a profile of the child population that received services, and the types of referrals that were made
after assessments. Data from the past four fiscal years (2011-2015) have been aggregated in order
to present a more robust profile of the children served.
Figure 20: Demographics of the Children (Ages 0-5) Participating in the SNDFCC (2011-2015)
Gender Primary Language
Race/Ethnicity Age
Source: Stanford Neurodevelopmental Foster Care Clinic, Data Template, 2011-2015. N: (Gender, Race/Ethnicity, Age)=296; (Language)=295.
Male46.6%
Female53.4%
English90.2%
Spanish9.8%
Latino / Hispanic,
54.1%
Caucasian / White, 39.5%
Other, 6.4% 13.9%
28.7%
16.6%
12.8%
13.5%
14.5%< 1 year old
1 year old
2 years old
3 years old
4 years old
5 years old
Indicator: A coordinated approach to address the neurodevelopmental needs of very vulnerable children ages 0-5 in the foster care system
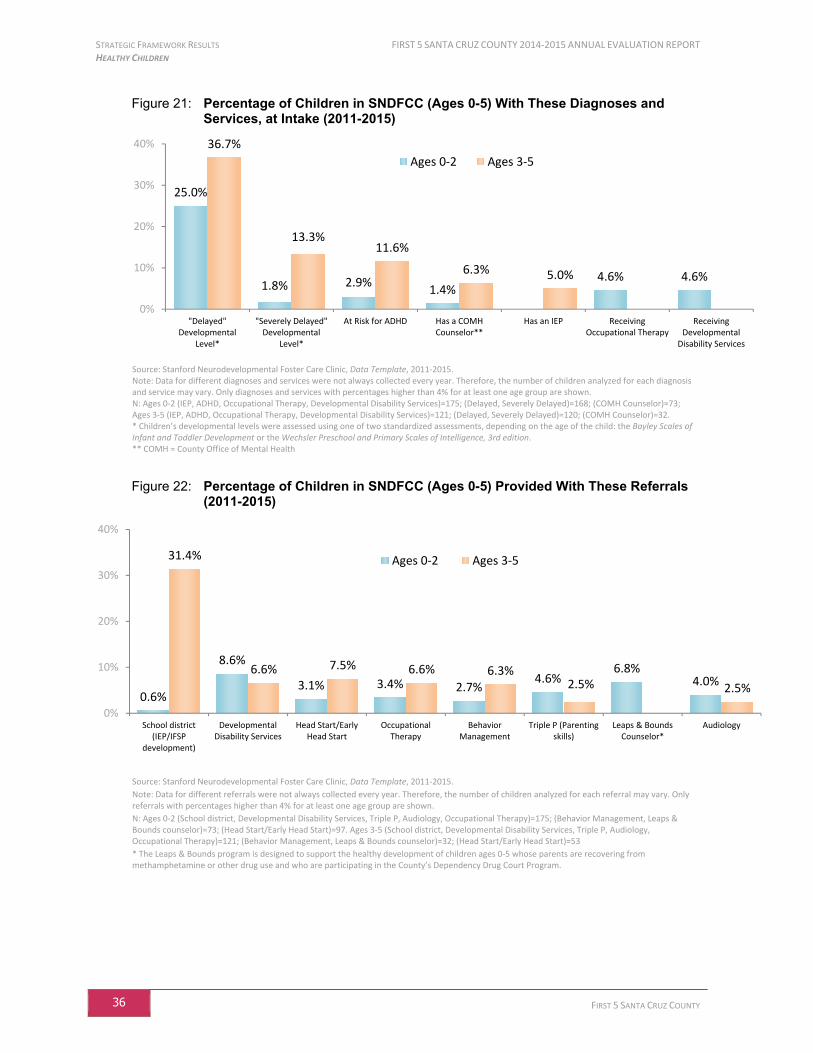
STRATEGIC FRAMEWORK RESULTS FIRST 5 SANTA CRUZ COUNTY 2014-2015 ANNUAL EVALUATION REPORT HEALTHY CHILDREN
36 FIRST 5 SANTA CRUZ COUNTY
Figure 21: Percentage of Children in SNDFCC (Ages 0-5) With These Diagnoses and Services, at Intake (2011-2015)
Source: Stanford Neurodevelopmental Foster Care Clinic, Data Template, 2011-2015. Note: Data for different diagnoses and services were not always collected every year. Therefore, the number of children analyzed for each diagnosis and service may vary. Only diagnoses and services with percentages higher than 4% for at least one age group are shown. N: Ages 0-2 (IEP, ADHD, Occupational Therapy, Developmental Disability Services)=175; (Delayed, Severely Delayed)=168; (COMH Counselor)=73; Ages 3-5 (IEP, ADHD, Occupational Therapy, Developmental Disability Services)=121; (Delayed, Severely Delayed)=120; (COMH Counselor)=32. * Children’s developmental levels were assessed using one of two standardized assessments, depending on the age of the child: the Bayley Scales of Infant and Toddler Development or the Wechsler Preschool and Primary Scales of Intelligence, 3rd edition. ** COMH = County Office of Mental Health
Figure 22: Percentage of Children in SNDFCC (Ages 0-5) Provided With These Referrals (2011-2015)
Source: Stanford Neurodevelopmental Foster Care Clinic, Data Template, 2011-2015.
Note: Data for different referrals were not always collected every year. Therefore, the number of children analyzed for each referral may vary. Only referrals with percentages higher than 4% for at least one age group are shown.
N: Ages 0-2 (School district, Developmental Disability Services, Triple P, Audiology, Occupational Therapy)=175; (Behavior Management, Leaps & Bounds counselor)=73; (Head Start/Early Head Start)=97. Ages 3-5 (School district, Developmental Disability Services, Triple P, Audiology, Occupational Therapy)=121; (Behavior Management, Leaps & Bounds counselor)=32; (Head Start/Early Head Start)=53
* The Leaps & Bounds program is designed to support the healthy development of children ages 0-5 whose parents are recovering from methamphetamine or other drug use and who are participating in the County’s Dependency Drug Court Program.
25.0%
1.8% 2.9%1.4%
4.6% 4.6%
36.7%
13.3%11.6%
6.3% 5.0%
0%
10%
20%
30%
40%
"Delayed"Developmental
Level*
"Severely Delayed"Developmental
Level*
At Risk for ADHD Has a COMHCounselor**
Has an IEP ReceivingOccupational Therapy
ReceivingDevelopmental
Disability Services
Ages 0-2 Ages 3-5
0.6%
8.6%
3.1% 3.4% 2.7%4.6%
6.8%4.0%
31.4%
6.6% 7.5% 6.6% 6.3%2.5% 2.5%
0%
10%
20%
30%
40%
School district(IEP/IFSP
development)
DevelopmentalDisability Services
Head Start/EarlyHead Start
OccupationalTherapy
BehaviorManagement
Triple P (Parentingskills)
Leaps & BoundsCounselor*
Audiology
Ages 0-2 Ages 3-5

FIRST 5 SANTA CRUZ COUNTY 2014-2015 ANNUAL EVALUATION REPORT STRATEGIC FRAMEWORK RESULTS STRONG FAMILIES
FIRST 5 SANTA CRUZ COUNTY 37
Strong Families
This portion of First 5 Santa Cruz County’s Strategic
Framework analysis includes data regarding the
Commission’s goals to decrease child abuse and
neglect and improve parent and caregiver practices
that support children’s social/emotional development. Additional information about partners’ efforts
to support Strong Families can be found in the Partner Profiles section of this report.
Decrease Child Abuse and Neglect
The rate of substantiated allegations of child maltreatment in Santa Cruz County has decreased from
a high of 16.2 (per 1,000) in 2004, to 6.8 (per 1,000) in 2014. The decreasing rates in Santa Cruz
County may have been assisted by the efforts of the Families Together program and the countywide
Triple P – Positive Parenting Program, which launched in late 2006 and 2009, respectively.
Figure 23: Rate of Substantiated Allegations of Child Maltreatment in Santa Cruz County and California (per 1,000)
Needell, B., Webster, D., Armijo, M., Lee, S., Dawson, W., Magruder, J., Exel, M., Cuccaro-Alamin, S., Putnam-Hornstein, E., King, B., Morris, Z., Sandoval, A., Yee, H., Mason, F., Benton, C., & Pixton, E. (2015). CCWIP reports. Retrieved 6/25/2015, from University of California at Berkeley California Child Welfare Indicators Project website. URL: <http://cssr.berkeley.edu/ucb_childwelfare>
11.6 11.5 11.3 11.210.2 9.9
9.6
9.5
9.3 9.2 9.0
16.2 15.7
13.714.4
12.2
10.2
8.8
11.0
7.9 7.36.8
0
2
4
6
8
10
12
14
16
18
2004 2005 2006 2007 2008 2009 2010 2011 2012 2013 2014
California
Santa Cruz County
Indicator: Rate of substantiated allegations of child maltreatment in Santa Cruz County
Strong Families
STRONG FAMILIES
Families Together
Launched 9/2006 Triple P
Launched 11/2009
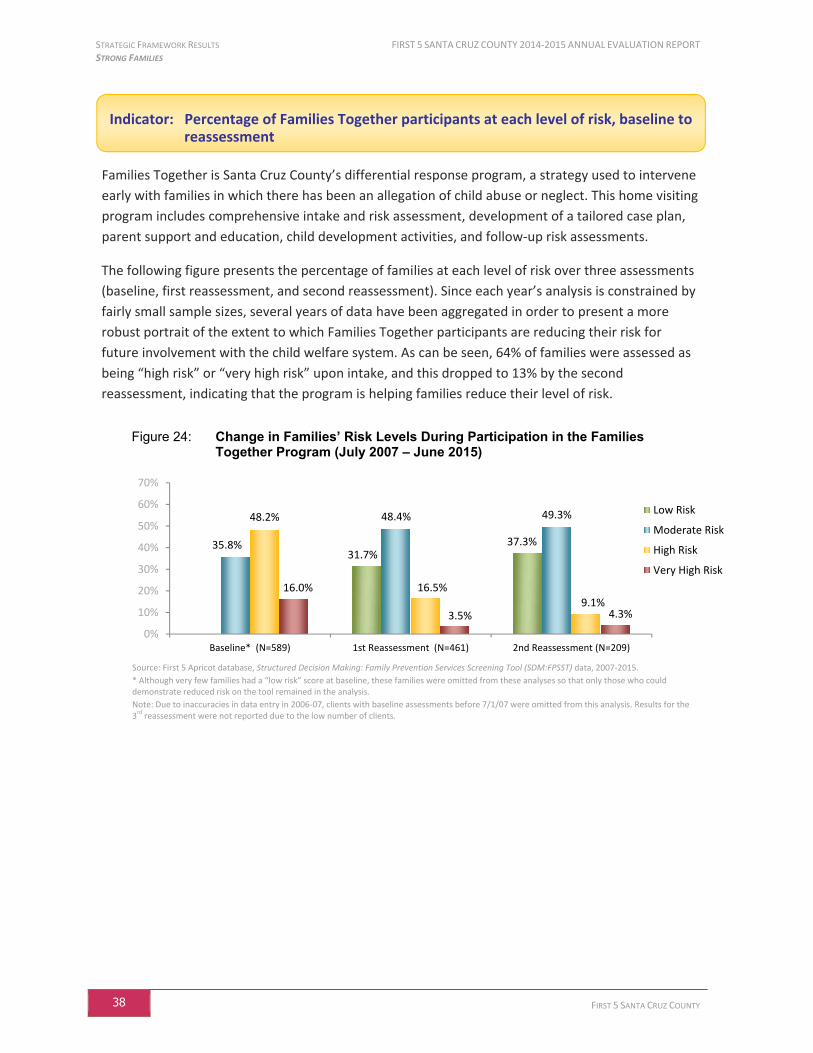
STRATEGIC FRAMEWORK RESULTS FIRST 5 SANTA CRUZ COUNTY 2014-2015 ANNUAL EVALUATION REPORT STRONG FAMILIES
38 FIRST 5 SANTA CRUZ COUNTY
Families Together is Santa Cruz County’s differential response program, a strategy used to intervene
early with families in which there has been an allegation of child abuse or neglect. This home visiting
program includes comprehensive intake and risk assessment, development of a tailored case plan,
parent support and education, child development activities, and follow-up risk assessments.
The following figure presents the percentage of families at each level of risk over three assessments
(baseline, first reassessment, and second reassessment). Since each year’s analysis is constrained by
fairly small sample sizes, several years of data have been aggregated in order to present a more
robust portrait of the extent to which Families Together participants are reducing their risk for
future involvement with the child welfare system. As can be seen, 64% of families were assessed as
being “high risk” or “very high risk” upon intake, and this dropped to 13% by the second
reassessment, indicating that the program is helping families reduce their level of risk.
Figure 24: Change in Families’ Risk Levels During Participation in the Families Together Program (July 2007 – June 2015)
Source: First 5 Apricot database, Structured Decision Making: Family Prevention Services Screening Tool (SDM:FPSST) data, 2007-2015.
* Although very few families had a “low risk” score at baseline, these families were omitted from these analyses so that only those who could demonstrate reduced risk on the tool remained in the analysis.
Note: Due to inaccuracies in data entry in 2006-07, clients with baseline assessments before 7/1/07 were omitted from this analysis. Results for the 3rd reassessment were not reported due to the low number of clients.
31.7%37.3%35.8%
48.4% 49.3%48.2%
16.5%
9.1%16.0%
3.5% 4.3%
0%
10%
20%
30%
40%
50%
60%
70%
Baseline* (N=589) 1st Reassessment (N=461) 2nd Reassessment (N=209)
Low Risk
Moderate Risk
High Risk
Very High Risk
Indicator: Percentage of Families Together participants at each level of risk, baseline to reassessment
FIRST 5 SANTA CRUZ COUNTY 2014-2015 ANNUAL EVALUATION REPORT STRATEGIC FRAMEWORK RESULTS STRONG FAMILIES
FIRST 5 SANTA CRUZ COUNTY 39
Of the 66 families who received services from Families Together and had their cases closed in the
2014 calendar year:
94% did not have a substantiated allegation of maltreatment within six months after case
closure. This figure is comparable to what was observed in the previous years.
An additional study found that 20% had been re-referred to child welfare within six months
after their exit from Families Together.
These results indicate that although some families are re-referred to child welfare after exiting from
Families Together, the rate of substantiated abuse is low. This suggests that even though families
are still experiencing high risk factors that lead to a child welfare report, they may have gained skills
and resources during their participation in Families Together that prevent court-mandated
involvement with child welfare.
Improve Parent and Caregiver Practices that Support Children’s Social and Emotional Development
The Triple P Program
First 5 Santa Cruz County has led the implementation of the Triple P – Positive Parenting Program
since late 2009, in partnership with two local funders (Health Services Agency and Human Services
Department) and agencies that serve children and families. Triple P is a comprehensive, evidence-
based parenting and family support system designed to increase parents’ confidence and
competence in raising children, improve the quality of parent-child relationships, and make
evidence-based parenting information and interventions widely accessible to parents. First 5 is now
implementing the full suite of Triple P services, which is designed to reach an entire community as
well as individual families through:
A media-based social marketing campaign;
Seminars on general parenting topics;
Workshops on specific parenting topics;
Brief consultations regarding a specific parenting concern;
In-depth parent education and skills training; and
Additional support to help parents deal with other stressors that impact their parenting
Selected data for key indicators are highlighted below for their significance, and more detailed data are
presented in the Triple P Partner Profile found later in this report.
Indicator: Percentage of Families Together participants with substantiated allegations of child maltreatment within 6 months of program completion
STRATEGIC FRAMEWORK RESULTS FIRST 5 SANTA CRUZ COUNTY 2014-2015 ANNUAL EVALUATION REPORT STRONG FAMILIES
40 FIRST 5 SANTA CRUZ COUNTY
First 5 continued to implement its Triple P social marketing campaign with the assistance of Miller
Maxfield, a local communications firm, in order to reach a broad population of parents, including
those who are less likely to seek support from a social service agency. The 2014-15 campaign
activities built on the previous year’s efforts to increase awareness about the benefits and availability
of the Triple P program in Santa Cruz County. Key campaign activities included:
Branding & Messaging: Continued to raise awareness of Triple P through earned media, paid
advertisements, event sponsorships, social media, and video PSAs
Web site: Received 313 online registrations for Triple P classes
Triple P Warmline/Email/Facebook: Received 103 requests for Triple P information and
services
Parenting Pocket Guides: Distributed approximately 8,500 bilingual Triple P parenting pocket
guides
Articles: Disseminated monthly articles with parenting tips in newspapers, web sites and
Triple P Santa Cruz County's e-newsletter
Triple P Santa Cruz County Facebook page: Gained 501 new fans
Positive Parenting Passport: Developed “passport” program to engage parents in Triple P
and positive parenting activities; Partnered with local businesses to sponsor prizes
Earned Media: Received free media coverage of Triple P classes and articles 157 times
Ads & Sponsorships: Promoted Triple P via bus ads, Highway 17 billboard, newspaper ads,
and sponsorship of Santa Cruz Warriors Kids' Dunk and Santa Cruz Children's Museum of
Discovery Mobile Museum
Parents who began the program with more serious parenting issues demonstrated the greatest
improvements as a result of receiving in-depth services (8 or more sessions). The majority of All
Parents who received in-depth Triple P services demonstrated improvement in each of these five
parenting domains: Perception of child’s behavior; Overall parenting style; Depression; Anxiety; Stress.
Indicator: Level of community members’ engagement in Triple P social marketing and outreach activities
Indicator: Percentage of parents experiencing high levels of distress who demonstrate improvement in one or more key parenting domains
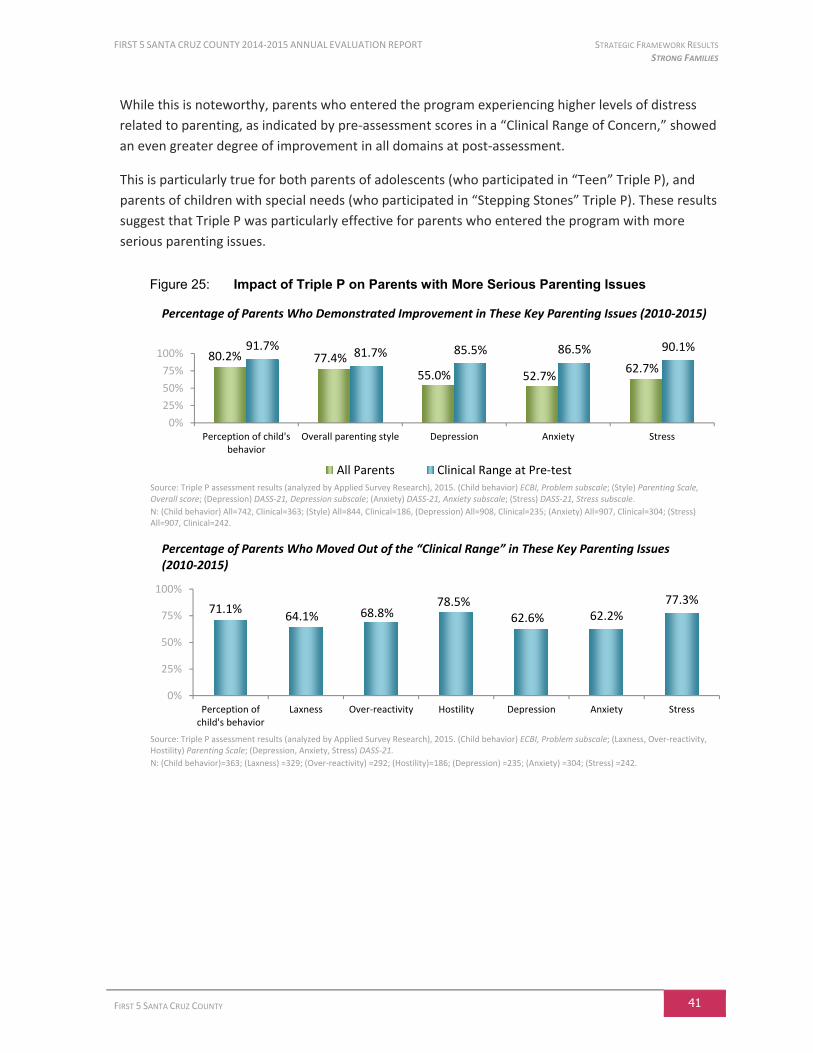
FIRST 5 SANTA CRUZ COUNTY 2014-2015 ANNUAL EVALUATION REPORT STRATEGIC FRAMEWORK RESULTS STRONG FAMILIES
FIRST 5 SANTA CRUZ COUNTY 41
While this is noteworthy, parents who entered the program experiencing higher levels of distress
related to parenting, as indicated by pre-assessment scores in a “Clinical Range of Concern,” showed
an even greater degree of improvement in all domains at post-assessment.
This is particularly true for both parents of adolescents (who participated in “Teen” Triple P), and
parents of children with special needs (who participated in “Stepping Stones” Triple P). These results
suggest that Triple P was particularly effective for parents who entered the program with more
serious parenting issues.
Figure 25: Impact of Triple P on Parents with More Serious Parenting Issues
Percentage of Parents Who Demonstrated Improvement in These Key Parenting Issues (2010-2015)
Source: Triple P assessment results (analyzed by Applied Survey Research), 2015. (Child behavior) ECBI, Problem subscale; (Style) Parenting Scale, Overall score; (Depression) DASS-21, Depression subscale; (Anxiety) DASS-21, Anxiety subscale; (Stress) DASS-21, Stress subscale.
N: (Child behavior) All=742, Clinical=363; (Style) All=844, Clinical=186, (Depression) All=908, Clinical=235; (Anxiety) All=907, Clinical=304; (Stress) All=907, Clinical=242.
Percentage of Parents Who Moved Out of the “Clinical Range” in These Key Parenting Issues (2010-2015)
Source: Triple P assessment results (analyzed by Applied Survey Research), 2015. (Child behavior) ECBI, Problem subscale; (Laxness, Over-reactivity, Hostility) Parenting Scale; (Depression, Anxiety, Stress) DASS-21.
N: (Child behavior)=363; (Laxness) =329; (Over-reactivity) =292; (Hostility)=186; (Depression) =235; (Anxiety) =304; (Stress) =242.
80.2% 77.4%
55.0% 52.7%62.7%
91.7%81.7% 85.5% 86.5% 90.1%
0%
25%
50%
75%
100%
Perception of child'sbehavior
Overall parenting style Depression Anxiety Stress
All Parents Clinical Range at Pre-test
71.1%64.1% 68.8%
78.5%62.6% 62.2%
77.3%
0%
25%
50%
75%
100%
Perception ofchild's behavior
Laxness Over-reactivity Hostility Depression Anxiety Stress
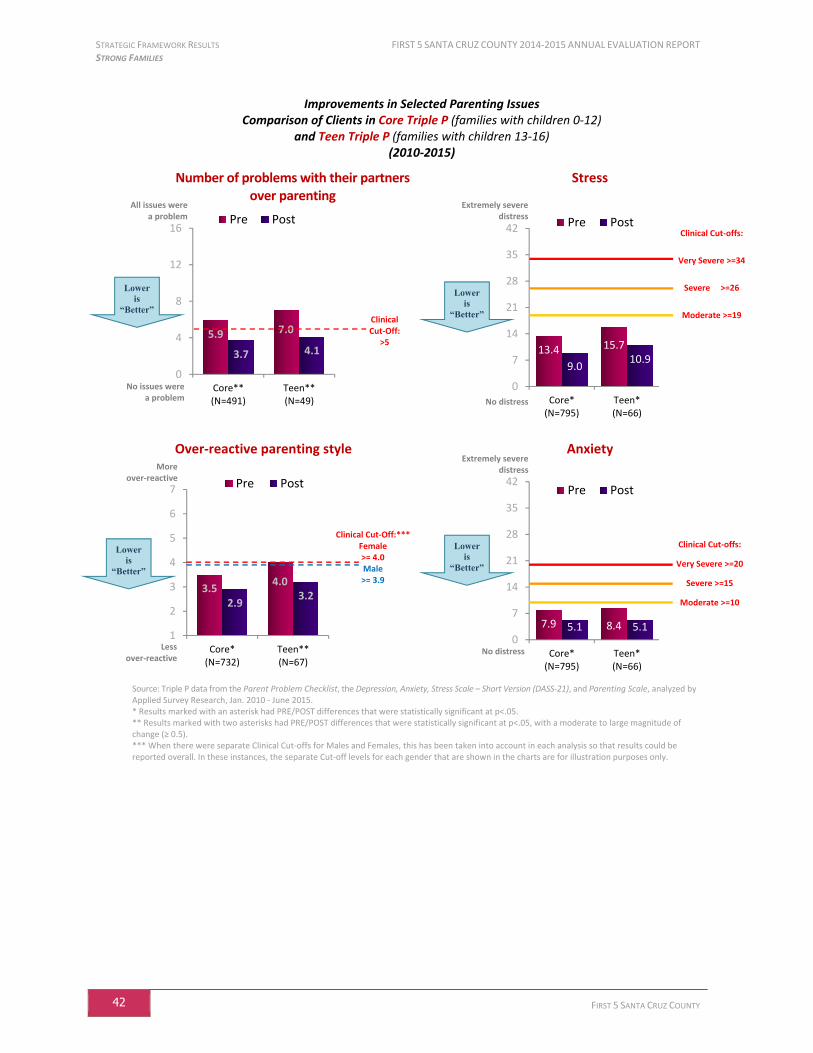
STRATEGIC FRAMEWORK RESULTS FIRST 5 SANTA CRUZ COUNTY 2014-2015 ANNUAL EVALUATION REPORT STRONG FAMILIES
42 FIRST 5 SANTA CRUZ COUNTY
Improvements in Selected Parenting Issues Comparison of Clients in Core Triple P (families with children 0-12)
and Teen Triple P (families with children 13-16) (2010-2015)
Number of problems with their partners over parenting
Stress
Over-reactive parenting style Anxiety
Source: Triple P data from the Parent Problem Checklist, the Depression, Anxiety, Stress Scale – Short Version (DASS-21), and Parenting Scale, analyzed by Applied Survey Research, Jan. 2010 - June 2015. * Results marked with an asterisk had PRE/POST differences that were statistically significant at p<.05. ** Results marked with two asterisks had PRE/POST differences that were statistically significant at p<.05, with a moderate to large magnitude of change (≥ 0.5). *** When there were separate Clinical Cut-offs for Males and Females, this has been taken into account in each analysis so that results could be reported overall. In these instances, the separate Cut-off levels for each gender that are shown in the charts are for illustration purposes only.
5.9 7.0
3.7 4.1
0
4
8
12
16
Core**(N=491)
Teen**(N=49)
Pre Post
13.4 15.7
9.010.9
0
7
14
21
28
35
42
Core*(N=795)
Teen*(N=66)
Pre Post
3.54.0
2.93.2
1
2
3
4
5
6
7
Core*(N=732)
Teen**(N=67)
Pre Post
7.9 8.45.1 5.10
7
14
21
28
35
42
Core*(N=795)
Teen*(N=66)
Pre Post
Less over-reactive
Lower is
“Better”
Clinical Cut-Off:*** Female >= 4.0 Male >= 3.9
More over-reactive
Lower is
“Better” Clinical Cut-Off:
>5
All issues were a problem
No issues were a problem
Extremely severe distress
No distress
Lower is
“Better”
Clinical Cut-offs:
Very Severe >=34
Severe >=26
Moderate >=19
Extremely severe distress
No distress
Lower is
“Better”
Clinical Cut-offs:
Very Severe >=20
Severe >=15
Moderate >=10

FIRST 5 SANTA CRUZ COUNTY 2014-2015 ANNUAL EVALUATION REPORT STRATEGIC FRAMEWORK RESULTS STRONG FAMILIES
FIRST 5 SANTA CRUZ COUNTY 43
Improvements in Selected Parenting Issues Comparison of Clients in Core Triple P (families with children 0-12)
and Stepping Stones Triple P (families with children who have special needs) (2010-2015)
Lax parenting style Stress
Number of child behaviors perceived to be a problem
Depression
Source: Triple P data from the Parenting Scale, ECBI, and the Depression, Anxiety, Stress Scale – Short Version (DASS-21), analyzed by Applied Survey Research, Jan. 2010 - June 2015. * Results marked with an asterisk had PRE/POST differences that were statistically significant at p<.05. ** Results marked with two asterisks had PRE/POST differences that were statistically significant at p<.05, with a moderate to large magnitude of change (≥ 0.5). *** When there were separate Clinical Cut-offs for Males and Females, this has been taken into account in each analysis so that results could be reported overall. In these instances, the separate Cut-off levels for each gender that are shown in the charts are for illustration purposes only.
3.2
4.0
2.6 2.6
1
2
3
4
5
6
7
Core**(N=733)
Stepping Stones**(N=11)
Pre Post
13.4 14.7
9.06.7
0
7
14
21
28
35
42
Core*(N=795)
Stepping Stones**(N=11)
Pre Post
14.3
19.4
7.411.0
0
6
12
18
24
30
36
Core**(N=645)
Stepping Stones**(N=10)
Pre Post
9.46.96.0
2.40
7
14
21
28
35
42
Core*(N=796)
Stepping Stones**(N=11)
Pre PostAll behaviors were a problem
No behaviors were a problem
Clinical Cut-off:
>=15
Lower is
“Better”
More lax
Less lax
Lower is
“Better”
Clinical Cut-Off:*** Female >= 3.6
Male >= 3.4
No distress
Lower is
“Better”
Clinical Cut-offs:
Very Severe >=34
Severe >=26
Moderate >=19
Lower is
“Better”
Extremely severe distress
No distress
Extremely severe distress
Clinical Cut-offs:
Very Severe >=28
Severe >= 21
Moderate >=14

STRATEGIC FRAMEWORK RESULTS FIRST 5 SANTA CRUZ COUNTY 2014-2015 ANNUAL EVALUATION REPORT STRONG FAMILIES
44 FIRST 5 SANTA CRUZ COUNTY
Parents who participated in in-depth Triple P services completed the Parenting Scale as a self-
assessment of their parenting style (this was only completed if the parent had at least one child
aged 18 months or older). Scores could range from 1 to 7, with lower scores indicating more positive
styles of discipline. An analysis of pre and post assessment scores indicates that:
There was significant improvement from pre to post assessment, indicating their parenting
style became less lax, less over-reactive, and less hostile through the course of the Triple P
program.
On average, All Parents and all analyzed parent sub-populations experienced a moderate to
large magnitude of change. These results indicate that these observed differences were not
only statistically significant but also meaningful.
Figure 26: Parents’ Use of Positive Parenting Styles (2010-2015)
Source: Triple P data from the Parenting Scale, Overall scores, analyzed by Applied Survey Research, Jan. 2010 - June 2015. Note: The Parenting Scale measures parenting styles in 3 scales, and overall. Scores for each scale are calculated by averaging the participants’ responses for each of the items. Higher scores indicate less positive parenting styles. In 2012, modifications were made to the Parenting Scale to accommodate the launching of the “Teen” variant of the Triple P program, so comparisons to previous years’ results should be made with caution. Due to these changes, there is no Clinical Cut-Off for the overall assessment score. See Appendix C for a complete description of these changes. ** Results marked with two asterisks had PRE/POST differences that were statistically significant at p<.05, with a moderate to large magnitude of change (≥ 0.5).
Continued Use and Effectiveness of Triple P: A Follow-up Phone Survey
As part of its process of continuous quality improvement, First 5 Santa Cruz County commissioned a
phone survey of Triple P participants—conducted in July 2015—to better understand the efficacy of
Triple P among local families, how participants are using Triple P strategies, how services may be
improved, as well as how Triple P can reach more families in the county who may benefit from
services.14
o On average, survey participants had last participated in Triple P services 10 months prior
to the interview. Of these, 95% reported they continue to use strategies learned from
Triple P.
14
The full report is available from First 5: Applied Survey Research, Triple P Santa Cruz County: Participant Pathways and Perspectives, 2015.
3.23.1
3.3 3.43.0
3.5
3.13.1
2.6 2.6 2.6 2.72.4
2.82.5 2.6
1
2
3
4
5
6
7
All Parents**(N=810)
Male**(N=230)
Female**(N=580)
Latino**(N=433)
Caucasian**(N=307)
Spanish**(N=298)
English**(N=496)
Child WelfareInvolved**
(N=188)
Pre Post
Indicator: Use of positive parenting styles
Less positive
More positive
Lower is
“Better”
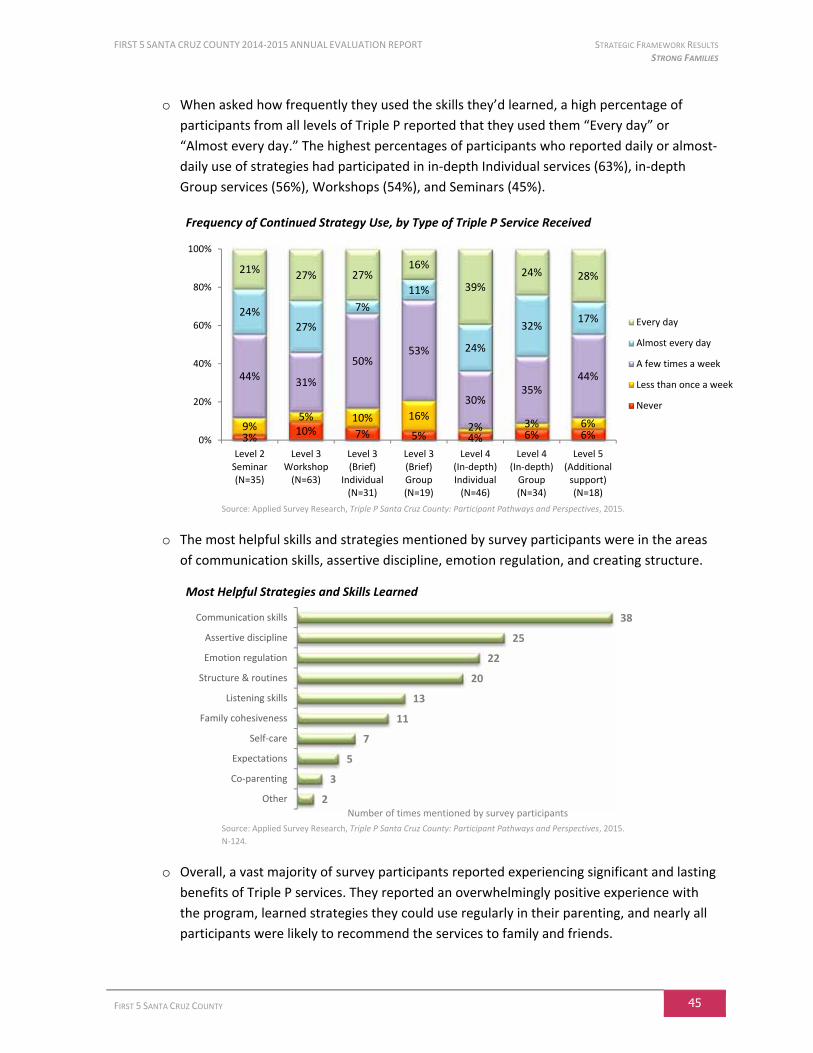
FIRST 5 SANTA CRUZ COUNTY 2014-2015 ANNUAL EVALUATION REPORT STRATEGIC FRAMEWORK RESULTS STRONG FAMILIES
FIRST 5 SANTA CRUZ COUNTY 45
o When asked how frequently they used the skills they’d learned, a high percentage of
participants from all levels of Triple P reported that they used them “Every day” or
“Almost every day.” The highest percentages of participants who reported daily or almost-
daily use of strategies had participated in in-depth Individual services (63%), in-depth
Group services (56%), Workshops (54%), and Seminars (45%).
Frequency of Continued Strategy Use, by Type of Triple P Service Received
Source: Applied Survey Research, Triple P Santa Cruz County: Participant Pathways and Perspectives, 2015.
o The most helpful skills and strategies mentioned by survey participants were in the areas
of communication skills, assertive discipline, emotion regulation, and creating structure.
Most Helpful Strategies and Skills Learned
Source: Applied Survey Research, Triple P Santa Cruz County: Participant Pathways and Perspectives, 2015.
N-124.
o Overall, a vast majority of survey participants reported experiencing significant and lasting
benefits of Triple P services. They reported an overwhelmingly positive experience with
the program, learned strategies they could use regularly in their parenting, and nearly all
participants were likely to recommend the services to family and friends.
3%10% 7% 5% 4% 6% 6%
9%5% 10% 16%
2% 3% 6%
44% 31%
50%53%
30%35%
44%
24%
27%
7%
11%
24%
32%17%
21% 27% 27%16%
39%24% 28%
0%
20%
40%
60%
80%
100%
Level 2Seminar(N=35)
Level 3Workshop
(N=63)
Level 3(Brief)
Individual(N=31)
Level 3(Brief)Group(N=19)
Level 4(In-depth)Individual
(N=46)
Level 4(In-depth)
Group(N=34)
Level 5(Additional
support)(N=18)
Every day
Almost every day
A few times a week
Less than once a week
Never
2
3
5
7
11
13
20
22
25
38
Other
Co-parenting
Expectations
Self-care
Family cohesiveness
Listening skills
Structure & routines
Emotion regulation
Assertive discipline
Communication skills
Number of times mentioned by survey participants
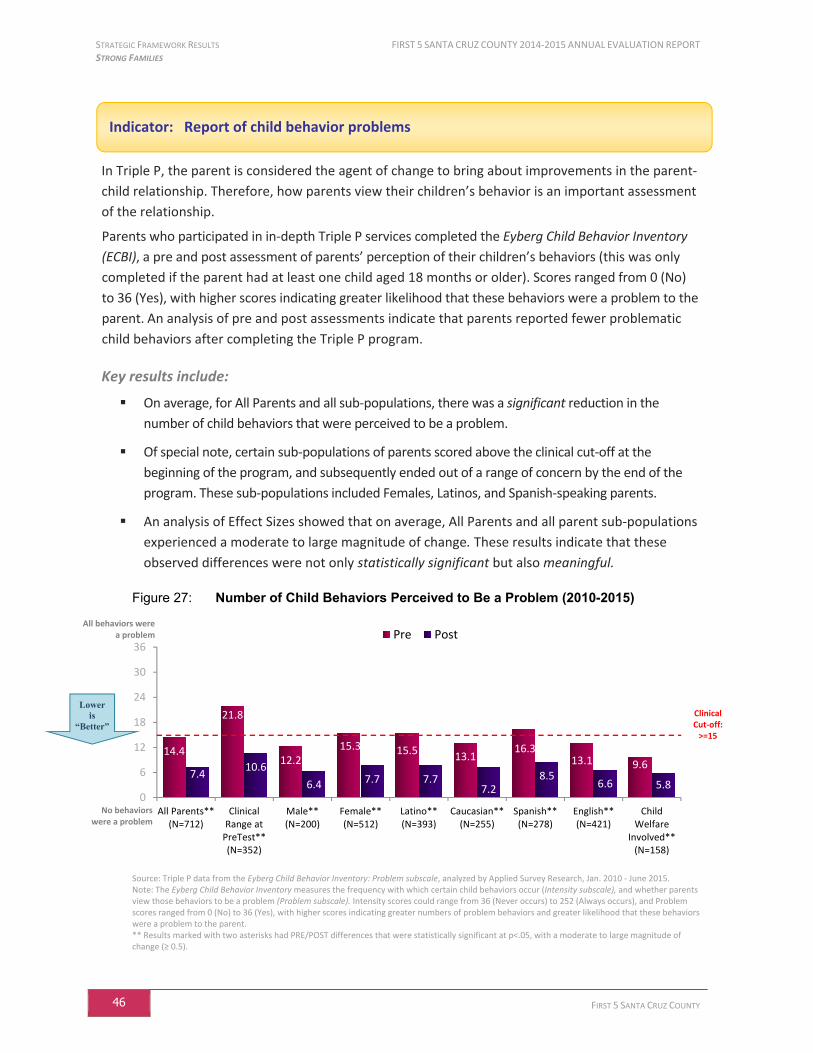
STRATEGIC FRAMEWORK RESULTS FIRST 5 SANTA CRUZ COUNTY 2014-2015 ANNUAL EVALUATION REPORT STRONG FAMILIES
46 FIRST 5 SANTA CRUZ COUNTY
In Triple P, the parent is considered the agent of change to bring about improvements in the parent-
child relationship. Therefore, how parents view their children’s behavior is an important assessment
of the relationship.
Parents who participated in in-depth Triple P services completed the Eyberg Child Behavior Inventory
(ECBI), a pre and post assessment of parents’ perception of their children’s behaviors (this was only
completed if the parent had at least one child aged 18 months or older). Scores ranged from 0 (No)
to 36 (Yes), with higher scores indicating greater likelihood that these behaviors were a problem to the
parent. An analysis of pre and post assessments indicate that parents reported fewer problematic
child behaviors after completing the Triple P program.
Key results include:
On average, for All Parents and all sub-populations, there was a significant reduction in the
number of child behaviors that were perceived to be a problem.
Of special note, certain sub-populations of parents scored above the clinical cut-off at the
beginning of the program, and subsequently ended out of a range of concern by the end of the
program. These sub-populations included Females, Latinos, and Spanish-speaking parents.
An analysis of Effect Sizes showed that on average, All Parents and all parent sub-populations
experienced a moderate to large magnitude of change. These results indicate that these
observed differences were not only statistically significant but also meaningful.
Figure 27: Number of Child Behaviors Perceived to Be a Problem (2010-2015)
Source: Triple P data from the Eyberg Child Behavior Inventory: Problem subscale, analyzed by Applied Survey Research, Jan. 2010 - June 2015. Note: The Eyberg Child Behavior Inventory measures the frequency with which certain child behaviors occur (Intensity subscale), and whether parents view those behaviors to be a problem (Problem subscale). Intensity scores could range from 36 (Never occurs) to 252 (Always occurs), and Problem scores ranged from 0 (No) to 36 (Yes), with higher scores indicating greater numbers of problem behaviors and greater likelihood that these behaviors were a problem to the parent. ** Results marked with two asterisks had PRE/POST differences that were statistically significant at p<.05, with a moderate to large magnitude of change (≥ 0.5).
14.4
21.8
12.215.3 15.5
13.116.3
13.1 9.67.4
10.6
6.4 7.7 7.77.2
8.56.6 5.8
0
6
12
18
24
30
36
All Parents**(N=712)
ClinicalRange at
PreTest**(N=352)
Male**(N=200)
Female**(N=512)
Latino**(N=393)
Caucasian**(N=255)
Spanish**(N=278)
English**(N=421)
ChildWelfare
Involved**(N=158)
Pre Post
Indicator: Report of child behavior problems
All behaviors were a problem
No behaviors were a problem
Clinical Cut-off:
>=15
Lower is
“Better”
FIRST 5 SANTA CRUZ COUNTY 2014-2015 ANNUAL EVALUATION REPORT STRATEGIC FRAMEWORK RESULTS CHILDREN LEARNING AND READY FOR SCHOOL
FIRST 5 SANTA CRUZ COUNTY 47
Children Learning and Ready for School
This portion of First 5 Santa Cruz County’s Strategic
Framework analysis includes data regarding the
Commission’s goals of increasing the quality of early
learning programs and improving children’s early
literacy skills. Additional information about partners’
efforts to support Children Learning and Ready for School can be found in the Partner Profiles section of
this report.
Increase the Quality of Early Learning Programs
In 2012-13, First 5 Santa Cruz County launched its Quality Early Learning Initiative (QELI) in
collaboration with local partners, with the goal of improving the quality of early learning programs
in Santa Cruz County. First 5 established this initiative as a result of receiving funding through
California’s Race to the Top - Early Learning Challenge (RTT-ELC) federal grant, and First 5
California’s Child Signature Program (CSP). While both of these grants share a common goal of
increasing the quality of early learning programs and closing the achievement gap for vulnerable
young children, implementation requirements vary slightly by funder, as described below.
RACE TO THE TOP – EARLY LEARNING CHALLENGE GRANT CHILD SIGNATURE PROGRAM
Funder California Department of Education First 5 California
Grant Goals Build a Quality Rating and Improvement System (QRIS) that results in:
A shared definition of child care quality based on reliable and validated research
A comprehensive and consistent approach to assess quality
A design to evaluate the rating system and its impact
Access to a system that supports quality improvement, especially for programs serving children with high needs (low income children, infants, dual language learners, children with special needs)
A consistent way for providers to communicate to parents and caregivers about quality, and increased consumer awareness about—and demand for—high quality child care
Increase quality in early learning programs for children ages 0-5 in early care and education (ECE) centers where the educational divide is greatest (i.e., neighborhoods in catchment areas of elementary schools with Academic Performance Index scores in deciles 1-3).
CHILDREN LEARNING AND READY FOR SCHOOL
STRATEGIC FRAMEWORK RESULTS FIRST 5 SANTA CRUZ COUNTY 2014-2015 ANNUAL EVALUATION REPORT CHILDREN LEARNING AND READY FOR SCHOOL
48 FIRST 5 SANTA CRUZ COUNTY
RACE TO THE TOP – EARLY LEARNING CHALLENGE GRANT CHILD SIGNATURE PROGRAM
Number of Sites/Classrooms
2012-2015
46 sites at:
o Cabrillo College
o Campus Kids Connection
o Community Bridges
o Encompass Community Services - Head Start & State Preschools
o Live Oak School District
o Pacific Elementary School District
o Pajaro Valley Unified School District
o UCSC
o Walnut Avenue Women’s Center
o YWCA of Watsonville
23 family child care sites
17 classrooms at:
Community Bridges
Encompass Community Services – Head Start & State Preschools
Live Oak School District
Pajaro Valley Unified School District
Quality Improvement Process
Conduct baseline and follow-up ratings using the Hybrid Quality Continuum Framework and Tiers (see Appendix B)
Develop site-specific Quality Improvement Plans (QIPs)
Develop a county-wide Quality Improvement Plan
Provide training, technical assistance, and coaching to achieve quality improvement goals in QIPs
Provide incentives to participate in quality improvement efforts
Convene Professional Learning Communities to promote ongoing peer learning
Conduct Readiness Assessments with participating classrooms
Develop classroom-specific Quality Improvement Plans (QIPs)
Develop county-wide Quality Improvement Plan
Provide or arrange for training and technical assistance to assist classrooms with achieving goals in QIPs
First 5 established the Santa Cruz County Quality Early Learning Initiative (QELI) Consortium,
bringing together organizations, stakeholders, and 26 early learning professionals who shared a
commitment to improving the quality of early learning and creating a county-wide Quality
Improvement Plan (QIP). Together, members of the QELI Consortium have been working to achieve
coherence and alignment in developing and piloting a local Quality Rating and Improvement System
(QRIS) as a way to foster ongoing improvement of early care and education programs in Santa Cruz
County.
The QELI Consortium adopted the Hybrid Quality Continuum Framework and Tiers as the foundation
of their local QRIS (see Appendix B). This framework identifies five tiers of quality, with points
Indicator: A consortium of local partners implementing a county-wide plan to improve the quality of early learning programs, particularly those serving the most vulnerable children
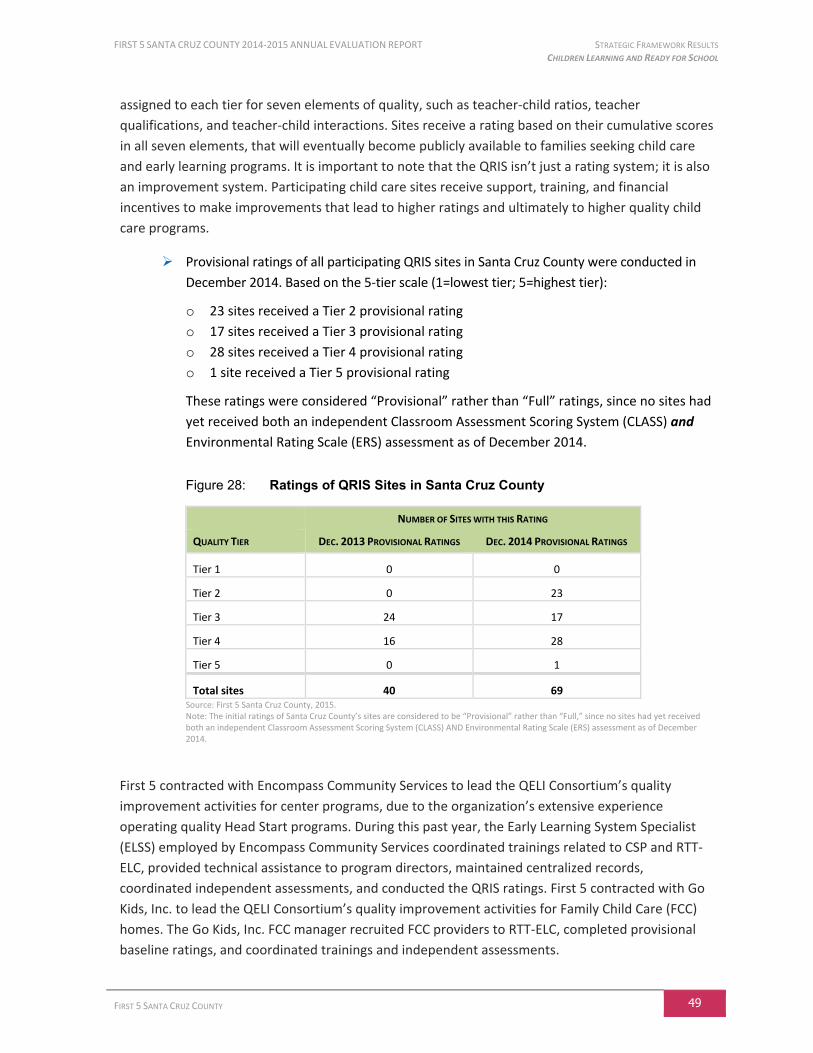
FIRST 5 SANTA CRUZ COUNTY 2014-2015 ANNUAL EVALUATION REPORT STRATEGIC FRAMEWORK RESULTS CHILDREN LEARNING AND READY FOR SCHOOL
FIRST 5 SANTA CRUZ COUNTY 49
assigned to each tier for seven elements of quality, such as teacher-child ratios, teacher
qualifications, and teacher-child interactions. Sites receive a rating based on their cumulative scores
in all seven elements, that will eventually become publicly available to families seeking child care
and early learning programs. It is important to note that the QRIS isn’t just a rating system; it is also
an improvement system. Participating child care sites receive support, training, and financial
incentives to make improvements that lead to higher ratings and ultimately to higher quality child
care programs.
Provisional ratings of all participating QRIS sites in Santa Cruz County were conducted in
December 2014. Based on the 5-tier scale (1=lowest tier; 5=highest tier):
o 23 sites received a Tier 2 provisional rating
o 17 sites received a Tier 3 provisional rating
o 28 sites received a Tier 4 provisional rating
o 1 site received a Tier 5 provisional rating
These ratings were considered “Provisional” rather than “Full” ratings, since no sites had
yet received both an independent Classroom Assessment Scoring System (CLASS) and
Environmental Rating Scale (ERS) assessment as of December 2014.
Figure 28: Ratings of QRIS Sites in Santa Cruz County
NUMBER OF SITES WITH THIS RATING
QUALITY TIER DEC. 2013 PROVISIONAL RATINGS DEC. 2014 PROVISIONAL RATINGS
Tier 1 0 0
Tier 2 0 23
Tier 3 24 17
Tier 4 16 28
Tier 5 0 1
Total sites 40 69 Source: First 5 Santa Cruz County, 2015. Note: The initial ratings of Santa Cruz County’s sites are considered to be “Provisional” rather than “Full,” since no sites had yet received both an independent Classroom Assessment Scoring System (CLASS) AND Environmental Rating Scale (ERS) assessment as of December 2014.
First 5 contracted with Encompass Community Services to lead the QELI Consortium’s quality
improvement activities for center programs, due to the organization’s extensive experience
operating quality Head Start programs. During this past year, the Early Learning System Specialist
(ELSS) employed by Encompass Community Services coordinated trainings related to CSP and RTT-
ELC, provided technical assistance to program directors, maintained centralized records,
coordinated independent assessments, and conducted the QRIS ratings. First 5 contracted with Go
Kids, Inc. to lead the QELI Consortium’s quality improvement activities for Family Child Care (FCC)
homes. The Go Kids, Inc. FCC manager recruited FCC providers to RTT-ELC, completed provisional
baseline ratings, and coordinated trainings and independent assessments.

STRATEGIC FRAMEWORK RESULTS FIRST 5 SANTA CRUZ COUNTY 2014-2015 ANNUAL EVALUATION REPORT CHILDREN LEARNING AND READY FOR SCHOOL
50 FIRST 5 SANTA CRUZ COUNTY
The following table presents the number of early childhood educators who participated
in trainings provided in 2014-15.
TRAINING / COACHING ACTIVITY NUMBER OF PARTICIPANTS
Number of early childhood educators in RTT-ELC/CSP sites who attended the Early Childhood Environmental Rating System (ECERS) training
45 center-based early childhood educators
Number of early childhood educators in RTT-ELC/CSP sites who attended a Make and Take workshop on the Early Childhood Environmental Rating System (ECERS)
37 center-based early childhood educators
Number of early childhood educators in RTT-ELC/CSP sites who attended the training and Make and Take workshop related to the Desired Results Developmental Profile – 2015
43 center-based early childhood educators
Number of directors from state and federally funded programs RTT-ELC/CSP sites participating in monthly technical assistance meetings with the Early Learning Systems Specialist
9 directors
Number of Family Child Care sites participating in monthly technical assistance meetings with the Family Child Care Education Manager
23 family child care sites
Number of participating RTT-ELC/CSP sites receiving training in the Ages and Stages Questionnaire (ASQ)
20 family child care sites
Number of participating RTT-ELC/CSP sites providing ASQ screenings
44 center sites provided ASQ screenings
20 family child care sites provided ASQ screenings
2 center sites also provided ASQ-SE screenings
Number of early childhood educators in RTT-ELC/CSP who received training in the CLASS tool
22 family child care providers
Number of early childhood educators in RTT-ELC/CSP classrooms who received coaching utilizing the CLASS tool
40 early childhood educators in 9 programs
Source: First 5 Santa Cruz County, 2015.
Santa Cruz County has joined with Santa Clara, San Francisco, Alameda, Contra Costa, and San
Mateo counties to form the Bay Area Quality Early Learning Partnership (BAQELP). This regional
consortium was developed so that these neighboring counties could strategize together, share
resources, leverage funds, and align practices. This regional approach has resulted in strengthening
the current resources available for professional development and independent assessment.
The counties in this consortium continue to develop and share a common data system called the
WELS Bay Area Regional RTT Database, which is designed to gather scoring information, track
supports and incentives, ensure participation by targeted programs serving children with high
needs, and review progress in relation to the Consortium’s local quality improvement targets.
Indicator: Local QELI resources are leveraged through participation in regional partnerships

FIRST 5 SANTA CRUZ COUNTY 2014-2015 ANNUAL EVALUATION REPORT STRATEGIC FRAMEWORK RESULTS CHILDREN LEARNING AND READY FOR SCHOOL
FIRST 5 SANTA CRUZ COUNTY 51
The Starlight Children’s Center (SCC) provided early childhood and family development services to
families of children 0-3 years old, and offered a wide variety of comprehensive bilingual services for
expectant parents and families with infants and toddlers. It was located in the Starlight Elementary
School catchment area of Watsonville, an area with one of the highest populations of children under
the age of five living in poverty in the County. A key goal was to create a “learning community” that
promoted early literacy and social/emotional skills to help lay a solid foundation for school readiness.
The program provided center-based services for 10 children, through collaborative funding with the
Early Head Start Program, and operated four days per week for six hours per day. In addition, the
program provided 20 families with home-based services which included weekly home visits and two
socializations per month. Both center- and home-based services followed the criteria for the
federally funded Early Head Start program, and SCC families received priority enrollment into Head
Start pre-school classes once the child turned three years old.
Population Served
2014-2015
Parents/Guardians (Total) 48
(Pregnant clients) 2(Parents/Guardians) 46
Children (Total) 32
(Center-based) 9(Home-visited) 23
Source: First 5 CCD database for July 1, 2014 – June 30, 2015; Starlight Children’s Center, Annual Progress Report, 2015.
At the Starlight Children’s Center, center staff and home visitors worked with parents of infants and
toddlers to build the foundations for literacy. To guide their efforts with children and their families, they
assessed children’s health and development using the Ages and Stages Questionnaire (ASQ) and ASQ:
Social/Emotional (ASQ:SE) screening tools, the DRDP – Infant/Toddler (2010) for children who received
center-based services, and the New Portage Guide for children who received home-based services.
Key Results
Assessment results from the DRDP-I/T showed that toddlers in the Starlight Children’s Center
were supported to develop social and interpersonal skills, and to develop a strong foundation
for later literacy. Children demonstrated similar amounts of improvement in all five areas of
the DRDP-I/T (“Motor and Perceptual Development,” “Health,” “Self and Social
Development,” “Language and Literacy,” and “Cognitive Development”).
For children who completed the New Portage Guide assessment, those ages 9-18 months
showed the greatest growth in “Exploration/approaches to learning.” For children between
the ages of 18-36 months the greatest growth was in “Social/emotional development” and
“Sensory organization.”
Indicator: Model infant/toddler quality site served as a “learning community” that promoted early literacy and social/emotional skills critical for school success
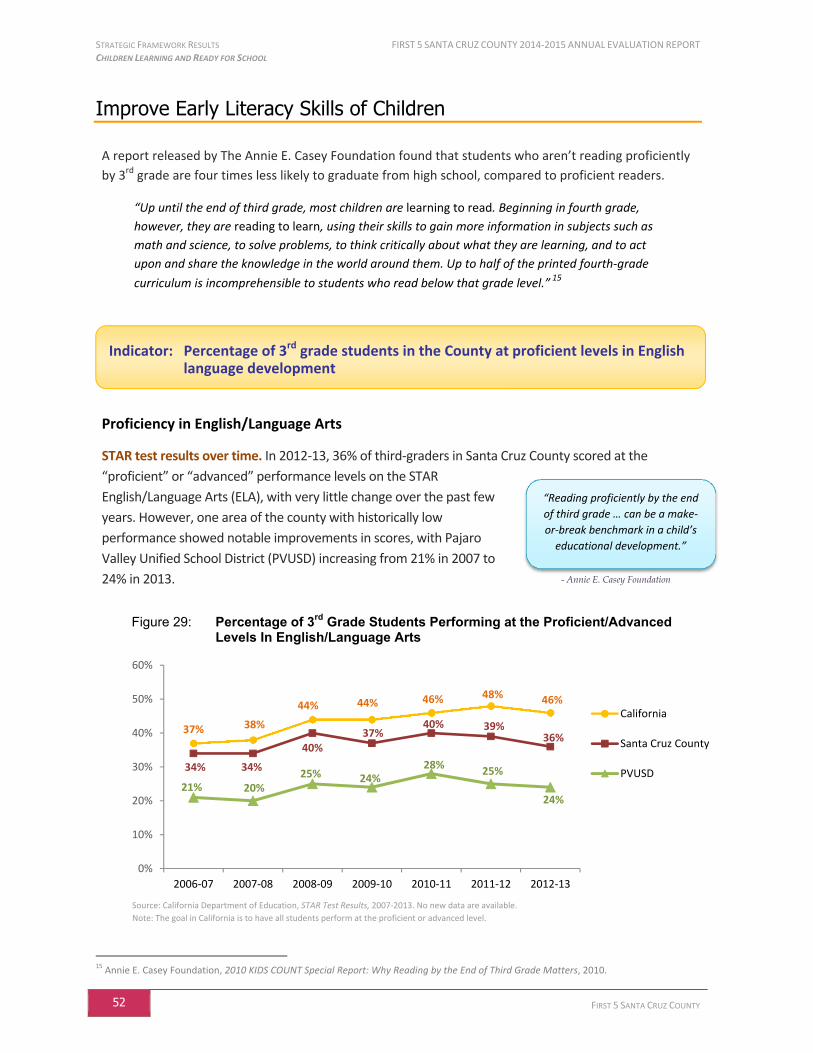
STRATEGIC FRAMEWORK RESULTS FIRST 5 SANTA CRUZ COUNTY 2014-2015 ANNUAL EVALUATION REPORT CHILDREN LEARNING AND READY FOR SCHOOL
52 FIRST 5 SANTA CRUZ COUNTY
Improve Early Literacy Skills of Children
A report released by The Annie E. Casey Foundation found that students who aren’t reading proficiently
by 3rd grade are four times less likely to graduate from high school, compared to proficient readers.
“Up until the end of third grade, most children are learning to read. Beginning in fourth grade,
however, they are reading to learn, using their skills to gain more information in subjects such as
math and science, to solve problems, to think critically about what they are learning, and to act
upon and share the knowledge in the world around them. Up to half of the printed fourth-grade
curriculum is incomprehensible to students who read below that grade level.” 15
Proficiency in English/Language Arts
STAR test results over time. In 2012-13, 36% of third-graders in Santa Cruz County scored at the
“proficient” or “advanced” performance levels on the STAR
English/Language Arts (ELA), with very little change over the past few
years. However, one area of the county with historically low
performance showed notable improvements in scores, with Pajaro
Valley Unified School District (PVUSD) increasing from 21% in 2007 to
24% in 2013.
Figure 29: Percentage of 3rd Grade Students Performing at the Proficient/Advanced Levels In English/Language Arts
Source: California Department of Education, STAR Test Results, 2007-2013. No new data are available.
Note: The goal in California is to have all students perform at the proficient or advanced level.
15
Annie E. Casey Foundation, 2010 KIDS COUNT Special Report: Why Reading by the End of Third Grade Matters, 2010.
37% 38%
44% 44% 46% 48% 46%
34% 34%
40%37%
40% 39%36%
21% 20%25% 24%
28%25%
24%
0%
10%
20%
30%
40%
50%
60%
2006-07 2007-08 2008-09 2009-10 2010-11 2011-12 2012-13
California
Santa Cruz County
PVUSD
Indicator: Percentage of 3rd grade students in the County at proficient levels in English language development
“Reading proficiently by the end
of third grade … can be a make-
or-break benchmark in a child’s
educational development.”
- Annie E. Casey Foundation
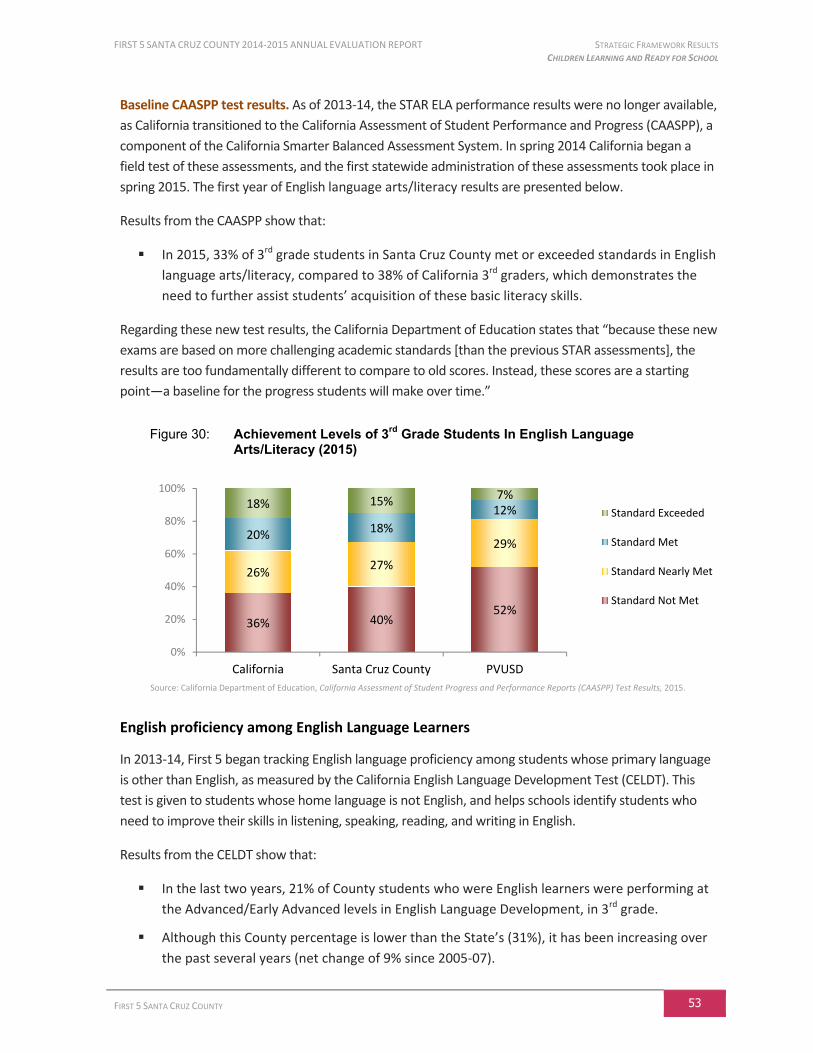
FIRST 5 SANTA CRUZ COUNTY 2014-2015 ANNUAL EVALUATION REPORT STRATEGIC FRAMEWORK RESULTS CHILDREN LEARNING AND READY FOR SCHOOL
FIRST 5 SANTA CRUZ COUNTY 53
Baseline CAASPP test results. As of 2013-14, the STAR ELA performance results were no longer available,
as California transitioned to the California Assessment of Student Performance and Progress (CAASPP), a
component of the California Smarter Balanced Assessment System. In spring 2014 California began a
field test of these assessments, and the first statewide administration of these assessments took place in
spring 2015. The first year of English language arts/literacy results are presented below.
Results from the CAASPP show that:
In 2015, 33% of 3rd grade students in Santa Cruz County met or exceeded standards in English
language arts/literacy, compared to 38% of California 3rd graders, which demonstrates the
need to further assist students’ acquisition of these basic literacy skills.
Regarding these new test results, the California Department of Education states that “because these new
exams are based on more challenging academic standards [than the previous STAR assessments], the
results are too fundamentally different to compare to old scores. Instead, these scores are a starting
point—a baseline for the progress students will make over time.”
Figure 30: Achievement Levels of 3rd Grade Students In English Language Arts/Literacy (2015)
Source: California Department of Education, California Assessment of Student Progress and Performance Reports (CAASPP) Test Results, 2015.
English proficiency among English Language Learners
In 2013-14, First 5 began tracking English language proficiency among students whose primary language
is other than English, as measured by the California English Language Development Test (CELDT). This
test is given to students whose home language is not English, and helps schools identify students who
need to improve their skills in listening, speaking, reading, and writing in English.
Results from the CELDT show that:
In the last two years, 21% of County students who were English learners were performing at
the Advanced/Early Advanced levels in English Language Development, in 3rd grade.
Although this County percentage is lower than the State’s (31%), it has been increasing over
the past several years (net change of 9% since 2005-07).
36% 40%52%
26%27%
29%20% 18%
12%18% 15% 7%
0%
20%
40%
60%
80%
100%
California Santa Cruz County PVUSD
Standard Exceeded
Standard Met
Standard Nearly Met
Standard Not Met
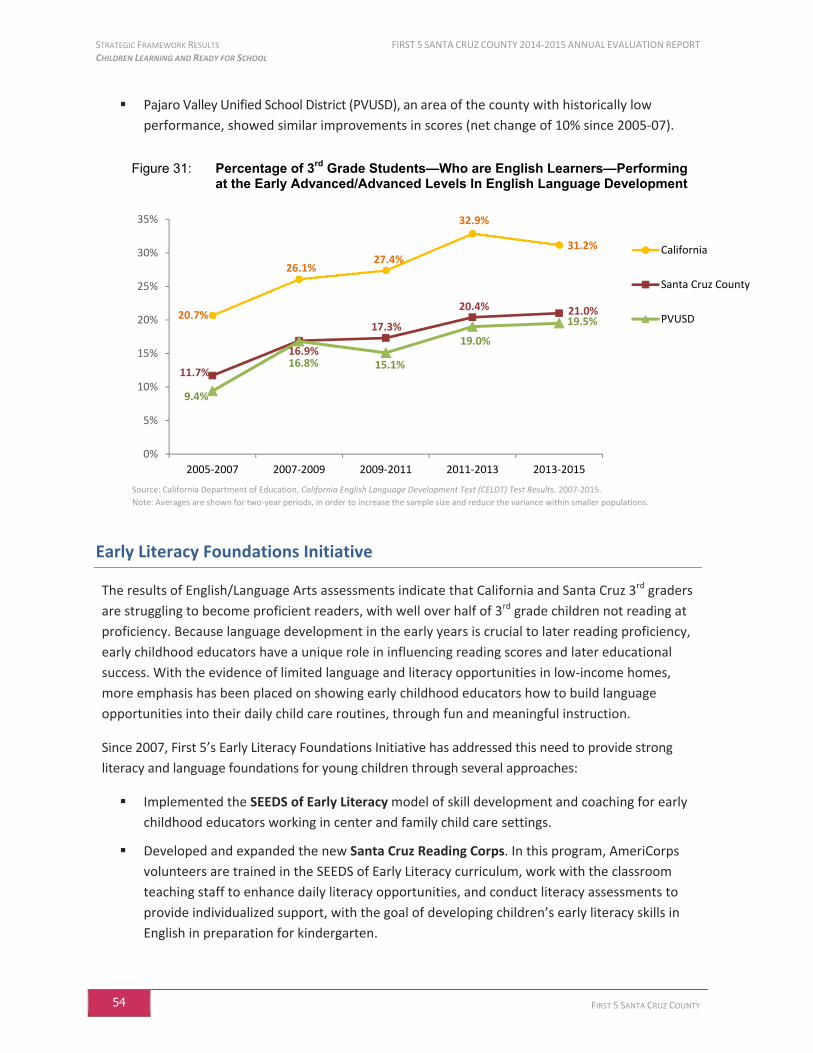
STRATEGIC FRAMEWORK RESULTS FIRST 5 SANTA CRUZ COUNTY 2014-2015 ANNUAL EVALUATION REPORT CHILDREN LEARNING AND READY FOR SCHOOL
54 FIRST 5 SANTA CRUZ COUNTY
Pajaro Valley Unified School District (PVUSD), an area of the county with historically low
performance, showed similar improvements in scores (net change of 10% since 2005-07).
Figure 31: Percentage of 3rd Grade Students—Who are English Learners—Performing at the Early Advanced/Advanced Levels In English Language Development
Source: California Department of Education, California English Language Development Test (CELDT) Test Results, 2007-2015.
Note: Averages are shown for two-year periods, in order to increase the sample size and reduce the variance within smaller populations.
Early Literacy Foundations Initiative
The results of English/Language Arts assessments indicate that California and Santa Cruz 3rd graders
are struggling to become proficient readers, with well over half of 3rd grade children not reading at
proficiency. Because language development in the early years is crucial to later reading proficiency,
early childhood educators have a unique role in influencing reading scores and later educational
success. With the evidence of limited language and literacy opportunities in low-income homes,
more emphasis has been placed on showing early childhood educators how to build language
opportunities into their daily child care routines, through fun and meaningful instruction.
Since 2007, First 5’s Early Literacy Foundations Initiative has addressed this need to provide strong
literacy and language foundations for young children through several approaches:
Implemented the SEEDS of Early Literacy model of skill development and coaching for early
childhood educators working in center and family child care settings.
Developed and expanded the new Santa Cruz Reading Corps. In this program, AmeriCorps
volunteers are trained in the SEEDS of Early Literacy curriculum, work with the classroom
teaching staff to enhance daily literacy opportunities, and conduct literacy assessments to
provide individualized support, with the goal of developing children’s early literacy skills in
English in preparation for kindergarten.
20.7%
26.1%27.4%
32.9%
31.2%
11.7%
16.9%
17.3%
20.4% 21.0%
9.4%
16.8% 15.1%
19.0%
19.5%
0%
5%
10%
15%
20%
25%
30%
35%
2005-2007 2007-2009 2009-2011 2011-2013 2013-2015
California
Santa Cruz County
PVUSD

FIRST 5 SANTA CRUZ COUNTY 2014-2015 ANNUAL EVALUATION REPORT STRATEGIC FRAMEWORK RESULTS CHILDREN LEARNING AND READY FOR SCHOOL
FIRST 5 SANTA CRUZ COUNTY 55
Encouraged family engagement in literacy activities through continuation of the Raising A
Reader program.
Provided other literacy supports for teachers and families.
The following indicators present an overview of the Early Literacy Foundation Initiative’s efforts and
outcomes this year (additional detail is included in the ELF Initiative’s Partner Profile later in this report).
SEEDS of Early Literacy
The professional development initiative mentioned above follows the SEEDS of Early Literacy curriculum
that has been researched by the University of Minnesota. Research on the SEEDS model shows that
teachers trained and coached on the SEEDS of Early Literacy Curriculum score significantly higher on
the Early Language and Literacy Classroom Observation (ELLCO) tool and show greater change over
time in teaching strategies than teachers without such training. Results also indicate that preschool
children who were taught by teachers trained in SEEDS entered kindergarten ready to read at higher
rates than children in non-SEEDS groups (Lizakowski, 2005).
The SEEDS Professional Development model consists of training—and providing coaching to—early
childhood educators on how to effectively integrate research-based language and literacy strategies
and materials into their classrooms. Early childhood educators are taught to use the strategies of
both embedded instruction (planned strategies that occur within the typical routines of the class
day) and explicit instruction (teacher-directed activities that emphasize the teaching of a specific
task), and to create a classroom environment that is designed to target early literacy predictors.
These predictors of later reading success include:
Conversation and Oral Language: The ability to produce or comprehend spoken language
Alphabet Knowledge: The ability to visually discriminate the differences between letters
and say the names and sounds associated with printed letters
Book and Print Rules: Refers to what children understand about how books and print work,
such as left-right, front-back, letters, words and that print has meaning
Phonological awareness: The ability to detect, manipulate, or analyze the auditory aspects
of spoken language, including the ability to distinguish or segment words, syllables, rhymes,
and beginning sounds
Vocabulary and Background Knowledge: A collection of words that relate to experiences
and knowledge that a child has of the world around him/her

STRATEGIC FRAMEWORK RESULTS FIRST 5 SANTA CRUZ COUNTY 2014-2015 ANNUAL EVALUATION REPORT CHILDREN LEARNING AND READY FOR SCHOOL
56 FIRST 5 SANTA CRUZ COUNTY
The following diagram displays the five essential SEEDS quality interactions and the five predictors
of literacy.
Santa Cruz County’s SEEDS of Early Literacy program has proven to be very effective at
strengthening classroom environments and practices, as well as influencing changes in children’s
skills on research-based predictors of early reading. In 2014-15 First 5 Santa Cruz County offered
SEEDS programs to two different populations of early childhood educators:
SEEDS for Center-based Pre-K and TK Teachers
This program provides professional development for early childhood educators working in Pre-K and
Transitional Kindergarten (TK) centers. In an effort to support teachers as they work to include the
SEEDS concepts into daily practice, this nine-month course is designed to focus on the SEEDS strategies
through embedded and explicit instruction, modeling, practice, and one-on-one coaching throughout
the academic year.
Each participant in SEEDS for Center-based Pre-K/TK receives:
16 three-hour instructional sessions Pre and Post literacy environment assessment
12 two-hour on-site coaching visits 4 literacy labs and 6 children’s books to use in their centers 2 optional literacy labs
SEEDS for Family Child Care Providers
This program provides professional development for family child care providers working with
Spanish speaking children through SEEDS of Early Literacy training and coaching. The training uses
the SEEDS Parent curriculum, with a focus on working with children from birth to kindergarten. This
program offers five Make and Take workshops in the fall, and again in the summer for migrant
providers (beginning in June).
Each workshop includes:
1½ hours of instruction 5 one-on-one coaching sessions in the home
2½ hours to create literacy-based materials to use in the family child care home
Pre and post literacy environment assessments 5 children’s books to use in their program
1 model SEEDS classroom/FCC home tour
FIRST 5 SANTA CRUZ COUNTY 2014-2015 ANNUAL EVALUATION REPORT STRATEGIC FRAMEWORK RESULTS CHILDREN LEARNING AND READY FOR SCHOOL
FIRST 5 SANTA CRUZ COUNTY 57
Santa Cruz Reading Corps
AmeriCorps is a national service organization with about 100,000 members serving across the
United States to help meet critical needs in the areas of education, health, the environment,
disaster services, veterans, and economic opportunity. In the summer of 2012, First 5 Santa Cruz
County partnered with AmeriCorps to create the Santa Cruz Reading Corps (SCRC), with the goal of
training and placing AmeriCorps volunteers in state preschool and transitional
kindergarten classrooms in both the Live Oak and Pajaro Valley Unified School
Districts. The SCRC is modeled after the Minnesota Reading Corps, the largest
single state AmeriCorps initiative in the country.
The focus of the SCRC is to promote strong literacy and language foundations
for young children, especially dual language learners. Local and statewide data
indicate that well over half of 3rd grade children in California—and Santa Cruz County—are not
reading at proficiency. Research shows that when students get off to a poor start in reading, they
rarely catch up with other students. Happily, research also shows that almost all children have the
capacity to learn to read proficiently if effective interventions are provided. Due to the fact that
language development in the early years is crucial to later reading proficiency, the SCRC members
are using the evidence-based SEEDS of Early Literacy curriculum to help boost the early literacy skills
of children in English as they prepare to enter kindergarten.
During the academic school year (running from September to May) SCRC members—called Literacy
Tutors—collaborate with the classroom teaching staff to enhance daily literacy opportunities, and
provide support to classrooms’ routines by implementing specific research-based strategies from
the SEEDS of Early Literacy curriculum. Each tutor receives extensive training, individualized
coaching, and support to track and guide children in English language development through one-on-
one and small group interventions. SCRC tutors also facilitate Raising A Reader, the weekly rotating
book bag program that provides books and support for families to read aloud with their children.
In addition to their daily work with students, tutors assess each child in their classroom three times;
once in October, once in early February, and once in May, in five areas of early reading predictors
(rhyming, alliteration, letter names, letter sounds, and vocabulary development). These assessments
help them select children who receive tailored literacy-based interventions on a daily basis. Each of
these children’s progress is monitored monthly to see if the interventions are effective. The goal of
the SCRC is to increase the number of children on target with early reading predictors. Through all
these efforts, children are provided the assistance they need to enter kindergarten more school-
ready and to become fluent readers by 3rd grade.

STRATEGIC FRAMEWORK RESULTS FIRST 5 SANTA CRUZ COUNTY 2014-2015 ANNUAL EVALUATION REPORT CHILDREN LEARNING AND READY FOR SCHOOL
58 FIRST 5 SANTA CRUZ COUNTY
The following figure presents the number of early childhood educators who participated in any of the
SEEDS trainings provided in 2014-15, and cumulatively since 2007.
Figure 32: Number of Early Childhood Educators Who Have Completed SEEDS Trainings
THIS
FUNDING
CYCLE
2014-2015
CUMULATIVE
TOTALS
2007-2015
EARLY CHILDHOOD EDUCATORS
Number of SEEDS Quality Coaches providing literacy coaching, literacy environmental assessments, and professional development advising for SEEDS instruction, fidelity, and integrity during the year
15 53
Number of early childhood educators attending SEEDS of Early Literacy courses 40 455
Number of early childhood educators attending the SEEDS Plus program* 0 41
Number of Family, Friend or Neighbor (FFN) informal child care providers attending SEEDS of Early Literacy workshops
0 155**
Number of Reading Corps tutors who received SEEDS training 14 29
TOTAL (unduplicated) 69 639**
CHILDREN
Number of children in classrooms with a Reading Corps tutor 601 1,472
Source: First 5 CCD database for July 1, 2014 – June 30, 2015; Early Literacy Foundations (ELF) Initiative, 2007-15.
* The SEEDS Plus program was offered from 2011-2013, and was designed for “graduates” of the early SEEDS of Early Literacy classes. This course was designed to promote and embed the ongoing use of SEEDS strategies, identify children who would receive tailored literacy-based interventions (using Response to Interventions (RtI) strategies), and increase the number of children on target with early reading predictors. Currently, SEEDS skills are incorporated into all SEEDS of Early Literacy trainings for SEEDS coaches and early childhood educators, without the use of RtI.
** In 2011-12, no formal SEEDS workshops were provided to FFN informal child care providers. However, approximately 45 FFN informal child care providers participated in a weekly “read aloud” group that modeled early literacy strategies. No personal information was collected for these 45 FFN informal child care providers. Therefore, these cumulative totals likely include duplicated clients.
Indicator: Number of early childhood educators who complete SEEDS training, and number of educators who are SEEDS coaches
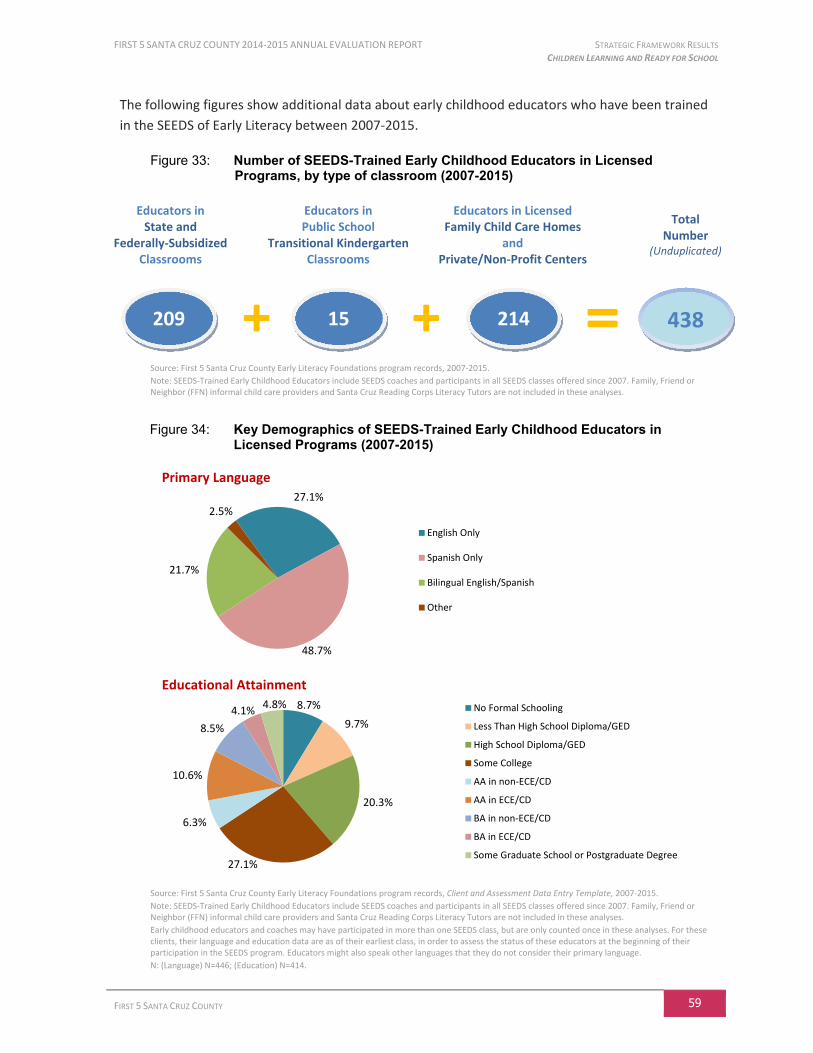
FIRST 5 SANTA CRUZ COUNTY 2014-2015 ANNUAL EVALUATION REPORT STRATEGIC FRAMEWORK RESULTS CHILDREN LEARNING AND READY FOR SCHOOL
FIRST 5 SANTA CRUZ COUNTY 59
The following figures show additional data about early childhood educators who have been trained
in the SEEDS of Early Literacy between 2007-2015.
Figure 33: Number of SEEDS-Trained Early Childhood Educators in Licensed Programs, by type of classroom (2007-2015)
Source: First 5 Santa Cruz County Early Literacy Foundations program records, 2007-2015.
Note: SEEDS-Trained Early Childhood Educators include SEEDS coaches and participants in all SEEDS classes offered since 2007. Family, Friend or Neighbor (FFN) informal child care providers and Santa Cruz Reading Corps Literacy Tutors are not included in these analyses.
Figure 34: Key Demographics of SEEDS-Trained Early Childhood Educators in Licensed Programs (2007-2015)
Primary Language
Educational Attainment
Source: First 5 Santa Cruz County Early Literacy Foundations program records, Client and Assessment Data Entry Template, 2007-2015.
Note: SEEDS-Trained Early Childhood Educators include SEEDS coaches and participants in all SEEDS classes offered since 2007. Family, Friend or Neighbor (FFN) informal child care providers and Santa Cruz Reading Corps Literacy Tutors are not included in these analyses.
Early childhood educators and coaches may have participated in more than one SEEDS class, but are only counted once in these analyses. For these clients, their language and education data are as of their earliest class, in order to assess the status of these educators at the beginning of their participation in the SEEDS program. Educators might also speak other languages that they do not consider their primary language.
N: (Language) N=446; (Education) N=414.
27.1%
48.7%
21.7%
2.5%
English Only
Spanish Only
Bilingual English/Spanish
Other
8.7%
9.7%
20.3%
27.1%
6.3%
10.6%
8.5%
4.1%4.8% No Formal Schooling
Less Than High School Diploma/GED
High School Diploma/GED
Some College
AA in non-ECE/CD
AA in ECE/CD
BA in non-ECE/CD
BA in ECE/CD
Some Graduate School or Postgraduate Degree
Educators in State and
Federally-Subsidized Classrooms
Educators in Licensed Family Child Care Homes
and Private/Non-Profit Centers
Total Number
(Unduplicated)
209 214 15
Educators in Public School
Transitional Kindergarten Classrooms
438
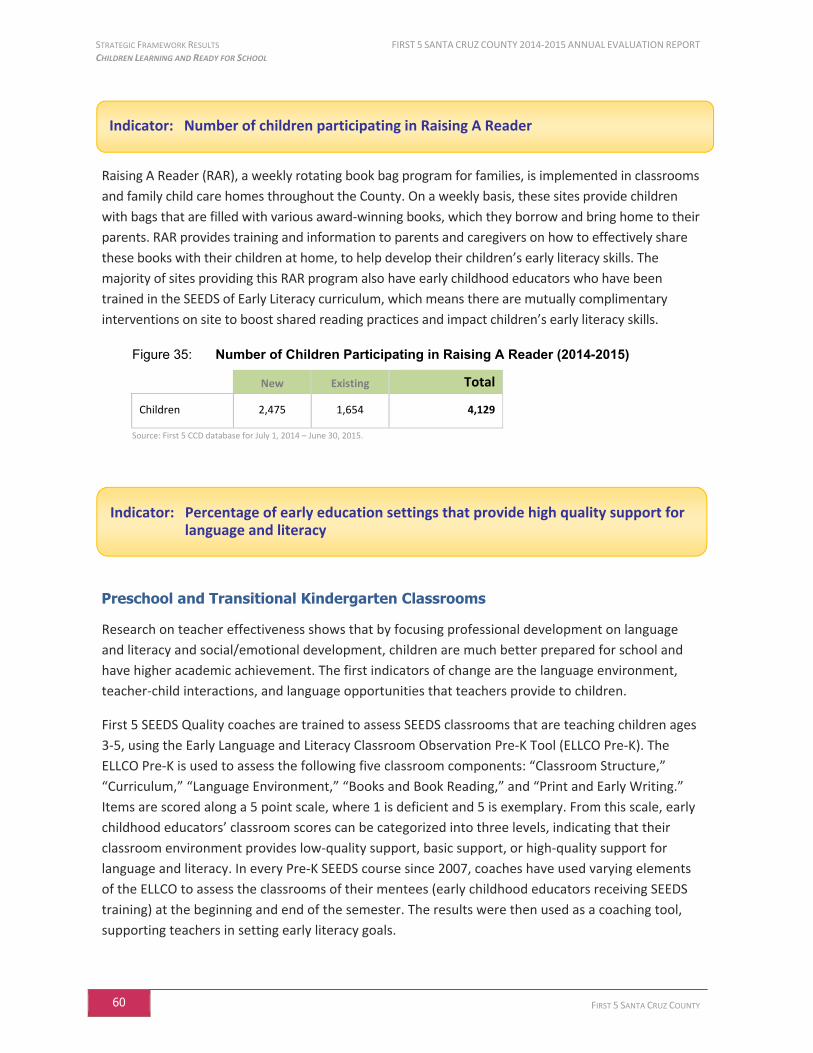
STRATEGIC FRAMEWORK RESULTS FIRST 5 SANTA CRUZ COUNTY 2014-2015 ANNUAL EVALUATION REPORT CHILDREN LEARNING AND READY FOR SCHOOL
60 FIRST 5 SANTA CRUZ COUNTY
Raising A Reader (RAR), a weekly rotating book bag program for families, is implemented in classrooms
and family child care homes throughout the County. On a weekly basis, these sites provide children
with bags that are filled with various award-winning books, which they borrow and bring home to their
parents. RAR provides training and information to parents and caregivers on how to effectively share
these books with their children at home, to help develop their children’s early literacy skills. The
majority of sites providing this RAR program also have early childhood educators who have been
trained in the SEEDS of Early Literacy curriculum, which means there are mutually complimentary
interventions on site to boost shared reading practices and impact children’s early literacy skills.
Figure 35: Number of Children Participating in Raising A Reader (2014-2015)
New Existing Total
Children 2,475 1,654 4,129
Source: First 5 CCD database for July 1, 2014 – June 30, 2015.
Preschool and Transitional Kindergarten Classrooms
Research on teacher effectiveness shows that by focusing professional development on language
and literacy and social/emotional development, children are much better prepared for school and
have higher academic achievement. The first indicators of change are the language environment,
teacher-child interactions, and language opportunities that teachers provide to children.
First 5 SEEDS Quality coaches are trained to assess SEEDS classrooms that are teaching children ages
3-5, using the Early Language and Literacy Classroom Observation Pre-K Tool (ELLCO Pre-K). The
ELLCO Pre-K is used to assess the following five classroom components: “Classroom Structure,”
“Curriculum,” “Language Environment,” “Books and Book Reading,” and “Print and Early Writing.”
Items are scored along a 5 point scale, where 1 is deficient and 5 is exemplary. From this scale, early
childhood educators’ classroom scores can be categorized into three levels, indicating that their
classroom environment provides low-quality support, basic support, or high-quality support for
language and literacy. In every Pre-K SEEDS course since 2007, coaches have used varying elements
of the ELLCO to assess the classrooms of their mentees (early childhood educators receiving SEEDS
training) at the beginning and end of the semester. The results were then used as a coaching tool,
supporting teachers in setting early literacy goals.
Indicator: Number of children participating in Raising A Reader
Indicator: Percentage of early education settings that provide high quality support for language and literacy

FIRST 5 SANTA CRUZ COUNTY 2014-2015 ANNUAL EVALUATION REPORT STRATEGIC FRAMEWORK RESULTS CHILDREN LEARNING AND READY FOR SCHOOL
FIRST 5 SANTA CRUZ COUNTY 61
Across all components, classrooms showed improvements from the beginning of the semester to
the end.
Overall, in 2014-15 the percentage of classrooms that were rated as having High-Quality
Support increased from 20% to 93%.
The classroom component where the most change occurred was in “Language Environment,”
where the percentage of classrooms rated as having High-Quality Support increased from 0%
at the beginning of the semester to 93% by the end of the semester.
Family Child Care Settings
Early childhood educators from licensed family child care settings also participated in SEEDS training
and received SEEDS coaching. Their sites were observed at the beginning of their SEEDS training and
again at the end using the Child/Home Early Language and Literacy Observation (CHELLO), a tool
designed to rate the early literacy environment in home-based child care settings of children ages
birth to 5 years.
Two sections of the CHELLO tool were used to assess home-based classrooms: the Group/Family
Observation section and the Literacy Environment Checklist. For the Group/Family Observation
section, items were scored along a 5 point scale, where 1 is deficient and 5 is exemplary. Like the
ELLCO analyses, early childhood educators’ classroom scores were categorized into three levels,
indicating their classroom environment provided low-quality support, basic support, or high-quality
support for language and literacy. Scores on the Literacy Environment Checklist ranged from 1 to
26, and were similarly categorized into three levels of support (Poor, Fair, Excellent).
For this analysis, several years of data have been aggregated16 in order to present a more robust
portrait of the extent to which SEEDS-trained early childhood educators in family child care settings
were providing high quality support for language and literacy in their preschool classrooms.
Across all components, family child care home environments showed substantial improvements
from the beginning of the training to the end.
Results from the Group/Family Observation section showed that overall, the percentage of
family child care settings that were rated as having High-Quality Support increased from 44%
to 89%.
Among the individual Group/Family Observation components, by the end of the trainings the
majority of family child care settings were rated as having High-Quality Support in all areas:
“Physical Environment for Learning” (93%), “Support for Learning” (87%), and “Adult
Teaching Strategies” (75%).
Scores on the Literacy Environment Checklist showed that the percentage of family child care
settings that were rated as having Excellent Support increased from 40% to 56%.
16
Between 2008-2011, early childhood educators in family child care settings did not use the CHELLO, and consequently no CHELLO data were collected during those years. Therefore, this analysis represents the results for the years that the CHELLO has been utilized (2007-2008, and 2011-present).

STRATEGIC FRAMEWORK RESULTS FIRST 5 SANTA CRUZ COUNTY 2014-2015 ANNUAL EVALUATION REPORT CHILDREN LEARNING AND READY FOR SCHOOL
62 FIRST 5 SANTA CRUZ COUNTY
State Pre-K and Transitional Kindergarten (TK) Classrooms
The Santa Cruz Reading Corps (SCRC) places one AmeriCorps volunteer (called a Literacy Tutor) in
each State Preschool and TK classroom at Live Oak School District, and in each State Preschool
classroom and one TK classroom at Pajaro Valley Unified School District. The Literacy Tutors are
trained in research-based strategies following the SEEDS of Early Literacy curriculum, collaborate
with the classroom teaching staff to enhance daily literacy opportunities, and conduct literacy
assessments to provide individualized support to help children in Santa Cruz County become
successful readers by 3rd grade. In 2014-15, 14 Literacy Tutors were trained and placed in 24
different classrooms17, serving 601 children.
Santa Cruz Reading Corps’ Literacy Tutors are trained in the use of Response to Interventions (RtI)
strategies as a way to provide children with tailored literacy support. 18 Literacy Tutors assess
children’s pre-literacy skills in five areas: Picture Naming, Rhyming, and Alliteration (as measured by
the Individual Growth and Development Indicators (IGDIs)), and Letter Naming and Letter Sounds (as
measured by the Formative Assessment System for Teachers (FAST)). These assessments help the
Tutors recognize children who need tailored literacy support and respond in ways that help the
children experience early school success.
There are three important factors to note regarding these analyses of children’s pre-literacy skills:
Focus on English skills. Beginning in 2012-13, there was an emphasis in all “SEEDS”
classrooms on developing and improving children’s vocabulary skills in English. As the
majority of preschool students were dual language learners, many children were initially
assessed in both English and Spanish. Once these children demonstrated proficiency in their
scores on the English-language assessments, however, they did not continue taking the
Spanish-language assessments. Therefore, the analyses in this report illustrate the amount of
improvement that children made in their English pre-literacy skills.
Focus on children about to enter kindergarten. Only children ages 4 and 5 were included in
these IGDIs analyses, in order to focus on children who were at a similar developmental age
just before entering kindergarten. Additionally, the companion assessment given along with
17
Many classrooms offer services to more than one cohort of children a day. In 2014-15, across 16 sites, there were 24 different cohorts of children.
18 Children who received tailored literacy-based intervention strategies received more frequent monitoring. In addition to the three
benchmark IGDIs assessments, these children took two additional assessments between the 1st and 2
nd benchmark assessments (called
Progress Monitoring 1 and 2), and then two more assessments between the 2nd
and 3rd
benchmark assessments (called Progress Monitoring 3 and 4). If a child demonstrated sufficient improvement by the 2
nd benchmark assessment, the intervention was ended with
that child and was begun with another child who was not on target with early reading predictors at that time. This new child then received two additional assessments between the 2
nd and 3
rd benchmark assessments (Progress Monitoring 3 and 4). Consequently,
every child who received an intervention was monitored at least two additional times with the Progress Monitoring assessments.
Indicator: Percentage of children who demonstrate research-based predictors of later reading success
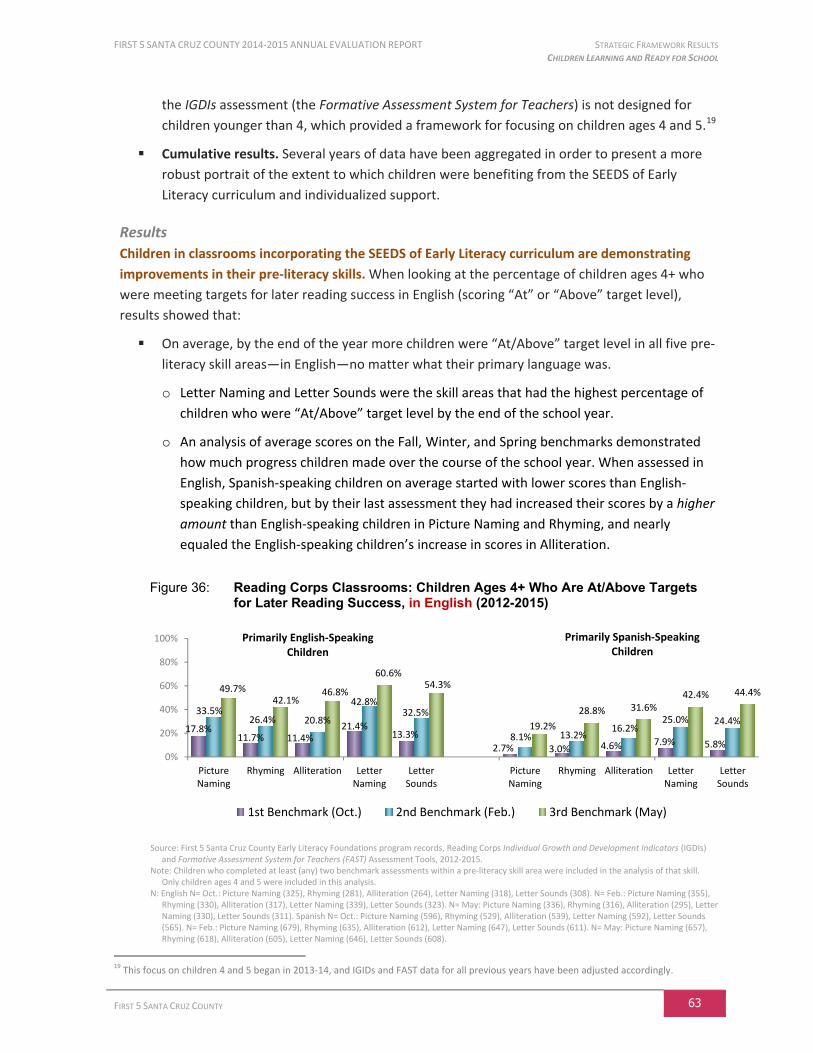
FIRST 5 SANTA CRUZ COUNTY 2014-2015 ANNUAL EVALUATION REPORT STRATEGIC FRAMEWORK RESULTS CHILDREN LEARNING AND READY FOR SCHOOL
FIRST 5 SANTA CRUZ COUNTY 63
the IGDIs assessment (the Formative Assessment System for Teachers) is not designed for
children younger than 4, which provided a framework for focusing on children ages 4 and 5.19
Cumulative results. Several years of data have been aggregated in order to present a more
robust portrait of the extent to which children were benefiting from the SEEDS of Early
Literacy curriculum and individualized support.
Results
Children in classrooms incorporating the SEEDS of Early Literacy curriculum are demonstrating
improvements in their pre-literacy skills. When looking at the percentage of children ages 4+ who
were meeting targets for later reading success in English (scoring “At” or “Above” target level),
results showed that:
On average, by the end of the year more children were “At/Above” target level in all five pre-
literacy skill areas—in English—no matter what their primary language was.
o Letter Naming and Letter Sounds were the skill areas that had the highest percentage of
children who were “At/Above” target level by the end of the school year.
o An analysis of average scores on the Fall, Winter, and Spring benchmarks demonstrated
how much progress children made over the course of the school year. When assessed in
English, Spanish-speaking children on average started with lower scores than English-
speaking children, but by their last assessment they had increased their scores by a higher
amount than English-speaking children in Picture Naming and Rhyming, and nearly
equaled the English-speaking children’s increase in scores in Alliteration.
Figure 36: Reading Corps Classrooms: Children Ages 4+ Who Are At/Above Targets for Later Reading Success, in English (2012-2015)
Source: First 5 Santa Cruz County Early Literacy Foundations program records, Reading Corps Individual Growth and Development Indicators (IGDIs)
and Formative Assessment System for Teachers (FAST) Assessment Tools, 2012-2015. Note: Children who completed at least (any) two benchmark assessments within a pre-literacy skill area were included in the analysis of that skill.
Only children ages 4 and 5 were included in this analysis. N: English N= Oct.: Picture Naming (325), Rhyming (281), Alliteration (264), Letter Naming (318), Letter Sounds (308). N= Feb.: Picture Naming (355),
Rhyming (330), Alliteration (317), Letter Naming (339), Letter Sounds (323). N= May: Picture Naming (336), Rhyming (316), Alliteration (295), Letter Naming (330), Letter Sounds (311). Spanish N= Oct.: Picture Naming (596), Rhyming (529), Alliteration (539), Letter Naming (592), Letter Sounds (565). N= Feb.: Picture Naming (679), Rhyming (635), Alliteration (612), Letter Naming (647), Letter Sounds (611). N= May: Picture Naming (657), Rhyming (618), Alliteration (605), Letter Naming (646), Letter Sounds (608).
19
This focus on children 4 and 5 began in 2013-14, and IGIDs and FAST data for all previous years have been adjusted accordingly.
17.8%11.7% 11.4%
21.4%13.3%
2.7% 3.0% 4.6% 7.9% 5.8%
33.5%26.4% 20.8%
42.8%32.5%
8.1% 13.2%16.2%
25.0% 24.4%
49.7%42.1%
46.8%
60.6%54.3%
19.2%
28.8% 31.6%42.4% 44.4%
0%
20%
40%
60%
80%
100%
PictureNaming
Rhyming Alliteration LetterNaming
LetterSounds
PictureNaming
Rhyming Alliteration LetterNaming
LetterSounds
1st Benchmark (Oct.) 2nd Benchmark (Feb.) 3rd Benchmark (May)
Primarily Spanish-Speaking Children
Primarily English-Speaking Children
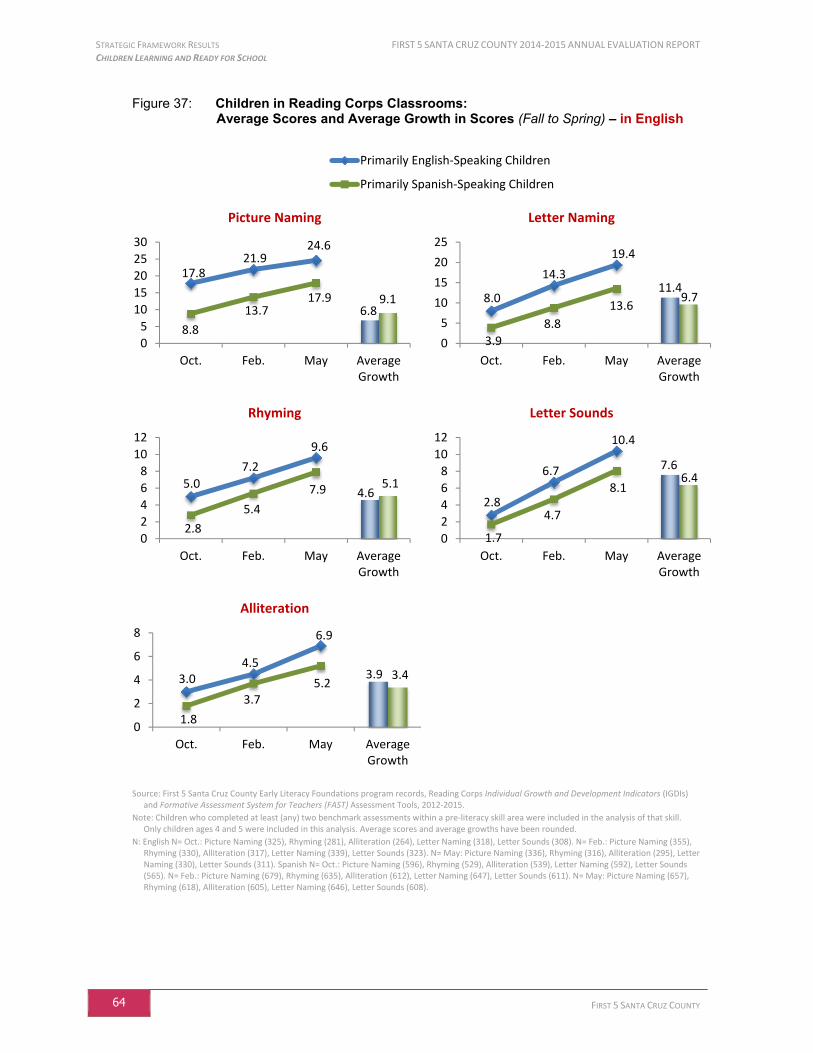
STRATEGIC FRAMEWORK RESULTS FIRST 5 SANTA CRUZ COUNTY 2014-2015 ANNUAL EVALUATION REPORT CHILDREN LEARNING AND READY FOR SCHOOL
64 FIRST 5 SANTA CRUZ COUNTY
Figure 37: Children in Reading Corps Classrooms: Average Scores and Average Growth in Scores (Fall to Spring) – in English
Picture Naming Letter Naming
Rhyming Letter Sounds
Alliteration
Source: First 5 Santa Cruz County Early Literacy Foundations program records, Reading Corps Individual Growth and Development Indicators (IGDIs) and Formative Assessment System for Teachers (FAST) Assessment Tools, 2012-2015.
Note: Children who completed at least (any) two benchmark assessments within a pre-literacy skill area were included in the analysis of that skill. Only children ages 4 and 5 were included in this analysis. Average scores and average growths have been rounded.
N: English N= Oct.: Picture Naming (325), Rhyming (281), Alliteration (264), Letter Naming (318), Letter Sounds (308). N= Feb.: Picture Naming (355), Rhyming (330), Alliteration (317), Letter Naming (339), Letter Sounds (323). N= May: Picture Naming (336), Rhyming (316), Alliteration (295), Letter Naming (330), Letter Sounds (311). Spanish N= Oct.: Picture Naming (596), Rhyming (529), Alliteration (539), Letter Naming (592), Letter Sounds (565). N= Feb.: Picture Naming (679), Rhyming (635), Alliteration (612), Letter Naming (647), Letter Sounds (611). N= May: Picture Naming (657), Rhyming (618), Alliteration (605), Letter Naming (646), Letter Sounds (608).
0
2 Primarily English-Speaking Children
Primarily Spanish-Speaking Children
6.89.1
17.821.9
24.6
8.8
13.717.9
0
5
10
15
20
25
30
Oct. Feb. May AverageGrowth
11.49.78.0
14.3
19.4
3.9
8.8
13.6
0
5
10
15
20
25
Oct. Feb. May AverageGrowth
4.65.15.0
7.2
9.6
2.8
5.4
7.9
0
2
4
6
8
10
12
Oct. Feb. May AverageGrowth
7.66.4
2.8
6.7
10.4
1.7
4.7
8.1
0
2
4
6
8
10
12
Oct. Feb. May AverageGrowth
3.9 3.43.04.5
6.9
1.8
3.75.2
0
2
4
6
8
Oct. Feb. May AverageGrowth
FIRST 5 SANTA CRUZ COUNTY 2014-2015 ANNUAL EVALUATION REPORT STRATEGIC FRAMEWORK RESULTS CHILDREN LEARNING AND READY FOR SCHOOL
FIRST 5 SANTA CRUZ COUNTY 65
Children who received tailored interventions are nearly catching up with their peers. Although
these improvement results are greatly encouraging, it is important to note that there are still some
areas where only a small percentage of children are meeting targets for later reading success. In
particular, more work needed to be done to help Spanish-speaking children increase their English
vocabulary (Picture Naming).
To this end, the “Repeated Read Aloud” (RRA) intervention was introduced in 2014-15 as a way to
increase vocabulary and fluency in English. Literacy Tutors used the IGDIs and FAST assessments to
help them identify five children who were most challenged in picture naming (vocabulary), and
provided each of these children with this tailored intervention.
In these 2014-15 analyses of IGDIs and FAST assessments in English, the results are shown for
children who did not require interventions, and for children who received the RRA tailored
interventions. The first set of analyses show the percentage of children at each level of proficiency
at each of the three benchmarks (below target, near target, at/above target), and the second
analysis shows the average scores at each of the three benchmarks, and the average growth from
Fall to Spring.
Overall results show that children who received tailored interventions showed remarkable
progress towards reaching greater proficiency in all pre-literacy skill areas, in English.
As would be expected, almost all children who were chosen to receive tailored interventions
had scored “Below” target at the beginning of the school year on the English-language
assessments. However, by the end of the school year, a majority of these children had moved
up into higher levels of proficiency (“Near,” or “At/Above” target).
This improvement in English pre-literacy skills was particularly striking among primarily
Spanish-speaking children who had received tailored interventions.
o Not only did these Spanish-speaking children improve their skill levels, but the
percentages who were “Near,” or “At/Above” target by the end of the school year came
quite close to the percentages of their peers who had not required these tailored
interventions. This was particularly true in the areas of Alliteration, Letter Naming, and
Letter Sounds.
o An analysis of average scores on the Fall, Winter, and Spring benchmarks showed that
when assessed in English, Spanish-speaking children who were selected to receive tailored
interventions on average started with lower scores than Spanish-speaking children who
did not require tailored interventions. But by their last assessment they had increased
their scores by a higher amount in Picture Naming and Rhyming.
This last result is especially encouraging, as it suggests that these tailored interventions are
greatly helping dual-language learners who are the most challenged with their English
vocabulary skills. These children are getting the tailored help they need to increase their
vocabulary and bring them up to a level where they can more fully benefit from the SEEDS of
Early Literacy classroom curriculum with the rest of their peers.

STRATEGIC FRAMEWORK RESULTS FIRST 5 SANTA CRUZ COUNTY 2014-2015 ANNUAL EVALUATION REPORT CHILDREN LEARNING AND READY FOR SCHOOL
66 FIRST 5 SANTA CRUZ COUNTY
Figure 38: Impact of Tailored Interventions on Children’s Proficiency in Key Pre-Literacy Skills (2014-2015) – in English
Primarily Spanish-Speaking Children Not Requiring Tailored Interventions
Primarily Spanish-Speaking Children Who Received Tailored Interventions
Source: First 5 Santa Cruz County Early Literacy Foundations program records, Reading Corps Individual Growth and Development Indicators (IGDIs)
and Formative Assessment System for Teachers (FAST) Assessment Tools, 2014-2015.
Note: Children who completed at least (any) two benchmark assessments within a pre-literacy skill area were included in the analysis of that skill. Only children ages 4 and 5 were included in this analysis.
N: “Children with No Intervention”—(Picture Naming) Oct =89, Feb=104, May=99; (Rhyming) Oct =76, Feb=96, May=90; (Alliteration) Oct =73, Feb=89, May=89; (Letter Naming) Oct =86, Feb=102, May=100; (Letter Sounds) Oct =74, Feb=93, May=88; Children with Interventions—(Picture Naming) Oct =71, Feb=84, May=77; (Rhyming) Oct =57, Feb=76, May=72; (Alliteration) Oct =65, Feb=78, May=73; (Letter Naming) Oct =69, Feb=83, May=80; (Letter Sounds) Oct =70, Feb=82, May=74.
59.6%39.4%
22.2%
69.7%58.3%
36.7%
76.7%64.0%
48.3%
69.8%
51.0%32.0%
79.7%
61.3%
37.5%
33.7%51.0%
60.6%
22.4%26.0%
33.3%
17.8%27.0%
29.2%
16.3%
17.6%
18.0%
9.5%
12.9%
11.4%
6.7% 9.6% 17.2%7.9%
15.6%30.0%
5.5% 9.0%22.5%
14.0%
31.4%
50.0%
10.8%25.8%
51.1%
0%
20%
40%
60%
80%
100%
Oct Feb May Oct Feb May Oct Feb May Oct Feb May Oct Feb May
Below Target Near Target At/Above Target
94.4%72.6%
36.4%
89.5%71.1%
50.0%
80.0%71.8%
56.2%
78.3%
57.8%
33.8%
94.3%
67.1%
41.9%
5.6%26.2%
50.6%
10.5%23.7%
33.3%
12.3% 21.8%
20.5%
7.2%
20.5%
22.5%
2.9%
13.4%
13.5%
0.0% 1.2%13.0%
0.0%5.3%
16.7%
7.7% 6.4%23.3%
14.5%21.7%
43.8%
2.9%
19.5%
44.6%
0%
20%
40%
60%
80%
100%
Oct Feb May Oct Feb May Oct Feb May Oct Feb May Oct Feb May
Below Target Near Target At/Above Target
Picture Naming Rhyming Alliteration Letter Naming Letter Sounds
Picture Naming Rhyming Alliteration Letter Naming Letter Sounds
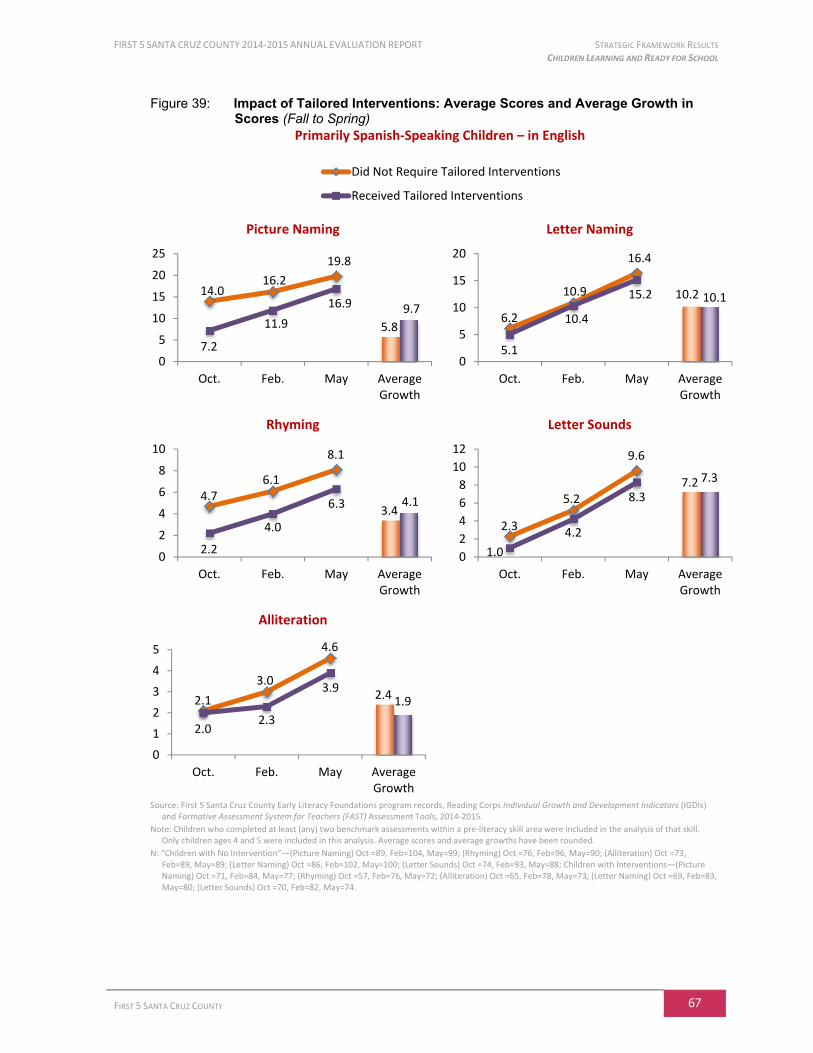
FIRST 5 SANTA CRUZ COUNTY 2014-2015 ANNUAL EVALUATION REPORT STRATEGIC FRAMEWORK RESULTS CHILDREN LEARNING AND READY FOR SCHOOL
FIRST 5 SANTA CRUZ COUNTY 67
Figure 39: Impact of Tailored Interventions: Average Scores and Average Growth in Scores (Fall to Spring)
Primarily Spanish-Speaking Children – in English
Picture Naming Letter Naming
Rhyming Letter Sounds
Alliteration
Source: First 5 Santa Cruz County Early Literacy Foundations program records, Reading Corps Individual Growth and Development Indicators (IGDIs) and Formative Assessment System for Teachers (FAST) Assessment Tools, 2014-2015.
Note: Children who completed at least (any) two benchmark assessments within a pre-literacy skill area were included in the analysis of that skill. Only children ages 4 and 5 were included in this analysis. Average scores and average growths have been rounded.
N: “Children with No Intervention”—(Picture Naming) Oct =89, Feb=104, May=99; (Rhyming) Oct =76, Feb=96, May=90; (Alliteration) Oct =73, Feb=89, May=89; (Letter Naming) Oct =86, Feb=102, May=100; (Letter Sounds) Oct =74, Feb=93, May=88; Children with Interventions—(Picture Naming) Oct =71, Feb=84, May=77; (Rhyming) Oct =57, Feb=76, May=72; (Alliteration) Oct =65, Feb=78, May=73; (Letter Naming) Oct =69, Feb=83, May=80; (Letter Sounds) Oct =70, Feb=82, May=74.
Did Not Require Tailored Interventions
Received Tailored Interventions
5.8
9.7
14.016.2
19.8
7.2
11.9
16.9
0
5
10
15
20
25
Oct. Feb. May AverageGrowth
10.2 10.1
6.2
10.9
16.4
5.1
10.4
15.2
0
5
10
15
20
Oct. Feb. May AverageGrowth
3.44.14.7
6.1
8.1
2.2
4.0
6.3
0
2
4
6
8
10
Oct. Feb. May AverageGrowth
7.2 7.3
2.3
5.2
9.6
1.0
4.2
8.3
0
2
4
6
8
10
12
Oct. Feb. May AverageGrowth
2.4 1.92.1
3.0
4.6
2.02.3
3.9
0
1
2
3
4
5
Oct. Feb. May AverageGrowth
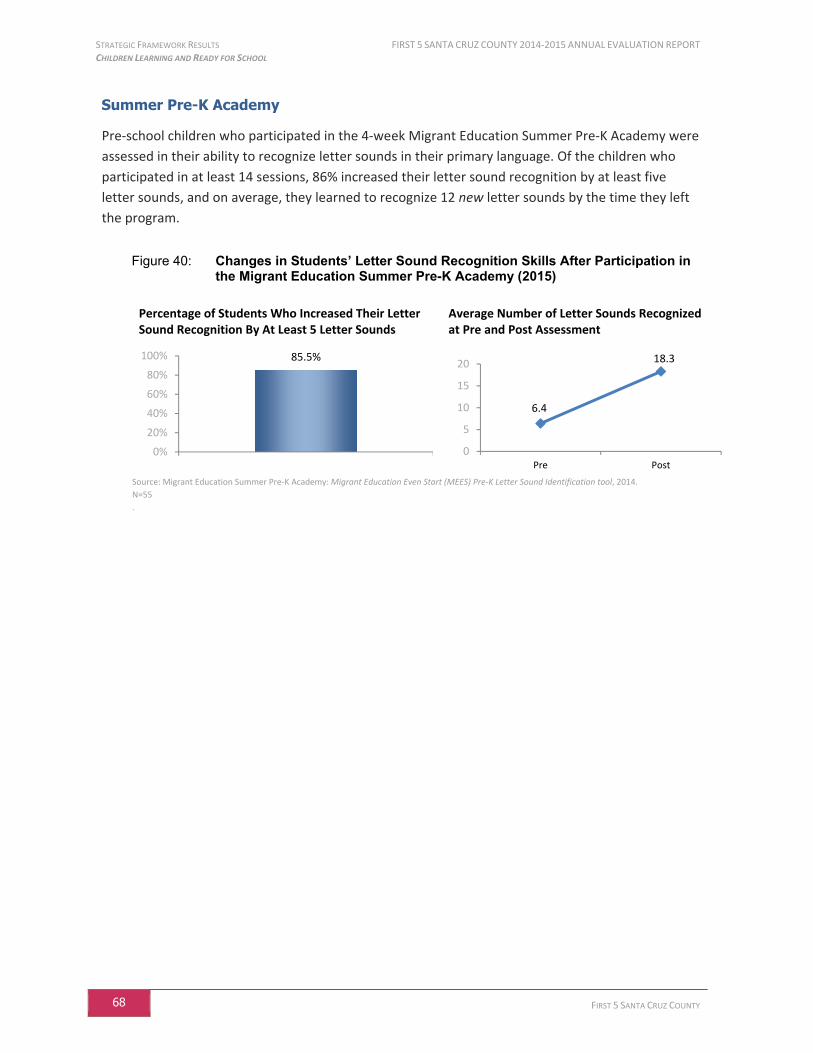
STRATEGIC FRAMEWORK RESULTS FIRST 5 SANTA CRUZ COUNTY 2014-2015 ANNUAL EVALUATION REPORT CHILDREN LEARNING AND READY FOR SCHOOL
68 FIRST 5 SANTA CRUZ COUNTY
Summer Pre-K Academy
Pre-school children who participated in the 4-week Migrant Education Summer Pre-K Academy were
assessed in their ability to recognize letter sounds in their primary language. Of the children who
participated in at least 14 sessions, 86% increased their letter sound recognition by at least five
letter sounds, and on average, they learned to recognize 12 new letter sounds by the time they left
the program.
Figure 40: Changes in Students’ Letter Sound Recognition Skills After Participation in the Migrant Education Summer Pre-K Academy (2015)
Percentage of Students Who Increased Their Letter Sound Recognition By At Least 5 Letter Sounds
Average Number of Letter Sounds Recognized at Pre and Post Assessment
Source: Migrant Education Summer Pre-K Academy: Migrant Education Even Start (MEES) Pre-K Letter Sound Identification tool, 2014.
N=55
.
85.5%
0%
20%
40%
60%
80%
100%
6.4
18.3
0
5
10
15
20
Pre Post

FIRST 5 SANTA CRUZ COUNTY 2014-2015 ANNUAL EVALUATION REPORT STRATEGIC FRAMEWORK RESULTS SERVICE INTEGRATION AND COMMUNITY STRENGTHENING
FIRST 5 SANTA CRUZ COUNTY 69
Service Integration & Community Strengthening
This portion of First 5 Santa Cruz County’s Strategic
Framework analysis includes data regarding building
system integration efforts through training, shared data,
community events, and capacity-building projects.
First 5 Service Integration
First 5 Santa Cruz County seeks to strengthen the system of care for families with children ages 0-5 in
the County. One measure of the degree of current integration across the system is the number of
children who are served by multiple First 5 grantees. Sometimes this occurs because grantees cross-
refer families, or because other agencies refer families into a coordinated network of First 5 services.
In 2014-15, approximately 15% of children received services from multiple First 5 partners.
This may be lower than previous years due to the absence of the Child Snapshot program,
which often served over 700 children who were likely to be involved in other First 5 services.
Not surprisingly, the agency with the highest child enrollment—Raising A Reader (with 4,129
children)—had the highest number of children who also participated in other programs,
including Early Literacy Foundations Reading Corps classrooms (530 children shared), Healthy
Kids Initiative (163 children shared), Families Together (125 children shared), and Triple P
(120 children shared).
Figure 41: Percentage of Children Receiving Services from Multiple First 5 Partners
Source: First 5 CCD database for July 1, 2006 - June 30, 2015.
N: (2006-07) N=4,462; (2007-08) N=5,214; (2008-09) N=5,440; (2009-10) N=5,762; (2010-11) N=9,292; (2011-12) N=8,382; (2012-13) N=7,974; (2013-14) N=6,840, (2014-15) N=6,328.
12.8%
20.3%
13.0%14.6%
17.8% 18.8% 17.9%21.9%
14.6%
0%
10%
20%
30%
2006-07 2007-08 2008-09 2009-10 2010-11 2011-12 2012-13 2013-14 2014-15
Indicator: Number of families who receive services from multiple First 5 grantees
SERVICE INTEGRATION & COMMUNITY STRENGTHENING
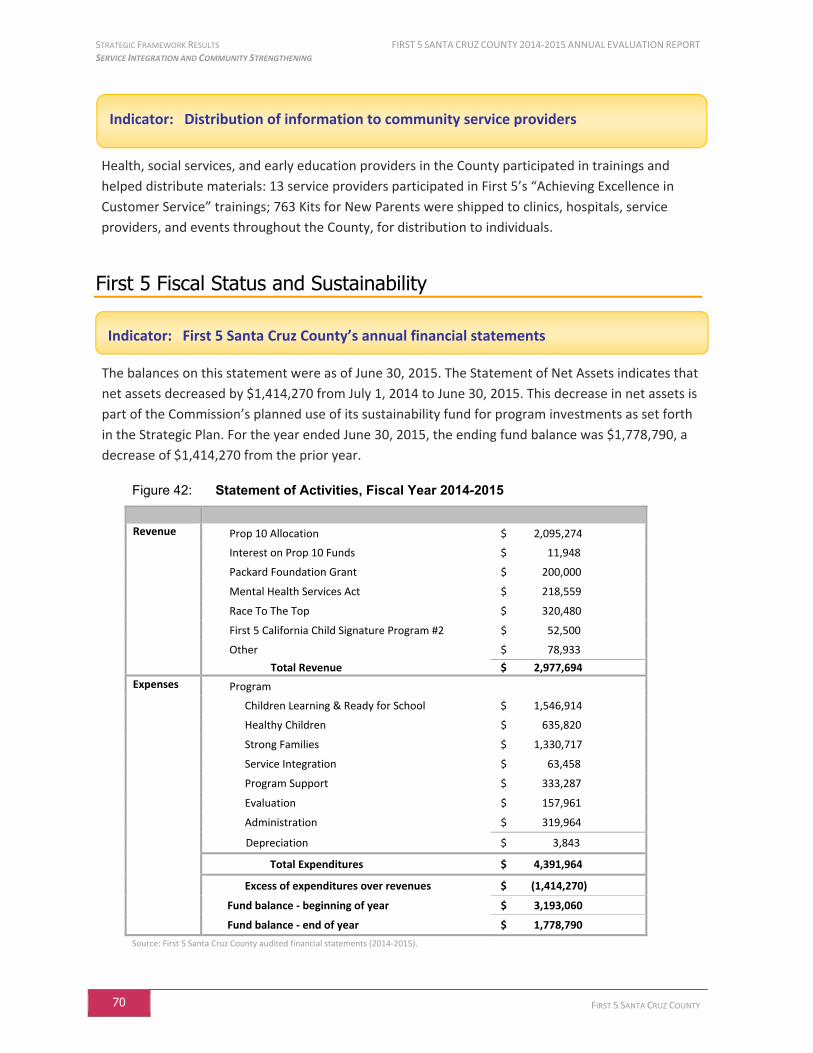
STRATEGIC FRAMEWORK RESULTS FIRST 5 SANTA CRUZ COUNTY 2014-2015 ANNUAL EVALUATION REPORT SERVICE INTEGRATION AND COMMUNITY STRENGTHENING
70 FIRST 5 SANTA CRUZ COUNTY
Health, social services, and early education providers in the County participated in trainings and
helped distribute materials: 13 service providers participated in First 5’s “Achieving Excellence in
Customer Service” trainings; 763 Kits for New Parents were shipped to clinics, hospitals, service
providers, and events throughout the County, for distribution to individuals.
First 5 Fiscal Status and Sustainability
The balances on this statement were as of June 30, 2015. The Statement of Net Assets indicates that
net assets decreased by $1,414,270 from July 1, 2014 to June 30, 2015. This decrease in net assets is
part of the Commission’s planned use of its sustainability fund for program investments as set forth
in the Strategic Plan. For the year ended June 30, 2015, the ending fund balance was $1,778,790, a
decrease of $1,414,270 from the prior year.
Figure 42: Statement of Activities, Fiscal Year 2014-2015
Revenue Prop 10 Allocation $ 2,095,274
Interest on Prop 10 Funds $ 11,948
Packard Foundation Grant $ 200,000
Mental Health Services Act $ 218,559
Race To The Top $ 320,480
First 5 California Child Signature Program #2 $ 52,500
Other $ 78,933
Total Revenue $ 2,977,694
Expenses Program
Children Learning & Ready for School $ 1,546,914
Healthy Children $ 635,820
Strong Families $ 1,330,717
Service Integration $ 63,458
Program Support $ 333,287
Evaluation $ 157,961
Administration $ 319,964
Depreciation $ 3,843
Total Expenditures $ 4,391,964
Excess of expenditures over revenues $ (1,414,270)
Fund balance - beginning of year $ 3,193,060
Fund balance - end of year $ 1,778,790
Source: First 5 Santa Cruz County audited financial statements (2014-2015).
Indicator: Distribution of information to community service providers
Indicator: First 5 Santa Cruz County’s annual financial statements
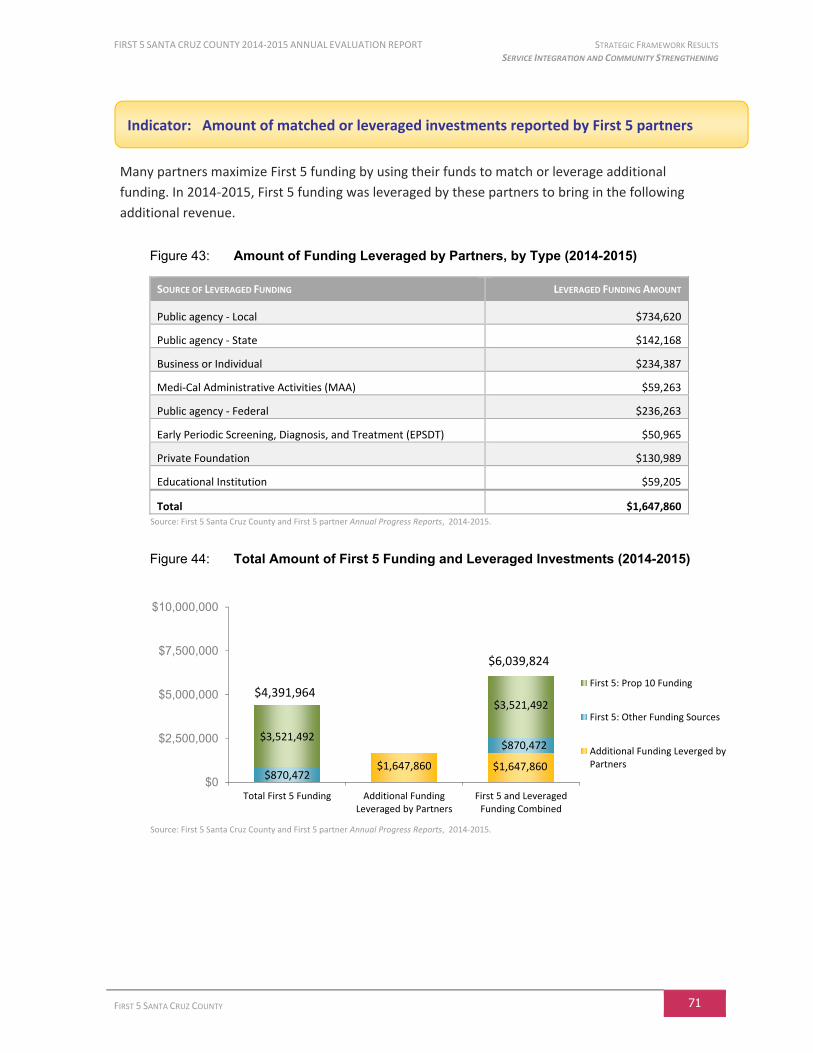
FIRST 5 SANTA CRUZ COUNTY 2014-2015 ANNUAL EVALUATION REPORT STRATEGIC FRAMEWORK RESULTS SERVICE INTEGRATION AND COMMUNITY STRENGTHENING
FIRST 5 SANTA CRUZ COUNTY 71
Many partners maximize First 5 funding by using their funds to match or leverage additional
funding. In 2014-2015, First 5 funding was leveraged by these partners to bring in the following
additional revenue.
Figure 43: Amount of Funding Leveraged by Partners, by Type (2014-2015)
SOURCE OF LEVERAGED FUNDING LEVERAGED FUNDING AMOUNT
Public agency - Local $734,620
Public agency - State $142,168
Business or Individual $234,387
Medi-Cal Administrative Activities (MAA) $59,263
Public agency - Federal $236,263
Early Periodic Screening, Diagnosis, and Treatment (EPSDT) $50,965
Private Foundation $130,989
Educational Institution $59,205
Total $1,647,860 Source: First 5 Santa Cruz County and First 5 partner Annual Progress Reports, 2014-2015.
Figure 44: Total Amount of First 5 Funding and Leveraged Investments (2014-2015)
Source: First 5 Santa Cruz County and First 5 partner Annual Progress Reports, 2014-2015.
$1,647,860 $1,647,860$870,472
$870,472$3,521,492
$3,521,492$4,391,964
$6,039,824
$0
$2,500,000
$5,000,000
$7,500,000
$10,000,000
Total First 5 Funding Additional FundingLeveraged by Partners
First 5 and LeveragedFunding Combined
First 5: Prop 10 Funding
First 5: Other Funding Sources
Additional Funding Leverged byPartners
Indicator: Amount of matched or leveraged investments reported by First 5 partners
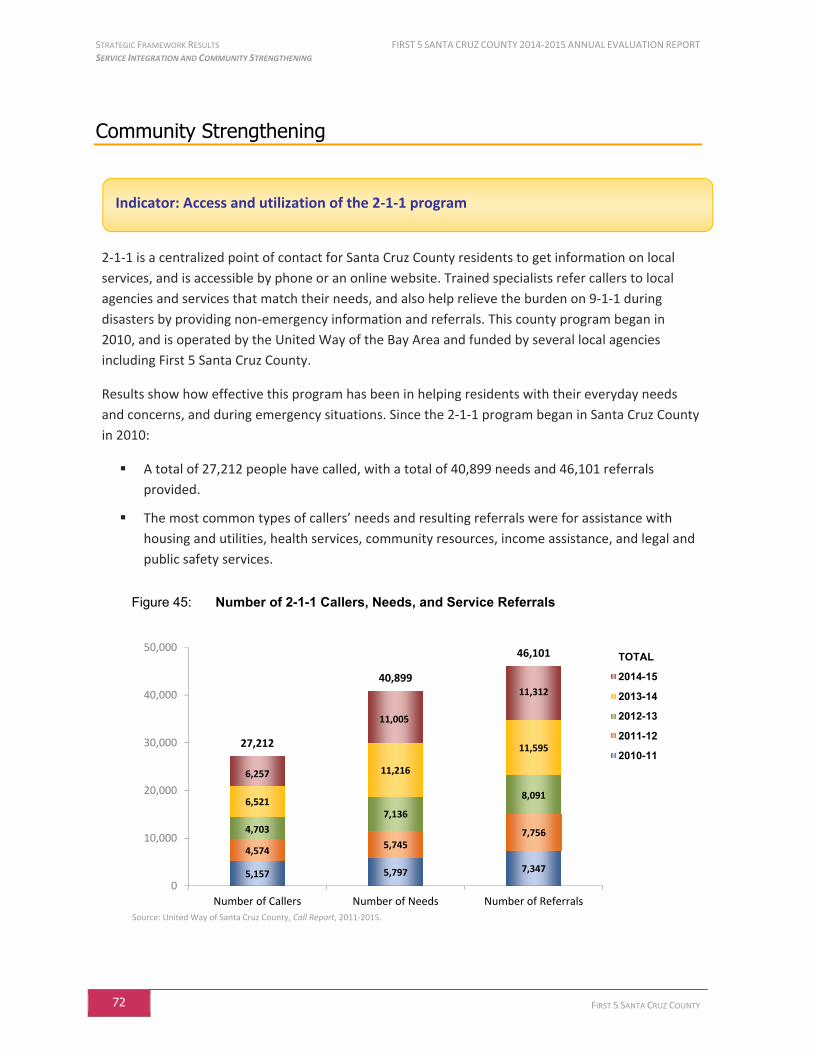
STRATEGIC FRAMEWORK RESULTS FIRST 5 SANTA CRUZ COUNTY 2014-2015 ANNUAL EVALUATION REPORT SERVICE INTEGRATION AND COMMUNITY STRENGTHENING
72 FIRST 5 SANTA CRUZ COUNTY
Community Strengthening
2-1-1 is a centralized point of contact for Santa Cruz County residents to get information on local
services, and is accessible by phone or an online website. Trained specialists refer callers to local
agencies and services that match their needs, and also help relieve the burden on 9-1-1 during
disasters by providing non-emergency information and referrals. This county program began in
2010, and is operated by the United Way of the Bay Area and funded by several local agencies
including First 5 Santa Cruz County.
Results show how effective this program has been in helping residents with their everyday needs
and concerns, and during emergency situations. Since the 2-1-1 program began in Santa Cruz County
in 2010:
A total of 27,212 people have called, with a total of 40,899 needs and 46,101 referrals
provided.
The most common types of callers’ needs and resulting referrals were for assistance with
housing and utilities, health services, community resources, income assistance, and legal and
public safety services.
Figure 45: Number of 2-1-1 Callers, Needs, and Service Referrals
Source: United Way of Santa Cruz County, Call Report, 2011-2015.
5,157 5,797 7,347
4,5745,745
7,7564,703
7,136
8,0916,521
11,216
11,595
6,257
11,005
11,312
27,212
40,899
46,101
0
10,000
20,000
30,000
40,000
50,000
Number of Callers Number of Needs Number of Referrals
TOTAL
2014-15
2013-14
2012-13
2011-12
2010-11
Indicator: Access and utilization of the 2-1-1 program
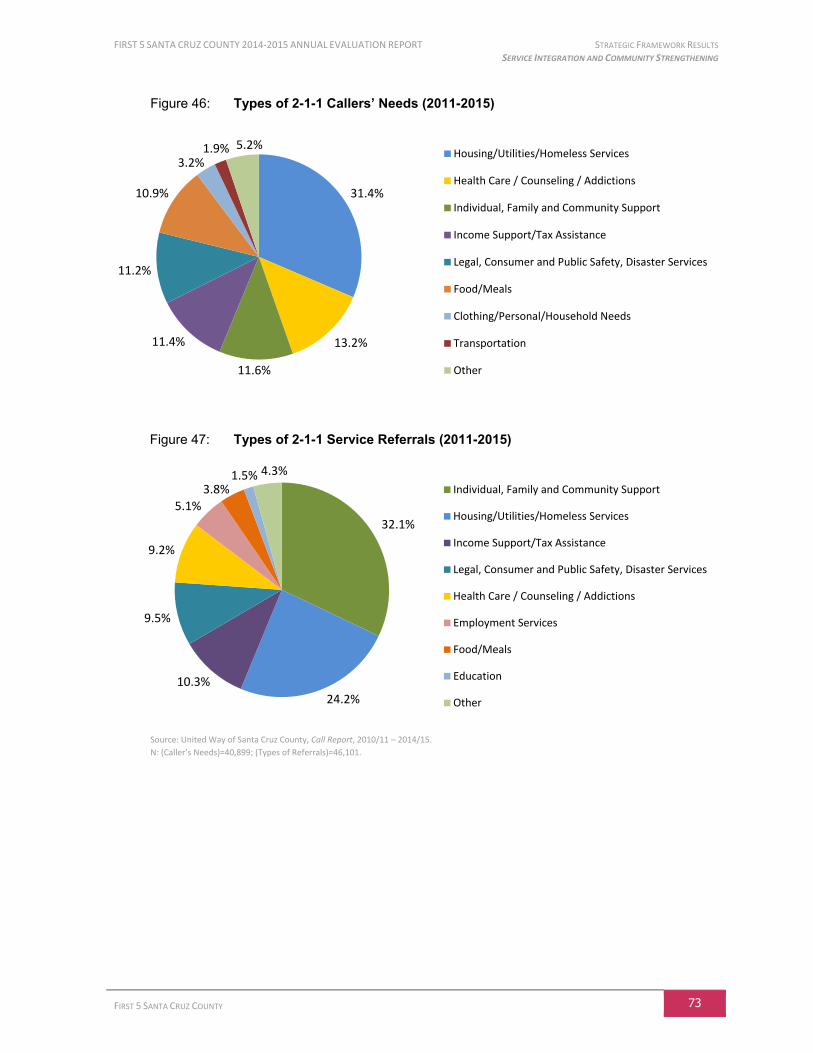
FIRST 5 SANTA CRUZ COUNTY 2014-2015 ANNUAL EVALUATION REPORT STRATEGIC FRAMEWORK RESULTS SERVICE INTEGRATION AND COMMUNITY STRENGTHENING
FIRST 5 SANTA CRUZ COUNTY 73
Figure 46: Types of 2-1-1 Callers’ Needs (2011-2015)
Figure 47: Types of 2-1-1 Service Referrals (2011-2015)
Source: United Way of Santa Cruz County, Call Report, 2010/11 – 2014/15.
N: (Caller’s Needs)=40,899; (Types of Referrals)=46,101.
31.4%
13.2%
11.6%
11.4%
11.2%
10.9%
3.2%1.9% 5.2%
Housing/Utilities/Homeless Services
Health Care / Counseling / Addictions
Individual, Family and Community Support
Income Support/Tax Assistance
Legal, Consumer and Public Safety, Disaster Services
Food/Meals
Clothing/Personal/Household Needs
Transportation
Other
32.1%
24.2%
10.3%
9.5%
9.2%
5.1%
3.8%1.5% 4.3%
Individual, Family and Community Support
Housing/Utilities/Homeless Services
Income Support/Tax Assistance
Legal, Consumer and Public Safety, Disaster Services
Health Care / Counseling / Addictions
Employment Services
Food/Meals
Education
Other

STRATEGIC FRAMEWORK RESULTS FIRST 5 SANTA CRUZ COUNTY 2014-2015 ANNUAL EVALUATION REPORT SERVICE INTEGRATION AND COMMUNITY STRENGTHENING
74 FIRST 5 SANTA CRUZ COUNTY
FIRST 5 SANTA CRUZ COUNTY 2014-2015 ANNUAL EVALUATION REPORT PARTNER PROFILES
FIRST 5 SANTA CRUZ COUNTY 75
PART 2: PARTNER PROFILES
PARTNER PROFILES FIRST 5 SANTA CRUZ COUNTY 2014-2015 ANNUAL EVALUATION REPORT
76 FIRST 5 SANTA CRUZ COUNTY
PARTNER PROFILES
This section of the report provides a snapshot of each First 5 partner’s work Between July 1, 2014
and June 30, 2015.
At the beginning of the 2014-15 contract period, scopes of work were developed with each partner
which detailed each program’s target population, the number of people to be served, primary
programmatic activities, outcome objectives, methods of measurement, and the timing of data
collection activities. Partners reported their outcome data biannually or annually, using First 5’s
Apricot database, customized Excel forms, or partner-specific reports. In addition, a narrative
template was provided to partners to submit qualitative information on the progress of their
services. When collecting data for their outcome objective, some programs did not administer their
assessment tools to every participant. For this reason the number of participants reported in their
outcome measurement may differ from the total number of participants who were served.
The purpose of the Partner Profiles is to highlight the work that each partner conducted in Fiscal
Year 2014-15. Organized by goal area (Healthy Children, Strong Families, and Children Learning and
Ready for School), each profile briefly lists:
Description of the program
Population served
Client outcome objectives achieved (and in a few cases, also program objectives achieved)
Readers will note that in many cases, data that were presented in the Strategic Framework section
are presented here again with the intent of summarizing the meaningful work that each of the
partners carried out in 2014-15.
Finally, it should be noted that these profiles only provide an overview of the innovative work that
each partner or initiative implements, and that more comprehensive detail about each partner’s
progress is provided in their annual report to First 5.
FIRST 5 SANTA CRUZ COUNTY 2014-2015 ANNUAL EVALUATION REPORT PARTNER PROFILES HEALTHY CHILDREN - HEALTHY KIDS INITIATIVE
FIRST 5 SANTA CRUZ COUNTY 77
“As a CAA I have met many families who are in need of insurance for their children. However, one family’s story reminds me of the importance of what we do. I met a mother who had a 4-year-old who was diagnosed with asthma, but she could not afford to pay for private insurance. When she realized she could qualify for one of the County programs she was very grateful. After the child was granted the health insurance the mother called and said. “Now I can let my child run with no worry!”
Our work is far beyond helping people apply for health insurance; we provide families with information that allows a 4-year-old to run worry-free.”
- Certified Application Assistor, First 5 Santa Cruz County
Healthy Children
Healthy Kids Initiative
Health Care Outreach Coalition
Program Description
The Health Care Outreach Coalition (HCOC) provides assistance with applications and enrollment in
public health insurance to income-eligible families. In 2014-15, HCOC was folded into the Benefits
Coalition, coordinated by the County of Santa Cruz Human
Services Department. Through community outreach
workers called Certified Application Assistors (CAAs) 20,
children from families earning up to 300% of the Federal
Poverty Level receive assistance in applying for Medi-Cal,
Covered California, and the local Healthy Kids health
insurance plan.
Additionally, staff participate in community events and
respond to business and community agency requests for
presentations and additional information regarding
health insurance. Staff also assist in the management of
the One-e-App online application system, providing
training and technical assistance to all CAAs.
With the introduction of the Affordable Care Act (ACA), there
have been many changes to public health insurance programs available to children. CAAs have
received intensive training that allows them to provide families with the assistance and support
necessary to keep eligible children enrolled in public health insurance benefits, which helps ensure a
more successful enrollment and retention process in all programs.
Population Served
2014-2015
Children 1,908
Source: First 5 CCD database for July 1, 2014 – June 30, 2015.
20
In this report, the title “CAA” is used to refer to both Certified Application Assistors and also individuals who are certified as Certified Enrollment Counselors (CECs), which is a title is specific to counselors providing Covered California services.
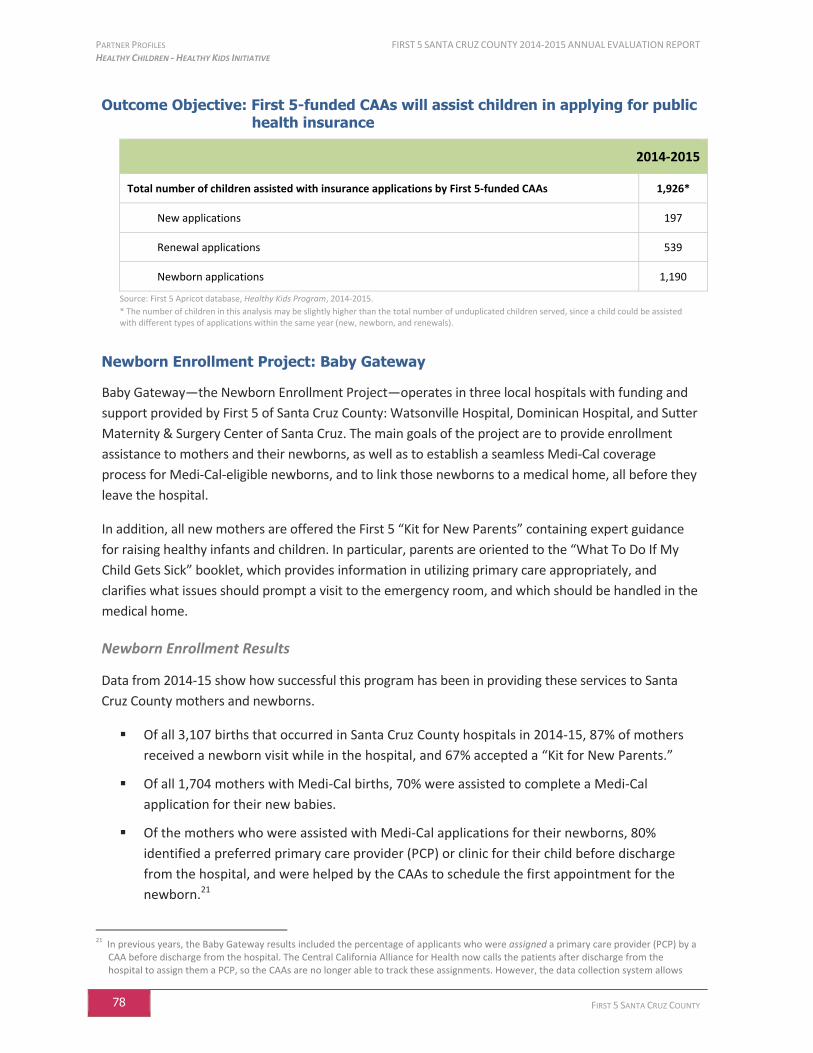
PARTNER PROFILES FIRST 5 SANTA CRUZ COUNTY 2014-2015 ANNUAL EVALUATION REPORT HEALTHY CHILDREN - HEALTHY KIDS INITIATIVE
78 FIRST 5 SANTA CRUZ COUNTY
Outcome Objective: First 5-funded CAAs will assist children in applying for public health insurance
2014-2015
Total number of children assisted with insurance applications by First 5-funded CAAs 1,926*
New applications 197
Renewal applications 539
Newborn applications 1,190
Source: First 5 Apricot database, Healthy Kids Program, 2014-2015.
* The number of children in this analysis may be slightly higher than the total number of unduplicated children served, since a child could be assisted with different types of applications within the same year (new, newborn, and renewals).
Newborn Enrollment Project: Baby Gateway
Baby Gateway—the Newborn Enrollment Project—operates in three local hospitals with funding and
support provided by First 5 of Santa Cruz County: Watsonville Hospital, Dominican Hospital, and Sutter
Maternity & Surgery Center of Santa Cruz. The main goals of the project are to provide enrollment
assistance to mothers and their newborns, as well as to establish a seamless Medi-Cal coverage
process for Medi-Cal-eligible newborns, and to link those newborns to a medical home, all before they
leave the hospital.
In addition, all new mothers are offered the First 5 “Kit for New Parents” containing expert guidance
for raising healthy infants and children. In particular, parents are oriented to the “What To Do If My
Child Gets Sick” booklet, which provides information in utilizing primary care appropriately, and
clarifies what issues should prompt a visit to the emergency room, and which should be handled in the
medical home.
Newborn Enrollment Results
Data from 2014-15 show how successful this program has been in providing these services to Santa
Cruz County mothers and newborns.
Of all 3,107 births that occurred in Santa Cruz County hospitals in 2014-15, 87% of mothers
received a newborn visit while in the hospital, and 67% accepted a “Kit for New Parents.”
Of all 1,704 mothers with Medi-Cal births, 70% were assisted to complete a Medi-Cal
application for their new babies.
Of the mothers who were assisted with Medi-Cal applications for their newborns, 80%
identified a preferred primary care provider (PCP) or clinic for their child before discharge
from the hospital, and were helped by the CAAs to schedule the first appointment for the
newborn.21
21
In previous years, the Baby Gateway results included the percentage of applicants who were assigned a primary care provider (PCP) by a CAA before discharge from the hospital. The Central California Alliance for Health now calls the patients after discharge from the hospital to assign them a PCP, so the CAAs are no longer able to track these assignments. However, the data collection system allows
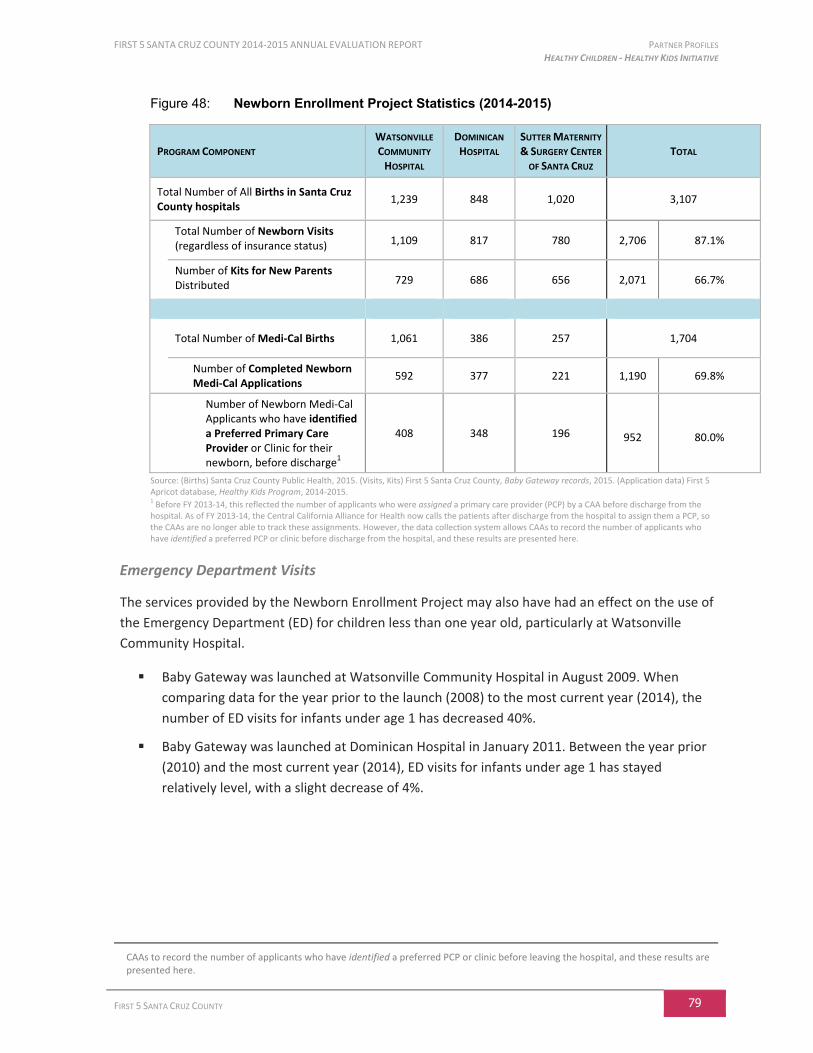
FIRST 5 SANTA CRUZ COUNTY 2014-2015 ANNUAL EVALUATION REPORT PARTNER PROFILES HEALTHY CHILDREN - HEALTHY KIDS INITIATIVE
FIRST 5 SANTA CRUZ COUNTY 79
Figure 48: Newborn Enrollment Project Statistics (2014-2015)
PROGRAM COMPONENT WATSONVILLE
COMMUNITY
HOSPITAL
DOMINICAN
HOSPITAL SUTTER MATERNITY
& SURGERY CENTER
OF SANTA CRUZ TOTAL
Total Number of All Births in Santa Cruz County hospitals
1,239 848 1,020 3,107
Total Number of Newborn Visits (regardless of insurance status) 1,109 817 780 2,706 87.1%
Number of Kits for New Parents Distributed 729 686 656 2,071 66.7%
Total Number of Medi-Cal Births 1,061 386 257 1,704
Number of Completed Newborn Medi-Cal Applications
592 377 221 1,190 69.8%
Number of Newborn Medi-Cal Applicants who have identified a Preferred Primary Care Provider or Clinic for their newborn, before discharge
1
408 348 196 952 80.0%
Source: (Births) Santa Cruz County Public Health, 2015. (Visits, Kits) First 5 Santa Cruz County, Baby Gateway records, 2015. (Application data) First 5 Apricot database, Healthy Kids Program, 2014-2015. 1 Before FY 2013-14, this reflected the number of applicants who were assigned a primary care provider (PCP) by a CAA before discharge from the hospital. As of FY 2013-14, the Central California Alliance for Health now calls the patients after discharge from the hospital to assign them a PCP, so the CAAs are no longer able to track these assignments. However, the data collection system allows CAAs to record the number of applicants who have identified a preferred PCP or clinic before discharge from the hospital, and these results are presented here.
Emergency Department Visits
The services provided by the Newborn Enrollment Project may also have had an effect on the use of
the Emergency Department (ED) for children less than one year old, particularly at Watsonville
Community Hospital.
Baby Gateway was launched at Watsonville Community Hospital in August 2009. When
comparing data for the year prior to the launch (2008) to the most current year (2014), the
number of ED visits for infants under age 1 has decreased 40%.
Baby Gateway was launched at Dominican Hospital in January 2011. Between the year prior
(2010) and the most current year (2014), ED visits for infants under age 1 has stayed
relatively level, with a slight decrease of 4%.
CAAs to record the number of applicants who have identified a preferred PCP or clinic before leaving the hospital, and these results are presented here.

PARTNER PROFILES FIRST 5 SANTA CRUZ COUNTY 2014-2015 ANNUAL EVALUATION REPORT HEALTHY CHILDREN - HEALTHY KIDS INITIATIVE
80 FIRST 5 SANTA CRUZ COUNTY
Figure 49: Number of Emergency Department Visits (Infants Less Than One Year Old)
Source: State of California, Office of Statewide Health Planning and Development (OSHPD), Healthcare Information Division, Emergency Department Pivot Profiles and customized reports, 2015.
2,2092,102
2,315
1,926
1,600 1,5661,526
1,268
617 655 724629 587
522 542 603
0
400
800
1,200
1,600
2,000
2,400
2007 2008 2009 2010 2011 2012 2013 2014
WatsonvilleCommunity Hospital
Dominican Hospital
Baby Gateway Launched at
Dominican Hospital
Baby Gateway Launched
at Watsonville Community
Hospital
FIRST 5 SANTA CRUZ COUNTY 2014-2015 ANNUAL EVALUATION REPORT PARTNER PROFILES HEALTHY CHILDREN - STANFORD NEURODEVELOPMENTAL FOSTER CARE CLINIC
FIRST 5 SANTA CRUZ COUNTY 81
“One newborn was discharged from the NICU to her loving foster parents. Like many parents and foster parents they came to their first appointment at SNDFCC with the hope that at 6 months ‘Lily’s’ development and behavior were fine. They were surprised to find out from the results of the developmental and behavioral assessments that she had a gross motor delay. She was referred to occupational therapy and started receiving services within 2 weeks.
Over 30% of the children seen in our foster care program were identified with developmental delays from our comprehensive evaluations. We assist families in making referrals and removing any obstacles they may have in accessing the recommended follow-up services.”
- Stanford Neurodevelopmental Foster Care Clinic, Annual Progress Report
Stanford Neurodevelopmental Foster Care Clinic
Program Description
The Stanford Neurodevelopmental Foster Care Clinic (“SNDFCC”) is an innovative, coordinated approach
to address the neurodevelopmental needs of very vulnerable children age 0-5 in the foster care system.
Nationally, almost one in five children face developmental disabilities or disabling behavioral challenges
before age eighteen, but fewer than half of these children are identified before the age of five.22 On the
other hand, about one-third of California children who receive early intervention services before the age
of three do not require additional intervention during the preschool years or when they enter
kindergarten.23 We know early intervention works, yet children who have already endured abuse and
neglect typically do not receive the early assessment and coordinated services they need. Children with
disabilities are more likely to be abused and neglected and
yet, once in the system designed to protect them, their
needs may go unaddressed – thereby missing a critical
window of opportunity to set a healthy life course.
In order to assess, intervene, and treat developmental and
social/emotional issues for children ages 0-5 in foster care
in Santa Cruz County, Dominican Pediatrics established in
2011 a coordinated and multidisciplinary
neurodevelopmental consultative care clinic called the
Dominican Interdisciplinary Child Development Program
(DICDP). DICDP was a collaboration between the Dominican
Pediatrics Program, Lucile Packard Children’s Hospital
Development and Behavior Program, Santa Cruz County
Children’s Mental Health, Santa Cruz County Family and
Children’s Services, and First 5 Santa Cruz County.
The DICDP went through a dramatic transformation in 2014 with
the closure of the Dominican Pediatrics Program. Losing the lead partner required a significant system
change, and after considerable planning Stanford Children’s Health stepped up as the lead agency and
opened a pediatric clinic named the Stanford Neurodevelopmental Foster Care Clinic within its new
Stanford Children’s Health Specialty Services Clinic in Capitola, CA. Stanford Children’s Health now
manages the clinical records, registration, scheduling, electronic medical records, and employment of the
clinical psychologist and licensed clinical social worker, with funding support from Lucile Packard
Children’s Hospital Stanford.
As before, the SNDFCC has an interdisciplinary team that focuses on early intervention to address
the needs of young children entering foster care, and to provide comprehensive services to these
22
American Academy of Pediatrics (2006). Identifying infants and young children with developmental disorders in the medical home: An algorithm for developmental surveillance and screening. Pediatrics, 118 (1), 405-420.
23 Centers for Disease Control and Prevention, “Child Development: Using Developmental Screening to Improve Children’s Health,” Centers
for Disease Control and Prevention. http://www.cdc.gov/ncbddd/child/improve.htm (accessed July 22, 2008).
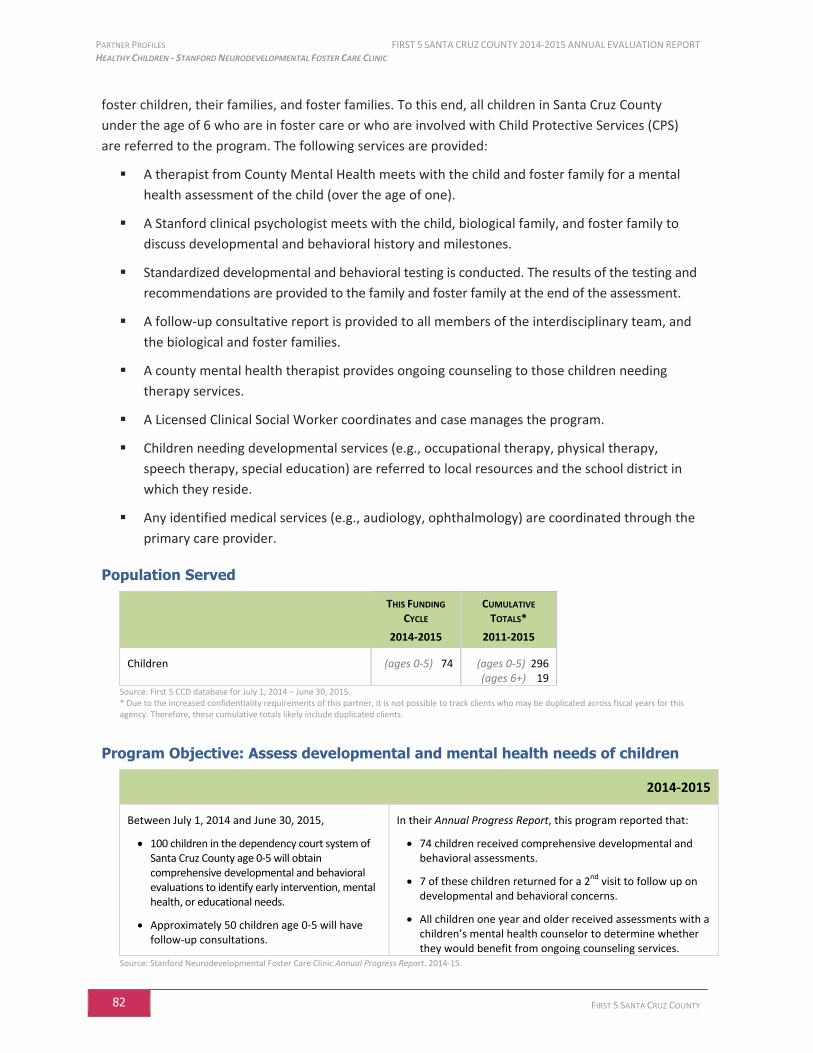
PARTNER PROFILES FIRST 5 SANTA CRUZ COUNTY 2014-2015 ANNUAL EVALUATION REPORT HEALTHY CHILDREN - STANFORD NEURODEVELOPMENTAL FOSTER CARE CLINIC
82 FIRST 5 SANTA CRUZ COUNTY
foster children, their families, and foster families. To this end, all children in Santa Cruz County
under the age of 6 who are in foster care or who are involved with Child Protective Services (CPS)
are referred to the program. The following services are provided:
A therapist from County Mental Health meets with the child and foster family for a mental
health assessment of the child (over the age of one).
A Stanford clinical psychologist meets with the child, biological family, and foster family to
discuss developmental and behavioral history and milestones.
Standardized developmental and behavioral testing is conducted. The results of the testing and
recommendations are provided to the family and foster family at the end of the assessment.
A follow-up consultative report is provided to all members of the interdisciplinary team, and
the biological and foster families.
A county mental health therapist provides ongoing counseling to those children needing
therapy services.
A Licensed Clinical Social Worker coordinates and case manages the program.
Children needing developmental services (e.g., occupational therapy, physical therapy,
speech therapy, special education) are referred to local resources and the school district in
which they reside.
Any identified medical services (e.g., audiology, ophthalmology) are coordinated through the
primary care provider.
Population Served
THIS FUNDING
CYCLE
2014-2015
CUMULATIVE
TOTALS*
2011-2015
Children (ages 0-5) 74 (ages 0-5) 296(ages 6+) 19
Source: First 5 CCD database for July 1, 2014 – June 30, 2015. * Due to the increased confidentiality requirements of this partner, it is not possible to track clients who may be duplicated across fiscal years for this agency. Therefore, these cumulative totals likely include duplicated clients.
Program Objective: Assess developmental and mental health needs of children
2014-2015
Between July 1, 2014 and June 30, 2015,
100 children in the dependency court system of Santa Cruz County age 0-5 will obtain comprehensive developmental and behavioral evaluations to identify early intervention, mental health, or educational needs.
Approximately 50 children age 0-5 will have follow-up consultations.
In their Annual Progress Report, this program reported that:
74 children received comprehensive developmental and behavioral assessments.
7 of these children returned for a 2nd visit to follow up on developmental and behavioral concerns.
All children one year and older received assessments with a children’s mental health counselor to determine whether they would benefit from ongoing counseling services.
Source: Stanford Neurodevelopmental Foster Care Clinic Annual Progress Report. 2014-15.
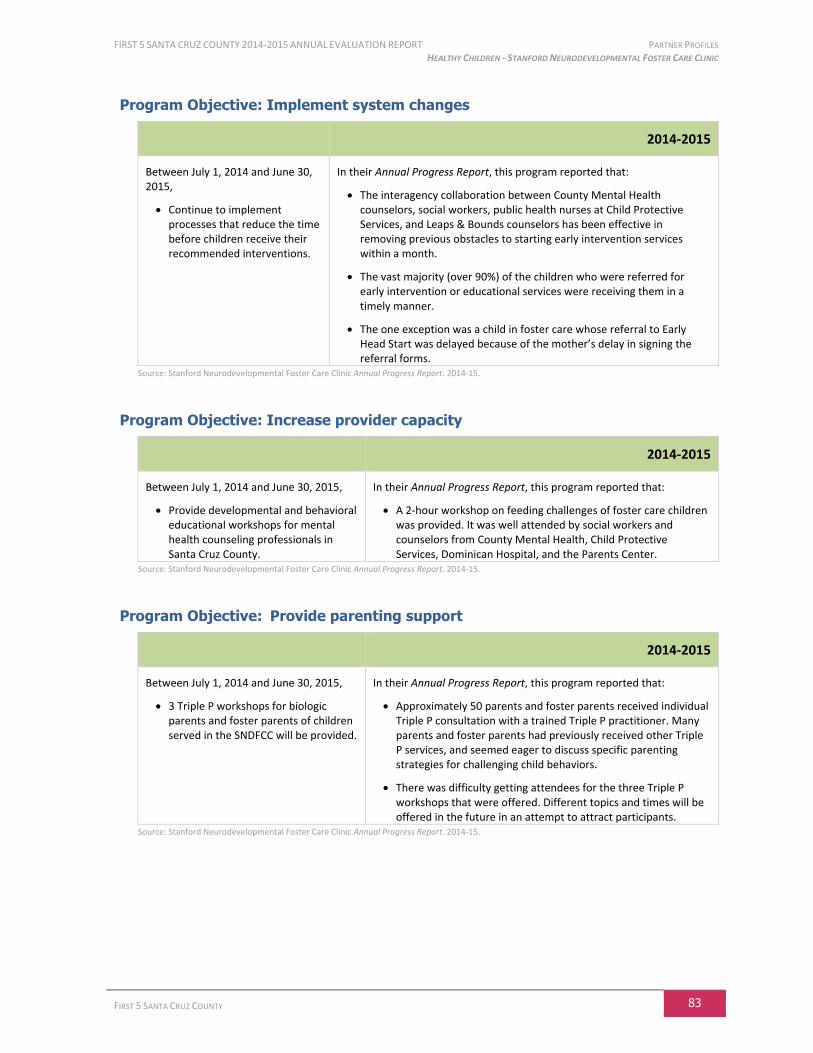
FIRST 5 SANTA CRUZ COUNTY 2014-2015 ANNUAL EVALUATION REPORT PARTNER PROFILES HEALTHY CHILDREN - STANFORD NEURODEVELOPMENTAL FOSTER CARE CLINIC
FIRST 5 SANTA CRUZ COUNTY 83
Program Objective: Implement system changes
2014-2015
Between July 1, 2014 and June 30, 2015,
Continue to implement processes that reduce the time before children receive their recommended interventions.
In their Annual Progress Report, this program reported that:
The interagency collaboration between County Mental Health counselors, social workers, public health nurses at Child Protective Services, and Leaps & Bounds counselors has been effective in removing previous obstacles to starting early intervention services within a month.
The vast majority (over 90%) of the children who were referred for early intervention or educational services were receiving them in a timely manner.
The one exception was a child in foster care whose referral to Early Head Start was delayed because of the mother’s delay in signing the referral forms.
Source: Stanford Neurodevelopmental Foster Care Clinic Annual Progress Report. 2014-15.
Program Objective: Increase provider capacity
2014-2015
Between July 1, 2014 and June 30, 2015,
Provide developmental and behavioral educational workshops for mental health counseling professionals in Santa Cruz County.
In their Annual Progress Report, this program reported that:
A 2-hour workshop on feeding challenges of foster care children was provided. It was well attended by social workers and counselors from County Mental Health, Child Protective Services, Dominican Hospital, and the Parents Center.
Source: Stanford Neurodevelopmental Foster Care Clinic Annual Progress Report. 2014-15.
Program Objective: Provide parenting support
2014-2015
Between July 1, 2014 and June 30, 2015,
3 Triple P workshops for biologic parents and foster parents of children served in the SNDFCC will be provided.
In their Annual Progress Report, this program reported that:
Approximately 50 parents and foster parents received individual Triple P consultation with a trained Triple P practitioner. Many parents and foster parents had previously received other Triple P services, and seemed eager to discuss specific parenting strategies for challenging child behaviors.
There was difficulty getting attendees for the three Triple P workshops that were offered. Different topics and times will be offered in the future in an attempt to attract participants.
Source: Stanford Neurodevelopmental Foster Care Clinic Annual Progress Report. 2014-15.

PARTNER PROFILES FIRST 5 SANTA CRUZ COUNTY 2014-2015 ANNUAL EVALUATION REPORT HEALTHY CHILDREN - STANFORD NEURODEVELOPMENTAL FOSTER CARE CLINIC
84 FIRST 5 SANTA CRUZ COUNTY
In the following results, data from the past four fiscal years (2011-2015) have been aggregated in
order to present a more robust profile of the children served.
Figure 50: Demographics of the Children (Ages 0-5) Participating in the SNDFCC (2011-2015)
Gender Primary Language
Race/Ethnicity Age
Source: Stanford Neurodevelopmental Foster Care Clinic, Data Template, 2011-2015. N: (Gender, Race/Ethnicity, Age)=296; (Language)=295.
Figure 51: Percentage of Children in SNDFCC (Ages 0-5) With These Diagnoses and Services, at Intake (2011-2015)
Source: Stanford Neurodevelopmental Foster Care Clinic, Data Template, 2011-2015. Note: Data for different diagnoses and services were not always collected every year. Therefore, the number of children analyzed for each diagnosis and service may vary. Only diagnoses and services with percentages higher than 4% for at least one age group are shown. N: Ages 0-2 (IEP, ADHD, Occupational Therapy, Developmental Disability Services)=175; (Delayed, Severely Delayed)=168; (COMH Counselor)=73; Ages 3-5 (IEP, ADHD, Occupational Therapy, Developmental Disability Services)=121; (Delayed, Severely Delayed)=120; (COMH Counselor)=32. * Children’s developmental levels were assessed using one of two standardized assessments, depending on the age of the child: the Bayley Scales of Infant and Toddler Development or the Wechsler Preschool and Primary Scales of Intelligence, 3rd edition. ** COMH = County Office of Mental Health
Male46.6%
Female53.4%
English90.2%
Spanish9.8%
Latino / Hispanic,
54.1%
Caucasian / White, 39.5%
Other, 6.4% 13.9%
28.7%
16.6%
12.8%
13.5%
14.5%< 1 year old
1 year old
2 years old
3 years old
4 years old
5 years old
25.0%
1.8% 2.9%1.4%
4.6% 4.6%
36.7%
13.3%11.6%
6.3% 5.0%
0%
10%
20%
30%
40%
"Delayed"Developmental
Level*
"Severely Delayed"Developmental
Level*
At Risk for ADHD Has a COMHCounselor**
Has an IEP ReceivingOccupational Therapy
ReceivingDevelopmental
Disability Services
Ages 0-2 Ages 3-5
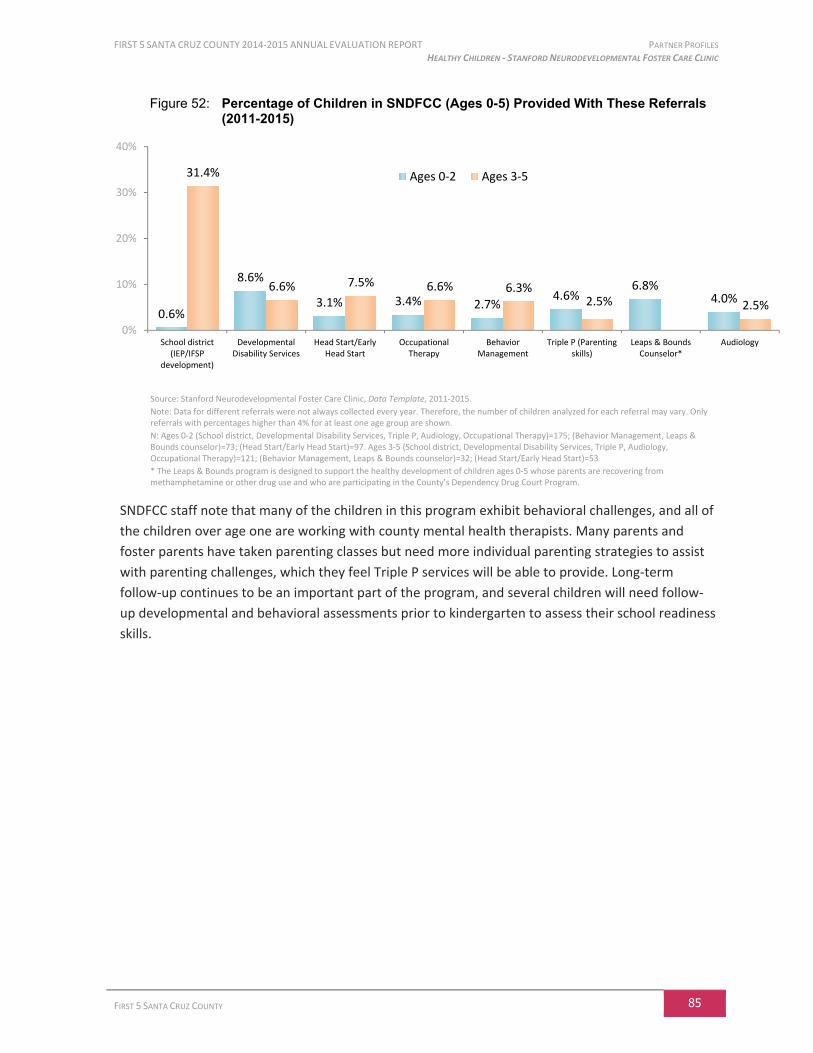
FIRST 5 SANTA CRUZ COUNTY 2014-2015 ANNUAL EVALUATION REPORT PARTNER PROFILES HEALTHY CHILDREN - STANFORD NEURODEVELOPMENTAL FOSTER CARE CLINIC
FIRST 5 SANTA CRUZ COUNTY 85
Figure 52: Percentage of Children in SNDFCC (Ages 0-5) Provided With These Referrals (2011-2015)
Source: Stanford Neurodevelopmental Foster Care Clinic, Data Template, 2011-2015.
Note: Data for different referrals were not always collected every year. Therefore, the number of children analyzed for each referral may vary. Only referrals with percentages higher than 4% for at least one age group are shown.
N: Ages 0-2 (School district, Developmental Disability Services, Triple P, Audiology, Occupational Therapy)=175; (Behavior Management, Leaps & Bounds counselor)=73; (Head Start/Early Head Start)=97. Ages 3-5 (School district, Developmental Disability Services, Triple P, Audiology, Occupational Therapy)=121; (Behavior Management, Leaps & Bounds counselor)=32; (Head Start/Early Head Start)=53
* The Leaps & Bounds program is designed to support the healthy development of children ages 0-5 whose parents are recovering from methamphetamine or other drug use and who are participating in the County’s Dependency Drug Court Program.
SNDFCC staff note that many of the children in this program exhibit behavioral challenges, and all of
the children over age one are working with county mental health therapists. Many parents and
foster parents have taken parenting classes but need more individual parenting strategies to assist
with parenting challenges, which they feel Triple P services will be able to provide. Long-term
follow-up continues to be an important part of the program, and several children will need follow-
up developmental and behavioral assessments prior to kindergarten to assess their school readiness
skills.
0.6%
8.6%
3.1% 3.4% 2.7%4.6%
6.8%4.0%
31.4%
6.6% 7.5% 6.6% 6.3%2.5% 2.5%
0%
10%
20%
30%
40%
School district(IEP/IFSP
development)
DevelopmentalDisability Services
Head Start/EarlyHead Start
OccupationalTherapy
BehaviorManagement
Triple P (Parentingskills)
Leaps & BoundsCounselor*
Audiology
Ages 0-2 Ages 3-5

PARTNER PROFILES FIRST 5 SANTA CRUZ COUNTY 2014-2015 ANNUAL EVALUATION REPORT STRONG FAMILIES – FAMILIES TOGETHER
86 FIRST 5 SANTA CRUZ COUNTY
“’Julia’ was socially isolated and depressed, stemming from living in a city she didn’t know, without community or family. Due to her strained relationship with her daughter’s father, Julia felt especially disconnected from her daughter. In addition, she was also engaged in a custody battle that caused extreme stress and anxiety, and at times re-triggered her own childhood traumas.
Through her sessions at Families Together, she learned anger management skills and mindfulness techniques. These helped her to continue parenting positively while she tackled challenges in court. By the end of her services, Julia felt more attached with her daughter. She also met with her primary care physician for support with depression and anxiety, and found support systems in Santa Cruz that have allowed her to heal and move forward in positive ways.
During her closing session, Julia stated, ‘If it wasn’t for Families Together, I would be an angry, mean mom who didn’t know how to parent or take care of my kids. This program made me better at everything I was doing wrong.’”
-Families Together, Annual Progress Report
Strong Families
Families Together
Program Description
Families Together provides an alternative, voluntary and prevention-focused way for Santa Cruz
County to respond to reports of abuse and neglect received by Family and Children’s Services (FCS).
Of all the referrals to the child welfare screening unit,
only about 8% meet the necessary criteria to receive
services from FCS. However, many of the families
that don’t qualify for services from FCS still have
needs and circumstances that place them at risk for
future incidents of child abuse and neglect. By
assisting these families, Santa Cruz County can
intervene early, before family difficulties escalate to
the point of maltreatment, in order to increase child
safety, engage families in decision-making, and to
support healthy child development.
Encompass Community Services is the lead agency
for Families Together. Other collaborative partners,
such as Family and Children’s Services, a division of
the Human Services Department (HSD), Health
Services Agency, and Families in Transition also play
critical roles in the program.
Most families are referred through the Child Welfare
System, but they participate in Families Together
voluntarily. Beginning in 2012-13, Families Together also began accepting a limited number of
“community-referred” families (e.g., through Head Start, Early Head Start, or public health nurses).
Families Together’s home visiting program includes comprehensive intake and risk assessment,
development of a tailored case plan, parent support and education, child development activities, and
periodic assessments. Using a strengths-based approach, participating families are encouraged to
identify goals and objectives that will support healthy family relationships, child health and safety,
positive parenting, family literacy and school readiness.
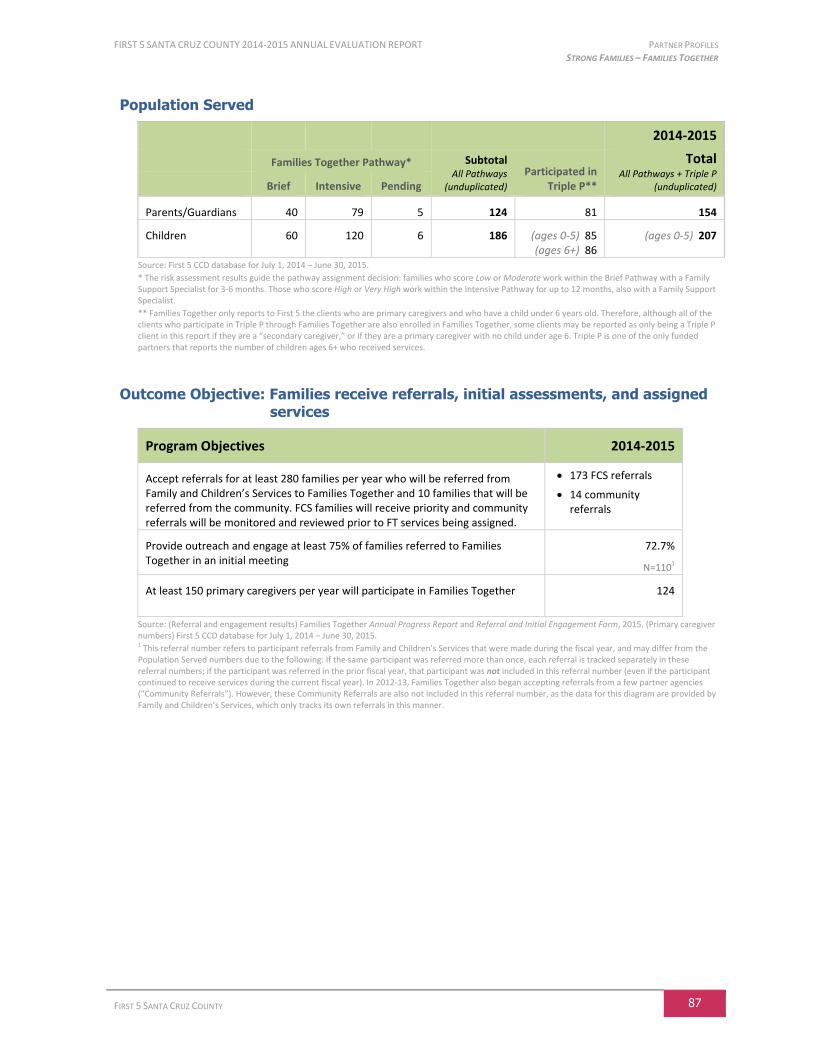
FIRST 5 SANTA CRUZ COUNTY 2014-2015 ANNUAL EVALUATION REPORT PARTNER PROFILES STRONG FAMILIES – FAMILIES TOGETHER
FIRST 5 SANTA CRUZ COUNTY 87
Population Served
2014-2015
Families Together Pathway* Subtotal All Pathways
(unduplicated) Participated in
Triple P**
Total All Pathways + Triple P
(unduplicated) Brief Intensive Pending
Parents/Guardians 40 79 5 124 81 154
Children 60 120 6 186 (ages 0-5) 85 (ages 6+) 86
(ages 0-5) 207
Source: First 5 CCD database for July 1, 2014 – June 30, 2015.
* The risk assessment results guide the pathway assignment decision: families who score Low or Moderate work within the Brief Pathway with a Family Support Specialist for 3-6 months. Those who score High or Very High work within the Intensive Pathway for up to 12 months, also with a Family Support Specialist.
** Families Together only reports to First 5 the clients who are primary caregivers and who have a child under 6 years old. Therefore, although all of the clients who participate in Triple P through Families Together are also enrolled in Families Together, some clients may be reported as only being a Triple P client in this report if they are a “secondary caregiver,” or if they are a primary caregiver with no child under age 6. Triple P is one of the only funded partners that reports the number of children ages 6+ who received services.
Outcome Objective: Families receive referrals, initial assessments, and assigned services
Program Objectives 2014-2015
Accept referrals for at least 280 families per year who will be referred from Family and Children’s Services to Families Together and 10 families that will be referred from the community. FCS families will receive priority and community referrals will be monitored and reviewed prior to FT services being assigned.
173 FCS referrals
14 community referrals
Provide outreach and engage at least 75% of families referred to Families Together in an initial meeting
72.7%
N=1101
At least 150 primary caregivers per year will participate in Families Together 124
Source: (Referral and engagement results) Families Together Annual Progress Report and Referral and Initial Engagement Form, 2015. (Primary caregiver numbers) First 5 CCD database for July 1, 2014 – June 30, 2015. 1 This referral number refers to participant referrals from Family and Children’s Services that were made during the fiscal year, and may differ from the Population Served numbers due to the following: If the same participant was referred more than once, each referral is tracked separately in these referral numbers; if the participant was referred in the prior fiscal year, that participant was not included in this referral number (even if the participant continued to receive services during the current fiscal year). In 2012-13, Families Together also began accepting referrals from a few partner agencies (“Community Referrals”). However, these Community Referrals are also not included in this referral number, as the data for this diagram are provided by Family and Children’s Services, which only tracks its own referrals in this manner.
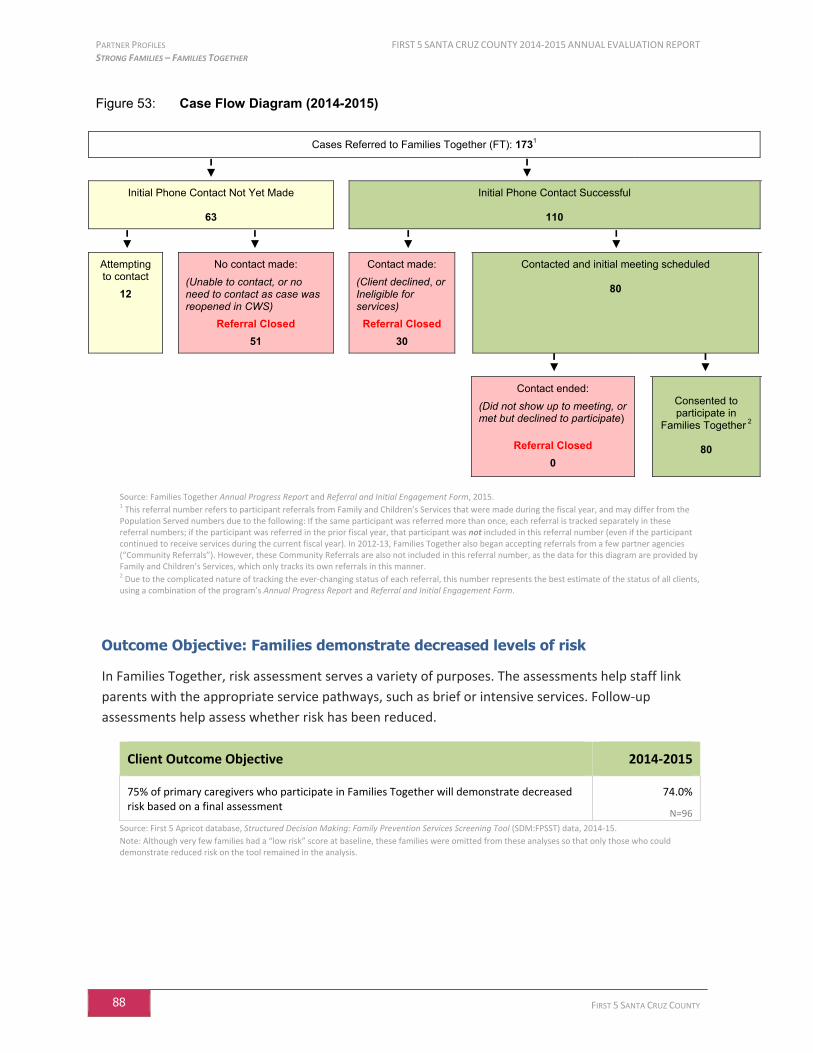
PARTNER PROFILES FIRST 5 SANTA CRUZ COUNTY 2014-2015 ANNUAL EVALUATION REPORT STRONG FAMILIES – FAMILIES TOGETHER
88 FIRST 5 SANTA CRUZ COUNTY
Figure 53: Case Flow Diagram (2014-2015)
Cases Referred to Families Together (FT): 1731
Initial Phone Contact Not Yet Made
63
Initial Phone Contact Successful
110
Attempting to contact
12
No contact made:
(Unable to contact, or no need to contact as case was reopened in CWS)
Referral Closed
51
Contact made:
(Client declined, or Ineligible for services)
Referral Closed
30
Contacted and initial meeting scheduled
80
Contact ended:
(Did not show up to meeting, or met but declined to participate)
Referral Closed
0
Consented to participate in
Families Together 2
80
Source: Families Together Annual Progress Report and Referral and Initial Engagement Form, 2015. 1 This referral number refers to participant referrals from Family and Children’s Services that were made during the fiscal year, and may differ from the Population Served numbers due to the following: If the same participant was referred more than once, each referral is tracked separately in these referral numbers; if the participant was referred in the prior fiscal year, that participant was not included in this referral number (even if the participant continued to receive services during the current fiscal year). In 2012-13, Families Together also began accepting referrals from a few partner agencies (“Community Referrals”). However, these Community Referrals are also not included in this referral number, as the data for this diagram are provided by Family and Children’s Services, which only tracks its own referrals in this manner. 2 Due to the complicated nature of tracking the ever-changing status of each referral, this number represents the best estimate of the status of all clients, using a combination of the program’s Annual Progress Report and Referral and Initial Engagement Form.
Outcome Objective: Families demonstrate decreased levels of risk
In Families Together, risk assessment serves a variety of purposes. The assessments help staff link
parents with the appropriate service pathways, such as brief or intensive services. Follow-up
assessments help assess whether risk has been reduced.
Client Outcome Objective 2014-2015
75% of primary caregivers who participate in Families Together will demonstrate decreased risk based on a final assessment
74.0%
N=96
Source: First 5 Apricot database, Structured Decision Making: Family Prevention Services Screening Tool (SDM:FPSST) data, 2014-15.
Note: Although very few families had a “low risk” score at baseline, these families were omitted from these analyses so that only those who could demonstrate reduced risk on the tool remained in the analysis.
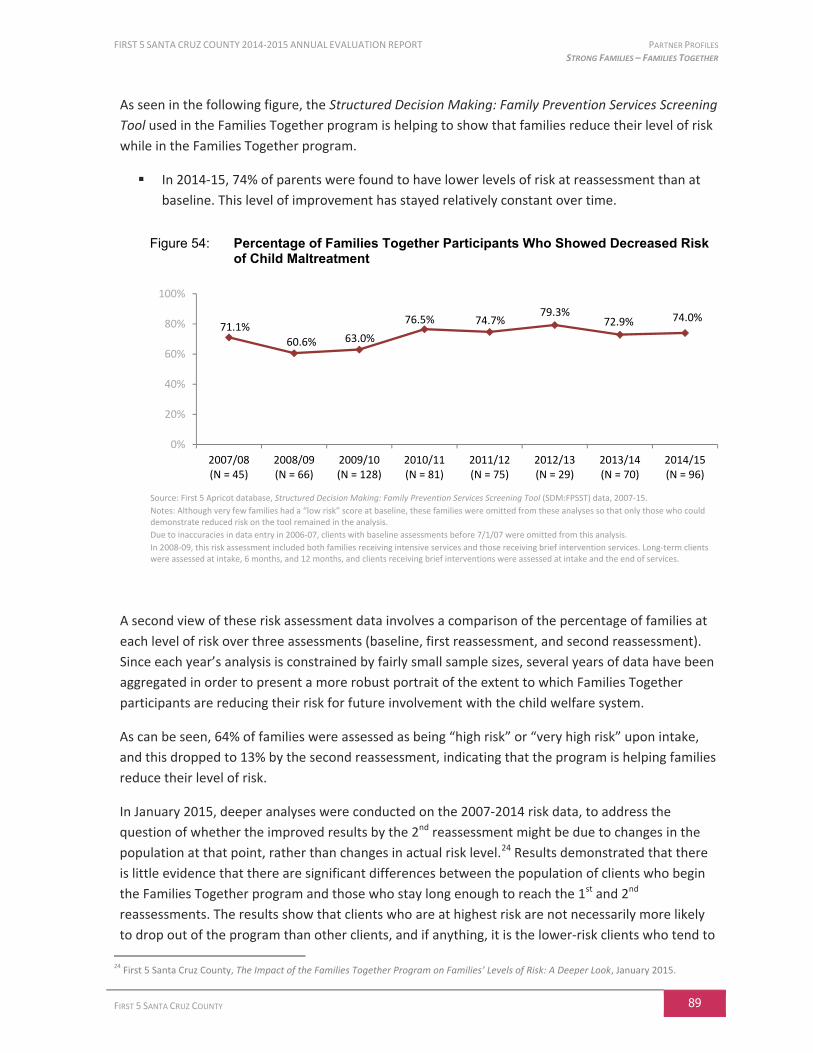
FIRST 5 SANTA CRUZ COUNTY 2014-2015 ANNUAL EVALUATION REPORT PARTNER PROFILES STRONG FAMILIES – FAMILIES TOGETHER
FIRST 5 SANTA CRUZ COUNTY 89
As seen in the following figure, the Structured Decision Making: Family Prevention Services Screening
Tool used in the Families Together program is helping to show that families reduce their level of risk
while in the Families Together program.
In 2014-15, 74% of parents were found to have lower levels of risk at reassessment than at
baseline. This level of improvement has stayed relatively constant over time.
Figure 54: Percentage of Families Together Participants Who Showed Decreased Risk of Child Maltreatment
Source: First 5 Apricot database, Structured Decision Making: Family Prevention Services Screening Tool (SDM:FPSST) data, 2007-15.
Notes: Although very few families had a “low risk” score at baseline, these families were omitted from these analyses so that only those who could demonstrate reduced risk on the tool remained in the analysis.
Due to inaccuracies in data entry in 2006-07, clients with baseline assessments before 7/1/07 were omitted from this analysis.
In 2008-09, this risk assessment included both families receiving intensive services and those receiving brief intervention services. Long-term clients were assessed at intake, 6 months, and 12 months, and clients receiving brief interventions were assessed at intake and the end of services.
A second view of these risk assessment data involves a comparison of the percentage of families at
each level of risk over three assessments (baseline, first reassessment, and second reassessment).
Since each year’s analysis is constrained by fairly small sample sizes, several years of data have been
aggregated in order to present a more robust portrait of the extent to which Families Together
participants are reducing their risk for future involvement with the child welfare system.
As can be seen, 64% of families were assessed as being “high risk” or “very high risk” upon intake,
and this dropped to 13% by the second reassessment, indicating that the program is helping families
reduce their level of risk.
In January 2015, deeper analyses were conducted on the 2007-2014 risk data, to address the
question of whether the improved results by the 2nd reassessment might be due to changes in the
population at that point, rather than changes in actual risk level.24 Results demonstrated that there
is little evidence that there are significant differences between the population of clients who begin
the Families Together program and those who stay long enough to reach the 1st and 2nd
reassessments. The results show that clients who are at highest risk are not necessarily more likely
to drop out of the program than other clients, and if anything, it is the lower-risk clients who tend to
24
First 5 Santa Cruz County, The Impact of the Families Together Program on Families’ Levels of Risk: A Deeper Look, January 2015.
71.1%
60.6% 63.0%
76.5% 74.7%79.3%
72.9% 74.0%
0%
20%
40%
60%
80%
100%
2007/08(N = 45)
2008/09(N = 66)
2009/10(N = 128)
2010/11(N = 81)
2011/12(N = 75)
2012/13(N = 29)
2013/14(N = 70)
2014/15(N = 96)
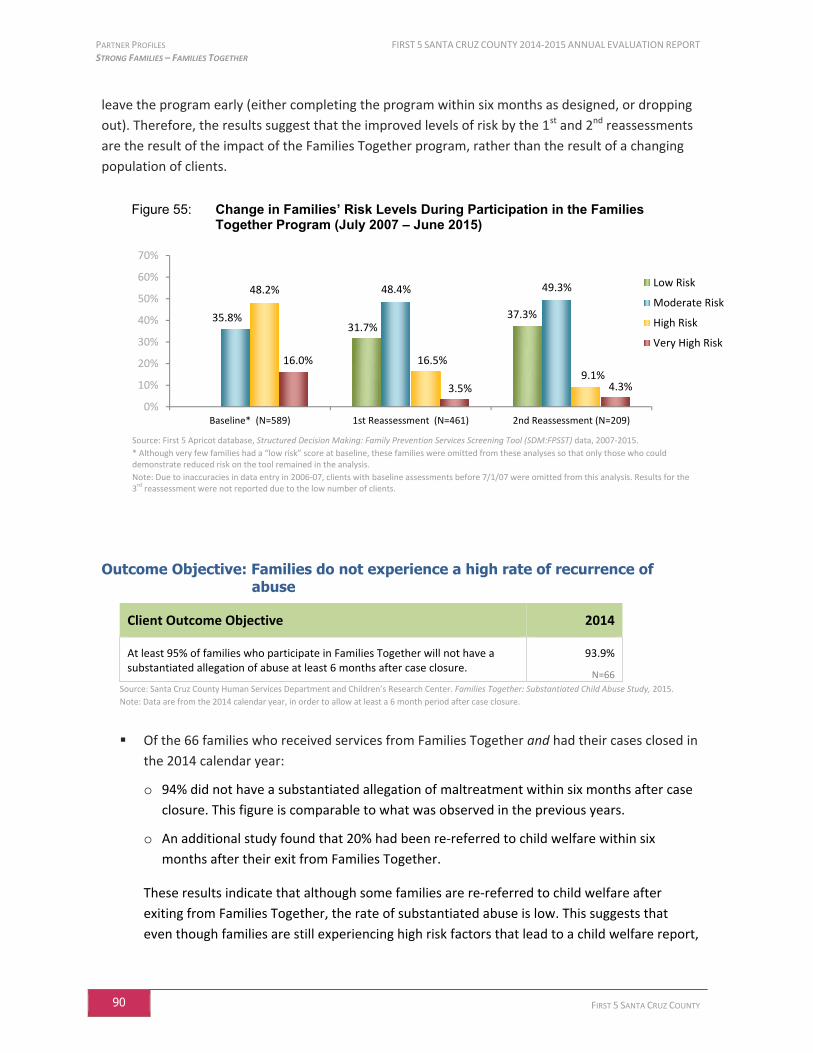
PARTNER PROFILES FIRST 5 SANTA CRUZ COUNTY 2014-2015 ANNUAL EVALUATION REPORT STRONG FAMILIES – FAMILIES TOGETHER
90 FIRST 5 SANTA CRUZ COUNTY
leave the program early (either completing the program within six months as designed, or dropping
out). Therefore, the results suggest that the improved levels of risk by the 1st and 2nd reassessments
are the result of the impact of the Families Together program, rather than the result of a changing
population of clients.
Figure 55: Change in Families’ Risk Levels During Participation in the Families Together Program (July 2007 – June 2015)
Source: First 5 Apricot database, Structured Decision Making: Family Prevention Services Screening Tool (SDM:FPSST) data, 2007-2015.
* Although very few families had a “low risk” score at baseline, these families were omitted from these analyses so that only those who could demonstrate reduced risk on the tool remained in the analysis.
Note: Due to inaccuracies in data entry in 2006-07, clients with baseline assessments before 7/1/07 were omitted from this analysis. Results for the 3rd reassessment were not reported due to the low number of clients.
Outcome Objective: Families do not experience a high rate of recurrence of abuse
Client Outcome Objective 2014
At least 95% of families who participate in Families Together will not have a substantiated allegation of abuse at least 6 months after case closure.
93.9%
N=66
Source: Santa Cruz County Human Services Department and Children’s Research Center. Families Together: Substantiated Child Abuse Study, 2015.
Note: Data are from the 2014 calendar year, in order to allow at least a 6 month period after case closure.
Of the 66 families who received services from Families Together and had their cases closed in
the 2014 calendar year:
o 94% did not have a substantiated allegation of maltreatment within six months after case
closure. This figure is comparable to what was observed in the previous years.
o An additional study found that 20% had been re-referred to child welfare within six
months after their exit from Families Together.
These results indicate that although some families are re-referred to child welfare after
exiting from Families Together, the rate of substantiated abuse is low. This suggests that
even though families are still experiencing high risk factors that lead to a child welfare report,
31.7%37.3%35.8%
48.4% 49.3%48.2%
16.5%
9.1%16.0%
3.5% 4.3%
0%
10%
20%
30%
40%
50%
60%
70%
Baseline* (N=589) 1st Reassessment (N=461) 2nd Reassessment (N=209)
Low Risk
Moderate Risk
High Risk
Very High Risk
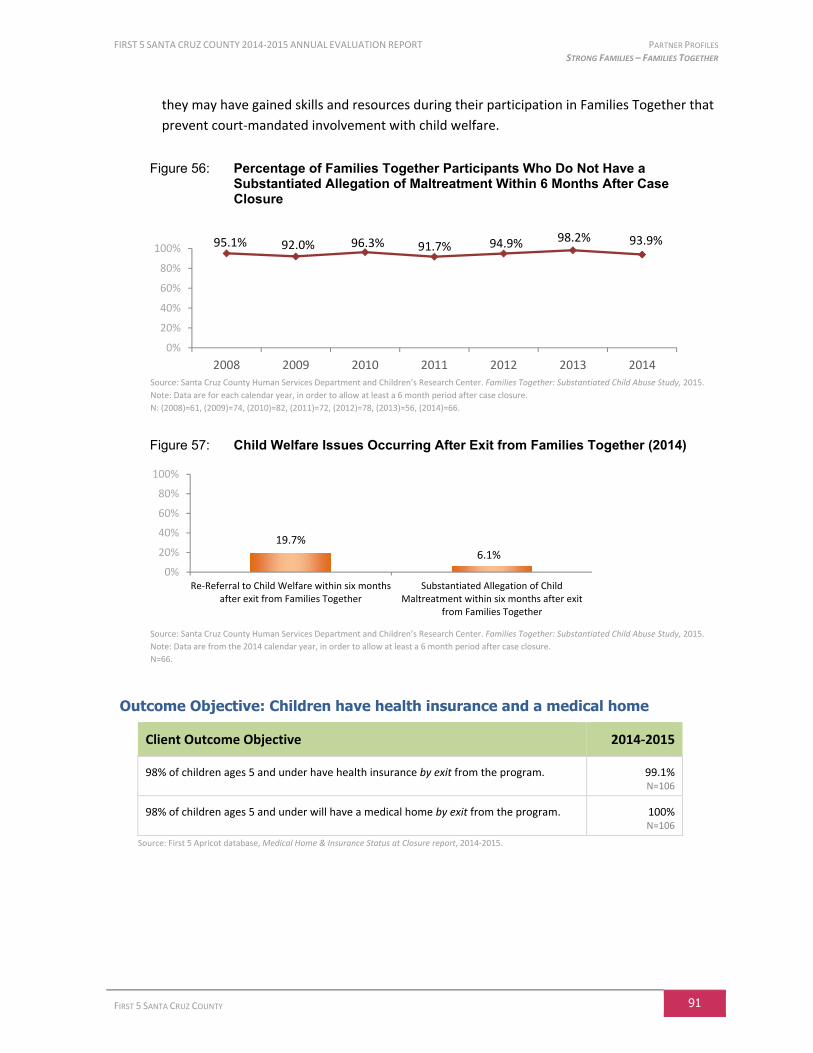
FIRST 5 SANTA CRUZ COUNTY 2014-2015 ANNUAL EVALUATION REPORT PARTNER PROFILES STRONG FAMILIES – FAMILIES TOGETHER
FIRST 5 SANTA CRUZ COUNTY 91
they may have gained skills and resources during their participation in Families Together that
prevent court-mandated involvement with child welfare.
Figure 56: Percentage of Families Together Participants Who Do Not Have a Substantiated Allegation of Maltreatment Within 6 Months After Case Closure
Source: Santa Cruz County Human Services Department and Children’s Research Center. Families Together: Substantiated Child Abuse Study, 2015.
Note: Data are for each calendar year, in order to allow at least a 6 month period after case closure.
N: (2008)=61, (2009)=74, (2010)=82, (2011)=72, (2012)=78, (2013)=56, (2014)=66.
Figure 57: Child Welfare Issues Occurring After Exit from Families Together (2014)
Source: Santa Cruz County Human Services Department and Children’s Research Center. Families Together: Substantiated Child Abuse Study, 2015.
Note: Data are from the 2014 calendar year, in order to allow at least a 6 month period after case closure.
N=66.
Outcome Objective: Children have health insurance and a medical home
Client Outcome Objective 2014-2015
98% of children ages 5 and under have health insurance by exit from the program. 99.1% N=106
98% of children ages 5 and under will have a medical home by exit from the program. 100% N=106
Source: First 5 Apricot database, Medical Home & Insurance Status at Closure report, 2014-2015.
95.1% 92.0% 96.3% 91.7% 94.9% 98.2% 93.9%
0%
20%
40%
60%
80%
100%
2008 2009 2010 2011 2012 2013 2014
19.7%
6.1%
0%
20%
40%
60%
80%
100%
Re-Referral to Child Welfare within six monthsafter exit from Families Together
Substantiated Allegation of ChildMaltreatment within six months after exit
from Families Together
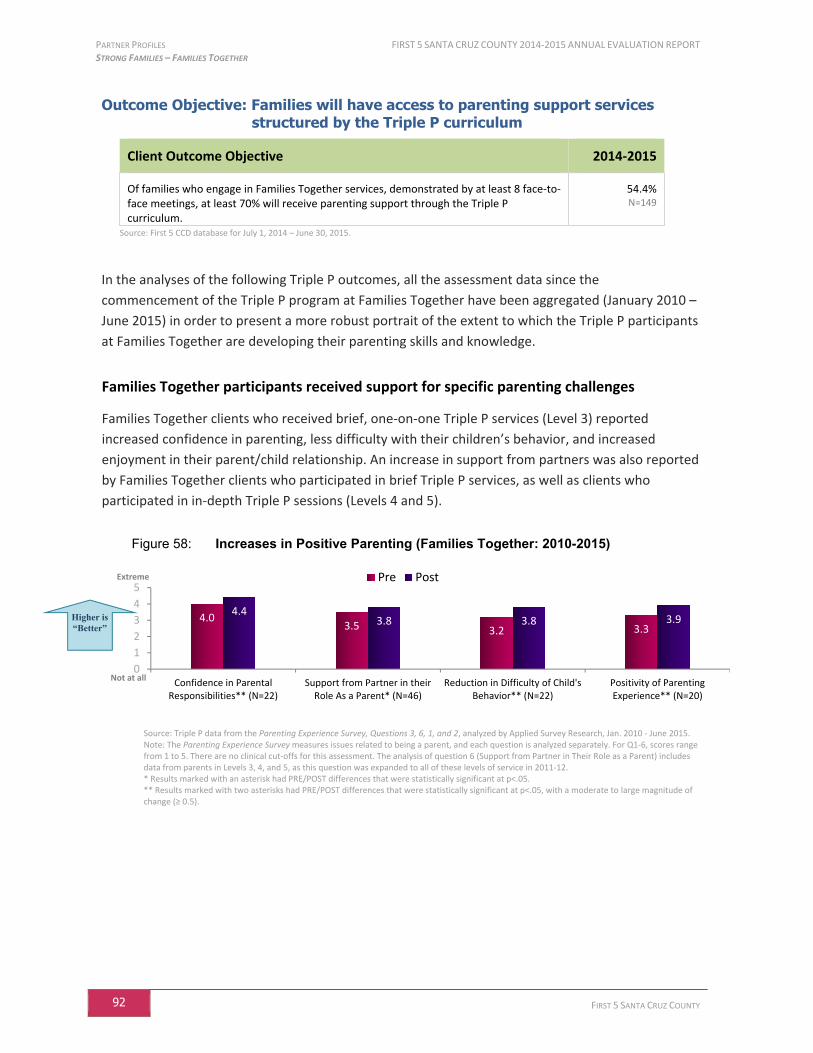
PARTNER PROFILES FIRST 5 SANTA CRUZ COUNTY 2014-2015 ANNUAL EVALUATION REPORT STRONG FAMILIES – FAMILIES TOGETHER
92 FIRST 5 SANTA CRUZ COUNTY
Outcome Objective: Families will have access to parenting support services structured by the Triple P curriculum
Client Outcome Objective 2014-2015
Of families who engage in Families Together services, demonstrated by at least 8 face-to-face meetings, at least 70% will receive parenting support through the Triple P curriculum.
54.4% N=149
Source: First 5 CCD database for July 1, 2014 – June 30, 2015.
In the analyses of the following Triple P outcomes, all the assessment data since the
commencement of the Triple P program at Families Together have been aggregated (January 2010 –
June 2015) in order to present a more robust portrait of the extent to which the Triple P participants
at Families Together are developing their parenting skills and knowledge.
Families Together participants received support for specific parenting challenges
Families Together clients who received brief, one-on-one Triple P services (Level 3) reported
increased confidence in parenting, less difficulty with their children’s behavior, and increased
enjoyment in their parent/child relationship. An increase in support from partners was also reported
by Families Together clients who participated in brief Triple P services, as well as clients who
participated in in-depth Triple P sessions (Levels 4 and 5).
Figure 58: Increases in Positive Parenting (Families Together: 2010-2015)
Source: Triple P data from the Parenting Experience Survey, Questions 3, 6, 1, and 2, analyzed by Applied Survey Research, Jan. 2010 - June 2015. Note: The Parenting Experience Survey measures issues related to being a parent, and each question is analyzed separately. For Q1-6, scores range from 1 to 5. There are no clinical cut-offs for this assessment. The analysis of question 6 (Support from Partner in Their Role as a Parent) includes data from parents in Levels 3, 4, and 5, as this question was expanded to all of these levels of service in 2011-12. * Results marked with an asterisk had PRE/POST differences that were statistically significant at p<.05. ** Results marked with two asterisks had PRE/POST differences that were statistically significant at p<.05, with a moderate to large magnitude of change (≥ 0.5).
4.03.5 3.2 3.3
4.43.8 3.8 3.9
0
1
2
3
4
5
Confidence in ParentalResponsibilities** (N=22)
Support from Partner in theirRole As a Parent* (N=46)
Reduction in Difficulty of Child'sBehavior** (N=22)
Positivity of ParentingExperience** (N=20)
Pre PostExtreme
Not at all
Higher is “Better”
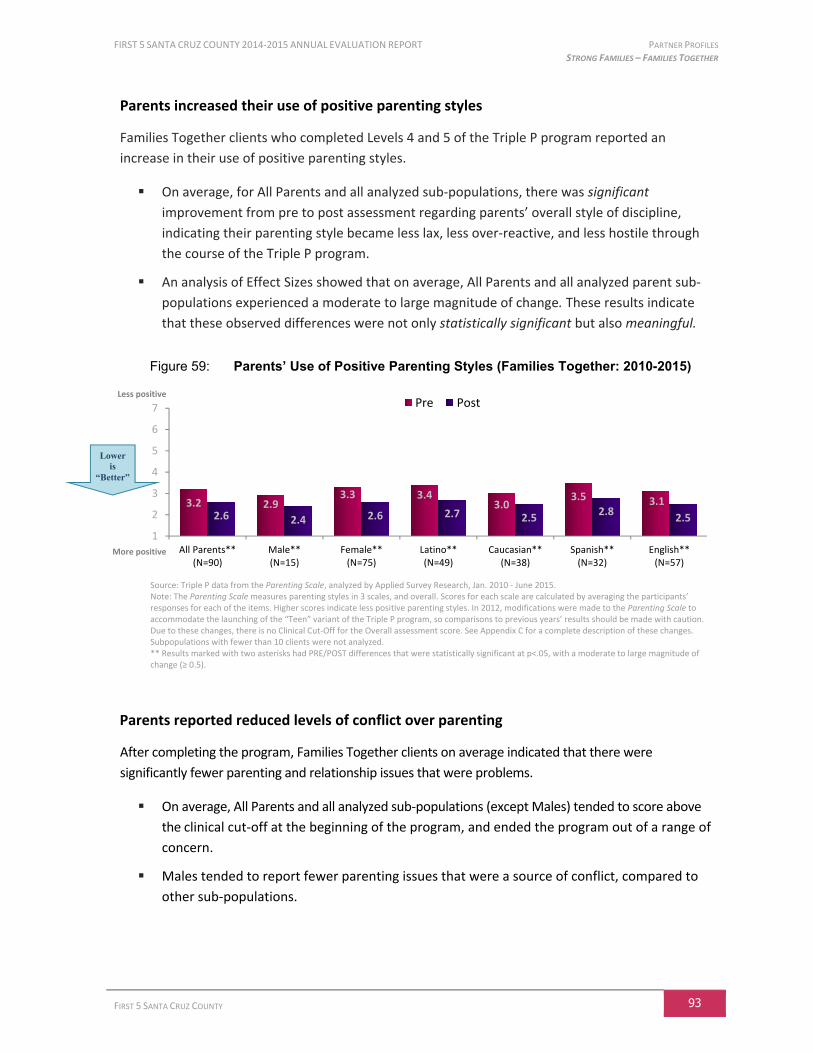
FIRST 5 SANTA CRUZ COUNTY 2014-2015 ANNUAL EVALUATION REPORT PARTNER PROFILES STRONG FAMILIES – FAMILIES TOGETHER
FIRST 5 SANTA CRUZ COUNTY 93
Parents increased their use of positive parenting styles
Families Together clients who completed Levels 4 and 5 of the Triple P program reported an
increase in their use of positive parenting styles.
On average, for All Parents and all analyzed sub-populations, there was significant
improvement from pre to post assessment regarding parents’ overall style of discipline,
indicating their parenting style became less lax, less over-reactive, and less hostile through
the course of the Triple P program.
An analysis of Effect Sizes showed that on average, All Parents and all analyzed parent sub-
populations experienced a moderate to large magnitude of change. These results indicate
that these observed differences were not only statistically significant but also meaningful.
Figure 59: Parents’ Use of Positive Parenting Styles (Families Together: 2010-2015)
Source: Triple P data from the Parenting Scale, analyzed by Applied Survey Research, Jan. 2010 - June 2015. Note: The Parenting Scale measures parenting styles in 3 scales, and overall. Scores for each scale are calculated by averaging the participants’ responses for each of the items. Higher scores indicate less positive parenting styles. In 2012, modifications were made to the Parenting Scale to accommodate the launching of the “Teen” variant of the Triple P program, so comparisons to previous years’ results should be made with caution. Due to these changes, there is no Clinical Cut-Off for the Overall assessment score. See Appendix C for a complete description of these changes. Subpopulations with fewer than 10 clients were not analyzed. ** Results marked with two asterisks had PRE/POST differences that were statistically significant at p<.05, with a moderate to large magnitude of change (≥ 0.5).
Parents reported reduced levels of conflict over parenting
After completing the program, Families Together clients on average indicated that there were
significantly fewer parenting and relationship issues that were problems.
On average, All Parents and all analyzed sub-populations (except Males) tended to score above
the clinical cut-off at the beginning of the program, and ended the program out of a range of
concern.
Males tended to report fewer parenting issues that were a source of conflict, compared to
other sub-populations.
3.2 2.93.3 3.4
3.03.5 3.1
2.6 2.4 2.6 2.7 2.52.8
2.5
1
2
3
4
5
6
7
All Parents**(N=90)
Male**(N=15)
Female**(N=75)
Latino**(N=49)
Caucasian**(N=38)
Spanish**(N=32)
English**(N=57)
Pre PostLess positive
More positive
Lower is
“Better”
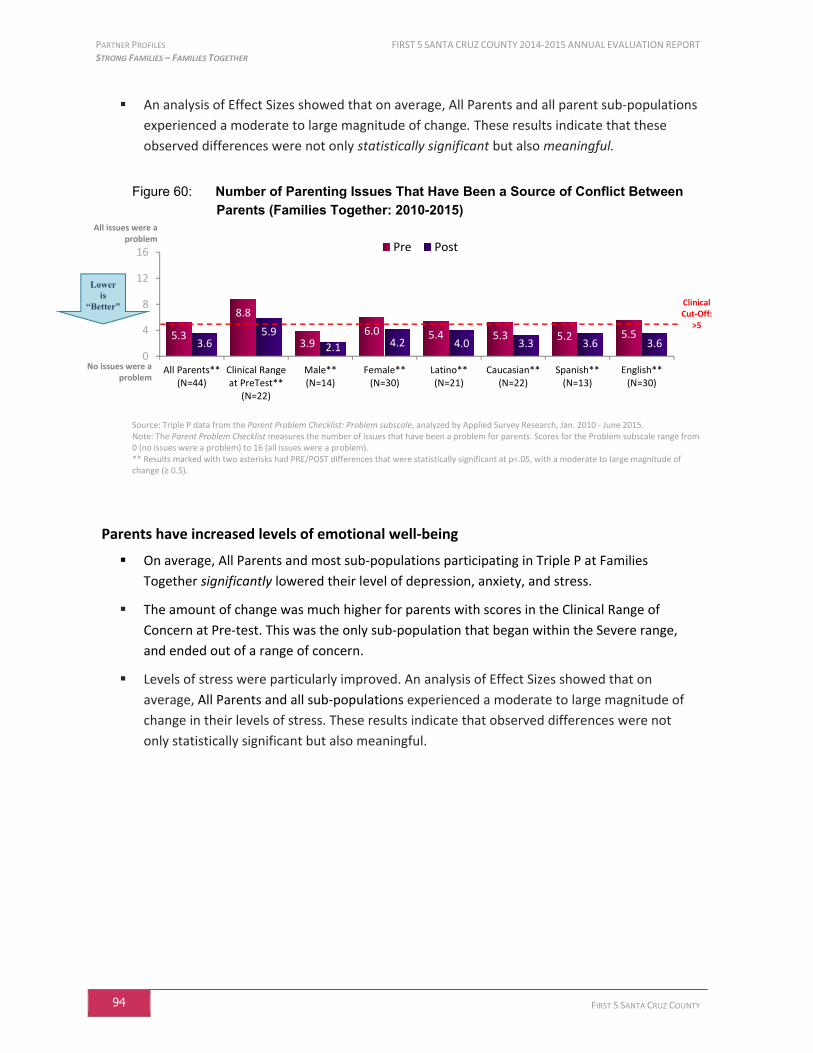
PARTNER PROFILES FIRST 5 SANTA CRUZ COUNTY 2014-2015 ANNUAL EVALUATION REPORT STRONG FAMILIES – FAMILIES TOGETHER
94 FIRST 5 SANTA CRUZ COUNTY
An analysis of Effect Sizes showed that on average, All Parents and all parent sub-populations
experienced a moderate to large magnitude of change. These results indicate that these
observed differences were not only statistically significant but also meaningful.
Figure 60: Number of Parenting Issues That Have Been a Source of Conflict Between
Parents (Families Together: 2010-2015)
Source: Triple P data from the Parent Problem Checklist: Problem subscale, analyzed by Applied Survey Research, Jan. 2010 - June 2015. Note: The Parent Problem Checklist measures the number of issues that have been a problem for parents. Scores for the Problem subscale range from 0 (no issues were a problem) to 16 (all issues were a problem). ** Results marked with two asterisks had PRE/POST differences that were statistically significant at p<.05, with a moderate to large magnitude of change (≥ 0.5).
Parents have increased levels of emotional well-being
On average, All Parents and most sub-populations participating in Triple P at Families
Together significantly lowered their level of depression, anxiety, and stress.
The amount of change was much higher for parents with scores in the Clinical Range of
Concern at Pre-test. This was the only sub-population that began within the Severe range,
and ended out of a range of concern.
Levels of stress were particularly improved. An analysis of Effect Sizes showed that on
average, All Parents and all sub-populations experienced a moderate to large magnitude of
change in their levels of stress. These results indicate that observed differences were not
only statistically significant but also meaningful.
5.3
8.8
3.96.0 5.4 5.3 5.2 5.5
3.65.9
2.1 4.2 4.0 3.3 3.6 3.60
4
8
12
16
All Parents**(N=44)
Clinical Rangeat PreTest**
(N=22)
Male**(N=14)
Female**(N=30)
Latino**(N=21)
Caucasian**(N=22)
Spanish**(N=13)
English**(N=30)
Pre Post
No issues were a problem
Clinical Cut-Off:
>5
Lower is
“Better”
All issues were a problem
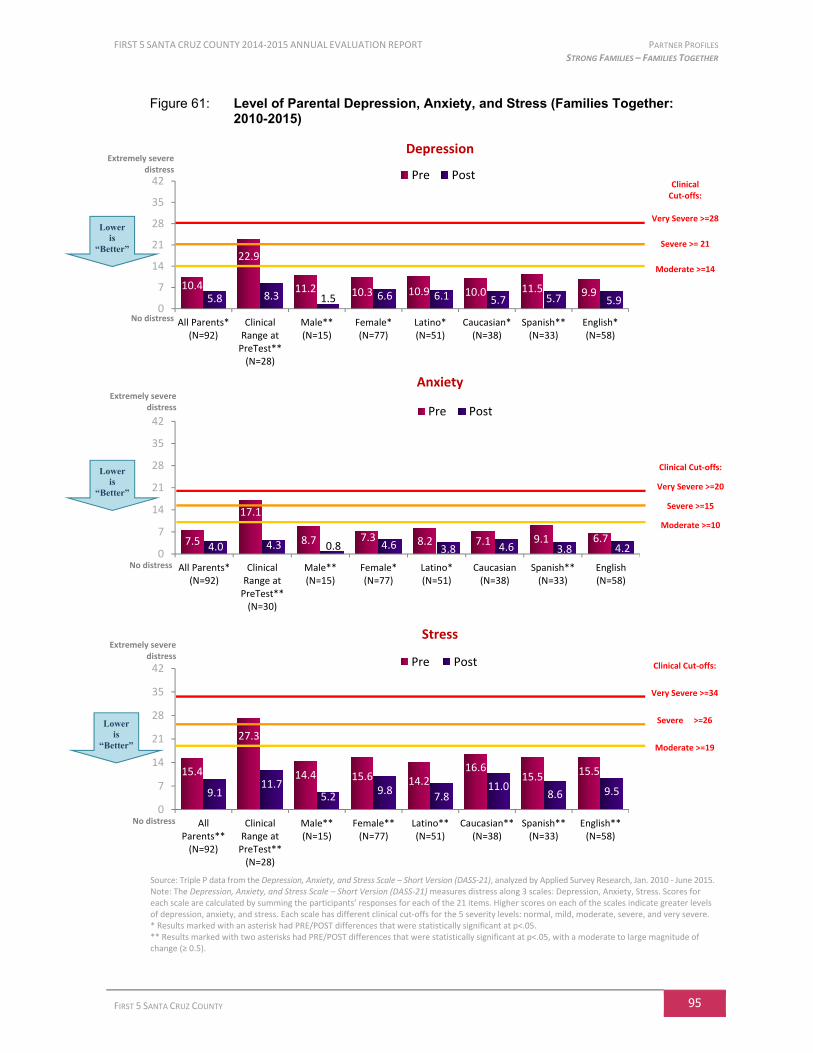
FIRST 5 SANTA CRUZ COUNTY 2014-2015 ANNUAL EVALUATION REPORT PARTNER PROFILES STRONG FAMILIES – FAMILIES TOGETHER
FIRST 5 SANTA CRUZ COUNTY 95
Figure 61: Level of Parental Depression, Anxiety, and Stress (Families Together: 2010-2015)
Depression
Anxiety
Stress
Source: Triple P data from the Depression, Anxiety, and Stress Scale – Short Version (DASS-21), analyzed by Applied Survey Research, Jan. 2010 - June 2015. Note: The Depression, Anxiety, and Stress Scale – Short Version (DASS-21) measures distress along 3 scales: Depression, Anxiety, Stress. Scores for each scale are calculated by summing the participants’ responses for each of the 21 items. Higher scores on each of the scales indicate greater levels of depression, anxiety, and stress. Each scale has different clinical cut-offs for the 5 severity levels: normal, mild, moderate, severe, and very severe. * Results marked with an asterisk had PRE/POST differences that were statistically significant at p<.05. ** Results marked with two asterisks had PRE/POST differences that were statistically significant at p<.05, with a moderate to large magnitude of change (≥ 0.5).
10.4
22.9
11.2 10.3 10.9 10.0 11.5 9.95.8 8.3 1.5 6.6 6.1 5.7 5.7 5.9
0
7
14
21
28
35
42
All Parents*(N=92)
ClinicalRange at
PreTest**(N=28)
Male**(N=15)
Female*(N=77)
Latino*(N=51)
Caucasian*(N=38)
Spanish**(N=33)
English*(N=58)
Pre Post
7.5
17.1
8.7 7.3 8.2 7.1 9.1 6.74.0 4.3 0.8 4.6 3.8 4.6 3.8 4.20
7
14
21
28
35
42
All Parents*(N=92)
ClinicalRange at
PreTest**(N=30)
Male**(N=15)
Female*(N=77)
Latino*(N=51)
Caucasian(N=38)
Spanish**(N=33)
English(N=58)
Pre Post
15.4
27.3
14.4 15.6 14.216.6
15.5 15.5
9.111.7
5.29.8
7.811.0
8.6 9.5
0
7
14
21
28
35
42
AllParents**
(N=92)
ClinicalRange at
PreTest**(N=28)
Male**(N=15)
Female**(N=77)
Latino**(N=51)
Caucasian**(N=38)
Spanish**(N=33)
English**(N=58)
Pre Post
Extremely severe distress
No distress
Clinical Cut-offs:
Very Severe >=28
Severe >= 21
Moderate >=14
Extremely severe distress
No distress
Clinical Cut-offs:
Very Severe >=20
Severe >=15
Moderate >=10
Extremely severe distress
No distress
Clinical Cut-offs:
Very Severe >=34
Severe >=26
Moderate >=19
Lower is
“Better”
Lower is
“Better”
Lower is
“Better”
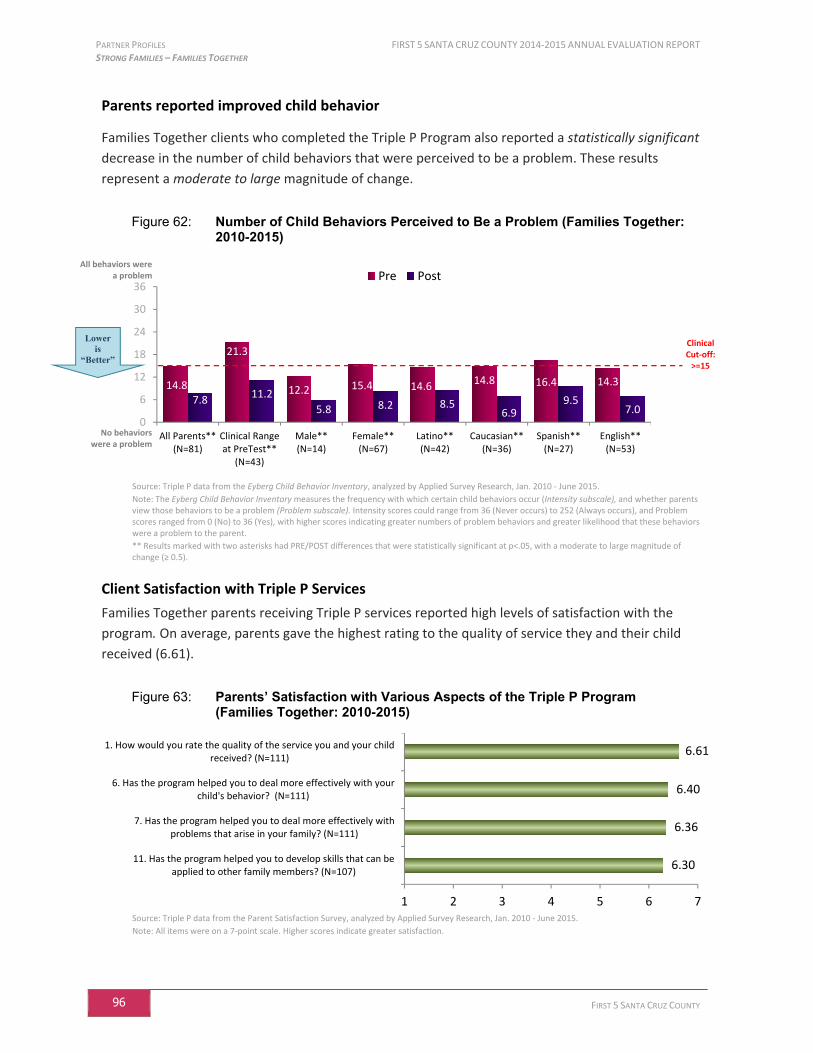
PARTNER PROFILES FIRST 5 SANTA CRUZ COUNTY 2014-2015 ANNUAL EVALUATION REPORT STRONG FAMILIES – FAMILIES TOGETHER
96 FIRST 5 SANTA CRUZ COUNTY
Parents reported improved child behavior
Families Together clients who completed the Triple P Program also reported a statistically significant
decrease in the number of child behaviors that were perceived to be a problem. These results
represent a moderate to large magnitude of change.
Figure 62: Number of Child Behaviors Perceived to Be a Problem (Families Together: 2010-2015)
Source: Triple P data from the Eyberg Child Behavior Inventory, analyzed by Applied Survey Research, Jan. 2010 - June 2015.
Note: The Eyberg Child Behavior Inventory measures the frequency with which certain child behaviors occur (Intensity subscale), and whether parents view those behaviors to be a problem (Problem subscale). Intensity scores could range from 36 (Never occurs) to 252 (Always occurs), and Problem scores ranged from 0 (No) to 36 (Yes), with higher scores indicating greater numbers of problem behaviors and greater likelihood that these behaviors were a problem to the parent.
** Results marked with two asterisks had PRE/POST differences that were statistically significant at p<.05, with a moderate to large magnitude of change (≥ 0.5).
Client Satisfaction with Triple P Services
Families Together parents receiving Triple P services reported high levels of satisfaction with the
program. On average, parents gave the highest rating to the quality of service they and their child
received (6.61).
Figure 63: Parents’ Satisfaction with Various Aspects of the Triple P Program (Families Together: 2010-2015)
Source: Triple P data from the Parent Satisfaction Survey, analyzed by Applied Survey Research, Jan. 2010 - June 2015.
Note: All items were on a 7-point scale. Higher scores indicate greater satisfaction.
14.8
21.3
12.2 15.4 14.6 14.8 16.4 14.3
7.811.2
5.8 8.2 8.56.9
9.57.0
0
6
12
18
24
30
36
All Parents**(N=81)
Clinical Rangeat PreTest**
(N=43)
Male**(N=14)
Female**(N=67)
Latino**(N=42)
Caucasian**(N=36)
Spanish**(N=27)
English**(N=53)
Pre Post
6.30
6.36
6.40
6.61
1 2 3 4 5 6 7
11. Has the program helped you to develop skills that can beapplied to other family members? (N=107)
7. Has the program helped you to deal more effectively withproblems that arise in your family? (N=111)
6. Has the program helped you to deal more effectively with yourchild's behavior? (N=111)
1. How would you rate the quality of the service you and your childreceived? (N=111)
All behaviors were a problem
No behaviors were a problem
Clinical Cut-off:
>=15
Lower is
“Better”
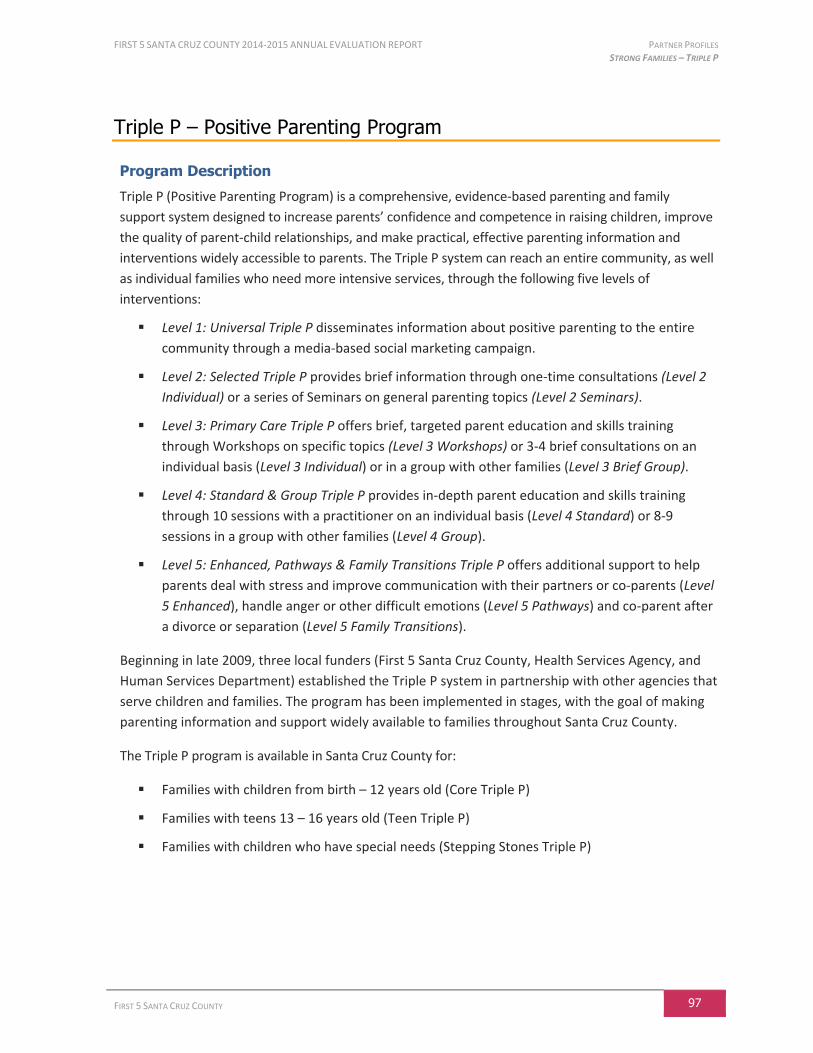
FIRST 5 SANTA CRUZ COUNTY 2014-2015 ANNUAL EVALUATION REPORT PARTNER PROFILES STRONG FAMILIES – TRIPLE P
FIRST 5 SANTA CRUZ COUNTY 97
Triple P – Positive Parenting Program
Program Description
Triple P (Positive Parenting Program) is a comprehensive, evidence-based parenting and family
support system designed to increase parents’ confidence and competence in raising children, improve
the quality of parent-child relationships, and make practical, effective parenting information and
interventions widely accessible to parents. The Triple P system can reach an entire community, as well
as individual families who need more intensive services, through the following five levels of
interventions:
Level 1: Universal Triple P disseminates information about positive parenting to the entire
community through a media-based social marketing campaign.
Level 2: Selected Triple P provides brief information through one-time consultations (Level 2
Individual) or a series of Seminars on general parenting topics (Level 2 Seminars).
Level 3: Primary Care Triple P offers brief, targeted parent education and skills training
through Workshops on specific topics (Level 3 Workshops) or 3-4 brief consultations on an
individual basis (Level 3 Individual) or in a group with other families (Level 3 Brief Group).
Level 4: Standard & Group Triple P provides in-depth parent education and skills training
through 10 sessions with a practitioner on an individual basis (Level 4 Standard) or 8-9
sessions in a group with other families (Level 4 Group).
Level 5: Enhanced, Pathways & Family Transitions Triple P offers additional support to help
parents deal with stress and improve communication with their partners or co-parents (Level
5 Enhanced), handle anger or other difficult emotions (Level 5 Pathways) and co-parent after
a divorce or separation (Level 5 Family Transitions).
Beginning in late 2009, three local funders (First 5 Santa Cruz County, Health Services Agency, and
Human Services Department) established the Triple P system in partnership with other agencies that
serve children and families. The program has been implemented in stages, with the goal of making
parenting information and support widely available to families throughout Santa Cruz County.
The Triple P program is available in Santa Cruz County for:
Families with children from birth – 12 years old (Core Triple P)
Families with teens 13 – 16 years old (Teen Triple P)
Families with children who have special needs (Stepping Stones Triple P)

PARTNER PROFILES FIRST 5 SANTA CRUZ COUNTY 2014-2015 ANNUAL EVALUATION REPORT STRONG FAMILIES – TRIPLE P
98 FIRST 5 SANTA CRUZ COUNTY
Snapshot of 2014-15 Triple P Implementation and Results in Santa Cruz County
Level 1: Universal – Social Marketing Campaign
Branding & Messaging: Continued to raise awareness of Triple P through earned media, paid advertisements, event
sponsorships, social media, and video PSAs
Web site: Received 313 online registrations for Triple P classes
Triple P Warmline/Email/Facebook: Received 103 requests for Triple P information and services
Parenting Pocket Guides: Distributed approximately 8,500 bilingual Triple P parenting pocket guides
Articles: Disseminated monthly articles with parenting tips in newspapers, web sites and Triple P Santa Cruz County's
e-newsletter
Triple P Santa Cruz County Facebook page: Gained 501 new fans
Positive Parenting Passport: Developed “passport” program to engage parents in Triple P and positive parenting
activities; Partnered with local businesses to sponsor prizes
Earned Media: Received free media coverage of Triple P classes and articles 157 times
Ads & Sponsorships: Promoted Triple P via bus ads, Highway 17 billboard, newspaper ads, and sponsorship of
Santa Cruz Warriors Kids' Dunk and Santa Cruz Children's Museum of Discovery Mobile Museum
Low Intensity
High Intensity
Level 2: Selected Individual & Seminar General information and tips for specific parenting concerns
314 parents participated in Seminars; 234 parents received 1-time consultations
17 accredited practitioners were available to provide Seminars
81 accredited practitioners were available to provide Level 2 Individual sessions (1-time consultations)
Parents report high levels of satisfaction with Seminars
Level 3: Primary Care Brief consultations and workshops about specific parenting concerns
Families showed significant improvements in children’s behavior, confidence in parenting skills, and
support from parenting partners.
746 parents participated in Workshops; 81 parents received brief support though individual or group
sessions
81 accredited practitioners were available to provide Level 3 brief parent consultations and
workshops
Parents reported high levels of satisfaction with these brief services
Level 4: Standard (Individual) & Group In-depth training in positive parenting skills
Families reported significant improvements in parenting style, child behavior, emotional
well-being and reduced conflict
Parents who had more serious parenting issues made the most meaningful changes in their
family life
385 parents received Level 4 Individual & Group services
69 accredited practitioners were available to provide Level 4 in-depth parenting support
Parents reported high levels of satisfaction with these services
Level 5: Enhanced, Pathways & Family Transitions Additional support for families
Families reported significant improvements in parenting style, child behavior,
and levels of conflict between parents
38 parents received Level 5 services
28 accredited practitioners were available to provide Level 5 specialized services
EXTE
NT
OF
REA
CH
INTO
TH
E C
OM
MU
NIT
Y
Broad Reach
Limited, Targeted
Reach
INTE
NSI
TY O
F SE
RV
ICES
FIRST 5 SANTA CRUZ COUNTY 2014-2015 ANNUAL EVALUATION REPORT PARTNER PROFILES STRONG FAMILIES – TRIPLE P
FIRST 5 SANTA CRUZ COUNTY 99
Triple P Highlights
Triple P’s population-based approach to parenting support provides the minimally sufficient level of
care for parents to enable them to independently manage their family issues. This section provides
an overview of how families in Santa Cruz County have been helped to receive the levels of support
that they needed through their participation in Triple P, and highlights some of the key
achievements in each of these levels.
Level 1: Universal
Activities and media strategies for Level 1 of Triple P are providing access to positive parenting
information and destigmatizing the need to get help for parenting issues. In 2014-15, First 5
continued to implement a robust social marketing campaign that included monthly parenting
articles published in Growing Up in Santa Cruz, Santa Cruz Parent, the Register-Pajaronian, Aptos-
Capitola-Soquel Life, and local Patches; video and radio PSAs in English and Spanish; flyers
promoting Triple P classes (Seminars, Workshops, Groups); regular posts on the Triple P Santa Cruz
County Facebook page; distribution of bilingual Parenting Pocket Guides for families with children
from birth to 12-years old, families with teens, and families with children with special needs; a
monthly e-newsletter; paid advertisements on radio stations, buses and the Highway 17 billboard;
free media coverage (“earned media”), sponsorships of local conferences and events; and
promotion of First 5 as a hub for information and assistance with accessing Triple P services. This
year First 5 also engaged parents in a local “Passport” program that offered prizes for participation
in various positive parenting activities.
Accessibility of information. Families are responding to Triple P messages in the media and
online. They are using First 5’s website to register for parenting classes and requesting
assistance with accessing Triple P services through the centralized “warmline,” Facebook, and
the Triple P email address.
Encouragement to participate. Since the beginning of the Triple P program, approximately
7,331 parents and 13,246 children have participated in Triple P services. Although these figures
may include duplicate counts of parents who participated in multiple services, it reflects the
widespread interest in—and reach of—this parenting program.
Client Participation in Triple P
Source: First 5, Triple P Master Client Data Collection Template, 2015 (analyzed by First 5 and Applied Survey Research).
THIS FUNDING CYCLE
2014-2015
CUMULATIVE TOTALS
2010-2015
Parents/Guardians 1,719 7,331
Children (all ages) 3,173 13,246

PARTNER PROFILES FIRST 5 SANTA CRUZ COUNTY 2014-2015 ANNUAL EVALUATION REPORT STRONG FAMILIES – TRIPLE P
100 FIRST 5 SANTA CRUZ COUNTY
Satisfaction with services. On average, parents rated the quality of services very high, noting
that they had received the help they wanted, were dealing more effectively with problems in
their family, and were able to apply the skills they learned to other family members.
Parents’ Satisfaction with Various Aspects of the Triple P Program (2010-2015)
Source: Triple P data from the Parent Satisfaction Survey, analyzed by Applied Survey Research, Jan. 2010 - June 2015.
Level 2: Selected (Individual & Seminars) & Level 3: Primary Care (Workshops)
The briefest forms of Triple P services are giving parents an opportunity to be introduced to Triple P
and providing easy access to general parenting support.
Gateway to more services. Over the past several years, analyses have consistently shown that
brief services are an effective way of getting parents initially engaged in the program, and gives
them an opportunity to participate in further services. Parents who attend Seminars and
Workshops frequently request follow-up services, and of parents who participate in multiple
services, those who begin with one or two brief consultations for specific parenting concerns are
likely to return later for in-depth consultations and multi-session programs.
Continued use of the skills they learned. On average, parents felt that the Seminars and
Workshops answered their questions, and that they would continue to use the strategies they
learned.
Seminar/Workshop Satisfaction Survey (2010-2015)
Source: Triple P data from the Seminar/Workshop Satisfaction Survey, analyzed by Applied Survey Research, Jan. 2010 - June 2015.
In fact, results from the July 2015 phone survey show that 54% of respondents who had
participated in a Workshop and 45% of respondents who had participated in a Seminar have
continued to use Triple P parenting strategies daily or almost daily.
6.26
6.34
6.43
6.48
1 2 3 4 5 6 7
11. Has the program helped you to develop skills that can beapplied to other family members? (N=1,055)
7. Has the program helped you to deal more effectively withproblems that arise in your family? (N=1,075)
6. Has the program helped you to deal more effectively with yourchild's behavior? (N=1,075)
1. How would you rate the quality of the service you and yourchild received? (N=1,074)
4.72
4.55
1 2 3 4 5
I am likely to use some of the parenting strategies inthe tip sheet. (N=3,827)
The seminar/workshop answered a question orconcern I have had about parenting. (N=3,834)
Highest Satisfaction
Lowest Satisfaction
Highest Satisfaction
Lowest Satisfaction
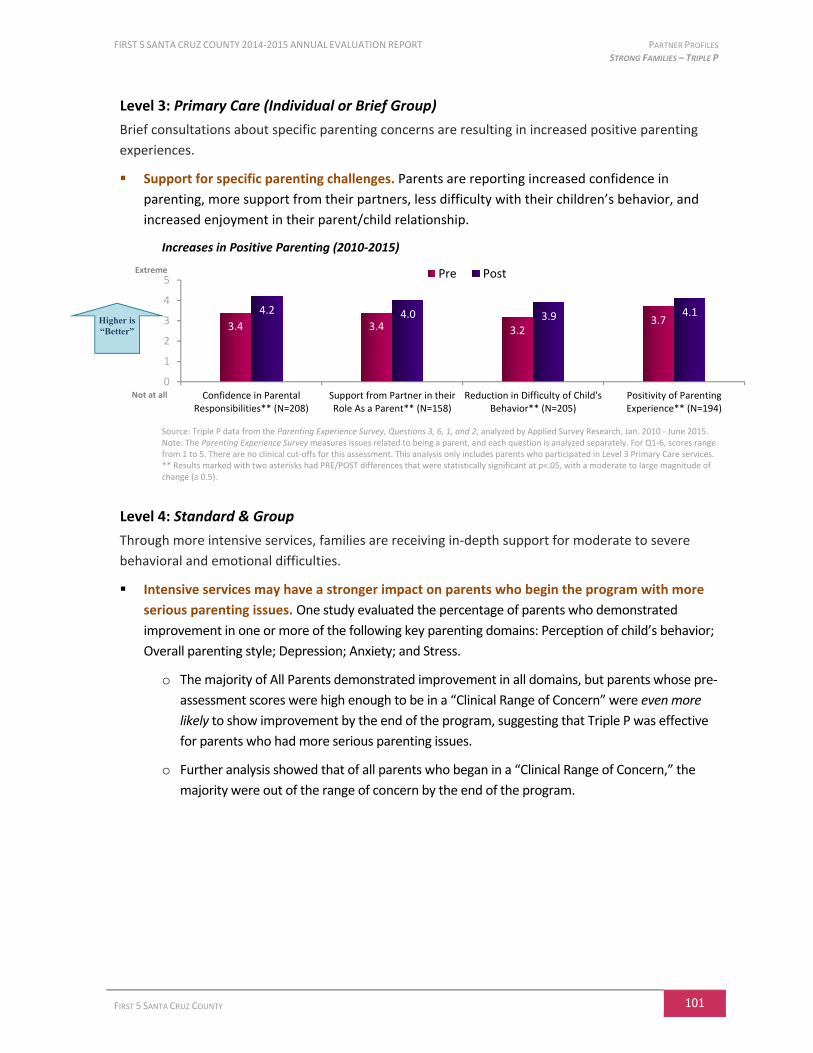
FIRST 5 SANTA CRUZ COUNTY 2014-2015 ANNUAL EVALUATION REPORT PARTNER PROFILES STRONG FAMILIES – TRIPLE P
FIRST 5 SANTA CRUZ COUNTY 101
Level 3: Primary Care (Individual or Brief Group)
Brief consultations about specific parenting concerns are resulting in increased positive parenting
experiences.
Support for specific parenting challenges. Parents are reporting increased confidence in
parenting, more support from their partners, less difficulty with their children’s behavior, and
increased enjoyment in their parent/child relationship.
Increases in Positive Parenting (2010-2015)
Source: Triple P data from the Parenting Experience Survey, Questions 3, 6, 1, and 2, analyzed by Applied Survey Research, Jan. 2010 - June 2015. Note: The Parenting Experience Survey measures issues related to being a parent, and each question is analyzed separately. For Q1-6, scores range from 1 to 5. There are no clinical cut-offs for this assessment. This analysis only includes parents who participated in Level 3 Primary Care services. ** Results marked with two asterisks had PRE/POST differences that were statistically significant at p<.05, with a moderate to large magnitude of change (≥ 0.5).
Level 4: Standard & Group
Through more intensive services, families are receiving in-depth support for moderate to severe
behavioral and emotional difficulties.
Intensive services may have a stronger impact on parents who begin the program with more
serious parenting issues. One study evaluated the percentage of parents who demonstrated
improvement in one or more of the following key parenting domains: Perception of child’s behavior;
Overall parenting style; Depression; Anxiety; and Stress.
o The majority of All Parents demonstrated improvement in all domains, but parents whose pre-
assessment scores were high enough to be in a “Clinical Range of Concern” were even more
likely to show improvement by the end of the program, suggesting that Triple P was effective
for parents who had more serious parenting issues.
o Further analysis showed that of all parents who began in a “Clinical Range of Concern,” the
majority were out of the range of concern by the end of the program.
3.4 3.4 3.23.7
4.2 4.0 3.9 4.1
0
1
2
3
4
5
Confidence in ParentalResponsibilities** (N=208)
Support from Partner in theirRole As a Parent** (N=158)
Reduction in Difficulty of Child'sBehavior** (N=205)
Positivity of ParentingExperience** (N=194)
Pre PostExtreme
Not at all
Higher is “Better”
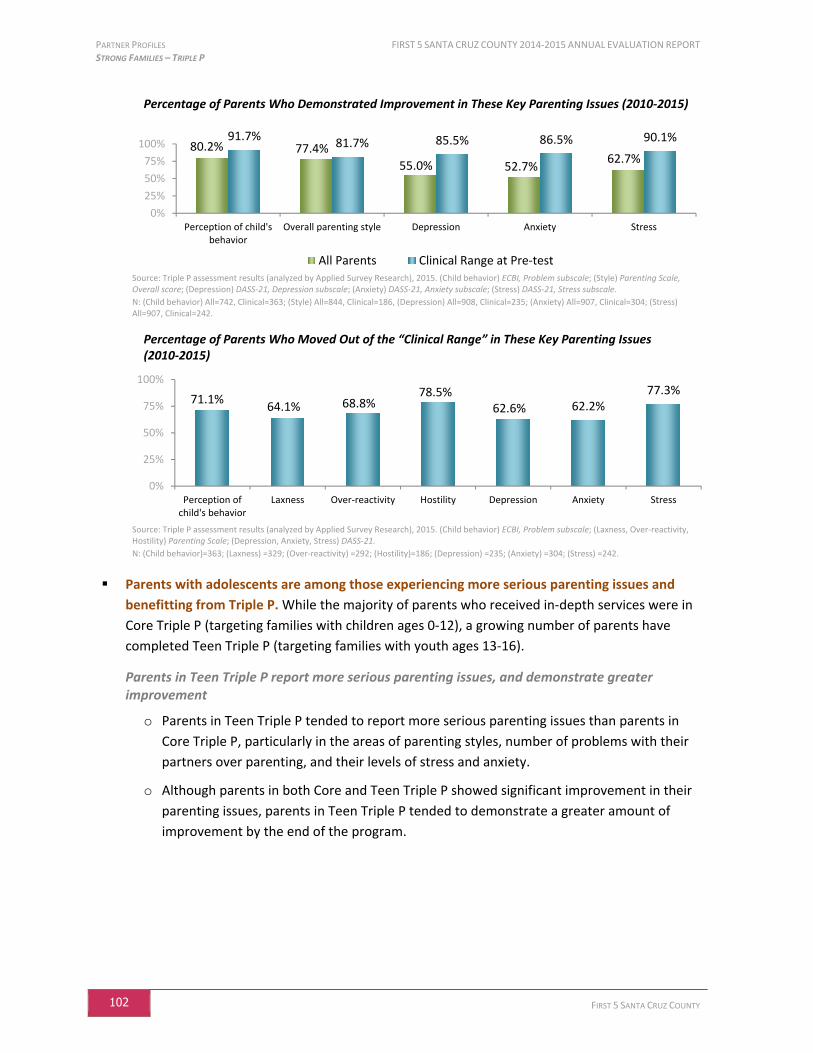
PARTNER PROFILES FIRST 5 SANTA CRUZ COUNTY 2014-2015 ANNUAL EVALUATION REPORT STRONG FAMILIES – TRIPLE P
102 FIRST 5 SANTA CRUZ COUNTY
Percentage of Parents Who Demonstrated Improvement in These Key Parenting Issues (2010-2015)
Source: Triple P assessment results (analyzed by Applied Survey Research), 2015. (Child behavior) ECBI, Problem subscale; (Style) Parenting Scale, Overall score; (Depression) DASS-21, Depression subscale; (Anxiety) DASS-21, Anxiety subscale; (Stress) DASS-21, Stress subscale.
N: (Child behavior) All=742, Clinical=363; (Style) All=844, Clinical=186, (Depression) All=908, Clinical=235; (Anxiety) All=907, Clinical=304; (Stress) All=907, Clinical=242.
Percentage of Parents Who Moved Out of the “Clinical Range” in These Key Parenting Issues (2010-2015)
Source: Triple P assessment results (analyzed by Applied Survey Research), 2015. (Child behavior) ECBI, Problem subscale; (Laxness, Over-reactivity, Hostility) Parenting Scale; (Depression, Anxiety, Stress) DASS-21.
N: (Child behavior)=363; (Laxness) =329; (Over-reactivity) =292; (Hostility)=186; (Depression) =235; (Anxiety) =304; (Stress) =242.
Parents with adolescents are among those experiencing more serious parenting issues and
benefitting from Triple P. While the majority of parents who received in-depth services were in
Core Triple P (targeting families with children ages 0-12), a growing number of parents have
completed Teen Triple P (targeting families with youth ages 13-16).
Parents in Teen Triple P report more serious parenting issues, and demonstrate greater improvement
o Parents in Teen Triple P tended to report more serious parenting issues than parents in
Core Triple P, particularly in the areas of parenting styles, number of problems with their
partners over parenting, and their levels of stress and anxiety.
o Although parents in both Core and Teen Triple P showed significant improvement in their
parenting issues, parents in Teen Triple P tended to demonstrate a greater amount of
improvement by the end of the program.
80.2% 77.4%
55.0% 52.7%62.7%
91.7%81.7% 85.5% 86.5% 90.1%
0%
25%
50%
75%
100%
Perception of child'sbehavior
Overall parenting style Depression Anxiety Stress
All Parents Clinical Range at Pre-test
71.1%64.1% 68.8%
78.5%62.6% 62.2%
77.3%
0%
25%
50%
75%
100%
Perception ofchild's behavior
Laxness Over-reactivity Hostility Depression Anxiety Stress
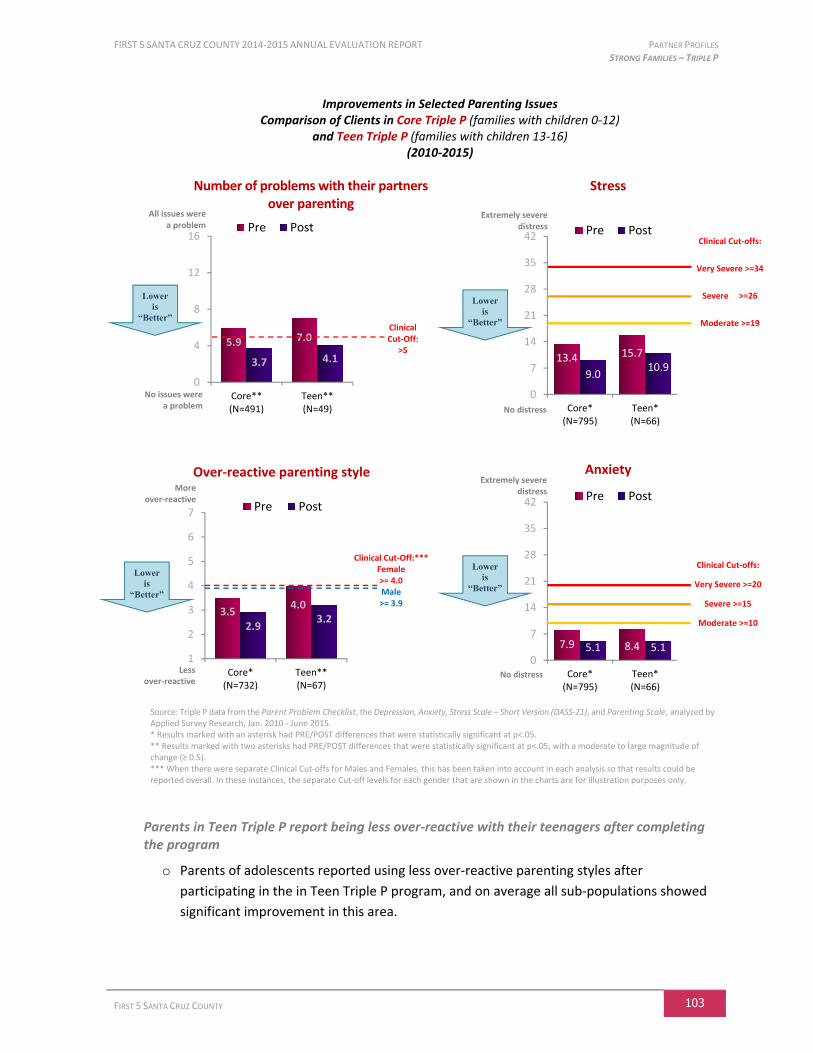
FIRST 5 SANTA CRUZ COUNTY 2014-2015 ANNUAL EVALUATION REPORT PARTNER PROFILES STRONG FAMILIES – TRIPLE P
FIRST 5 SANTA CRUZ COUNTY 103
Improvements in Selected Parenting Issues Comparison of Clients in Core Triple P (families with children 0-12)
and Teen Triple P (families with children 13-16) (2010-2015)
Number of problems with their partners over parenting
Stress
Over-reactive parenting style
Anxiety
Source: Triple P data from the Parent Problem Checklist, the Depression, Anxiety, Stress Scale – Short Version (DASS-21), and Parenting Scale, analyzed by Applied Survey Research, Jan. 2010 - June 2015. * Results marked with an asterisk had PRE/POST differences that were statistically significant at p<.05. ** Results marked with two asterisks had PRE/POST differences that were statistically significant at p<.05, with a moderate to large magnitude of change (≥ 0.5). *** When there were separate Clinical Cut-offs for Males and Females, this has been taken into account in each analysis so that results could be reported overall. In these instances, the separate Cut-off levels for each gender that are shown in the charts are for illustration purposes only.
Parents in Teen Triple P report being less over-reactive with their teenagers after completing the program
o Parents of adolescents reported using less over-reactive parenting styles after
participating in the in Teen Triple P program, and on average all sub-populations showed
significant improvement in this area.
5.9 7.0
3.7 4.1
0
4
8
12
16
Core**(N=491)
Teen**(N=49)
Pre Post
13.4 15.7
9.010.9
0
7
14
21
28
35
42
Core*(N=795)
Teen*(N=66)
Pre Post
3.54.0
2.93.2
1
2
3
4
5
6
7
Core*(N=732)
Teen**(N=67)
Pre Post
7.9 8.45.1 5.10
7
14
21
28
35
42
Core*(N=795)
Teen*(N=66)
Pre Post
Less over-reactive
Lower is
“Better”
Clinical Cut-Off:*** Female >= 4.0 Male >= 3.9
More over-reactive
Lower is
“Better” Clinical Cut-Off:
>5
All issues were a problem
No issues were a problem
Extremely severe distress
No distress
Lower is
“Better”
Clinical Cut-offs:
Very Severe >=34
Severe >=26
Moderate >=19
Extremely severe distress
No distress
Lower is
“Better”
Clinical Cut-offs:
Very Severe >=20
Severe >=15
Moderate >=10

PARTNER PROFILES FIRST 5 SANTA CRUZ COUNTY 2014-2015 ANNUAL EVALUATION REPORT STRONG FAMILIES – TRIPLE P
104 FIRST 5 SANTA CRUZ COUNTY
Parents Use of Over-reactive Parenting Styles with their Adolescents (2010-2015)
Source: Triple P data from the Teen Parenting Scale, analyzed by Applied Survey Research, Jan. 2010 - June 2015. Note: The Teen Parenting Scale measures parenting styles in 2 scales, and overall. Scores for each scale are calculated by averaging the participants’ responses for each of the items. Higher scores indicate less positive parenting styles. ** Results marked with two asterisks had PRE/POST differences that were statistically significant at p<.05, with a moderate to large magnitude of change (≥ 0.5).
Parents in Teen Triple P report decreased amount of conflict with teenagers
o On average, mothers reported significant decreases in the amount of conflict between
themselves and their teenagers. Effect size analyses showed that on average, mothers
experienced a moderate to large magnitude of change, indicating that these observed
differences were not only statistically significant but also meaningful.
o Fathers also reported lowered amounts of conflict with their teenagers. As the number of
fathers with this assessment grows these improvements will likely become statistically
significant.
o Both mothers and fathers tended to score above the clinical cut-off at the beginning of the
program, and subsequently ended out of a range of concern by the end of the program.
o Teenagers also reported significantly lowered amounts of conflict with their mothers. There
were not yet enough data on teenagers’ amount of conflict with their fathers to analyze.
Amount of Conflict Between Parents and Their Teenagers (2010-2015)
Source: Triple P data from the Conflict Behavior Questionnaire, analyzed by Applied Survey Research, Jan. 2010 - June 2015.
Note: The Conflict Behavior Questionnaire (CBQ) was utilized by clients participating in the Teen variant of Levels 4 and 5 of the Triple P Program, and assesses general conflict between parents and their children. The CBQ was completed by both parents and adolescents, and discriminates between distressed and non-distressed families. Scores could range from 0 (non-distressed) to 20 (distressed), with higher score indicating a greater amount of conflict.
* Results marked with an asterisk had PRE/POST differences that were statistically significant at p<.05.
** Results marked with two asterisks had PRE/POST differences that were statistically significant at p<.05, with a moderate to large magnitude of change (≥ 0.5).
3.9 3.7 4.0 3.64.1
3.0 2.83.2 2.9 3.2
1
2
3
4
5
6
7
All Parents** (N=63) Latino** (N=37) Caucasian** (N=23) Spanish** (N=32) English** (N=31)
Pre Post
8.911.1
7.64.8
7.34.8
0
5
10
15
20
Mother's report of conflictwith teenager**
(N=45)
Father's report of conflictwith teenager
(N=10)
Teenager's report of conflictwith Mother*
(N=19)
Pre PostHigh Amount
of Conflict
Low Amount of Conflict
Lower is
“Better” Clinical Cut-off:
>8.2
Clinical Cut-off:
>9.2
Clinical Cut-off:
>8
More over-reactive
Less over-reactive
Lower is
“Better”

FIRST 5 SANTA CRUZ COUNTY 2014-2015 ANNUAL EVALUATION REPORT PARTNER PROFILES STRONG FAMILIES – TRIPLE P
FIRST 5 SANTA CRUZ COUNTY 105
Parents of children with special needs are also among those experiencing more serious
parenting issues, and are also benefitting from Triple P. A small but growing number of parents
have completed Stepping Stones Triple P, a specialized program for families with children who
have special needs. Results are already showing significant progress.
o Parents in Stepping Stones Triple P tended to report more serious parenting issues than
parents in Core Triple P, particularly in the areas of parenting styles, number of problems
with their partners over parenting, and their levels of stress and depression.
o Although parents in both Core and Stepping Stones Triple P showed significant
improvement in their parenting issues, parents in Stepping Stones Triple P tended to
demonstrate a greater degree of improvement by the end of the program.
Improvements in Selected Parenting Issues Comparison of Clients in Core Triple P (families with children 0-12)
and Stepping Stones Triple P (families with children who have special needs) (2010-2015)
Lax parenting style
Stress
Number of child behaviors perceived to be a problem
Depression
Source: Triple P data from the Parenting Scale, ECBI, and the Depression, Anxiety, Stress Scale – Short Version (DASS-21), analyzed by Applied Survey Research, Jan. 2010 - June 2015. * Results marked with an asterisk had PRE/POST differences that were statistically significant at p<.05. ** Results marked with two asterisks had PRE/POST differences that were statistically significant at p<.05, with a moderate to large magnitude of change (≥ 0.5). *** When there were separate Clinical Cut-offs for Males and Females, this has been taken into account in each analysis so that results could be reported overall. In these instances, the separate Cut-off levels for each gender that are shown in the charts are for illustration purposes only.
3.2
4.0
2.6 2.6
1
2
3
4
5
6
7
Core**(N=733)
Stepping Stones**(N=11)
Pre Post
13.4 14.7
9.06.7
0
7
14
21
28
35
42
Core*(N=795)
Stepping Stones**(N=11)
Pre Post
14.3
19.4
7.411.0
0
6
12
18
24
30
36
Core**(N=645)
Stepping Stones**(N=10)
Pre Post
9.46.96.0
2.40
7
14
21
28
35
42
Core*(N=796)
Stepping Stones**(N=11)
Pre Post
All behaviors were a problem
No behaviors were a problem
Clinical Cut-off:
>=15
Lower is
“Better”
More lax
Less lax
Lower is
“Better”
Clinical Cut-Off:*** Female >= 3.6
Male >= 3.4
No distress
Lower is
“Better”
Clinical Cut-offs:
Very Severe >=34
Severe >=26
Moderate >=19
Lower is
“Better”
Extremely severe distress
No distress
Extremely severe distress
Clinical Cut-offs:
Very Severe >=28
Severe >= 21
Moderate >=14

PARTNER PROFILES FIRST 5 SANTA CRUZ COUNTY 2014-2015 ANNUAL EVALUATION REPORT STRONG FAMILIES – TRIPLE P
106 FIRST 5 SANTA CRUZ COUNTY
Increased use of positive parenting styles. There were significant improvements in parenting
styles, indicating parents became less lax, less over-reactive, and less hostile through the course of
the Triple P program.
Parents’ Use of Positive Parenting Styles (2010-2015)
Source: Triple P data from the Parenting Scale, Overall scores, analyzed by Applied Survey Research, Jan. 2010 - June 2015. Note: The Parenting Scale measures parenting styles in 3 scales, and overall. Scores for each scale are calculated by averaging the participants’ responses for each of the items. Higher scores indicate less positive parenting styles. In 2012, modifications were made to the Parenting Scale to accommodate the launching of the “Teen” variant of the Triple P program, so comparisons to previous years’ results should be made with caution. Due to these changes, there is no Clinical Cut-Off for the overall assessment score. See Appendix C for a complete description of these changes. ** Results marked with two asterisks had PRE/POST differences that were statistically significant at p<.05, with a moderate to large magnitude of change (≥ 0.5).
Reduced levels of conflict over parenting. After completing the program, parents on average
indicated that there were significantly fewer parenting and relationship issues that were problems.
Parents in each of these populations tended to score above the clinical cut-off at the beginning of
the program, and ended the program out of a range of concern. On average, effect sizes were
much higher for parents in the Clinical Range at Pre-test, suggesting that these intensive services
have a stronger impact on parents who begin the program with more serious parenting issues.
Number of Parenting Issues That Have Been a Source of Conflict Between Parents (2010-2015)
Source: Triple P data from the Parent Problem Checklist: Problem subscale, analyzed by Applied Survey Research, Jan. 2010 - June 2015. Note: The Parent Problem Checklist measures the number of issues that have been a problem for parents. Scores for the Problem subscale range from 0 (no issues were a problem) to 16 (all issues were a problem). * Results marked with an asterisk had PRE/POST differences that were statistically significant at p<.05. ** Results marked with two asterisks had PRE/POST differences that were statistically significant at p<.05, with a moderate to large magnitude of change (≥ 0.5).
Increased levels of emotional well-being. The following figures indicate that on average, All
Parents and all sub-populations significantly lowered their level of depression, anxiety, and
stress. The amount of change was much higher for parents with scores in the Clinical Range of
3.23.1
3.3 3.43.0
3.5
3.13.1
2.6 2.6 2.6 2.72.4
2.82.5 2.6
1
2
3
4
5
6
7
All Parents**(N=810)
Male**(N=230)
Female**(N=580)
Latino**(N=433)
Caucasian**(N=307)
Spanish**(N=298)
English**(N=496)
Child WelfareInvolved**
(N=188)
Pre Post
6.0
8.9
5.6 6.2 6.0 5.9 6.1 6.0 5.23.7
5.33.4 3.9 3.4 4.0 3.4 4.0 3.5
0
4
8
12
16
All Parents**(N=545)
ClinicalRange at
PreTest**(N=318)
Male**(N=194)
Female**(N=351)
Latino**(N=283)
Caucasian**(N=212)
Spanish**(N=190)
English**(N=345)
ChildWelfare
Involved*(N=111)
Pre Post
Less positive
No issues were a problem
Clinical Cut-Off:
>5
Lower is
“Better”
All issues were a problem
More positive
Lower is
“Better”

FIRST 5 SANTA CRUZ COUNTY 2014-2015 ANNUAL EVALUATION REPORT PARTNER PROFILES STRONG FAMILIES – TRIPLE P
FIRST 5 SANTA CRUZ COUNTY 107
Concern at Pre-test. This was the only sub-population that began within the Severe range, and
ended out of a range of concern.
Level of Parental Depression, Anxiety, and Stress (2010-2015)
Depression
Anxiety
Stress
Source: Triple P data from the Depression, Anxiety, and Stress Scale – Short Version (DASS-21), analyzed by Applied Survey Research, Jan. 2010 - June 2015. Note: The Depression, Anxiety, and Stress Scale – Short Version (DASS-21) measures distress along 3 scales: Depression, Anxiety, Stress. Scores for each scale are calculated by summing the participants’ responses for each of the 21 items. Higher scores on each of the scales indicate greater levels of depression, anxiety, and stress. Each scale has different clinical cut-offs for the 5 severity levels: normal, mild, moderate, severe, and very severe. * Results marked with an asterisk had PRE/POST differences that were statistically significant at p<.05. ** Results marked with two asterisks had PRE/POST differences that were statistically significant at p<.05, with a moderate to large magnitude of change (≥ 0.5).
9.4
23.5
7.7 10.2 10.2 8.3 10.9 8.6 9.16.010.8
5.7 6.1 6.3 5.4 6.5 5.6 6.50
7
14
21
28
35
42
All Parents*(N=873)
ClinicalRange at
PreTest**(N=225)
Male*(N=259)
Female*(N=614)
Latino*(N=467)
Caucasian*(N=327)
Spanish*(N=312)
English*(N=544)
ChildWelfare
Involved*(N=236)
Pre Post
8.0
18.6
6.48.6
8.7 6.6 9.1 7.3 8.45.1 8.6 4.6 5.3 5.3 4.5
5.74.6
5.80
7
14
21
28
35
42
All Parents*(N=872)
ClinicalRange at
PreTest**(N=293)
Male*(N=259)
Female*(N=613)
Latino*(N=467)
Caucasian*(N=326)
Spanish*(N=312)
English*(N=543)
ChildWelfare
Involved*(N=235)
Pre Post
13.6
27.2
11.5 14.5 13.013.9
13.313.8 12.4
9.113.5
8.4 9.4 8.3 9.8 8.5 9.3 9.1
0
7
14
21
28
35
42
All Parents*(N=872)
ClinicalRange at
PreTest**(N=235)
Male*(N=259)
Female**(N=613)
Latino*(N=466)
Caucasian*(N=327)
Spanish*(N=311)
English*(N=544)
ChildWelfare
Involved*(N=236)
Pre Post
Extremely severe distress
No distress
Clinical Cut-offs:
Very Severe >=28
Severe >= 21
Moderate >=14
Extremely severe distress
No distress
Clinical Cut-offs:
Very Severe >=20
Severe >=15
Moderate >=10
Extremely severe distress
No distress
Clinical Cut-offs:
Very Severe >=34
Severe >=26
Moderate >=19
Lower is
“Better”
Lower is
“Better”
Lower is
“Better”

PARTNER PROFILES FIRST 5 SANTA CRUZ COUNTY 2014-2015 ANNUAL EVALUATION REPORT STRONG FAMILIES – TRIPLE P
108 FIRST 5 SANTA CRUZ COUNTY
Improvements in child behavior. For All Parents and all sub-populations, there was a significant
reduction in the number of child behaviors that were perceived to be a problem. Of special note,
certain sub-populations of parents scored above the clinical cut-off at the beginning of the
program, and subsequently ended out of a range of concern by the end of the program. These
sub-populations included Females, Latinos, and Spanish-speaking parents.
Number of Child Behaviors Perceived to Be a Problem (2010-2015)
Source: Triple P data from the Eyberg Child Behavior Inventory: Problem subscale, analyzed by Applied Survey Research, Jan. 2010 - June 2015.
Note: The Eyberg Child Behavior Inventory measures the frequency with which certain child behaviors occur (Intensity subscale), and whether parents view those behaviors to be a problem (Problem subscale). Intensity scores could range from 36 (Never occurs) to 252 (Always occurs), and Problem scores ranged from 0 (No) to 36 (Yes), with higher scores indicating greater numbers of problem behaviors and greater likelihood that these behaviors were a problem to the parent.
** Results marked with two asterisks had PRE/POST differences that were statistically significant at p<.05, with a moderate to large magnitude of change (≥ 0.5).
Level 5: Enhanced, Pathways, and Family Transitions
Level 5 offers additional support for families where parenting issues are compounded by parental
stress and/or relationship difficulties (Level 5 Enhanced), there is risk for child maltreatment due to
parents’ anger management issues or negative beliefs about their children’s behaviors (Level 5
Pathways), or parents are divorced or separated (Level 5 Family Transitions).
There has been a growing level of participation in Level 5 Family Transitions, and the following
results demonstrate the significant improvement in these parents’ relationships, parenting skills,
and children’s behaviors. These results are particularly noteworthy considering the very small
number of parents available for these analyses.
14.4
21.8
12.215.3 15.5
13.116.3
13.1 9.67.4
10.6
6.4 7.7 7.77.2
8.56.6 5.8
0
6
12
18
24
30
36
All Parents**(N=712)
ClinicalRange at
PreTest**(N=352)
Male**(N=200)
Female**(N=512)
Latino**(N=393)
Caucasian**(N=255)
Spanish**(N=278)
English**(N=421)
ChildWelfare
Involved**(N=158)
Pre PostAll behaviors were
a problem
No behaviors were a problem
Clinical Cut-off:
>=15
Lower is
“Better”
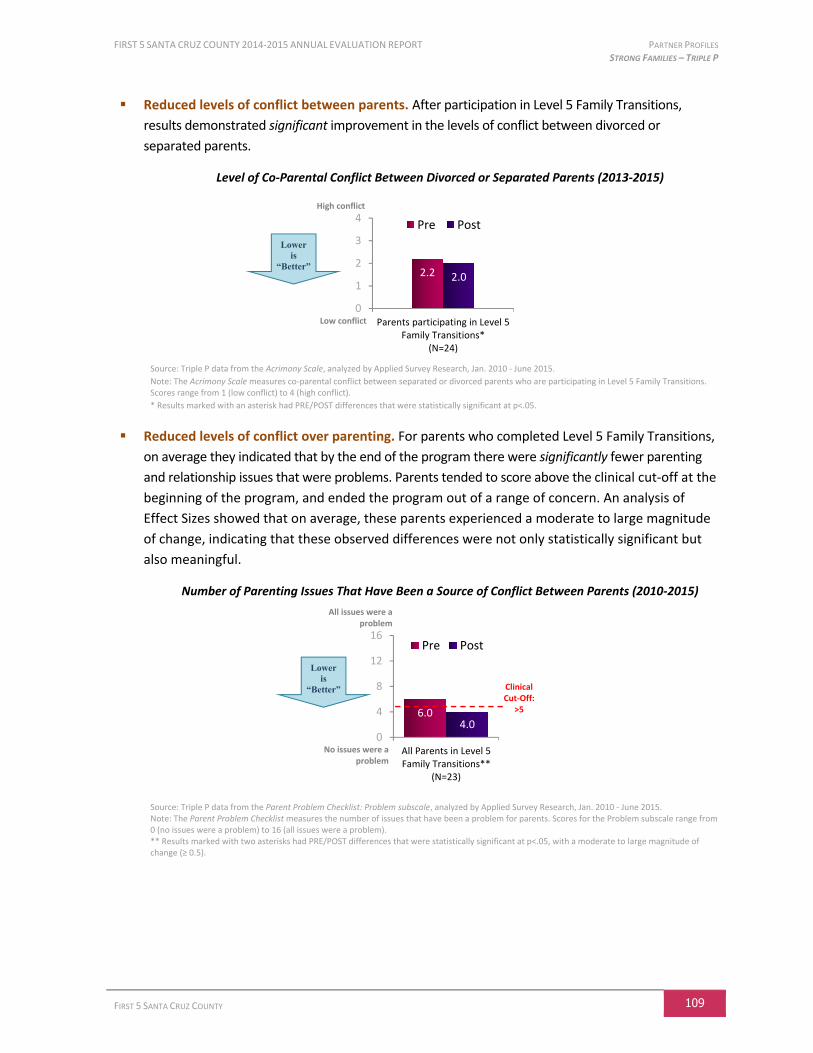
FIRST 5 SANTA CRUZ COUNTY 2014-2015 ANNUAL EVALUATION REPORT PARTNER PROFILES STRONG FAMILIES – TRIPLE P
FIRST 5 SANTA CRUZ COUNTY 109
Reduced levels of conflict between parents. After participation in Level 5 Family Transitions,
results demonstrated significant improvement in the levels of conflict between divorced or
separated parents.
Level of Co-Parental Conflict Between Divorced or Separated Parents (2013-2015)
Source: Triple P data from the Acrimony Scale, analyzed by Applied Survey Research, Jan. 2010 - June 2015.
Note: The Acrimony Scale measures co-parental conflict between separated or divorced parents who are participating in Level 5 Family Transitions. Scores range from 1 (low conflict) to 4 (high conflict).
* Results marked with an asterisk had PRE/POST differences that were statistically significant at p<.05.
Reduced levels of conflict over parenting. For parents who completed Level 5 Family Transitions,
on average they indicated that by the end of the program there were significantly fewer parenting
and relationship issues that were problems. Parents tended to score above the clinical cut-off at the
beginning of the program, and ended the program out of a range of concern. An analysis of
Effect Sizes showed that on average, these parents experienced a moderate to large magnitude
of change, indicating that these observed differences were not only statistically significant but
also meaningful.
Number of Parenting Issues That Have Been a Source of Conflict Between Parents (2010-2015)
Source: Triple P data from the Parent Problem Checklist: Problem subscale, analyzed by Applied Survey Research, Jan. 2010 - June 2015. Note: The Parent Problem Checklist measures the number of issues that have been a problem for parents. Scores for the Problem subscale range from 0 (no issues were a problem) to 16 (all issues were a problem). ** Results marked with two asterisks had PRE/POST differences that were statistically significant at p<.05, with a moderate to large magnitude of change (≥ 0.5).
2.2 2.0
0
1
2
3
4
Parents participating in Level 5Family Transitions*
(N=24)
Pre Post
6.04.0
0
4
8
12
16
All Parents in Level 5Family Transitions**
(N=23)
Pre Post
No issues were a problem
Clinical Cut-Off:
>5
Lower is
“Better”
All issues were a problem
Low conflict
Lower is
“Better”
High conflict
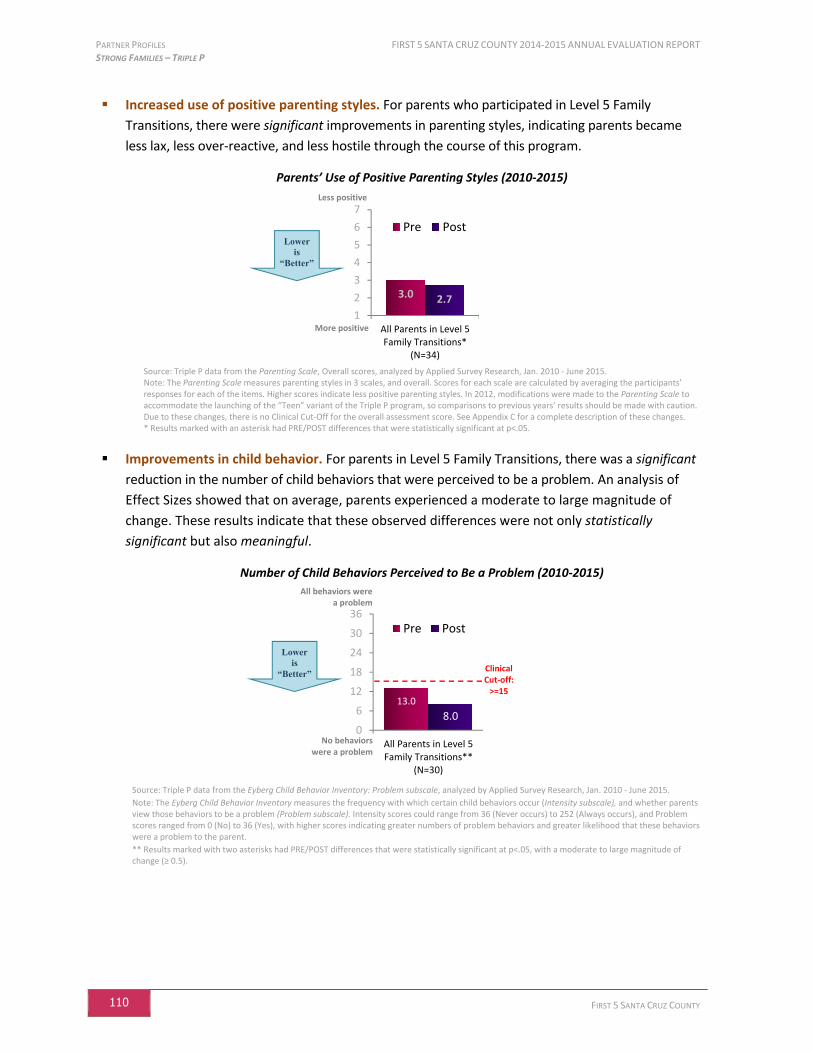
PARTNER PROFILES FIRST 5 SANTA CRUZ COUNTY 2014-2015 ANNUAL EVALUATION REPORT STRONG FAMILIES – TRIPLE P
110 FIRST 5 SANTA CRUZ COUNTY
Increased use of positive parenting styles. For parents who participated in Level 5 Family
Transitions, there were significant improvements in parenting styles, indicating parents became
less lax, less over-reactive, and less hostile through the course of this program.
Parents’ Use of Positive Parenting Styles (2010-2015)
Source: Triple P data from the Parenting Scale, Overall scores, analyzed by Applied Survey Research, Jan. 2010 - June 2015. Note: The Parenting Scale measures parenting styles in 3 scales, and overall. Scores for each scale are calculated by averaging the participants’ responses for each of the items. Higher scores indicate less positive parenting styles. In 2012, modifications were made to the Parenting Scale to accommodate the launching of the “Teen” variant of the Triple P program, so comparisons to previous years’ results should be made with caution. Due to these changes, there is no Clinical Cut-Off for the overall assessment score. See Appendix C for a complete description of these changes. * Results marked with an asterisk had PRE/POST differences that were statistically significant at p<.05.
Improvements in child behavior. For parents in Level 5 Family Transitions, there was a significant
reduction in the number of child behaviors that were perceived to be a problem. An analysis of
Effect Sizes showed that on average, parents experienced a moderate to large magnitude of
change. These results indicate that these observed differences were not only statistically
significant but also meaningful.
Number of Child Behaviors Perceived to Be a Problem (2010-2015)
Source: Triple P data from the Eyberg Child Behavior Inventory: Problem subscale, analyzed by Applied Survey Research, Jan. 2010 - June 2015.
Note: The Eyberg Child Behavior Inventory measures the frequency with which certain child behaviors occur (Intensity subscale), and whether parents view those behaviors to be a problem (Problem subscale). Intensity scores could range from 36 (Never occurs) to 252 (Always occurs), and Problem scores ranged from 0 (No) to 36 (Yes), with higher scores indicating greater numbers of problem behaviors and greater likelihood that these behaviors were a problem to the parent.
** Results marked with two asterisks had PRE/POST differences that were statistically significant at p<.05, with a moderate to large magnitude of change (≥ 0.5).
3.0 2.7
1
2
3
4
5
6
7
All Parents in Level 5Family Transitions*
(N=34)
Pre Post
13.0
8.00
6
12
18
24
30
36
All Parents in Level 5Family Transitions**
(N=30)
Pre Post
All behaviors were a problem
No behaviors were a problem
Clinical Cut-off:
>=15
Lower is
“Better”
Less positive
More positive
Lower is
“Better”
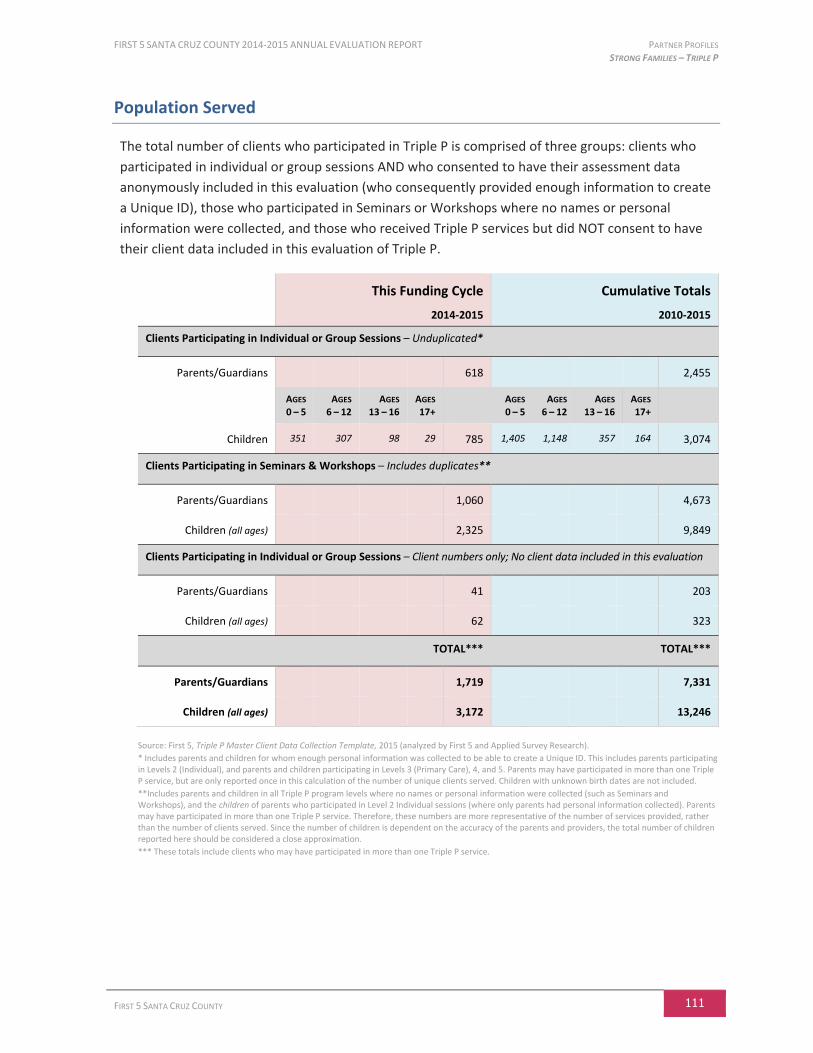
FIRST 5 SANTA CRUZ COUNTY 2014-2015 ANNUAL EVALUATION REPORT PARTNER PROFILES STRONG FAMILIES – TRIPLE P
FIRST 5 SANTA CRUZ COUNTY 111
Population Served
The total number of clients who participated in Triple P is comprised of three groups: clients who
participated in individual or group sessions AND who consented to have their assessment data
anonymously included in this evaluation (who consequently provided enough information to create
a Unique ID), those who participated in Seminars or Workshops where no names or personal
information were collected, and those who received Triple P services but did NOT consent to have
their client data included in this evaluation of Triple P.
Source: First 5, Triple P Master Client Data Collection Template, 2015 (analyzed by First 5 and Applied Survey Research).
* Includes parents and children for whom enough personal information was collected to be able to create a Unique ID. This includes parents participating in Levels 2 (Individual), and parents and children participating in Levels 3 (Primary Care), 4, and 5. Parents may have participated in more than one Triple P service, but are only reported once in this calculation of the number of unique clients served. Children with unknown birth dates are not included.
**Includes parents and children in all Triple P program levels where no names or personal information were collected (such as Seminars and Workshops), and the children of parents who participated in Level 2 Individual sessions (where only parents had personal information collected). Parents may have participated in more than one Triple P service. Therefore, these numbers are more representative of the number of services provided, rather than the number of clients served. Since the number of children is dependent on the accuracy of the parents and providers, the total number of children reported here should be considered a close approximation.
*** These totals include clients who may have participated in more than one Triple P service.
This Funding Cycle
2014-2015
Cumulative Totals
2010-2015
Clients Participating in Individual or Group Sessions – Unduplicated*
Parents/Guardians 618 2,455
AGES
0 – 5 AGES
6 – 12 AGES
13 – 16 AGES
17+ AGES
0 – 5 AGES
6 – 12 AGES
13 – 16 AGES
17+
Children 351 307 98 29 785 1,405 1,148 357 164 3,074
Clients Participating in Seminars & Workshops – Includes duplicates**
Parents/Guardians 1,060 4,673
Children (all ages) 2,325 9,849
Clients Participating in Individual or Group Sessions – Client numbers only; No client data included in this evaluation
Parents/Guardians 41 203
Children (all ages) 62 323
TOTAL*** TOTAL***
Parents/Guardians 1,719 7,331
Children (all ages) 3,172 13,246
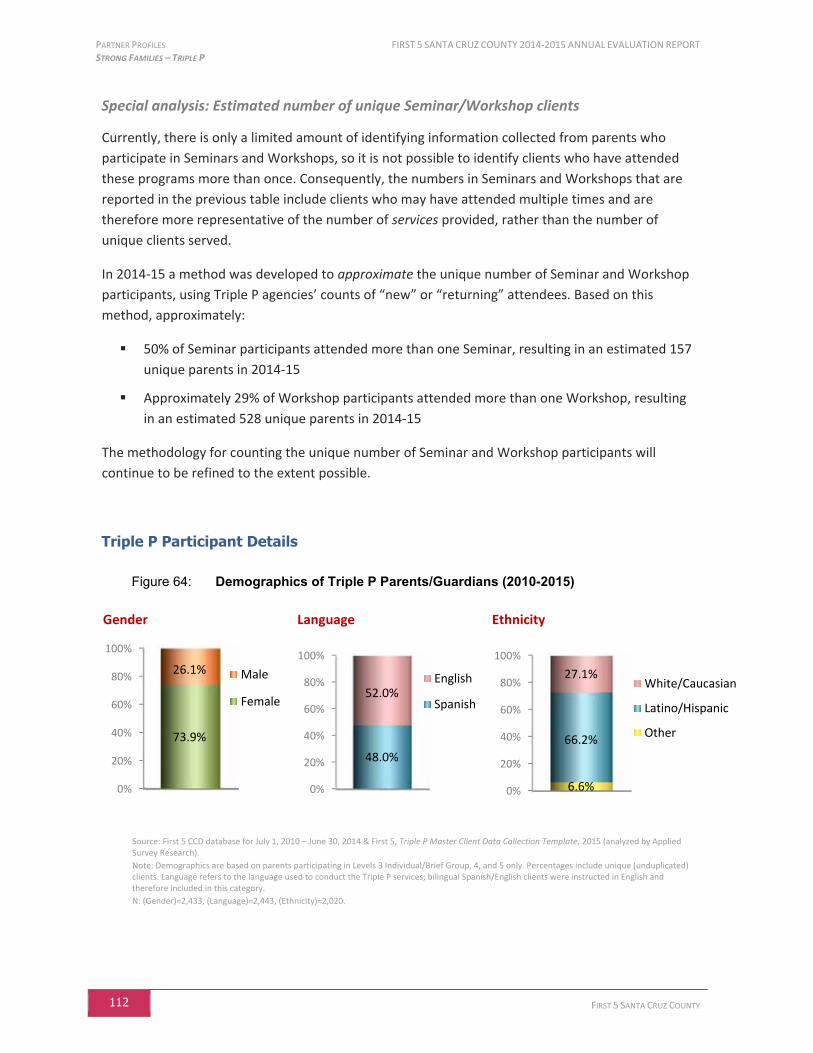
PARTNER PROFILES FIRST 5 SANTA CRUZ COUNTY 2014-2015 ANNUAL EVALUATION REPORT STRONG FAMILIES – TRIPLE P
112 FIRST 5 SANTA CRUZ COUNTY
Special analysis: Estimated number of unique Seminar/Workshop clients
Currently, there is only a limited amount of identifying information collected from parents who
participate in Seminars and Workshops, so it is not possible to identify clients who have attended
these programs more than once. Consequently, the numbers in Seminars and Workshops that are
reported in the previous table include clients who may have attended multiple times and are
therefore more representative of the number of services provided, rather than the number of
unique clients served.
In 2014-15 a method was developed to approximate the unique number of Seminar and Workshop
participants, using Triple P agencies’ counts of “new” or “returning” attendees. Based on this
method, approximately:
50% of Seminar participants attended more than one Seminar, resulting in an estimated 157
unique parents in 2014-15
Approximately 29% of Workshop participants attended more than one Workshop, resulting
in an estimated 528 unique parents in 2014-15
The methodology for counting the unique number of Seminar and Workshop participants will
continue to be refined to the extent possible.
Triple P Participant Details
Figure 64: Demographics of Triple P Parents/Guardians (2010-2015)
Gender
Language Ethnicity
Source: First 5 CCD database for July 1, 2010 – June 30, 2014 & First 5, Triple P Master Client Data Collection Template, 2015 (analyzed by Applied Survey Research).
Note: Demographics are based on parents participating in Levels 3 Individual/Brief Group, 4, and 5 only. Percentages include unique (unduplicated) clients. Language refers to the language used to conduct the Triple P services; bilingual Spanish/English clients were instructed in English and therefore included in this category.
N: (Gender)=2,433, (Language)=2,443, (Ethnicity)=2,020.
0%
20%
40%
60%
80%
100%
73.9%
26.1% Male
Female
0%
20%
40%
60%
80%
100%
48.0%
52.0%English
Spanish
0%
20%
40%
60%
80%
100%
6.6%
66.2%
27.1%White/Caucasian
Latino/Hispanic
Other
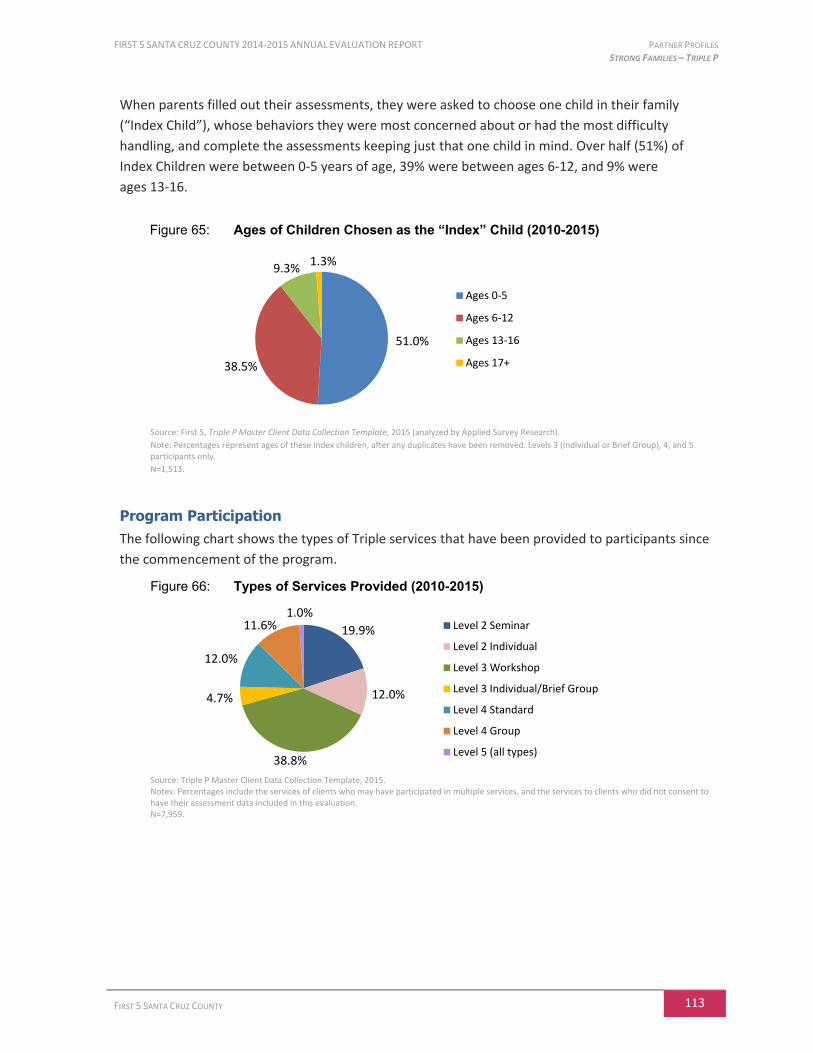
FIRST 5 SANTA CRUZ COUNTY 2014-2015 ANNUAL EVALUATION REPORT PARTNER PROFILES STRONG FAMILIES – TRIPLE P
FIRST 5 SANTA CRUZ COUNTY 113
When parents filled out their assessments, they were asked to choose one child in their family
(“Index Child”), whose behaviors they were most concerned about or had the most difficulty
handling, and complete the assessments keeping just that one child in mind. Over half (51%) of
Index Children were between 0-5 years of age, 39% were between ages 6-12, and 9% were
ages 13-16.
Figure 65: Ages of Children Chosen as the “Index” Child (2010-2015)
Source: First 5, Triple P Master Client Data Collection Template, 2015 (analyzed by Applied Survey Research).
Note: Percentages represent ages of these Index children, after any duplicates have been removed. Levels 3 (Individual or Brief Group), 4, and 5 participants only.
N=1,513.
Program Participation The following chart shows the types of Triple services that have been provided to participants since
the commencement of the program.
Figure 66: Types of Services Provided (2010-2015)
Source: Triple P Master Client Data Collection Template, 2015. Notes: Percentages include the services of clients who may have participated in multiple services, and the services to clients who did not consent to have their assessment data included in this evaluation. N=7,959.
51.0%
38.5%
9.3%1.3%
Ages 0-5
Ages 6-12
Ages 13-16
Ages 17+
19.9%
12.0%
38.8%
4.7%
12.0%
11.6%1.0%
Level 2 Seminar
Level 2 Individual
Level 3 Workshop
Level 3 Individual/Brief Group
Level 4 Standard
Level 4 Group
Level 5 (all types)
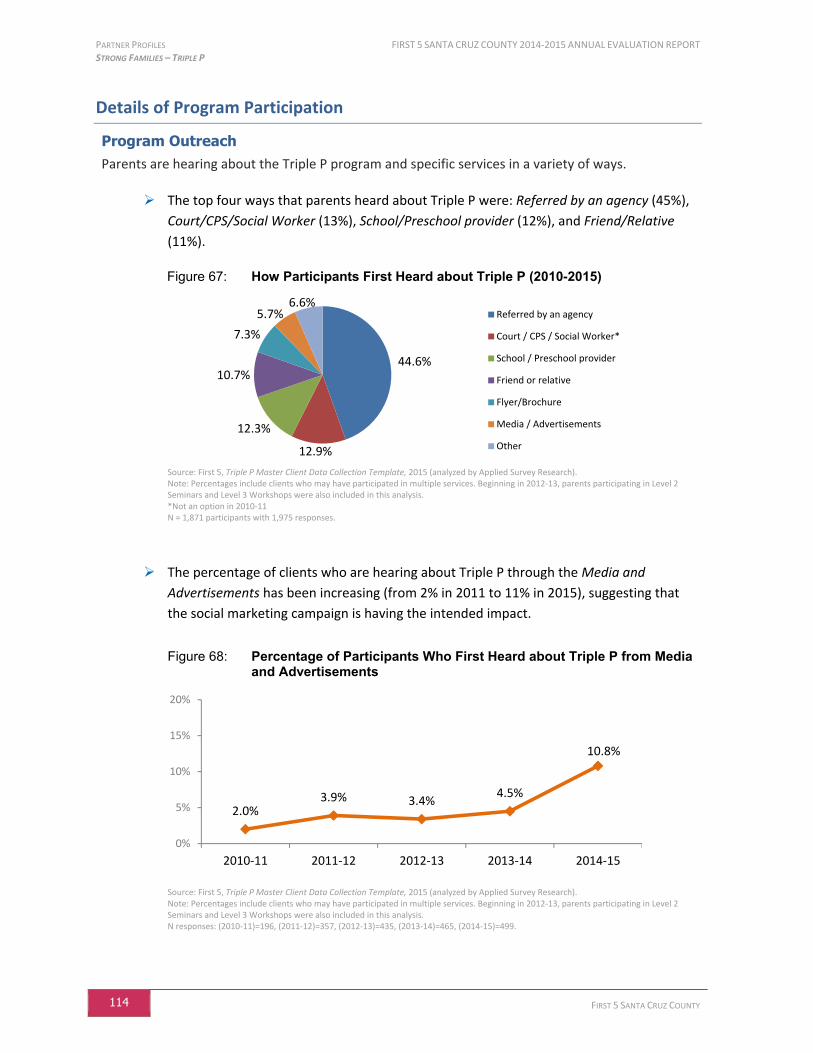
PARTNER PROFILES FIRST 5 SANTA CRUZ COUNTY 2014-2015 ANNUAL EVALUATION REPORT STRONG FAMILIES – TRIPLE P
114 FIRST 5 SANTA CRUZ COUNTY
Details of Program Participation
Program Outreach Parents are hearing about the Triple P program and specific services in a variety of ways.
The top four ways that parents heard about Triple P were: Referred by an agency (45%),
Court/CPS/Social Worker (13%), School/Preschool provider (12%), and Friend/Relative
(11%).
Figure 67: How Participants First Heard about Triple P (2010-2015)
Source: First 5, Triple P Master Client Data Collection Template, 2015 (analyzed by Applied Survey Research). Note: Percentages include clients who may have participated in multiple services. Beginning in 2012-13, parents participating in Level 2 Seminars and Level 3 Workshops were also included in this analysis. *Not an option in 2010-11 N = 1,871 participants with 1,975 responses.
The percentage of clients who are hearing about Triple P through the Media and
Advertisements has been increasing (from 2% in 2011 to 11% in 2015), suggesting that
the social marketing campaign is having the intended impact.
Figure 68: Percentage of Participants Who First Heard about Triple P from Media and Advertisements
Source: First 5, Triple P Master Client Data Collection Template, 2015 (analyzed by Applied Survey Research). Note: Percentages include clients who may have participated in multiple services. Beginning in 2012-13, parents participating in Level 2 Seminars and Level 3 Workshops were also included in this analysis. N responses: (2010-11)=196, (2011-12)=357, (2012-13)=435, (2013-14)=465, (2014-15)=499.
44.6%
12.9%
12.3%
10.7%
7.3%
5.7%6.6%
Referred by an agency
Court / CPS / Social Worker*
School / Preschool provider
Friend or relative
Flyer/Brochure
Media / Advertisements
Other
2.0%3.9% 3.4%
4.5%
10.8%
0%
5%
10%
15%
20%
2010-11 2011-12 2012-13 2013-14 2014-15
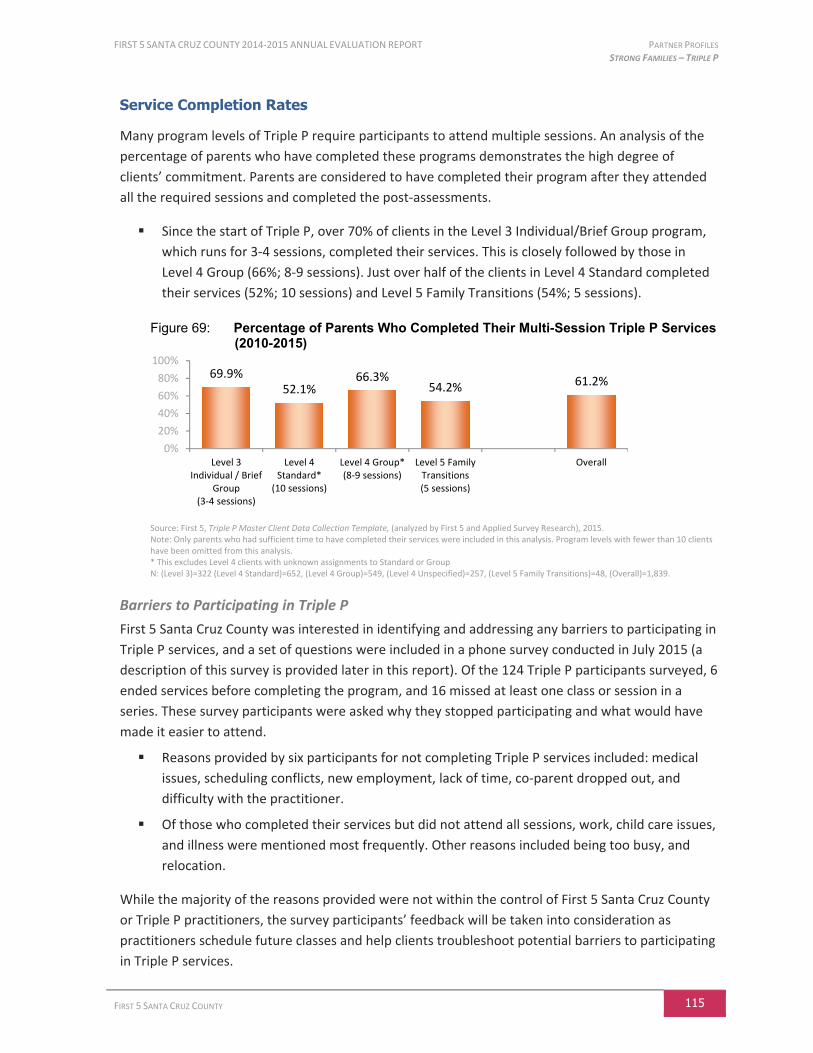
FIRST 5 SANTA CRUZ COUNTY 2014-2015 ANNUAL EVALUATION REPORT PARTNER PROFILES STRONG FAMILIES – TRIPLE P
FIRST 5 SANTA CRUZ COUNTY 115
Service Completion Rates
Many program levels of Triple P require participants to attend multiple sessions. An analysis of the
percentage of parents who have completed these programs demonstrates the high degree of
clients’ commitment. Parents are considered to have completed their program after they attended
all the required sessions and completed the post-assessments.
Since the start of Triple P, over 70% of clients in the Level 3 Individual/Brief Group program,
which runs for 3-4 sessions, completed their services. This is closely followed by those in
Level 4 Group (66%; 8-9 sessions). Just over half of the clients in Level 4 Standard completed
their services (52%; 10 sessions) and Level 5 Family Transitions (54%; 5 sessions).
Figure 69: Percentage of Parents Who Completed Their Multi-Session Triple P Services (2010-2015)
Source: First 5, Triple P Master Client Data Collection Template, (analyzed by First 5 and Applied Survey Research), 2015. Note: Only parents who had sufficient time to have completed their services were included in this analysis. Program levels with fewer than 10 clients have been omitted from this analysis. * This excludes Level 4 clients with unknown assignments to Standard or Group N: (Level 3)=322 (Level 4 Standard)=652, (Level 4 Group)=549, (Level 4 Unspecified)=257, (Level 5 Family Transitions)=48, (Overall)=1,839.
Barriers to Participating in Triple P
First 5 Santa Cruz County was interested in identifying and addressing any barriers to participating in
Triple P services, and a set of questions were included in a phone survey conducted in July 2015 (a
description of this survey is provided later in this report). Of the 124 Triple P participants surveyed, 6
ended services before completing the program, and 16 missed at least one class or session in a
series. These survey participants were asked why they stopped participating and what would have
made it easier to attend.
Reasons provided by six participants for not completing Triple P services included: medical
issues, scheduling conflicts, new employment, lack of time, co-parent dropped out, and
difficulty with the practitioner.
Of those who completed their services but did not attend all sessions, work, child care issues,
and illness were mentioned most frequently. Other reasons included being too busy, and
relocation.
While the majority of the reasons provided were not within the control of First 5 Santa Cruz County
or Triple P practitioners, the survey participants’ feedback will be taken into consideration as
practitioners schedule future classes and help clients troubleshoot potential barriers to participating
in Triple P services.
69.9%52.1%
66.3%54.2% 61.2%
0%
20%
40%
60%
80%
100%
Level 3Individual / Brief
Group(3-4 sessions)
Level 4Standard*
(10 sessions)
Level 4 Group*(8-9 sessions)
Level 5 FamilyTransitions(5 sessions)
Overall

PARTNER PROFILES FIRST 5 SANTA CRUZ COUNTY 2014-2015 ANNUAL EVALUATION REPORT STRONG FAMILIES – TRIPLE P
116 FIRST 5 SANTA CRUZ COUNTY
Satisfaction with Services
All parents in the Triple P program (except those attending brief Level 2 Individual sessions) were
asked to complete a self-administered satisfaction survey upon completing their services.
Key results include:
Parents participating in Levels 3 (Individual or
Brief Group) and Levels 4 and 5 of the Triple P
Program filled out a Parent Satisfaction Survey
with 13 questions using a 7-point scale (with 7
indicating highest satisfaction), and 3 open-ended
questions.
o For each of the survey questions, the average
parent satisfaction rating ranged from 5.30 to
6.48, on the 7-point scale, indicating a high
level of satisfaction with various aspects of the
program experience.
o On average, parents felt the highest satisfaction with the quality of the service they and
their child received (6.48). Parents reported that the program helped “somewhat” with
their relationship with their partner (5.30), which was the lowest rating given a question
on this survey. Although still a very high rating, this has consistently been the most
difficult issue over the years.
A further analysis of Satisfaction Surveys showed that clients’ satisfaction with their partner
was significantly more likely to be improved by the end of the Triple P program if they had
attended with another adult (who was usually this partner).
Figure 70: Percentage of Parents Whose Satisfaction with Their Partner Improved, With and Without Participation with Another Adult (2010-2015)
Source: First 5, Triple P Master Client Data Collection Template, analyzed by Applied Survey Research, Jan. 2010 - June 2015.
Notes: Chi-Square results were significant: Χ2(1, N = 1,391) = 20.2, p = .000. Relationships were defined as having improved if the parent answered 5, 6, or 7 (on the 7-point scale) to question 8 of the Satisfaction Survey.
Parents participating in the Level 2 Seminars and Level 3 Workshops filled out a shorter
Satisfaction Survey with 3 questions using a 5-point scale (with 5 indicating highest
satisfaction), and 1 open-ended question. On average, parents in both services reported that
they would continue to use the tip sheets, that they were very satisfied with the services
they received, and that the program answered their question or concern.
38.1%50.2%
0%
25%
50%
75%
100%
Participated alone Participated with another adult
What Parents Are Saying
“I feel like the Triple P program has ideal solutions to everyday family problems. It's pretty much “right on” with the difficulties our family has.”
“I feel as though I've grown up even more as a father and have strengthened my bond with my son.”
“This program helped me not only in my relationship with my child, but helped me to improve myself and my self-esteem.”
“I thank Triple P for the skills I will cherish. I will have a second chance at having a nuclear family.”
- Triple P Client Satisfaction Surveys
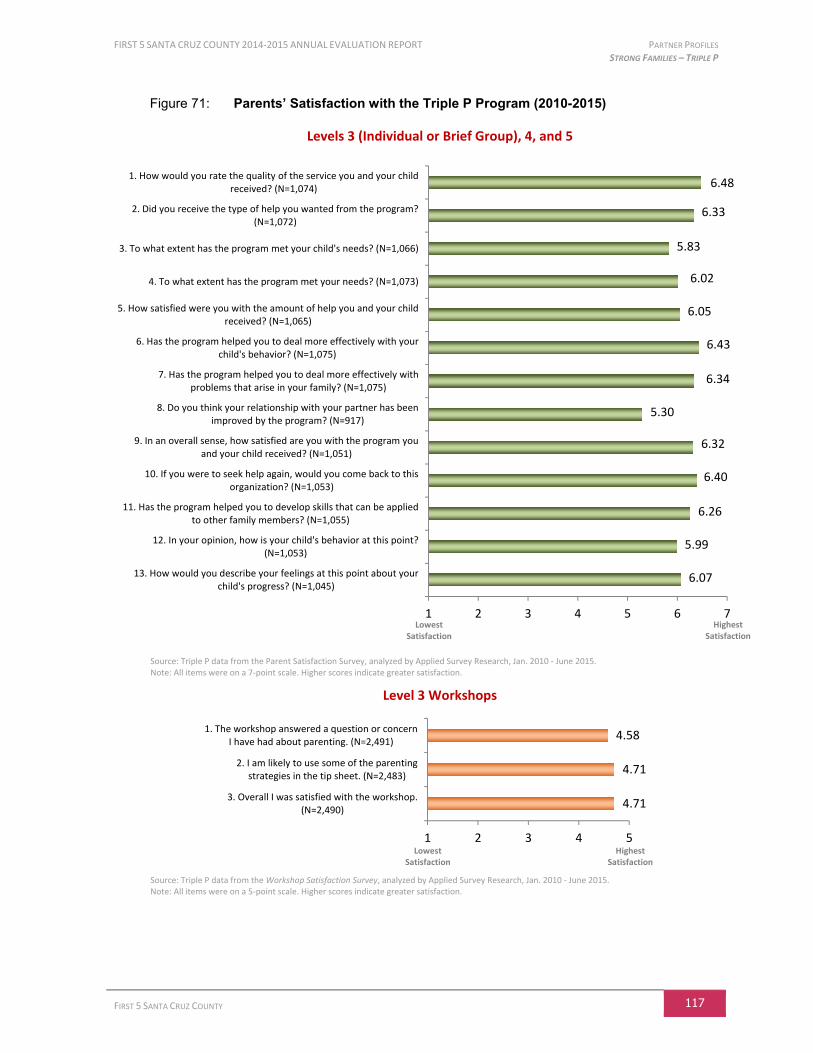
FIRST 5 SANTA CRUZ COUNTY 2014-2015 ANNUAL EVALUATION REPORT PARTNER PROFILES STRONG FAMILIES – TRIPLE P
FIRST 5 SANTA CRUZ COUNTY 117
Figure 71: Parents’ Satisfaction with the Triple P Program (2010-2015)
Levels 3 (Individual or Brief Group), 4, and 5
Source: Triple P data from the Parent Satisfaction Survey, analyzed by Applied Survey Research, Jan. 2010 - June 2015. Note: All items were on a 7-point scale. Higher scores indicate greater satisfaction.
Level 3 Workshops
Source: Triple P data from the Workshop Satisfaction Survey, analyzed by Applied Survey Research, Jan. 2010 - June 2015. Note: All items were on a 5-point scale. Higher scores indicate greater satisfaction.
6.07
5.99
6.26
6.40
6.32
5.30
6.34
6.43
6.05
6.02
5.83
6.33
6.48
1 2 3 4 5 6 7
13. How would you describe your feelings at this point about yourchild's progress? (N=1,045)
12. In your opinion, how is your child's behavior at this point?(N=1,053)
11. Has the program helped you to develop skills that can be appliedto other family members? (N=1,055)
10. If you were to seek help again, would you come back to thisorganization? (N=1,053)
9. In an overall sense, how satisfied are you with the program youand your child received? (N=1,051)
8. Do you think your relationship with your partner has beenimproved by the program? (N=917)
7. Has the program helped you to deal more effectively withproblems that arise in your family? (N=1,075)
6. Has the program helped you to deal more effectively with yourchild's behavior? (N=1,075)
5. How satisfied were you with the amount of help you and your childreceived? (N=1,065)
4. To what extent has the program met your needs? (N=1,073)
3. To what extent has the program met your child's needs? (N=1,066)
2. Did you receive the type of help you wanted from the program?(N=1,072)
1. How would you rate the quality of the service you and your childreceived? (N=1,074)
4.71
4.71
4.58
1 2 3 4 5
3. Overall I was satisfied with the workshop.(N=2,490)
2. I am likely to use some of the parentingstrategies in the tip sheet. (N=2,483)
1. The workshop answered a question or concernI have had about parenting. (N=2,491)
Highest Satisfaction
Lowest Satisfaction
Highest Satisfaction
Lowest Satisfaction
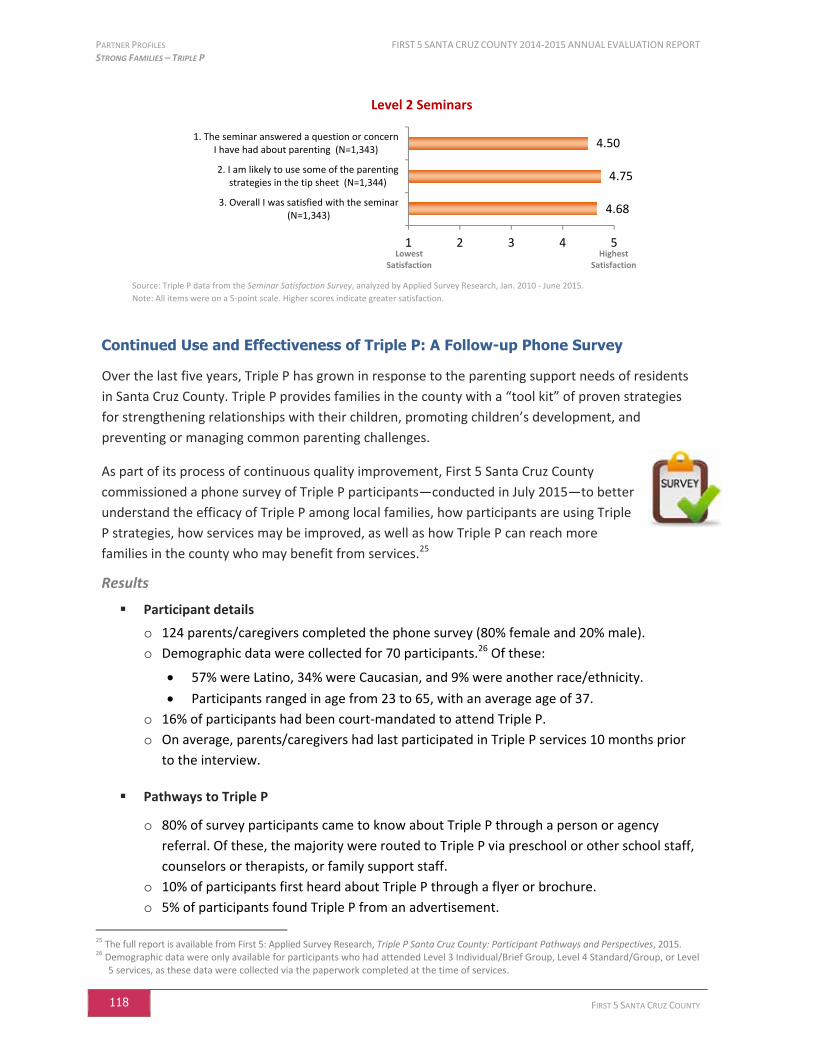
PARTNER PROFILES FIRST 5 SANTA CRUZ COUNTY 2014-2015 ANNUAL EVALUATION REPORT STRONG FAMILIES – TRIPLE P
118 FIRST 5 SANTA CRUZ COUNTY
Level 2 Seminars
Source: Triple P data from the Seminar Satisfaction Survey, analyzed by Applied Survey Research, Jan. 2010 - June 2015.
Note: All items were on a 5-point scale. Higher scores indicate greater satisfaction.
Continued Use and Effectiveness of Triple P: A Follow-up Phone Survey
Over the last five years, Triple P has grown in response to the parenting support needs of residents
in Santa Cruz County. Triple P provides families in the county with a “tool kit” of proven strategies
for strengthening relationships with their children, promoting children’s development, and
preventing or managing common parenting challenges.
As part of its process of continuous quality improvement, First 5 Santa Cruz County
commissioned a phone survey of Triple P participants—conducted in July 2015—to better
understand the efficacy of Triple P among local families, how participants are using Triple
P strategies, how services may be improved, as well as how Triple P can reach more
families in the county who may benefit from services.25
Results
Participant details
o 124 parents/caregivers completed the phone survey (80% female and 20% male).
o Demographic data were collected for 70 participants.26 Of these:
57% were Latino, 34% were Caucasian, and 9% were another race/ethnicity.
Participants ranged in age from 23 to 65, with an average age of 37.
o 16% of participants had been court-mandated to attend Triple P.
o On average, parents/caregivers had last participated in Triple P services 10 months prior
to the interview.
Pathways to Triple P
o 80% of survey participants came to know about Triple P through a person or agency
referral. Of these, the majority were routed to Triple P via preschool or other school staff,
counselors or therapists, or family support staff.
o 10% of participants first heard about Triple P through a flyer or brochure.
o 5% of participants found Triple P from an advertisement.
25
The full report is available from First 5: Applied Survey Research, Triple P Santa Cruz County: Participant Pathways and Perspectives, 2015. 26
Demographic data were only available for participants who had attended Level 3 Individual/Brief Group, Level 4 Standard/Group, or Level 5 services, as these data were collected via the paperwork completed at the time of services.
4.68
4.75
4.50
1 2 3 4 5
3. Overall I was satisfied with the seminar(N=1,343)
2. I am likely to use some of the parentingstrategies in the tip sheet (N=1,344)
1. The seminar answered a question or concernI have had about parenting (N=1,343)
Highest Satisfaction
Lowest Satisfaction
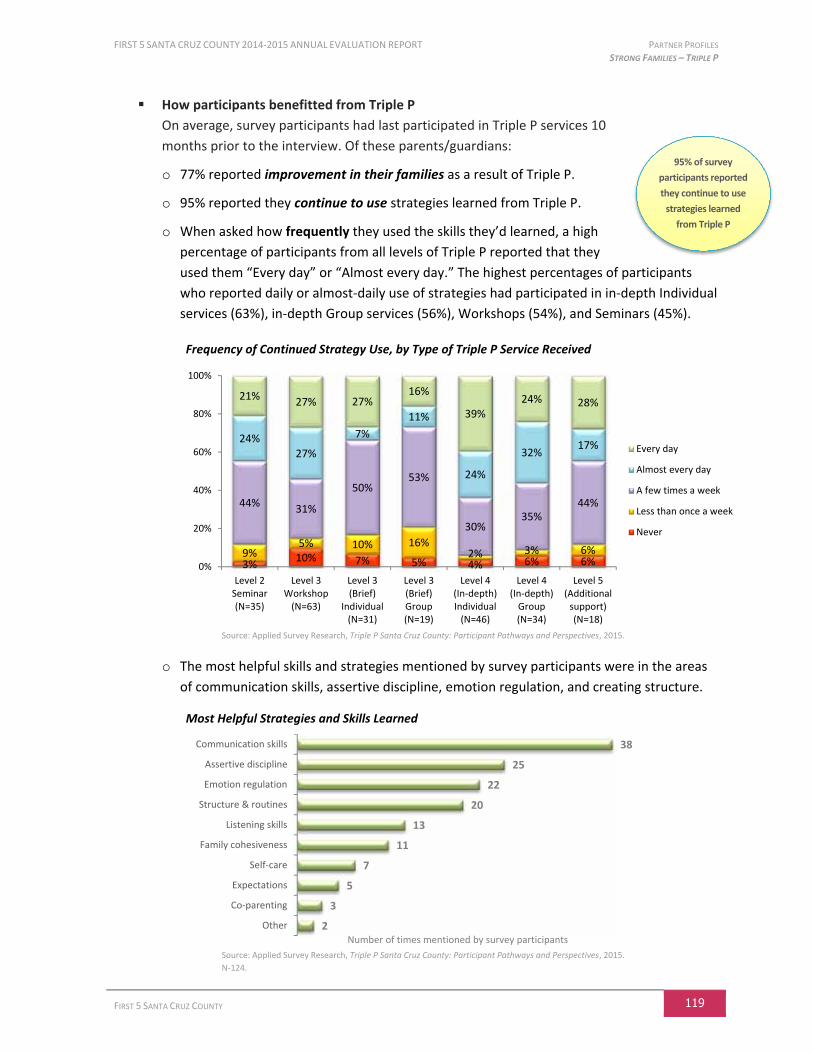
FIRST 5 SANTA CRUZ COUNTY 2014-2015 ANNUAL EVALUATION REPORT PARTNER PROFILES STRONG FAMILIES – TRIPLE P
FIRST 5 SANTA CRUZ COUNTY 119
How participants benefitted from Triple P
On average, survey participants had last participated in Triple P services 10
months prior to the interview. Of these parents/guardians:
o 77% reported improvement in their families as a result of Triple P.
o 95% reported they continue to use strategies learned from Triple P.
o When asked how frequently they used the skills they’d learned, a high
percentage of participants from all levels of Triple P reported that they
used them “Every day” or “Almost every day.” The highest percentages of participants
who reported daily or almost-daily use of strategies had participated in in-depth Individual
services (63%), in-depth Group services (56%), Workshops (54%), and Seminars (45%).
Frequency of Continued Strategy Use, by Type of Triple P Service Received
Source: Applied Survey Research, Triple P Santa Cruz County: Participant Pathways and Perspectives, 2015.
o The most helpful skills and strategies mentioned by survey participants were in the areas
of communication skills, assertive discipline, emotion regulation, and creating structure.
Most Helpful Strategies and Skills Learned
Source: Applied Survey Research, Triple P Santa Cruz County: Participant Pathways and Perspectives, 2015.
N-124.
3%10% 7% 5% 4% 6% 6%
9%5% 10% 16%
2% 3% 6%
44%31%
50%53%
30%35%
44%
24%
27%
7%
11%
24%
32%17%
21% 27% 27%16%
39%24% 28%
0%
20%
40%
60%
80%
100%
Level 2Seminar(N=35)
Level 3Workshop
(N=63)
Level 3(Brief)
Individual(N=31)
Level 3(Brief)Group(N=19)
Level 4(In-depth)Individual
(N=46)
Level 4(In-depth)
Group(N=34)
Level 5(Additional
support)(N=18)
Every day
Almost every day
A few times a week
Less than once a week
Never
2
3
5
7
11
13
20
22
25
38
Other
Co-parenting
Expectations
Self-care
Family cohesiveness
Listening skills
Structure & routines
Emotion regulation
Assertive discipline
Communication skills
Number of times mentioned by survey participants
95% of survey
participants reported
they continue to use
strategies learned
from Triple P
PARTNER PROFILES FIRST 5 SANTA CRUZ COUNTY 2014-2015 ANNUAL EVALUATION REPORT STRONG FAMILIES – TRIPLE P
120 FIRST 5 SANTA CRUZ COUNTY
Satisfaction with services
o 82% of survey participants were “very satisfied” with the quality of Triple P instruction.
o 78% of survey participants were “very satisfied” with Triple P services.
Involvement in Triple P
o 98% of survey participants would recommend Triple P to family and friends.
o 81% of survey participants said that they were likely to participate in
another Triple P service.
o 59% of survey participants showed interest in spreading information about
Triple P through social media, flyers, email, or other means.
o 51% of survey participants were interested in learning more about becoming a Triple P
practitioner.
Difference by preferred language and gender
o Participants whose preferred language was Spanish reported greater improvement as a
result of services.
o Female participants reported greater overall satisfaction with Triple P services than male
participants.
Barriers to participating Triple P
o Reasons provided by six participants for not completing Triple P services included: medical
issues, scheduling conflicts, new employment, lack of time, co-parent dropped out, and
difficulty with the practitioner.
o Of those who completed their services but did not attend all sessions, work, child care
issues, and illness were mentioned most frequently. Other reasons included being too
busy, and relocation.
o While the majority of the reasons provided were not within the control of First 5 Santa
Cruz County or Triple P practitioners, the survey participants’ feedback will be taken into
consideration as practitioners schedule future classes and help clients troubleshoot
potential barriers to participating in Triple P services.
Summary
o Overall, a vast majority of survey participants reported experiencing significant and lasting
benefits of Triple P services. They reported an overwhelmingly positive experience with
the program, learned strategies they could use regularly in their parenting, and nearly all
participants were likely to recommend the services to family and friends.
98% of survey
participants would
recommend Triple P
to family and friends
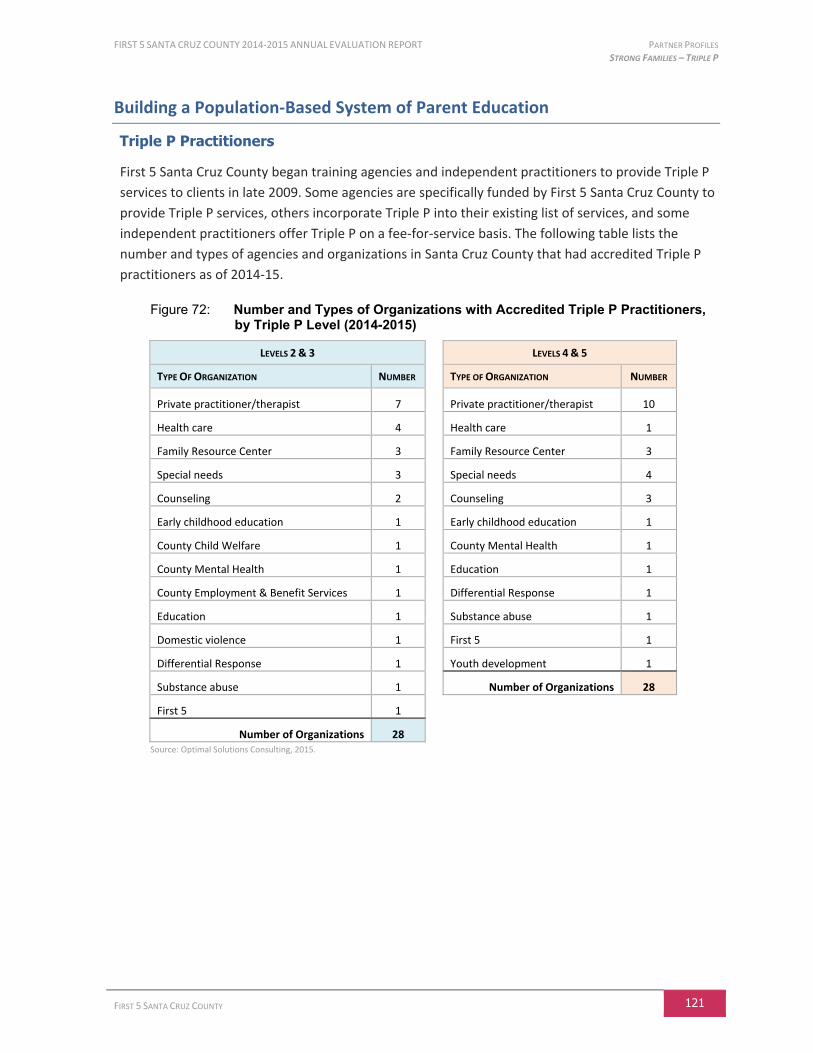
FIRST 5 SANTA CRUZ COUNTY 2014-2015 ANNUAL EVALUATION REPORT PARTNER PROFILES STRONG FAMILIES – TRIPLE P
FIRST 5 SANTA CRUZ COUNTY 121
Building a Population-Based System of Parent Education
Triple P Practitioners
First 5 Santa Cruz County began training agencies and independent practitioners to provide Triple P
services to clients in late 2009. Some agencies are specifically funded by First 5 Santa Cruz County to
provide Triple P services, others incorporate Triple P into their existing list of services, and some
independent practitioners offer Triple P on a fee-for-service basis. The following table lists the
number and types of agencies and organizations in Santa Cruz County that had accredited Triple P
practitioners as of 2014-15.
Figure 72: Number and Types of Organizations with Accredited Triple P Practitioners, by Triple P Level (2014-2015)
LEVELS 2 & 3 LEVELS 4 & 5
TYPE OF ORGANIZATION NUMBER TYPE OF ORGANIZATION NUMBER
Private practitioner/therapist 7 Private practitioner/therapist 10
Health care 4 Health care 1
Family Resource Center 3 Family Resource Center 3
Special needs 3 Special needs 4
Counseling 2 Counseling 3
Early childhood education 1 Early childhood education 1
County Child Welfare 1 County Mental Health 1
County Mental Health 1 Education 1
County Employment & Benefit Services 1 Differential Response 1
Education 1 Substance abuse 1
Domestic violence 1 First 5 1
Differential Response 1 Youth development 1
Substance abuse 1 Number of Organizations 28
First 5 1
Number of Organizations 28 Source: Optimal Solutions Consulting, 2015.
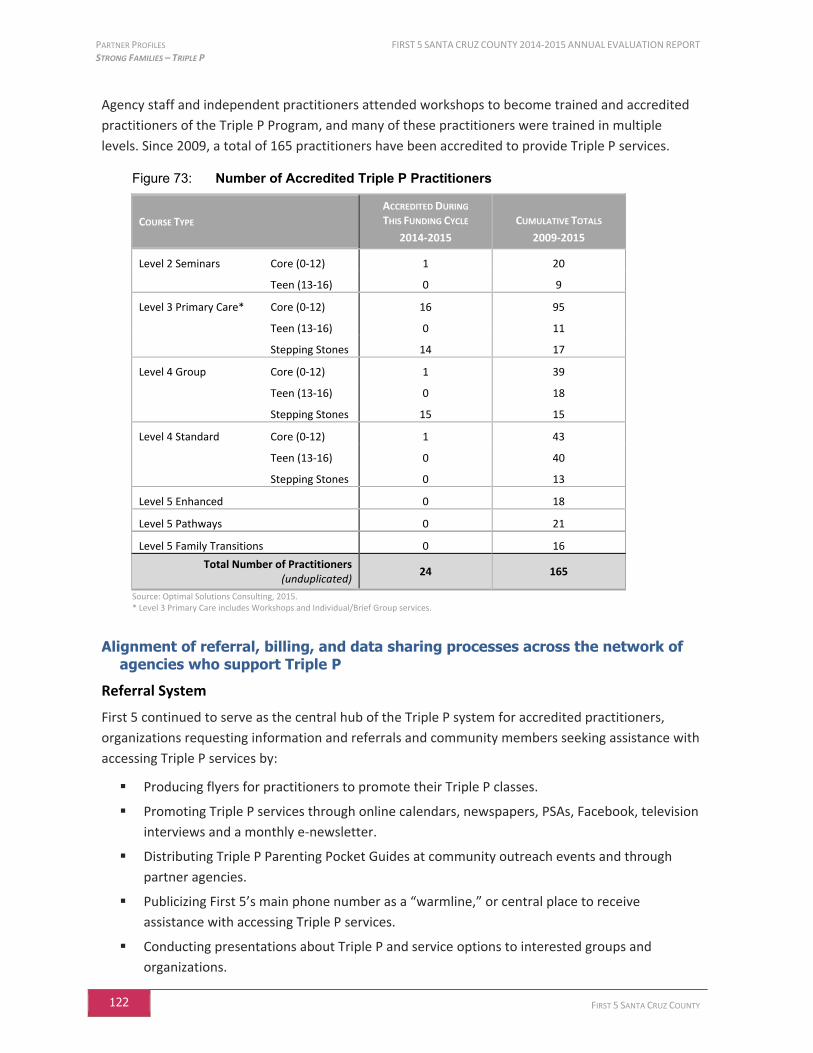
PARTNER PROFILES FIRST 5 SANTA CRUZ COUNTY 2014-2015 ANNUAL EVALUATION REPORT STRONG FAMILIES – TRIPLE P
122 FIRST 5 SANTA CRUZ COUNTY
Agency staff and independent practitioners attended workshops to become trained and accredited
practitioners of the Triple P Program, and many of these practitioners were trained in multiple
levels. Since 2009, a total of 165 practitioners have been accredited to provide Triple P services.
Figure 73: Number of Accredited Triple P Practitioners
COURSE TYPE
ACCREDITED DURING THIS FUNDING CYCLE
2014-2015
CUMULATIVE TOTALS
2009-2015
Level 2 Seminars Core (0-12) 1 20
Teen (13-16) 0 9
Level 3 Primary Care* Core (0-12) 16 95
Teen (13-16) 0 11
Stepping Stones 14 17
Level 4 Group Core (0-12) 1 39
Teen (13-16) 0 18
Stepping Stones 15 15
Level 4 Standard Core (0-12) 1 43
Teen (13-16) 0 40
Stepping Stones 0 13
Level 5 Enhanced 0 18
Level 5 Pathways 0 21
Level 5 Family Transitions 0 16
Total Number of Practitioners (unduplicated)
24 165
Source: Optimal Solutions Consulting, 2015. * Level 3 Primary Care includes Workshops and Individual/Brief Group services.
Alignment of referral, billing, and data sharing processes across the network of agencies who support Triple P
Referral System
First 5 continued to serve as the central hub of the Triple P system for accredited practitioners,
organizations requesting information and referrals and community members seeking assistance with
accessing Triple P services by:
Producing flyers for practitioners to promote their Triple P classes.
Promoting Triple P services through online calendars, newspapers, PSAs, Facebook, television
interviews and a monthly e-newsletter.
Distributing Triple P Parenting Pocket Guides at community outreach events and through
partner agencies.
Publicizing First 5’s main phone number as a “warmline,” or central place to receive
assistance with accessing Triple P services.
Conducting presentations about Triple P and service options to interested groups and
organizations.
FIRST 5 SANTA CRUZ COUNTY 2014-2015 ANNUAL EVALUATION REPORT PARTNER PROFILES STRONG FAMILIES – TRIPLE P
FIRST 5 SANTA CRUZ COUNTY 123
Billing and Funding
First 5, Health Services Agency (Children’s Mental Health), and the Human Services Department
continued their collaborative system for funding Triple P trainings, parent resources, and services.
Children’s Mental Health contracted with First 5 to implement Prevention and Early
Intervention strategies in the Mental Health Services Act (MHSA) Plan, including the
coordination and implementation of Triple P.
First 5 blended its own resources with funds from Children’s Mental Health to contract with
Triple P America and organizations providing specific Triple P services. This blended funding
strategy streamlined billing procedures and reporting requirements, which allowed resources
to be used in a more flexible and coordinated manner.
Agencies that were approved Medi-Cal providers billed EPSDT for Triple P services.
Families in the Child Welfare System received services funded from a contract between the
Human Services Department (HSD) and the Parents Center.
Data Sharing
Practitioners are trained to obtain parents’ informed consent to participate in the evaluation of the
Triple P program, collect the required intake and assessment data, and submit the data to First 5 on
a monthly basis. Specific protocols have been established to protect the privacy and confidentiality
of parents participating in Triple P services. First 5 continued to proof all assessment data to ensure
completeness and accuracy and provided real-time feedback to practitioners, which has been crucial
to ensuring the integrity of Triple P outcomes.
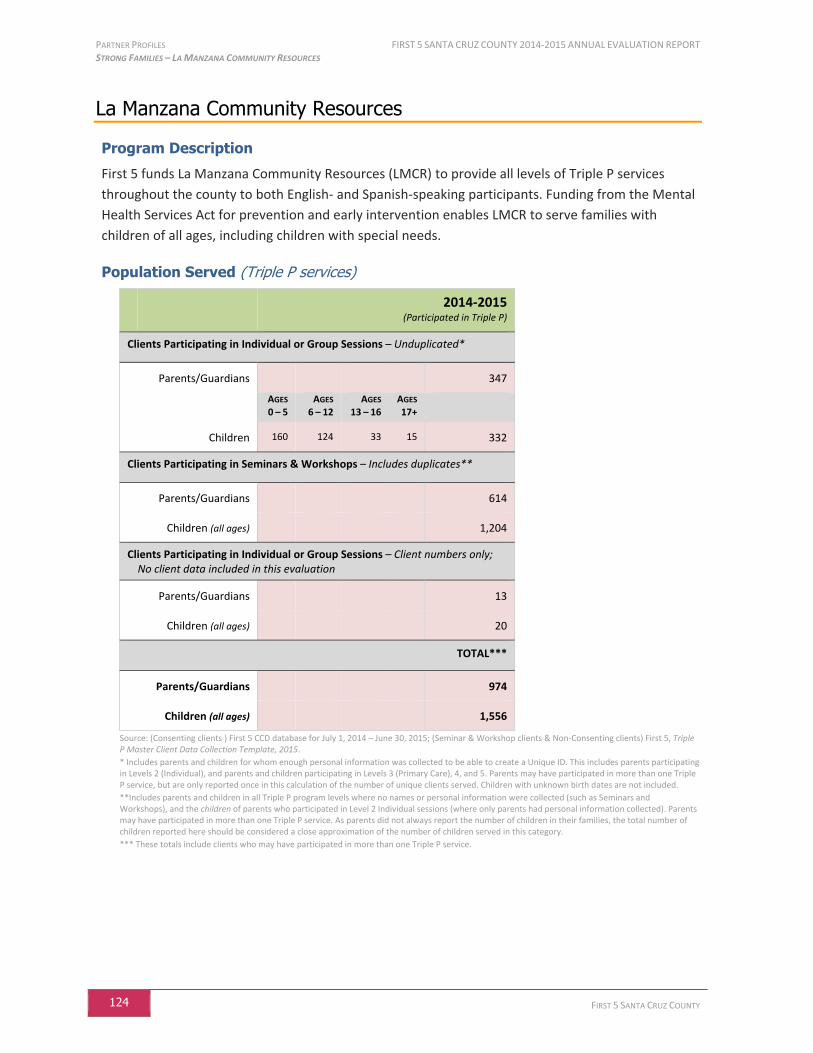
PARTNER PROFILES FIRST 5 SANTA CRUZ COUNTY 2014-2015 ANNUAL EVALUATION REPORT STRONG FAMILIES – LA MANZANA COMMUNITY RESOURCES
124 FIRST 5 SANTA CRUZ COUNTY
La Manzana Community Resources
Program Description
First 5 funds La Manzana Community Resources (LMCR) to provide all levels of Triple P services
throughout the county to both English- and Spanish-speaking participants. Funding from the Mental
Health Services Act for prevention and early intervention enables LMCR to serve families with
children of all ages, including children with special needs.
Population Served (Triple P services)
2014-2015(Participated in Triple P)
Clients Participating in Individual or Group Sessions – Unduplicated*
Parents/Guardians 347
AGES
0 – 5 AGES
6 – 12 AGES
13 – 16 AGES
17+
Children 160 124 33 15 332
Clients Participating in Seminars & Workshops – Includes duplicates**
Parents/Guardians 614
Children (all ages) 1,204
Clients Participating in Individual or Group Sessions – Client numbers only; No client data included in this evaluation
Parents/Guardians 13
Children (all ages) 20
TOTAL***
Parents/Guardians 974
Children (all ages) 1,556
Source: (Consenting clients ) First 5 CCD database for July 1, 2014 – June 30, 2015; (Seminar & Workshop clients & Non-Consenting clients) First 5, Triple P Master Client Data Collection Template, 2015.
* Includes parents and children for whom enough personal information was collected to be able to create a Unique ID. This includes parents participating in Levels 2 (Individual), and parents and children participating in Levels 3 (Primary Care), 4, and 5. Parents may have participated in more than one Triple P service, but are only reported once in this calculation of the number of unique clients served. Children with unknown birth dates are not included.
**Includes parents and children in all Triple P program levels where no names or personal information were collected (such as Seminars and Workshops), and the children of parents who participated in Level 2 Individual sessions (where only parents had personal information collected). Parents may have participated in more than one Triple P service. As parents did not always report the number of children in their families, the total number of children reported here should be considered a close approximation of the number of children served in this category.
*** These totals include clients who may have participated in more than one Triple P service.
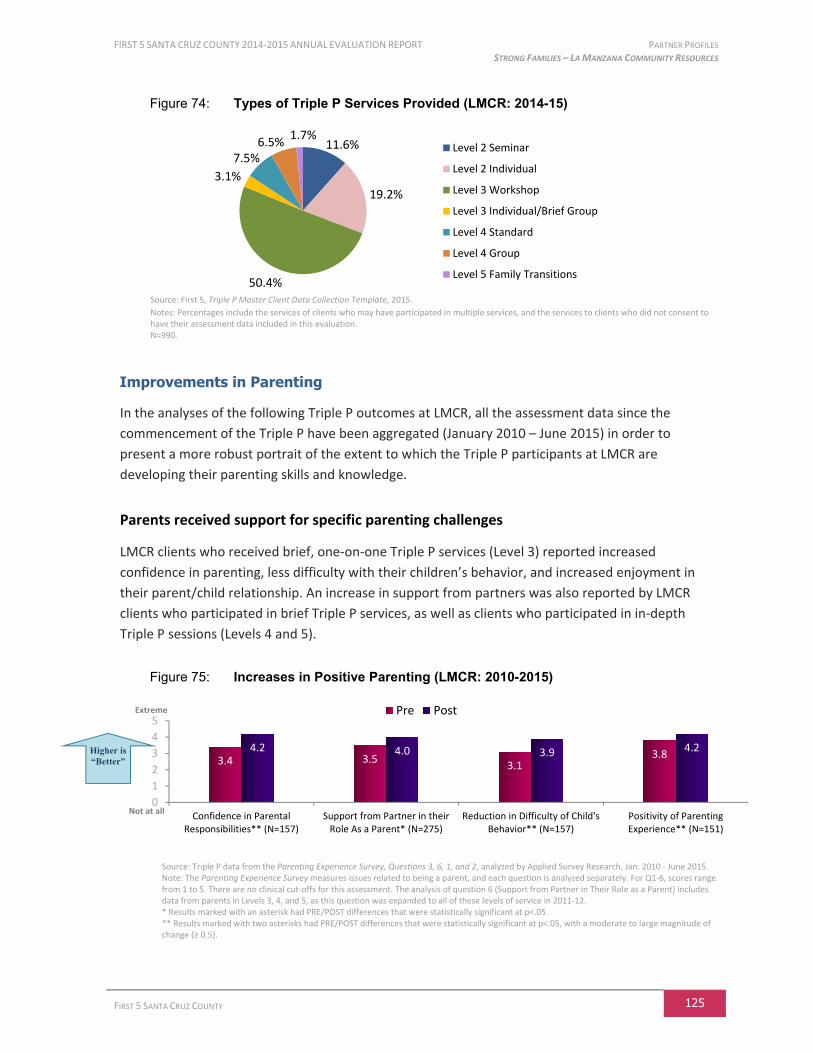
FIRST 5 SANTA CRUZ COUNTY 2014-2015 ANNUAL EVALUATION REPORT PARTNER PROFILES STRONG FAMILIES – LA MANZANA COMMUNITY RESOURCES
FIRST 5 SANTA CRUZ COUNTY 125
Figure 74: Types of Triple P Services Provided (LMCR: 2014-15)
Source: First 5, Triple P Master Client Data Collection Template, 2015.
Notes: Percentages include the services of clients who may have participated in multiple services, and the services to clients who did not consent to have their assessment data included in this evaluation. N=990.
Improvements in Parenting
In the analyses of the following Triple P outcomes at LMCR, all the assessment data since the
commencement of the Triple P have been aggregated (January 2010 – June 2015) in order to
present a more robust portrait of the extent to which the Triple P participants at LMCR are
developing their parenting skills and knowledge.
Parents received support for specific parenting challenges
LMCR clients who received brief, one-on-one Triple P services (Level 3) reported increased
confidence in parenting, less difficulty with their children’s behavior, and increased enjoyment in
their parent/child relationship. An increase in support from partners was also reported by LMCR
clients who participated in brief Triple P services, as well as clients who participated in in-depth
Triple P sessions (Levels 4 and 5).
Figure 75: Increases in Positive Parenting (LMCR: 2010-2015)
Source: Triple P data from the Parenting Experience Survey, Questions 3, 6, 1, and 2, analyzed by Applied Survey Research, Jan. 2010 - June 2015. Note: The Parenting Experience Survey measures issues related to being a parent, and each question is analyzed separately. For Q1-6, scores range from 1 to 5. There are no clinical cut-offs for this assessment. The analysis of question 6 (Support from Partner in Their Role as a Parent) includes data from parents in Levels 3, 4, and 5, as this question was expanded to all of these levels of service in 2011-12. * Results marked with an asterisk had PRE/POST differences that were statistically significant at p<.05. ** Results marked with two asterisks had PRE/POST differences that were statistically significant at p<.05, with a moderate to large magnitude of change (≥ 0.5).
11.6%
19.2%
50.4%
3.1%
7.5%6.5%
1.7%Level 2 Seminar
Level 2 Individual
Level 3 Workshop
Level 3 Individual/Brief Group
Level 4 Standard
Level 4 Group
Level 5 Family Transitions
3.4 3.53.1
3.84.2 4.0 3.9 4.2
0
1
2
3
4
5
Confidence in ParentalResponsibilities** (N=157)
Support from Partner in theirRole As a Parent* (N=275)
Reduction in Difficulty of Child'sBehavior** (N=157)
Positivity of ParentingExperience** (N=151)
Pre PostExtreme
Not at all
Higher is “Better”
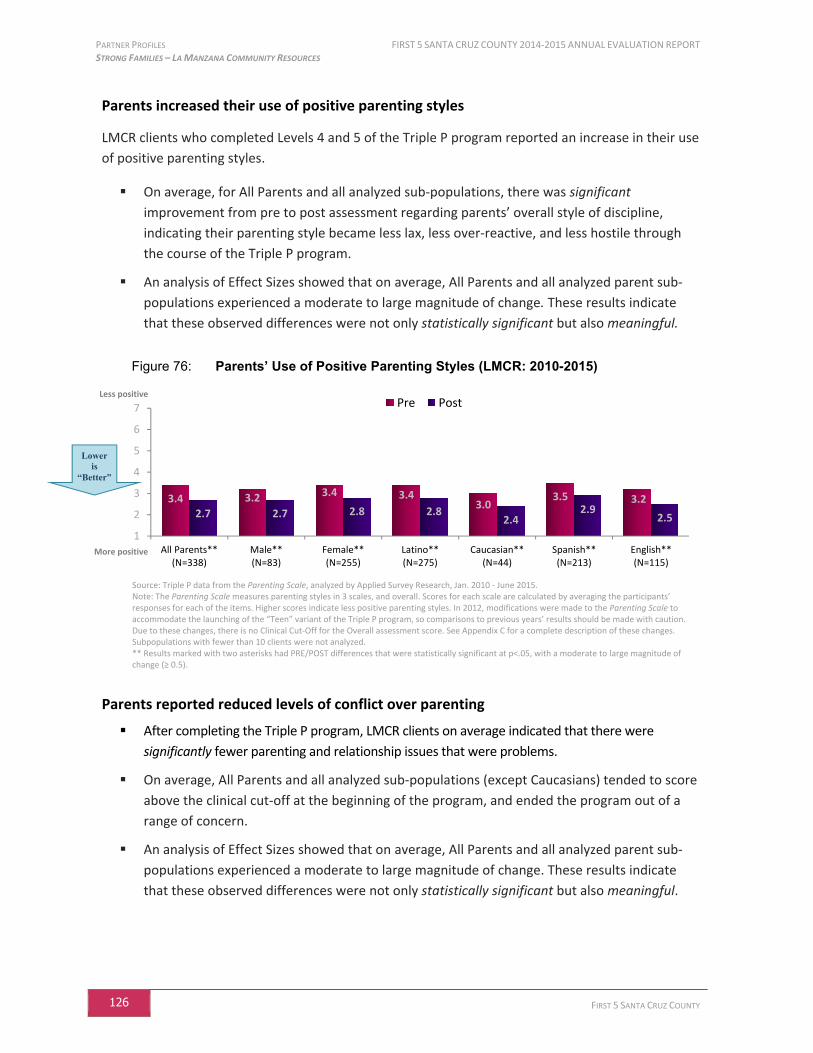
PARTNER PROFILES FIRST 5 SANTA CRUZ COUNTY 2014-2015 ANNUAL EVALUATION REPORT STRONG FAMILIES – LA MANZANA COMMUNITY RESOURCES
126 FIRST 5 SANTA CRUZ COUNTY
Parents increased their use of positive parenting styles
LMCR clients who completed Levels 4 and 5 of the Triple P program reported an increase in their use
of positive parenting styles.
On average, for All Parents and all analyzed sub-populations, there was significant
improvement from pre to post assessment regarding parents’ overall style of discipline,
indicating their parenting style became less lax, less over-reactive, and less hostile through
the course of the Triple P program.
An analysis of Effect Sizes showed that on average, All Parents and all analyzed parent sub-
populations experienced a moderate to large magnitude of change. These results indicate
that these observed differences were not only statistically significant but also meaningful.
Figure 76: Parents’ Use of Positive Parenting Styles (LMCR: 2010-2015)
Source: Triple P data from the Parenting Scale, analyzed by Applied Survey Research, Jan. 2010 - June 2015. Note: The Parenting Scale measures parenting styles in 3 scales, and overall. Scores for each scale are calculated by averaging the participants’ responses for each of the items. Higher scores indicate less positive parenting styles. In 2012, modifications were made to the Parenting Scale to accommodate the launching of the “Teen” variant of the Triple P program, so comparisons to previous years’ results should be made with caution. Due to these changes, there is no Clinical Cut-Off for the Overall assessment score. See Appendix C for a complete description of these changes. Subpopulations with fewer than 10 clients were not analyzed. ** Results marked with two asterisks had PRE/POST differences that were statistically significant at p<.05, with a moderate to large magnitude of change (≥ 0.5).
Parents reported reduced levels of conflict over parenting
After completing the Triple P program, LMCR clients on average indicated that there were
significantly fewer parenting and relationship issues that were problems.
On average, All Parents and all analyzed sub-populations (except Caucasians) tended to score
above the clinical cut-off at the beginning of the program, and ended the program out of a
range of concern.
An analysis of Effect Sizes showed that on average, All Parents and all analyzed parent sub-
populations experienced a moderate to large magnitude of change. These results indicate
that these observed differences were not only statistically significant but also meaningful.
3.4 3.2 3.4 3.43.0
3.5 3.22.7 2.7 2.8 2.8
2.42.9
2.5
1
2
3
4
5
6
7
All Parents**(N=338)
Male**(N=83)
Female**(N=255)
Latino**(N=275)
Caucasian**(N=44)
Spanish**(N=213)
English**(N=115)
Pre PostLess positive
More positive
Lower is
“Better”
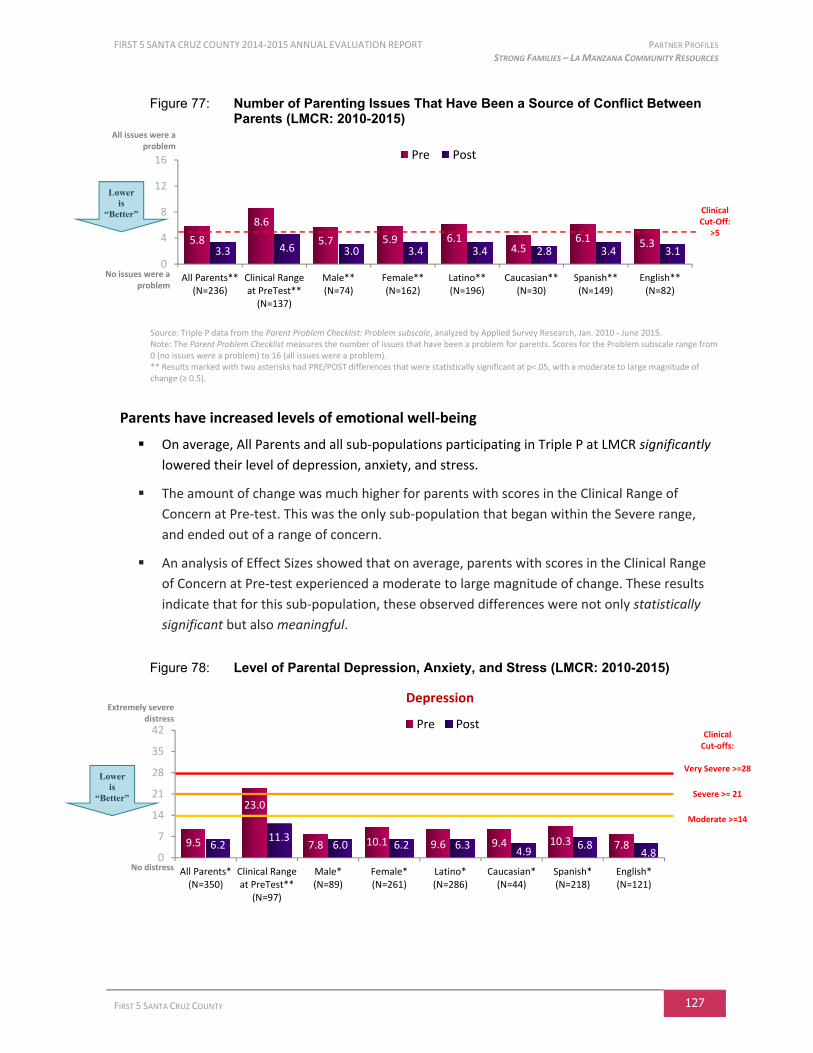
FIRST 5 SANTA CRUZ COUNTY 2014-2015 ANNUAL EVALUATION REPORT PARTNER PROFILES STRONG FAMILIES – LA MANZANA COMMUNITY RESOURCES
FIRST 5 SANTA CRUZ COUNTY 127
Figure 77: Number of Parenting Issues That Have Been a Source of Conflict Between Parents (LMCR: 2010-2015)
Source: Triple P data from the Parent Problem Checklist: Problem subscale, analyzed by Applied Survey Research, Jan. 2010 - June 2015. Note: The Parent Problem Checklist measures the number of issues that have been a problem for parents. Scores for the Problem subscale range from 0 (no issues were a problem) to 16 (all issues were a problem). ** Results marked with two asterisks had PRE/POST differences that were statistically significant at p<.05, with a moderate to large magnitude of change (≥ 0.5).
Parents have increased levels of emotional well-being
On average, All Parents and all sub-populations participating in Triple P at LMCR significantly
lowered their level of depression, anxiety, and stress.
The amount of change was much higher for parents with scores in the Clinical Range of
Concern at Pre-test. This was the only sub-population that began within the Severe range,
and ended out of a range of concern.
An analysis of Effect Sizes showed that on average, parents with scores in the Clinical Range
of Concern at Pre-test experienced a moderate to large magnitude of change. These results
indicate that for this sub-population, these observed differences were not only statistically
significant but also meaningful.
Figure 78: Level of Parental Depression, Anxiety, and Stress (LMCR: 2010-2015)
Depression
5.8
8.6
5.7 5.9 6.14.5
6.1 5.33.3 4.6 3.0 3.4 3.4 2.8 3.4 3.1
0
4
8
12
16
All Parents**(N=236)
Clinical Rangeat PreTest**
(N=137)
Male**(N=74)
Female**(N=162)
Latino**(N=196)
Caucasian**(N=30)
Spanish**(N=149)
English**(N=82)
Pre Post
9.5
23.0
7.8 10.1 9.6 9.4 10.3 7.86.211.3
6.0 6.2 6.34.9
6.84.80
7
14
21
28
35
42
All Parents*(N=350)
Clinical Rangeat PreTest**
(N=97)
Male*(N=89)
Female*(N=261)
Latino*(N=286)
Caucasian*(N=44)
Spanish*(N=218)
English*(N=121)
Pre Post
No issues were a problem
Clinical Cut-Off:
>5
Lower is
“Better”
All issues were a problem
Extremely severe distress
No distress
Clinical Cut-offs:
Very Severe >=28
Severe >= 21
Moderate >=14
Lower is
“Better”

PARTNER PROFILES FIRST 5 SANTA CRUZ COUNTY 2014-2015 ANNUAL EVALUATION REPORT STRONG FAMILIES – LA MANZANA COMMUNITY RESOURCES
128 FIRST 5 SANTA CRUZ COUNTY
Anxiety
Stress
Source: Triple P data from the Depression, Anxiety, and Stress Scale – Short Version (DASS-21), analyzed by Applied Survey Research, Jan. 2010 - June 2015. Note: The Depression, Anxiety, and Stress Scale – Short Version (DASS-21) measures distress along 3 scales: Depression, Anxiety, Stress. Scores for each scale are calculated by summing the participants’ responses for each of the 21 items. Higher scores on each of the scales indicate greater levels of depression, anxiety, and stress. Each scale has different clinical cut-offs for the 5 severity levels: normal, mild, moderate, severe, and very severe. * Results marked with an asterisk had PRE/POST differences that were statistically significant at p<.05. ** Results marked with two asterisks had PRE/POST differences that were statistically significant at p<.05, with a moderate to large magnitude of change (≥ 0.5).
Parents reported improved child behavior
After completing the Triple P Program at LMCR, parents reported a decrease in the frequency and
number of problematic child behaviors.
On average, for All Parents and all sub-populations, there was a significant reduction in the
number of child behaviors that were perceived to be a problem. On average, all parent
populations (except Males) began with scores within the clinical range, and ended with
scores that were out of the clinical range.
An analysis of Effect Sizes showed that on average, All Parents and all parent sub-populations
experienced a moderate to large magnitude of change. These results indicate that these
observed differences were not only statistically significant but also meaningful.
8.0
18.3
6.08.7
8.2 6.8 8.7 6.45.5 9.44.9 5.7 5.6 4.0
5.94.30
7
14
21
28
35
42
All Parents*(N=350)
ClinicalRange at
PreTest**(N=121)
Male(N=89)
Female*(N=261)
Latino*(N=286)
Caucasian*(N=44)
Spanish*(N=218)
English*(N=121)
Pre Post
12.7
27.6
9.913.6 12.5
14.212.5 12.6
8.5
13.7
7.7 8.7 8.4 8.1 8.5 8.00
7
14
21
28
35
42
All Parents*(N=349)
ClinicalRange at
PreTest**(N=80)
Male*(N=89)
Female*(N=260)
Latino*(N=285)
Caucasian**(N=44)
Spanish*(N=217)
English**(N=121)
Pre Post
Extremely severe distress
No distress
Clinical Cut-offs:
Very Severe >=20
Severe >=15
Moderate >=10
Extremely severe distress
No distress
Clinical Cut-offs:
Very Severe >=34
Severe >=26
Moderate >=19
Lower is
“Better”
Lower is
“Better”

FIRST 5 SANTA CRUZ COUNTY 2014-2015 ANNUAL EVALUATION REPORT PARTNER PROFILES STRONG FAMILIES – LA MANZANA COMMUNITY RESOURCES
FIRST 5 SANTA CRUZ COUNTY 129
Figure 79: Number of Child Behaviors Perceived to Be a Problem (LMCR: 2010-2015)
Source: Triple P data from the Eyberg Child Behavior Inventory, analyzed by Applied Survey Research, Jan. 2010 - June 2015.
Note: The Eyberg Child Behavior Inventory measures the frequency with which certain child behaviors occur (Intensity subscale), and whether parents view those behaviors to be a problem (Problem subscale). Intensity scores could range from 36 (Never occurs) to 252 (Always occurs), and Problem scores ranged from 0 (No) to 36 (Yes), with higher scores indicating greater numbers of problem behaviors and greater likelihood that these behaviors were a problem to the parent.
** Results marked with two asterisks had PRE/POST differences that were statistically significant at p<.05, with a moderate to large magnitude of change (≥ 0.5).
Parents Reported High Satisfaction with Services
LMCR parents receiving Triple P services reported high levels of satisfaction with the program.
Parents participating in Levels 3 (Individual or Brief Group), 4, and 5 of the Triple P Program
reported a high level of satisfaction with various aspects of the program experience. Most
parents felt the highest satisfaction with how the program
helped them to deal more effectively with their child’s
behavior (6.55), and with the quality of the service they
and their child received (6.54, on a 7-point scale).
The average parent satisfaction ratings for Level 3
Workshops ranged from 4.69 to 4.78, and Level 2
Seminars ranged from 4.75 to 4.84, on the 5-point scale.
Virtually all parents felt that the program answered their
questions, that they would continue to use the tip sheets,
and were very satisfied with the services they received.
16.2
23.0
14.0 16.9 16.4 15.5 16.6 15.0
7.8 10.96.4 8.3 8.0 7.5
8.6 6.20
6
12
18
24
30
36
All Parents**(N=314)
Clinical Rangeat PreTest**
(N=175)
Male**(N=76)
Female**(N=238)
Latino**(N=261)
Caucasian**(N=35)
Spanish**(N=204)
English**(N=102)
Pre PostAll behaviors were
a problem
No behaviors were a problem
Clinical Cut-off:
>=15
Lower is
“Better”
What Parents Are Saying
“I enjoyed learning ways to deal with my child’s tantrums, and to positively improve communication.”
“I have practiced what I learned in class, about how to communicate with words and not reacting. It works for me.”
“I really liked how I was always offered ‘tools’ to work with my child. I would learn and practice at home with my child. I have gotten great results and my child has greatly improved in her behaviors!”
“I’m very pleased with the help I have received. I would definitely recommend these services to another father.”
- Triple P Client Satisfaction Surveys

PARTNER PROFILES FIRST 5 SANTA CRUZ COUNTY 2014-2015 ANNUAL EVALUATION REPORT STRONG FAMILIES – LA MANZANA COMMUNITY RESOURCES
130 FIRST 5 SANTA CRUZ COUNTY
Figure 80: Parents’ Satisfaction with Various Aspects of the Triple P Program (LMCR: 2010-2015)
Levels 3 (Individual or Brief Group), 4, and 5
Source: Triple P data from the Parent Satisfaction Survey, analyzed by Applied Survey Research, Jan. 2010 - June 2015. Note: All items were on a 7-point scale. Higher scores indicate greater satisfaction.
Level 3 Workshops
Source: Triple P data from the Workshop Satisfaction Survey, analyzed by Applied Survey Research, Jan. 2010 - June 2015.
Note: All items were on a 5-point scale. Higher scores indicate greater satisfaction.
Level 2 Seminars
Source: Triple P data from the Seminar Satisfaction Survey, analyzed by Applied Survey Research, Jan. 2010 - June 2015.
Note: All items were on a 5-point scale. Higher scores indicate greater satisfaction.
N=389.
6.36
6.48
6.55
6.54
1 2 3 4 5 6 7
11. Has the program helped you to develop skills that can be appliedto other family members? (N=502)
7. Has the program helped you to deal more effectively withproblems that arise in your family? (N=511)
6. Has the program helped you to deal more effectively with yourchild's behavior? (N=511)
1. How would you rate the quality of the service you and your childreceived? (N=511)
4.78
4.77
4.69
1 2 3 4 5
3. Overall I was satisfied with the workshop.(N=1,462)
2. I am likely to use some of the parentingstrategies in the tip sheet. (N=1,454)
1. The workshop answered a question or concernI have had about parenting. (N=1,460)
4.81
4.84
4.75
1 2 3 4 5
3. Overall I was satisfied with the seminar
2. I am likely to use some of the parentingstrategies in the tip sheet.
1. The seminar answered a question or concernI have had about parenting.

FIRST 5 SANTA CRUZ COUNTY 2014-2015 ANNUAL EVALUATION REPORT PARTNER PROFILES STRONG FAMILIES – MOUNTAIN COMMUNITY RESOURCES
FIRST 5 SANTA CRUZ COUNTY 131
Mountain Community Resources
Program Description
First 5 funds Mountain Community Resources (MCR) to provide all levels of Triple P services,
primarily in the San Lorenzo Valley, Scotts Valley, and Santa Cruz communities, to both English- and
Spanish-speaking participants. Funding from the Mental Health Services Act for prevention and early
intervention enables MCR to serve families with children of all ages, including children with special
needs.
Population Served (Triple P services)
2014-2015(Participated in Triple P)
Clients Participating in Individual or Group Sessions – Unduplicated*
Parents/Guardians 66
AGES
0 – 5 AGES
6 – 12 AGES
13 – 16 AGES
17+
Children 39 46 22 6 113
Clients Participating in Seminars & Workshops – Includes duplicates**
Parents/Guardians 138
Children (all ages) 216
Clients Participating in Individual or Group Sessions – Client numbers only; No client data included in this evaluation
Parents/Guardians 3
Children (all ages) 4
TOTAL***
Parents/Guardians 207
Children (all ages) 333
Source: (Consenting clients ) First 5 CCD database for July 1, 2014 – June 30, 2015; (Seminar & Workshop clients & Non-Consenting clients) First 5, Triple P Master Client Data Collection Template, 2015.
* Includes parents and children for whom enough personal information was collected to be able to create a Unique ID. This includes parents participating in Levels 2 (Individual), and parents and children participating in Levels 3 (Primary Care), 4, and 5. Parents may have participated in more than one Triple P service, but are only reported once in this calculation of the number of unique clients served. Children with unknown birth dates are not included.
**Includes parents and children in all Triple P program levels where no names or personal information were collected (such as Seminars and Workshops), and the children of parents who participated in Level 2 Individual sessions (where only parents had personal information collected). Parents may have participated in more than one Triple P service. As parents did not always report the number of children in their families, the total number of children reported here should be considered a close approximation of the number of children served in this category.
*** These totals include clients who may have participated in more than one Triple P service.
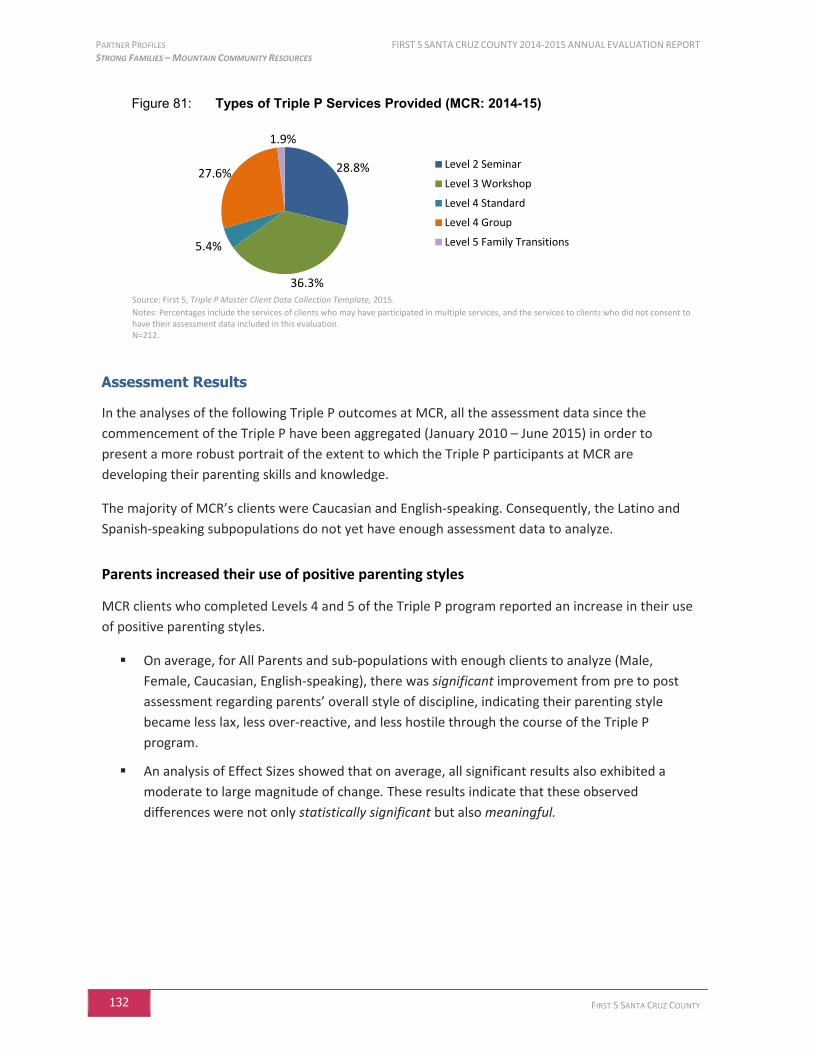
PARTNER PROFILES FIRST 5 SANTA CRUZ COUNTY 2014-2015 ANNUAL EVALUATION REPORT STRONG FAMILIES – MOUNTAIN COMMUNITY RESOURCES
132 FIRST 5 SANTA CRUZ COUNTY
Figure 81: Types of Triple P Services Provided (MCR: 2014-15)
Source: First 5, Triple P Master Client Data Collection Template, 2015.
Notes: Percentages include the services of clients who may have participated in multiple services, and the services to clients who did not consent to have their assessment data included in this evaluation. N=212.
Assessment Results
In the analyses of the following Triple P outcomes at MCR, all the assessment data since the
commencement of the Triple P have been aggregated (January 2010 – June 2015) in order to
present a more robust portrait of the extent to which the Triple P participants at MCR are
developing their parenting skills and knowledge.
The majority of MCR’s clients were Caucasian and English-speaking. Consequently, the Latino and
Spanish-speaking subpopulations do not yet have enough assessment data to analyze.
Parents increased their use of positive parenting styles
MCR clients who completed Levels 4 and 5 of the Triple P program reported an increase in their use
of positive parenting styles.
On average, for All Parents and sub-populations with enough clients to analyze (Male,
Female, Caucasian, English-speaking), there was significant improvement from pre to post
assessment regarding parents’ overall style of discipline, indicating their parenting style
became less lax, less over-reactive, and less hostile through the course of the Triple P
program.
An analysis of Effect Sizes showed that on average, all significant results also exhibited a
moderate to large magnitude of change. These results indicate that these observed
differences were not only statistically significant but also meaningful.
28.8%
36.3%
5.4%
27.6%
1.9%
Level 2 Seminar
Level 3 Workshop
Level 4 Standard
Level 4 Group
Level 5 Family Transitions

FIRST 5 SANTA CRUZ COUNTY 2014-2015 ANNUAL EVALUATION REPORT PARTNER PROFILES STRONG FAMILIES – MOUNTAIN COMMUNITY RESOURCES
FIRST 5 SANTA CRUZ COUNTY 133
Figure 82: Parents’ Use of Positive Parenting Styles (MCR: 2010-2015)
Source: Triple P data from the Parenting Scale, analyzed by Applied Survey Research, Jan. 2010 - June 2015. Note: The Parenting Scale measures parenting styles in 3 scales, and overall. Scores for each scale are calculated by averaging the participants’ responses for each of the items. Higher scores indicate less positive parenting styles. In 2012, modifications were made to the Parenting Scale to accommodate the launching of the “Teen” variant of the Triple P program, so comparisons to previous years’ results should be made with caution. Due to these changes, there is no Clinical Cut-Off for the Overall assessment score. See Appendix C for a complete description of these changes. Subpopulations with fewer than 10 clients were not analyzed. ** Results marked with two asterisks had PRE/POST differences that were statistically significant at p<.05, with a moderate to large magnitude of change (≥ 0.5).
Parents reported reduced levels of conflict over parenting
After completing the Triple P program, MCR clients on average indicated that there were
significantly fewer parenting and relationship issues that were problems.
An analysis of Effect Sizes showed that on average, All Parents and all analyzed parent sub-
populations experienced a moderate to large magnitude of change. These results indicate
that these observed differences were not only statistically significant but also meaningful.
Although the Male sub-population demonstrated reduced levels of conflict, on average the
amount of improvement was not significant.
Figure 83: Number of Parenting Issues That Have Been a Source of Conflict Between Parents (MCR: 2010-2015)
Source: Triple P data from the Parent Problem Checklist: Problem subscale, analyzed by Applied Survey Research, Jan. 2010 - June 2015. Note: The Parent Problem Checklist measures the number of issues that have been a problem for parents. Scores for the Problem subscale range from 0 (no issues were a problem) to 16 (all issues were a problem). ** Results marked with two asterisks had PRE/POST differences that were statistically significant at p<.05, with a moderate to large magnitude of change (≥ 0.5).
3.0 3.0 3.0 2.93.0
2.3 2.4 2.3 2.3 2.31
2
3
4
5
6
7
All Parents**(N=70)
Male **(N=26)
Female**(N=44)
Caucasian**(N=55)
English**(N=64)
Pre Post
7.8 8.9 7.7 7.9 7.1 7.5
5.8 6.4 6.5 5.4 5.4 5.8
0
4
8
12
16
All Parents**(N=65)
Clinical Rangeat PreTest**
(N=54)
Male(N=24)
Female**(N=41)
Caucasian**(N=51)
English**(N=60)
Pre Post
Less positive
More positive
Lower is
“Better”
No issues were a problem
Clinical Cut-Off:
>5
Lower is
“Better”
All issues were a problem

PARTNER PROFILES FIRST 5 SANTA CRUZ COUNTY 2014-2015 ANNUAL EVALUATION REPORT STRONG FAMILIES – MOUNTAIN COMMUNITY RESOURCES
134 FIRST 5 SANTA CRUZ COUNTY
Parents have increased levels of emotional well-being
On average, All Parents and most sub-populations (Females, Caucasians, and English-
speaking clients) participating in Triple P at MCR significantly lowered their level of
depression, anxiety, and stress.
The amount of change was much higher for parents with scores in the Clinical Range of
Concern at Pre-test. This was the only sub-population that began within the Severe range,
and ended out of a range of concern.
Levels of stress were particularly improved. An analysis of Effect Sizes showed that on
average, All Parents and most sub-populations (Females, Caucasians, and English-speaking
clients) experienced a moderate to large magnitude of change in their levels of stress. These
results indicate that for these sub-populations, observed differences were not only
statistically significant but also meaningful.
Figure 84: Level of Parental Depression, Anxiety, and Stress (MCR: 2010-2015)
Depression
Anxiety
8.4
24.3
4.410.7
8.1 8.05.09.7
4.7 5.2 4.9 5.20
7
14
21
28
35
42
All Parents*(N=70)
Clinical Rangeat PreTest**
(N=12)
Male(N=26)
Female**(N=44)
Caucasian*(N=55)
English*(N=64)
Pre Post
7.1
17.7
4.1
9.06.7 6.8
3.87.4
3.3 4.1 3.8 4.00
7
14
21
28
35
42
All Parents*(N=70)
Clinical Rangeat PreTest**
(N=22)
Male(N=26)
Female**(N=44)
Caucasian*(N=55)
English*(N=64)
Pre Post
Extremely severe distress
No distress
Clinical Cut-offs:
Very Severe >=28
Severe >= 21
Moderate >=14
Extremely severe distress
No distress
Clinical Cut-offs:
Very Severe >=20
Severe >=15
Moderate >=10
Lower is
“Better”
Lower is
“Better”

FIRST 5 SANTA CRUZ COUNTY 2014-2015 ANNUAL EVALUATION REPORT PARTNER PROFILES STRONG FAMILIES – MOUNTAIN COMMUNITY RESOURCES
FIRST 5 SANTA CRUZ COUNTY 135
Stress
Source: Triple P data from the Depression, Anxiety, and Stress Scale – Short Version (DASS-21), analyzed by Applied Survey Research, Jan. 2010 - June 2015. Note: The Depression, Anxiety, and Stress Scale – Short Version (DASS-21) measures distress along 3 scales: Depression, Anxiety, Stress. Scores for each scale are calculated by summing the participants’ responses for each of the 21 items. Higher scores on each of the scales indicate greater levels of depression, anxiety, and stress. Each scale has different clinical cut-offs for the 5 severity levels: normal, mild, moderate, severe, and very severe. * Results marked with an asterisk had PRE/POST differences that were statistically significant at p<.05. ** Results marked with two asterisks had PRE/POST differences that were statistically significant at p<.05, with a moderate to large magnitude of change (≥ 0.5).
Parents reported improved child behavior
After completing the Triple P Program, MCR clients reported a decrease in the number of child
behaviors that were perceived to be a problem.
On average, for All Parents and sub-populations with enough clients to analyze, there was a
significant reduction in the number of child behaviors that were perceived to be a problem.
The amount of change was much higher for parents with scores in the Clinical Range of
Concern at Pre-test, and Males. Parents in these sub-populations began with scores within
the clinical range, and ended with scores that were out of the clinical range.
An analysis of Effect Sizes showed that on average, all significant results also exhibited a
moderate to large magnitude of change. These results indicate that these observed
differences were not only statistically significant but also meaningful.
16.1
25.6
13.517.7 16.0
16.3
10.514.3
10.6 10.5 10.7 11.1
0
7
14
21
28
35
42
All Parents**(N=70)
Clinical Rangeat PreTest**
(N=28)
Male*(N=26)
Female**(N=44)
Caucasian**(N=55)
English**(N=64)
Pre Post
Extremely severe distress
No distress
Clinical Cut-offs:
Very Severe >=34
Severe >=26
Moderate >=19
Lower is
“Better”
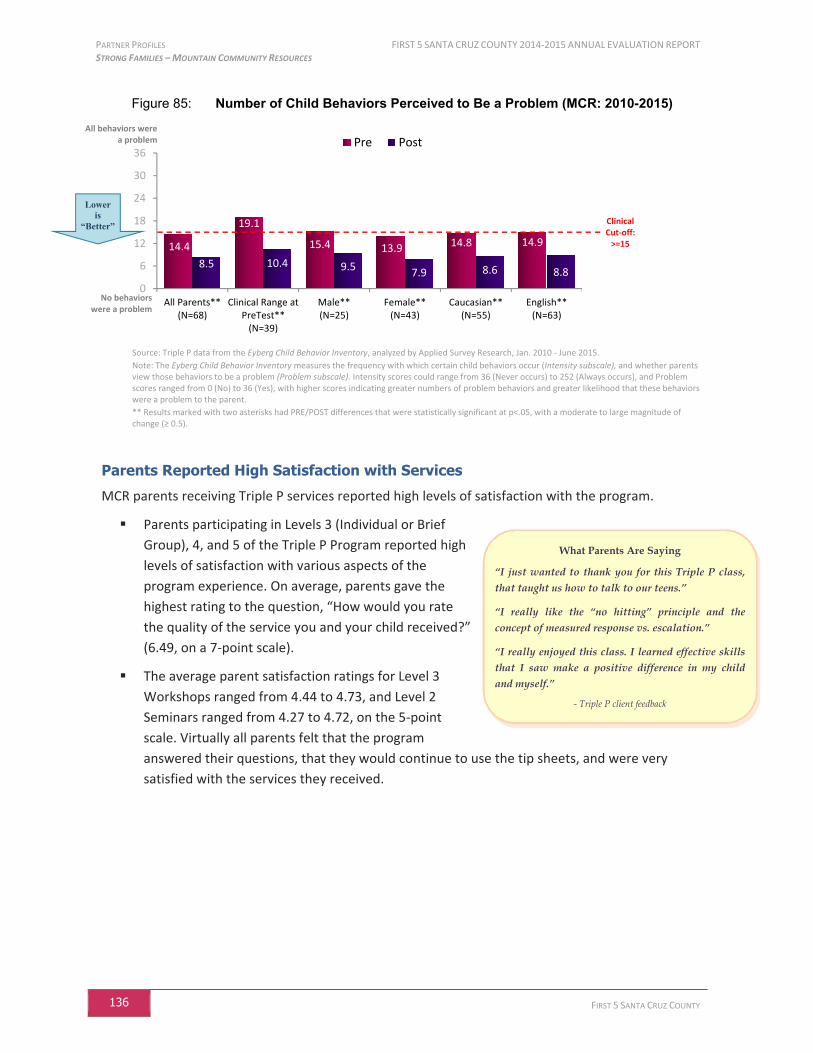
PARTNER PROFILES FIRST 5 SANTA CRUZ COUNTY 2014-2015 ANNUAL EVALUATION REPORT STRONG FAMILIES – MOUNTAIN COMMUNITY RESOURCES
136 FIRST 5 SANTA CRUZ COUNTY
Figure 85: Number of Child Behaviors Perceived to Be a Problem (MCR: 2010-2015)
Source: Triple P data from the Eyberg Child Behavior Inventory, analyzed by Applied Survey Research, Jan. 2010 - June 2015.
Note: The Eyberg Child Behavior Inventory measures the frequency with which certain child behaviors occur (Intensity subscale), and whether parents view those behaviors to be a problem (Problem subscale). Intensity scores could range from 36 (Never occurs) to 252 (Always occurs), and Problem scores ranged from 0 (No) to 36 (Yes), with higher scores indicating greater numbers of problem behaviors and greater likelihood that these behaviors were a problem to the parent.
** Results marked with two asterisks had PRE/POST differences that were statistically significant at p<.05, with a moderate to large magnitude of change (≥ 0.5).
Parents Reported High Satisfaction with Services
MCR parents receiving Triple P services reported high levels of satisfaction with the program.
Parents participating in Levels 3 (Individual or Brief
Group), 4, and 5 of the Triple P Program reported high
levels of satisfaction with various aspects of the
program experience. On average, parents gave the
highest rating to the question, “How would you rate
the quality of the service you and your child received?”
(6.49, on a 7-point scale).
The average parent satisfaction ratings for Level 3
Workshops ranged from 4.44 to 4.73, and Level 2
Seminars ranged from 4.27 to 4.72, on the 5-point
scale. Virtually all parents felt that the program
answered their questions, that they would continue to use the tip sheets, and were very
satisfied with the services they received.
14.4
19.1
15.4 13.9 14.8 14.9
8.5 10.4 9.57.9 8.6 8.8
0
6
12
18
24
30
36
All Parents**(N=68)
Clinical Range atPreTest**
(N=39)
Male**(N=25)
Female**(N=43)
Caucasian**(N=55)
English**(N=63)
Pre PostAll behaviors were
a problem
No behaviors were a problem
Clinical Cut-off:
>=15
Lower is
“Better”
What Parents Are Saying
“I just wanted to thank you for this Triple P class, that taught us how to talk to our teens.”
“I really like the “no hitting” principle and the concept of measured response vs. escalation.”
“I really enjoyed this class. I learned effective skills that I saw make a positive difference in my child and myself.”
- Triple P client feedback

FIRST 5 SANTA CRUZ COUNTY 2014-2015 ANNUAL EVALUATION REPORT PARTNER PROFILES STRONG FAMILIES – MOUNTAIN COMMUNITY RESOURCES
FIRST 5 SANTA CRUZ COUNTY 137
Figure 86: Parents’ Satisfaction with Various Aspects of the Triple P Program (MCR: 2010-2015)
Levels 3 (Individual or Brief Group), 4, and 5
Source: Triple P data from the Parent Satisfaction Survey, analyzed by Applied Survey Research, Jan. 2010 - June 2015. Note: All items were on a 7-point scale. Higher scores indicate greater satisfaction.
Level 3 Workshops
Source: Triple P data from the Workshop Satisfaction Survey, analyzed by Applied Survey Research, Jan. 2010 - June 2015. Note: All items were on a 5-point scale. Higher scores indicate greater satisfaction.
Level 2 Seminars
Source: Triple P data from the Seminar Satisfaction Survey, analyzed by Applied Survey Research, Jan. 2010 - June 2015. Note: All items were on a 5-point scale. Higher scores indicate greater satisfaction.
6.15
6.30
6.36
6.49
1 2 3 4 5 6 7
11. Has the program helped you to develop skills that can be appliedto other family members? (N=73)
7. Has the program helped you to deal more effectively withproblems that arise in your family? (N=74)
6. Has the program helped you to deal more effectively with yourchild's behavior? (N=74)
1. How would you rate the quality of the service you and your childreceived? (N=74)
4.67
4.73
4.44
1 2 3 4 5
3. Overall I was satisfied with the workshop.(N=363)
2. I am likely to use some of the parentingstrategies in the tip sheet. (N=364)
1. The workshop answered a question orconcern I have had about parenting. (N=366)
4.54
4.72
4.27
1 2 3 4 5
3. Overall I was satisfied with the seminar.(N=263)
2. I am likely to use some of the parentingstrategies in the tip sheet. (N=265)
1. The seminar answered a question orconcern I have had about parenting. (N=264)
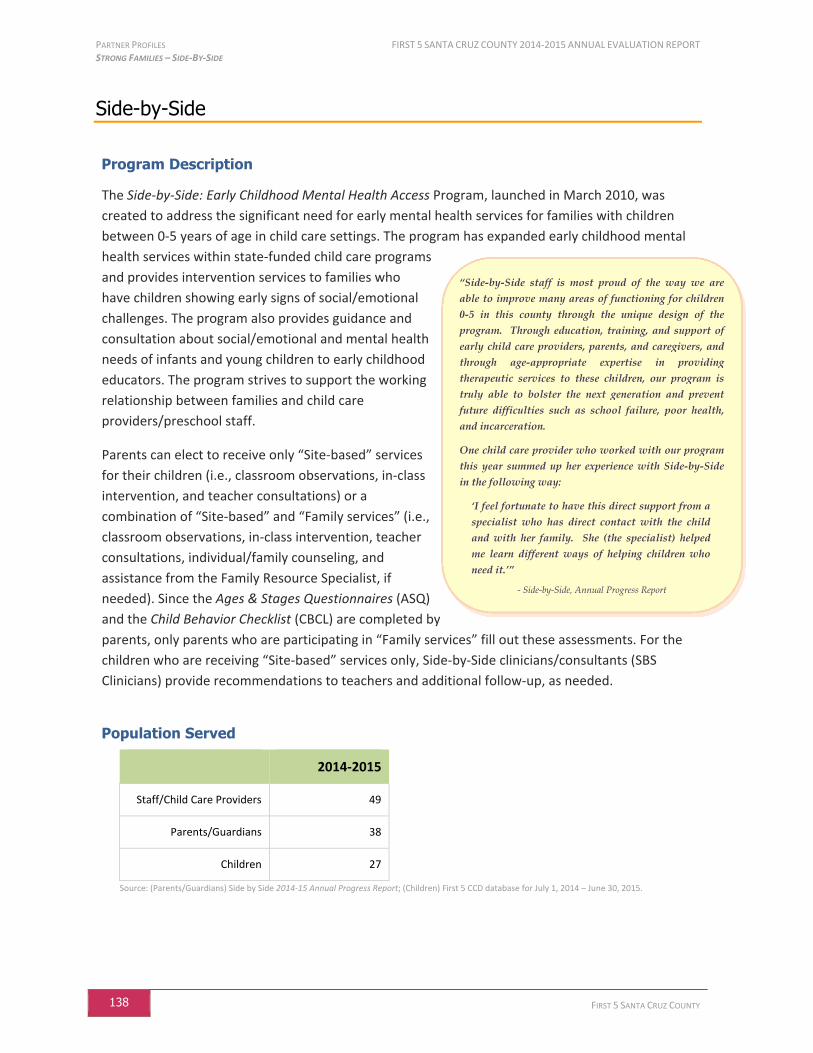
PARTNER PROFILES FIRST 5 SANTA CRUZ COUNTY 2014-2015 ANNUAL EVALUATION REPORT STRONG FAMILIES – SIDE-BY-SIDE
138 FIRST 5 SANTA CRUZ COUNTY
“Side-by-Side staff is most proud of the way we are able to improve many areas of functioning for children 0-5 in this county through the unique design of the program. Through education, training, and support of early child care providers, parents, and caregivers, and through age-appropriate expertise in providing therapeutic services to these children, our program is truly able to bolster the next generation and prevent future difficulties such as school failure, poor health, and incarceration.
One child care provider who worked with our program this year summed up her experience with Side-by-Side in the following way:
‘I feel fortunate to have this direct support from a specialist who has direct contact with the child and with her family. She (the specialist) helped me learn different ways of helping children who need it.’”
- Side-by-Side, Annual Progress Report
Side-by-Side
Program Description
The Side-by-Side: Early Childhood Mental Health Access Program, launched in March 2010, was
created to address the significant need for early mental health services for families with children
between 0-5 years of age in child care settings. The program has expanded early childhood mental
health services within state-funded child care programs
and provides intervention services to families who
have children showing early signs of social/emotional
challenges. The program also provides guidance and
consultation about social/emotional and mental health
needs of infants and young children to early childhood
educators. The program strives to support the working
relationship between families and child care
providers/preschool staff.
Parents can elect to receive only “Site-based” services
for their children (i.e., classroom observations, in-class
intervention, and teacher consultations) or a
combination of “Site-based” and “Family services” (i.e.,
classroom observations, in-class intervention, teacher
consultations, individual/family counseling, and
assistance from the Family Resource Specialist, if
needed). Since the Ages & Stages Questionnaires (ASQ)
and the Child Behavior Checklist (CBCL) are completed by
parents, only parents who are participating in “Family services” fill out these assessments. For the
children who are receiving “Site-based” services only, Side-by-Side clinicians/consultants (SBS
Clinicians) provide recommendations to teachers and additional follow-up, as needed.
Population Served
2014-2015
Staff/Child Care Providers 49
Parents/Guardians 38
Children 27
Source: (Parents/Guardians) Side by Side 2014-15 Annual Progress Report; (Children) First 5 CCD database for July 1, 2014 – June 30, 2015.
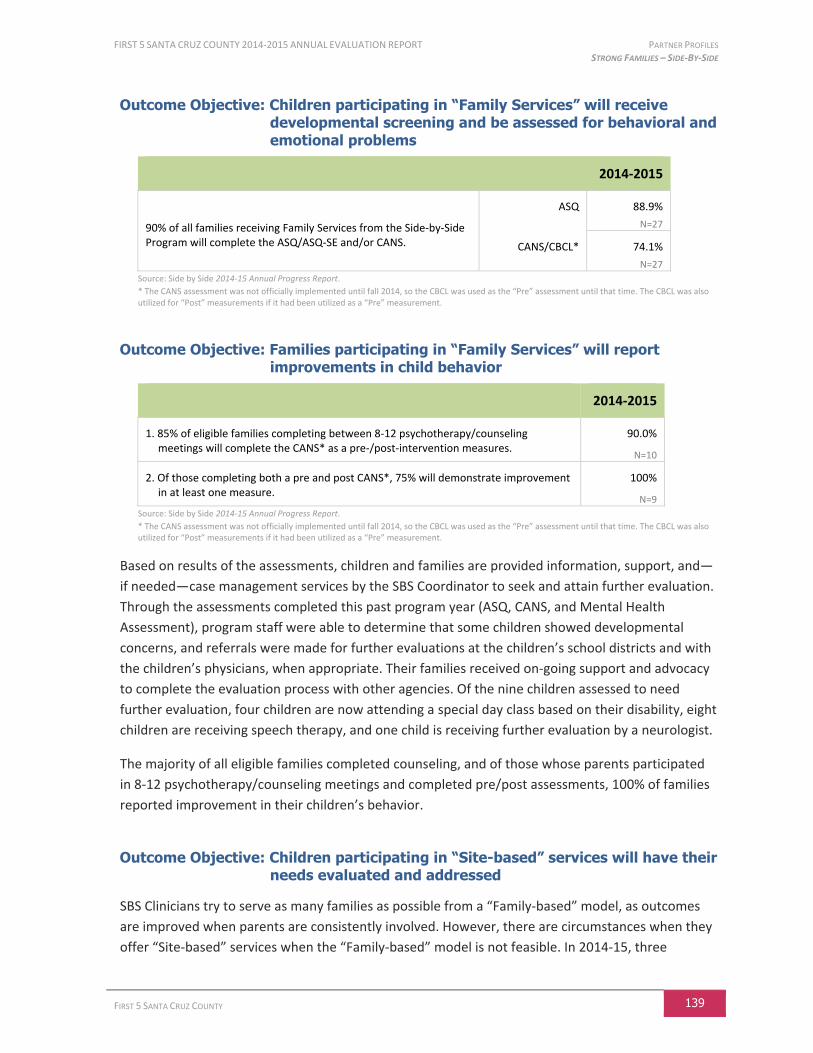
FIRST 5 SANTA CRUZ COUNTY 2014-2015 ANNUAL EVALUATION REPORT PARTNER PROFILES STRONG FAMILIES – SIDE-BY-SIDE
FIRST 5 SANTA CRUZ COUNTY 139
Outcome Objective: Children participating in “Family Services” will receive developmental screening and be assessed for behavioral and emotional problems
2014-2015
90% of all families receiving Family Services from the Side-by-Side Program will complete the ASQ/ASQ-SE and/or CANS.
ASQ 88.9%
N=27
CANS/CBCL* 74.1%
N=27
Source: Side by Side 2014-15 Annual Progress Report.
* The CANS assessment was not officially implemented until fall 2014, so the CBCL was used as the “Pre” assessment until that time. The CBCL was also utilized for “Post” measurements if it had been utilized as a “Pre” measurement.
Outcome Objective: Families participating in “Family Services” will report improvements in child behavior
2014-2015
1. 85% of eligible families completing between 8-12 psychotherapy/counseling meetings will complete the CANS* as a pre-/post-intervention measures.
90.0%
N=10
2. Of those completing both a pre and post CANS*, 75% will demonstrate improvement in at least one measure.
100%
N=9
Source: Side by Side 2014-15 Annual Progress Report.
* The CANS assessment was not officially implemented until fall 2014, so the CBCL was used as the “Pre” assessment until that time. The CBCL was also utilized for “Post” measurements if it had been utilized as a “Pre” measurement.
Based on results of the assessments, children and families are provided information, support, and—
if needed—case management services by the SBS Coordinator to seek and attain further evaluation.
Through the assessments completed this past program year (ASQ, CANS, and Mental Health
Assessment), program staff were able to determine that some children showed developmental
concerns, and referrals were made for further evaluations at the children’s school districts and with
the children’s physicians, when appropriate. Their families received on-going support and advocacy
to complete the evaluation process with other agencies. Of the nine children assessed to need
further evaluation, four children are now attending a special day class based on their disability, eight
children are receiving speech therapy, and one child is receiving further evaluation by a neurologist.
The majority of all eligible families completed counseling, and of those whose parents participated
in 8-12 psychotherapy/counseling meetings and completed pre/post assessments, 100% of families
reported improvement in their children’s behavior.
Outcome Objective: Children participating in “Site-based” services will have their needs evaluated and addressed
SBS Clinicians try to serve as many families as possible from a “Family-based” model, as outcomes
are improved when parents are consistently involved. However, there are circumstances when they
offer “Site-based” services when the “Family-based” model is not feasible. In 2014-15, three
PARTNER PROFILES FIRST 5 SANTA CRUZ COUNTY 2014-2015 ANNUAL EVALUATION REPORT STRONG FAMILIES – SIDE-BY-SIDE
140 FIRST 5 SANTA CRUZ COUNTY
children received “Site-based” services, and one of these three later moved to “Family-based”
services when the parent was able to commit to more intensive work with the Clinician.
“Site-based” services typically begin if the staff have concerns about the child’s emotional well-
being, or if they see increases in the child’s disruptive behaviors. Often there is knowledge of family
challenges, including ongoing CPS investigations, or parents with their own mental health concerns.
In one case, although the lead teacher was highly skilled and experienced, she reported that she had
never seen such difficult behavior from a child and was seeking further support. At this point, the
SBS Clinician attempts to engage the parents and as rapport with the parents increase, they are
more willing to engage in family counseling and parenting support.
The SBS Clinician begins providing consultation services to both the staff and the parents via
classroom observations, face-to face consultations, and phone consultations. Suggestions and
consultations with the staff have included strategies to reduce the child’s anxiety, adjustments to
their expectations of the child’s classroom participation, learning how to minimize triggers for the
child, and how to provide a consistent and safe nurturing environment. A better understanding of
the parents by school staff has often reduced stigmatization of the family and allowed for more
inclusion.
Suggestions to the parents have included seeking further evaluation for their child through the
child’s school district and/or family physician, reducing stressors in their living situation, practicing
coping skills to reduce their own anxiety, and parenting tools to provide more consistency and
follow-through to reduce the children’s aggressive behaviors.
The results are inspiring and encouraging. Teachers report that they have gained awareness and
understanding of the child’s needs, have shifted their expectations, increased their empathy for the
child, and have found strategies that decrease the child’s disruptive behavior.

FIRST 5 SANTA CRUZ COUNTY 2014-2015 ANNUAL EVALUATION REPORT PARTNER PROFILES CHILDREN LEARNING AND READY FOR SCHOOL - QUALITY EARLY LEARNING INITIATIVE
FIRST 5 SANTA CRUZ COUNTY 141
Children Learning and Ready for School
Quality Early Learning Initiative
Program Description
In 2012-13, First 5 Santa Cruz County launched its Quality Early Learning Initiative (QELI) in
collaboration with local partners, with the goal of improving the quality of early learning programs
in Santa Cruz County. First 5 established this initiative as a result of funding received through
California’s Race to the Top - Early Learning Challenge (RTT-ELC) federal grant and First 5 California’s
Child Signature Program (CSP). Both of these grants share a common goal of increasing the quality
of early learning programs and closing the achievement gap for vulnerable young children, and are
described below.
Race to the Top – Early Learning Challenge
In 2012, California received a highly competitive Race to the Top - Early Learning Challenge (RTT-
ELC) federal grant to improve the quality of early learning programs and close the achievement gap
for vulnerable young children. Santa Cruz County is one of the 16 California counties included in this
4-year grant. During this time, California—led by local efforts in the
16 counties in collaboration with the California Department of
Education—will work together to ensure positive outcomes for
infants, toddlers, and preschoolers.
The end goal of California’s RTT-ELC effort is that young children—
particularly those who are low-income, English learners, or children
with disabilities or developmental delays—have access to high quality
early learning programs so that they thrive in their early learning
settings and succeed in kindergarten and beyond. The state will use
the funding primarily to build and pilot a new child care rating system—called the Quality Rating and
Improvement System (QRIS)—to collect and disseminate information about the quality of early
learning programs. The process of building a QRIS ultimately will result in:
A shared definition of child care quality based on reliable and validated research
A comprehensive and consistent approach to assess quality
A design to evaluate the rating system and its impact
Access to a system that supports quality improvement, especially for programs serving
children with high needs (low income children, infants, dual language learners, children with
special needs)
A consistent way for providers to communicate to parents and caregivers about quality
Increased consumer awareness about—and demand for—high quality child care
“A growing body of research
confirms the importance of
quality early learning
experiences to effectively
prepare young children not only
for school, but for life.”
- First 5 California
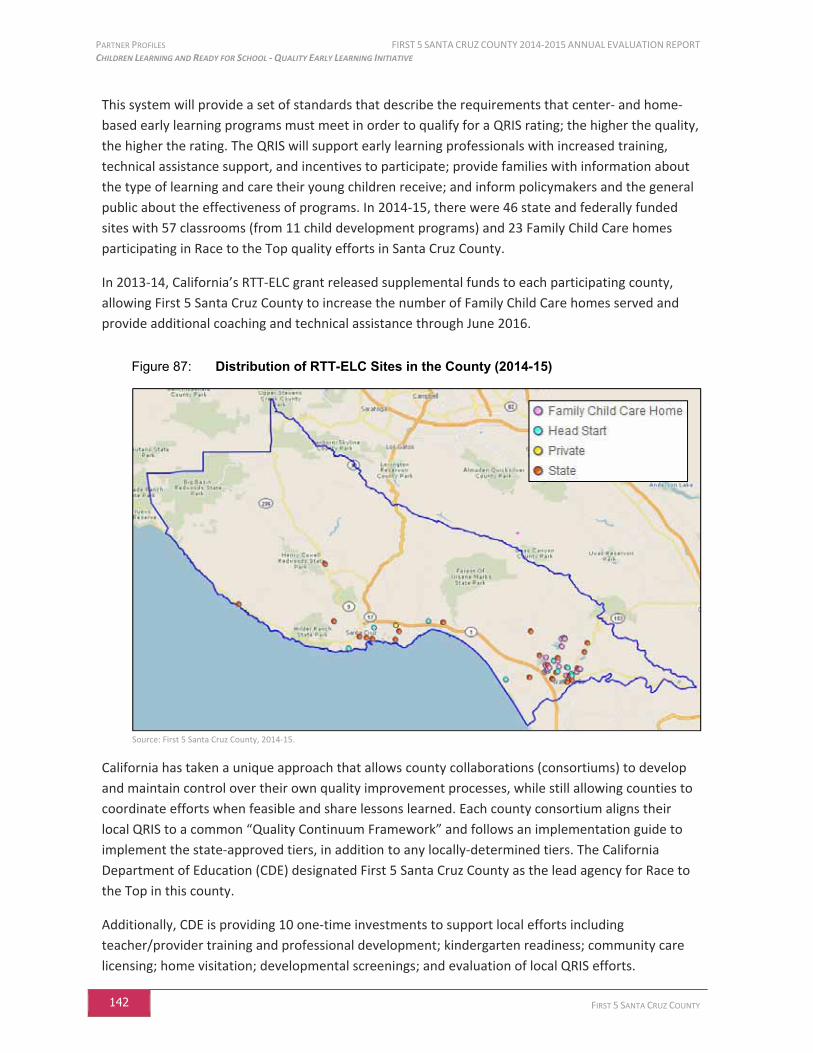
PARTNER PROFILES FIRST 5 SANTA CRUZ COUNTY 2014-2015 ANNUAL EVALUATION REPORT CHILDREN LEARNING AND READY FOR SCHOOL - QUALITY EARLY LEARNING INITIATIVE
142 FIRST 5 SANTA CRUZ COUNTY
This system will provide a set of standards that describe the requirements that center- and home-
based early learning programs must meet in order to qualify for a QRIS rating; the higher the quality,
the higher the rating. The QRIS will support early learning professionals with increased training,
technical assistance support, and incentives to participate; provide families with information about
the type of learning and care their young children receive; and inform policymakers and the general
public about the effectiveness of programs. In 2014-15, there were 46 state and federally funded
sites with 57 classrooms (from 11 child development programs) and 23 Family Child Care homes
participating in Race to the Top quality efforts in Santa Cruz County.
In 2013-14, California’s RTT-ELC grant released supplemental funds to each participating county,
allowing First 5 Santa Cruz County to increase the number of Family Child Care homes served and
provide additional coaching and technical assistance through June 2016.
Figure 87: Distribution of RTT-ELC Sites in the County (2014-15)
Source: First 5 Santa Cruz County, 2014-15.
California has taken a unique approach that allows county collaborations (consortiums) to develop
and maintain control over their own quality improvement processes, while still allowing counties to
coordinate efforts when feasible and share lessons learned. Each county consortium aligns their
local QRIS to a common “Quality Continuum Framework” and follows an implementation guide to
implement the state-approved tiers, in addition to any locally-determined tiers. The California
Department of Education (CDE) designated First 5 Santa Cruz County as the lead agency for Race to
the Top in this county.
Additionally, CDE is providing 10 one-time investments to support local efforts including
teacher/provider training and professional development; kindergarten readiness; community care
licensing; home visitation; developmental screenings; and evaluation of local QRIS efforts.
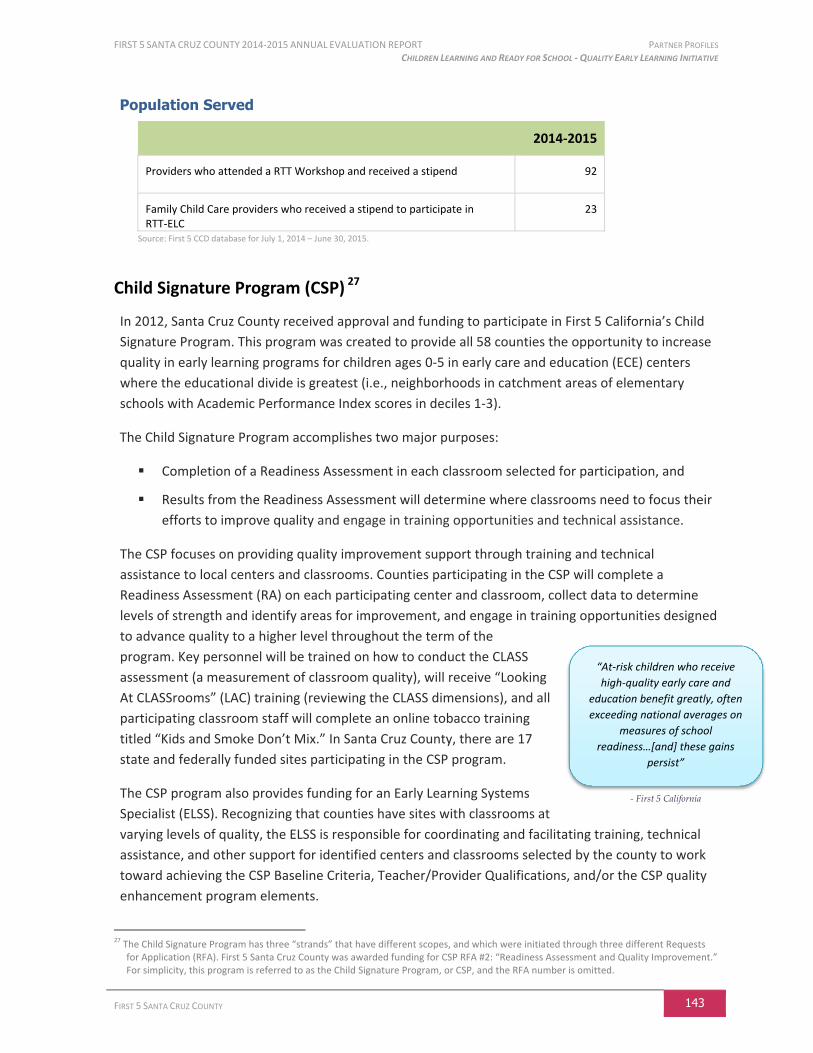
FIRST 5 SANTA CRUZ COUNTY 2014-2015 ANNUAL EVALUATION REPORT PARTNER PROFILES CHILDREN LEARNING AND READY FOR SCHOOL - QUALITY EARLY LEARNING INITIATIVE
FIRST 5 SANTA CRUZ COUNTY 143
Population Served
2014-2015
Providers who attended a RTT Workshop and received a stipend
92
Family Child Care providers who received a stipend to participate in RTT-ELC
23
Source: First 5 CCD database for July 1, 2014 – June 30, 2015.
Child Signature Program (CSP) 27
In 2012, Santa Cruz County received approval and funding to participate in First 5 California’s Child
Signature Program. This program was created to provide all 58 counties the opportunity to increase
quality in early learning programs for children ages 0-5 in early care and education (ECE) centers
where the educational divide is greatest (i.e., neighborhoods in catchment areas of elementary
schools with Academic Performance Index scores in deciles 1-3).
The Child Signature Program accomplishes two major purposes:
Completion of a Readiness Assessment in each classroom selected for participation, and
Results from the Readiness Assessment will determine where classrooms need to focus their
efforts to improve quality and engage in training opportunities and technical assistance.
The CSP focuses on providing quality improvement support through training and technical
assistance to local centers and classrooms. Counties participating in the CSP will complete a
Readiness Assessment (RA) on each participating center and classroom, collect data to determine
levels of strength and identify areas for improvement, and engage in training opportunities designed
to advance quality to a higher level throughout the term of the
program. Key personnel will be trained on how to conduct the CLASS
assessment (a measurement of classroom quality), will receive “Looking
At CLASSrooms” (LAC) training (reviewing the CLASS dimensions), and all
participating classroom staff will complete an online tobacco training
titled “Kids and Smoke Don’t Mix.” In Santa Cruz County, there are 17
state and federally funded sites participating in the CSP program.
The CSP program also provides funding for an Early Learning Systems
Specialist (ELSS). Recognizing that counties have sites with classrooms at
varying levels of quality, the ELSS is responsible for coordinating and facilitating training, technical
assistance, and other support for identified centers and classrooms selected by the county to work
toward achieving the CSP Baseline Criteria, Teacher/Provider Qualifications, and/or the CSP quality
enhancement program elements.
27
The Child Signature Program has three “strands” that have different scopes, and which were initiated through three different Requests for Application (RFA). First 5 Santa Cruz County was awarded funding for CSP RFA #2: “Readiness Assessment and Quality Improvement.” For simplicity, this program is referred to as the Child Signature Program, or CSP, and the RFA number is omitted.
“At-risk children who receive
high-quality early care and
education benefit greatly, often
exceeding national averages on
measures of school
readiness…[and] these gains
persist”
- First 5 California

PARTNER PROFILES FIRST 5 SANTA CRUZ COUNTY 2014-2015 ANNUAL EVALUATION REPORT CHILDREN LEARNING AND READY FOR SCHOOL - QUALITY EARLY LEARNING INITIATIVE
144 FIRST 5 SANTA CRUZ COUNTY
Local Quality Rating and Improvement System (QRIS)
First 5 established the Santa Cruz County Quality Early Learning Initiative (QELI) Consortium, bringing
together organizations, stakeholders, and 26 early learning professionals who shared a commitment to
improving the quality of early learning and creating a county-wide Quality Improvement Plan (QIP).
Together, members of the QELI Consortium have been working to achieve coherence and alignment in
developing and piloting a local Quality Rating and Improvement System (QRIS) as a way to foster
ongoing improvement of early care and education programs in Santa Cruz County.
The QELI Consortium adopted the Hybrid Quality Continuum Framework and Tiers as the foundation
of their local QRIS. This framework identifies five tiers of quality, with points assigned to each tier
for seven elements of quality, such as teacher-child ratios, teacher qualifications, and teacher-child
interactions (for more information, see Appendix B). Sites receive a rating based on their cumulative
scores in all seven elements that will eventually become publicly available to families seeking child
care and early learning programs. It is important to note that the QRIS isn’t just a rating system; it is
also an improvement system. Participating child care sites receive support, training, and financial
incentives to make improvements that lead to higher ratings and ultimately to higher quality child
care programs.
Provisional ratings of all participating QRIS sites in Santa Cruz County were conducted in
December 2014. Based on the 5-tier scale (1=lowest tier; 5=highest tier):
o 23 sites received a Tier 2 provisional rating
o 17 sites received a Tier 3 provisional rating
o 28 sites received a Tier 4 provisional rating
o 1 site received a Tier 5 provisional rating
These ratings were considered “Provisional” rather than “Full” ratings, since no sites had
yet received both an independent Classroom Assessment Scoring System (CLASS) and
Environmental Rating Scale (ERS) assessment as of December 2014.
Figure 88: Ratings of QRIS Sites in Santa Cruz County
NUMBER OF SITES WITH THIS RATING
QUALITY TIER DEC. 2013 PROVISIONAL RATINGS DEC. 2014 PROVISIONAL RATINGS
Tier 1 0 0
Tier 2 0 23
Tier 3 24 17
Tier 4 16 28
Tier 5 0 1
Total sites 40 69 Source: First 5 Santa Cruz County, 2015. Note: The initial ratings of Santa Cruz County’s sites are considered to be “Provisional” rather than “Full,” since no sites had yet received both an independent Classroom Assessment Scoring System AND Environmental Rating Scale assessment as of December 2014.
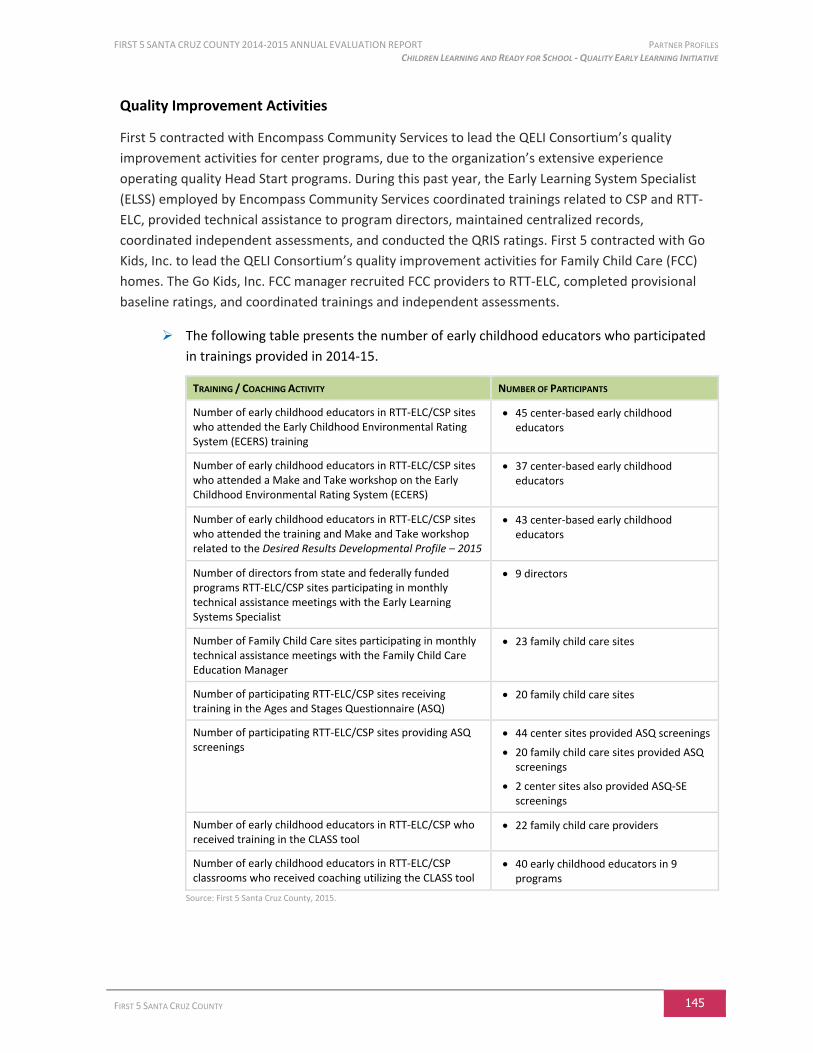
FIRST 5 SANTA CRUZ COUNTY 2014-2015 ANNUAL EVALUATION REPORT PARTNER PROFILES CHILDREN LEARNING AND READY FOR SCHOOL - QUALITY EARLY LEARNING INITIATIVE
FIRST 5 SANTA CRUZ COUNTY 145
Quality Improvement Activities
First 5 contracted with Encompass Community Services to lead the QELI Consortium’s quality
improvement activities for center programs, due to the organization’s extensive experience
operating quality Head Start programs. During this past year, the Early Learning System Specialist
(ELSS) employed by Encompass Community Services coordinated trainings related to CSP and RTT-
ELC, provided technical assistance to program directors, maintained centralized records,
coordinated independent assessments, and conducted the QRIS ratings. First 5 contracted with Go
Kids, Inc. to lead the QELI Consortium’s quality improvement activities for Family Child Care (FCC)
homes. The Go Kids, Inc. FCC manager recruited FCC providers to RTT-ELC, completed provisional
baseline ratings, and coordinated trainings and independent assessments.
The following table presents the number of early childhood educators who participated
in trainings provided in 2014-15.
TRAINING / COACHING ACTIVITY NUMBER OF PARTICIPANTS
Number of early childhood educators in RTT-ELC/CSP sites who attended the Early Childhood Environmental Rating System (ECERS) training
45 center-based early childhood educators
Number of early childhood educators in RTT-ELC/CSP sites who attended a Make and Take workshop on the Early Childhood Environmental Rating System (ECERS)
37 center-based early childhood educators
Number of early childhood educators in RTT-ELC/CSP sites who attended the training and Make and Take workshop related to the Desired Results Developmental Profile – 2015
43 center-based early childhood educators
Number of directors from state and federally funded programs RTT-ELC/CSP sites participating in monthly technical assistance meetings with the Early Learning Systems Specialist
9 directors
Number of Family Child Care sites participating in monthly technical assistance meetings with the Family Child Care Education Manager
23 family child care sites
Number of participating RTT-ELC/CSP sites receiving training in the Ages and Stages Questionnaire (ASQ)
20 family child care sites
Number of participating RTT-ELC/CSP sites providing ASQ screenings
44 center sites provided ASQ screenings
20 family child care sites provided ASQ screenings
2 center sites also provided ASQ-SE screenings
Number of early childhood educators in RTT-ELC/CSP who received training in the CLASS tool
22 family child care providers
Number of early childhood educators in RTT-ELC/CSP classrooms who received coaching utilizing the CLASS tool
40 early childhood educators in 9 programs
Source: First 5 Santa Cruz County, 2015.
PARTNER PROFILES FIRST 5 SANTA CRUZ COUNTY 2014-2015 ANNUAL EVALUATION REPORT CHILDREN LEARNING AND READY FOR SCHOOL - QUALITY EARLY LEARNING INITIATIVE
146 FIRST 5 SANTA CRUZ COUNTY
Bay Area Quality Early Learning Partnership (BAQELP)
Santa Cruz County has joined with Santa Clara, San Francisco, Alameda, Contra Costa, and San
Mateo counties to form the Bay Area Quality Early Learning Partnership (BAQELP). This regional
consortium was developed so that these neighboring counties could strategize together, share
resources, leverage funds, and align practices. This regional approach has resulted in strengthening
the current resources available for professional development and independent assessment.
The counties in this consortium continue to develop and share a common data system called the
WELS Bay Area Regional RTT Database, which is designed to gather scoring information, track
supports and incentives, ensure participation by targeted programs serving children with high
needs, and review progress in relation to the Consortium’s local quality improvement targets.
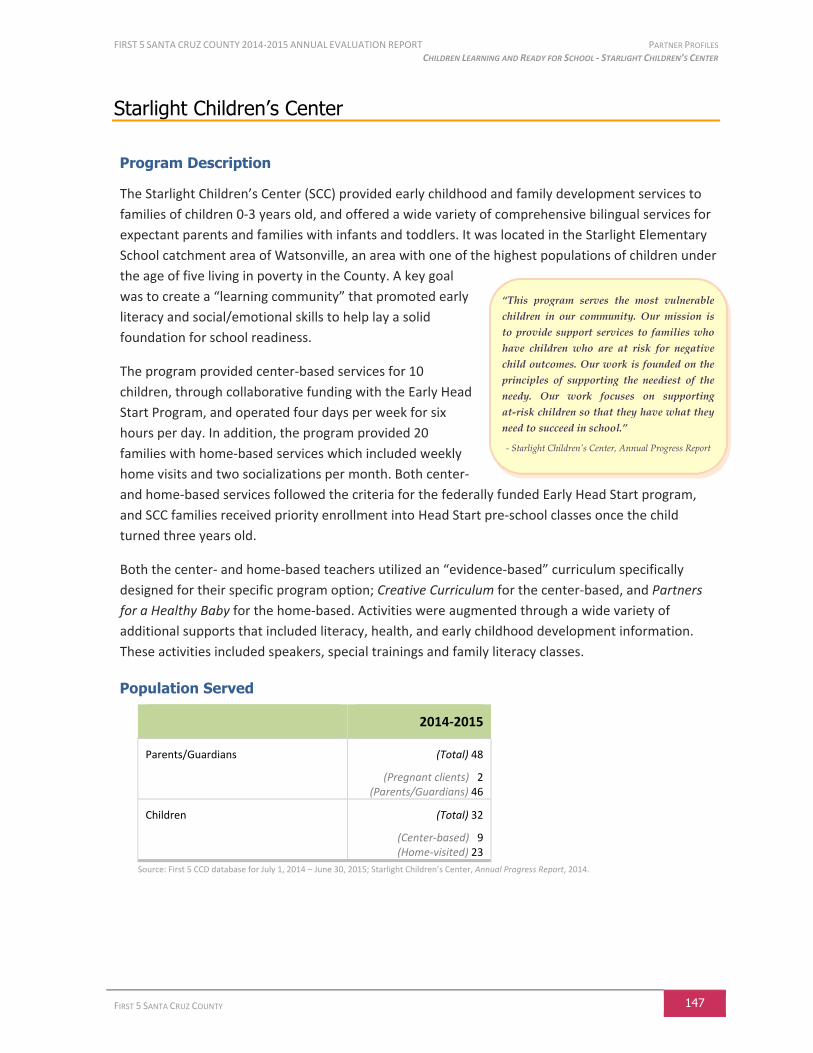
FIRST 5 SANTA CRUZ COUNTY 2014-2015 ANNUAL EVALUATION REPORT PARTNER PROFILES CHILDREN LEARNING AND READY FOR SCHOOL - STARLIGHT CHILDREN’S CENTER
FIRST 5 SANTA CRUZ COUNTY 147
Starlight Children’s Center
Program Description
The Starlight Children’s Center (SCC) provided early childhood and family development services to
families of children 0-3 years old, and offered a wide variety of comprehensive bilingual services for
expectant parents and families with infants and toddlers. It was located in the Starlight Elementary
School catchment area of Watsonville, an area with one of the highest populations of children under
the age of five living in poverty in the County. A key goal
was to create a “learning community” that promoted early
literacy and social/emotional skills to help lay a solid
foundation for school readiness.
The program provided center-based services for 10
children, through collaborative funding with the Early Head
Start Program, and operated four days per week for six
hours per day. In addition, the program provided 20
families with home-based services which included weekly
home visits and two socializations per month. Both center-
and home-based services followed the criteria for the federally funded Early Head Start program,
and SCC families received priority enrollment into Head Start pre-school classes once the child
turned three years old.
Both the center- and home-based teachers utilized an “evidence-based” curriculum specifically
designed for their specific program option; Creative Curriculum for the center-based, and Partners
for a Healthy Baby for the home-based. Activities were augmented through a wide variety of
additional supports that included literacy, health, and early childhood development information.
These activities included speakers, special trainings and family literacy classes.
Population Served
2014-2015
Parents/Guardians (Total) 48
(Pregnant clients) 2(Parents/Guardians) 46
Children (Total) 32
(Center-based) 9(Home-visited) 23
Source: First 5 CCD database for July 1, 2014 – June 30, 2015; Starlight Children’s Center, Annual Progress Report, 2014.
“This program serves the most vulnerable children in our community. Our mission is to provide support services to families who have children who are at risk for negative child outcomes. Our work is founded on the principles of supporting the neediest of the needy. Our work focuses on supporting at-risk children so that they have what they need to succeed in school.”
- Starlight Children’s Center, Annual Progress Report
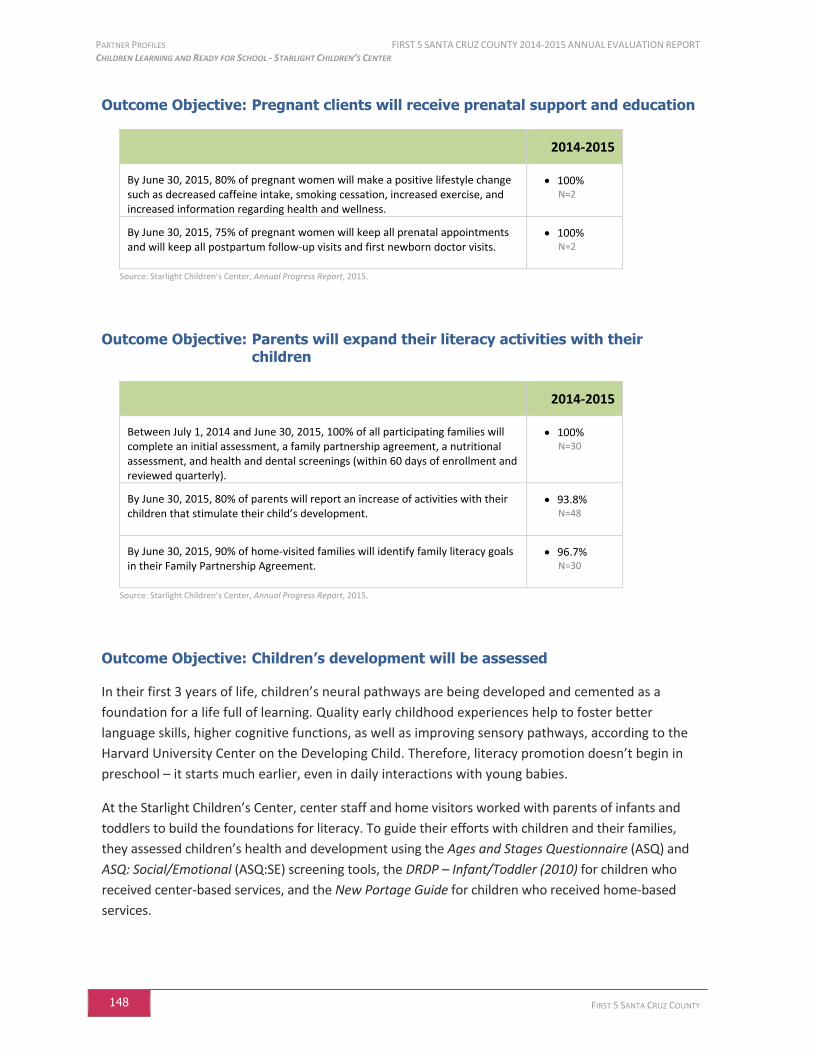
PARTNER PROFILES FIRST 5 SANTA CRUZ COUNTY 2014-2015 ANNUAL EVALUATION REPORT CHILDREN LEARNING AND READY FOR SCHOOL - STARLIGHT CHILDREN’S CENTER
148 FIRST 5 SANTA CRUZ COUNTY
Outcome Objective: Pregnant clients will receive prenatal support and education
2014-2015
By June 30, 2015, 80% of pregnant women will make a positive lifestyle change such as decreased caffeine intake, smoking cessation, increased exercise, and increased information regarding health and wellness.
100% N=2
By June 30, 2015, 75% of pregnant women will keep all prenatal appointments and will keep all postpartum follow-up visits and first newborn doctor visits.
100% N=2
Source: Starlight Children’s Center, Annual Progress Report, 2015.
Outcome Objective: Parents will expand their literacy activities with their children
2014-2015
Between July 1, 2014 and June 30, 2015, 100% of all participating families will complete an initial assessment, a family partnership agreement, a nutritional assessment, and health and dental screenings (within 60 days of enrollment and reviewed quarterly).
100% N=30
By June 30, 2015, 80% of parents will report an increase of activities with their children that stimulate their child’s development.
93.8% N=48
By June 30, 2015, 90% of home-visited families will identify family literacy goals in their Family Partnership Agreement.
96.7% N=30
Source: Starlight Children’s Center, Annual Progress Report, 2015.
Outcome Objective: Children’s development will be assessed
In their first 3 years of life, children’s neural pathways are being developed and cemented as a
foundation for a life full of learning. Quality early childhood experiences help to foster better
language skills, higher cognitive functions, as well as improving sensory pathways, according to the
Harvard University Center on the Developing Child. Therefore, literacy promotion doesn’t begin in
preschool – it starts much earlier, even in daily interactions with young babies.
At the Starlight Children’s Center, center staff and home visitors worked with parents of infants and
toddlers to build the foundations for literacy. To guide their efforts with children and their families,
they assessed children’s health and development using the Ages and Stages Questionnaire (ASQ) and
ASQ: Social/Emotional (ASQ:SE) screening tools, the DRDP – Infant/Toddler (2010) for children who
received center-based services, and the New Portage Guide for children who received home-based
services.
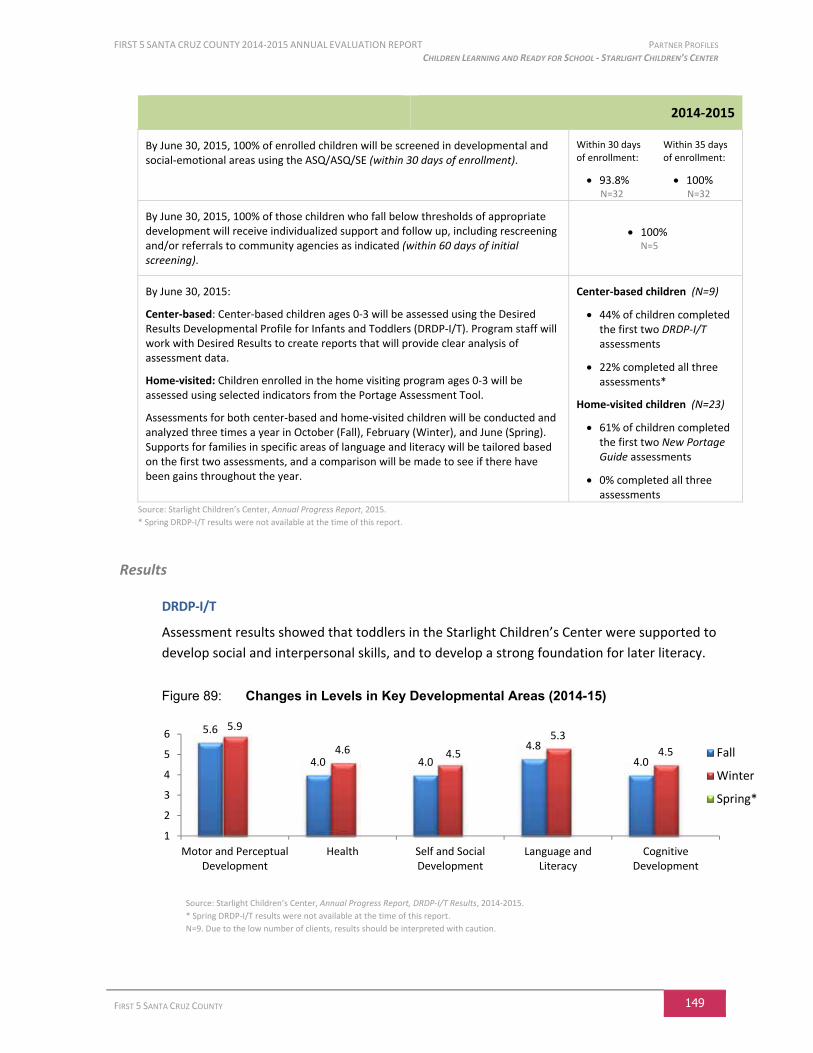
FIRST 5 SANTA CRUZ COUNTY 2014-2015 ANNUAL EVALUATION REPORT PARTNER PROFILES CHILDREN LEARNING AND READY FOR SCHOOL - STARLIGHT CHILDREN’S CENTER
FIRST 5 SANTA CRUZ COUNTY 149
2014-2015
By June 30, 2015, 100% of enrolled children will be screened in developmental and social-emotional areas using the ASQ/ASQ/SE (within 30 days of enrollment).
Within 30 days of enrollment:
Within 35 days of enrollment:
93.8% N=32
100% N=32
By June 30, 2015, 100% of those children who fall below thresholds of appropriate development will receive individualized support and follow up, including rescreening and/or referrals to community agencies as indicated (within 60 days of initial screening).
100% N=5
By June 30, 2015:
Center-based: Center-based children ages 0-3 will be assessed using the Desired Results Developmental Profile for Infants and Toddlers (DRDP-I/T). Program staff will work with Desired Results to create reports that will provide clear analysis of assessment data.
Home-visited: Children enrolled in the home visiting program ages 0-3 will be assessed using selected indicators from the Portage Assessment Tool.
Assessments for both center-based and home-visited children will be conducted and analyzed three times a year in October (Fall), February (Winter), and June (Spring). Supports for families in specific areas of language and literacy will be tailored based on the first two assessments, and a comparison will be made to see if there have been gains throughout the year.
Center-based children (N=9)
44% of children completed the first two DRDP-I/T assessments
22% completed all three assessments*
Home-visited children (N=23)
61% of children completed the first two New Portage Guide assessments
0% completed all three assessments
Source: Starlight Children’s Center, Annual Progress Report, 2015.
* Spring DRDP-I/T results were not available at the time of this report.
Results
DRDP-I/T
Assessment results showed that toddlers in the Starlight Children’s Center were supported to
develop social and interpersonal skills, and to develop a strong foundation for later literacy.
Figure 89: Changes in Levels in Key Developmental Areas (2014-15)
Source: Starlight Children’s Center, Annual Progress Report, DRDP-I/T Results, 2014-2015.
* Spring DRDP-I/T results were not available at the time of this report.
N=9. Due to the low number of clients, results should be interpreted with caution.
5.6
4.0 4.0
4.8
4.0
5.9
4.6 4.5
5.3
4.5
1
2
3
4
5
6
Motor and PerceptualDevelopment
Health Self and SocialDevelopment
Language andLiteracy
CognitiveDevelopment
Fall
Winter
Spring*
PARTNER PROFILES FIRST 5 SANTA CRUZ COUNTY 2014-2015 ANNUAL EVALUATION REPORT CHILDREN LEARNING AND READY FOR SCHOOL - STARLIGHT CHILDREN’S CENTER
150 FIRST 5 SANTA CRUZ COUNTY
New Portage Guide
The New Portage Guide Birth to Six was a developmental assessment tool based on direct
observations of typical milestone skills in five domain areas:
Communication/language/literacy
Exploration/approaches to learning
Purposeful motor activity
Sensory organization
Social/emotional development
Children were rated in these areas as either: No/Not observed, Occasionally/Emerging Skill
area, or Consistently/Mastered. “Mastery” of an indicator meant that the child consistently
demonstrated the skill in a variety of settings. Assessments were completed three times a
year for each child to document their growth and development, measure progress, and plan
individualized learning activities with parents and in socialization group settings.
In 2014-15, children demonstrated growth in all domain elements.
Children ages 9-18 months showed the greatest growth in “Exploration/approaches to learning.”
For children between the ages of 18-36 months the greatest growth was in “Social/emotional development” and “Sensory organization.”
FIRST 5 SANTA CRUZ COUNTY 2014-2015 ANNUAL EVALUATION REPORT PARTNER PROFILES CHILDREN LEARNING AND READY FOR SCHOOL - EARLY LITERACY FOUNDATIONS INITIATIVE
FIRST 5 SANTA CRUZ COUNTY 151
Early Literacy Foundations (ELF) Initiative
Program Description
California 3rd graders are struggling to become proficient readers. Local and statewide data indicate
that well over half of 3rd grade children are not reading at proficiency. Because language
development in the early years is crucial to later reading proficiency, early childhood educators have
a unique role in influencing language and literacy development and later educational success.
According to a report published in the Journal of Education Psychology, early childhood educators
play a key role in the language development of children from high poverty backgrounds:
“Language development has a profound effect on young children’s successful transition to school
and, in particular, on their success in learning to read. Children who arrive in first grade with a
foundation in pre-literacy skills and the interest and motivation to learn are better prepared to
engage in the complex task of learning to read.
Most children acquire language and pre-literacy skills through interactions with adults and peers
who use language in ways that are consistent with the majority culture and correspond to the
printed word. Unfortunately, many children raised in poverty have limited access to opportunities
to develop language and literacy skills in such ways.
As one important illustration, Hart and Risley (1995) reported that by the age of 3, children in
poverty were already well behind their more affluent peers in their acquisition of vocabulary and
oral language skills. Snow et al. (1998) also reported that children in poverty lack necessary
pre-literacy skills at the beginning of kindergarten. Similar research indicates that socioeconomic
status is the strongest predictor of performance differences in children at the beginning of the first
grade and that this gap persists as children progress from elementary to high school.”28
With the evidence of limited language and literacy opportunities in low-income homes, more
emphasis has been placed on showing early childhood educators how to build language
opportunities into their daily child care routines, through fun and meaningful instruction. First 5’s
Early Literacy Foundations Initiative builds skills among early childhood educators to promote strong
literacy and language foundations for young children.
The ELF Initiative features:
1. Professional development for early childhood educators working in center-based Pre-K and
TK sites through SEEDS of Early Literacy training and coaching. Educators earn a stipend,
receive on-site coaching, and attend literacy labs. This program is described in more detail in
the following pages.
2. Professional development for family child care providers working with Spanish-speaking
children through SEEDS of Early Literacy training and coaching. Training includes
28
American Psychological Association (2006). The Effects of a Language and Literacy Intervention on Head Start Children and Teachers. Journal of Educational Psychology, 98, (1), 63–74.

PARTNER PROFILES FIRST 5 SANTA CRUZ COUNTY 2014-2015 ANNUAL EVALUATION REPORT CHILDREN LEARNING AND READY FOR SCHOOL - EARLY LITERACY FOUNDATIONS INITIATIVE
152 FIRST 5 SANTA CRUZ COUNTY
opportunities to create literacy-based materials to use in the family child care home
environment through “Make and Take” workshops. This program is described in more detail
in the following pages.
3. Development and expansion of the Santa Cruz Reading Corps. This program places
AmeriCorps volunteers (called a Literacy Tutors) in each State Preschool classroom in the
Pajaro Valley Unified and Live Oak school districts, and also in a growing number of
Transitional Kindergarten classrooms in these districts. The goal of this program is to
develop children’s early literacy skills in English in preparation for kindergarten. The Literacy
Tutors are trained in research-based strategies following the SEEDS of Early Literacy
curriculum, collaborate with the classroom teaching staff to enhance daily literacy
opportunities, and conduct literacy assessments to provide individualized support to help
children in Santa Cruz County become successful readers by 3rd grade. This program is
described in more detail in the following pages.
4. Assessment of children’s development of early literacy skills in participating State Pre-K and
TK classrooms via the Individual Growth and Development Indicators (IGDIs) tool. These
assessments help teachers identify children who need individualized instruction in early
literacy strategies. Since 2013-14, only State Pre-K classrooms with Reading Corps tutors
have been using these assessments to this level of intention.
5. Family Engagement through continuation of the “Raising A Reader” weekly rotating book
bag program. All Raising A Reader classrooms have SEEDS trained staff, resulting in mutually
complimentary interventions to boost shared reading practices with children and their
families, and to impact children’s early literacy skills. Information on this program can be
found in the Raising A Reader partner profile.
6. The Santa Cruz Public Libraries (SCPL) “Toddler Time,” a program offered at six branches,
provides 60 minutes of moderately unstructured play and activity time, including early
literacy development with stories and songs to engage very young children and families in
early literacy activities.
The following descriptions provide more detailed information about the SEEDS of Early Literacy and
the Santa Cruz Reading Corps.
SEEDS of Early Literacy
This professional development initiative follows the SEEDS of Early Literacy curriculum that has been
researched by the University of Minnesota. Research on the SEEDS model shows that teachers trained
and coached on the SEEDS of Early Literacy curriculum score significantly higher on the Early
Language and Literacy Classroom Observation (ELLCO) tool and show greater change over time in
teaching strategies than teachers without such training or coaching. Results also indicate that
preschool children who were taught by teachers trained in SEEDS entered kindergarten ready to
read at higher rates than children in non-SEEDS groups (Lizakowski, 2005).
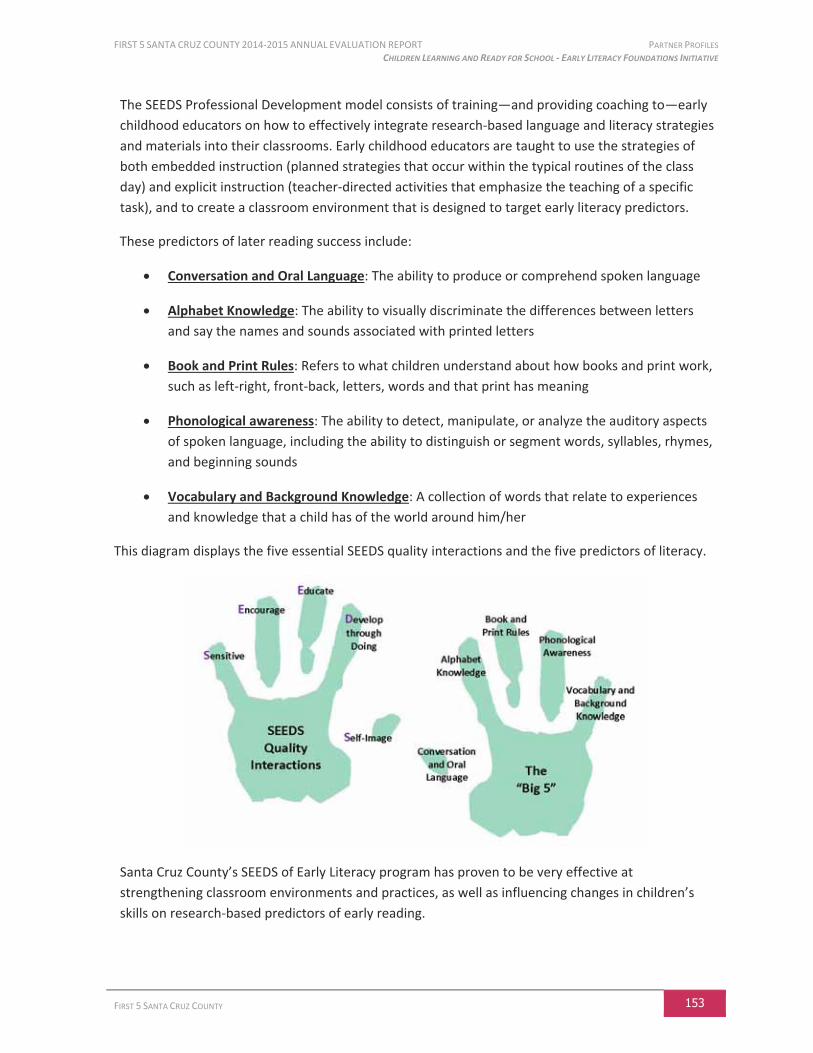
FIRST 5 SANTA CRUZ COUNTY 2014-2015 ANNUAL EVALUATION REPORT PARTNER PROFILES CHILDREN LEARNING AND READY FOR SCHOOL - EARLY LITERACY FOUNDATIONS INITIATIVE
FIRST 5 SANTA CRUZ COUNTY 153
The SEEDS Professional Development model consists of training—and providing coaching to—early
childhood educators on how to effectively integrate research-based language and literacy strategies
and materials into their classrooms. Early childhood educators are taught to use the strategies of
both embedded instruction (planned strategies that occur within the typical routines of the class
day) and explicit instruction (teacher-directed activities that emphasize the teaching of a specific
task), and to create a classroom environment that is designed to target early literacy predictors.
These predictors of later reading success include:
Conversation and Oral Language: The ability to produce or comprehend spoken language
Alphabet Knowledge: The ability to visually discriminate the differences between letters
and say the names and sounds associated with printed letters
Book and Print Rules: Refers to what children understand about how books and print work,
such as left-right, front-back, letters, words and that print has meaning
Phonological awareness: The ability to detect, manipulate, or analyze the auditory aspects
of spoken language, including the ability to distinguish or segment words, syllables, rhymes,
and beginning sounds
Vocabulary and Background Knowledge: A collection of words that relate to experiences
and knowledge that a child has of the world around him/her
This diagram displays the five essential SEEDS quality interactions and the five predictors of literacy.
Santa Cruz County’s SEEDS of Early Literacy program has proven to be very effective at
strengthening classroom environments and practices, as well as influencing changes in children’s
skills on research-based predictors of early reading.
PARTNER PROFILES FIRST 5 SANTA CRUZ COUNTY 2014-2015 ANNUAL EVALUATION REPORT CHILDREN LEARNING AND READY FOR SCHOOL - EARLY LITERACY FOUNDATIONS INITIATIVE
154 FIRST 5 SANTA CRUZ COUNTY
In 2014-15 First 5 Santa Cruz County offered SEEDS programs to two different populations of early
childhood educators:
SEEDS for Center-based Pre-K and TK Teachers
This program provides professional development for early childhood educators working in Pre-K and
Transitional Kindergarten (TK) centers. In an effort to support teachers as they work to include the
SEEDS concepts into daily practice, this nine-month course is designed to focus on the SEEDS strategies
through embedded and explicit instruction, modeling, practice, and one-on-one coaching throughout
the academic year.
Each participant in SEEDS for Center-based Pre-K/TK receives:
16 three-hour instructional sessions Pre and Post literacy environment assessment
12 two-hour on-site coaching visits 4 literacy labs and 6 children’s books to use in their centers 2 optional literacy labs
SEEDS for Family Child Care Providers
This program provides professional development for family child care providers working with
Spanish speaking children through SEEDS of Early Literacy training and coaching. The training uses
the SEEDS Parent curriculum, with a focus on working with children from birth to kindergarten. This
program offers five Make and Take workshops in the fall, and again in the summer for migrant
providers (beginning in June).
Each workshop includes:
1½ hours of instruction 2½ hours to create literacy-based materials to use in the family child care home 5 one-on-one coaching sessions in the home Pre and post literacy environment assessments 5 children’s books to use in their program 1 model SEEDS classroom/FCC home tour
Santa Cruz Reading Corps
AmeriCorps is a national service organization with about 100,000 members
serving across the United States to help meet critical needs in the areas of
education, health, the environment, disaster services, veterans, and
economic opportunity. In the summer of 2012, First 5 Santa Cruz County
partnered with AmeriCorps29 to create the Santa Cruz Reading Corps (SCRC),
with the goal of training and placing AmeriCorps volunteers in state
preschool and transitional kindergarten classrooms in both the Live Oak and
Pajaro Valley Unified School Districts. The SCRC is modeled after the
Minnesota Reading Corps, the largest single state AmeriCorps initiative in the country.
29
In 2001, representatives of the First 5 California and the First 5 Association were invited by the Governor’s Office on Service and Volunteerism (GO SERV) to discuss the utilization of AmeriCorps members in First 5 funded programs and initiatives. Through this partnership, the First 5 Service Corps was developed. In this report, this collaboration is simply referred to as AmeriCorps.

FIRST 5 SANTA CRUZ COUNTY 2014-2015 ANNUAL EVALUATION REPORT PARTNER PROFILES CHILDREN LEARNING AND READY FOR SCHOOL - EARLY LITERACY FOUNDATIONS INITIATIVE
FIRST 5 SANTA CRUZ COUNTY 155
The focus of the SCRC is to promote strong literacy and language foundations for young children,
especially dual language learners. Local and statewide data indicate that well over half of 3rd grade
children in California—and Santa Cruz County—are not reading at proficiency. Research shows that
when students get off to a poor start in reading, they rarely catch up with other students. Happily,
research also shows that almost all children have the capacity to learn to read proficiently if
effective interventions are provided. Due to the fact that language development in the early years is
crucial to later reading proficiency, the SCRC members are
using the evidence-based SEEDS of Early Literacy curriculum to
help boost the early literacy skills of children in English as they
prepare to enter kindergarten.
During the academic school year (running from September to
May) SCRC members—called Literacy Tutors—collaborate with
the classroom teaching staff to enhance daily literacy
opportunities, and provide support to classrooms’ routines by
implementing specific research-based strategies from the
SEEDS of Early Literacy curriculum. Each tutor receives
extensive training, individualized coaching, and support to track
and guide children in English language development through
one-on-one and small group interventions. SCRC tutors also
facilitate Raising A Reader, the weekly rotating book bag
program that provides books and support for families to read
aloud with their children.
In addition to their daily work with students, tutors assess each
child in their classroom three times; once in October, once in
early February, and once in May, in five areas of early reading
predictors (rhyming, alliteration, letter names, letter sounds, and vocabulary development). These
assessments help them select children who receive tailored literacy-based interventions on a daily
basis. Each of these children’s progress is monitored monthly to see if the interventions are
effective. The goal of the SCRC is to increase the number of children on target with early reading
predictors. Through all these efforts, children are provided the assistance they need to enter
kindergarten more school-ready and to become fluent readers by 3rd grade.
One Literacy Tutor’s Story
“At the beginning of the school year Jose had almost no language skills. I grouped Jose with two other boys who had similarly low levels of language skills and began reading books and doing vocabulary building activities with them every day.
For a long time Jose was uninterested in participating, but eventually he grew to enjoy it. Halfway through the year Jose started asking me to read to him and would go fetch the other boys in the group to come listen. He started speaking in single words, and then sentence fragments. The most exciting development in Jose's progression is that about two months ago he started asking me ‘why?’ all the time (and every time I enthusiastically answer him).
Learning is no longer a discouraging activity for him and he now feels free to explore his curiosity. Jose finally feels empowered as a learner.”
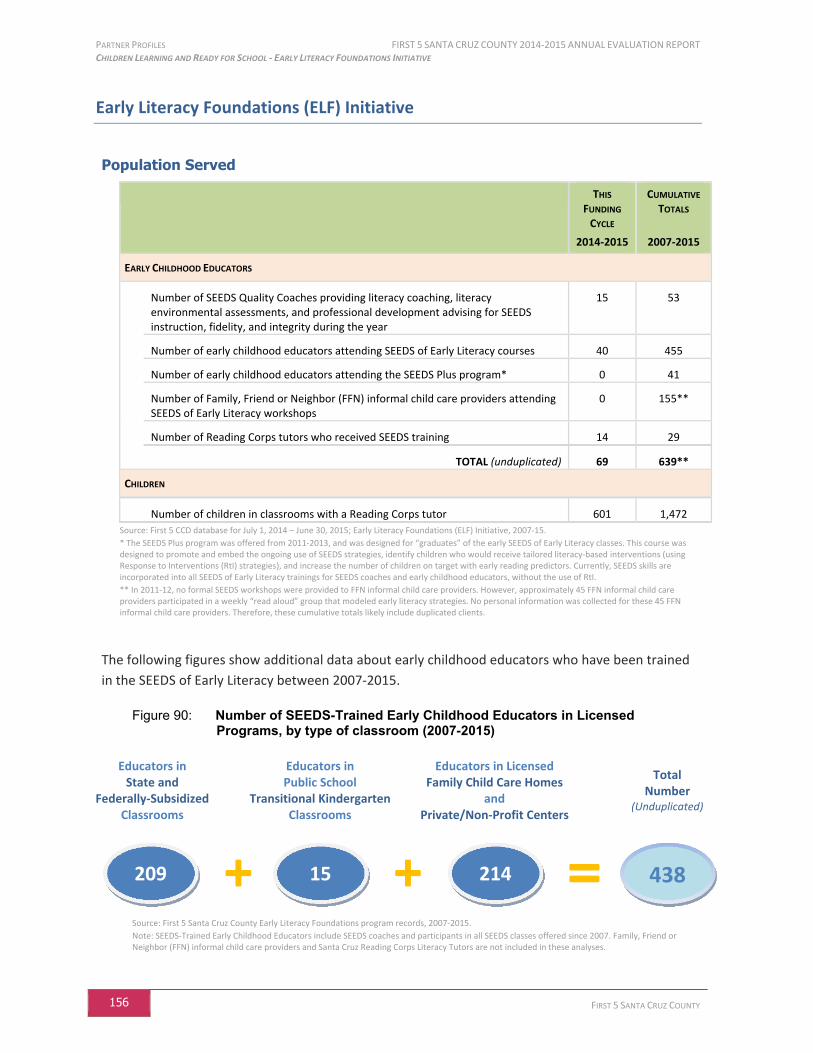
PARTNER PROFILES FIRST 5 SANTA CRUZ COUNTY 2014-2015 ANNUAL EVALUATION REPORT CHILDREN LEARNING AND READY FOR SCHOOL - EARLY LITERACY FOUNDATIONS INITIATIVE
156 FIRST 5 SANTA CRUZ COUNTY
Early Literacy Foundations (ELF) Initiative
Population Served
THIS
FUNDING
CYCLE
2014-2015
CUMULATIVE
TOTALS
2007-2015
EARLY CHILDHOOD EDUCATORS
Number of SEEDS Quality Coaches providing literacy coaching, literacy environmental assessments, and professional development advising for SEEDS instruction, fidelity, and integrity during the year
15 53
Number of early childhood educators attending SEEDS of Early Literacy courses 40 455
Number of early childhood educators attending the SEEDS Plus program* 0 41
Number of Family, Friend or Neighbor (FFN) informal child care providers attending SEEDS of Early Literacy workshops
0 155**
Number of Reading Corps tutors who received SEEDS training 14 29
TOTAL (unduplicated) 69 639**
CHILDREN
Number of children in classrooms with a Reading Corps tutor 601 1,472
Source: First 5 CCD database for July 1, 2014 – June 30, 2015; Early Literacy Foundations (ELF) Initiative, 2007-15.
* The SEEDS Plus program was offered from 2011-2013, and was designed for “graduates” of the early SEEDS of Early Literacy classes. This course was designed to promote and embed the ongoing use of SEEDS strategies, identify children who would receive tailored literacy-based interventions (using Response to Interventions (RtI) strategies), and increase the number of children on target with early reading predictors. Currently, SEEDS skills are incorporated into all SEEDS of Early Literacy trainings for SEEDS coaches and early childhood educators, without the use of RtI.
** In 2011-12, no formal SEEDS workshops were provided to FFN informal child care providers. However, approximately 45 FFN informal child care providers participated in a weekly “read aloud” group that modeled early literacy strategies. No personal information was collected for these 45 FFN informal child care providers. Therefore, these cumulative totals likely include duplicated clients.
The following figures show additional data about early childhood educators who have been trained
in the SEEDS of Early Literacy between 2007-2015.
Figure 90: Number of SEEDS-Trained Early Childhood Educators in Licensed Programs, by type of classroom (2007-2015)
Source: First 5 Santa Cruz County Early Literacy Foundations program records, 2007-2015.
Note: SEEDS-Trained Early Childhood Educators include SEEDS coaches and participants in all SEEDS classes offered since 2007. Family, Friend or Neighbor (FFN) informal child care providers and Santa Cruz Reading Corps Literacy Tutors are not included in these analyses.
Educators in State and
Federally-Subsidized Classrooms
Educators in Licensed Family Child Care Homes
and Private/Non-Profit Centers
Total Number
(Unduplicated)
209 214 15
Educators in Public School
Transitional Kindergarten Classrooms
438

FIRST 5 SANTA CRUZ COUNTY 2014-2015 ANNUAL EVALUATION REPORT PARTNER PROFILES CHILDREN LEARNING AND READY FOR SCHOOL - EARLY LITERACY FOUNDATIONS INITIATIVE
FIRST 5 SANTA CRUZ COUNTY 157
Figure 91: Key Demographics of SEEDS-Trained Early Childhood Educators in Licensed Programs (2007-2015)
Primary Language
Educational Attainment
Source: First 5 Santa Cruz County Early Literacy Foundations program records, Client and Assessment Data Entry Template, 2007-2015.
Note: SEEDS-Trained Early Childhood Educators include SEEDS coaches and participants in all SEEDS classes offered since 2007. Family, Friend or Neighbor (FFN) informal child care providers and Santa Cruz Reading Corps Literacy Tutors are not included in these analyses.
Early childhood educators and coaches may have participated in more than one SEEDS class, but are only counted once in these analyses. For these clients, their language and education data are as of their earliest class, in order to assess the status of these educators at the beginning of their participation in the SEEDS program. Educators might also speak other languages that they do not consider their primary language.
N: (Language) N=446; (Education) N=414.
Outcome Objective: Increase the number of early education settings that provide high quality support for language and literacy
Preschool and Transitional Kindergarten (TK) Classrooms
Research on teacher effectiveness shows that by focusing professional development on language
and literacy and social/emotional development, children are much better prepared for school and
have higher academic achievement. The first indicators of change are the language environment,
teacher-child interactions, and language opportunities that teachers provide to children.
First 5 SEEDS Quality coaches are trained to assess SEEDS classrooms that are teaching children ages
3-5, using the Early Language and Literacy Classroom Observation Pre-K Tool (ELLCO Pre-K). The
ELLCO Pre-K is used to assess the following five classroom components: “Classroom Structure,”
“Curriculum,” “Language Environment,” “Books and Book Reading,” and “Print and Early Writing.”
27.1%
48.7%
21.7%
2.5%
English Only
Spanish Only
Bilingual English/Spanish
Other
8.7%
9.7%
20.3%
27.1%
6.3%
10.6%
8.5%
4.1%4.8% No Formal Schooling
Less Than High School Diploma/GED
High School Diploma/GED
Some College
AA in non-ECE/CD
AA in ECE/CD
BA in non-ECE/CD
BA in ECE/CD
Some Graduate School or Postgraduate Degree
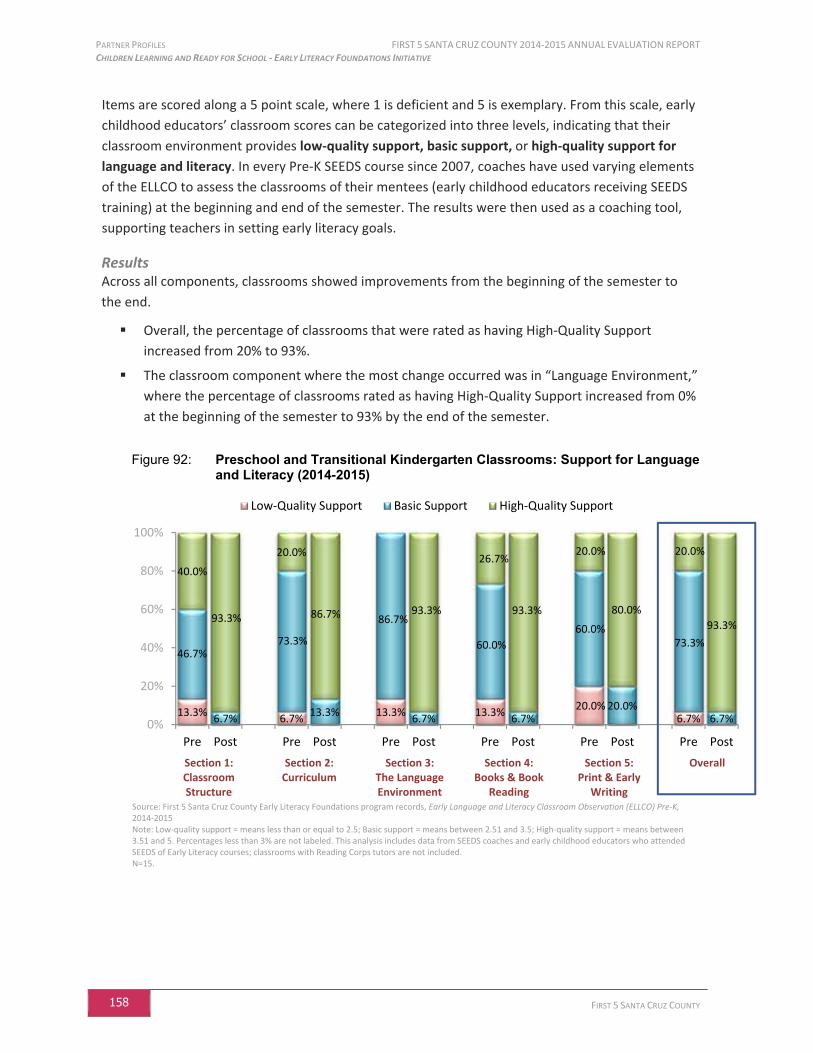
PARTNER PROFILES FIRST 5 SANTA CRUZ COUNTY 2014-2015 ANNUAL EVALUATION REPORT CHILDREN LEARNING AND READY FOR SCHOOL - EARLY LITERACY FOUNDATIONS INITIATIVE
158 FIRST 5 SANTA CRUZ COUNTY
Items are scored along a 5 point scale, where 1 is deficient and 5 is exemplary. From this scale, early
childhood educators’ classroom scores can be categorized into three levels, indicating that their
classroom environment provides low-quality support, basic support, or high-quality support for
language and literacy. In every Pre-K SEEDS course since 2007, coaches have used varying elements
of the ELLCO to assess the classrooms of their mentees (early childhood educators receiving SEEDS
training) at the beginning and end of the semester. The results were then used as a coaching tool,
supporting teachers in setting early literacy goals.
Results Across all components, classrooms showed improvements from the beginning of the semester to
the end.
Overall, the percentage of classrooms that were rated as having High-Quality Support
increased from 20% to 93%.
The classroom component where the most change occurred was in “Language Environment,”
where the percentage of classrooms rated as having High-Quality Support increased from 0%
at the beginning of the semester to 93% by the end of the semester.
Figure 92: Preschool and Transitional Kindergarten Classrooms: Support for Language and Literacy (2014-2015)
Source: First 5 Santa Cruz County Early Literacy Foundations program records, Early Language and Literacy Classroom Observation (ELLCO) Pre-K, 2014-2015 Note: Low-quality support = means less than or equal to 2.5; Basic support = means between 2.51 and 3.5; High-quality support = means between 3.51 and 5. Percentages less than 3% are not labeled. This analysis includes data from SEEDS coaches and early childhood educators who attended SEEDS of Early Literacy courses; classrooms with Reading Corps tutors are not included. N=15.
13.3%6.7%
13.3% 13.3%20.0%
6.7%
46.7%
6.7%
73.3%
13.3%
86.7%
6.7%
60.0%
6.7%
60.0%
20.0%
73.3%
6.7%
40.0%
93.3%
20.0%
86.7% 93.3%
26.7%
93.3%
20.0%
80.0%
20.0%
93.3%
0%
20%
40%
60%
80%
100%
Pre Post Pre Post Pre Post Pre Post Pre Post Pre Post
Low-Quality Support Basic Support High-Quality Support
Section 1: Classroom Structure
Section 2: Curriculum
Section 3: The Language Environment
Section 4: Books & Book
Reading
Section 5: Print & Early
Writing
Overall
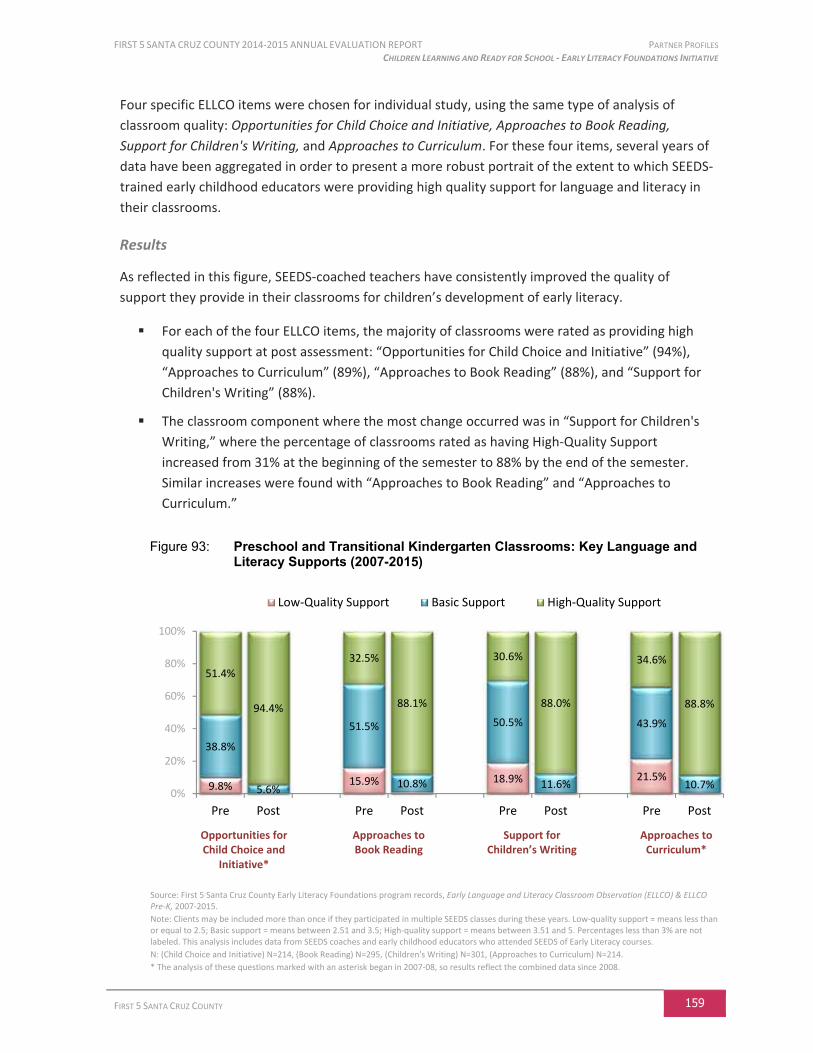
FIRST 5 SANTA CRUZ COUNTY 2014-2015 ANNUAL EVALUATION REPORT PARTNER PROFILES CHILDREN LEARNING AND READY FOR SCHOOL - EARLY LITERACY FOUNDATIONS INITIATIVE
FIRST 5 SANTA CRUZ COUNTY 159
Four specific ELLCO items were chosen for individual study, using the same type of analysis of
classroom quality: Opportunities for Child Choice and Initiative, Approaches to Book Reading,
Support for Children's Writing, and Approaches to Curriculum. For these four items, several years of
data have been aggregated in order to present a more robust portrait of the extent to which SEEDS-
trained early childhood educators were providing high quality support for language and literacy in
their classrooms.
Results
As reflected in this figure, SEEDS-coached teachers have consistently improved the quality of
support they provide in their classrooms for children’s development of early literacy.
For each of the four ELLCO items, the majority of classrooms were rated as providing high
quality support at post assessment: “Opportunities for Child Choice and Initiative” (94%),
“Approaches to Curriculum” (89%), “Approaches to Book Reading” (88%), and “Support for
Children's Writing” (88%).
The classroom component where the most change occurred was in “Support for Children's
Writing,” where the percentage of classrooms rated as having High-Quality Support
increased from 31% at the beginning of the semester to 88% by the end of the semester.
Similar increases were found with “Approaches to Book Reading” and “Approaches to
Curriculum.”
Figure 93: Preschool and Transitional Kindergarten Classrooms: Key Language and Literacy Supports (2007-2015)
Source: First 5 Santa Cruz County Early Literacy Foundations program records, Early Language and Literacy Classroom Observation (ELLCO) & ELLCO Pre-K, 2007-2015.
Note: Clients may be included more than once if they participated in multiple SEEDS classes during these years. Low-quality support = means less than or equal to 2.5; Basic support = means between 2.51 and 3.5; High-quality support = means between 3.51 and 5. Percentages less than 3% are not labeled. This analysis includes data from SEEDS coaches and early childhood educators who attended SEEDS of Early Literacy courses.
N: (Child Choice and Initiative) N=214, (Book Reading) N=295, (Children's Writing) N=301, (Approaches to Curriculum) N=214.
* The analysis of these questions marked with an asterisk began in 2007-08, so results reflect the combined data since 2008.
9.8% 15.9% 18.9% 21.5%
38.8%
5.6%
51.5%
10.8%
50.5%
11.6%
43.9%
10.7%
51.4%
94.4%
32.5%
88.1%
30.6%
88.0%
34.6%
88.8%
0%
20%
40%
60%
80%
100%
Pre Post Pre Post Pre Post Pre Post
Low-Quality Support Basic Support High-Quality Support
Approaches to Book Reading
Opportunities for Child Choice and
Initiative*
Support for Children’s Writing
Approaches to Curriculum*
PARTNER PROFILES FIRST 5 SANTA CRUZ COUNTY 2014-2015 ANNUAL EVALUATION REPORT CHILDREN LEARNING AND READY FOR SCHOOL - EARLY LITERACY FOUNDATIONS INITIATIVE
160 FIRST 5 SANTA CRUZ COUNTY
Family Child Care Settings
The previous data describe the ways that SEEDS-trained teachers made changes to their preschool
classroom environments and their practices in order to better support children’s development of
pre-literacy skills. However, SEEDS training was not just limited to preschool center teachers — early
childhood educators from licensed family child care settings also participated in SEEDS training and
received SEEDS coaching. Their sites were observed at the beginning of their SEEDS training and
again at the end.
The Child/Home Early Language and Literacy Observation (CHELLO) is a tool designed to rate the
early literacy environment in home-based child care settings of children ages birth to 5 years. Two
sections of the CHELLO tool were used to assess home-based classrooms: the Group/Family
Observation section and the Literacy Environment Checklist. For the Group/Family Observation
section, items were scored along a 5 point scale, where 1 is deficient and 5 is exemplary. Like the
ELLCO analyses, early childhood educators’ classroom scores were categorized into three levels,
indicating their classroom environment provided low-quality support, basic support, or high-quality
support for language and literacy. Scores on the Literacy Environment Checklist ranged from 1 to
26, and were similarly categorized into three levels of support (Poor, Fair, Excellent).
For this analysis, several years of data have been aggregated30 in order to present a more robust
portrait of the extent to which SEEDS-trained early childhood educators in family child care settings
were providing high quality support for language and literacy in their preschool classrooms.
Results
The following figures present the PRE and POST scores gathered from early childhood educators in
family child care settings for infants/toddlers, using the CHELLO tool. Across all components,
classrooms showed substantial improvements from the first training to the final training.
Results from the Group/Family Observation section showed that overall, the percentage of
family child care settings that were rated as having High-Quality Support increased from 44%
to 89%.
Among the individual Group/Family Observation components, by the end of the trainings the
majority of family child care settings were rated as having High-Quality Support in all areas:
“Physical Environment for Learning” (93%), “Support for Learning” (87%), and “Adult
Teaching Strategies” (75%).
Scores on the Literacy Environment Checklist showed that the percentage of family child care
settings that were rated as having Excellent Support increased from 40% to 56%.
30
Between 2008-2011, early childhood educators in family child care settings did not use the CHELLO, and consequently no CHELLO data were collected during those years. Therefore, this analysis represents the results for the years that the CHELLO has been utilized (2007-2008, and 2011-present).
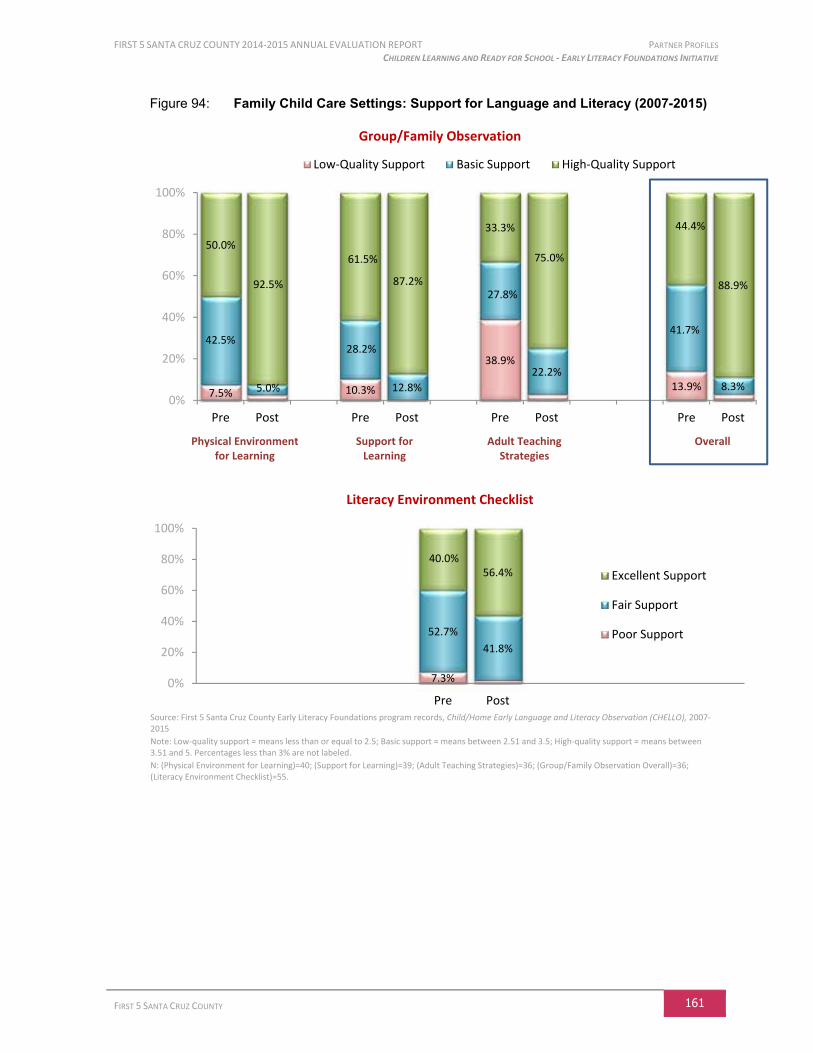
FIRST 5 SANTA CRUZ COUNTY 2014-2015 ANNUAL EVALUATION REPORT PARTNER PROFILES CHILDREN LEARNING AND READY FOR SCHOOL - EARLY LITERACY FOUNDATIONS INITIATIVE
FIRST 5 SANTA CRUZ COUNTY 161
Figure 94: Family Child Care Settings: Support for Language and Literacy (2007-2015)
Group/Family Observation
Literacy Environment Checklist
Source: First 5 Santa Cruz County Early Literacy Foundations program records, Child/Home Early Language and Literacy Observation (CHELLO), 2007-2015
Note: Low-quality support = means less than or equal to 2.5; Basic support = means between 2.51 and 3.5; High-quality support = means between 3.51 and 5. Percentages less than 3% are not labeled.
N: (Physical Environment for Learning)=40; (Support for Learning)=39; (Adult Teaching Strategies)=36; (Group/Family Observation Overall)=36; (Literacy Environment Checklist)=55.
7.5% 10.3%
38.9%
13.9%
42.5%
5.0%
28.2%
12.8%
27.8%
22.2%
41.7%
8.3%
50.0%
92.5%
61.5%
87.2%
33.3%
75.0%
44.4%
88.9%
0%
20%
40%
60%
80%
100%
Pre Post Pre Post Pre Post Pre Post
Low-Quality Support Basic Support High-Quality Support
7.3%
52.7%
41.8%
40.0%56.4%
0%
20%
40%
60%
80%
100%
Pre Post
Excellent Support
Fair Support
Poor Support
Physical Environment for Learning
Support for Learning
Adult Teaching Strategies
Overall
PARTNER PROFILES FIRST 5 SANTA CRUZ COUNTY 2014-2015 ANNUAL EVALUATION REPORT CHILDREN LEARNING AND READY FOR SCHOOL - EARLY LITERACY FOUNDATIONS INITIATIVE
162 FIRST 5 SANTA CRUZ COUNTY
Outcome Objective: Children will increase their skills in research-based predictors for reading success
The Santa Cruz Reading Corps (SCRC) places one AmeriCorps volunteer (called a Literacy Tutor) in
each State Preschool and TK classroom at Live Oak School District, and in each State Preschool
classroom and one TK classroom at Pajaro Valley Unified School District. The goal of this program is
to develop children’s early literacy skills in English in preparation for kindergarten. The Literacy
Tutors are trained in research-based strategies following the SEEDS of Early Literacy curriculum,
collaborate with the classroom teaching staff to enhance daily literacy opportunities, and conduct
literacy assessments to provide individualized support to help children in Santa Cruz County become
successful readers by 3rd grade. In 2014-15, 14 Literacy Tutors were trained and placed in 24
different classrooms31, serving 601 children.
Santa Cruz Reading Corps’ Literacy Tutors are trained in the use of Response to Interventions (RtI)
strategies as a way to provide children with tailored literacy support. 32 Literacy Tutors assess
children’s pre-literacy skills in five areas: Picture Naming, Rhyming, and Alliteration (as measured by
the Individual Growth and Development Indicators (IGDIs)), and Letter Naming and Letter Sounds (as
measured by the Formative Assessment System for Teachers (FAST)). These assessments help the
Tutors recognize children who need tailored literacy support and respond in ways that help the
children experience early school success.
There are three important factors to note regarding these analyses of children’s pre-literacy skills:
Focus on English skills. Beginning in 2012-13, there was an emphasis in all “SEEDS”
classrooms on developing and improving children’s vocabulary skills in English. As the
majority of preschool students were dual language learners, many children were initially
assessed in both English and Spanish. Once these children demonstrated proficiency in their
scores on the English-language assessments, however, they did not continue taking the
Spanish-language assessments. Therefore, the analyses in this report illustrate the amount of
improvement that children made in their English pre-literacy skills.
Focus on children about to enter kindergarten. Only children ages 4 and 5 were included in
these IGDIs analyses, in order to focus on children who were at a similar developmental age
just before entering kindergarten. Additionally, the companion assessment given along with
the IGDIs assessment (the Formative Assessment System for Teachers) is not designed for
children younger than 4, which provided a framework for focusing on children ages 4 and 5.
31
Many classrooms offer services to more than one cohort of children a day. In 2014-15, across 16 sites, there were 24 different cohorts of children.
32 Children who received tailored literacy-based intervention strategies received more frequent monitoring. In addition to the three
benchmark IGDIs assessments, these children took two additional assessments between the 1st and 2
nd benchmark assessments (called
Progress Monitoring 1 and 2), and then two more assessments between the 2nd
and 3rd
benchmark assessments (called Progress Monitoring 3 and 4). If a child demonstrated sufficient improvement by the 2
nd benchmark assessment, the intervention was ended with
that child and was begun with another child who was not on target with early reading predictors at that time. This new child then received two additional assessments between the 2
nd and 3
rd benchmark assessments (Progress Monitoring 3 and 4). Consequently,
every child who received an intervention was monitored at least two additional times with the Progress Monitoring assessments.
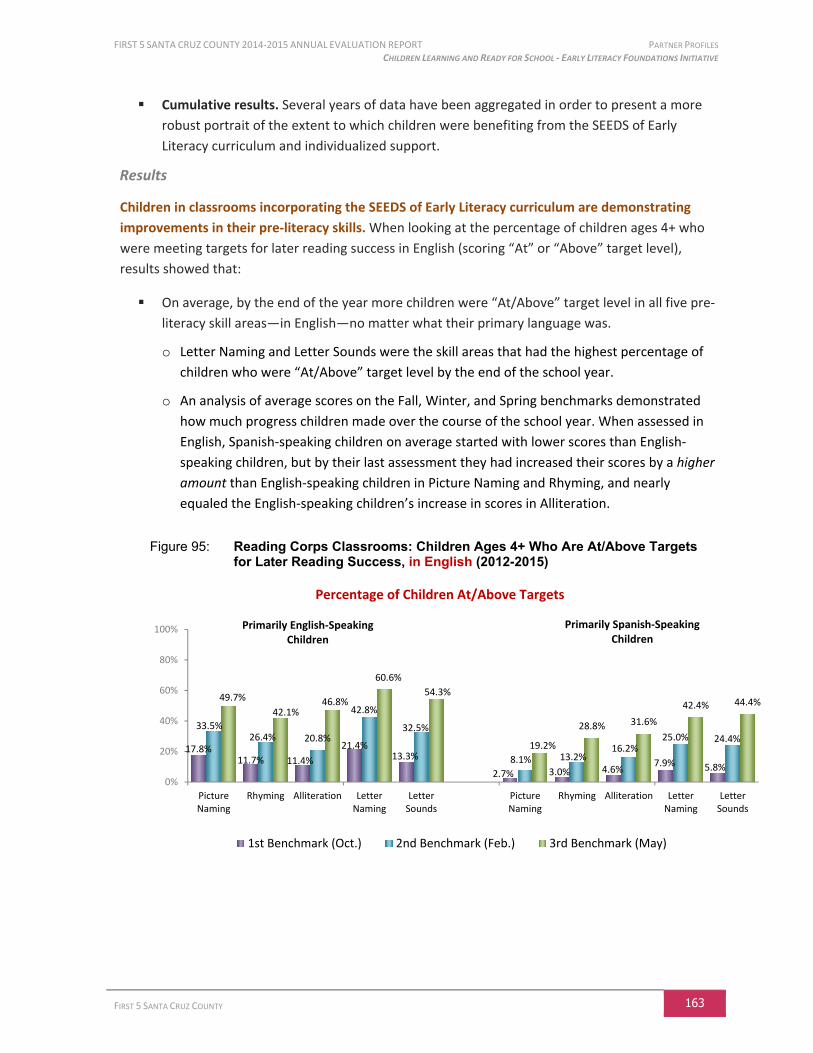
FIRST 5 SANTA CRUZ COUNTY 2014-2015 ANNUAL EVALUATION REPORT PARTNER PROFILES CHILDREN LEARNING AND READY FOR SCHOOL - EARLY LITERACY FOUNDATIONS INITIATIVE
FIRST 5 SANTA CRUZ COUNTY 163
Cumulative results. Several years of data have been aggregated in order to present a more
robust portrait of the extent to which children were benefiting from the SEEDS of Early
Literacy curriculum and individualized support.
Results
Children in classrooms incorporating the SEEDS of Early Literacy curriculum are demonstrating
improvements in their pre-literacy skills. When looking at the percentage of children ages 4+ who
were meeting targets for later reading success in English (scoring “At” or “Above” target level),
results showed that:
On average, by the end of the year more children were “At/Above” target level in all five pre-
literacy skill areas—in English—no matter what their primary language was.
o Letter Naming and Letter Sounds were the skill areas that had the highest percentage of
children who were “At/Above” target level by the end of the school year.
o An analysis of average scores on the Fall, Winter, and Spring benchmarks demonstrated
how much progress children made over the course of the school year. When assessed in
English, Spanish-speaking children on average started with lower scores than English-
speaking children, but by their last assessment they had increased their scores by a higher
amount than English-speaking children in Picture Naming and Rhyming, and nearly
equaled the English-speaking children’s increase in scores in Alliteration.
Figure 95: Reading Corps Classrooms: Children Ages 4+ Who Are At/Above Targets for Later Reading Success, in English (2012-2015)
Percentage of Children At/Above Targets
17.8%11.7% 11.4%
21.4%13.3%
2.7% 3.0% 4.6%7.9% 5.8%
33.5%26.4% 20.8%
42.8%
32.5%
8.1% 13.2%16.2%
25.0% 24.4%
49.7%
42.1%46.8%
60.6%
54.3%
19.2%
28.8% 31.6%
42.4% 44.4%
0%
20%
40%
60%
80%
100%
PictureNaming
Rhyming Alliteration LetterNaming
LetterSounds
PictureNaming
Rhyming Alliteration LetterNaming
LetterSounds
1st Benchmark (Oct.) 2nd Benchmark (Feb.) 3rd Benchmark (May)
Primarily Spanish-Speaking Children
Primarily English-Speaking Children
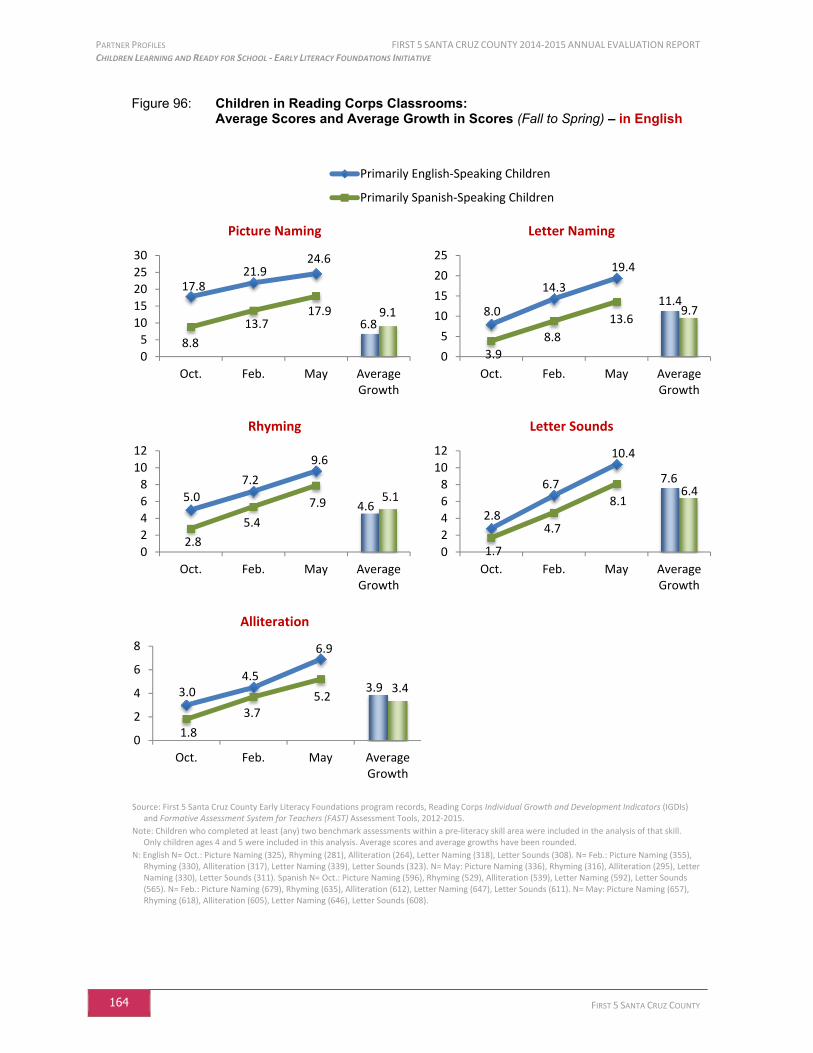
PARTNER PROFILES FIRST 5 SANTA CRUZ COUNTY 2014-2015 ANNUAL EVALUATION REPORT CHILDREN LEARNING AND READY FOR SCHOOL - EARLY LITERACY FOUNDATIONS INITIATIVE
164 FIRST 5 SANTA CRUZ COUNTY
Figure 96: Children in Reading Corps Classrooms: Average Scores and Average Growth in Scores (Fall to Spring) – in English
Picture Naming Letter Naming
Rhyming Letter Sounds
Alliteration
Source: First 5 Santa Cruz County Early Literacy Foundations program records, Reading Corps Individual Growth and Development Indicators (IGDIs) and Formative Assessment System for Teachers (FAST) Assessment Tools, 2012-2015.
Note: Children who completed at least (any) two benchmark assessments within a pre-literacy skill area were included in the analysis of that skill. Only children ages 4 and 5 were included in this analysis. Average scores and average growths have been rounded.
N: English N= Oct.: Picture Naming (325), Rhyming (281), Alliteration (264), Letter Naming (318), Letter Sounds (308). N= Feb.: Picture Naming (355), Rhyming (330), Alliteration (317), Letter Naming (339), Letter Sounds (323). N= May: Picture Naming (336), Rhyming (316), Alliteration (295), Letter Naming (330), Letter Sounds (311). Spanish N= Oct.: Picture Naming (596), Rhyming (529), Alliteration (539), Letter Naming (592), Letter Sounds (565). N= Feb.: Picture Naming (679), Rhyming (635), Alliteration (612), Letter Naming (647), Letter Sounds (611). N= May: Picture Naming (657), Rhyming (618), Alliteration (605), Letter Naming (646), Letter Sounds (608).
0
2 Primarily English-Speaking Children
Primarily Spanish-Speaking Children
6.89.1
17.821.9
24.6
8.8
13.717.9
0
5
10
15
20
25
30
Oct. Feb. May AverageGrowth
11.49.78.0
14.3
19.4
3.9
8.8
13.6
0
5
10
15
20
25
Oct. Feb. May AverageGrowth
4.65.15.0
7.2
9.6
2.8
5.4
7.9
0
2
4
6
8
10
12
Oct. Feb. May AverageGrowth
7.66.4
2.8
6.7
10.4
1.7
4.7
8.1
0
2
4
6
8
10
12
Oct. Feb. May AverageGrowth
3.9 3.43.04.5
6.9
1.8
3.75.2
0
2
4
6
8
Oct. Feb. May AverageGrowth

FIRST 5 SANTA CRUZ COUNTY 2014-2015 ANNUAL EVALUATION REPORT PARTNER PROFILES CHILDREN LEARNING AND READY FOR SCHOOL - EARLY LITERACY FOUNDATIONS INITIATIVE
FIRST 5 SANTA CRUZ COUNTY 165
Children who received tailored interventions are nearly catching up with their peers. Although
these improvement results are greatly encouraging, it is important to note that there are still some
areas where only a small percentage of children are meeting targets for later reading success. In
particular, more work needed to be done to help Spanish-speaking children increase their English
vocabulary (Picture Naming).
To this end, 2014-15 was the first year that the “Repeated Read Aloud” (RRA) strategy became the
main intervention for children needing extra help with their English vocabulary. It was used as a way to
increase vocabulary and fluency in English, which is done by teaching words in the context of a story.
The Big 5 early literacy skills are strategically spaced throughout the week so that there is a different
instructional focus each day, including the specific skills of Rhyming, Alliteration, Letter Naming, and
Letter Sounds. Consequently, the RRA intervention is considered one of the most effective strategies
in bringing about change in children’s pre-literacy skills. This tailored intervention is specifically geared
to dual language learners and the instruction is matched to children’s individual learning speeds. The
intervention provides tutors with a systematic way to discuss books as they re-read them with children
and encourages children to talk more each day. Literacy Tutors used the IGDIs and FAST assessments
to help them identify five children who were most challenged in picture naming (vocabulary), and
provided each of these children with this tailored intervention.
In these 2014-15 analyses of IGDIs and FAST assessments in English, the results are shown for children
who did not require interventions, and for children who received the RRA tailored interventions. The
first set of analyses show the percentage of children at each level of proficiency at each of the three
benchmarks (below target, near target, at/above target), and the second analysis shows the average
scores at each of the three benchmarks, and the average growth from Fall to Spring.
Overall results show that children who received tailored interventions showed remarkable
progress towards reaching greater proficiency in all pre-literacy skill areas, in English.
As would be expected, almost all children who were chosen to receive tailored interventions
had scored “Below” target at the beginning of the school year on the English-language
assessments. However, by the end of the school year, a majority of these children had moved
up into higher levels of proficiency (“Near,” or “At/Above” target).
This improvement in English pre-literacy skills was particularly striking among primarily
Spanish-speaking children who had received tailored interventions.
o Not only did these Spanish-speaking children improve their skill levels, but the percentages
who were “Near,” or “At/Above” target by the end of the school year came quite close to
the percentages of their peers who had not required these tailored interventions. This was
particularly true in the areas of Alliteration, Letter Naming, and Letter Sounds.
o An analysis of average scores on the Fall, Winter, and Spring benchmarks showed that
when assessed in English, Spanish-speaking children who were selected to receive tailored
interventions started with lower scores than Spanish-speaking children who did not
require tailored interventions. But by their last assessment they had increased their scores
by a higher amount in Picture Naming and Rhyming.
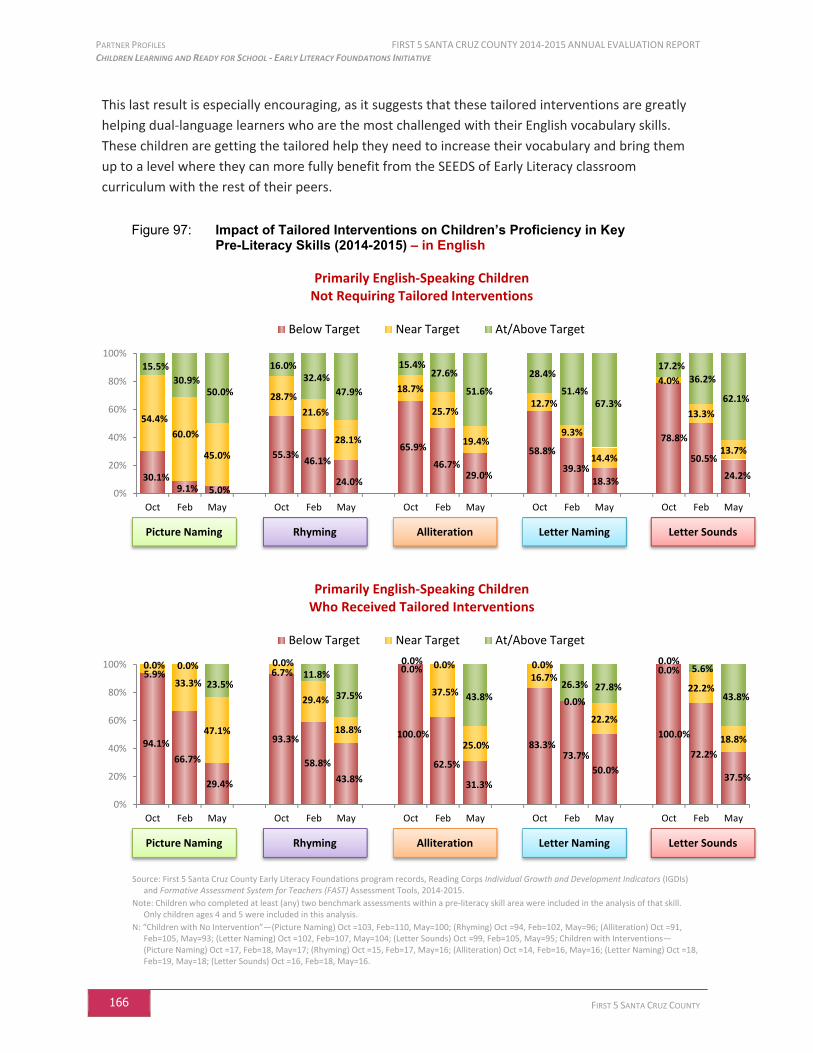
PARTNER PROFILES FIRST 5 SANTA CRUZ COUNTY 2014-2015 ANNUAL EVALUATION REPORT CHILDREN LEARNING AND READY FOR SCHOOL - EARLY LITERACY FOUNDATIONS INITIATIVE
166 FIRST 5 SANTA CRUZ COUNTY
This last result is especially encouraging, as it suggests that these tailored interventions are greatly
helping dual-language learners who are the most challenged with their English vocabulary skills.
These children are getting the tailored help they need to increase their vocabulary and bring them
up to a level where they can more fully benefit from the SEEDS of Early Literacy classroom
curriculum with the rest of their peers.
Figure 97: Impact of Tailored Interventions on Children’s Proficiency in Key Pre-Literacy Skills (2014-2015) – in English
Primarily English-Speaking Children Not Requiring Tailored Interventions
Primarily English-Speaking Children Who Received Tailored Interventions
Source: First 5 Santa Cruz County Early Literacy Foundations program records, Reading Corps Individual Growth and Development Indicators (IGDIs)
and Formative Assessment System for Teachers (FAST) Assessment Tools, 2014-2015.
Note: Children who completed at least (any) two benchmark assessments within a pre-literacy skill area were included in the analysis of that skill. Only children ages 4 and 5 were included in this analysis.
N: “Children with No Intervention”—(Picture Naming) Oct =103, Feb=110, May=100; (Rhyming) Oct =94, Feb=102, May=96; (Alliteration) Oct =91, Feb=105, May=93; (Letter Naming) Oct =102, Feb=107, May=104; (Letter Sounds) Oct =99, Feb=105, May=95; Children with Interventions—(Picture Naming) Oct =17, Feb=18, May=17; (Rhyming) Oct =15, Feb=17, May=16; (Alliteration) Oct =14, Feb=16, May=16; (Letter Naming) Oct =18, Feb=19, May=18; (Letter Sounds) Oct =16, Feb=18, May=16.
30.1%9.1% 5.0%
55.3%46.1%
24.0%
65.9%
46.7%29.0%
58.8%
39.3%18.3%
78.8%
50.5%
24.2%
54.4%
60.0%
45.0%
28.7%
21.6%
28.1%
18.7%
25.7%
19.4%
12.7%
9.3%
14.4%
4.0%
13.3%
13.7%
15.5%
30.9%50.0%
16.0%32.4%
47.9%
15.4%27.6%
51.6%
28.4%
51.4%67.3%
17.2%36.2%
62.1%
0%
20%
40%
60%
80%
100%
Oct Feb May Oct Feb May Oct Feb May Oct Feb May Oct Feb May
Below Target Near Target At/Above Target
94.1%
66.7%
29.4%
93.3%
58.8%
43.8%
100.0%
62.5%
31.3%
83.3%73.7%
50.0%
100.0%
72.2%
37.5%
5.9%33.3%
47.1%
6.7%
29.4%
18.8%
0.0%
37.5%
25.0%
16.7%
0.0%
22.2%
0.0%
22.2%
18.8%
0.0% 0.0%
23.5%
0.0%11.8%
37.5%
0.0% 0.0%
43.8%
0.0%
26.3% 27.8%
0.0%5.6%
43.8%
0%
20%
40%
60%
80%
100%
Oct Feb May Oct Feb May Oct Feb May Oct Feb May Oct Feb May
Below Target Near Target At/Above Target
Picture Naming Rhyming Alliteration Letter Naming Letter Sounds
Picture Naming Rhyming Alliteration Letter Naming Letter Sounds

FIRST 5 SANTA CRUZ COUNTY 2014-2015 ANNUAL EVALUATION REPORT PARTNER PROFILES CHILDREN LEARNING AND READY FOR SCHOOL - EARLY LITERACY FOUNDATIONS INITIATIVE
FIRST 5 SANTA CRUZ COUNTY 167
Primarily Spanish-Speaking Children Not Requiring Tailored Interventions
Primarily Spanish-Speaking Children Who Received Tailored Interventions
Source: First 5 Santa Cruz County Early Literacy Foundations program records, Reading Corps Individual Growth and Development Indicators (IGDIs)
and Formative Assessment System for Teachers (FAST) Assessment Tools, 2014-2015.
Note: Children who completed at least (any) two benchmark assessments within a pre-literacy skill area were included in the analysis of that skill. Only children ages 4 and 5 were included in this analysis.
N: “Children with No Intervention”—(Picture Naming) Oct =89, Feb=104, May=99; (Rhyming) Oct =76, Feb=96, May=90; (Alliteration) Oct =73, Feb=89, May=89; (Letter Naming) Oct =86, Feb=102, May=100; (Letter Sounds) Oct =74, Feb=93, May=88; Children with Interventions—(Picture Naming) Oct =71, Feb=84, May=77; (Rhyming) Oct =57, Feb=76, May=72; (Alliteration) Oct =65, Feb=78, May=73; (Letter Naming) Oct =69, Feb=83, May=80; (Letter Sounds) Oct =70, Feb=82, May=74.
59.6%39.4%
22.2%
69.7%58.3%
36.7%
76.7%64.0%
48.3%
69.8%
51.0%32.0%
79.7%
61.3%
37.5%
33.7%51.0%
60.6%
22.4%26.0%
33.3%
17.8%27.0%
29.2%
16.3%
17.6%
18.0%
9.5%
12.9%
11.4%
6.7% 9.6% 17.2%7.9%
15.6%
30.0%
5.5% 9.0%22.5%
14.0%
31.4%
50.0%
10.8%25.8%
51.1%
0%
20%
40%
60%
80%
100%
Oct Feb May Oct Feb May Oct Feb May Oct Feb May Oct Feb May
Below Target Near Target At/Above Target
94.4%72.6%
36.4%
89.5%71.1%
50.0%
80.0%71.8%
56.2%
78.3%
57.8%
33.8%
94.3%
67.1%
41.9%
5.6%26.2%
50.6%
10.5%23.7%
33.3%
12.3% 21.8%
20.5%
7.2%
20.5%
22.5%
2.9%
13.4%
13.5%
0.0% 1.2%13.0%
0.0%5.3%
16.7%
7.7% 6.4%23.3%
14.5%21.7%
43.8%
2.9%
19.5%
44.6%
0%
20%
40%
60%
80%
100%
Oct Feb May Oct Feb May Oct Feb May Oct Feb May Oct Feb May
Below Target Near Target At/Above Target
Picture Naming Rhyming Alliteration Letter Naming Letter Sounds
Picture Naming Rhyming Alliteration Letter Naming Letter Sounds
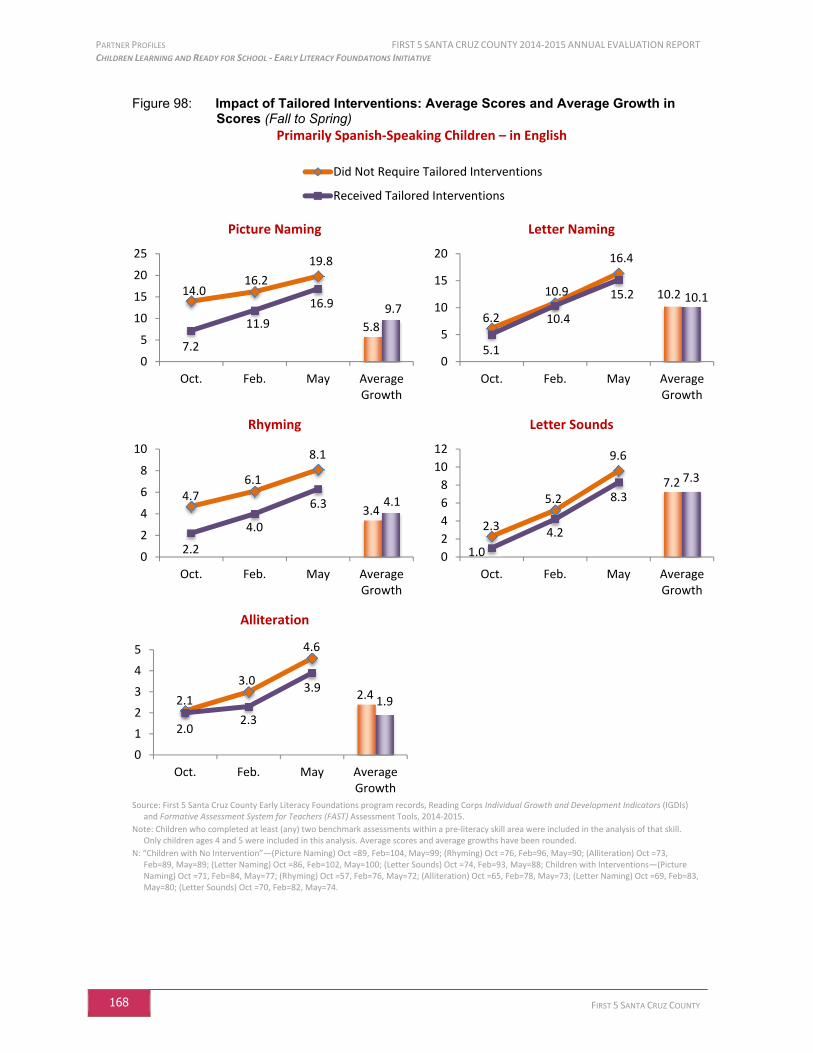
PARTNER PROFILES FIRST 5 SANTA CRUZ COUNTY 2014-2015 ANNUAL EVALUATION REPORT CHILDREN LEARNING AND READY FOR SCHOOL - EARLY LITERACY FOUNDATIONS INITIATIVE
168 FIRST 5 SANTA CRUZ COUNTY
Figure 98: Impact of Tailored Interventions: Average Scores and Average Growth in Scores (Fall to Spring)
Primarily Spanish-Speaking Children – in English
Picture Naming Letter Naming
Rhyming Letter Sounds
Alliteration
Source: First 5 Santa Cruz County Early Literacy Foundations program records, Reading Corps Individual Growth and Development Indicators (IGDIs) and Formative Assessment System for Teachers (FAST) Assessment Tools, 2014-2015.
Note: Children who completed at least (any) two benchmark assessments within a pre-literacy skill area were included in the analysis of that skill. Only children ages 4 and 5 were included in this analysis. Average scores and average growths have been rounded.
N: “Children with No Intervention”—(Picture Naming) Oct =89, Feb=104, May=99; (Rhyming) Oct =76, Feb=96, May=90; (Alliteration) Oct =73, Feb=89, May=89; (Letter Naming) Oct =86, Feb=102, May=100; (Letter Sounds) Oct =74, Feb=93, May=88; Children with Interventions—(Picture Naming) Oct =71, Feb=84, May=77; (Rhyming) Oct =57, Feb=76, May=72; (Alliteration) Oct =65, Feb=78, May=73; (Letter Naming) Oct =69, Feb=83, May=80; (Letter Sounds) Oct =70, Feb=82, May=74.
Did Not Require Tailored Interventions
Received Tailored Interventions
5.8
9.7
14.016.2
19.8
7.2
11.9
16.9
0
5
10
15
20
25
Oct. Feb. May AverageGrowth
10.2 10.1
6.2
10.9
16.4
5.1
10.4
15.2
0
5
10
15
20
Oct. Feb. May AverageGrowth
3.44.14.7
6.1
8.1
2.2
4.0
6.3
0
2
4
6
8
10
Oct. Feb. May AverageGrowth
7.2 7.3
2.3
5.2
9.6
1.0
4.2
8.3
0
2
4
6
8
10
12
Oct. Feb. May AverageGrowth
2.4 1.92.1
3.0
4.6
2.02.3
3.9
0
1
2
3
4
5
Oct. Feb. May AverageGrowth

FIRST 5 SANTA CRUZ COUNTY 2014-2015 ANNUAL EVALUATION REPORT PARTNER PROFILES CHILDREN LEARNING AND READY FOR SCHOOL - EARLY LITERACY FOUNDATIONS INITIATIVE
FIRST 5 SANTA CRUZ COUNTY 169
Santa Cruz Public Libraries
Toddler Time program
The Santa Cruz Public Libraries (SCPL) offer Toddler Time programs at six branches of the Santa Cruz
Public Libraries (Downtown, Live Oak, Boulder Creek, Scotts Valley, Aptos, and Branciforte). This program
is based on the previous “Family Place” program, and includes 60 minutes of moderately unstructured
play and activity time, including early literacy development with stories and songs, movement activities,
socialization activities, art activities, and parent discussion time. Occasionally community resource guests
participate in the program as well.
In September 2014 a new Toddler Time program began at the Branciforte branch of the SCPL,
with a regular group of families who come each week.
In 2014-15, SCPL provided a total of 241 Toddler Time programs to an estimated 4,946
families. Many families came to 2 or more Toddler Time programs each week.
In spring 2015, “Musical Me” visited several Toddler Times.
Brio Train Table
The Brio Train Table at Live Oak Branch was originally purchased with First 5 funding, and has been loved
by Live Oak children for almost a decade. In 2014-15 the train was restored with a new table top, track,
train cars, and accessories.
Raising A Reader
The SCPL schedules and hosts library visits for preschools that are participating in Raising A Reader (RAR).
In 2014-15, SCPL hosted a total of 14 Raising A Reader visits for 11 different preschools.
These RAR visits were attended by 179 parents and teachers and 268 children.
PARTNER PROFILES FIRST 5 SANTA CRUZ COUNTY 2014-2015 ANNUAL EVALUATION REPORT CHILDREN LEARNING AND READY FOR SCHOOL - RAISING A READER
170 FIRST 5 SANTA CRUZ COUNTY
Raising A Reader
Program Description
Raising A Reader (RAR) fosters healthy brain development, supports parent-child bonding, and
motivates families to read aloud with their children which helps develop the early literacy skills that
are critical for school success. Raising A Reader (RAR) began operation in Watsonville during the last
quarter of the 2005-06 funding cycle. The program provides a way for children and their parents or
caregivers to participate in a weekly rotating book
bag program through early care and education
settings.
On a weekly basis, participating RAR classrooms and
family child care homes provide children with bags
that are filled with various award-winning books,
which they borrow and bring home to their parents.
RAR provides training and information to parents
and caregivers on how to effectively share these
books with their children at home, to help develop
their children’s early literacy skills.
RAR also connects families with their local public
library, and at the end of the program children are
given a book bag of their own as a way to
encourage families to continue the practice of
borrowing and reading books together.
Population Served
New Existing
2014-15Total
Children 2,475 1,654 4,129
Source: First 5 CCD database for July 1, 2014 – June 30, 2015.
Note: “New” children are those who began participating in Raising A Reader for the first time during this fiscal year. “Existing” children are those who began participating in Raising A Reader before this fiscal year, and continued their participation during this fiscal year.
Outcome Objective: Raising A Reader will support at least 277 sites (56 new and 221 existing)
Periodically, RAR staff visit participating child care sites to monitor how well the program is
operating, and provide refresher books or trainings as needed. Indeed, as more and more sites in
the county have implemented RAR over the years, the objectives of RAR has shifted from adding
new sites to maintaining and supporting the existing ones.
“RAR has gotten our parents more involved. The red bag and books let them realize how simple and rewarding it can be to just be with your child and a book.”
“Books are the best connection between parents, school, students, and providers.”
“I heard a 10-month-old talk about ‘el rancho’ (the farm) after being read some RAR books.”
“I’m especially pleased to see that parents of infants in my program understand the importance of reading to very young children. I see a high level of engagement with books.”
“One family especially enjoyed the Read Aloud DVD and have noticed a big difference as they have been applying the techniques used.”
- Raising A Reader Provider Survey comments
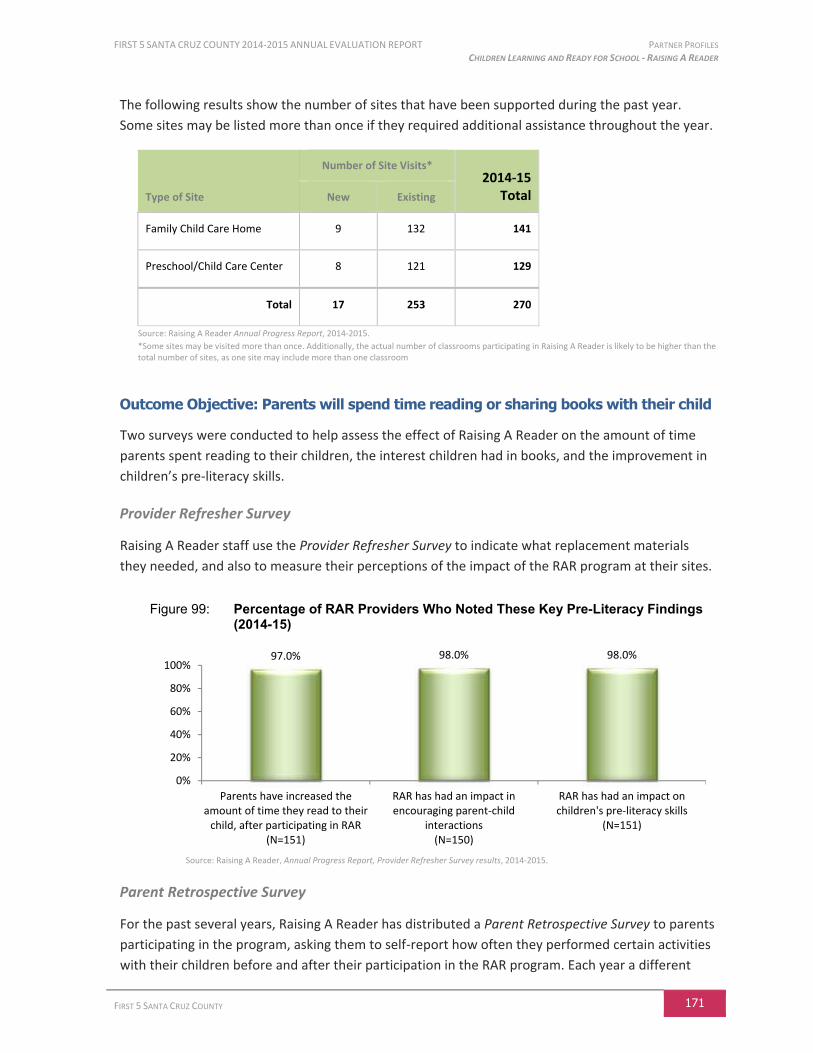
FIRST 5 SANTA CRUZ COUNTY 2014-2015 ANNUAL EVALUATION REPORT PARTNER PROFILES CHILDREN LEARNING AND READY FOR SCHOOL - RAISING A READER
FIRST 5 SANTA CRUZ COUNTY 171
The following results show the number of sites that have been supported during the past year.
Some sites may be listed more than once if they required additional assistance throughout the year.
Type of Site
Number of Site Visits* 2014-15
Total New Existing
Family Child Care Home 9 132 141
Preschool/Child Care Center 8 121 129
Total 17 253 270
Source: Raising A Reader Annual Progress Report, 2014-2015.
*Some sites may be visited more than once. Additionally, the actual number of classrooms participating in Raising A Reader is likely to be higher than the total number of sites, as one site may include more than one classroom
Outcome Objective: Parents will spend time reading or sharing books with their child
Two surveys were conducted to help assess the effect of Raising A Reader on the amount of time
parents spent reading to their children, the interest children had in books, and the improvement in
children’s pre-literacy skills.
Provider Refresher Survey
Raising A Reader staff use the Provider Refresher Survey to indicate what replacement materials
they needed, and also to measure their perceptions of the impact of the RAR program at their sites.
Figure 99: Percentage of RAR Providers Who Noted These Key Pre-Literacy Findings (2014-15)
Source: Raising A Reader, Annual Progress Report, Provider Refresher Survey results, 2014-2015.
Parent Retrospective Survey
For the past several years, Raising A Reader has distributed a Parent Retrospective Survey to parents
participating in the program, asking them to self-report how often they performed certain activities
with their children before and after their participation in the RAR program. Each year a different
97.0% 98.0% 98.0%
0%
20%
40%
60%
80%
100%
Parents have increased theamount of time they read to their
child, after participating in RAR(N=151)
RAR has had an impact inencouraging parent-child
interactions(N=150)
RAR has had an impact onchildren's pre-literacy skills
(N=151)
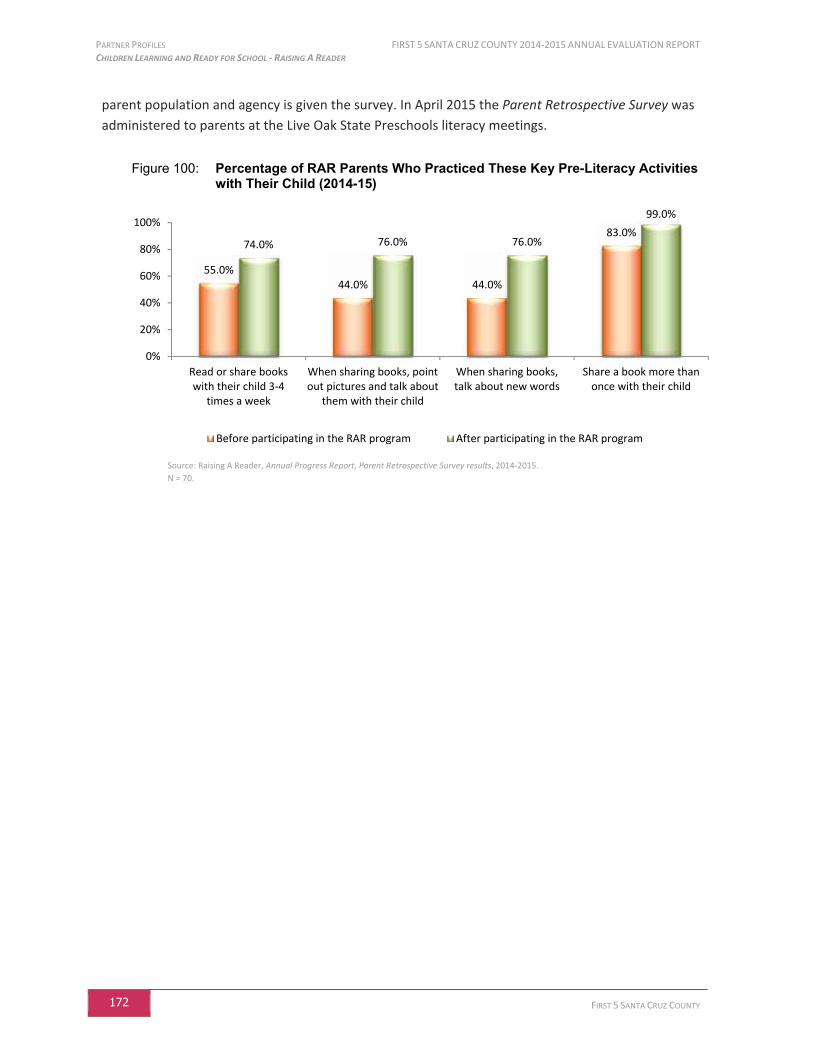
PARTNER PROFILES FIRST 5 SANTA CRUZ COUNTY 2014-2015 ANNUAL EVALUATION REPORT CHILDREN LEARNING AND READY FOR SCHOOL - RAISING A READER
172 FIRST 5 SANTA CRUZ COUNTY
parent population and agency is given the survey. In April 2015 the Parent Retrospective Survey was
administered to parents at the Live Oak State Preschools literacy meetings.
Figure 100: Percentage of RAR Parents Who Practiced These Key Pre-Literacy Activities with Their Child (2014-15)
Source: Raising A Reader, Annual Progress Report, Parent Retrospective Survey results, 2014-2015.
N = 70.
55.0%44.0% 44.0%
83.0%74.0% 76.0% 76.0%
99.0%
0%
20%
40%
60%
80%
100%
Read or share bookswith their child 3-4
times a week
When sharing books, pointout pictures and talk about
them with their child
When sharing books,talk about new words
Share a book more thanonce with their child
Before participating in the RAR program After participating in the RAR program

FIRST 5 SANTA CRUZ COUNTY 2014-2015 ANNUAL EVALUATION REPORT PARTNER PROFILES CHILDREN LEARNING AND READY FOR SCHOOL - SUMMER PRE-K ACADEMY
FIRST 5 SANTA CRUZ COUNTY 173
Summer Pre-K Academy
Program Description
Pajaro Valley Unified School District (PVUSD)-Migrant Education implements a four-week summer
academy for children about to enter kindergarten at seven PVUSD elementary schools. The program
is designed to serve children from migrant families who have little or no preschool experience, in
the summer before they enter kindergarten. First 5 partners with PVUSD-Migrant Education to fund
100 additional children who do not qualify for Migrant Education. Although the Summer Pre-K
Academy serves children from both Monterey and Santa Cruz Counties, only the children from Santa
Cruz County enrolled due to First 5 funding are described in this report.
The academy is geared toward exposing children to early literacy concepts and kindergarten routines
in a safe learning environment that helps to support children’s emotional and social well-being and
build bonds with other children to ease later adjustments. Using a culturally responsive program that
is aligned with the California Preschool Foundations, the program focuses on building on the home
language and bridging to English. The instruction is designed to accelerate the students’ kindergarten
readiness skills in order to narrow the achievement gap upon entering kindergarten.
Population Served
2014-2015
Children 68
Source: First 5 CCD database for July 1, 2014 – June 30, 2015.
Outcome Objective: Children will increase their recognition of letter sounds
Program Objectives
2014-2015
All Children
Children attending at least
14 sessions
75% of participants who completed both the pre and post survey will increase their letter sound recognition by 5 letter sounds using the cognate alphabet in the child’s home language.
85.2%
N=61
85.5%
N=55
Source: Migrant Education – Summer Pre-K Academy, Migrant Education Even Start (MEES) Pre-K Letter Sound Identification tool, 2015.
“This evidence based, culturally responsive program is aligned with the three California Preschool Foundations, with a focus on building on the home language and bridging to English. The instruction is designed to accelerate the students’ school readiness skills in order to narrow the achievement gap upon entering kindergarten, and provides many of the necessary tools that will help them reach their very first academic milestones.”
- Migrant Education, Annual Progress Report
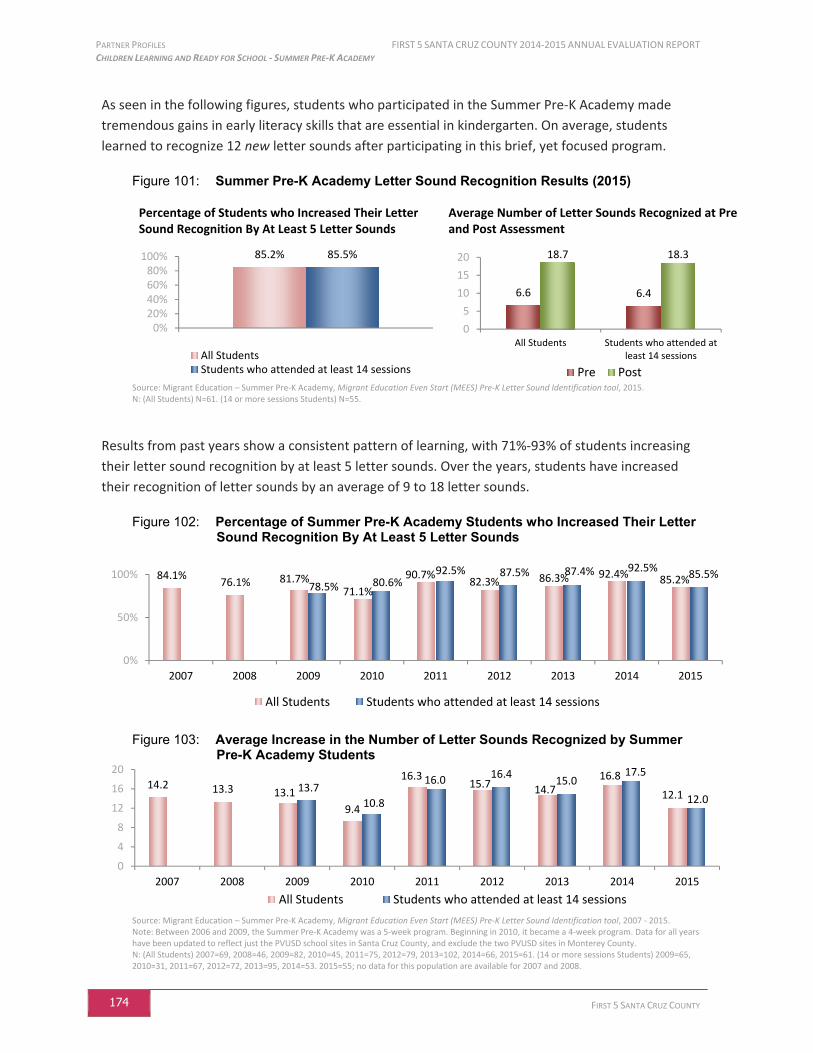
PARTNER PROFILES FIRST 5 SANTA CRUZ COUNTY 2014-2015 ANNUAL EVALUATION REPORT CHILDREN LEARNING AND READY FOR SCHOOL - SUMMER PRE-K ACADEMY
174 FIRST 5 SANTA CRUZ COUNTY
As seen in the following figures, students who participated in the Summer Pre-K Academy made
tremendous gains in early literacy skills that are essential in kindergarten. On average, students
learned to recognize 12 new letter sounds after participating in this brief, yet focused program.
Figure 101: Summer Pre-K Academy Letter Sound Recognition Results (2015)
Percentage of Students who Increased Their Letter Sound Recognition By At Least 5 Letter Sounds
Average Number of Letter Sounds Recognized at Pre and Post Assessment
Source: Migrant Education – Summer Pre-K Academy, Migrant Education Even Start (MEES) Pre-K Letter Sound Identification tool, 2015. N: (All Students) N=61. (14 or more sessions Students) N=55.
Results from past years show a consistent pattern of learning, with 71%-93% of students increasing
their letter sound recognition by at least 5 letter sounds. Over the years, students have increased
their recognition of letter sounds by an average of 9 to 18 letter sounds.
Figure 102: Percentage of Summer Pre-K Academy Students who Increased Their Letter Sound Recognition By At Least 5 Letter Sounds
Figure 103: Average Increase in the Number of Letter Sounds Recognized by Summer Pre-K Academy Students
Source: Migrant Education – Summer Pre-K Academy, Migrant Education Even Start (MEES) Pre-K Letter Sound Identification tool, 2007 - 2015. Note: Between 2006 and 2009, the Summer Pre-K Academy was a 5-week program. Beginning in 2010, it became a 4-week program. Data for all years have been updated to reflect just the PVUSD school sites in Santa Cruz County, and exclude the two PVUSD sites in Monterey County. N: (All Students) 2007=69, 2008=46, 2009=82, 2010=45, 2011=75, 2012=79, 2013=102, 2014=66, 2015=61. (14 or more sessions Students) 2009=65, 2010=31, 2011=67, 2012=72, 2013=95, 2014=53. 2015=55; no data for this population are available for 2007 and 2008.
85.2% 85.5%
0%20%40%60%80%
100%
All StudentsStudents who attended at least 14 sessions
6.6 6.4
18.7 18.3
0
5
10
15
20
All Students Students who attended atleast 14 sessions
Pre Post
84.1%76.1% 81.7%
71.1%
90.7%82.3% 86.3% 92.4% 85.2%
78.5% 80.6%92.5% 87.5% 87.4% 92.5%
85.5%
0%
50%
100%
2007 2008 2009 2010 2011 2012 2013 2014 2015
All Students Students who attended at least 14 sessions
14.2 13.3 13.1
9.4
16.315.7 14.7
16.8
12.113.7
10.8
16.0 16.415.0
17.5
12.0
0
4
8
12
16
20
2007 2008 2009 2010 2011 2012 2013 2014 2015
All Students Students who attended at least 14 sessions

FIRST 5 SANTA CRUZ COUNTY 2014-2015 ANNUAL EVALUATION REPORT PARTNER PROFILES CHILDREN LEARNING AND READY FOR SCHOOL - TRANSITION TO KINDERGARTEN WORKSHOPS
FIRST 5 SANTA CRUZ COUNTY 175
Transition to Kindergarten
Transition to Kindergarten Workshops
Program Description
Transition to Kindergarten Workshops are offered to families in preschool settings from January to
June of each year. These workshops inform parents about kindergarten registration requirements,
choices of language programs, how to support their child in school, and ways to ensure that their
child’s entry into school is a pleasant and smooth transition.
Families participated in workshops at 19 State and Federally funded Preschool sites throughout the
county.
Population Served
2014-2015
Parents/Guardians 314
Source: First 5, Transition to Kindergarten Workshop Participant Data, 2014-2015.
PARTNER PROFILES FIRST 5 SANTA CRUZ COUNTY 2014-2015 ANNUAL EVALUATION REPORT CHILDREN LEARNING AND READY FOR SCHOOL - TRANSITION TO KINDERGARTEN WORKSHOPS
176 FIRST 5 SANTA CRUZ COUNTY
FIRST 5 SANTA CRUZ COUNTY 2014-2015 ANNUAL EVALUATION REPORT APPENDICES
FIRST 5 SANTA CRUZ COUNTY 177
APPENDICES

APPENDICES FIRST 5 SANTA CRUZ COUNTY 2014-2015 ANNUAL EVALUATION REPORT
178 FIRST 5 SANTA CRUZ COUNTY
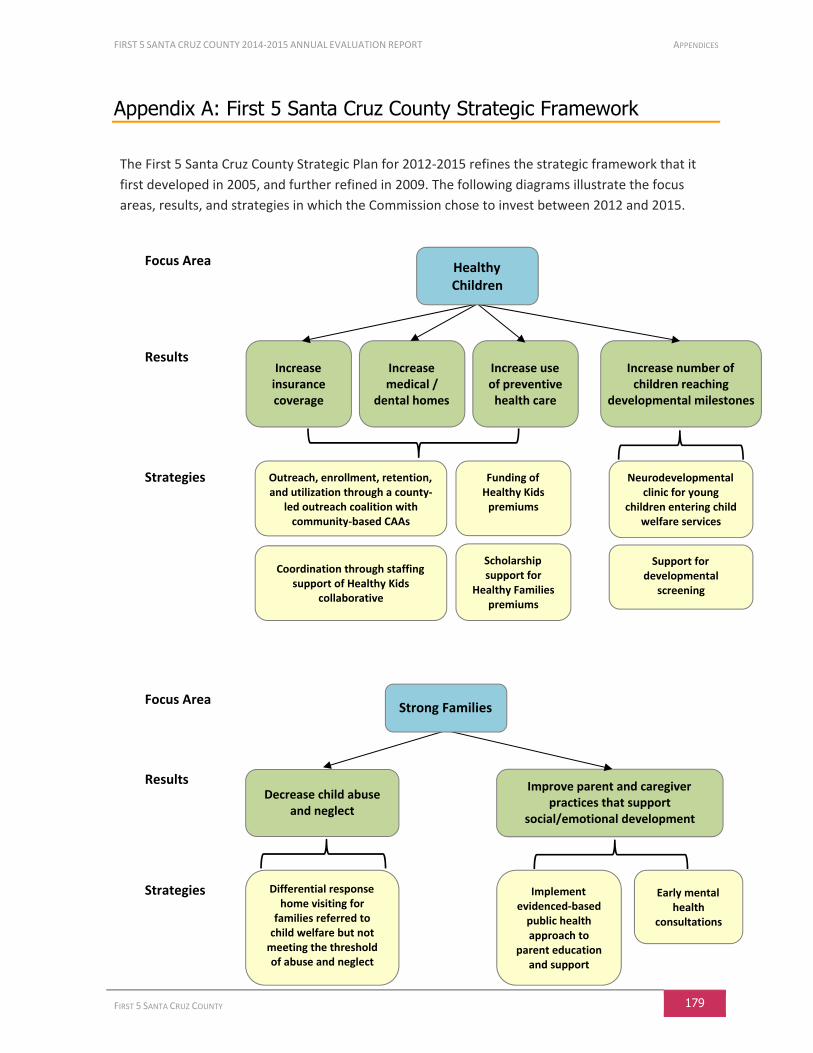
FIRST 5 SANTA CRUZ COUNTY 2014-2015 ANNUAL EVALUATION REPORT APPENDICES
FIRST 5 SANTA CRUZ COUNTY 179
Appendix A: First 5 Santa Cruz County Strategic Framework
The First 5 Santa Cruz County Strategic Plan for 2012-2015 refines the strategic framework that it
first developed in 2005, and further refined in 2009. The following diagrams illustrate the focus
areas, results, and strategies in which the Commission chose to invest between 2012 and 2015.
Focus Area
Results
Strategies
Increase number of children reaching
developmental milestones
Increase use of preventive health care
Increase insurance coverage
Increase medical /
dental homes
Outreach, enrollment, retention, and utilization through a county-
led outreach coalition with community-based CAAs
Coordination through staffing support of Healthy Kids
collaborative
Scholarship support for
Healthy Families premiums
Funding of Healthy Kids
premiums
Neurodevelopmental clinic for young
children entering child welfare services
Support for developmental
screening
Focus Area
Results
Strategies
Decrease child abuse and neglect
Improve parent and caregiver practices that support
social/emotional development
Differential response home visiting for
families referred to child welfare but not
meeting the threshold of abuse and neglect
Implement evidenced-based
public health approach to
parent education and support
Early mental health
consultations
Strong Families
Healthy Children
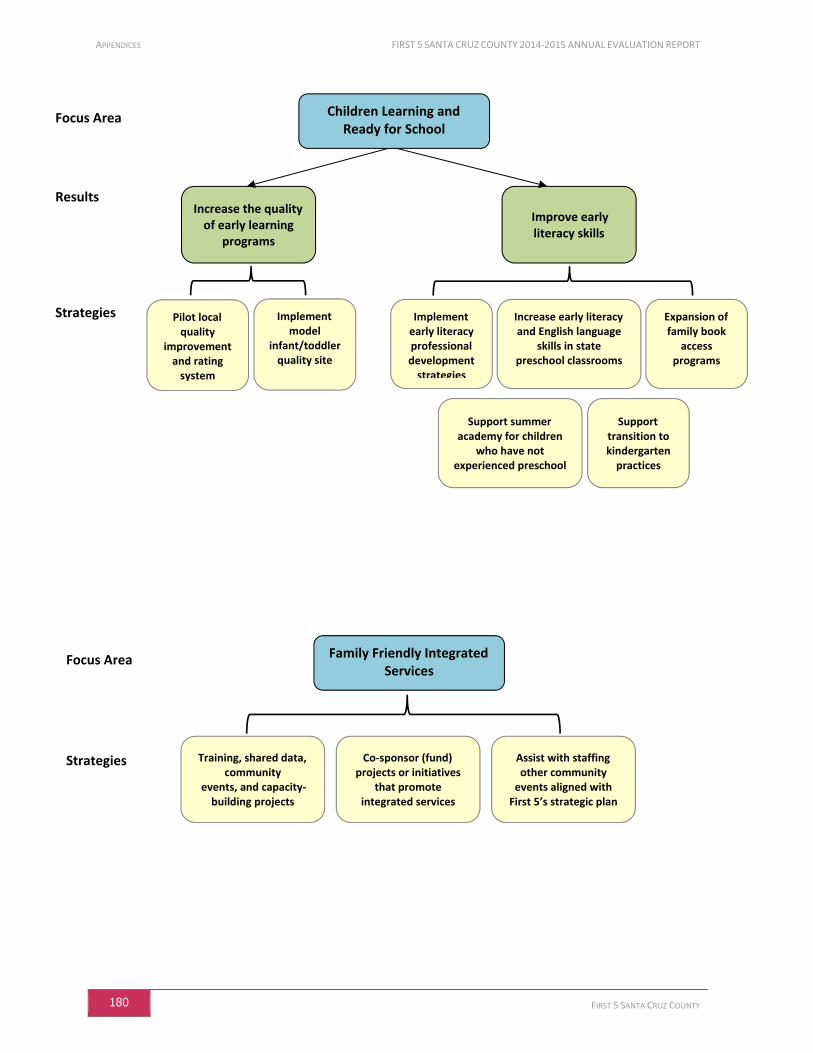
APPENDICES FIRST 5 SANTA CRUZ COUNTY 2014-2015 ANNUAL EVALUATION REPORT
180 FIRST 5 SANTA CRUZ COUNTY
Focus Area
Results
Strategies
Increase the quality of early learning
programs
Improve early literacy skills
Family Friendly Integrated Services
Pilot local quality
improvement and rating
system
Support summer academy for children
who have not experienced preschool
Implement model
infant/toddler quality site
Implement early literacy professional development
strategies
Support transition to kindergarten
practices
Focus Area
Strategies Training, shared data, community
events, and capacity-building projects
Assist with staffing other community
events aligned with First 5’s strategic plan
Co-sponsor (fund) projects or initiatives
that promote integrated services
Children Learning and Ready for School
Expansion of family book
access programs
Increase early literacy and English language
skills in state preschool classrooms
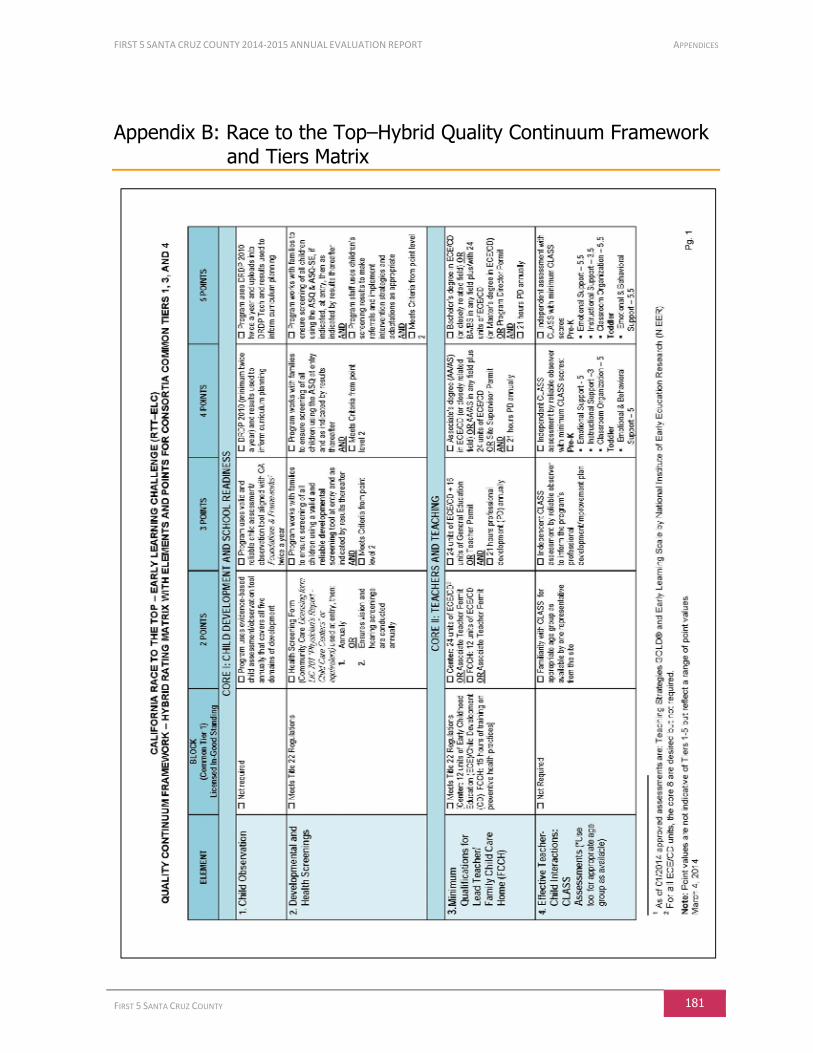
FIRST 5 SANTA CRUZ COUNTY 2014-2015 ANNUAL EVALUATION REPORT APPENDICES
FIRST 5 SANTA CRUZ COUNTY 181
Appendix B: Race to the Top–Hybrid Quality Continuum Framework and Tiers Matrix
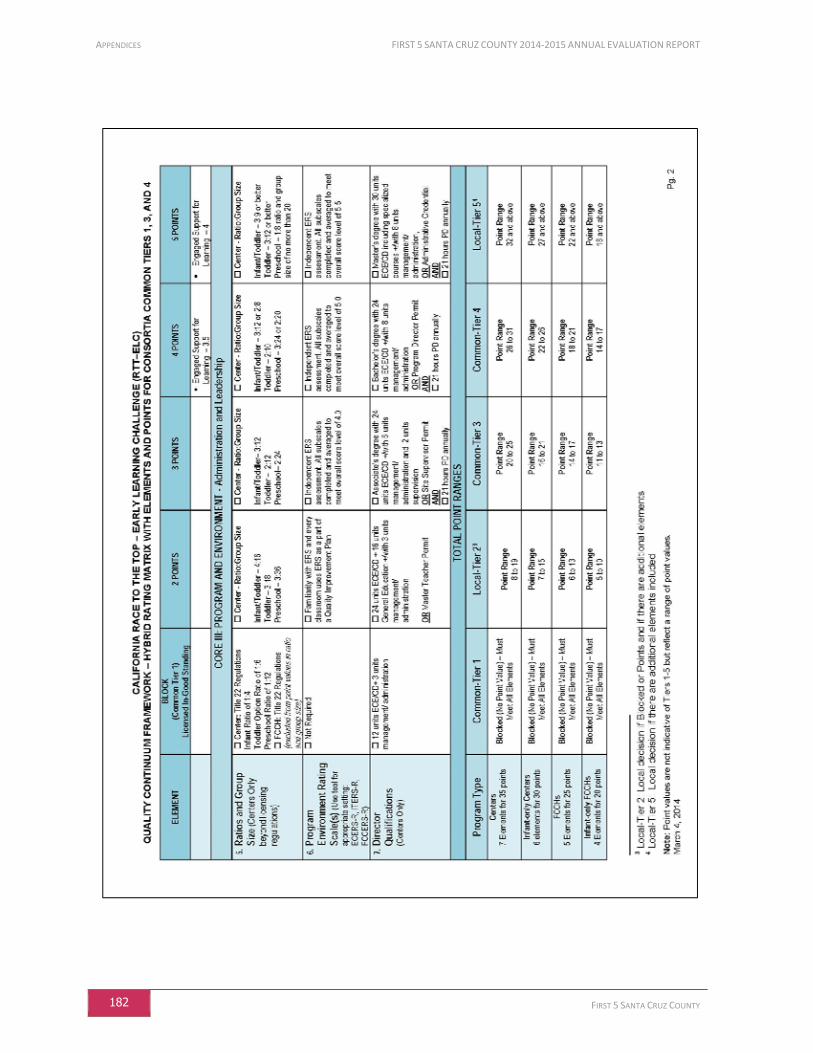
APPENDICES FIRST 5 SANTA CRUZ COUNTY 2014-2015 ANNUAL EVALUATION REPORT
182 FIRST 5 SANTA CRUZ COUNTY
FIRST 5 SANTA CRUZ COUNTY 2014-2015 ANNUAL EVALUATION REPORT APPENDICES
FIRST 5 SANTA CRUZ COUNTY 183
Appendix C: Measurement Tools
The following assessments and measurement tools were used to collect evaluation data during this
funding cycle. They are listed in alphabetical order.
Acrimony Scale
The Acrimony Scale (Emery, 1982) is utilized by Triple P clients who participate in the Level 5
– Family Transitions program. This scale measures co-parental conflict between separated or
divorced parents. Scores are calculated as the average of all questions, and can range from 1
(low acrimony) to 4 (high acrimony).
Ages & Stages Questionnaires (ASQ)
The Ages & Stages Questionnaires® (ASQ) are used to screen infants and young children for
developmental delays during the crucial first five years of life. Parents complete the 30-item
age-appropriate questionnaires at designated intervals, assessing children in their natural
environments to ensure valid results. Each questionnaire covers five key developmental
areas: communication, gross motor, fine motor, problem solving, and personal-social.33
Bayley Scales of Infant and Toddler Development, 3rd Edition
The Bayley Scales of Infant and Toddler Development is a standardized test that is used by the
Stanford Neurodevelopmental Foster Care Clinic (“SNDFCC”) to assess children’s
developmental skills in the areas of cognition, language, and motor skills. There are also
additional measures of adaptive skills and emotional functioning. The instrument is used for
children from ages 16 days to 42 months. Standard scores have a mean of 100 and standard
deviation of 15.
Child and Adolescent Needs and Strengths (CANS)
The Child and Adolescent Needs and Strengths (CANS) is used by the Side-by-Side program,
and is a document that organizes clinical information collected during a behavioral health
assessment in a consistent manner to improve communication among those involved in
planning care for a child or adolescent. The CANS is also used as a decision-support tool to
guide care planning, and to track changing strengths and needs over time. The following
areas are addressed in the instrument: life functioning, behavioral/emotional needs, risk
factors and behaviors, caregiver resources and needs, acculturation, transition to adulthood,
and child strengths. The CANS is an item-level tool; each domain is scored on a 4-point scale
(0-3), and there is no total score.
33
Brookes Publishing, Ages & Stages Questionnaires® (ASQ), http://www.brookespublishing.com/store/books/bricker-asq/, 2007.
APPENDICES FIRST 5 SANTA CRUZ COUNTY 2014-2015 ANNUAL EVALUATION REPORT
184 FIRST 5 SANTA CRUZ COUNTY
Child/Home Early Language and Literacy Observation Tool (CHELLO)
Child/Home Early Language and Literacy Observation (CHELLO) is a tool designed to rate the
early literacy environment in home-based child care settings of children ages birth to 5 years.
The CHELLO is used to develop accurate profiles of materials and practices in family/group
child care settings, improve early childhood educator literacy supports and interactions with
children, and measure changes in the quality of environments over time.
The CHELLO tool is used by the Early Literacy Foundations, and assesses home-based
classrooms using the Literacy Environment Checklist, and along the three dimensions of the
Group/Family Observation section: Physical Environment for Learning, Support for Learning,
and Adult Teaching Strategies.
Child Behavior Checklist (CBCL)
The Child Behavior Checklist (CBCL; Achenbach, 1991; 2001) is part of the Achenbach System
of Empirically Based Assessment. The CBCL is a screening tool which is used by parents (and
in mental health settings) to assess behavioral and emotional problems in children and
adolescents (this is only completed if the child is aged 18 months or older).
The Child Behavior Checklist (CBCL) contains about 100 items that can cluster into several
syndromes, competence scales, and codes from the Diagnostic and Statistical Manual of
Mental Disorders, 4th Edition (DSM-IV). Children are ranked according to the severity of
behavior, thus percentile rankings tell us how a child, or group of children, compare to the
general population. Higher percentile rank indicates more problematic behavior. Rankings
falling between the 65th and 70th percentile indicate “Borderline Clinical”; the 70th
percentile rank and above denote the clinical range. Clients who score at or near the clinical
range are more likely to have or develop a clinical diagnosis. Thus, the CBCL serves as an
indicator of clinical risk based on the degree of similarity with other children who have
received (or have not received) a diagnoses. A significant drop in percentile rank indicates a
decrease in clinical risk.
The CBCL has good psychometric properties and has been validated internationally. This tool
is helpful in determining children who might benefit from additional assessment and mental
health services.
Classroom Assessment Scoring System™ (CLASS™)
The Classroom Assessment Scoring System™ (CLASS™) is an observational instrument used by
the Quality Early Learning Initiative to assess classroom quality in Pre-K classrooms. The
CLASS™ instrument measures teacher-student interactions in a classroom setting and offers
resources for strengthening those interactions across any subject area or age group. It
includes four cycles of 15-minute observations of teachers and students by a certified
CLASS™ observer. Those observations are then rated using a manual of behaviors and
responses.

FIRST 5 SANTA CRUZ COUNTY 2014-2015 ANNUAL EVALUATION REPORT APPENDICES
FIRST 5 SANTA CRUZ COUNTY 185
Conflict Behavior Questionnaire (CBQ) The Conflict Behavior Questionnaire (Robin & Foster, 1989) is utilized by clients participating in
the Teen variant of Levels 4 and 5 of the Triple P Program. It is a 20-item true/false scale that
assesses general conflict between parents and their children. The CBQ is completed by both
parents and adolescents, and discriminates between distressed and non-distressed families.
This 20-item measure contains both “positive” and “negative” statements regarding a child’s
social competence/conflictual behaviors. Clients answer each question by responding with
“true” or “false.” To obtain an overall measure of social competence, distressed responses
are given the value of 1, while non-distressed responses are given the value of 0. Then all 20
items are summed to obtain an overall score and measure of conflictual behaviors, with
scores ranging from 0 (non-distressed) to 20 (distressed). A non-zero score indicates some
conflictual behaviors; a high score indicates a great amount of conflict.
Depression, Anxiety, and Stress Scale (DASS-21) The Depression, Anxiety, and Stress Scale – Short Version (DASS-21) is utilized by participants
in Levels 4 and 5 of the Triple P Program. It is a 21-item brief version of the Depression
Anxiety Stress Scales (Lovibond & Lovibond in 1995). It is a self-report measure used to assess
the levels of depression, anxiety, and tension/stress experienced, which is completed by
parents in the program. Respondents indicate how much they felt each of the 21 symptoms
during the previous week. The scale is psychometrically sound – it has good convergent and
discriminant validity. It also has high internal consistency in clinical and non-clinical samples,
and across different ethnic groups.
Desired Results Developmental Profile (DRDP) The Desired Results Development Profile was created as a comprehensive program evaluation
system designed to measure California Department of Education funded child development
program effectiveness. Desired Results reflect the positive effects of the state-funded child
development system on the development and functioning of children and on the self-
sufficiency and functioning of families34. The DRDP is an observation-based assessment and is
organized into several domains, each representing a crucial area of learning and
development. Each domain contains several measures, which focus on a specific competency
within that domain.
There are three DRDP assessment instruments: infant/toddler (birth to 36 months),
preschool (three years to kindergarten entry), and school-age (kindergarten through 12
years); one of these assessments was used by a First 5 partner:
Desired Results Developmental Profile – Infant/Toddler (2010)
The DRDP – Infant/Toddler (2010) is used for children ages birth to 36 months, and measures
five domains. The Starlight Children’s Center chose to assess the infants and toddlers
34
California Department of Education. (2009). Introduction to Desired Results. Retrieved from http://www.cde.ca.gov/sp/cd/ci/desiredresults.asp
APPENDICES FIRST 5 SANTA CRUZ COUNTY 2014-2015 ANNUAL EVALUATION REPORT
186 FIRST 5 SANTA CRUZ COUNTY
participating in their program in two domains, using a total of eight measures. In the Self and
Social Development domain, two measures are used to assess interactions and relationships
with adults. In the Language and Literacy Development domain, six measures are used to
assess language comprehension, communication skills, interest in literacy, and recognition of
symbols.
Early Language and Literacy Classroom Observation Pre-K Tool (ELLCO Pre-K)
The first version of the ELLCO (ELLCO Toolkit) was designed to evaluate the teaching practices
of early childhood educators in the areas of language and literacy, in pre-kindergarten to
third-grade classrooms.35 The newest version of the tool (ELLCO Pre-K) is comparable to the
ELLCO Toolkit, and has been reorganized so that it reduces the bias towards classrooms that
have a lot of resources, and focuses more on the use of materials rather than just their
presence in the preschool classrooms.36
The ELLCO Pre-K is used by the Early Literacy Foundations to help identify the effectiveness of
classroom teaching on children’s language and literacy development by focusing on five
components: “Classroom Structure,” “Curriculum,” “Language Environment,” “Books and
Book Reading,” and “Print and Early Writing.” Items are scored along a 5 point scale, where 1
is deficient and 5 is exemplary. From this scale, early childhood educators’ classroom scores
can be categorized into three levels of support for language and literacy, indicating their
classroom environment provides either Low-Quality Support (with means less than or equal
to 2.5), Basic Support (with means between 2.51 and 3.5), or High-Quality Support (with
means between 3.51 and 5).
Eyberg Child Behavior Inventory Intensity Scale (ECBI)
The Eyberg Child Behavior Inventory Intensity Scale (ECBI; Eyberg & Pincus, 1999) is utilized
by participants in Levels 4 and 5 of the Triple P Program (this is only completed if the parent
has at least one child aged 18 months or older). The ECBI is a 36-item parent report measure
of behavior problems among children. Parents indicate the frequency of common behavior
problems, such as wetting the bed, whining, or having temper tantrums. Parents indicate
how frequently each of the problem behaviors occur (from never to always) and whether or
not they feel that the behavior is a problem (yes or no). The ECBI has good psychometric
properties (reliability and validity). The ECBI is useful in determining children who may have a
diagnosable disruptive behavior disorder, as well as for helping intervene to reduce early
behavior problems and to reduce negative parent-child interactions that may contribute to
the development of disruptive behavior problems.37
35
Education Development Center, Inc., Center for Children and Families, Early Language and Literacy Classroom Observation Toolkit, 2002. 36
Review by Maria Cahill (University of Tennessee), of the User’s Guide to the Early Language & Literacy Classroom Observation Pre-K Tool, Education Book Review website.
37 Berkovits, M. D., O’Brien, K. A., Carter, C. G., & Eyberg, S. M. (2010). Early identification and intervention for behavior problems in
primary care: A comparison of two abbreviated versions of parent-child interaction therapy. Behavior Therapy, 41, 375 – 387.
FIRST 5 SANTA CRUZ COUNTY 2014-2015 ANNUAL EVALUATION REPORT APPENDICES
FIRST 5 SANTA CRUZ COUNTY 187
First 5 Apricot Database
On a biannual basis, funded partners are required to submit information on the program
participants who they directly served, and also on the status of their programs’ outcome
objectives. Client Characteristic Data (CCDs) and outcome data are gathered in one of three
ways, First 5’s Apricot database, customized Excel forms, or partner-specific data collection
forms.38
o First 5’s online database, originally called Santa Cruz County Services Unifying Network
(SCC SUN), was launched on January 1, 2004, and many partner agencies used this
database to record their clients’ data and other outcome data. The database is integrated,
meaning that information can be shared between agencies, if the appropriate consent is
obtained. Demographic information about these clients can then be extracted for analysis,
using unique IDs that maintained clients’ anonymity. In April 2015 this database was
upgraded to a more flexible and efficient database called Apricot, all previous data in SCC
SUN were migrated to this new database, and all current data are now being collected and
reported using Apricot.
o Partner agencies not using First 5’s Apricot database collect and submit demographic and
outcome data either using customized Excel forms developed by First 5, or in partner-
specific data collection forms.
In the course of evaluating CCDs, a “cleaning” process is performed. In this process, each
program’s data are standardized to use the same response sets, reviewed for accuracy and
completeness, and corrected wherever possible. These data are then migrated to a
customized statistical database that aggregates them and determines the unduplicated count
of individuals served by goal area, partner agency, and overall. Each client characteristic is
analyzed, with results that report the total number of individuals with data for that variable,
and the frequency and percentage of each response to that variable.
o Children’s ages are determined in these ways:
For all partners except Triple P, children’s ages are calculated as of the first day of the funding cycle. This enables all children ages 0-5 to be included in the analyses, even if they turn six years old later in the fiscal year. Children not yet born by the first day of the funding cycle (i.e., born later in the funding cycle) are also included in the analyses and categorized as being under one year of age.
For Triple P children, their ages are calculated as of the date of their parent’s first assessments (“Pre-assessments”), or the date of their single program session. This date is chosen since many Triple P assessments require that the child be within a certain age range for the parent to complete it. Therefore, this more exact determination of the child’s age as of the date of the assessment is needed in order to identify whether or not it is appropriate to include those data in the analysis of that assessment.
38
In this report, client characteristic data (CCDs) collected via all approved methods—which are then combined and comprehensively analyzed—are collectively referred to as “First 5 CCD database.”
APPENDICES FIRST 5 SANTA CRUZ COUNTY 2014-2015 ANNUAL EVALUATION REPORT
188 FIRST 5 SANTA CRUZ COUNTY
o The cities where clients live are organized into the following sub-county areas:
SUB-COUNTY AREA CITIES
North County Bonny Doon, Capitola, Davenport, Live Oak, Santa Cruz, Scotts Valley, Soquel
South County Aptos, Corralitos, Freedom, La Selva Beach, Seacliff, Watsonville
San Lorenzo Valley Ben Lomond, Boulder Creek, Brookdale, Felton, Mount Hermon
Formative Assessment System for Teachers (FAST)
Early childhood educators trained in the SEEDS of Early Literacy curriculum assess children’s
pre-literacy skills in three skill areas of Picture Naming, Rhyming, Alliteration (see Individual
Growth and Development Indicators), and also in the two skill areas of Letter Naming and
Letter Sounds, as measured by the Formative Assessment System for Teachers (FAST) literacy
assessment.
Along with the IGDIs assessment, the FAST literacy assessment is administered three times a
year and is used to help measure children’s progress in these key pre-literacy skill areas.
Healthcare Effectiveness Data and Information Set (HEDIS) Indicators
First 5 uses the Healthcare Effectiveness Data and Information Set (HEDIS) data to track the
quality of care that children enrolled in Healthy Kids are receiving in Santa Cruz County.
Selected health care quality indicators are requested annually by First 5 California and the
California Endowment from every operating Healthy Kids insurance plan based on data
entered into HEDIS. HEDIS is a “set of standardized performance measures designed to
ensure that purchasers and consumers have the information they need to reliably compare
the performance of managed health care plans.”39
Individual Growth and Development Indicators (IGDIs)
Early childhood educators in trained in the SEEDS of Early Literacy curriculum assess
children’s pre-literacy skills in the three areas measured by the Individual Growth and
Development Indicators (IGDIs) assessment tool (Picture Naming, Rhyming, Alliteration), and
also in the two skill areas of Letter Naming and Letter Sounds (see Formative Assessment
System for Teachers).
Individual Growth and Development Indicators (IGDIs) are a set of measures designed and
validated for use by early education professionals for the purpose of monitoring children’s
growth and progress in early reading predictors. Unlike standardized tests that are
administered infrequently, IGDIs is designed to be used repeatedly by early childhood
educators in order to estimate each child’s “rate of growth” over time. The distinctive benefit
of this approach is that the information can be used to directly inform intervention design,
implementation, and modification at reasonable levels of training, time, and cost. The tools
39
National Committee for Quality Assurance (NCQA), Guidelines for Advertising, Retrieved from http://www.ncqa.org/, 2012.

FIRST 5 SANTA CRUZ COUNTY 2014-2015 ANNUAL EVALUATION REPORT APPENDICES
FIRST 5 SANTA CRUZ COUNTY 189
provide helpful information about children’s growth in three key areas of reading predictors:
Picture Naming (a measure of vocabulary development), Rhyming, and Alliteration.
Beginning in 2012-13, there was a change in the method used for determining each child’s
primary language, which is now directly noted by the teacher. Children noted as bilingual
(English/Spanish) are included in the “Primarily English-Speaking” analyses. Although the
previous method of determining primary language was highly accurate, this new method was
introduced to ensure complete precision.
Only children ages 4 and 5 are included in these IGDIs analyses,40 in order to focus on
children who are at a similar developmental age just before entering kindergarten.
Additionally, the companion assessment given along with the IGDIs assessment (the
Formative Assessment System for Teachers) is not designed for children younger than 4,
which provides a framework for focusing on children ages 4 and 5. This focus on children
ages 4 and 5 began in 2013-14, and IGIDs and FAST data for all previous years have been
adjusted accordingly.
Migrant Education Even Start (MEES) Pre-K Letter Sound Identification
Children attending the PVUSD-Migrant Education Summer Pre-K Academy are assessed using
the Pre-K Letter Sound Identification tool, which is used to assess letter sound recognition in
the child’s primary language. The MEES tool is a pre- and post-program survey that allows
early childhood educators to circle those letters for which the child can say the sound (not
the name of the letter). Changes in children’s outcomes are evaluated by comparing the
scores between their baseline and final assessments.
New Portage Guide: Birth to Six
The New Portage Guide: Birth to Six is a developmental assessment tool based on direct
observations of typical milestone skills in five domain areas, rated as either: No/Not
observed, Occasionally/Emerging Skill area, or Consistently/Mastered. “Mastery” of an
indicator means that the child consistently demonstrates the skill in a variety of settings.
Assessments are completed three times a year for each child to document their growth and
development, measure progress and plan individualized activities.
Parent Problem Checklist
The Parent Problem Checklist (PPC; Dadds & Powell, 1991) is utilized by Levels 4 and 5 of the
Triple P Program. It is a 36-item self-assessment measure of parental and relationship
conflict, completed by each parent (or each adult who is co-parenting the child). For each
issue (e.g., disagreement over household rules), parents identify if the issue has been a
problem (yes or no), and the extent to which the issue has been a problem, from not at all, to
40
To be included in these analyses, children had to be at least 4 years old as of October 1st of that fiscal year, which was the time of the 1
st
benchmark assessment.

APPENDICES FIRST 5 SANTA CRUZ COUNTY 2014-2015 ANNUAL EVALUATION REPORT
190 FIRST 5 SANTA CRUZ COUNTY
very much. It has been shown to have high internal consistency, test-retest reliability, and
convergent validity.
In 2012, two questions from the Parenting Experience Survey (PES) were added to the end of
this assessment that asked additional questions about the parent’s relationship with the co-
parenting adult, allowing a more robust analysis of Triple P participants’ relationship issues.
Parenting Experience Survey
The Parenting Experience Survey (Sanders et. al., 1999) is utilized by Level 3 of the Triple P
Program. It is a self-report measure of issues related to being a parent, and is completed by
parent participants. It consists of 7 items and assesses parents’ experiences related to issues
such as how difficult they perceive their child to be, how stressful they feel parenting to be,
and how rewarding they feel parenting to be. There are 3 items which are specific to parents
who have a partner. Those items are used to assess agreement on discipline, partner
support, and relationship happiness. This survey has been used to show changes in parental
attitudes and behaviors from the beginning to the completion of the Triple P Program.
Parenting Scale
The Parenting Scale (Arnold, O’Leary, Wolff & Acker, 1993) is utilized by clients in Levels 4
and 5 of the Triple P Program, as part of the general “Core” variant of program (this is only
completed if the parent has at least one child aged 18 months or older). It is a measure of
parenting styles for handling child misbehavior, completed by parents. It consists of 30 items,
which are grouped into 3 factors: laxness, over-reactivity, and hostility (some items are not
part of any factor, and are called “No Factor” items). Clinical cut-off scores have been
evaluated for all three factors and the overall score, which determine whether a client is at a
level of clinical concern in those areas. The Parenting Scale has good test-retest reliability,
discriminant validity, and correlates with other self-report measures of child behavior,
marital discord, and child behavior.
For clients who are participating in the “Teen” variant of the Triple P Program, there is a
“Teen” version of the scale that consists of 13 items that are grouped into 2 factors: laxness
and over-reactivity (one item is not part of any factor, and is called a “No Factor” item). All of
the questions in this Teen variant of the scale are also part of the scale used in the Core
variant. Unlike the Core version, however, no clinical cut-off scores have yet been evaluated
by the developers of this tool, for either of the two Teen factors or for the Teen overall score.
In 2012, modifications were made by First 5 Santa Cruz County to the Core Parenting Scale to
accommodate the launching of the “Teen” variant of the Triple P program. This modified
scale incorporates all of the “Teen” items, and all of the “Core” items that constitute one of
the 3 factors. Core items that were not part of any factor (“No Factor” items) were omitted.
Because all of the Teen items were also part of the original Core scale, these changes
reduced the total number of items in the modified scale from 30 to 17. This one modified
FIRST 5 SANTA CRUZ COUNTY 2014-2015 ANNUAL EVALUATION REPORT APPENDICES
FIRST 5 SANTA CRUZ COUNTY 191
scale is designed to be filled out by clients in both the Teen and Core variants, and the
appropriate items are used to calculate the factors and overall scores specific to that variant.
The impact of these modifications on the original Core version is minimal, with all three Core
factors still containing the same items, and all factors using the same clinical cut-off scores.
However, the Core overall score is calculated differently since many of the “No Factor” items
were omitted. Therefore, the clinical cut-off score for the Core overall score is no longer
appropriate, and caution should be used when comparing the Core overall score to previous
years’ overall scores.
Parent’s Attribution for Child’s Behavior Measure
The Parent’s Attribution for Child’s Behavior Measure (Pigeon & Sanders, 2004) is utilized by
Level 5 Pathways of the Triple P Program (this is only completed if the parent has at least one
child aged 18 months or older). It is a self-report measure of attributions for children’s
behaviors. The instrument consists of 6 hypothetical situations describing different types of
difficult child behavior, with 4 questions related to each situation. The questions for each
situation relate to innateness of the child’s behavior, the child’s intentionality, and the
blameworthiness of the child. The total score and the 3 subscale scores for this tool have
good internal consistency and discriminant validity.
Structured Decision Making (SDM)
The Structured Decision Making (SDM) model is a set of assessments for guiding decision-
making at each of the decision points for children in Families Together. One assessment is the
SDM Family Prevention Services Screening Tool (FPSST), used to make two decisions:
whether or not to offer voluntary prevention services and, if so, the frequency of ongoing
case manager contact. The screening tool identifies families who have low, moderate, high,
or very high probabilities of future abuse or neglect. The risk level identifies the degree of risk
of future maltreatment, guides the decision to offer voluntary prevention services, and helps
determine the frequency of case manager contact.
The SDM:FPSST is also used to reassess a family in order to make two decisions: whether or
not to continue voluntary prevention services past 12 months for these families receiving
intensive services, and past 3 months for those receiving a brief intervention and, if so, the
frequency of case manager contact.41
Triple P Satisfaction Survey
Multiple Sessions (Individual or Group)
The Multiple Sessions Satisfaction Survey is utilized by parents who complete
Levels 3 (Individual /Brief Group), 4, or 5 of the Triple P Program. It consists of 16 items:
13 closed-ended items and 3 open-ended items. Parents assess many different dimensions of
41
Children’s Research Center, Structured Decision Making Policy and Procedure Manual, 2006.
APPENDICES FIRST 5 SANTA CRUZ COUNTY 2014-2015 ANNUAL EVALUATION REPORT
192 FIRST 5 SANTA CRUZ COUNTY
the program including: the quality of the program, the extent to which the program met their
needs and their child’s needs, how much the program helped parents deal with problems in
their family or with their children, relationship improvement, child behavior improvement,
and overall satisfaction. Participants also have the option of providing their email address if
they are interested in receiving the Triple P newsletter.
Single Sessions (Seminars & Workshops)
The Single Session Satisfaction Survey is utilized by parents who participate in Level 2
Seminars and Level 3 Workshops of the Triple P Program. It consists of 4 items: 3 closed-
ended questions, and 1 open-ended question. Participants fill out this short survey which
assesses if they felt that the Seminar or Workshop addressed their questions, whether they
are going to use any of the parenting strategies they learned, and if they are satisfied, overall,
with the Seminar or Workshop. Participants can also add any additional comments they have.
Late in fiscal year 2011-12 an additional question was added that asked participants how
they first heard about the program, and beginning in 2012-13 participants had the option of
providing their email address if they were interested in receiving the Triple P newsletter.
Wechsler Preschool and Primary Scales of Intelligence, 4th edition (WPPSI-IV)
The WPPSI IV is used by the Stanford Neurodevelopmental Foster Care Clinic (“SNDFCC”), and
is an individually administered test designed to reflect the cognitive functioning of young
children, with two bands available: one for children ranging in age from 2 years, 6 months to
3 years, 11 months, and another for children ranging in age from 4 years to 7 years, 7 months
(to accommodate the substantial changes in cognitive development that occur during early
childhood). The test yields three levels of interpretation: Full Scale, Primary Index scale, and
Ancillary Index scale levels. A full scale composite IQ is also calculated. Standard scores have
a mean of 100 and standard deviation of 15.