Annual Disaster Statistical Review 2014 - Centre for ... · Annual Disaster Statistical Review 2014...
54
Annual Disaster Statistical Review 2014 The numbers and trends Debarati Guha-Sapir, Philippe Hoyois and Regina Below Centre for Research on the Epidemiology of Disasters (CRED)
-
Upload
nguyenkhanh -
Category
Documents
-
view
215 -
download
0
Transcript of Annual Disaster Statistical Review 2014 - Centre for ... · Annual Disaster Statistical Review 2014...
Annual Disaster Statistical Review 2014
The numbers and trends
Debarati Guha-Sapir, Philippe Hoyois and Regina Below
Centre for Research on
the Epidemiology of
Disasters (CRED)

Annual Disaster Statistical Review 2014
The numbers and trends
Debarati Guha-Sapir
Philippe Hoyois and
Regina Below
Centre for Research on the Epidemiology of Disasters (CRED) Institute of Health and Society (IRSS)
Université catholique de Louvain – Brussels, Belgium
ii Annual Disaster Statistical Review 2014 – The numbers and trends
Acknowledgements The data upon which this report is based on, is maintained through the long-term support of the US Agency for International Development’s Office of Foreign Disaster Assistance (USAID/OFDA). We are grateful to Pascaline Wallemacq for designing the graphs and maps and for proofreading. We encourage the free use of the contents of this report with appropriate and full citation: “Guha-Sapir D, Hoyois Ph. , Below. R. Annual Disaster Statistical Review 2014: The Numbers and Trends. Brussels: CRED; 2015.” This document is available on http://www.cred.be/sites/default/files/ADSR_2014.pdf Printed by: Ciaco Imprimerie, Louvain-la-Neuve (Belgium) This publication is printed in an environmentally - friendly manner. September 2015
Annual Disaster Statistical Review 2014 – The numbers and trends iii
About CRED
The Centre for Research on the Epidemiology of Disasters (CRED) has been active for more than 40 years in the fields of: international disaster and conflict health studies, research and training activities linking relief, rehabilitation, and development. It was established in Brussels in 1973 at the School of Public Health of the Catholic University of Louvain (UCL) as a non-profit institution with international status under Belgian law. In 1980, CRED became a World Health Organization (WHO) collaborating centre as part of WHO’s Global Program for Emergency Preparedness and Response. Since then, CRED has increased its international network substantially and collaborates closely with numerous UN agencies, inter-governmental and governmental institutions, non–governmental organizations, research institutes and universities.
Objective
The Centre promotes research and provides an evidence base to the international community on the burden of disease and related health issues due to disasters and conflicts, in order to improve preparedness and responses to these humanitarian emergencies. CRED trains field managers, students, relief personnel and health professionals in the management of short and long-term humanitarian emergencies.
CRED’s focus
CRED’s research focuses on all humanitarian and emergency situations with a major impact on human health. These include all types of natural and human-made disasters, such as earthquakes, floods and storms; longer-term disasters such as famines and droughts; and situations creating mass displacement of people such as civil strife and conflicts.
The Centre focuses on health aspects and the burden of disease arising from disasters and complex emergencies. CRED also promotes research on broader aspects of humanitarian crises, such as human rights and humanitarian law, socio-economic and environmental issues, early warning systems, the special needs of women and children, and mental health care.
The Centre is actively involved in stimulating debate on the effectiveness of various humanitarian interventions. It encourages scientific and policy discussions on existing and potential interventions and their impacts on acute and chronic malnutrition, human survival, morbidity, infectious diseases and mental health.
The CRED team works in four main areas:
Natural disasters and their impacts
Civil strife and conflict epidemiology
Database and information support
Capacity building and training
The CRED team
The Centre is composed of a multinational and multidisciplinary team that includes experts in medicine and public health, informatics and database management, psychology, nutritional sciences, sociology, economics and geography. The working languages are English and French.

iv Annual Disaster Statistical Review 2014 – The numbers and trends
Annual Disaster Statistical Review 2014 – The numbers and trends v
Table of Contents Executive Summary 1 CHAPTER 1 1 About EM-DAT: The International Disaster Database 5
1.1 What is EM-DAT? 7 1.2 Database classification, definitions, criteria and content 7 1.3 Methodology 9
CHAPTER 2 2 What did 2014 bring? 11 CHAPTER 3 3 How different was 2014? 19 CHAPTER 4 4 Regional analysis 25
4.1. Africa 28 4.2. Americas 29 4.3. Asia 30 4.4. Europe 31 4.5 Oceania 32
ANNEX 1: Definitions 37 ANNEX 2: List of countries per continent 41
vi Annual Disaster Statistical Review 2014 – The numbers and trends
List of Figures, Maps and Tables Figures
Figure 1: Trends in occurrence and victims 3 Figure 2: Top 10 countries by number of reported events in 2014 15 Figure 3: Top 10 countries in terms of disaster mortality in 2014
and distributed by disaster type 16 Figure 4: Top 10 countries by victims in 2014 and distributed by
disaster type 16 Figure 5: Top 10 countries by damages in 2014 and distributed by
disaster type 17 Figure 6: Natural disaster impacts by disaster sub-group:
2014 versus 2004-2013 annual average 22
Maps
Map 1: Percent share of reported occurrence by disaster sub-group and continent in 2014 34
Map 2: Percent share of reported victims by disaster sub-group
and continent in 2014 34 Map 3: Percent share of reported economic damages by disaster sub-group
and continent in 2014 35
Tables
Table 1: Top 10 natural disasters by number of deaths 17 Table 2: Top 10 natural disasters by number of victims 18 Table 3: Top 10 natural disasters by economic damages 18 Table 4: Natural disaster occurrence and impacts: regional figures 27
Annual Disaster Statistical Review 2014 – The numbers and trends 1
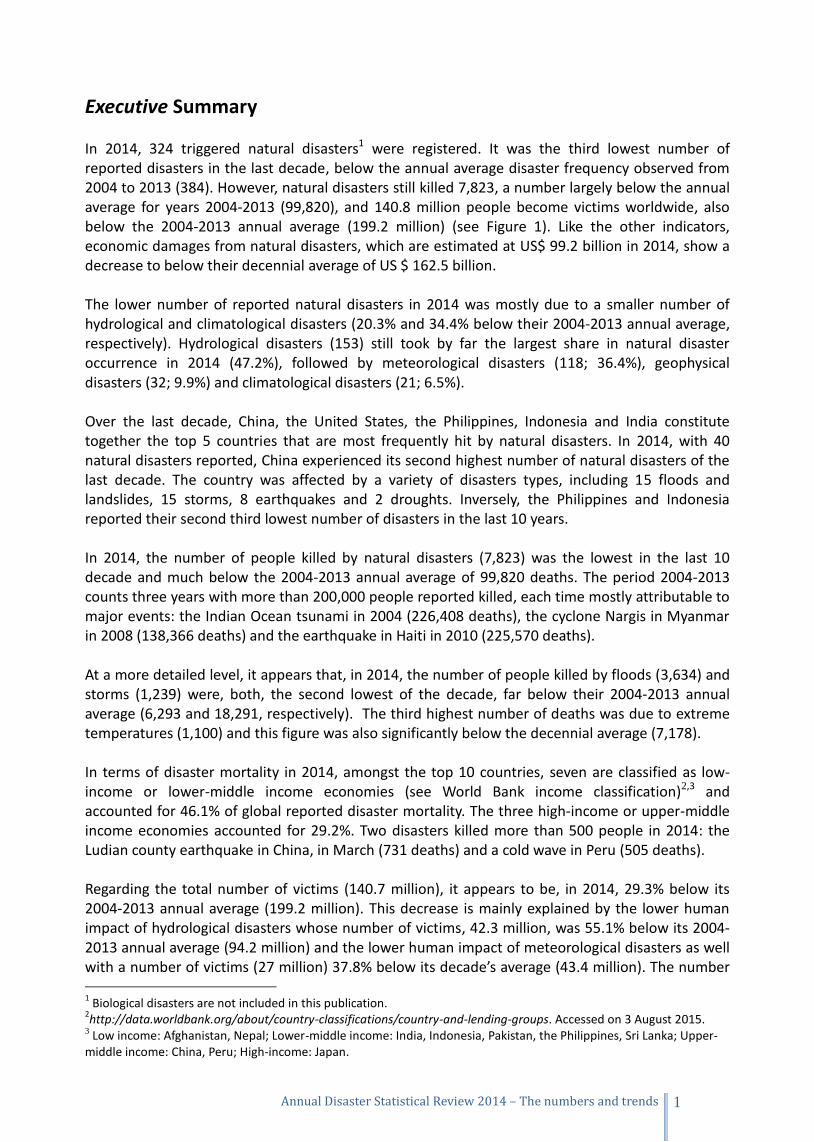
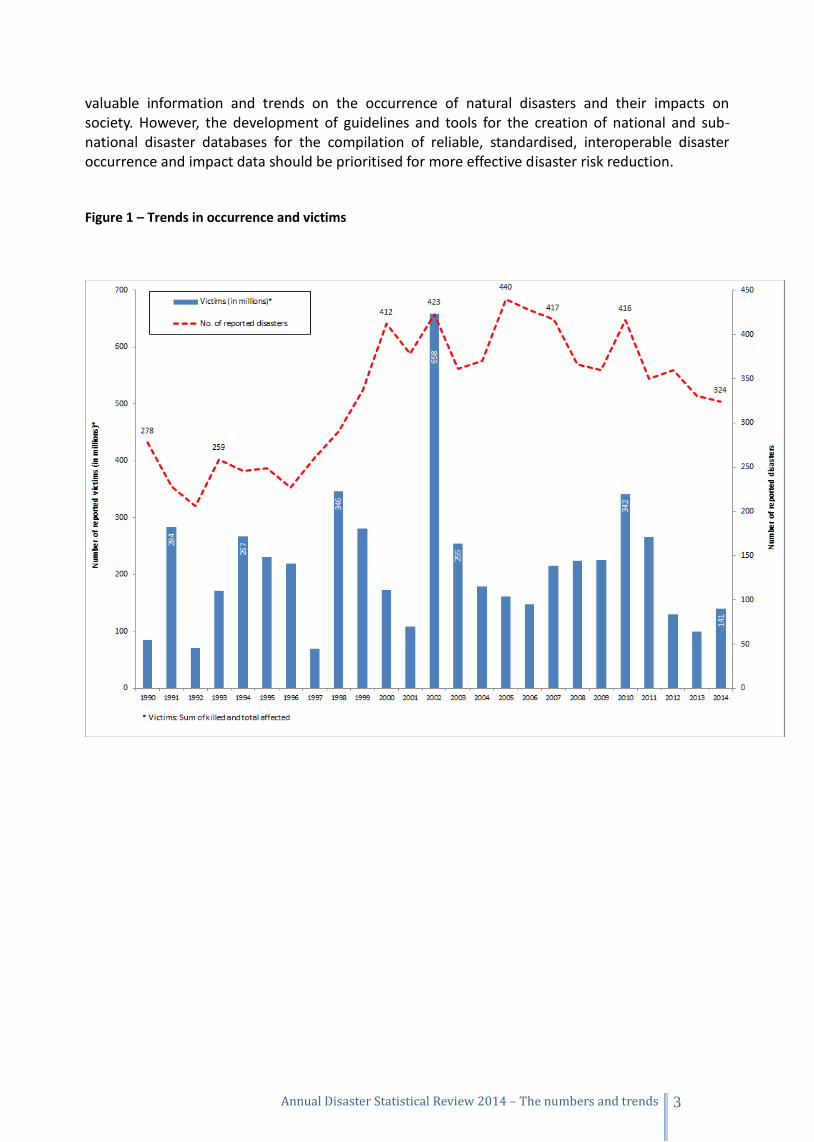
Executive Summary In 2014, 324 triggered natural disasters1 were registered. It was the third lowest number of reported disasters in the last decade, below the annual average disaster frequency observed from 2004 to 2013 (384). However, natural disasters still killed 7,823, a number largely below the annual average for years 2004-2013 (99,820), and 140.8 million people become victims worldwide, also below the 2004-2013 annual average (199.2 million) (see Figure 1). Like the other indicators, economic damages from natural disasters, which are estimated at US$ 99.2 billion in 2014, show a decrease to below their decennial average of US $ 162.5 billion. The lower number of reported natural disasters in 2014 was mostly due to a smaller number of hydrological and climatological disasters (20.3% and 34.4% below their 2004-2013 annual average, respectively). Hydrological disasters (153) still took by far the largest share in natural disaster occurrence in 2014 (47.2%), followed by meteorological disasters (118; 36.4%), geophysical disasters (32; 9.9%) and climatological disasters (21; 6.5%). Over the last decade, China, the United States, the Philippines, Indonesia and India constitute together the top 5 countries that are most frequently hit by natural disasters. In 2014, with 40 natural disasters reported, China experienced its second highest number of natural disasters of the last decade. The country was affected by a variety of disasters types, including 15 floods and landslides, 15 storms, 8 earthquakes and 2 droughts. Inversely, the Philippines and Indonesia reported their second third lowest number of disasters in the last 10 years. In 2014, the number of people killed by natural disasters (7,823) was the lowest in the last 10 decade and much below the 2004-2013 annual average of 99,820 deaths. The period 2004-2013 counts three years with more than 200,000 people reported killed, each time mostly attributable to major events: the Indian Ocean tsunami in 2004 (226,408 deaths), the cyclone Nargis in Myanmar in 2008 (138,366 deaths) and the earthquake in Haiti in 2010 (225,570 deaths). At a more detailed level, it appears that, in 2014, the number of people killed by floods (3,634) and storms (1,239) were, both, the second lowest of the decade, far below their 2004-2013 annual average (6,293 and 18,291, respectively). The third highest number of deaths was due to extreme temperatures (1,100) and this figure was also significantly below the decennial average (7,178). In terms of disaster mortality in 2014, amongst the top 10 countries, seven are classified as low-income or lower-middle income economies (see World Bank income classification)2,3 and accounted for 46.1% of global reported disaster mortality. The three high-income or upper-middle income economies accounted for 29.2%. Two disasters killed more than 500 people in 2014: the Ludian county earthquake in China, in March (731 deaths) and a cold wave in Peru (505 deaths). Regarding the total number of victims (140.7 million), it appears to be, in 2014, 29.3% below its 2004-2013 annual average (199.2 million). This decrease is mainly explained by the lower human impact of hydrological disasters whose number of victims, 42.3 million, was 55.1% below its 2004-2013 annual average (94.2 million) and the lower human impact of meteorological disasters as well with a number of victims (27 million) 37.8% below its decade’s average (43.4 million). The number 1 Biological disasters are not included in this publication.
2http://data.worldbank.org/about/country-classifications/country-and-lending-groups. Accessed on 3 August 2015.
3 Low income: Afghanistan, Nepal; Lower-middle income: India, Indonesia, Pakistan, the Philippines, Sri Lanka; Upper-middle income: China, Peru; High-income: Japan.
2 Annual Disaster Statistical Review 2014 – The numbers and trends
of victims of geophysical disasters (3.4 million) also decreased strongly, being 60.1% below its annual 2004-2013 average (8.6 million). Conversely, the number of victims from climatological disasters (68.1 million) was, in 2014, 28.3% above its 2004-2013 average (53 million) but this increase isn’t important enough to compensate the lowering in the numbers of victims of others disaster types. Two droughts in China (27.5 million victims) and in Brazil (27 million victims), one flood in China (15 million victims) and the typhoon Rammasun in China and the Philippines (9.9 and 4.7 million victims, respectively) made almost 60% of the total number of victims. Eighteen other disasters (8 floods, 5 droughts, 3 storms, 1 earthquake and 1 episode of extreme temperature) had severe human impacts ranging from 1 to 5 million victims. The estimated economic losses from natural disasters in 2014 (US$ 99.2 billion) was the fourth lowest since 2004 and 39 % below the annual 2004-2013 damages average (US$ 162.5 billion). The lowering in the amounts of damages came from geophysical (US$ 7.4 billion; -85.3% compared to the 2004-2013 average) and meteorological disasters (US$ 43.1 billion; -41.3% compared to the 2004-2013 average). Conversely, damages from hydrological disasters (US$ 37.4 billion) were, in 2014, 19.4 % above their 2004-2013 annual average, while damages from climatological disasters (US$ 11.3 billion) were 48.8% above their decennial average. The costliest natural disaster in 2014 was the flood in the Jammu and Kashmir region, in India, which cost US$ 16 billion, while cyclone Hudhud made US$ 7 billion damages, also in India. Costs from a winter storm in Japan amounted to US$ 5.9 billion. A drought in Brazil, the Ludian earthquake in China and typhoon Rammasun in China and the Philippines made damages of US$ 5 billion each. Seventeen other disasters (7 floods, 6 storms, 3 droughts and one episode of extreme temperature) made damages ranging from US$ 1 to 3.9 billion. The total costs of all these disasters represent 77.4% of all reported damages in 2014. Looking at the distribution of disasters across continents, it appears that Asia was most often hit (44.4%), followed by the Americas (23.5%), Europe (16.7%), Africa (12.0%) and Oceania (3.4%). This regional distribution of disaster occurrence in 2014 is not really different from the profile observed from 2004 to 2013. Asia accounted in 2014 for 69.5% of worldwide reported disaster victims (against 80.7% for the 2004-2013 decade’s average), while the Americas accounted for 22.8% (against 4.9% on average for the 2004-2013 period) and Africa for 5.5% (against 14% on average for 2004-2013). Europe accounted for 2% of all natural disasters victims (against 0.3% for 2004-2013 average) and Oceania for 0.12% (against 0.10% according to the 2004-2013 average). With 64.6% of worldwide natural disasters reported costs, Asia suffered the most damages in 2014, followed by the Americas (26.0%) and Europe (7.8%). A share of 1.1% of global disaster damages was reported for Oceania and of 0.5% for Africa. Despite some differences in the proportions, the ranking of the continents according to their contribution to the total reported damages is similar from the one observed over the last decade, where Asia had the highest damages, followed by the Americas and Europe. However, when compared to their respective 2004-2013 averages, the amount of damages in Asia and in the Americas differed significantly, the lowering of costs being much larger in the Americas. EM-DAT’s global approach to the compilation of disaster data continuously provides us with
Annual Disaster Statistical Review 2014 – The numbers and trends 3
valuable information and trends on the occurrence of natural disasters and their impacts on society. However, the development of guidelines and tools for the creation of national and sub-national disaster databases for the compilation of reliable, standardised, interoperable disaster occurrence and impact data should be prioritised for more effective disaster risk reduction. Figure 1 – Trends in occurrence and victims

4 Annual Disaster Statistical Review 2014 – The numbers and trends
Annual Disaster Statistical Review 2014 – The numbers and trends 5
About EM-DAT: The International Disaster Database
What is EM-DAT? Database definitions, criteria and content Methodology
Chapter 1

6 Annual Disaster Statistical Review 2014 – The numbers and trends
Annual Disaster Statistical Review 2014 – The numbers and trends 7
1. About EM-DAT: the International Disaster Database
1.1 What is EM-DAT?
Since 1988, with the sponsorship of the United States Agency for International Development’s Office of Foreign Disaster Assistance (USAID/OFDA), CRED has maintained EM-DAT, a worldwide database on disasters. It contains essential core data on the occurrence and impacts of more than 13 500 natural and 8 000 technological disasters in the world dating from 1900 to present. The data are compiled from various sources including UN agencies, non-governmental organizations, insurance companies, research institutes and press agencies. Priority is given to data from UN agencies, followed by OFDA, governments and the International Federation of Red Cross and Red Crescent Societies. This prioritization is not only a reflection of the quality or value of the data but it also reflects the fact that most reporting sources do not cover all disasters or have political limitations that can affect the figures. The entries are constantly reviewed for redundancy, inconsistencies and incompleteness. The database’s main objectives are to assist humanitarian action at both national and international levels; to rationalize decision-making for disaster preparedness; and to provide an objective basis for vulnerability assessment and priority setting.
1.2 Database classification, definitions, criteria and content
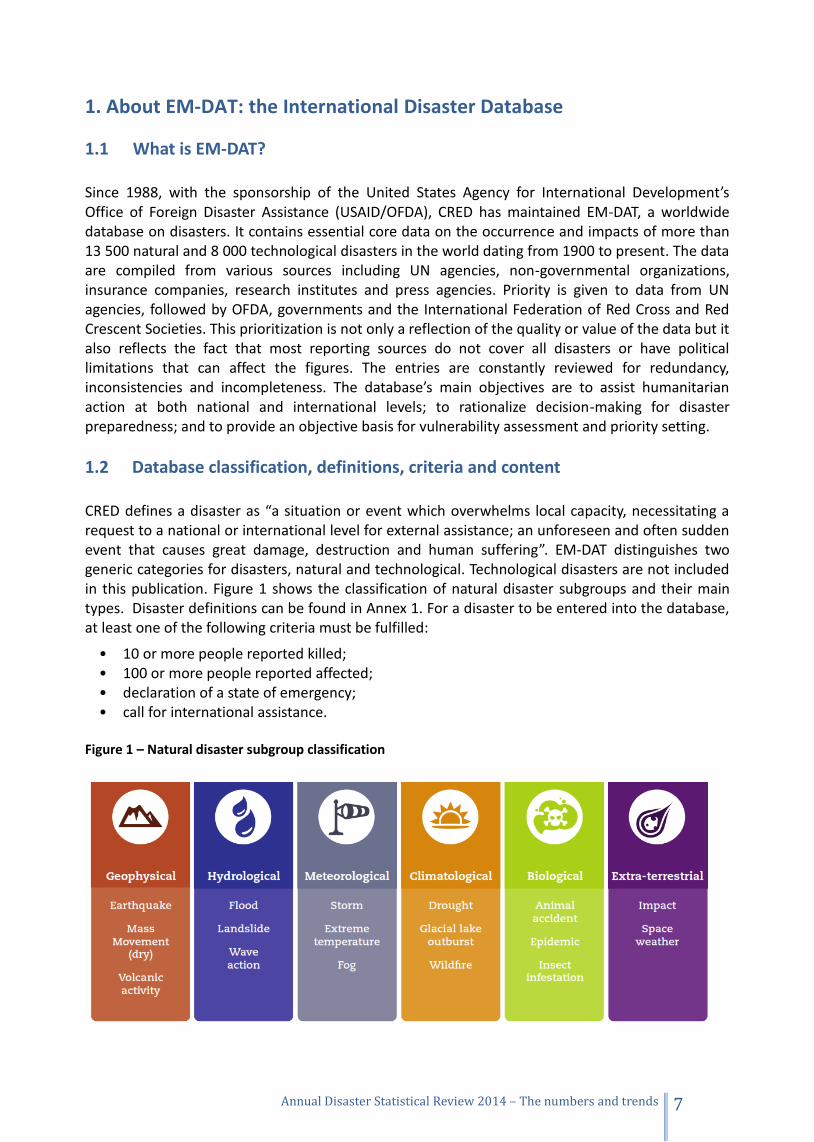
CRED defines a disaster as “a situation or event which overwhelms local capacity, necessitating a request to a national or international level for external assistance; an unforeseen and often sudden event that causes great damage, destruction and human suffering”. EM-DAT distinguishes two generic categories for disasters, natural and technological. Technological disasters are not included in this publication. Figure 1 shows the classification of natural disaster subgroups and their main types. Disaster definitions can be found in Annex 1. For a disaster to be entered into the database, at least one of the following criteria must be fulfilled:
• 10 or more people reported killed; • 100 or more people reported affected; • declaration of a state of emergency; • call for international assistance.
Figure 1 – Natural disaster subgroup classification
8 Annual Disaster Statistical Review 2014 – The numbers and trends
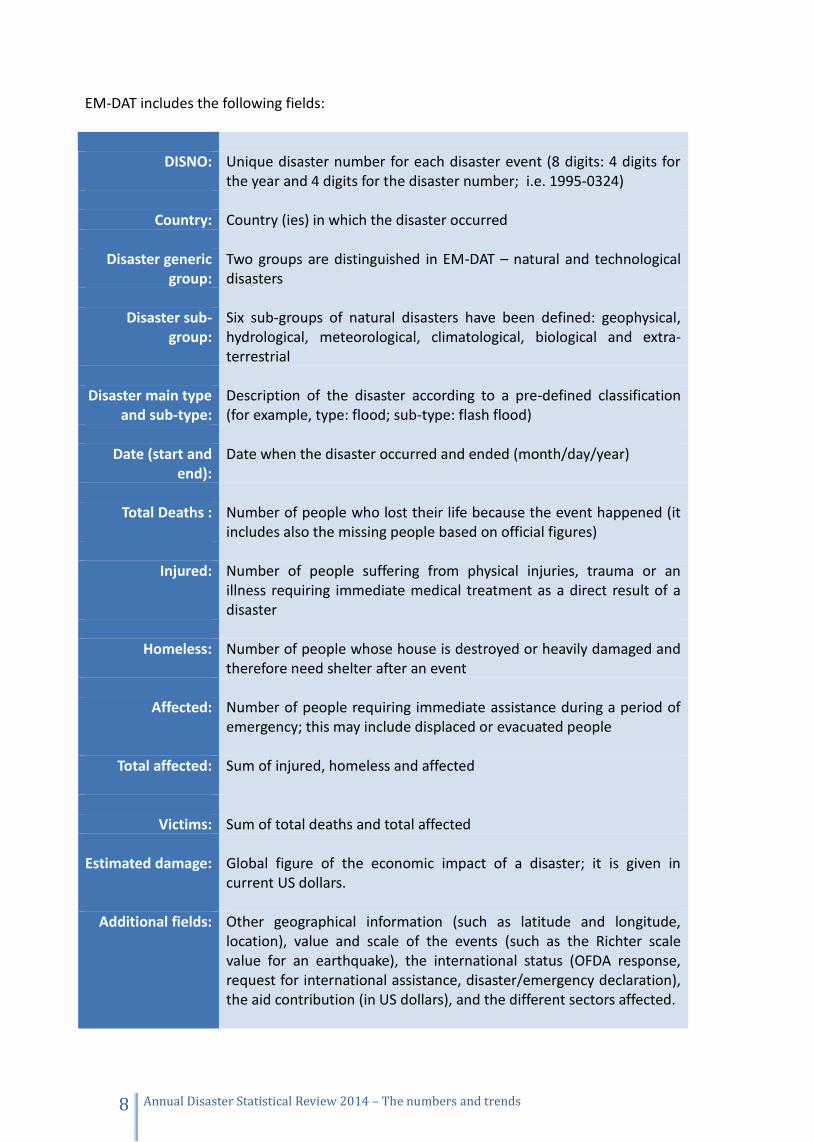
EM-DAT includes the following fields:
DISNO: Unique disaster number for each disaster event (8 digits: 4 digits for
the year and 4 digits for the disaster number; i.e. 1995-0324)
Country: Country (ies) in which the disaster occurred
Disaster generic group:
Two groups are distinguished in EM-DAT – natural and technological disasters
Disaster sub-
group: Six sub-groups of natural disasters have been defined: geophysical, hydrological, meteorological, climatological, biological and extra-terrestrial
Disaster main type
and sub-type: Description of the disaster according to a pre-defined classification (for example, type: flood; sub-type: flash flood)
Date (start and
end): Date when the disaster occurred and ended (month/day/year)
Total Deaths : Number of people who lost their life because the event happened (it
includes also the missing people based on official figures)
Injured: Number of people suffering from physical injuries, trauma or an illness requiring immediate medical treatment as a direct result of a disaster
Homeless: Number of people whose house is destroyed or heavily damaged and
therefore need shelter after an event
Affected: Number of people requiring immediate assistance during a period of emergency; this may include displaced or evacuated people
Total affected: Sum of injured, homeless and affected
Victims: Sum of total deaths and total affected
Estimated damage: Global figure of the economic impact of a disaster; it is given in current US dollars.
Additional fields: Other geographical information (such as latitude and longitude,
location), value and scale of the events (such as the Richter scale value for an earthquake), the international status (OFDA response, request for international assistance, disaster/emergency declaration), the aid contribution (in US dollars), and the different sectors affected.
Annual Disaster Statistical Review 2014 – The numbers and trends 9
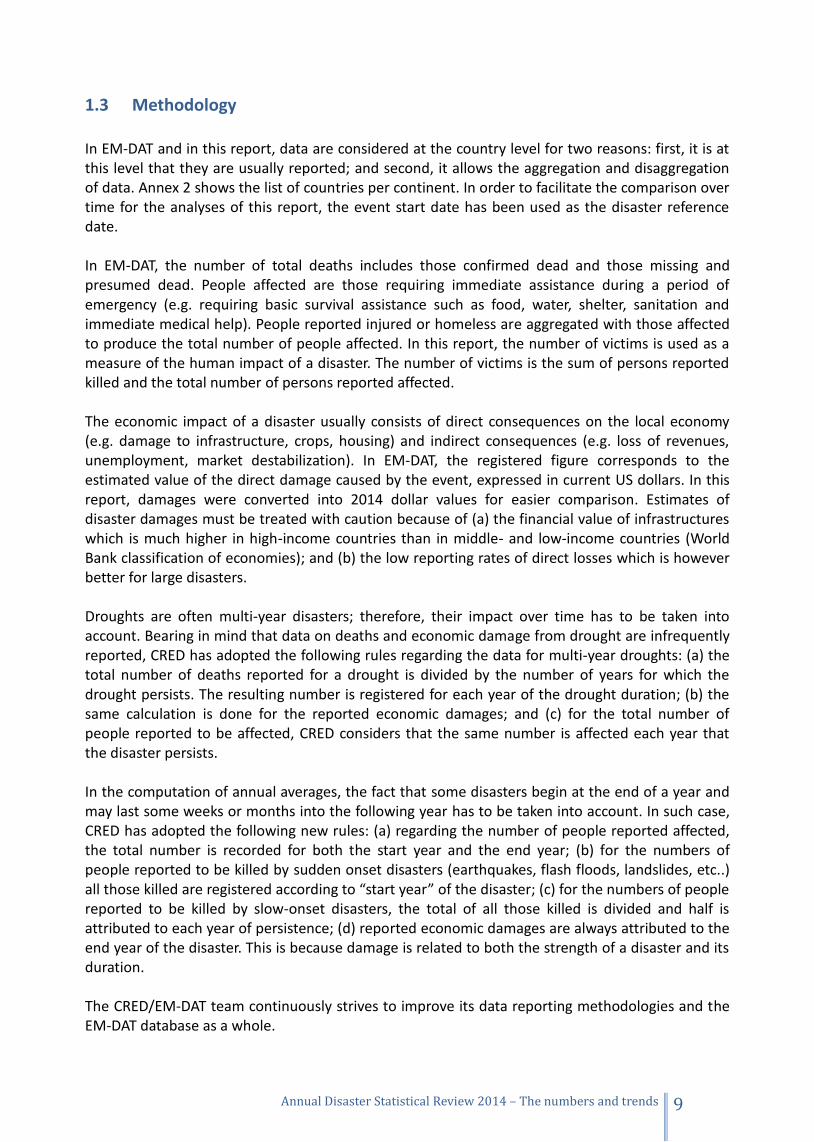
1.3 Methodology
In EM-DAT and in this report, data are considered at the country level for two reasons: first, it is at this level that they are usually reported; and second, it allows the aggregation and disaggregation of data. Annex 2 shows the list of countries per continent. In order to facilitate the comparison over time for the analyses of this report, the event start date has been used as the disaster reference date. In EM-DAT, the number of total deaths includes those confirmed dead and those missing and presumed dead. People affected are those requiring immediate assistance during a period of emergency (e.g. requiring basic survival assistance such as food, water, shelter, sanitation and immediate medical help). People reported injured or homeless are aggregated with those affected to produce the total number of people affected. In this report, the number of victims is used as a measure of the human impact of a disaster. The number of victims is the sum of persons reported killed and the total number of persons reported affected. The economic impact of a disaster usually consists of direct consequences on the local economy (e.g. damage to infrastructure, crops, housing) and indirect consequences (e.g. loss of revenues, unemployment, market destabilization). In EM-DAT, the registered figure corresponds to the estimated value of the direct damage caused by the event, expressed in current US dollars. In this report, damages were converted into 2014 dollar values for easier comparison. Estimates of disaster damages must be treated with caution because of (a) the financial value of infrastructures which is much higher in high-income countries than in middle- and low-income countries (World Bank classification of economies); and (b) the low reporting rates of direct losses which is however better for large disasters. Droughts are often multi-year disasters; therefore, their impact over time has to be taken into account. Bearing in mind that data on deaths and economic damage from drought are infrequently reported, CRED has adopted the following rules regarding the data for multi-year droughts: (a) the total number of deaths reported for a drought is divided by the number of years for which the drought persists. The resulting number is registered for each year of the drought duration; (b) the same calculation is done for the reported economic damages; and (c) for the total number of people reported to be affected, CRED considers that the same number is affected each year that the disaster persists. In the computation of annual averages, the fact that some disasters begin at the end of a year and may last some weeks or months into the following year has to be taken into account. In such case, CRED has adopted the following new rules: (a) regarding the number of people reported affected, the total number is recorded for both the start year and the end year; (b) for the numbers of people reported to be killed by sudden onset disasters (earthquakes, flash floods, landslides, etc..) all those killed are registered according to “start year” of the disaster; (c) for the numbers of people reported to be killed by slow-onset disasters, the total of all those killed is divided and half is attributed to each year of persistence; (d) reported economic damages are always attributed to the end year of the disaster. This is because damage is related to both the strength of a disaster and its duration. The CRED/EM-DAT team continuously strives to improve its data reporting methodologies and the EM-DAT database as a whole.

10 Annual Disaster Statistical Review 2014 – The numbers and trends

Annual Disaster Statistical Review 2014 – The numbers and trends 11
What did 2014 bring?
Chapter 2

12 Annual Disaster Statistical Review 2014 – The numbers and trends
Annual Disaster Statistical Review 2014 – The numbers and trends 13
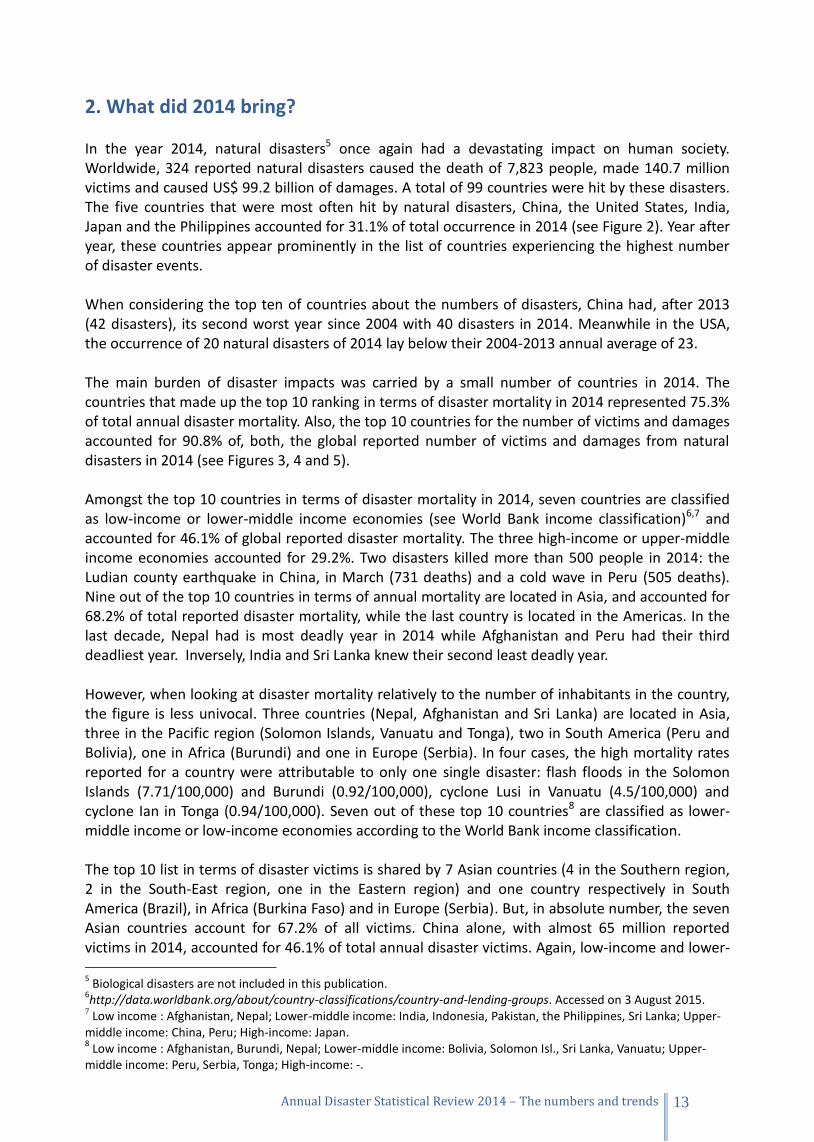
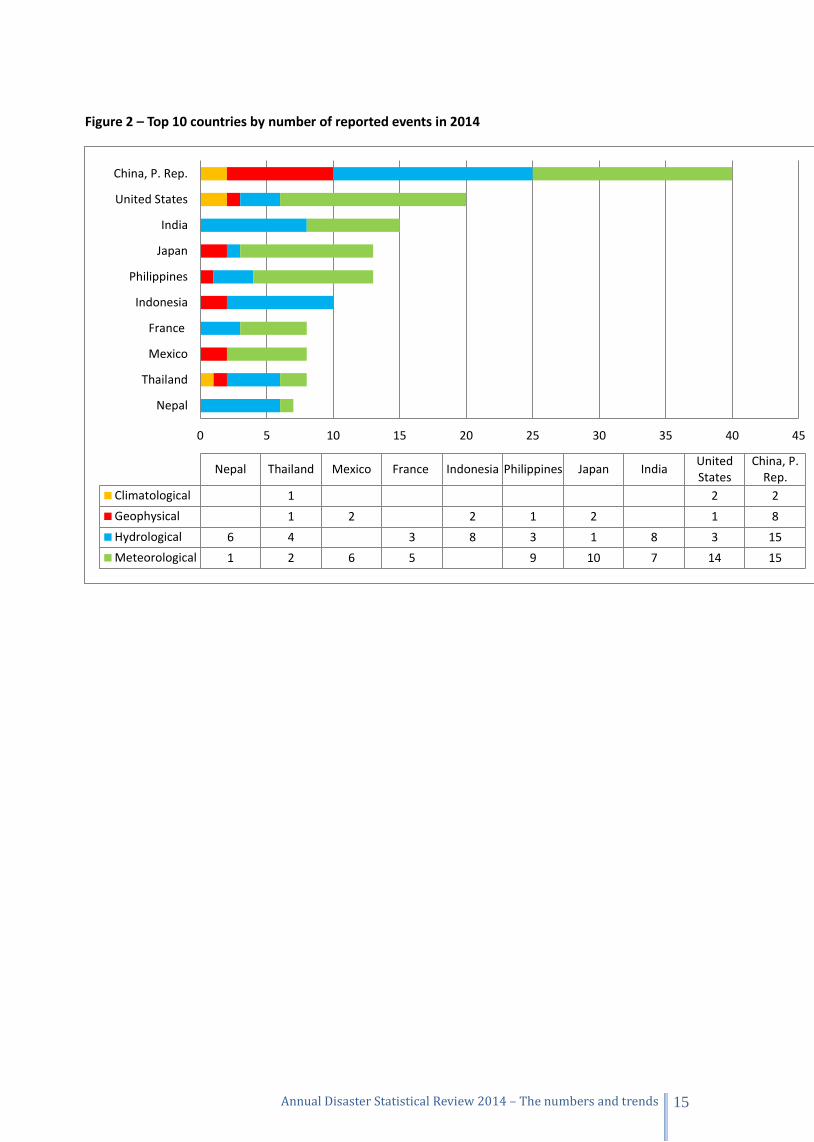
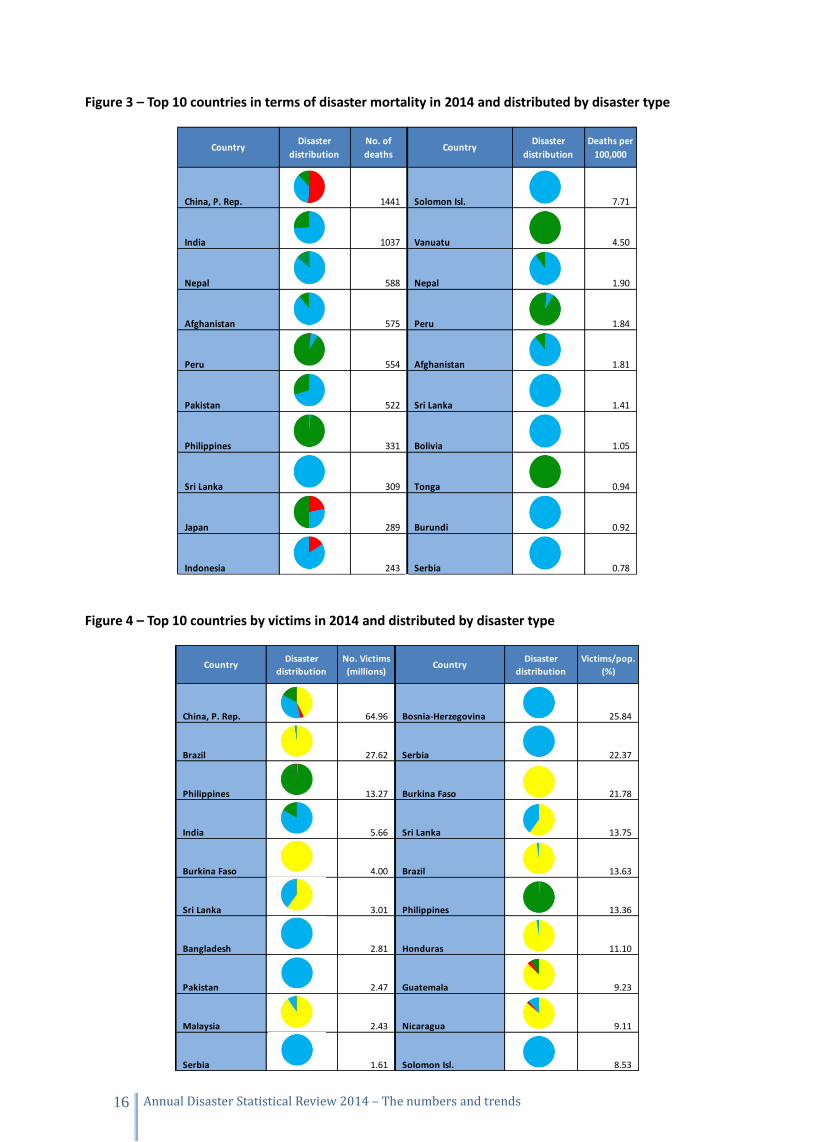
2. What did 2014 bring? In the year 2014, natural disasters5 once again had a devastating impact on human society. Worldwide, 324 reported natural disasters caused the death of 7,823 people, made 140.7 million victims and caused US$ 99.2 billion of damages. A total of 99 countries were hit by these disasters. The five countries that were most often hit by natural disasters, China, the United States, India, Japan and the Philippines accounted for 31.1% of total occurrence in 2014 (see Figure 2). Year after year, these countries appear prominently in the list of countries experiencing the highest number of disaster events. When considering the top ten of countries about the numbers of disasters, China had, after 2013 (42 disasters), its second worst year since 2004 with 40 disasters in 2014. Meanwhile in the USA, the occurrence of 20 natural disasters of 2014 lay below their 2004-2013 annual average of 23. The main burden of disaster impacts was carried by a small number of countries in 2014. The countries that made up the top 10 ranking in terms of disaster mortality in 2014 represented 75.3% of total annual disaster mortality. Also, the top 10 countries for the number of victims and damages accounted for 90.8% of, both, the global reported number of victims and damages from natural disasters in 2014 (see Figures 3, 4 and 5). Amongst the top 10 countries in terms of disaster mortality in 2014, seven countries are classified as low-income or lower-middle income economies (see World Bank income classification)6,7 and accounted for 46.1% of global reported disaster mortality. The three high-income or upper-middle income economies accounted for 29.2%. Two disasters killed more than 500 people in 2014: the Ludian county earthquake in China, in March (731 deaths) and a cold wave in Peru (505 deaths). Nine out of the top 10 countries in terms of annual mortality are located in Asia, and accounted for 68.2% of total reported disaster mortality, while the last country is located in the Americas. In the last decade, Nepal had is most deadly year in 2014 while Afghanistan and Peru had their third deadliest year. Inversely, India and Sri Lanka knew their second least deadly year. However, when looking at disaster mortality relatively to the number of inhabitants in the country, the figure is less univocal. Three countries (Nepal, Afghanistan and Sri Lanka) are located in Asia, three in the Pacific region (Solomon Islands, Vanuatu and Tonga), two in South America (Peru and Bolivia), one in Africa (Burundi) and one in Europe (Serbia). In four cases, the high mortality rates reported for a country were attributable to only one single disaster: flash floods in the Solomon Islands (7.71/100,000) and Burundi (0.92/100,000), cyclone Lusi in Vanuatu (4.5/100,000) and cyclone Ian in Tonga (0.94/100,000). Seven out of these top 10 countries8 are classified as lower-middle income or low-income economies according to the World Bank income classification. The top 10 list in terms of disaster victims is shared by 7 Asian countries (4 in the Southern region, 2 in the South-East region, one in the Eastern region) and one country respectively in South America (Brazil), in Africa (Burkina Faso) and in Europe (Serbia). But, in absolute number, the seven Asian countries account for 67.2% of all victims. China alone, with almost 65 million reported victims in 2014, accounted for 46.1% of total annual disaster victims. Again, low-income and lower- 5 Biological disasters are not included in this publication.
6http://data.worldbank.org/about/country-classifications/country-and-lending-groups. Accessed on 3 August 2015.
7 Low income : Afghanistan, Nepal; Lower-middle income: India, Indonesia, Pakistan, the Philippines, Sri Lanka; Upper-middle income: China, Peru; High-income: Japan. 8 Low income : Afghanistan, Burundi, Nepal; Lower-middle income: Bolivia, Solomon Isl., Sri Lanka, Vanuatu; Upper-
middle income: Peru, Serbia, Tonga; High-income: -.
14 Annual Disaster Statistical Review 2014 – The numbers and trends
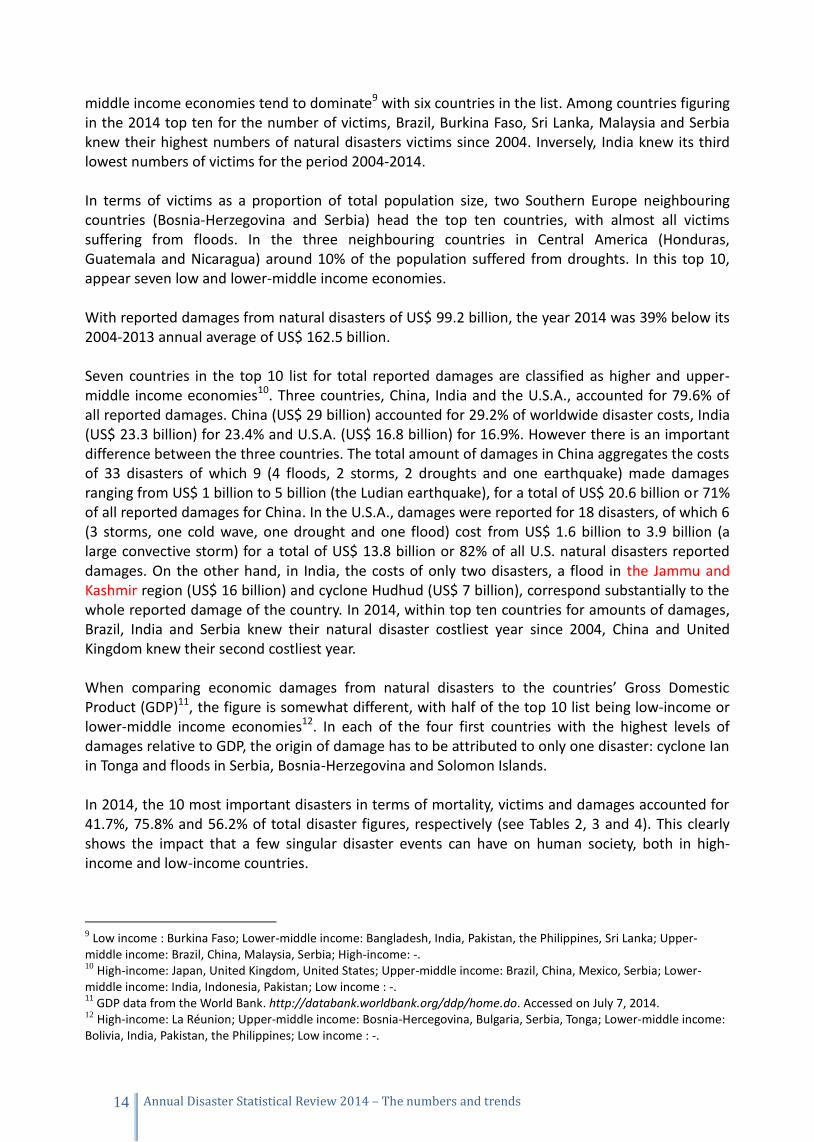
middle income economies tend to dominate9 with six countries in the list. Among countries figuring in the 2014 top ten for the number of victims, Brazil, Burkina Faso, Sri Lanka, Malaysia and Serbia knew their highest numbers of natural disasters victims since 2004. Inversely, India knew its third lowest numbers of victims for the period 2004-2014. In terms of victims as a proportion of total population size, two Southern Europe neighbouring countries (Bosnia-Herzegovina and Serbia) head the top ten countries, with almost all victims suffering from floods. In the three neighbouring countries in Central America (Honduras, Guatemala and Nicaragua) around 10% of the population suffered from droughts. In this top 10, appear seven low and lower-middle income economies.
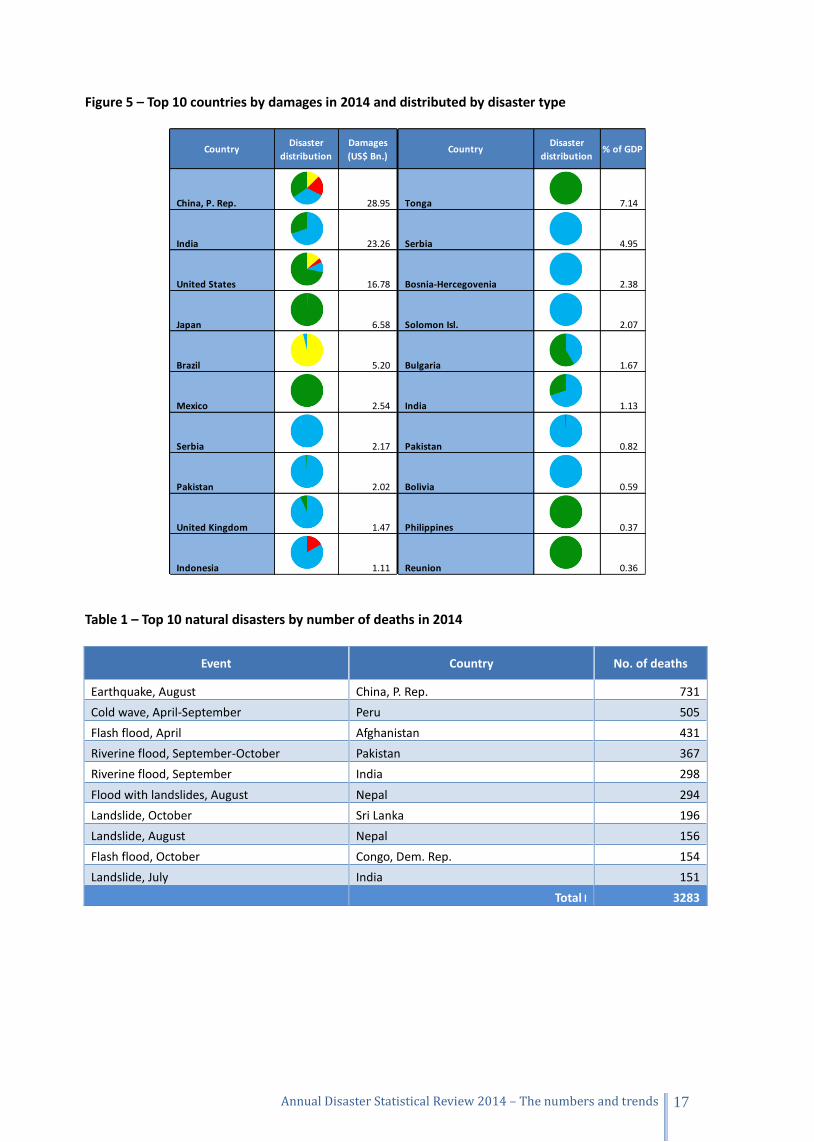
With reported damages from natural disasters of US$ 99.2 billion, the year 2014 was 39% below its 2004-2013 annual average of US$ 162.5 billion. Seven countries in the top 10 list for total reported damages are classified as higher and upper-middle income economies10. Three countries, China, India and the U.S.A., accounted for 79.6% of all reported damages. China (US$ 29 billion) accounted for 29.2% of worldwide disaster costs, India (US$ 23.3 billion) for 23.4% and U.S.A. (US$ 16.8 billion) for 16.9%. However there is an important difference between the three countries. The total amount of damages in China aggregates the costs of 33 disasters of which 9 (4 floods, 2 storms, 2 droughts and one earthquake) made damages ranging from US$ 1 billion to 5 billion (the Ludian earthquake), for a total of US$ 20.6 billion or 71% of all reported damages for China. In the U.S.A., damages were reported for 18 disasters, of which 6 (3 storms, one cold wave, one drought and one flood) cost from US$ 1.6 billion to 3.9 billion (a large convective storm) for a total of US$ 13.8 billion or 82% of all U.S. natural disasters reported damages. On the other hand, in India, the costs of only two disasters, a flood in the Jammu and Kashmir region (US$ 16 billion) and cyclone Hudhud (US$ 7 billion), correspond substantially to the whole reported damage of the country. In 2014, within top ten countries for amounts of damages, Brazil, India and Serbia knew their natural disaster costliest year since 2004, China and United Kingdom knew their second costliest year. When comparing economic damages from natural disasters to the countries’ Gross Domestic Product (GDP)11, the figure is somewhat different, with half of the top 10 list being low-income or lower-middle income economies12. In each of the four first countries with the highest levels of damages relative to GDP, the origin of damage has to be attributed to only one disaster: cyclone Ian in Tonga and floods in Serbia, Bosnia-Herzegovina and Solomon Islands. In 2014, the 10 most important disasters in terms of mortality, victims and damages accounted for 41.7%, 75.8% and 56.2% of total disaster figures, respectively (see Tables 2, 3 and 4). This clearly shows the impact that a few singular disaster events can have on human society, both in high-income and low-income countries. 9 Low income : Burkina Faso; Lower-middle income: Bangladesh, India, Pakistan, the Philippines, Sri Lanka; Upper-
middle income: Brazil, China, Malaysia, Serbia; High-income: -. 10
High-income: Japan, United Kingdom, United States; Upper-middle income: Brazil, China, Mexico, Serbia; Lower-middle income: India, Indonesia, Pakistan; Low income : -. 11
GDP data from the World Bank. http://databank.worldbank.org/ddp/home.do. Accessed on July 7, 2014. 12
High-income: La Réunion; Upper-middle income: Bosnia-Hercegovina, Bulgaria, Serbia, Tonga; Lower-middle income: Bolivia, India, Pakistan, the Philippines; Low income : -.
Annual Disaster Statistical Review 2014 – The numbers and trends 15
Figure 2 – Top 10 countries by number of reported events in 2014
0 5 10 15 20 25 30 35 40 45
Nepal
Thailand
Mexico
France
Indonesia
Philippines
Japan
India
United States
China, P. Rep.
Nepal Thailand Mexico France Indonesia Philippines Japan IndiaUnitedStates
China, P.Rep.
Climatological 1 2 2
Geophysical 1 2 2 1 2 1 8
Hydrological 6 4 3 8 3 1 8 3 15
Meteorological 1 2 6 5 9 10 7 14 15
16 Annual Disaster Statistical Review 2014 – The numbers and trends
Figure 3 – Top 10 countries in terms of disaster mortality in 2014 and distributed by disaster type
Figure 4 – Top 10 countries by victims in 2014 and distributed by disaster type
CountryDisaster
distribution
No. of
deathsCountry
Disaster
distribution
Deaths per
100,000
China, P. Rep. 1441 Solomon Isl. 7.71
India 1037 Vanuatu 4.50
Nepal 588 Nepal 1.90
Afghanistan 575 Peru 1.84
Peru 554 Afghanistan 1.81
Pakistan 522 Sri Lanka 1.41
Philippines 331 Bolivia 1.05
Sri Lanka 309 Tonga 0.94
Japan 289 Burundi 0.92
Indonesia 243 Serbia 0.78
CountryDisaster
distribution
No. Victims
(millions)Country
Disaster
distribution
Victims/pop.
(%)
China, P. Rep. 64.96 Bosnia-Herzegovina 25.84
Brazil 27.62 Serbia 22.37
Philippines 13.27 Burkina Faso 21.78
India 5.66 Sri Lanka 13.75
Burkina Faso 4.00 Brazil 13.63
Sri Lanka 3.01 Philippines 13.36
Bangladesh 2.81 Honduras 11.10
Pakistan 2.47 Guatemala 9.23
Malaysia 2.43 Nicaragua 9.11
Serbia 1.61 Solomon Isl. 8.53
Annual Disaster Statistical Review 2014 – The numbers and trends 17
Figure 5 – Top 10 countries by damages in 2014 and distributed by disaster type
Table 1 – Top 10 natural disasters by number of deaths in 2014
Event Country No. of deaths
Earthquake, August China, P. Rep. 731
Cold wave, April-September Peru 505
Flash flood, April Afghanistan 431
Riverine flood, September-October Pakistan 367
Riverine flood, September India 298
Flood with landslides, August Nepal 294
Landslide, October Sri Lanka 196
Landslide, August Nepal 156
Flash flood, October Congo, Dem. Rep. 154
Landslide, July India 151
Total l 3283
CountryDisaster
distribution
Damages
(US$ Bn.)Country
Disaster
distribution% of GDP
China, P. Rep. 28.95 Tonga 7.14
India 23.26 Serbia 4.95
United States 16.78 Bosnia-Hercegovenia 2.38
Japan 6.58 Solomon Isl. 2.07
Brazil 5.20 Bulgaria 1.67
Mexico 2.54 India 1.13
Serbia 2.17 Pakistan 0.82
Pakistan 2.02 Bolivia 0.59
United Kingdom 1.47 Philippines 0.37
Indonesia 1.11 Reunion 0.36
18 Annual Disaster Statistical Review 2014 – The numbers and trends
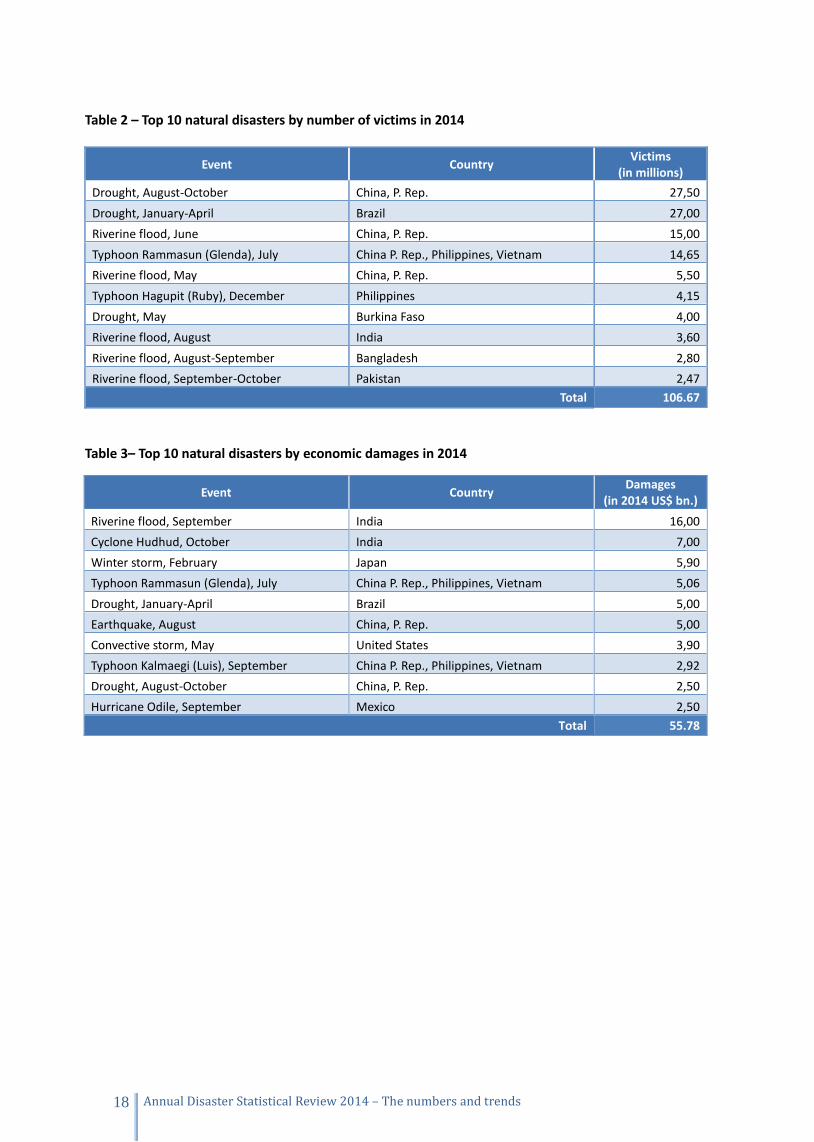
Table 2 – Top 10 natural disasters by number of victims in 2014
Event Country Victims
(in millions)
Drought, August-October China, P. Rep. 27,50
Drought, January-April Brazil 27,00
Riverine flood, June China, P. Rep. 15,00
Typhoon Rammasun (Glenda), July China P. Rep., Philippines, Vietnam 14,65
Riverine flood, May China, P. Rep. 5,50
Typhoon Hagupit (Ruby), December Philippines 4,15
Drought, May Burkina Faso 4,00
Riverine flood, August India 3,60
Riverine flood, August-September Bangladesh 2,80
Riverine flood, September-October Pakistan 2,47
Total 106.67
Table 3– Top 10 natural disasters by economic damages in 2014
Event Country Damages
(in 2014 US$ bn.)
Riverine flood, September India 16,00
Cyclone Hudhud, October India 7,00
Winter storm, February Japan 5,90
Typhoon Rammasun (Glenda), July China P. Rep., Philippines, Vietnam 5,06
Drought, January-April Brazil 5,00
Earthquake, August China, P. Rep. 5,00
Convective storm, May United States 3,90
Typhoon Kalmaegi (Luis), September China P. Rep., Philippines, Vietnam 2,92
Drought, August-October China, P. Rep. 2,50
Hurricane Odile, September Mexico 2,50
Total 55.78
Annual Disaster Statistical Review 2014 – The numbers and trends 19
How different was 2014?
Chapter 3

20 Annual Disaster Statistical Review 2014 – The numbers and trends
Annual Disaster Statistical Review 2014 – The numbers and trends 21
3. How different was 2014? The number of natural disasters reported in 2014 (324) showed a decrease of 2.1% compared to 2013’s number (331). Being the lowest figure for the last decade, it remained 15.6% below the annual average disaster occurrence for 2004-2013 (384), confirming the stabilization in the number of reported disasters observed during the previous decade and a possible slow decrease. The number of people killed by disasters in 2014 (7,823) was the lowest in the last decade2004 and strongly below its value for 2013 (21,629) and its 2004-2013 annual average (99,820). It can’t be compared to the peaks of 2010 (297,598), year of Haiti’s earthquake; 2004 (241,698), year of the Indian Ocean tsunami and 2008 (235,293) when cyclone Nargis hit Myanmar. The number of reported victims in 2014 (140.7 million) was the third lowest of the decade but was 40.1% above the number of victims of 2013 (100.5 million), which was the lowest since 2004. Compared to the decade’s annual average of 199.2 million victims, the number of victims was 29.3% below in 2014. The estimated economic losses from natural disasters in 2014 (US$ 99.2 billion) were 39% below the damages annual average for years 2004-2013. Damages in 2014 were the fourth lowest since 2004, far below 2011 (US$ 388.8 billion), year of the tsunami in Japan and the large flood in Thailand, and 2005 (US$ 261.3 billion), year of the hurricane Katrina. The lower number of reported natural disasters in 2014 was mainly due to decreases in the numbers of climatological disasters and hydrological disasters. Among climatological disasters, wildfires (4) were at their lowest level, 44% below their 2004-2013 annual average, and droughts (17) at their third lowest level since 2004, 23% below their decade’s average. Among hydrological disasters, floods (137) also showed a decrease in 2014, their number being the second lowest since 2004, 23% below the decade’s average. Among meteorological disasters, extreme temperatures (18) were at their third lowest level since 2004, 30% below their 2004-2013 annual average. Inversely, the number of earthquakes, volcanic eruptions, mass movements of hydrological origin and storms remained near their amounts for 2013 and very near their 2004-2013 average. The number of people killed by natural disasters in 2014 (7,823) was the lowest in the last decade, very far below its 2004-2013 annual average (99,820). The number of deaths from storms (1,239) was the lowest since 2004, very far below the 138,000 deaths from cyclone Nargis in 2008. The numbers of deaths from floods (3,634) was the second lowest for the decade, as well as the one from earthquakes (773) which cannot be compared to the figure of more than 200,000 deaths from the Indian Ocean tsunami of 2004 or the Haiti earthquake of 2010. Inversely, the number of deaths from volcanic activities (102) was the second highest since 2004 and the one from mass movements of hydrological origin (958) the third highest, but such levels of mortality remain, most of the time, unrelated to the very much higher figures encountered in the other disasters types. Compared to the 2004-2013 annual average, a decrease of 29% of the number of victims from natural disasters (140. 7 million) is observed, in 2014. A more or less marked decrease exists for all disasters types except for droughts (+28.9%) and volcanic activities (+ 43.1%). Numbers of victims from less frequent disasters, such as wild fires, mass movements of hydrological origin or extreme temperatures, decreased in proportions around 90%. On the other hand, numbers of victims from more common disasters declined, proportionally, less strongly, with a lowering of 62% for earthquakes, 55% for floods and 25% for storms. Damages from natural disasters (US$ 99.2 billion) were, in 2014, the fourth lowest in the last decade. Meteorological (US$ 43.5 billion) and hydrological (US$ 37.7 billion) disasters amounted for 81.2% of all costs but damages from meteorological disasters were 41.3% below their annual 2004-2013 average, while in contrast the amount of hydrological damages was 19% above its decennial
22 Annual Disaster Statistical Review 2014 – The numbers and trends
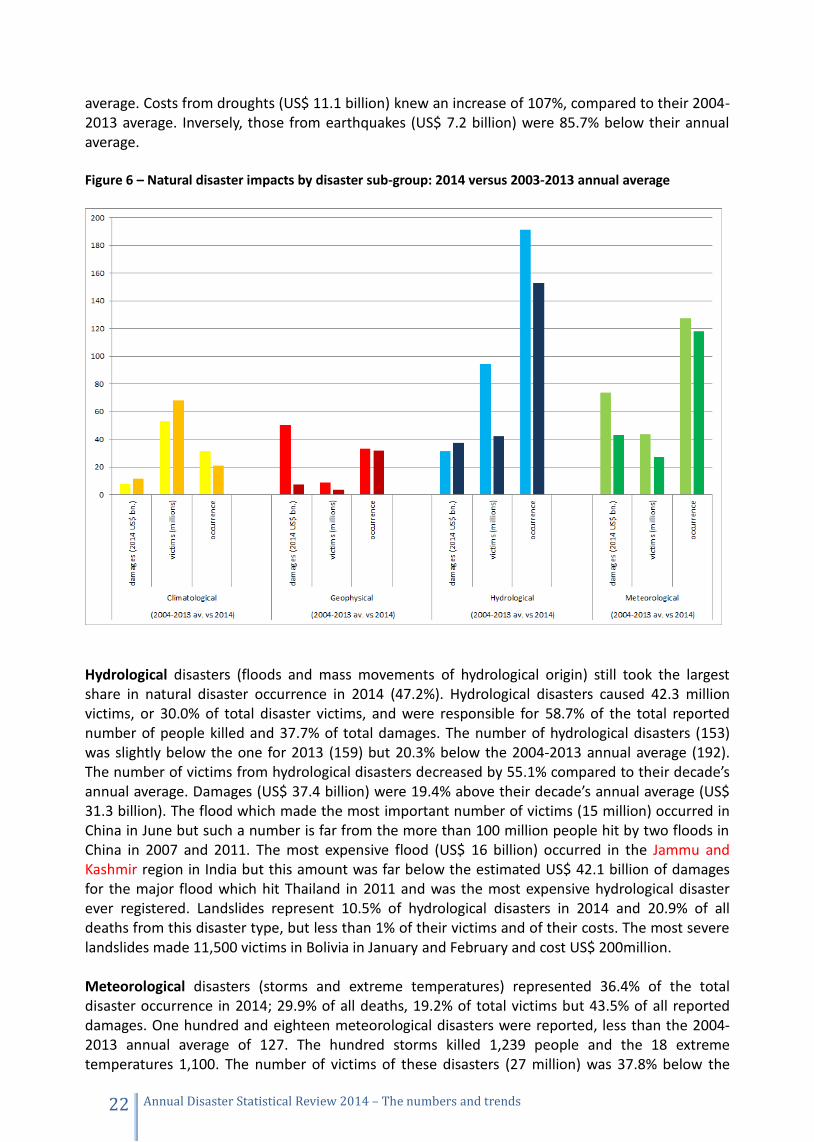
average. Costs from droughts (US$ 11.1 billion) knew an increase of 107%, compared to their 2004-2013 average. Inversely, those from earthquakes (US$ 7.2 billion) were 85.7% below their annual average. Figure 6 – Natural disaster impacts by disaster sub-group: 2014 versus 2003-2013 annual average
Hydrological disasters (floods and mass movements of hydrological origin) still took the largest share in natural disaster occurrence in 2014 (47.2%). Hydrological disasters caused 42.3 million victims, or 30.0% of total disaster victims, and were responsible for 58.7% of the total reported number of people killed and 37.7% of total damages. The number of hydrological disasters (153) was slightly below the one for 2013 (159) but 20.3% below the 2004-2013 annual average (192). The number of victims from hydrological disasters decreased by 55.1% compared to their decade’s annual average. Damages (US$ 37.4 billion) were 19.4% above their decade’s annual average (US$ 31.3 billion). The flood which made the most important number of victims (15 million) occurred in China in June but such a number is far from the more than 100 million people hit by two floods in China in 2007 and 2011. The most expensive flood (US$ 16 billion) occurred in the Jammu and Kashmir region in India but this amount was far below the estimated US$ 42.1 billion of damages for the major flood which hit Thailand in 2011 and was the most expensive hydrological disaster ever registered. Landslides represent 10.5% of hydrological disasters in 2014 and 20.9% of all deaths from this disaster type, but less than 1% of their victims and of their costs. The most severe landslides made 11,500 victims in Bolivia in January and February and cost US$ 200million. Meteorological disasters (storms and extreme temperatures) represented 36.4% of the total disaster occurrence in 2014; 29.9% of all deaths, 19.2% of total victims but 43.5% of all reported damages. One hundred and eighteen meteorological disasters were reported, less than the 2004-2013 annual average of 127. The hundred storms killed 1,239 people and the 18 extreme temperatures 1,100. The number of victims of these disasters (27 million) was 37.8% below the
Annual Disaster Statistical Review 2014 – The numbers and trends 23
annual average for years from 2004 to 2013. People victims of extreme temperatures represent only 4.5% of all victims of meteorological disasters. The typhoon Rammasun was the storm which made most victims in 2014 with almost ten million people affected in China and 4.6 million in the Philippines. Such a number of victims is far from the 30 million reported for typhoon Bilis in China in 2006 but, however, makes Rammasun the sixth storm in terms of number of victims since 2004. Damages from meteorological disasters (US$ 43.1 billion) were 41% below their 2004-2013 average and the most damages are attributable to storms (US$ 40.6 billion). The costliest storm was the cyclone Hudhud which made US$ 7 billion damages in India. Such an amount is far from the costs of hurricane Katrina (US$ 151.5 billion) and Sandy (US$ 51.5 billion) in the U.S.A in 2005 and 2012 but made Hudhud the third costliest storm in Asia since 2004, behind typhoons Songda in Japan in 2004 (US$ 11.5 billion) and Haiyan in the Philippines in 2013 (US$ 11.2 billion). The cold wave which hit the East of the U.S.A. in January made US$ 2.5 billion. Climatological disasters (droughts and wildfires) took in 2014 a 6.5% share of total disaster occurrence, below the share of 8.3% per year on average for 2004-2014. The 21 climatological disasters aggregate 17 droughts and 4 wildfires. The latter represents 19% of the climatological disasters occurrence, 100 % of the 17 deaths (no deaths were reported for droughts), less than 1% of the victims and 2.7 % of all damages. With 68.1 million victims, climatological disasters took in 2014 a share of 48.4% of total disaster victims, to be compared to a 26.6% annual average for the period 2004-2014. Such a difference in the proportions corresponds to an increase of 12.8% in the number of victims. In 2014, the reported damages from climatological disasters (US$ 11.3 billion) increased by 48.8% compared to their 2004-2013 annual average damages. Their share in the total damages grew from 4.7% on average for years 2004-2013 to 11.4% in 2014. Two droughts made respectively 27.5 million and 27 million victims in China and Brazil, placing them at the third and fourth ranks of droughts with the largest human impact since 2004, just behind two droughts which made 60 and 35 million victims in China in the years 2009-2011. Damages from the drought in Brazil amounted to US$ 5 billion and in China to US$ 2.5 billion. Another drought in the U.S.A. cost US$ 2.2 billion. The Brazilian drought is the third costliest since 2004, behind the US$ 20.6 billion and 8.4 billion damages from two droughts in the U.S.A. in 2012 and 2011, respectively. The Chinese and U.S. droughts rank 5 and 6, behind the Chinese drought of 2009-2010 which cost a total of US$ 3.9 billion. The wild fire with the most severe human impact in 2014 occurred in Chile, making 11,000 victims; far below the one million victims of such a disaster in Macedonia in 2007. The costliest wild fire made damages amounting to US$ 150 million in Sweden; which cannot be compared to the US$ 2.5 and 2 billion of two wild fires in the U.S.A. in 2007 and 2008 and of the US$ 2 billion of such a disaster in Spain in 2005. It should be noted that reported damages from climatological disasters, and especially droughts, are often underestimated due to a lack of standardized methods for quantifying and reporting losses. In 2014, 32 geophysical disasters (earthquakes/tsunamis, volcanic activities and mass movements of geological origin) were registered, representing a share of 9.9% of total disaster occurrence, close to their decade’s annual average of 8.6%. However, deaths from geophysical disasters (875) were extremely low in 2014 compared to the annual average of 65,068 for the years 2004-2013. This 2014 number of deaths from geophysical disasters represented only 11.2% of all deaths compared to a 2004-2013 annual average of 65.2%. Geophysical disasters made 3.4 million victims, a share of 2.4% of all disaster victims and a number very below their 8.6 million annual 2004-2013 average. Reported damages amounted to US$ 7.4 billion, a decrease of 85% from the decennial annual average of US$ 50.1 billion. Those disasters took a share of 7.7% of the total natural disasters damages of 2014, compared to a share of 30.8% on average from 2004 to 2013. The most severe 2014 earthquake occurred in the Ludian county in China, making 1.1 million victims and costing US$ 5 billion. Such numbers are very below the 46 million victims and US$ 93 billion
24 Annual Disaster Statistical Review 2014 – The numbers and trends
damages of the Sichuan earthquake in China in 2008, whose costs are also not commensurate with those of the tsunami in Japan in 2011 (US$ 221 billion). Year after year, the proportion of each disaster type in the total of disasters occurrence remains more or less similar and relatively stable. Inversely, the contribution of each of the four disasters types to numbers of people killed, numbers of victims and amounts of damages vary considerably from one year to another, reflecting the high variability and diversity of disaster’s impacts over time.
Annual Disaster Statistical Review 2014 – The numbers and trends 25
Regional analysis
Africa Americas Asia Europe Oceania
Chapter 4

26 Annual Disaster Statistical Review 2014 – The numbers and trends
Annual Disaster Statistical Review 2014 – The numbers and trends 27
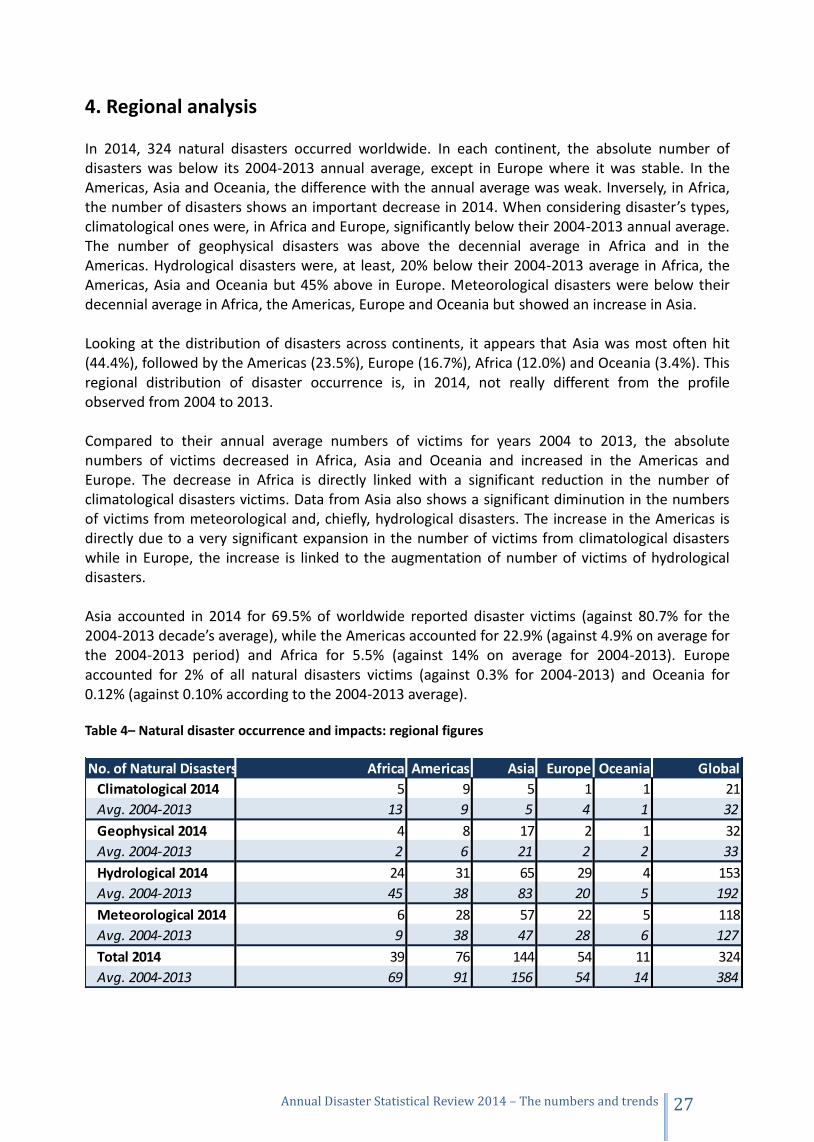
4. Regional analysis In 2014, 324 natural disasters occurred worldwide. In each continent, the absolute number of disasters was below its 2004-2013 annual average, except in Europe where it was stable. In the Americas, Asia and Oceania, the difference with the annual average was weak. Inversely, in Africa, the number of disasters shows an important decrease in 2014. When considering disaster’s types, climatological ones were, in Africa and Europe, significantly below their 2004-2013 annual average. The number of geophysical disasters was above the decennial average in Africa and in the Americas. Hydrological disasters were, at least, 20% below their 2004-2013 average in Africa, the Americas, Asia and Oceania but 45% above in Europe. Meteorological disasters were below their decennial average in Africa, the Americas, Europe and Oceania but showed an increase in Asia. Looking at the distribution of disasters across continents, it appears that Asia was most often hit (44.4%), followed by the Americas (23.5%), Europe (16.7%), Africa (12.0%) and Oceania (3.4%). This regional distribution of disaster occurrence is, in 2014, not really different from the profile observed from 2004 to 2013. Compared to their annual average numbers of victims for years 2004 to 2013, the absolute numbers of victims decreased in Africa, Asia and Oceania and increased in the Americas and Europe. The decrease in Africa is directly linked with a significant reduction in the number of climatological disasters victims. Data from Asia also shows a significant diminution in the numbers of victims from meteorological and, chiefly, hydrological disasters. The increase in the Americas is directly due to a very significant expansion in the number of victims from climatological disasters while in Europe, the increase is linked to the augmentation of number of victims of hydrological disasters. Asia accounted in 2014 for 69.5% of worldwide reported disaster victims (against 80.7% for the 2004-2013 decade’s average), while the Americas accounted for 22.9% (against 4.9% on average for the 2004-2013 period) and Africa for 5.5% (against 14% on average for 2004-2013). Europe accounted for 2% of all natural disasters victims (against 0.3% for 2004-2013) and Oceania for 0.12% (against 0.10% according to the 2004-2013 average). Table 4– Natural disaster occurrence and impacts: regional figures
No. of Natural Disasters Africa Americas Asia Europe Oceania Global
Climatological 2014 5 9 5 1 1 21
Avg. 2004-2013 13 9 5 4 1 32
Geophysical 2014 4 8 17 2 1 32
Avg. 2004-2013 2 6 21 2 2 33
Hydrological 2014 24 31 65 29 4 153
Avg. 2004-2013 45 38 83 20 5 192
Meteorological 2014 6 28 57 22 5 118
Avg. 2004-2013 9 38 47 28 6 127
Total 2014 39 76 144 54 11 324
Avg. 2004-2013 69 91 156 54 14 384
28 Annual Disaster Statistical Review 2014 – The numbers and trends
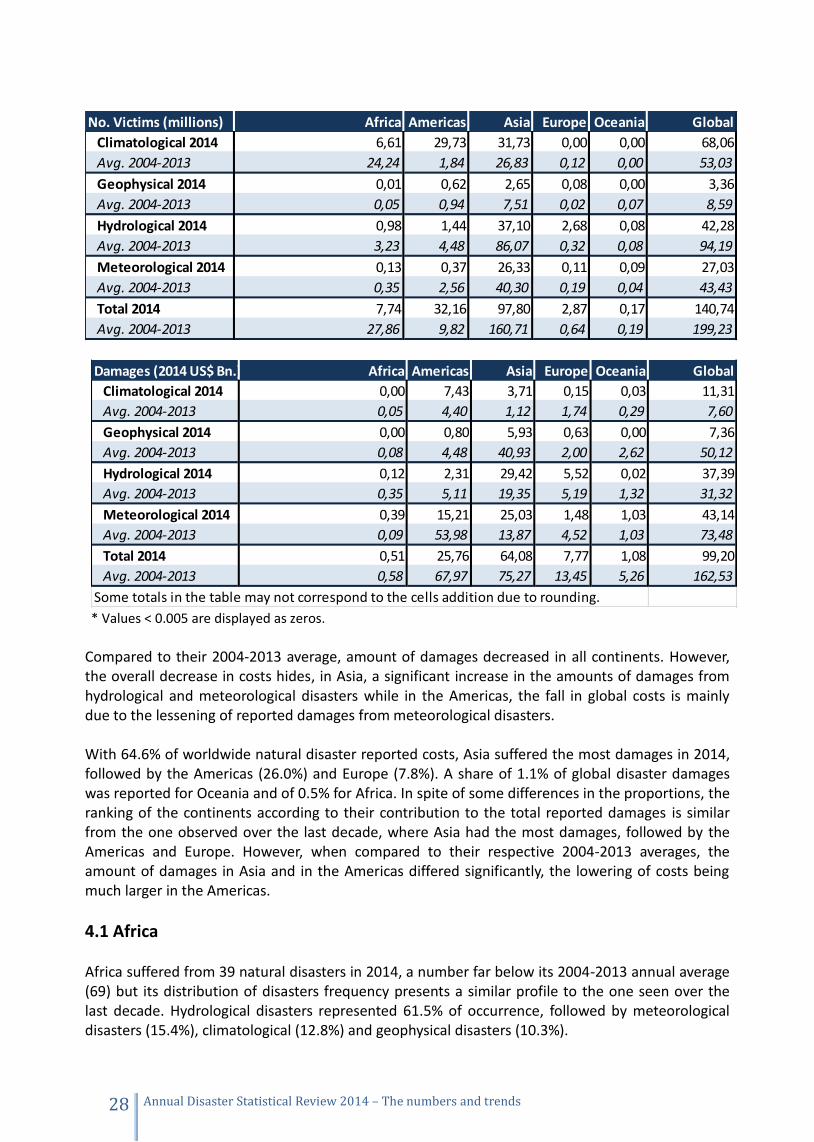
* Values < 0.005 are displayed as zeros.
Compared to their 2004-2013 average, amount of damages decreased in all continents. However, the overall decrease in costs hides, in Asia, a significant increase in the amounts of damages from hydrological and meteorological disasters while in the Americas, the fall in global costs is mainly due to the lessening of reported damages from meteorological disasters. With 64.6% of worldwide natural disaster reported costs, Asia suffered the most damages in 2014, followed by the Americas (26.0%) and Europe (7.8%). A share of 1.1% of global disaster damages was reported for Oceania and of 0.5% for Africa. In spite of some differences in the proportions, the ranking of the continents according to their contribution to the total reported damages is similar from the one observed over the last decade, where Asia had the most damages, followed by the Americas and Europe. However, when compared to their respective 2004-2013 averages, the amount of damages in Asia and in the Americas differed significantly, the lowering of costs being much larger in the Americas.
4.1 Africa Africa suffered from 39 natural disasters in 2014, a number far below its 2004-2013 annual average (69) but its distribution of disasters frequency presents a similar profile to the one seen over the last decade. Hydrological disasters represented 61.5% of occurrence, followed by meteorological disasters (15.4%), climatological (12.8%) and geophysical disasters (10.3%).
No. Victims (millions) Africa Americas Asia Europe Oceania Global
Climatological 2014 6,61 29,73 31,73 0,00 0,00 68,06
Avg. 2004-2013 24,24 1,84 26,83 0,12 0,00 53,03
Geophysical 2014 0,01 0,62 2,65 0,08 0,00 3,36
Avg. 2004-2013 0,05 0,94 7,51 0,02 0,07 8,59
Hydrological 2014 0,98 1,44 37,10 2,68 0,08 42,28
Avg. 2004-2013 3,23 4,48 86,07 0,32 0,08 94,19
Meteorological 2014 0,13 0,37 26,33 0,11 0,09 27,03
Avg. 2004-2013 0,35 2,56 40,30 0,19 0,04 43,43
Total 2014 7,74 32,16 97,80 2,87 0,17 140,74
Avg. 2004-2013 27,86 9,82 160,71 0,64 0,19 199,23
Damages (2014 US$ Bn.) Africa Americas Asia Europe Oceania Global
Climatological 2014 0,00 7,43 3,71 0,15 0,03 11,31
Avg. 2004-2013 0,05 4,40 1,12 1,74 0,29 7,60
Geophysical 2014 0,00 0,80 5,93 0,63 0,00 7,36
Avg. 2004-2013 0,08 4,48 40,93 2,00 2,62 50,12
Hydrological 2014 0,12 2,31 29,42 5,52 0,02 37,39
Avg. 2004-2013 0,35 5,11 19,35 5,19 1,32 31,32
Meteorological 2014 0,39 15,21 25,03 1,48 1,03 43,14
Avg. 2004-2013 0,09 53,98 13,87 4,52 1,03 73,48
Total 2014 0,51 25,76 64,08 7,77 1,08 99,20
Avg. 2004-2013 0,58 67,97 75,27 13,45 5,26 162,53
Some totals in the table may not correspond to the cells addition due to rounding.
Annual Disaster Statistical Review 2014 – The numbers and trends 29
The number of victims (7.74 million) was largely below the annual average during the period 2004-2013 (27.9 million), mainly due to the low number of victims of climatological disasters, the third lowest since 2004. Two droughts in Burkina Faso (4 million victims) and in Kenya (1.6 million victims) accounted for a total of 72.3% of the total number of disasters victims in 2014. Hydrological disasters are the second contributors to the total numbers of victims and three floods in Sudan (266,000 victims), Cameroon (250,000 victims) and Niger (165,000 victims) accounted for 69.3 % of hydrological disasters victims. With 117,000 victims, a severe storm in Morocco was the meteorological disaster with the most severe human impact in Africa in 2014. The estimation of natural disaster damages in Africa remains extremely challenging as data are often poorly reported or lacking altogether and, in 2014, damages were reported for only 5 natural disasters. The costliest was the severe storm in Morocco with US$ 300 million reported damages. At La Réunion, the cyclone Beisja made havoc for US$ 85 million. One riverine flood in South Africa cost US$ 85 million and two flash floods in Zimbabwe and the Democratic Republic of Congo made damages of respectively US$ 20 and 15 million.
4.2 Americas The Americas suffered in 2014 from 76 natural disasters, a number twenty percent below the 2004-2013 annual average of 91 disasters. Hydrological disasters (40.8%) and meteorological disasters (36.8%) occurred most often, while climatological and geophysical disasters occurred in similar proportions (11.8% and 10.5%, respectively). Compared to its average for the decade 2004-2013, only the number of geophysical disasters appeared slightly more frequent in 2014. In 2014, the total number of victims from natural disasters (32.2 million) was multiplied by more than 3 compared to its 2004-2013 annual average and this increase was essentially due to the drought which affected 27 million persons in Brazil in the first months of the year. Three other droughts affected significant numbers of people in Guatemala (1.2 million), Honduras (932,000) and Nicaragua (460,000). Those four droughts accounted for 91% of the total number of victims in the region in 2014. The Iquique earthquake and tsunami, in April in Chile, affected more than 500,000 persons and accounted for 83% of all geophysical disasters victims. Four floods in Brazil (500,000 victims), in Paraguay (231,000 victims), in Bolivia (185,000 victims) and in the United States (100,000 victims), represented a share of 70% of all flood victims. In 2014, disaster damages in the Americas (US$ 25.8 billion) were 62 percent below their annual average for the 2004-2013 period (US$ 67.9 billion). Important decreases were observable for damages from geophysical, hydrological and meteorological disasters. Damages reported for climatological disasters in the Americas in 2014 (US$ 7.4 billion) were the third highest for the period 2004-2013, essentially due to two droughts: one in Brazil which cost US$ 5 billion and another in the United States with damages amounting to US$ 2.2 billion. However, such amounts remain far below those reported for droughts in the United States in 2011 and 2012 (8.4 and 20.6 US$ billion, respectively). The costliest geophysical disasters were an earthquake in California in August which cost US$ 700 million while the Iquique earthquake in Chile made US$ 100 million damages. In comparison, two major earthquakes in 2010 made damages of US$ 32.5 billion in Chile and of 8.7 billion in Haiti. Costs from hydrological disasters (US$ 2.3 billion) accounted for half of their 2004-2013 annual average. The most severe hydrological disaster in terms of economic damages was a flood, in the USA which cost US$ 1.6 billion, far below the US$ 11 billion of the US Midwest floods of 2008, the
30 Annual Disaster Statistical Review 2014 – The numbers and trends
US$ 4.8 billion of the Mississippi flood in 2011 or the US$ 5.8 billion of the flood in the Calgary region in Canada, in 2013. Damages from meteorological disasters (US$ 15.2 billion) were 70% below their 2004-2013 annual average. Four storms made damages between US$ 1.6 and 3.9 billion in the USA and the hurricane Odile cost US$ 2.5 billion in Mexico. Such amounts are far from those reported for major hurricanes like Katrina (US$ 152 billion) or Ivan, Ike or Sandy which costs went from US$ 22.5 billion to 51.5 billion and from the costs of tornadoes in 2011 in the USA (US$ 26.2 billion).
4.3 Asia The number of disasters in Asia in 2014 (144) was near its 2004-2013 annual average (156) but this main figure hide differences between disaster types. In 2014, the number of climatological disasters (5) was equivalent to the annual 2004-2013 average (5). The numbers of geophysical and hydrological disasters (17 and 65) were, respectively the third lowest and the lowest since 2004 and showed a decrease of 19.0% and 21.7%, compared to their annual 2004-2013 average. Inversely, the number of meteorological disasters (57) was the highest since 2004 and showed a 21% increase when compared to its annual 2004-2013 average. The number of victims in Asia in 2014 (97.8 million) was far below the 2004-2013 annual average (160.7 million) and a decrease was observed for all disaster types, except climatological disasters of which the number of victims (31.7 million) increased in 2014 by almost 20%, but 87% of these victims suffered from one drought in China. The number of victims from geophysical disasters (2.65 million) was 65% below its decade’s average but this average is biased by the Sichuan earthquake which made 46 million of victims in China in 2008. In fact, the number of victims from geophysical disasters was, in 2014, near to the corrected average (2.75 million) excluding the major Chinese earthquake of 2008. An earthquake made 1.1 million victims in China and, in the same country, seven other earthquakes made a total of 1.3 million victims. Chinese people account then for 92% of all geophysical victims. The number of victims of hydrological disasters (37.1 million) decreased of 56.9% compared to its 2004-2013 annual average. In 2014, the biggest flood (15 million victims) occurred in China; six other floods made 1 to 5.5 million victims but these numbers are far from the ten millions of many floods in earlier years. The number of victims of meteorological disasters (26.3 million) was 35% lower than the annual 2004-2013 average and, in 2014, tropical cyclones were responsible of 92% of meteorological disaster victims in Asia. With 10 million victims in China and 4.7 million in the Philippines, the typhoon Rammasun was the most severe meteorological disaster in 2014. Its human impact can be compared to those of cyclones Haiyan in the Philippines (16 million victims) and Phailin in India (13 million victims) in 2013, but does not reach the 30 million of victims from the typhoon Bilis in China in 2006. In Asia, 17 disasters – 7 floods, 5 storms, 3 droughts, one earthquake and one cold wave - made more than one million victims each, for a total of 87.1 million or 89% of all Asian victims. Sixty-six percent of all victims lived in China, 13.6% in the Philippines and 5.8% in India. Disaster damages in Asia in 2014 (US$ 64.1 billion) were below their annual average for years 2004 to 2013 (US$ 75.3 billion) but this overall figure hides different phenomena. Damages from
Annual Disaster Statistical Review 2014 – The numbers and trends 31
climatological disasters (US$ 3.71 billion) were three times their 2004-2013 average. Costs from hydrological disasters (US$ 29.4 billion) were 52% higher than their decade’s average, and damages from meteorological disasters (US$ 26.3 billion) were 35% above their 2004-2013 average. Conversely, those from geophysical disasters (US$ 5.9 billion) were 85 % lower than their annual 2004-2013 average, accounting only for 9.3% of all reported damages against 54.4% for the decade’s average. The two most contributors to the total costs were hydrological disasters with a share of 45% of all damages (versus 25% for the 2004-2013 period) and meteorological disasters with a share of 39% (versus 15% for the decade). The costliest hydrological disaster was a flood, consecutive to monsoon rains, which made US$ 16 billion damages in the Jammu and Kashmir region in the North of India. This disaster was also the costliest in all Asia in 2014 and only the floods in Thailand in 2011 (201US$ 42 billion) and in China in 2010 (US$ 19.5 billion) made more damages. Five other floods – 4 in China and one in Pakistan – cost more than US$1 billion, for a total of US$ 6.8 billion. The total cost for these floods and the Indian one accounted for 77% of all hydrological damages in 2014. In 2014 in Asia, damages from meteorological disasters (US$ 25 billion) were the highest since 2004, above the peaks of 2004 and 2013 (US$ 23.5 and 23.8 billion, respectively), and two third of these costs originated in tropical cyclones or tropical storms. The cyclone Hudhud in India (US$ 7 billion) and a winter storm in Japan in February (US$ 5.9 billion) were the two costliest meteorological disasters in 2014. Only the cyclone Songda, in Japan in 2004 (US$ 11.3 billion) and, in 2013, the cyclone Haiyan in the Philippines (US$ 10.1 billion) and the tropical storm Fitow in China (US$ 6.8 billion), cost more than these two disasters. In 2014, an earthquake in China cost US$ 5 billion, which accounted for 84% of all geophysical disaster damages reported for Asia. However, such an amount is very below the US$ 221 billion of the tsunami in Japan in 2011, and from damages from earthquakes in China in 2008 (US$ 93.5 billion), in Japan in 2004 (US$ 35.1 billion) and in 2007 (US$ 14.3 billion). Two droughts in China cost, in 2014, respectively US$ 2.5 billion and 1.2 billion and accounted for 99% of all climatological reported damages. However, five droughts, also in China in 2006, 2009, 2010 and 2011, had more severe economic impacts, of between US$ 1.3 to 3.5 billion.
4.4 Europe The number of reported disasters in Europe (54) was equal to their annual average disaster occurrence from 2004 to 2013. However, when looking at disasters types the figure is somewhat different. The number of geophysical disaster (2) was equal to its annual 2004-2013 average, but such events are infrequent. Only one climatological disaster was reported against a 2004-2013 average of four. It should be noted that no drought was reported in Europe in 2014. The number of meteorological disasters (22) was the fourth lowest since 2004 and 22% below its 2004-2013 average. Inversely, the number of hydrological disasters (29) was the fourth highest since 2004 and showed a 45% increase compared to its decennial average. In 2014, the increase in the number of victims (2.9 million) compared to their 2004-2013 annual average (0.64 million) is explained by the increase of their number in hydrological disasters. These disasters took the largest share of total disaster victims in Europe (93%) and their increase is attributable to floods which, in Serbia and Bosnia-Herzegovina, made 1.6 and 1 million victims respectively. Since 2004, only a flood in Czech Republic in 2013 made a comparable amount of victims (1.3 million).
32 Annual Disaster Statistical Review 2014 – The numbers and trends
The numbers of victims of geophysical and climatological disasters were the lowest since 2004 and are linked to the rarity of such disasters in 2014. In spite of an increase in the reported number of meteorological disasters, the number of victims they did declined. The storm with the most severe impact made 18,000 victims in the UK in 2014, which is a low figure compared to the numbers of victims of storms in Albania in 2005 (400,000), in France in 2010 (500,000) and in Russia in 2013 (300,000). The most severe winter conditions made 50,000 victims in Belarus in 2014 while 230,000 were reported for the same type of disaster in Albania in 2012. Damages from natural disasters in Europe in 2014 (US$ 7.8 billion) were the fourth lowest since 2004, far below those reported for 2013 (US$ 23.4 billion), 2012 (US$ 25 billion), 2010 (US$ 20.6 billion) and 2007 (US$ 24.2 billion). The share of hydrological disasters in 2014 total damages is of 71%, against their 39% annual average for years 2004-2013, and damages from meteorological disasters accounted for 19% of all damages, versus an average share of 33% for the decade. The costliest disaster in 2014, was a flood in Serbia with damages of US$ 2 billion, far from the damages from a huge flood in Germany in 2013 (US$ 13 billion) and two floods in the UK in 2007 (US$ 4.5 billion, each). However, 9 floods cost more than US$ 100 million, making 2014 the year with the highest number of costly floods in Europe since 2004. The hailstorm in Bulgaria in July made damages estimated to US$ 545 million and was the costliest meteorological disaster in Europe in 2014, very far from the damages caused by the extratropical storm Kyrill in Germany in 2007 (US$ 6.3 billion) or from the 12 other storms which made at least US$ 1 billion damages between 2004 and 2013 in Europe. Two earthquakes cost US$ 450 and 178 million in Greece in 2014, an amount far from the two earthquakes which made, in Italy, in the Ferrare region in 2012 and at l’Aquila in 2009 damages for US$ 16.3 billion and 2.7 billion, respectively. The only climatological disaster reported in Europe in 2014 was a wildfire in Sweden, which cost US$ 150 million, an amount which can’t be compared to the, at least US$ 2 billion damages reported for wild fires in Spain and Portugal in 2005, in Greece in 2007 and in Russia in 2010.
4.5 Oceania In 2014, the number of disasters (11) was below its 2004-2013 annual average (14). Only one climatological disaster was reported but such events are not very frequent in Oceania, as shown by their decennial averages (1). Only one geophysical disaster was also reported, which is below their 2004-2013 average of 2 and the 5 such events reported in 2009. The number of hydrological disasters (4) is near its annual 2004-2013 average (5) and was the fourth lowest since 2004. The number of meteorological disasters (5) is also near its annual average (6), far below the peak of 13 in 2004. Number of victims of natural disasters in 2014 in Oceania (170,234) is near its 2004-2013 annual average (194,642), far below the peaks of almost 550,000 and 520,000 victims in 2010 and 2011. The only climatological disaster of 2014 was a wildfire in Australia which made “only” 170 victims and cost US$ 25 million, to compare with the wildfire in Australia in 2009 which made 10,134 victims and US$ 1.4 billion. No drought was reported in 2014 in Oceania. The only geophysical disaster was a volcanic eruption of Mount Bagana in Papua New Guinea, which affected 1,380 persons. In 2005, the eruption and continuous activity of Manam volcano, in Papua New Guinea as well, affected 11,000 people and the same phenomenon was reported for
Annual Disaster Statistical Review 2014 – The numbers and trends 33
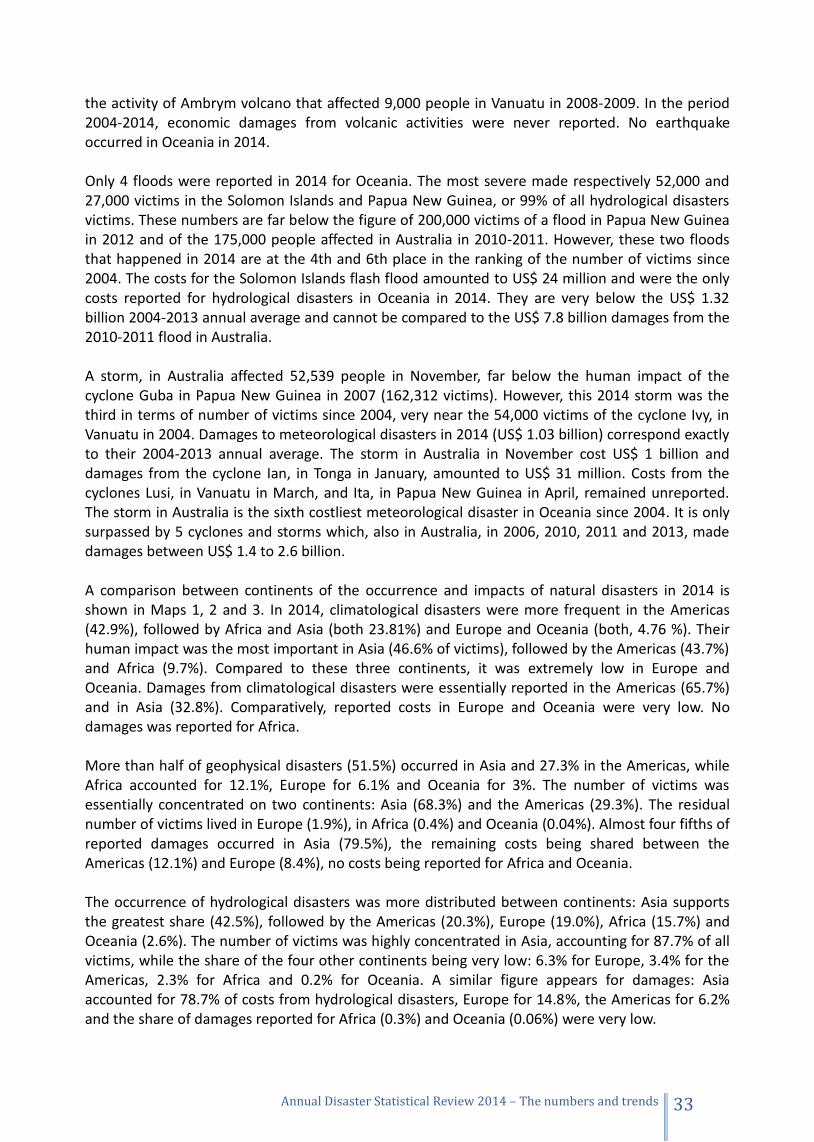
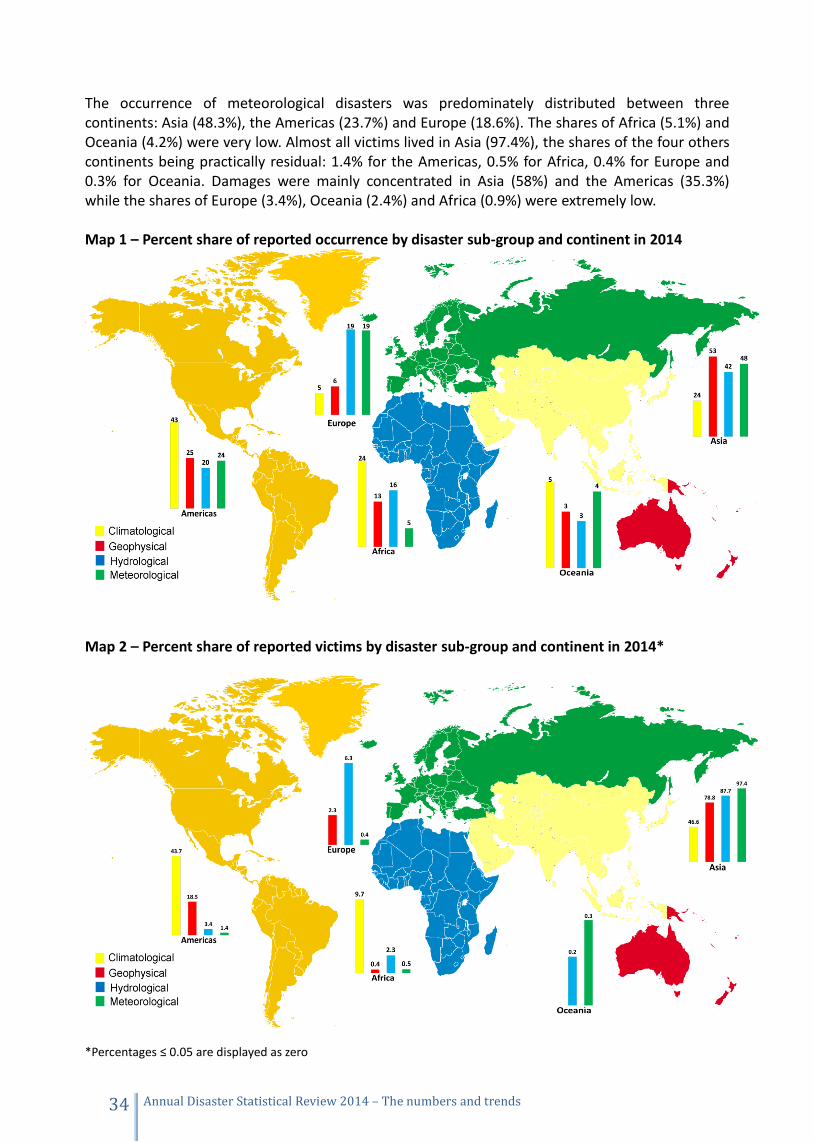
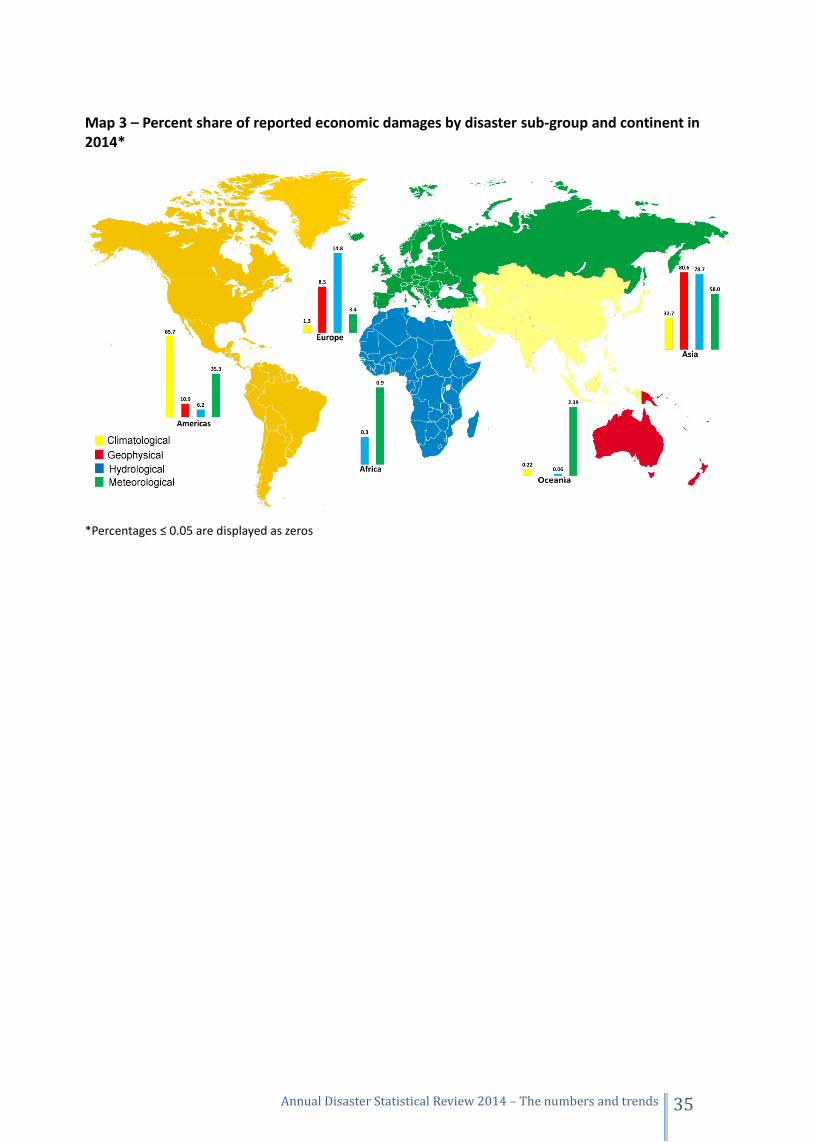
the activity of Ambrym volcano that affected 9,000 people in Vanuatu in 2008-2009. In the period 2004-2014, economic damages from volcanic activities were never reported. No earthquake occurred in Oceania in 2014. Only 4 floods were reported in 2014 for Oceania. The most severe made respectively 52,000 and 27,000 victims in the Solomon Islands and Papua New Guinea, or 99% of all hydrological disasters victims. These numbers are far below the figure of 200,000 victims of a flood in Papua New Guinea in 2012 and of the 175,000 people affected in Australia in 2010-2011. However, these two floods that happened in 2014 are at the 4th and 6th place in the ranking of the number of victims since 2004. The costs for the Solomon Islands flash flood amounted to US$ 24 million and were the only costs reported for hydrological disasters in Oceania in 2014. They are very below the US$ 1.32 billion 2004-2013 annual average and cannot be compared to the US$ 7.8 billion damages from the 2010-2011 flood in Australia. A storm, in Australia affected 52,539 people in November, far below the human impact of the cyclone Guba in Papua New Guinea in 2007 (162,312 victims). However, this 2014 storm was the third in terms of number of victims since 2004, very near the 54,000 victims of the cyclone Ivy, in Vanuatu in 2004. Damages to meteorological disasters in 2014 (US$ 1.03 billion) correspond exactly to their 2004-2013 annual average. The storm in Australia in November cost US$ 1 billion and damages from the cyclone Ian, in Tonga in January, amounted to US$ 31 million. Costs from the cyclones Lusi, in Vanuatu in March, and Ita, in Papua New Guinea in April, remained unreported. The storm in Australia is the sixth costliest meteorological disaster in Oceania since 2004. It is only surpassed by 5 cyclones and storms which, also in Australia, in 2006, 2010, 2011 and 2013, made damages between US$ 1.4 to 2.6 billion. A comparison between continents of the occurrence and impacts of natural disasters in 2014 is shown in Maps 1, 2 and 3. In 2014, climatological disasters were more frequent in the Americas (42.9%), followed by Africa and Asia (both 23.81%) and Europe and Oceania (both, 4.76 %). Their human impact was the most important in Asia (46.6% of victims), followed by the Americas (43.7%) and Africa (9.7%). Compared to these three continents, it was extremely low in Europe and Oceania. Damages from climatological disasters were essentially reported in the Americas (65.7%) and in Asia (32.8%). Comparatively, reported costs in Europe and Oceania were very low. No damages was reported for Africa. More than half of geophysical disasters (51.5%) occurred in Asia and 27.3% in the Americas, while Africa accounted for 12.1%, Europe for 6.1% and Oceania for 3%. The number of victims was essentially concentrated on two continents: Asia (68.3%) and the Americas (29.3%). The residual number of victims lived in Europe (1.9%), in Africa (0.4%) and Oceania (0.04%). Almost four fifths of reported damages occurred in Asia (79.5%), the remaining costs being shared between the Americas (12.1%) and Europe (8.4%), no costs being reported for Africa and Oceania. The occurrence of hydrological disasters was more distributed between continents: Asia supports the greatest share (42.5%), followed by the Americas (20.3%), Europe (19.0%), Africa (15.7%) and Oceania (2.6%). The number of victims was highly concentrated in Asia, accounting for 87.7% of all victims, while the share of the four other continents being very low: 6.3% for Europe, 3.4% for the Americas, 2.3% for Africa and 0.2% for Oceania. A similar figure appears for damages: Asia accounted for 78.7% of costs from hydrological disasters, Europe for 14.8%, the Americas for 6.2% and the share of damages reported for Africa (0.3%) and Oceania (0.06%) were very low.
34 Annual Disaster Statistical Review 2014 – The numbers and trends
The occurrence of meteorological disasters was predominately distributed between three continents: Asia (48.3%), the Americas (23.7%) and Europe (18.6%). The shares of Africa (5.1%) and Oceania (4.2%) were very low. Almost all victims lived in Asia (97.4%), the shares of the four others continents being practically residual: 1.4% for the Americas, 0.5% for Africa, 0.4% for Europe and 0.3% for Oceania. Damages were mainly concentrated in Asia (58%) and the Americas (35.3%) while the shares of Europe (3.4%), Oceania (2.4%) and Africa (0.9%) were extremely low. Map 1 – Percent share of reported occurrence by disaster sub-group and continent in 2014
Map 2 – Percent share of reported victims by disaster sub-group and continent in 2014*
*Percentages ≤ 0.05 are displayed as zero
Annual Disaster Statistical Review 2014 – The numbers and trends 35
Map 3 – Percent share of reported economic damages by disaster sub-group and continent in 2014*
*Percentages ≤ 0.05 are displayed as zeros

36 Annual Disaster Statistical Review 2014 – The numbers and trends
Annual Disaster Statistical Review 2013 – The numbers and trends 37
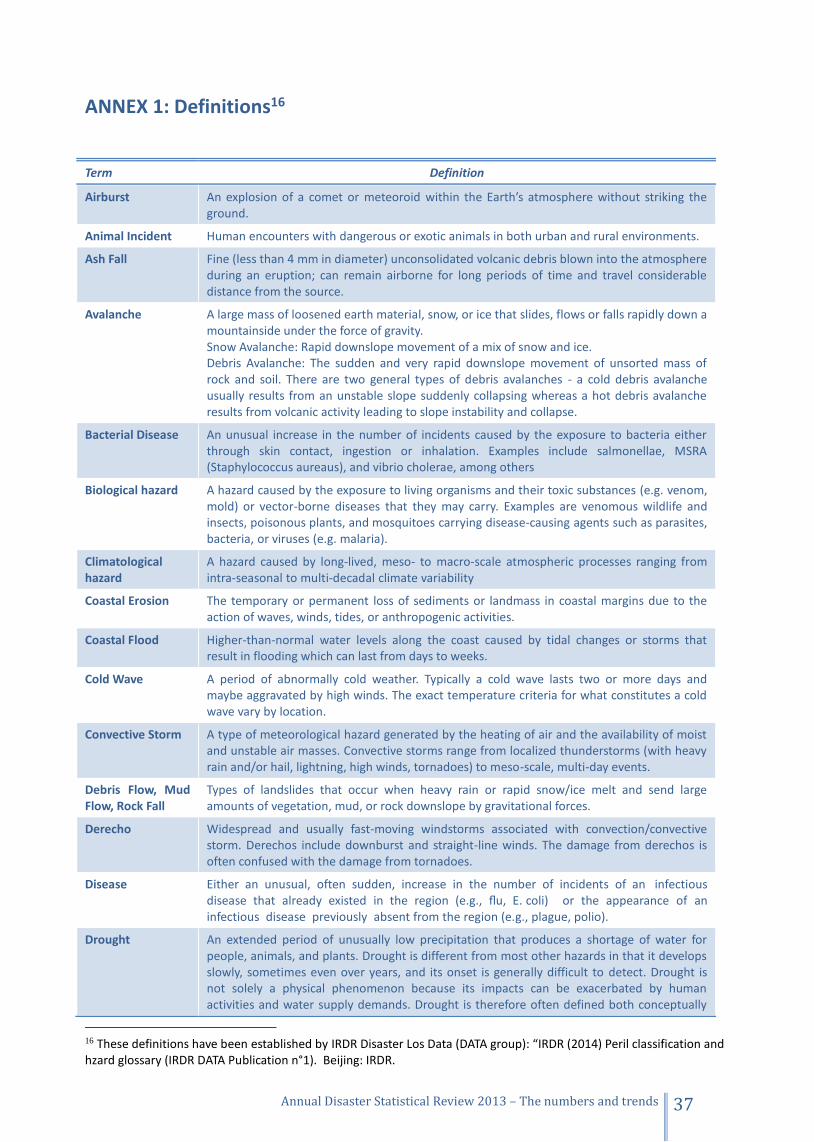
ANNEX 1: Definitions16
Term Definition
Airburst An explosion of a comet or meteoroid within the Earth’s atmosphere without striking the ground.
Animal Incident Human encounters with dangerous or exotic animals in both urban and rural environments.
Ash Fall Fine (less than 4 mm in diameter) unconsolidated volcanic debris blown into the atmosphere during an eruption; can remain airborne for long periods of time and travel considerable distance from the source.
Avalanche A large mass of loosened earth material, snow, or ice that slides, flows or falls rapidly down a mountainside under the force of gravity. Snow Avalanche: Rapid downslope movement of a mix of snow and ice. Debris Avalanche: The sudden and very rapid downslope movement of unsorted mass of rock and soil. There are two general types of debris avalanches - a cold debris avalanche usually results from an unstable slope suddenly collapsing whereas a hot debris avalanche results from volcanic activity leading to slope instability and collapse.
Bacterial Disease An unusual increase in the number of incidents caused by the exposure to bacteria either through skin contact, ingestion or inhalation. Examples include salmonellae, MSRA (Staphylococcus aureaus), and vibrio cholerae, among others
Biological hazard A hazard caused by the exposure to living organisms and their toxic substances (e.g. venom, mold) or vector-borne diseases that they may carry. Examples are venomous wildlife and insects, poisonous plants, and mosquitoes carrying disease-causing agents such as parasites, bacteria, or viruses (e.g. malaria).
Climatological hazard
A hazard caused by long-lived, meso- to macro-scale atmospheric processes ranging from intra-seasonal to multi-decadal climate variability
Coastal Erosion The temporary or permanent loss of sediments or landmass in coastal margins due to the action of waves, winds, tides, or anthropogenic activities.
Coastal Flood Higher-than-normal water levels along the coast caused by tidal changes or storms that result in flooding which can last from days to weeks.
Cold Wave A period of abnormally cold weather. Typically a cold wave lasts two or more days and maybe aggravated by high winds. The exact temperature criteria for what constitutes a cold wave vary by location.
Convective Storm A type of meteorological hazard generated by the heating of air and the availability of moist and unstable air masses. Convective storms range from localized thunderstorms (with heavy rain and/or hail, lightning, high winds, tornadoes) to meso-scale, multi-day events.
Debris Flow, Mud Flow, Rock Fall
Types of landslides that occur when heavy rain or rapid snow/ice melt and send large amounts of vegetation, mud, or rock downslope by gravitational forces.
Derecho Widespread and usually fast-moving windstorms associated with convection/convective storm. Derechos include downburst and straight-line winds. The damage from derechos is often confused with the damage from tornadoes.
Disease Either an unusual, often sudden, increase in the number of incidents of an infectious disease that already existed in the region (e.g., flu, E. coli) or the appearance of an infectious disease previously absent from the region (e.g., plague, polio).
Drought An extended period of unusually low precipitation that produces a shortage of water for people, animals, and plants. Drought is different from most other hazards in that it develops slowly, sometimes even over years, and its onset is generally difficult to detect. Drought is not solely a physical phenomenon because its impacts can be exacerbated by human activities and water supply demands. Drought is therefore often defined both conceptually
16 These definitions have been established by IRDR Disaster Los Data (DATA group): “IRDR (2014) Peril classification and hzard glossary (IRDR DATA Publication n°1). Beijing: IRDR.
38 Annual Disaster Statistical Review 2013 – The numbers and trends
and operationally. Operational definitions of drought, meaning the degree of precipitation reduction that constitutes a drought, vary by locality, climate and environmental sector.
Earthquake Sudden movement of a block of the Earth’s crust along a geological fault and associated ground shaking.
Energetic Particles Emissions from solar radiation storms consisting of pieces of matter (e.g., protons and other charged particles) moving at very high speed. The magnetosphere and atmosphere block (solar) energetic particles (SEP) from reaching humans on Earth but they are a danger to life in outer space and pose a radiation hazard to aircraft travelling at high altitudes.
Epidemic Either an unusual, often sudden, increase in the number of incidents of an infectious disease that already existed in the region (e.g., flu, E. coli) or the appearance of an infectious disease previously absent from the region (e.g., plague, polio).
Expansive Soil Earthen material, particularly clays that upon wetting, freezing, or drying will alternately expand or contract causing damage to foundations of buildings and other structures. Shrinkage is generally referred to as subsidence or desiccation.
Extraterrestrial hazard
A hazard caused by asteroids, meteoroids, and comets as they pass near-earth, enter the Earth’s atmosphere, and/or strike the Earth, and by changes in interplanetary conditions that effect the Earth’s magnetosphere, ionosphere, and thermosphere.
Extratropical Storm
A type of low-pressure cyclonic system in the middle and high latitudes (also called- mid-latitude cyclone) that primarily gets its energy from the horizontal temperature contrasts (fronts) that exist in the atmosphere. When associated with cold fronts, extratropical cyclones may be particularly damaging (e.g., European winter/windstorm).
Extreme Temperature
A general term for temperature variations above (extreme heat) or below (extreme cold) normal conditions.
Extreme winter conditions
Damage caused by snow and ice. Winter damage refers to damage to buidlings, infrastructure, traffic (especially navigation) inflicted by snow and ice in the form of snow pressure, freezing rain, frozen waterways, etc.
Fire following Earthquake
Urban fires triggered by earthquakes. Particularly susceptible areas include densely spaced , wooden buildings that dominate local architecture, and where the earthquake has damaged or ruptured water and gas pipelines. Small local fires have the potential to merge into conflagrations destroying many city blocks.
Flash Flood Heavy or excessive rainfall in a short period of time that produce immediate runoff, creating flooding conditions within minutes or a few hours during or after the rainfall.
Flood A general term for the overflow of water from a stream channel onto normally dry land in the floodplain (riverine flooding), higher-than-normal levels along the coast and in lakes or reservoirs (coastal flooding) as well as ponding of water at or near the point where the rain fell (flash floods).
Fog Water droplets that are suspended in the air near the Earth’s surface. Fog is simply a cloud that is in contact with the ground.
Forest Fire A type of wildfire in a wooded area.
Frost, Freeze Frost is the consequence of radiative cooling resulting in the formation of thin ice crystals on the ground or other surfaces in the form of needles, feathers, scales, or fans. Frost occurs when the temperature of surfaces is below freezing and water vapor from humid air forms solid deposits on the cold surface. Freeze occurs when the air temperature is at (32˚F/0˚C) or below over a widespread area for a climatologically significant period of time. Use of the term is usually restricted to advective situations or to occasions when wind or other conditions prevent frost. Frost and freeze are particularly damaging during the crop growing season.
Fungal disease Exposure to fungi either through skin contact, ingestion or inhalation of spores resulting in an unusual increase in the number of incidents. Examples are fungal pneumonia, fungal meningitis, etc.
Geomagnetic Storm
A type of extraterrestrial hazard caused by solar wind shockwaves that temporarily disturb the Earth’s magnetosphere. Geomagnetic storms can disrupt power grids, spacecraft operations, and satellite communications.
Annual Disaster Statistical Review 2013 – The numbers and trends 39
Geophysical hazard
A hazard originating from solid earth. This term is used interchangeably with
the term geological hazard.
Glacial Lake Outburst
A flood that occurs when water dammed by a glacier or moraine is suddenly released. Glacial lakes can be at the front of the glacial (marginal lake) or below the ice sheet (sub-glacial lake).
Ground Movement Surface displacement of earthen materials due to ground shaking triggered by earthquakes or volcanic eruptions
Hail Solid precipitation in the form of irregular pellets or balls of ice more than 5 mm in diameter.
Heat Wave A period of abnormally hot and/or unusually humid weather. Typically a heat wave lasts two or more days. The exact temperature criteria for what constitutes a heat wave vary by location.
Ice Jam Flood The accumulation of floating ice restricting or blocking a river’s flow and drainage. Ice jams tend to develop near river bends and obstructions (e.g., bridges).
Impact A type of extraterrestrial hazard caused by the collision of the Earth with a meteorite.
Insect Infestation The pervasive influx, swarming and/or hatching of insects affecting humans, animals, crops, and perishable goods. Examples are locusts and African Bees.
Lahar Hot or cold mixture of earthen material flowing on the slope of a volcano either during or between volcanic eruptions.
Landslide following Earthquake
Independent of the presence of water, mass movement may also be triggered by earthquakes.
Lava Flow The ejected magma that moves as a liquid mass downslope from a volcano during an eruption.
Lightning A high-voltage, visible electrical discharge produced by a thunderstorm and followed by the sound of thunder.
Liquefaction The transformation of (partially) water-saturated soil from a solid state to a liquid state caused by an earthquake. Liquefaction reduces the strength and stiffness of soil causing buildings to topple over.
Mass Movement Any type of downslope movement of earth materials.
Meteorological hazard
A hazard caused by short-lived, micro- to meso-scale extreme weather and atmospheric conditions that last from minutes to days.
Parasitic Disease Exposure to a parasite – an organism living on or in a host – causes an unusual increase in the number of incidents. Exposure to parasites occurs mostly through contaminated water, food or contact with insects, animals (zoonotic), pets, etc. Examples are malaria, chagas disease, giardiasis and trichinellosis.
Prion Disease A type of biological hazard caused by prion proteins. Prion diseases or transmissible spongiform encephalopathies (TSEs) are a family of rare progressive neurodegenerative disorders that affect both humans and animals characterized by long incubation periods and neural loss. Examples are Bovine Spongiform Encephalophaty (BSE), Creutzfeld-Jakob-Disease (CJD), Kuru, etc.
Pyroclastic Flow Extremely hot gases, ash, and other materials of more than 1,000 degrees Celsius that rapidly flow down the flank of a volcano (more than 700 km/h) during an eruption.
Radio Disturbance Triggered by x-ray emissions from the Sun hitting the Earth’s atmosphere and causing disturbances in the ionosphere such as jamming of high and/or low frequency radio signals. This affects satellite radio communication and Global Position Systems (GPS).
Rain Water vapor condenses in the atmosphere to form water droplets that fall to the Earth.
Riverine Flood A type of flooding resulting from the overflow of water from a stream or river channel onto normally dry land in the floodplain adjacent to the channel.
Rogue Wave An unusual single crest of an ocean wave far out at sea that is much higher and/or steeper than other waves in the prevailing swell system.
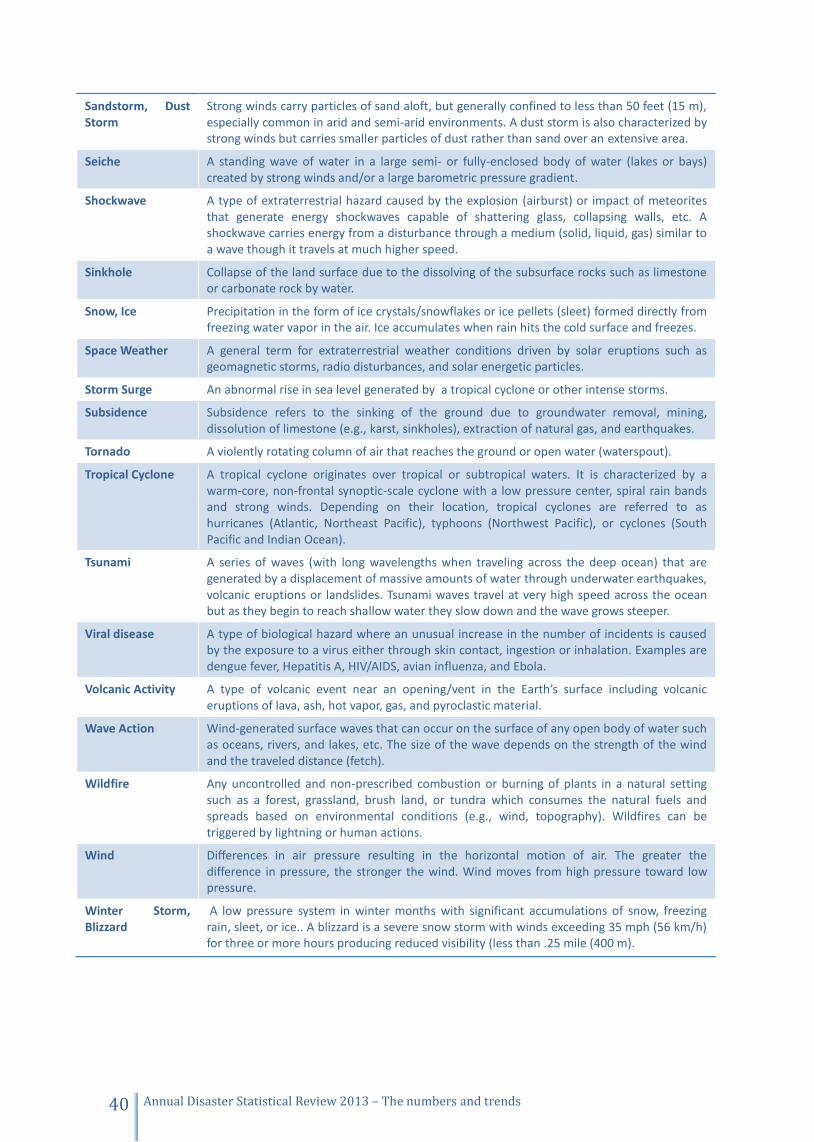
40 Annual Disaster Statistical Review 2013 – The numbers and trends
Sandstorm, Dust Storm
Strong winds carry particles of sand aloft, but generally confined to less than 50 feet (15 m), especially common in arid and semi-arid environments. A dust storm is also characterized by strong winds but carries smaller particles of dust rather than sand over an extensive area.
Seiche A standing wave of water in a large semi- or fully-enclosed body of water (lakes or bays) created by strong winds and/or a large barometric pressure gradient.
Shockwave A type of extraterrestrial hazard caused by the explosion (airburst) or impact of meteorites that generate energy shockwaves capable of shattering glass, collapsing walls, etc. A shockwave carries energy from a disturbance through a medium (solid, liquid, gas) similar to a wave though it travels at much higher speed.
Sinkhole Collapse of the land surface due to the dissolving of the subsurface rocks such as limestone or carbonate rock by water.
Snow, Ice Precipitation in the form of ice crystals/snowflakes or ice pellets (sleet) formed directly from freezing water vapor in the air. Ice accumulates when rain hits the cold surface and freezes.
Space Weather A general term for extraterrestrial weather conditions driven by solar eruptions such as geomagnetic storms, radio disturbances, and solar energetic particles.
Storm Surge An abnormal rise in sea level generated by a tropical cyclone or other intense storms.
Subsidence Subsidence refers to the sinking of the ground due to groundwater removal, mining, dissolution of limestone (e.g., karst, sinkholes), extraction of natural gas, and earthquakes.
Tornado A violently rotating column of air that reaches the ground or open water (waterspout).
Tropical Cyclone A tropical cyclone originates over tropical or subtropical waters. It is characterized by a warm-core, non-frontal synoptic-scale cyclone with a low pressure center, spiral rain bands and strong winds. Depending on their location, tropical cyclones are referred to as hurricanes (Atlantic, Northeast Pacific), typhoons (Northwest Pacific), or cyclones (South Pacific and Indian Ocean).
Tsunami A series of waves (with long wavelengths when traveling across the deep ocean) that are generated by a displacement of massive amounts of water through underwater earthquakes, volcanic eruptions or landslides. Tsunami waves travel at very high speed across the ocean but as they begin to reach shallow water they slow down and the wave grows steeper.
Viral disease A type of biological hazard where an unusual increase in the number of incidents is caused by the exposure to a virus either through skin contact, ingestion or inhalation. Examples are dengue fever, Hepatitis A, HIV/AIDS, avian influenza, and Ebola.
Volcanic Activity A type of volcanic event near an opening/vent in the Earth’s surface including volcanic eruptions of lava, ash, hot vapor, gas, and pyroclastic material.
Wave Action Wind-generated surface waves that can occur on the surface of any open body of water such as oceans, rivers, and lakes, etc. The size of the wave depends on the strength of the wind and the traveled distance (fetch).
Wildfire Any uncontrolled and non-prescribed combustion or burning of plants in a natural setting such as a forest, grassland, brush land, or tundra which consumes the natural fuels and spreads based on environmental conditions (e.g., wind, topography). Wildfires can be triggered by lightning or human actions.
Wind Differences in air pressure resulting in the horizontal motion of air. The greater the difference in pressure, the stronger the wind. Wind moves from high pressure toward low pressure.
Winter Storm, Blizzard
A low pressure system in winter months with significant accumulations of snow, freezing rain, sleet, or ice.. A blizzard is a severe snow storm with winds exceeding 35 mph (56 km/h) for three or more hours producing reduced visibility (less than .25 mile (400 m).
Annual Disaster Statistical Review 2013 – The numbers and trends 41
ANNEX 2: List of countries per continent
AFRICA
Algeria Angola Benin Botswana Burkina Faso Burundi Cameroon Cape Verde Central African Republic Chad Comoros Congo Cote d’Ivoire Democratic Republic of Congo Djibouti Egypt Equatorial Guinea Eritrea Ethiopia Gabon
Gambia Ghana Guinea Guinea-Bissau Kenya Lesotho Liberia Libyan Arab Jamahiriya Madagascar Malawi Mali Mauritania Mauritius Mayotte Morocco Mozambique Namibia Niger Nigeria Reunion
Rwanda Sao Tome and Principe Senegal Seychelles Sierra Leone Somalia South Africa South Sudan St. Helena Sudan Swaziland Togo Tunisia Uganda United Republic of Tanzania Western Sahara Zambia Zimbabwe
AMERICAS Anguilla Antigua and Barbuda Argentina Aruba Bahamas Barbados Belize Bermuda Bolivia Brazil British Virgin Islands Canada Cayman Islands Chile Colombia Costa Rica Cuba Dominica
Dominican Republic Ecuador El Salvador Falkland Islands (Malvinas) French Guiana Greenland Grenada Guadeloupe Guatemala Guyana Haiti Honduras Jamaica Martinique Mexico Montserrat Netherlands Antilles Nicaragua
Panama Paraguay Peru Puerto Rico St. Barthélemy St. Kitts and Nevis St. Lucia St. Martin (French part) St. Pierre and Miquelon St. Vincent and the Grenadines Suriname Trinidad and Tobago Turks and Caicos Islands Uruguay Venezuela United States of America United States Virgin Islands
42 Annual Disaster Statistical Review 2012 – The numbers and trends
ASIA Afghanistan Armenia Azerbaijan Bahrain Bangladesh Bhutan Brunei Darussalam Cambodia China Cyprus Georgia Hong Kong (China) India Indonesia Iran Iraq Israel Japan
Jordan Kazakhstan Korea (Dem Rep) Korea (Rep) Kuwait Kyrgyzstan Laos Lebanon Macau (China) Malaysia Maldives Mongolia Myanmar Nepal Palestine (West Bank) Oman Pakistan Philippines
Qatar Saudi Arabia Singapore Sri Lanka Syrian Arab Republic Taiwan (China) Tajikistan Thailand Timor-Leste Turkey Turkmenistan United Arab Emirates Uzbekistan Viet Nam Yemen
EUROPE Aland Islands Albania Andorra Austria Belarus Belgium Bosnia and Herzegovina Bulgaria Channel Islands Croatia Czech Republic Denmark Estonia Faroe Islands Finland France Germany Gibraltar
Greece Guernsey Holy See Hungary Iceland Ireland Italy Jersey Latvia Liechtenstein Lithuania Luxembourg Macedonia, FYR Malta Man, Isle of Moldova Monaco Montenegro
Netherlands Norway Poland Portugal Romania Russian Federation San Marino Serbia Slovakia Slovenia Spain Svalbard & Jan Mayen Islands Sweden Switzerland Ukraine United Kingdom
Annual Disaster Statistical Review 2013 – The numbers and trends 43
OCEANIA American Samoa Australia Cook Islands Federated States of Micronesia Fiji French Polynesia Guam Kiribati Marshall Islands
Nauru New Caledonia New Zealand Niue Norfolk Island Northern Mariana Islands Palau Papua New Guinea Pitcairn
Samoa Solomon Islands Tokelau Tonga Tuvalu Vanuatu Wallis and Futuna

44 Annual Disaster Statistical Review 2012 – The numbers and trends

Centre for Research on the Epidemiology of Disasters (CRED) Institute of Health and Society (IRSS) Université catholique de Louvain
Clos Chapelle-aux-Champs, 30 - B1.30.15 1200 Brussels –Belgium Phone: +32 (0)2.764.33.27 Fax: +32 (0)2.764.34.41 E-mail: [email protected] URL: www.cred.be
Copyright © 2015
The EM-DAT project gratefully acknowledges support from USAID/OFDA