Annual Data Miner Survey
48
© 2010 Rexer Analytics 3 rd Annual Data Miner Survey – 2009 Survey Summary Report – For more information, please contact: Karl Rexer, PhD [email protected] www.RexerAnalytics.com
description
Transcript of Annual Data Miner Survey
© 2010 Rexer Analytics
3rd Annual Data Miner Survey – 2009 Survey Summary Report –
For more information, please contact: Karl Rexer, PhD [email protected] www.RexerAnalytics.com

© 2010 Rexer Analytics 2
Overview
Executive Summary
Methodology
Data Mining Practices & Perspectives
Data Mining Software
Organizational Applications of Data Mining
Appendix:
• Data Miner Demographics • Data Miner Training

© 2010 Rexer Analytics
Executive Summary

© 2010 Rexer Analytics 4
Executive Summary
• Data miners’ most commonly used algorithms are regression, decision trees, and cluster analysis.
• Data mining is playing an important role in organizations. Half of data miners say their results are helping to drive strategic decisions and operational processes.
58% say they are adding to the knowledge base in the field.
60% of respondents say the results of their modeling are deployed always or most of the time.
• Most data miners feel that the economy will not negatively impact them.
• Almost half of industry data miners rate the analytic capabilities of their company as above average or excellent. But 19% feel their company has minimal or no analytic capabilities.
• The top challenges facing data miners are dirty data, explaining data mining to others, and difficult access to data. However, in 2009 fewer data miners listed data quality and data access as challenges than in the previous year.
• SPSS Clementine (IBM Modeler), Statistica, and SPSS (IBM Statistics) are identified as the “primary tools” used by the most data miners.
Open-source tools Weka and R made substantial movement up data miner’s tool rankings this year, and are now used by large numbers of both academic and for-profit data miners.
SAS Enterprise Miner dropped in data miner’s tool rankings this year.
• Fields & Industries: Data mining is everywhere. The most sited areas are CRM / Marketing, Academic, Financial Services, & IT / Telecom.
• Data mining functions are most often found in Marketing & Sales departments and Research & Development departments.
© 2010 Rexer Analytics
Methodology

© 2010 Rexer Analytics 6
Method The third annual data miner survey was conducted on-line in early 2009.
The 40 questions drew heavily on the 2007 and 2008 data miner surveys. Suggestions and feedback from 2008 respondents also contributed to question modification and the design of several new questions. The 2009 survey questions assessed:
• Demographics of data miners
• Algorithms and software packages used
• Computing environments, types of data, and data quality
• Data mining results, deployment, and success measurement
• Challenges data miners face and current trends in data mining
Snowball method: • Direct contacts are requested to forward survey links to others
• Initial contacts: Postings on newsgroups (e.g., KDnuggets), user groups, and blogs E-mailed the organizers of several data-mining conferences E-mailed data mining software vendors E-mailed the authors’ professional networks
• Approximately 24% of respondents were snowballed (referred by others)
Completed surveys: • 710 completed surveys were collected in 2009. 181 participants were employed by data mining software
vendors and their data was analyzed separately -- it does not appear in this report. Thus, the remaining 2009 sample represents 529 data miners.
• The 2008 sample reported in this deck was comprised of 265 data miners not employed by software vendors.
Academics (137)
Industry & Consulting
(392)
Tool Vendors (181)
© 2010 Rexer Analytics 7
Year Over Year Comparisons
• The charts in this report summarize the responses of all academic and for-profit 2009 respondents (N=529, once data mining software vendors are removed).
Note: Again this year we saw remarkably similar results when we analyzed the data with and without the tool vendors. However, since tool vendors may have biases in their responses to some questions, we have chosen to again present only the tool-vendor free analyses in the annual summary report.
• The overwhelming response we received to the data miner survey this year included a greater proportion of Academic respondents as compared to prior years (academics comprised 24% of the 529 non-tool-vendor respondents in 2009 vs. 16% of the 265 non-tool-vendor respondents in 2008).
• Data miners in academia and the for-profit sector have somewhat different priorities, concerns and experiences.
• The best available groups for year-to-year comparisons are the for-profit respondents from 2008 and 2009.
• Significant year-to-year differences (for these for-profit respondents) are noted where relevant in this report.
© 2010 Rexer Analytics
Data Mining Practices & Perspectives

© 2010 Rexer Analytics 9
Fields Applying Data Mining
• As in the 2007 and 2008 surveys, CRM/Marketing, Academic, and Financial are the most commonly reported fields.
• Many data miners work in several fields.
Question: In what fields do you TYPICALLY apply data mining? (Select all that apply)

© 2010 Rexer Analytics 10
Data Mining Algorithms • Decision trees, regression, and cluster analysis continue to form a triad of core
algorithms for most data miners (consistent across 2007, 2008, and 2009).
• However, a wide variety of algorithms are being used.
2008 vs. 2009
Use of decision trees, time series, and survival analysis have all decreased this year (among non-academic responders).
Question: What algorithms/analytic methods do you TYPICALLY use? (Select all that apply)

© 2010 Rexer Analytics 11
How Data Mining Results are Used
• Data miners feel positive about the role data mining is playing in their organizations.
• 58% report their data mining results are adding to the knowledge base in the field.
• About half indicate that their data mining is driving strategic decisions or operational processes.
Question: How are the results of your data mining projects typically used? (Select all that apply)
Adds to knowledge base in field
Drives strategic decisions
Drives operational processes
Algorithms are deployed via batch scoring in a database or data warehouse
Drives product or service creation/ development/ improvement
Algorithms are deployed in an interactive environment that uses real-time information
Algorithms are incorporated into a software project
Other

© 2010 Rexer Analytics 12
Challenges Facing Data Miners
• The top challenges facing data miners in 2009 are dirty data, explaining data mining to others, and difficult access to data.
• However, we see some reason for hope: Several of these challenges are reported by fewer data miners this year.
2008 vs. 2009
Difficulties with dirty data, difficult access to data, and finding qualified data miners have all decreased this year (among non-academic responders).
Question: What challenges do data miners in your organization TYPICALLY face? (Select all that apply)

© 2010 Rexer Analytics 13
Computing Environments
• Data Mining most often occurs on a desktop or laptop computer.
• Very few data miners report working in a cloud computing environment.
Data miners report that data mining occurs in a variety of computing environments at their organizations.
Question: What are the computing environments/platforms on which data mining/analytics occurs at your company/organization? (Check all that apply)
In the 2010 survey we will probe further to see if the data mining is being processed locally on these desktops and laptops.

© 2010 Rexer Analytics 14
The Size of Datasets Mined
• There is a wide range in the size of datasets typically analyzed.
• About a third of respondents report that their datasets typically have over a million records.
Question: What size data sets did you typically data mine in 2008?

© 2010 Rexer Analytics 15
Frequency of Result Deployment
• 60% of data miners report that the results of their analytics are deployed or utilized “always” or “most of the time”.
• Less than one in ten reported that this occurred “rarely” or “never”.
Question: How often are the results of your analytics deployed and/or utilized?

© 2010 Rexer Analytics 16
Concerns About Current Use of Data Mining
• Top concerns include insufficient training and resistance to data mining.
• Only two in ten respondents feel concerned that data mining is being used to breach individual privacy.
2008 vs. 2009
Concerns about model refresh frequency decreased this year (among non-academic responders).
Question: What are your greatest concerns with the way that data mining is currently being utilized in the world at large? (Check all that apply)

© 2010 Rexer Analytics 17
Data Mining and the Economy
• 40% feel that the number of data mining projects their company conducts will increase even if the economic slump continues.
• 32% feel that in a continuing economic slump the number of data mining projects at their company will stay the same.
Most data miners don’t feel the economic slump will impact them.
Questions:
How do you think the current economy, should it continue to struggle, will affect the number of data mining projects your organization will conduct in 2009 as compared to what has been typical in the past few years?
Has your company moved any data mining or other analytics to another country to take advantage of lower wages in the destination country?
N = 243
Off-shoring: On a related note, only 8% of data miners report that their company has moved any data mining or analytics to another country to take advantage of lower wages.

© 2010 Rexer Analytics
Data Mining Software

© 2010 Rexer Analytics 19
Data Mining Software (page 1 of 2) • The primary software used by the most data miners: SPSS Clementine, Statistica, and SPSS. • Software used by the most data miners: SPSS, R, and SAS. • See following page for more software findings.
Products are listed in descending order
based on the overall percent of data
miners who identify it as their primary
package.
Questions:
What Data mining/analytic tools did you use in 2008? (rate each as “never”, “occasionally”, or “frequently”)
What one Data Mining software package do you use most frequently?

© 2010 Rexer Analytics 20
Data Mining Software (page 2 of 2)
• Overall, for the third year in a row, SPSS Clementine (IBM SPSS Modeler) is identified as the primary software package used by more data miners than any other software package.
• Statistica, Weka, and SPSS (IBM SPSS Statistics) are the primary software packages selected by data miners in academia.
• Clementine, Statistica, and SAS the primary software packages selected by data miners in industry.
Primary software:
• Overall, for the third year in a row, more data miners report using SPSS (IBM SPSS Statistics) than any other software package.
• SPSS, Matlab, and R have the highest penetration among data miners in academia. • SPSS, SAS, and R have the highest penetration among data miners in industry.
Most widely used software:
• Weka, SPSS, and R are ranked higher this year in data miners’ choice of primary package. R also climbed in the rankings of the most used software.
• SAS and SAS Enterprise Miner ranked lower this year in data miners’ choice of primary package. SAS Enterprise Miner and SPSS Clementine dropped in the rankings of the most used software.
Trends:
© 2010 Rexer Analytics 21
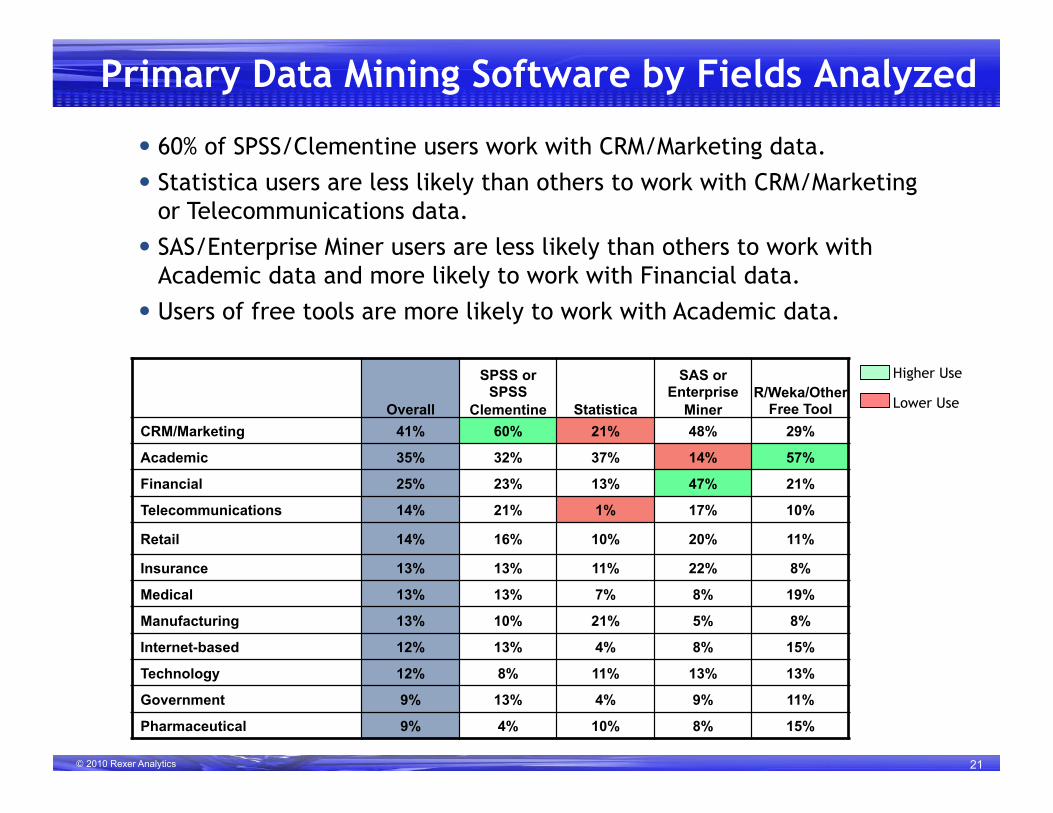
Primary Data Mining Software by Fields Analyzed
• 60% of SPSS/Clementine users work with CRM/Marketing data. • Statistica users are less likely than others to work with CRM/Marketing
or Telecommunications data. • SAS/Enterprise Miner users are less likely than others to work with
Academic data and more likely to work with Financial data. • Users of free tools are more likely to work with Academic data.
Overall
SPSS or SPSS
Clementine Statistica
SAS or Enterprise
Miner R/Weka/Other
Free Tool CRM/Marketing 41% 60% 21% 48% 29%
Academic 35% 32% 37% 14% 57%
Financial 25% 23% 13% 47% 21%
Telecommunications 14% 21% 1% 17% 10%
Retail 14% 16% 10% 20% 11%
Insurance 13% 13% 11% 22% 8%
Medical 13% 13% 7% 8% 19%
Manufacturing 13% 10% 21% 5% 8%
Internet-based 12% 13% 4% 8% 15%
Technology 12% 8% 11% 13% 13%
Government 9% 13% 4% 9% 11%
Pharmaceutical 9% 4% 10% 8% 15%
Higher Use
Lower Use

© 2010 Rexer Analytics 22
Satisfaction by Primary Package • Overall, 86% of data miners are satisfied and 40% are extremely satisfied
with their primary data mining package.
• Satisfaction is highest for SPSS Clementine, Statistica, and Rapid Miner.
• Satisfaction is significantly lower among users of the base SAS and SPSS products.
Question: Please rate your overall satisfaction with your primary Data Mining software package.
Note: Only packages identified as primary by more than 20 respondents are included in this chart.

© 2010 Rexer Analytics 23
Likelihood to Continue Using Primary Package • Overall, 84% of data miners are likely to continue using their primary
package for the next 3 years. 53% are extremely likely to continue. • 80% of data miners who identify Rapid Miner as their primary product, report
they are extremely likely to continue using it for the next 3 years. • Only 42% of data miners who identify SAS as their primary product are
extremely likely to continue using it as their primary package.
Question: What is the likelihood that you will continue to use this tool as your primary Data Mining software package over the next 3 years?
Note: Only packages identified as primary by more than 20 respondents are included in this chart.
© 2010 Rexer Analytics 24
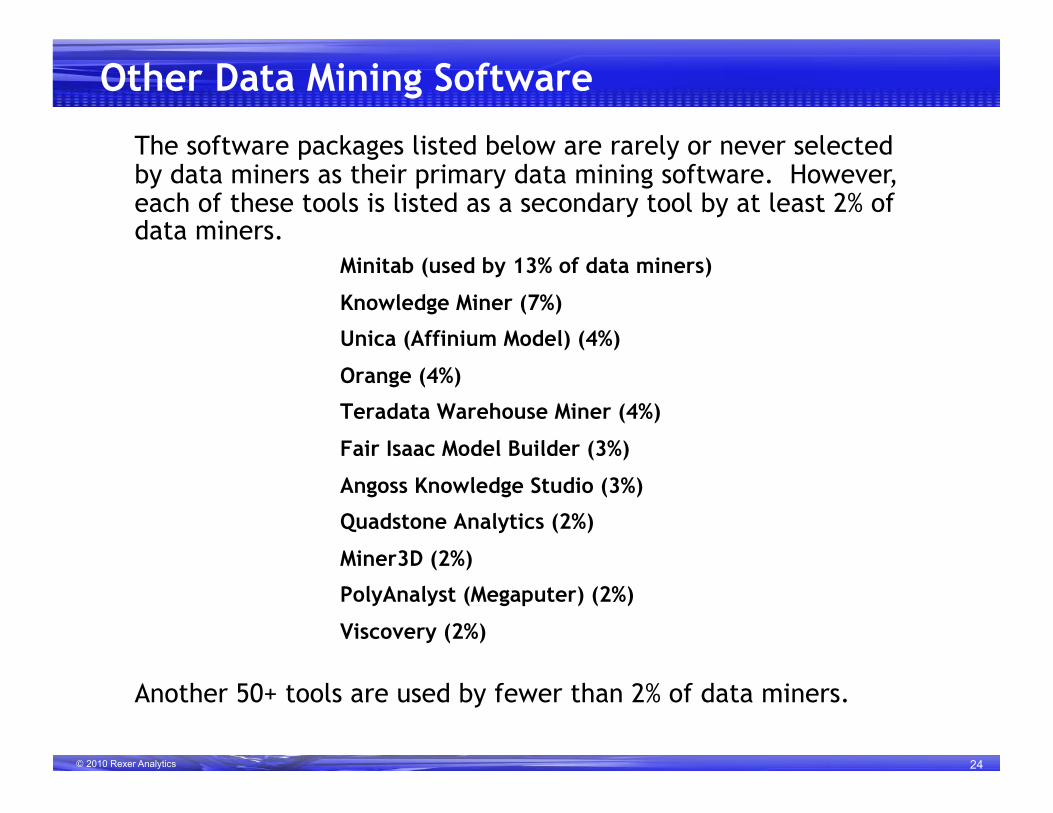
Other Data Mining Software
Minitab (used by 13% of data miners)
Knowledge Miner (7%)
Unica (Affinium Model) (4%)
Orange (4%)
Teradata Warehouse Miner (4%)
Fair Isaac Model Builder (3%)
Angoss Knowledge Studio (3%)
Quadstone Analytics (2%)
Miner3D (2%)
PolyAnalyst (Megaputer) (2%)
Viscovery (2%)
The software packages listed below are rarely or never selected by data miners as their primary data mining software. However, each of these tools is listed as a secondary tool by at least 2% of data miners.
Another 50+ tools are used by fewer than 2% of data miners.
© 2010 Rexer Analytics 25
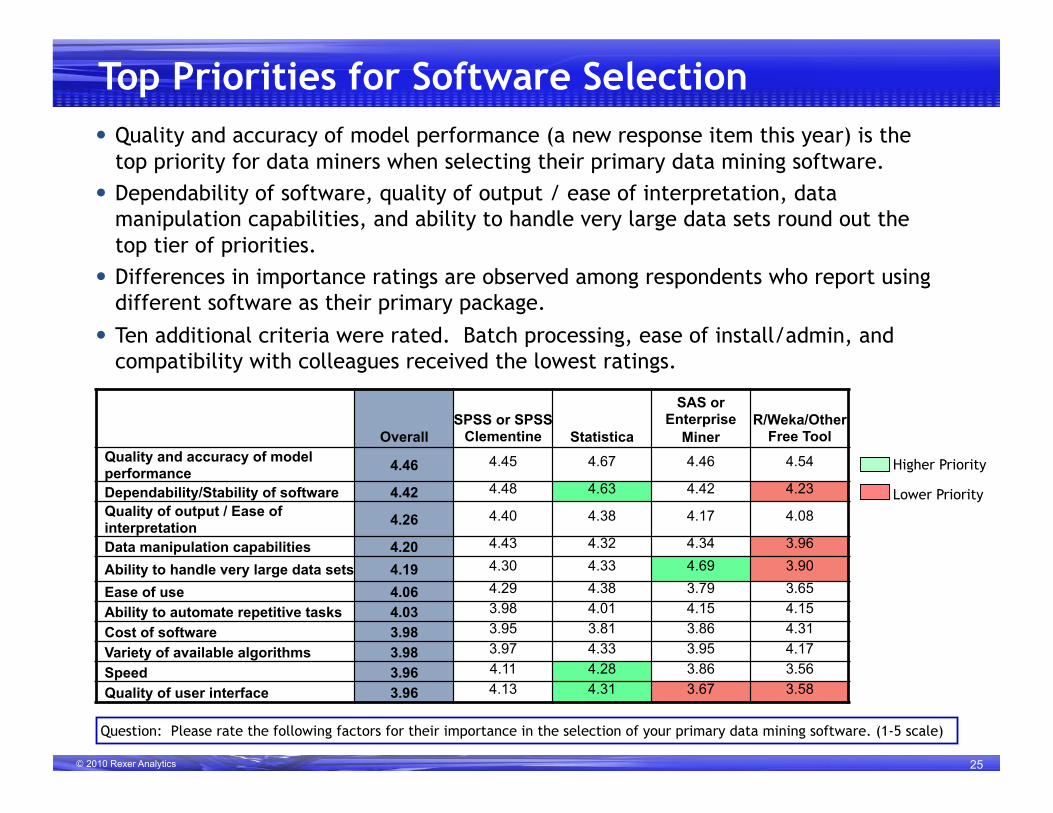
Top Priorities for Software Selection • Quality and accuracy of model performance (a new response item this year) is the
top priority for data miners when selecting their primary data mining software. • Dependability of software, quality of output / ease of interpretation, data
manipulation capabilities, and ability to handle very large data sets round out the top tier of priorities.
• Differences in importance ratings are observed among respondents who report using different software as their primary package.
• Ten additional criteria were rated. Batch processing, ease of install/admin, and compatibility with colleagues received the lowest ratings.
Overall SPSS or SPSS
Clementine Statistica
SAS or Enterprise
Miner R/Weka/Other
Free Tool Quality and accuracy of model performance 4.46 4.45 4.67 4.46 4.54
Dependability/Stability of software 4.42 4.48 4.63 4.42 4.23 Quality of output / Ease of interpretation 4.26 4.40 4.38 4.17 4.08
Data manipulation capabilities 4.20 4.43 4.32 4.34 3.96
Ability to handle very large data sets 4.19 4.30 4.33 4.69 3.90
Ease of use 4.06 4.29 4.38 3.79 3.65
Ability to automate repetitive tasks 4.03 3.98 4.01 4.15 4.15
Cost of software 3.98 3.95 3.81 3.86 4.31
Variety of available algorithms 3.98 3.97 4.33 3.95 4.17
Speed 3.96 4.11 4.28 3.86 3.56
Quality of user interface 3.96 4.13 4.31 3.67 3.58
Higher Priority
Lower Priority
Question: Please rate the following factors for their importance in the selection of your primary data mining software. (1-5 scale)

© 2010 Rexer Analytics 26
Trends in Software Selection Priorities
• Data miners are placing more importance on the quality of the user interface this year than they did in 2008.
• Data miners are also placing less importance this year on the dependability/stability of their software package and less importance on a package’s ability to handle very large datasets.
2009 2008 Significant Change
Quality and accuracy of model performance 4.27 NA
Dependability/Stability of software 4.16 4.45
Quality of output / Ease of interpretation 4.10 4.12
Data manipulation capabilities 4.17 4.20
Ability to handle very large data sets 4.11 4.43
Ease of use 4.17 3.99
Ability to automate repetitive tasks 4.03 4.11
Cost of software 3.65 3.74
Variety of available algorithms 4.12 3.94
Speed 4.08 4.07
Quality of user interface 4.06 3.57
Note: Academic Respondents have been removed for the purposes of this comparison. 2009 data shown here will not match that seen on previous pages.

© 2010 Rexer Analytics 27
Satisfaction with Primary Package (page 1 of 2)
• Quality and accuracy of model performance, and dependability/stability of the software are the software characteristics that data miners are most satisfied with.
Scale: 1 = “Very Dissatisfied” to 5 = “Very Satisfied”
Question: Now we would like you rate how satisfied you are with the performance of your primary data mining package (identified in the last question) on each of these factors.

© 2010 Rexer Analytics 28
Satisfaction with Primary Package (page 2 of 2)
• Data miners are least satisfied with the cost of their software and the quality of manuals and documentation.
Scale: 1 = “Very Dissatisfied” to 5 = “Very Satisfied”
© 2010 Rexer Analytics
Organizational Applications of Data Mining
© 2010 Rexer Analytics 30
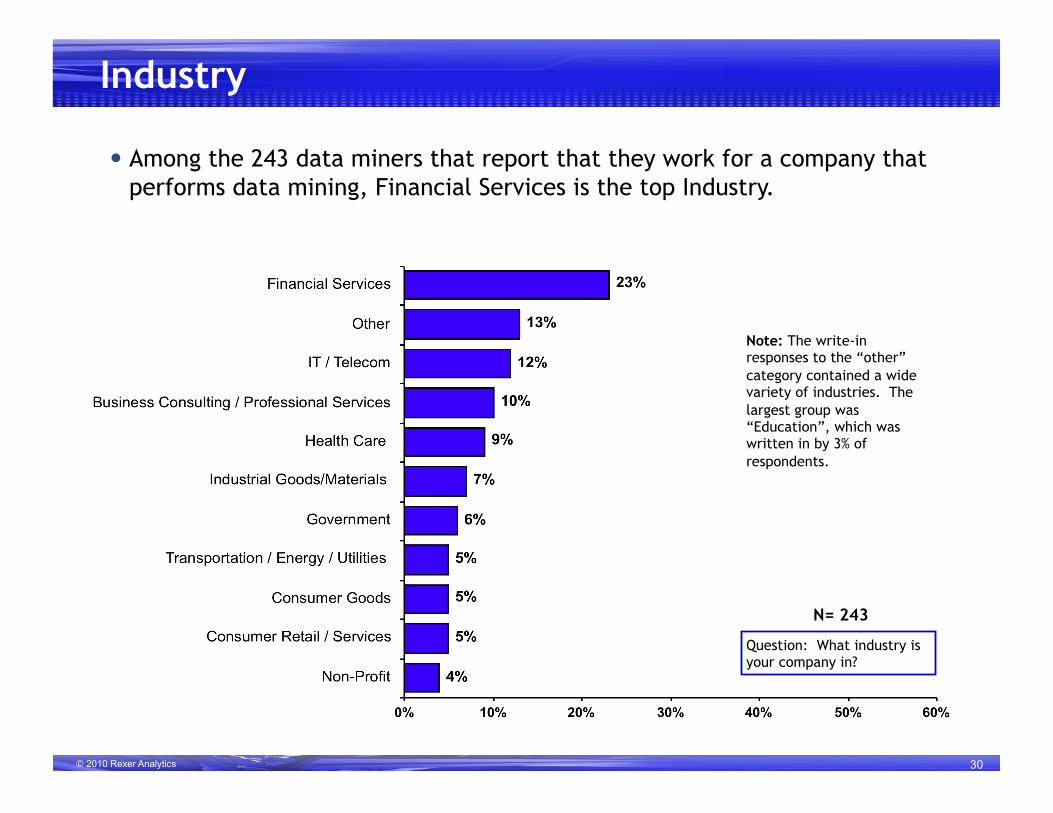
Industry
• Among the 243 data miners that report that they work for a company that performs data mining, Financial Services is the top Industry.
N= 243
Question: What industry is your company in?
Note: The write-in responses to the “other” category contained a wide variety of industries. The largest group was “Education”, which was written in by 3% of respondents.
© 2010 Rexer Analytics 31
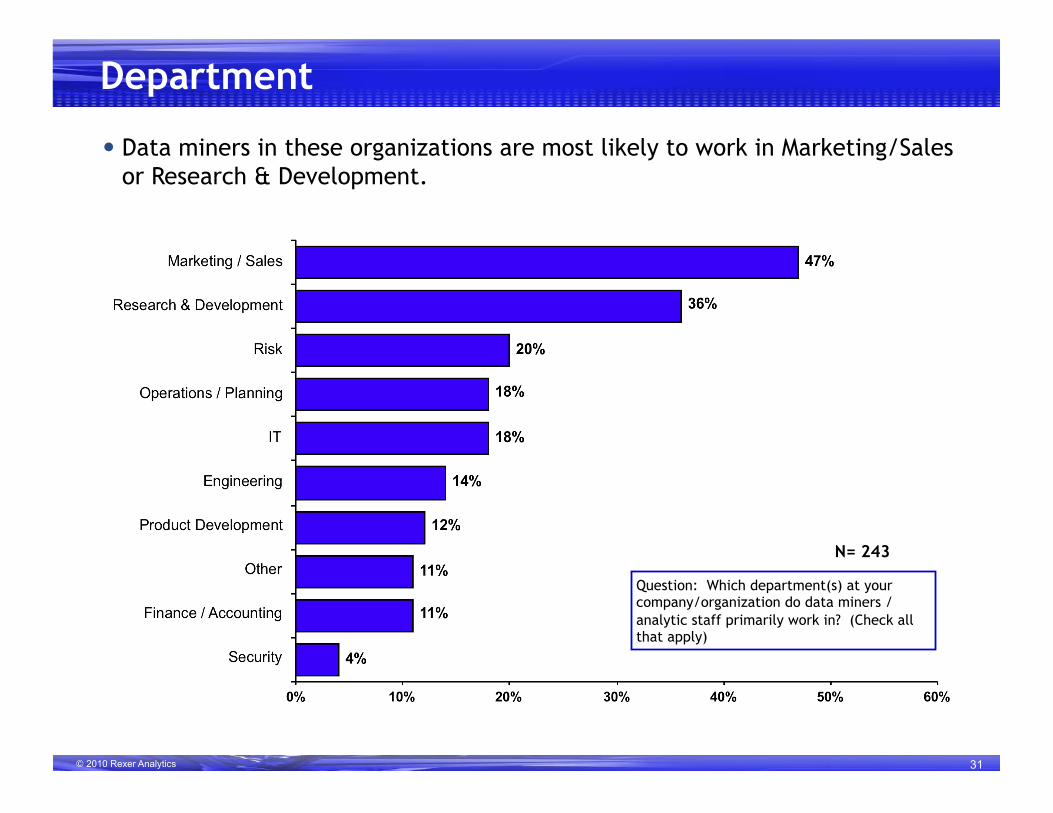
Department
• Data miners in these organizations are most likely to work in Marketing/Sales or Research & Development.
N= 243
Question: Which department(s) at your company/organization do data miners / analytic staff primarily work in? (Check all that apply)
© 2010 Rexer Analytics 32
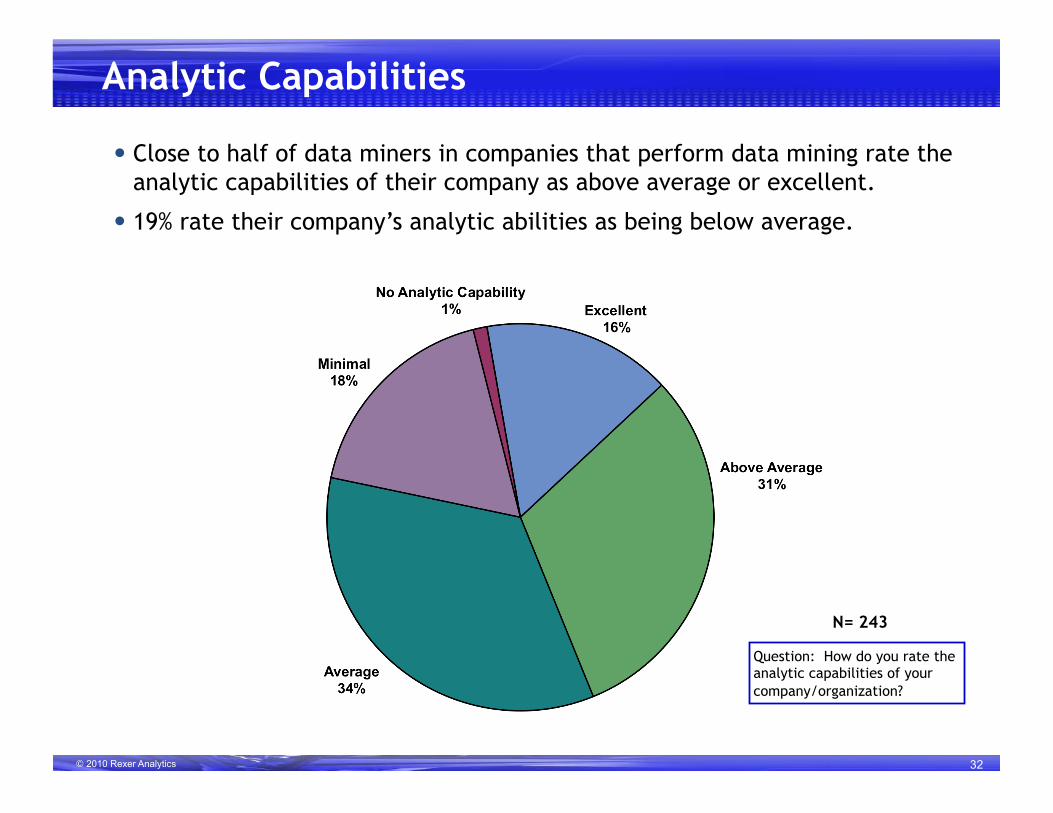
Analytic Capabilities
• Close to half of data miners in companies that perform data mining rate the analytic capabilities of their company as above average or excellent.
• 19% rate their company’s analytic abilities as being below average.
N= 243
Question: How do you rate the analytic capabilities of your company/organization?

© 2010 Rexer Analytics 33
Analytic Capabilities by Industry • Respondents’ assessment of their company’s analytic capabilities varies by
industry.
• Those in business consulting/professional services are most positive about their company’s capabilities, while those in health care are least positive.
N= 158
Note: Only Industries represented by more than 20 respondents were included in this analysis

© 2010 Rexer Analytics 34
Data Quality
• Close to half of these data miners rate the quality of data available to them as strong or very strong, while few consider it poor.
• There are no significant differences in assessment of data quality by industry.
N= 243
Question: How do you rate the quality of data available for analysis at your company/organization?
© 2010 Rexer Analytics 35
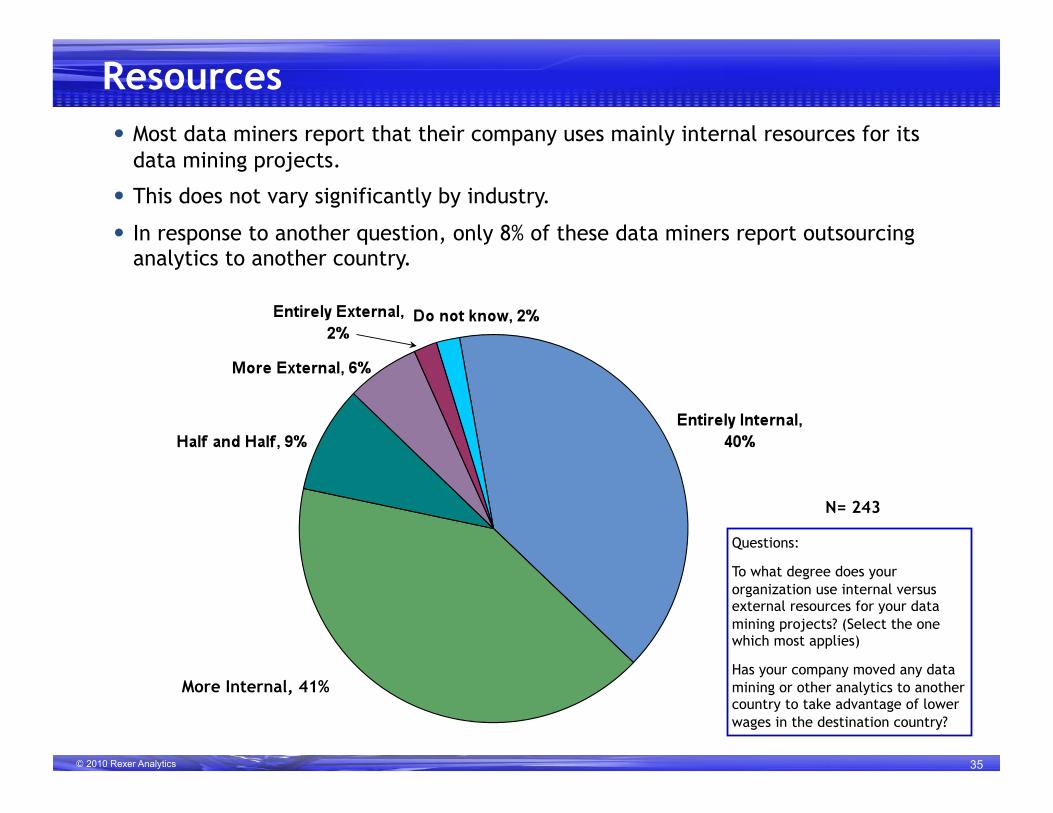
Resources • Most data miners report that their company uses mainly internal resources for its
data mining projects.
• This does not vary significantly by industry.
• In response to another question, only 8% of these data miners report outsourcing analytics to another country.
More Internal, 41%
N= 243
Questions:
To what degree does your organization use internal versus external resources for your data mining projects? (Select the one which most applies)
Has your company moved any data mining or other analytics to another country to take advantage of lower wages in the destination country?

© 2010 Rexer Analytics 36
Measuring Success
• More than half of these data miners report measuring the success of their projects using good model performance.
• About half list improved efficiency and new business insights as their success metrics.
N= 243
Question: How do you typically measure success of your analytic projects? (Check all that apply)

© 2010 Rexer Analytics
Appendix: Data Miner Demographics

© 2010 Rexer Analytics 38
Location of Respondents
710 respondents from 58 countries completed the 2009 data miner survey.
181 respondents were employed by data mining software vendors. Their results were analyzed separately (see pages 6 & 7 for more information).
All analyses in this report focused on the remaining 529 respondents. They represented 52 countries:
• 51% United States • 5% Germany • 3% Australia • 3% Poland • 3% France • 3% Canada • 3% Turkey • 36% 45 Other Countries
While many efforts were taken to obtain a truly global sample of data miners, the authors reside in the the United States and their networks are stronger there. Survey awareness and participation rates are therefore probably higher in the United States.

© 2010 Rexer Analytics 39
Company Size
• Most data miners are employed at medium to large companies.
Number of Employees
Question: Please estimate the number of employees in your company/organization.

© 2010 Rexer Analytics 40
Employees Involved in Analytics
• Close to two thirds of data miners report that their organization has 10 or fewer employees directly involved in data mining or other analytic functions.
Number of Employees involved in Analytics
Question: Please estimate the number of employees in your company / organization that are directly involved in data mining or analytic functions.

© 2010 Rexer Analytics 41
Personal Involvement in Data Mining
• Almost half of respondents spend much or most of their time personally conducting data mining.
• 15% spend little or no time directly conducting data mining.
Question: About how much of your typical work week is spent personally conducting data mining (i.e., using an analytic tool)?
© 2010 Rexer Analytics 42
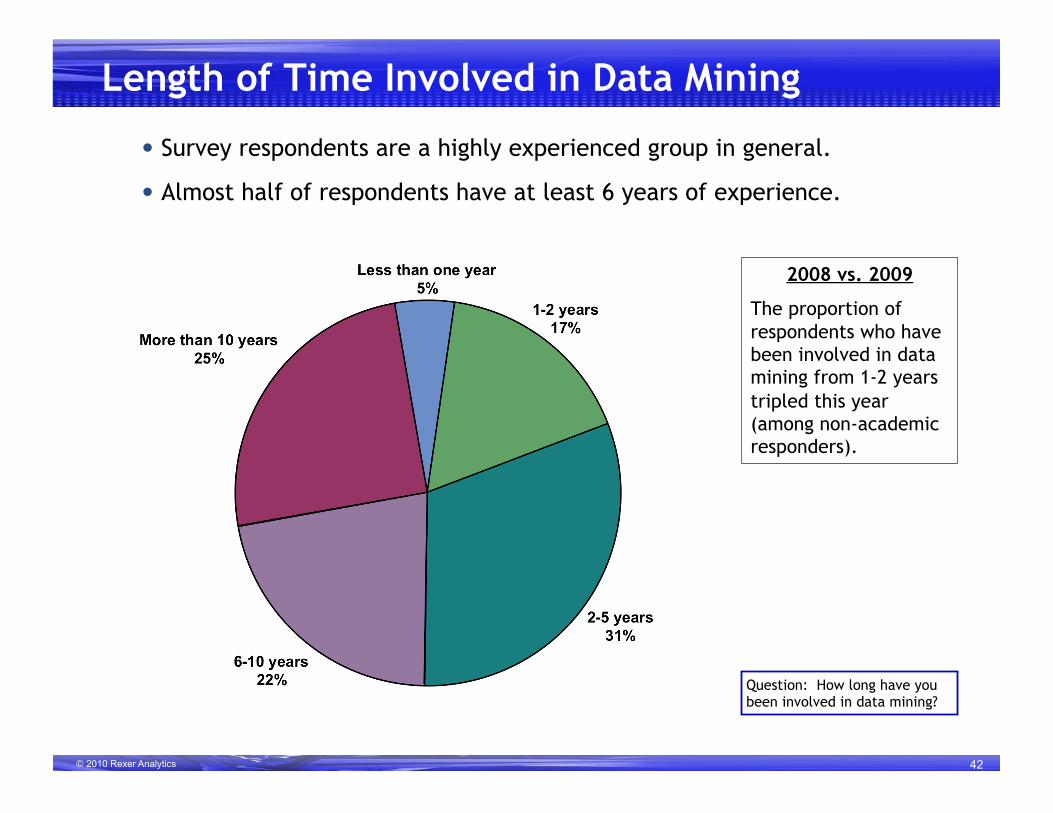
Length of Time Involved in Data Mining
• Survey respondents are a highly experienced group in general.
• Almost half of respondents have at least 6 years of experience.
2008 vs. 2009
The proportion of respondents who have been involved in data mining from 1-2 years tripled this year (among non-academic responders).
Question: How long have you been involved in data mining?
© 2010 Rexer Analytics 43
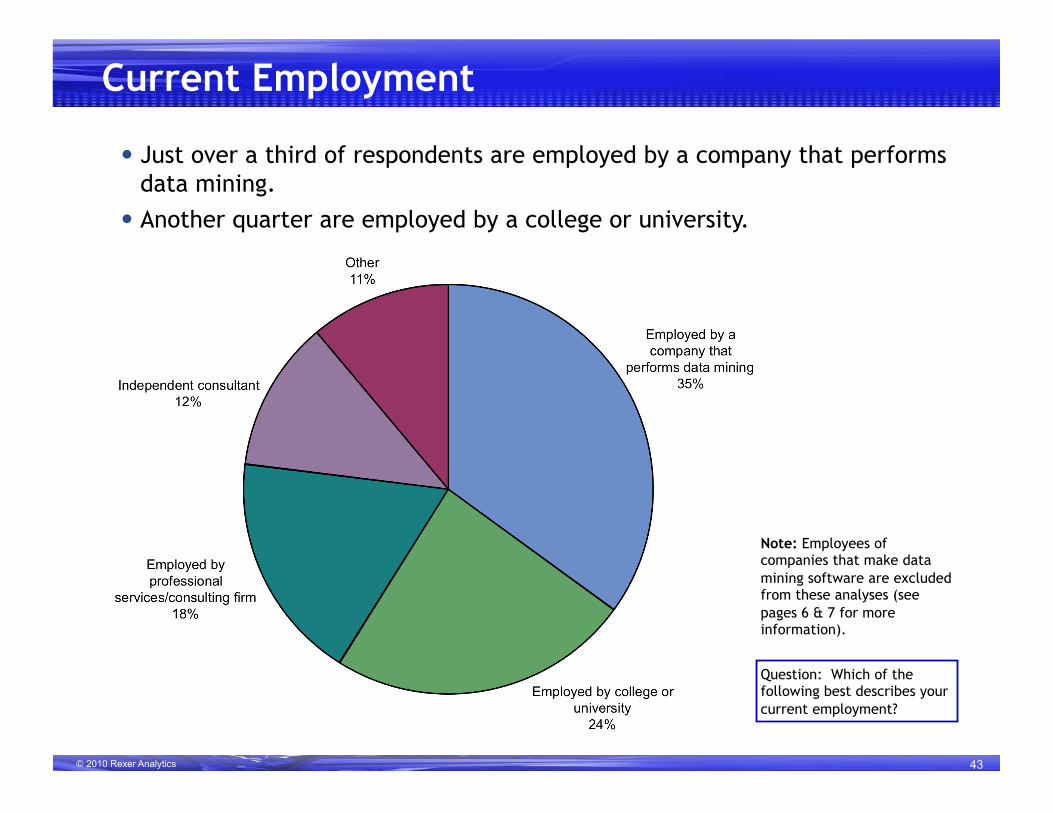
Current Employment
• Just over a third of respondents are employed by a company that performs data mining.
• Another quarter are employed by a college or university.
Question: Which of the following best describes your current employment?
Note: Employees of companies that make data mining software are excluded from these analyses (see pages 6 & 7 for more information).
© 2010 Rexer Analytics
Appendix: Data Miner Training
© 2010 Rexer Analytics 45
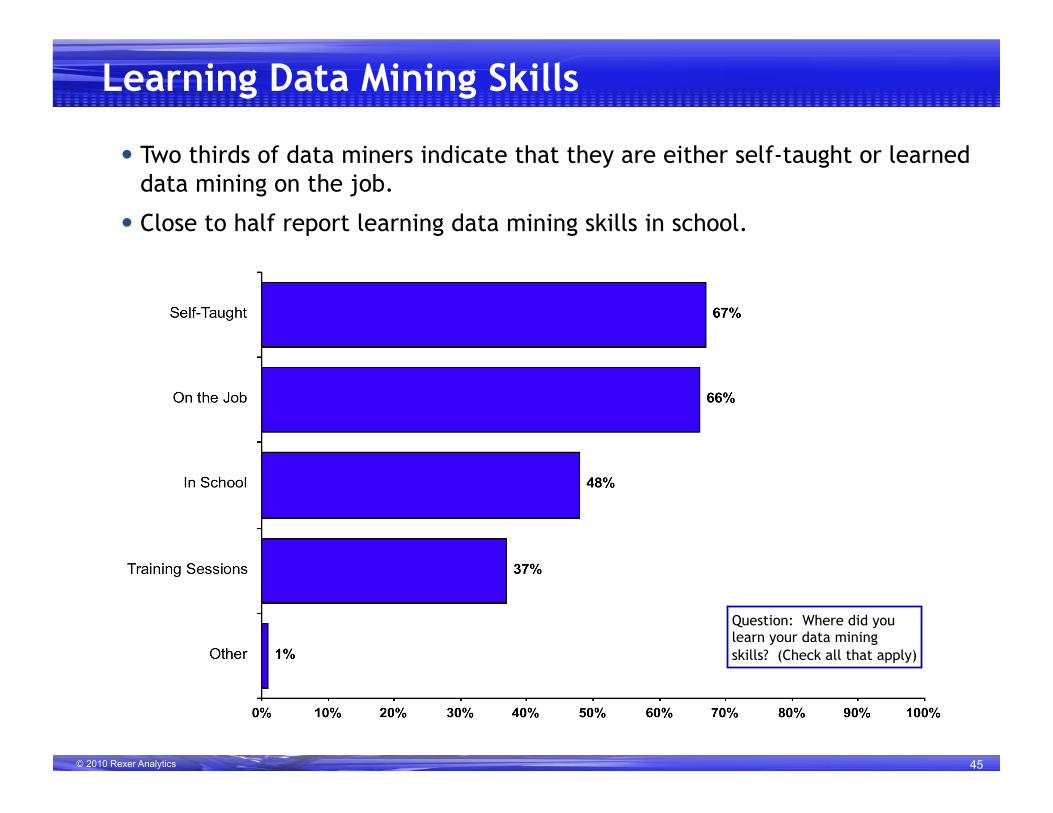
Learning Data Mining Skills
• Two thirds of data miners indicate that they are either self-taught or learned data mining on the job.
• Close to half report learning data mining skills in school.
Question: Where did you learn your data mining skills? (Check all that apply)
© 2010 Rexer Analytics 46
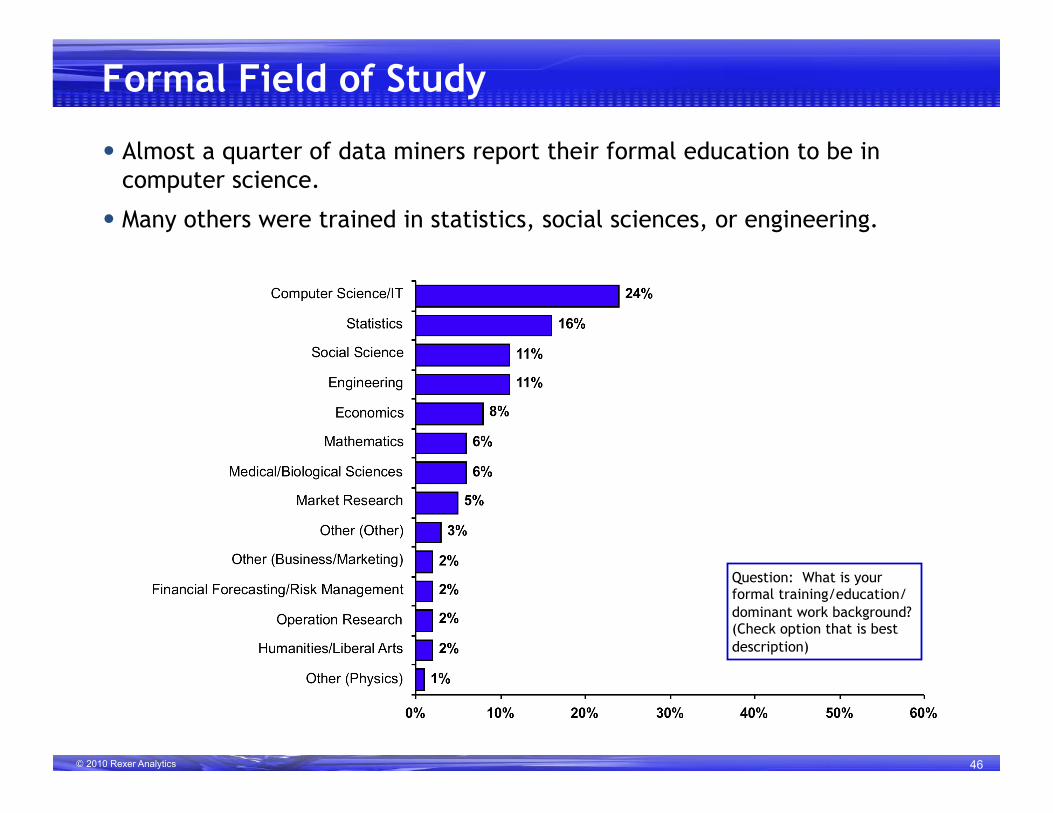
Formal Field of Study
• Almost a quarter of data miners report their formal education to be in computer science.
• Many others were trained in statistics, social sciences, or engineering.
Question: What is your formal training/education/dominant work background? (Check option that is best description)
© 2010 Rexer Analytics 47
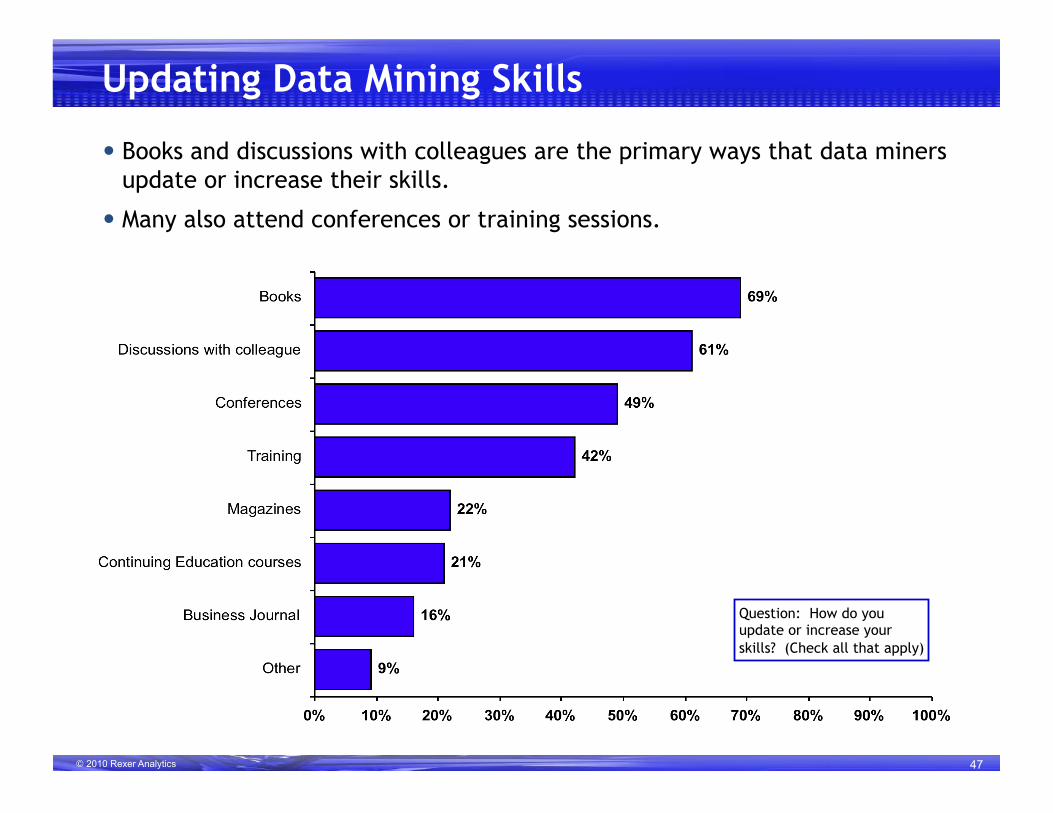
Updating Data Mining Skills
• Books and discussions with colleagues are the primary ways that data miners update or increase their skills.
• Many also attend conferences or training sessions.
Question: How do you update or increase your skills? (Check all that apply)

© 2010 Rexer Analytics 48
Karl Rexer, PhD [email protected] 617-233-8185
Rexer Analytics 30 Vine Street Winchester, MA 01890 USA
www.RexerAnalytics.com
For more information contact: