Annual Business Plan, Budget 2018 2027 Long Term ... Structure and Policy ..... 15 7.1 What are...
34
2017/2018 Annual Business Plan, Budget and 2018‐2027 Long Term Financial Plan
Transcript of Annual Business Plan, Budget 2018 2027 Long Term ... Structure and Policy ..... 15 7.1 What are...
2017/2018 Annual Business Plan, Budget
and
2018‐2027 Long Term Financial Plan

Contents
1. Preamble ................................................................................................................................................... 1
2. Message from the Mayor and Chief Executive Officer ............................................................................. 2
3. Budget Snapshot ....................................................................................................................................... 3
4. Significant Budget Influences and Priorities .............................................................................................. 5
5. 2017/2018 Recurrent and Project Budgets ............................................................................................... 6
5.1 Sources of Council Revenue ............................................................................................................... 7
5.2 How Council’s Revenue is Spent ......................................................................................................... 8
5.3 Budgeted Statement of Comprehensive Income ............................................................................. 10
5.4 Four‐Year Operating Project Program .............................................................................................. 11
5.5 Four‐Year Capital Projects Program ................................................................................................. 11
5.6 2017/2018 Capital Program in Details .............................................................................................. 12
6. Loan Borrowings ...................................................................................................................................... 13
6.1 Current Long‐Term Borrowings ........................................................................................................ 14
7. Rating Structure and Policy ..................................................................................................................... 15
7.1 What are Rates? ............................................................................................................................... 15
7.2 Strategic Focus .................................................................................................................................. 15
7.3 Method Used to Value Land ............................................................................................................. 15
7.4 Impact of Rates ................................................................................................................................. 16
7.5 Differential General Rates ................................................................................................................ 16
7.6 Fixed Charge ..................................................................................................................................... 17
7.7 Natural Resource Management Board Levies .................................................................................. 17
7.8 Service Charges ................................................................................................................................. 17
7.9 Mandatory Township Refuse Charges .............................................................................................. 19
7.10 Payment of Rates .............................................................................................................................. 19
7.11 Remission and Postponement of Rates ............................................................................................ 19
7.12 Rebate of Rates ................................................................................................................................ 20
7.13 Sale of Land for Non‐Payment of Council Rates ............................................................................... 20
8. How to Measure Council Performance ................................................................................................... 20
9. Long Term Financial Plan 2017/2018 to 2026/2027 ............................................................................... 23
9.1 Long Term Financial Objective of the Adelaide Plains Council ......................................................... 23
9.2 Assumptions Used in the Preparation of Long Term Financial Plan 2017/2018 to 2026/2027 ....... 25
9.3 Long Term Financial Indicators ......................................................................................................... 31

2017/2018 Annual Business Plan and 2018‐2027 Long Term Financial Plan 1
1. Preamble
Under section 123 of the Local Government Act 1999 (the Act), a Council must have a budget for each
financial year. This budget must be considered in conjunction with the Council’s Annual Business Plan (and
be consistent with that plan) and must be adopted before 31 August for the financial year.
Council therefore prepares, as part of its budget development process, an Annual Business Plan. According
to section 123(2) of the Act, each annual business plan of a council must:
a) include a summary of the council's long‐term objectives (as set out in its strategic management
plans);
b) include an outline of:
(i) the council's objectives for the financial year;
(ii) the activities that the council intends to undertake to achieve those objectives; and
(iii) the measures (financial and non‐financial) that the council intends to use to assess the
performance of the council against its objectives over the financial year;
c) assess the financial requirements of the council for the financial year and, taking those requirements
into account, set out a summary of its proposed operating expenditure, capital expenditure and
sources of revenue;
d) set out the rates structure and policies for the financial year;
e) assess the impact of the rates structure and policies on the community based on modelling that has
been undertaken or obtained by the council;
f) take into account the council's long‐term financial plan and relevant issues relating to the
management and development of infrastructure and major assets by the council; and
g) address or include any other matter prescribed by the regulations.
Before a Council adopts its Annual Business Plan it must prepare a draft Annual Business Plan and
undertake a public consultation process that, as a minimum, meets the requirements of section 123(4) of
the Local Government Act 1999. During the public consultation period copies of the Council’s Draft Annual
Business Plan and any other associated documents must be made available for inspection and purchase by
the public at the principal office of the Council.
This document presents the 2017/2018 Annual Business Plan, Budget and 2018‐2027 Long Term Financial
Plan for the Adelaide Plains Council as adopted by the Council at a special meeting held on Monday, 10 July
2017 which has been developed in consultation with the Elected Members, Audit Committee and the
Council staff in the context of Council’s “Strategic Plan 2013‐2016”.

2017/2018 Annual Business Plan and 2018‐2027 Long Term Financial Plan 2
2. Message from the Mayor and Chief Executive Officer
On behalf of the Adelaide Plains Council, I am excited to unveil Council's Annual Business Plan and Budget
for the 2017/2018 financial year. While the 2016/2017 financial year was a period of consolidation for
Council, the forthcoming twelve month period will certainly see a number of exciting advancements and
these are set out within Council's 2017/2018 Annual Business Plan.
Following the recruitment of Council's Chief Executive Officer in May 2016, a concerted focus has been on
improving governance practices as well as restructuring our organisation to ensure better integration of
disciplines so as to achieve greater efficiencies in the manner in which Council delivers its services.
With much of the internal focal areas now having been addressed, Council is well equipped to embrace the
2017/2018 Financial Year with optimism and excitement, as should our community.
There is a high level of economic development activity and investment occurring within our Council region
at present. Two Wells residential growth, the advancement of a new Reception‐Year 12 educational
establishment also at Two Wells, the Northern Adelaide Irrigation Scheme which will drive horticultural
investment and employment within our Food Bowl precinct, allied industrial investment that will come as a
result of a land rezoning initiative that seizes on the water harvesting opportunity, and finally, the
International Bird Sanctuary – a wonderful tourism opportunity for our Council region if capitalised upon
correctly. With all this activity it is fair to say that the Adelaide Plains Council’s landscape will evolve, and
quite rapidly, over the next few years and we as a Council need to ensure that this growth is orderly and
economic – with no adverse impact on our region’s amenity nor our ratepayers’ levels of service.
Council understands the importance of sound financial management and to that end we assure our
residents that the 2017/2018 Annual Business Plan and Budget has been through a thorough review
process with extensive consultation with our elected members. Management has adopted a zero based
budget approach where each budget line was reviewed for relevance and necessity. With a shrewd,
disciplined approach to financial management, aligning expenditure with service level expectations, we are
confident that the Annual Business Plan and Budget is transparent, well considered and accountable. Some
of the key aspects of the forthcoming Annual Business Plan include:
Delivery of Council's Strategic Plan 2017‐2020;
Delivery of the Northern Adelaide Food Bowl Protection Development Plan Amendment (DPA);
$2.982m investment into capital works projects;
$0.857m investment into operating projects; and
Commitment to continue to realise savings through astute fiscal management, review of service
levels and the manner in which we procure, as well as exploring external funding grants as a means
of increasing revenue streams to delivery services and projects for our region.
Council continues to pursue financial sustainability and this budget certainly contributes to attaining this
goal over time. On behalf of Council, we are excited to present the 2017/2018 Annual Business Plan and
Budget and 2018‐2027 Long‐Term Financial Plan for the Adelaide Plains community.
Tony Flaherty OAM, James Miller, Mayor Chief Executive Officer

2017/2018 Annual Business Plan and 2018‐2027 Long Term Financial Plan 3
2.00
13.32
4.63
8.18
5.89 21.00
CEO
D&C
F&ED
G&C
INF
Inside Outside
3.40
2.50
3.40
2.50
3.40
2.50
2016/2017
2017/2018
Primary Production
Commercial & Industrial
Residential, Vacant Land & Other
9.073 , 80%
0.335 , 3%
0.159 , 1%
1.680 , 15% 0.163 , 1%
Rates
Statutory charges
User charges, Ineterst & Other Income
Grants, subsidies and contributions
Reimbursements
3. Budget Snapshot
Source of Council Revenue ($’000) Services Charges ($)
Rate in the dollar increase (%) Budgeted Council Staff Assets managed with Numbers (FTEs) by Department Council rates?
Council investment in Community Assets in 2017/2018 ($’000)
586
405
375
132
180
135
90
586
405
405
132
180
135
90
‐ 100 200 300 400 500 600
Mallala CWMS
Middle Beach CWMS ‐Large Tank
Middle Beach CWMS ‐Small Tank
Waste Levy ‐ Additional Bin
Standard Waste Levy
Waste Levy ‐ 25% Discount
Waste Levy ‐ 50% Discount
2017/2018 2016/2017
857
813
236
80
38
30
25
20
‐ 100 200 300 400 500 600 700 800 900
Road Sealing
Road Resheeting
Road Resealing
Plant Replacement
New Footpaths
Building Renewal
New Drainage
Others
Asset/Service Category
Dimensions
Sealed 165 km
Unsealed Roads 544 km
Pavement 165 km
Footpaths 14 km
Kerb and Watertable
46 km
Clay Roads 239 km
Street Lights (no) 356
Development Applications 335
Libraries (10,000 visitors) 02

2017/2018 Annual Business Plan and 2018‐2027 Long Term Financial Plan 4
Council investment in New Operating Projects 2017/2018 ($’000)
Summary of Council Operating Expenses ($’000) Loans Outstanding at 30/06/17 ($Mn)
Projected 10 Year Operating Surplus/(Deficit) ($’000)
with a 3.00% increase in average rates (2.50% rate in the Dollar Increase & 0.50% valuation increase
60
500
70
50
36
64 40
Building Maintenance Program
Two Wells Roundabout
Allied Food Industries Land Supply Study & Northern Food Bowl Protection Areas DPA
Webb Beach Community Emergency Mgt. Plan
Recruitment of New General Inspector (0.4FTE)
Recruitment of New Engineer (0.6 FTE)
Others
4.740 , 38%
3.619 , 29%
2.807 , 23%
0.329 , 3%0.820 , 7%
Employee Costs
Materials, contracts and other services
Depreciation
Loan Interest
Operating Project Expenses
(904)(616)
(549) (370) 132
325 527 749
990 1,252
138
3,182
410 ‐ 120
(1,500)
(1,000)
(500)
‐
500
1,000
1,500
2,000
2,500
3,000
3,500
2018 2019 2020 2021 2022 2023 2024 2025 2026 2027
Budgeted Operating Surplus/(Deficit) New Borrowings
Purpose Due RemarkMallala CWMS Initial Investment
1.892 $1.391m Roll‐over in 2036
Funding Mallala Depot and Capital Program
1.716 Paid out in 2022
Funding Capital Program in 2009/2010
0.635 Paid out in 2020
Gawler River Scheme ‐ Flood Plain Mgt.
0.193 Paid out in 2022
Resource Recovery shed and Ruskin Shannon Rd Development
0.167 Paid out in 2022
Purchase Community Land ‐ Mallala
0.081 Paid out in 2022
Gawler River Scheme ‐ Flood Plain Mgt.
0.042 Paid out in 2021
Mallala Bowling Club Synthetic Green
0.012 Paid out in 2018
Cash Advance Loans 1.594
Total Loans Outstanding 6.332
2017/2018 Annual Business Plan and 2018‐2027 Long Term Financial Plan 5
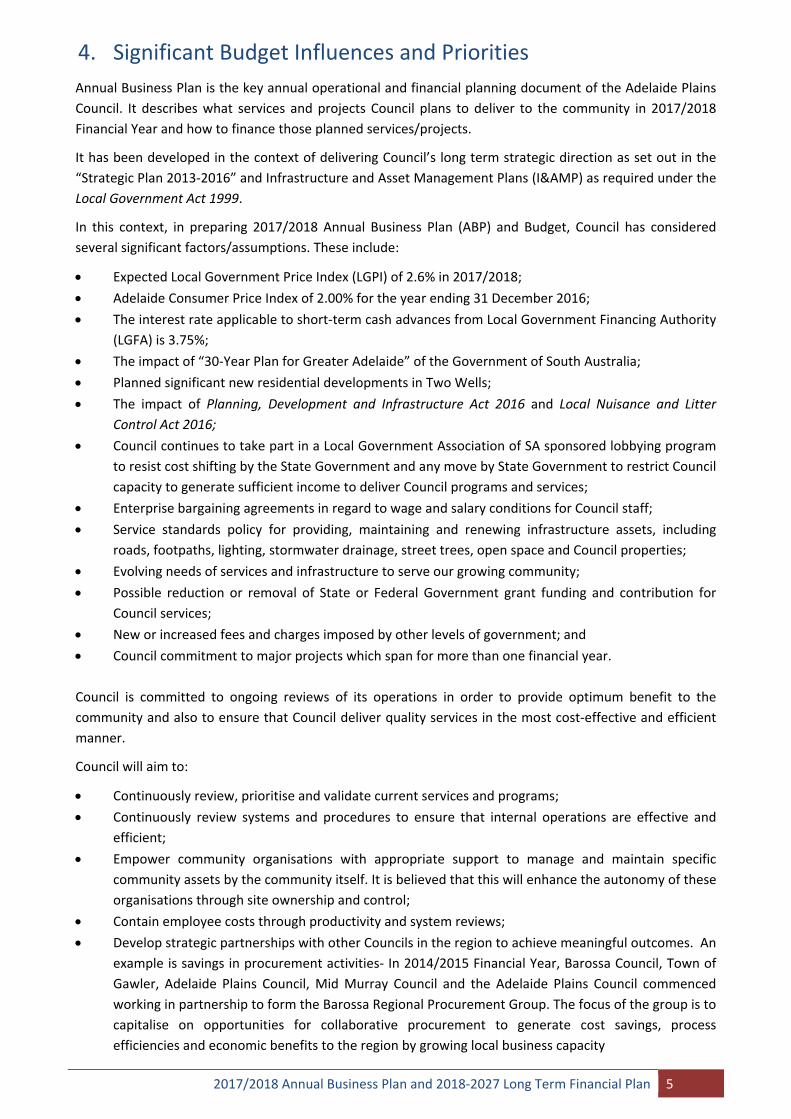
4. Significant Budget Influences and Priorities
Annual Business Plan is the key annual operational and financial planning document of the Adelaide Plains
Council. It describes what services and projects Council plans to deliver to the community in 2017/2018
Financial Year and how to finance those planned services/projects.
It has been developed in the context of delivering Council’s long term strategic direction as set out in the
“Strategic Plan 2013‐2016” and Infrastructure and Asset Management Plans (I&) as required under the
Local Government Act 1999.
In this context, in preparing 2017/2018 Annual Business Plan (ABP) and Budget, Council has considered
several significant factors/assumptions. These include:
Expected Local Government Price Index (LGPI) of 2.6% in 2017/2018;
Adelaide Consumer Price Index of 2.00% for the year ending 31 December 2016;
The interest rate applicable to short‐term cash advances from Local Government Financing Authority
(LGFA) is 3.75%;
The impact of “30‐Year Plan for Greater Adelaide” of the Government of South Australia;
Planned significant new residential developments in Two Wells;
The impact of Planning, Development and Infrastructure Act 2016 and Local Nuisance and Litter
Control Act 2016;
Council continues to take part in a Local Government Association of SA sponsored lobbying program
to resist cost shifting by the State Government and any move by State Government to restrict Council
capacity to generate sufficient income to deliver Council programs and services;
Enterprise bargaining agreements in regard to wage and salary conditions for Council staff;
Service standards policy for providing, maintaining and renewing infrastructure assets, including
roads, footpaths, lighting, stormwater drainage, street trees, open space and Council properties;
Evolving needs of services and infrastructure to serve our growing community;
Possible reduction or removal of State or Federal Government grant funding and contribution for
Council services;
New or increased fees and charges imposed by other levels of government; and
Council commitment to major projects which span for more than one financial year.
Council is committed to ongoing reviews of its operations in order to provide optimum benefit to the
community and also to ensure that Council deliver quality services in the most cost‐effective and efficient
manner.
Council will aim to:
Continuously review, prioritise and validate current services and programs;
Continuously review systems and procedures to ensure that internal operations are effective and
efficient;
Empower community organisations with appropriate support to manage and maintain specific
community assets by the community itself. It is believed that this will enhance the autonomy of these
organisations through site ownership and control;
Contain employee costs through productivity and system reviews;
Develop strategic partnerships with other Councils in the region to achieve meaningful outcomes. An
example is savings in procurement activities‐ In 2014/2015 Financial Year, Barossa Council, Town of
Gawler, Adelaide Plains Council, Mid Murray Council and the Adelaide Plains Council commenced
working in partnership to form the Barossa Regional Procurement Group. The focus of the group is to
capitalise on opportunities for collaborative procurement to generate cost savings, process
efficiencies and economic benefits to the region by growing local business capacity

2017/2018 Annual Business Plan and 2018‐2027 Long Term Financial Plan 6
The following graph (Figure 1) shows the growth in Council operating expenditures since the 2012/2013
Financial Year. Accordingly, Employee Costs have gone up by $1.026m or 28% from 2012/2013 to
2017/2018 Financial Year. During the same period, the number of fulltime equivalent (FTEs) staff has
increased from 51 to 55. While the budget for 2017/2018 is proposing to create 1.00 FTEs positions, Council
is committed not to create any new staff positions in the near future.
Material, Contracts and Other Expenses have fluctuated across the period dependent upon each year’s
proposed budget, however an upward trend is showing over the period except in 2014/2015 and in
2016/2017 Financial Years, mainly due to increased cost to Council of purchasing items such as of general
maintenance, water, electricity, insurances, legal fees, fuel, plant monitoring etc.
Interest Expenses have also increased over the years due to additional borrowings Council has made,
particularly, its short‐term cash advance facility from LGFA.
Depreciation Expenses has gone up by $0.934m, mainly due to the impact of additional depreciation
flowing from Council investment of $11.578m on new/upgraded assets since 2012/2013 Financial Year.
5. 2017/2018 Recurrent and Project Budgets
Council’s 2017/2018 Budget, consists of Recurrent Budget, Operating Projects and Capital Projects Budgets.
Recurrent Budget
The Recurrent Budget includes the amount of operating income Council will receive in 2017/2018 Financial
Year from general rates, service charges, government grants, fees and charges and investment and
operating expenditures to provide council’s day‐to‐day operations and services in the course of its normal
operating activities (on business as usual basis) such as kerbside rubbish collection, street lighting, parks
and ovals maintaining and issuing building consents etc. It also includes costs related to the capital
expenditure programme such as interest on loan obtained for capital program, maintenance of Council
assets and depreciation.
3,714 3,923
4,257 4,326
5,042 4,740
3,198 3,301
3,071 3,727
3,224 3,619
1,873 1,883
2,335
2,619 2,707 2,807
364 332 446 428 436 329
‐
1,000
2,000
3,000
4,000
5,000
6,000
2013 2014 2015 2016 2017 2018
$'000
Financial Year
Figure 1: Growth in Council's Operating Expenses
Employee Costs Materials, contracts and other services Depreciation Finance Costs
2017/2018 Annual Business Plan and 2018‐2027 Long Term Financial Plan 7
Operating Projects
Some programs/activities of the Council are categorised as Operating Projects rather than Recurrent
Budget, if it does not make up part of Council’s regular core services or there is a finite funding life
required.
Capital Projects
The expenditure included in the Capital Projects category is the amount of money Council will invest either
in upgrading existing assets or the creation of new assets in accordance with the Council’s Strategic Plan
objectives and Infrastructure and Asset Management Plans.
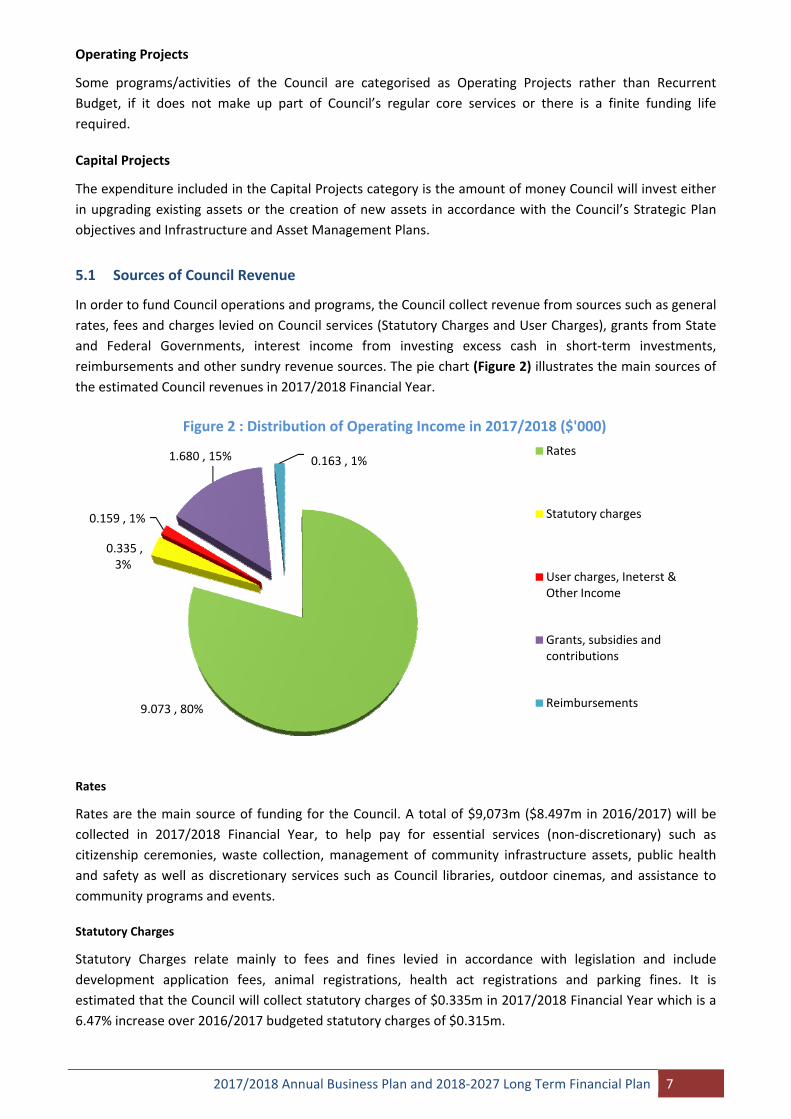
5.1 Sources of Council Revenue
In order to fund Council operations and programs, the Council collect revenue from sources such as general
rates, fees and charges levied on Council services (Statutory Charges and User Charges), grants from State
and Federal Governments, interest income from investing excess cash in short‐term investments,
reimbursements and other sundry revenue sources. The pie chart (Figure 2) illustrates the main sources of
the estimated Council revenues in 2017/2018 Financial Year.
Rates
Rates are the main source of funding for the Council. A total of $9,073m ($8.497m in 2016/2017) will be
collected in 2017/2018 Financial Year, to help pay for essential services (non‐discretionary) such as
citizenship ceremonies, waste collection, management of community infrastructure assets, public health
and safety as well as discretionary services such as Council libraries, outdoor cinemas, and assistance to
community programs and events.
Statutory Charges
Statutory Charges relate mainly to fees and fines levied in accordance with legislation and include
development application fees, animal registrations, health act registrations and parking fines. It is
estimated that the Council will collect statutory charges of $0.335m in 2017/2018 Financial Year which is a
6.47% increase over 2016/2017 budgeted statutory charges of $0.315m.
9.073 , 80%
0.335 , 3%
0.159 , 1%
1.680 , 15% 0.163 , 1%
Figure 2 : Distribution of Operating Income in 2017/2018 ($'000)
Rates
Statutory charges
User charges, Ineterst & Other Income
Grants, subsidies and contributions
Reimbursements

2017/2018 Annual Business Plan and 2018‐2027 Long Term Financial Plan 8
User Charges
User charges relate mainly to the recovery of service delivery costs through the charging of fees to users of
Council’s services. These include charges for the use of Council facilities, library printing and photocopy
charges, Section 7 property searches etc. User charge income is expected to increase from $0.076m in
2016/2017 Financial Year to $0.143m in 2017/2018 Financial Year.
Grants, subsidies and contributions
Grants include monies received from State and Federal sources for the purposes of funding the delivery of
Council’s services to ratepayers and contributions from other parties towards property development costs.
Grants income has been budgeted based on confirmed funding levels only. The main source of grant to be
received by the Council is from Commonwealth Government through the South Australian Local
Government Grants Commission ($1.294m) and under Roads to Recovery (R2R) program ($0.360m). While
both grants are untied, Roads to Recovery grant can be spent, at a council’s discretion, only on maintaining,
renewing, replacing or upgrading existing roads or construction of new roads.
In addition, Government of South Australia allocates funds annually to support public libraries in South
Australia, complementing the funding allocation by individual Councils to public libraries. Accordingly,
Adelaide Plains Council is estimated to receive $0.025m for 2017/2018 Financial Year.
Investment Income
The Council earns investment income primarily in the form of interest from the investment of cash
surpluses throughout the financial year and loan given to community organisations.
Reimbursements
From time to time the Council enters into commercial arrangements under which it performs services on
behalf of third parties, and subsequently then seeks reimbursement for undertaking those services.
During 2017/2018, it is estimated that the Council will seek reimbursement for $0.162m compared to
$0.245m in 2016/2017.
Other Income
Other income relates to a range of unclassified items that do not fit within the aforementioned main
revenue categories. Council will receive other income of $0.015m in 2017/2018 Financial Year compared to
$0.029m in 2016/2017.
5.2 How Council’s Revenue is Spent
Employee Expenses
Employee expenses include all labour related expenditure such as salaries, wages, allowances and on‐costs
(Annual Leaves, Long Service Leaves, Superannuation, Workers Compensation Insurances etc.) expenses.
During 2017/2018 Financial Year, employee costs are expected to decrease to $4.740m as compared to
$5.042m in 2016/2017.This is an overall reduction of $0.302m or 6% due to combined impact of the staff
Enterprise Bargaining Agreement and staff resignations in 2016/2017 Financial Year that was not filled. The
budgeted FTEs for 2017/2018 is 55 which is same as the FTEs on 30/06/14, excluding two (2) new positions
of 1.00FTEs proposed in the Operating Project budget for 2017/2018.
Following graph shows the Adelaide Plains Council’s staff levels at the end of each financial year from 2008
and current staff numbers on a full‐time equivalent basis.
It should be noted that compared to other Council’s in the region, Adelaide Plains Council has higher staff
numbers, as the Council deliver several services in‐house (road maintenance, roads constructions, kerbside

2017/2018 Annual Business Plan and 2018‐2027 Long Term Financial Plan 9
waste collection, cleaning of office buildings, quarry operations, rubble carting etc) that are being done
through contractors in other Councils.
Figure 3: Adelaide Plains Council Workforce (FTEs)
*Note: 30/06/08 to 30/06/17 are actual staff numbers, 30/06/18 is budgeted staff numbers
Materials, Contracts and Other Expenses
Materials include items such as electricity, water, fuel, road products, library books, printing and stationary
costs. Contracts relate to the provision of Council services by external providers and include items such as
street sweeping, security, leases and infrastructure repairs and maintenance.
Other Expenses relate to a range of unclassified items including contributions to community groups,
advertising, insurances, motor vehicle registrations, payment of the NRM levy and other miscellaneous
expenditure.
It is estimated that the Council will spend on Materials, Contracts and Other Expenses $3.619m in
2017/2018 Financial Year, compared to $3.323m in 2016/2017 Financial Year, an increase of $0.296m or
8.91% which is due to combined impact of general CPI increase of Council expenses and new planning
portal expenses of $0.020m.
Depreciation, Amortisation and Impairment
Depreciation is an accounting charge which measures the usage of the Council’s Property, Plant and
Equipment (including infrastructure assets such as roads and drains) over the estimated effective useful life
of the assets.
In 2017/2018 the forecast amount of depreciation is $2.807m compared to $2.707m for 2016/2017, an
increase of $0.100m or 3.68% due to additional depreciation expenses on new/upgraded assets created in
2015/2016 and 2016/2017.
Finance Charges
Finance charges relate to interest charged by the Local Government Financing Authority on funds that have
been borrowed by Council. Interest costs have been estimated based on Council’s current loan portfolio as
at June 2017 and expected borrowings scheduled for 2017/2018 Financial Year.
Interest costs for 2017/2018 are expected to decrease by 15.80% from $0.435m in 2016/2017 Financial
Year to $0.366m in 2017/2018, mainly due to interest being paid progressively reduced when repaying loan
instalments overtime.
45 44
47
51 52
54 55
56 56 5755
40
42
44
46
48
50
52
54
56
58

2017/2018 Annual Business Plan and 2018‐2027 Long Term Financial Plan 10
Figure 4: Distribution of Operating Expenses in 2017/2018 ($’000)
5.3 Budgeted Statement of Comprehensive Income
Council’s Statement of Comprehensive Income which incorporates all operating income and expenses and
operating project expenses are given below in Table 1. Accordingly, it is estimated that Council will incur an
operational deficit of $1.154m in 2017/2018 Financial Year, with a 3.00% increase in average rates.
Table 1: Statement of Comprehensive Income for 2017/2018 Financial Year
2015/2016 2016/2017 2017/2018
Audited Actual Adopted Budget Budget
OPERATING INCOME Rates 8,112,516 8,497,616 9,073,257 Statutory charges 325,479 314,835 335,205 User charges 115,413 75,794 142,825 Grants, subsidies and contributions 1,452,028 1,736,700 1,679,566 Investment Income 7,665 2,000 1,500 Reimbursements 282,508 245,125 162,443 Other Income 136,943 29,498 14,969
TOTAL INCOME 10,432,552 10,901,568 11,409,765
OPERATING EXPENSES Employee Costs 4,326,041 5,041,825 4,739,668 Materials, contracts and other services 3,726,567 3,323,531 3,569,046 Depreciation, Amortisation & Impairment 2,619,196 2,707,107 2,806,820 Finance Costs 427,625 435,863 328,567 Share of loss ‐ joint ventures & associates 66,872 ‐ 50,000 Operating Project Expenses ‐ ‐ 819,706
TOTAL EXPENSES 11,166,301 11,508,326 12,313,807
OPERATING SURPLUS / (DEFICIT) (733,749) (606,758) (904,042) Asset Disposal & Fair Value Adjustments (52,403) (36,000) 10,000
Amounts specifically for new or upgraded assets 871,592 ‐ 490,500 Physical resources received free of charge 661,308 ‐ ‐
NET SURPLUS (DEFICIT) 746,748 (642,758) (403,542)
Note: Above estimates do not include the impact of Two Wells new housing developments.
$4,740 , 41%
$3,619 , 32%
$2,807 , 24%
$366 , 3%
Employee Costs
Materials, contracts and other services
Depreciation
Loan Interest

2017/2018 Annual Business Plan and 2018‐2027 Long Term Financial Plan 11
5.4 Four‐Year Operating Project Program
As part of developing 2017/2018 Annual Budget, management has developed four (4) year operating
project program, with a total investment value of $2.088m, for consideration by the Council. A summary of
four (4) year program is presented in Table 2 below.
Table 2: Four Year Operating Project Budget
Project Name Four Year
Cost 17/18 18/19 19/20 20/21
Delegation Software 1,500 1,500 ‐ ‐ ‐
Annual Building Maintenance Program 275,800 60,000 215,800 ‐ ‐
Community Plant Nursery 10,000 ‐ 10,000 ‐ ‐
Installation of roundabout in Two Wells 500,000 500,000 ‐ ‐ ‐
Levees – Two Wells Development ‐ To be confirmed
Lewiston Storm Water Management Plan 40,000 ‐ 40,000 ‐ ‐
AIBS Issues and Opportunities Paper 30,000 ‐ 30,000 ‐ ‐
Allied Food Industries Land Supply Study & Northern Food Bowl Protection Areas DPA 70,000 70,000 ‐ ‐ ‐
Webb Beach Community Emergency Management Plan 50,000 50,000 ‐ ‐ ‐
Coastal Settlements DPA and the Issues and Opportunities ‐ Coastal Settlements ‐
To be confirmed
General Inspector 0.6FTE 149,233 36,316 36,970 37,635 38,312
Engineer 1.0 FTE 263,817 64,200 65,355 66,532 67,730
APC Remanent and Roadside Vegetation Action Plan 30,000 ‐ 30,000 ‐ ‐
Take 5 safety program & smart phones to access the program by Depot outside staff 5,000 5,000 ‐ ‐ ‐
Review of 5 By‐Laws (Permits & Penalties/Local Govt. Land/Roads/Dogs/Moveable Signs) 10,000 10,000 ‐ ‐ ‐
Council Election 30,000 30,000 ‐ ‐
Building Biodiversity 12,000 12,000 ‐ ‐ ‐
Two Wells Service Centre Landscaping 10,690 10,690 ‐ ‐ ‐
Other Operating Projects yet to be specified 600,000 ‐ ‐ 300,000 300,000
Total Costs 2,088,041 819,706 458,125 404,167 406,042
5.5 Four‐Year Capital Projects Program
Adelaide Plains Council is responsible for a large portfolio of assets with a depreciation of $2.808m
approximately per annum. It is therefore critical for the long term sustainability of assets that the Council
engages in practises that optimise assets useful lives for the benefit of the community.
Capital Budget with an investment of $11.6m over four (4) years was prepared by the Management as part
of 2017/2018 Annual Budget. Elected Members considered these capital programs at two workshops held
on 14 March 2017 and 03 April 2017. Table 3 below summarise four (4) year capital program.
In 2017/2018 Financial Year, Council is planning to spend $2.099m on its capital programs of which
$1.179m will be spent on asset renewal programs which involves, resealing sealed roads, re‐sheeting
sheeted rural roads, renewing footpath, kerbing, building, open spaces etc. and $0.920m will be spend on
new/upgraded assets.

2017/2018 Annual Business Plan and 2018‐2027 Long Term Financial Plan 12
Table 3 below summarise the Council investment in the four (4) year capital program.
Table 3: Four Year Capital Project Budget
Project Name Four Year
Cost 17/18 18/19 19/20 20/21
New Sealing Program (Note 1) 1,376,500 857,500# 294,000 50,000 175,000
New Footpath Program 186,880 37,680 58,240 36,160 54,800
New Sheeting Program 55,000 55,000
New Kerbing Program 161,920 ‐ 33,920 128,000 ‐
New Site Improvement Program 85,0000 ‐ 85,000
New Levees 325,500 302,500 16,000 7,000
New Stormwater Program 349,000 25,000 175,000 119,000 30,000
Resealing Renewal Program 962,012 235,776 256,867 230,842 238,527
Resheeting Renewal Program 3,019,922 814,109 1,094,751 551,870 559,192
Kerbing Renewal Program 340,329 ‐ 259,352 52,791 28,186
Footpath Renewal Program 40,000 10,000 10,000 10,000 10,000
Building Renewal Program 629,557 29,500 117,000 160,215 322,942
Site Improvements Renewal 246,575 5,394 ‐ 217,741 23,440
Structure Renewal Program 16,231 16,231
CWMS Renewal Program 41,985 4,500 37,485
Plant/Fleet Replacement(Note2) 3,716,895 79,500* 2,399,265 523,130 715,000
Total Costs 11,553,406 2,098,959 5,157,126 2,095,749 2,201,572
Note 1#: Includes allocation of $681,000 for the sealing and upgrade of Hart Road in Lower Light and will be
implemented only if Council’s grant application for $341,500 is successful and private contribution of $150,000.
Note 2*: Include replacement of garbage compacter at a cost of $380,000. However, the expenditure may not be
incurred if the Council decides to engage an external contractor for kerbside collection program.
5.6 2017/2018 Capital Program in Details
Table 4 below provides more details on the capital program for 2017/2018 Financial Year.
Table 4: 2017/2018 Capital Project Budget
Capital Project Description Costs
New Roads Sealing Program
Dublin Road and Shannon Road ‐ Intersection upgrade 26,500
Germantown Road (Gawler Road to End of Seal) Reconstruction 150,000
Hart Road ‐ Sheeted to Sealed Project 681,000
Resealing Roads Program
Surface ‐ Boundary Road (045) from Gawler Road to Hayman Road 46,457
Surface ‐ Dublin Road (025) from Powerline Road to Hall Road 80,048
Surface ‐ Port Parham Road (020) from Beach Road to Webb Beach Road 83,935
Surface ‐ Port Parham Road (025) from Webb Beach Road to First Street 25,337
Resheeting Roads Program
Surface ‐ Nairn Road (010) from Franks Road to Hall Road 37,855
Surface ‐ March Road (010) from Owen Road to Davies Road 49,285
Surface ‐ March Road (005) from Balaklava Road to Owen Road 37,707
Surface ‐ Franks Road (010) from Calomba Road to Ross Road 33,816
Surface ‐ Franks Road (015) from Ross Road to Broster Road 46,686
Surface ‐ Earl Road (010) from Old Dublin Road to Cawrse Road 43,679
Surface ‐ Curnow from Carwse sth. to resheet end near hay shed.700 metres 19,300
Surface ‐ Gordon Road (015) from Porter Road to Church Road 37,830

2017/2018 Annual Business Plan and 2018‐2027 Long Term Financial Plan 13
Surface ‐ Wasley Road (025) from Big Rabbit Road to Gallipoli Road 43,008
Surface ‐ Pratt Road (020) from Mallala ‐ Two Wells Road to Gordon Road 40,323
Surface ‐ Stockyard Road (005) from Mallala ‐ Two Wells Road to End 5,455
Surface ‐ Simpkin Road from Germantown to Williams 1420 mts. 49,330
Surface ‐ Simpkin Road from Williams to Harvey 1200 mts. 41,688
Surface ‐ John West Road from Old Port Wakefield Road to last house access 380 mts. 8,664
Surface ‐ Davis Road (005) from Smith Road to McEvoy Road 26,506
Surface ‐ Harris Road (005) from Port Wakefield Road to Schlodder Road 13,408
Surface ‐ Third Street (Dublin) (015) from End of Seal to Schlodder road 4,932
Surface ‐ Gilbert's Road (005) from Port Wakefield Road to North Parham Road 71,122
Surface ‐ Third Street (Wild Horse Plains) (005) from Second Street to End 5,477
Surface ‐ Slant Road (005) from Port Wakefield Road to Wild Horse Plains Road 49,986
Surface ‐ Fourth Street (Wild Horse Plains) (005) from Second Street to First Street 3,263
Surface ‐ Gregor Road (005) from Day Road to Aunger Road North 77,764
Surface ‐ Barabba Road (020) from Butler Street to Redbanks Road 67,025
Annual New Footpath Program
Eden to Tangari Footpath Access 15,000
Gawler Road ‐ Old Mallala Road to Rowe Crescent (141m) 11,280
Mary Street ‐ Aerodrome Road to Chivell Street (105m) 8,400
Gawler Road ‐ Drew Street to Railway (20m) 3,000
Annual Plant/Fleet Replacement Programs
Tractor 75,000
Other Capital Programs
Purchase of new 3 X computers & 2 Ipads for Two Wells Library 4,500
Pram Ramp renewal to Disability Discrimination Act compliant 10,000
Parham Camping Ground Toilets ‐ Septic tank and soakage 20,000
Security System for Mallala/Two Wells Office Reception, TW Library & Mallala Chamber 9,500
Grace Plains Cemetery ‐ Fencing 5,394
Russel Road & Trim Road ‐ Drainage construction (pipes and crossovers) 25,000
Middle Beach CWMS ‐ Treatment Plant Air Blower 4,500
Total Costs 2,098,959
6. Loan Borrowings
In developing the Long Term Financial Plan, borrowing was identified as an important funding source,
particularly for bridging short‐term cash flow gaps. Borrowings are undertaken in accordance with Council’s
Treasury Management Policy which underpins the Council’s decision making in the funding of Council’s
operations in the context of cash flow, budgeting, borrowings and investments.
As borrowing is an important financial management tool in the overall context of funding Council’s
expenditures, Council’s Treasury Management Policy links closely to the Council’s overall strategic
management plans in the context of:
Strategic planning for the future of the Council, covering short, medium and long term spending and
investment issues;
Current and estimated future revenues and the ability to increase the revenue stream through
Council rates, user charges or additional grant funds;
Inter‐generational equity considerations in terms of the ratepayers who benefit from the
expenditure and therefore on a user pay basis who should pay for the costs associated with such
expenditure;
Current and future funding needs for both operating and capital expenditures;
Potential movements in interest rates; and
Any other strategic imperative such as development of local economy that is linked to revenue and
expenditure capacities (for example, sealing of section of Hart Road in Lower Light).

2017/2018 Annual Business Plan and 2018‐2027 Long Term Financial Plan 14
6.1 Current Long‐Term Borrowings
At the end of 2016/2017 Financial Year, Council is expected to have eight (8) outstanding fixed rates long‐
term borrowings with a total value of $4.739m and short‐term cash advance (CAD) borrowings of $2.300m.
Following Table 4 shows the details of the outstanding long‐term borrowings;
Table 4: Outstanding Long‐term Loans as at 30 June 2017
Purpose of the Loan $ Comment
Gawler River Scheme ‐ Flood Plain Management 41,906 Paid from General Rates income
Gawler River Scheme ‐ Flood Plain Management 192,982 Paid from General Rates income
Community Land ‐ Mallala 81,454 Paid from General Rates income
Resource Recovery shed and Ruskin Shannon Rd Development 166,716 Paid from General Rates income
Mallala Bowling Club Synthetic Green 12,295 Paid by Mallala Bowling Club
Funding 2009/2010 Capital Program 634,613 Paid from General Rates income
Funding Mallala Depot Construction and Other Capital Program 1,716,526 Paid from General Rates income
Council investment in Mallala CWMS 1,892,152 Paid from Annual CWMS Charge
Total outstanding long‐term loans 4,738,644
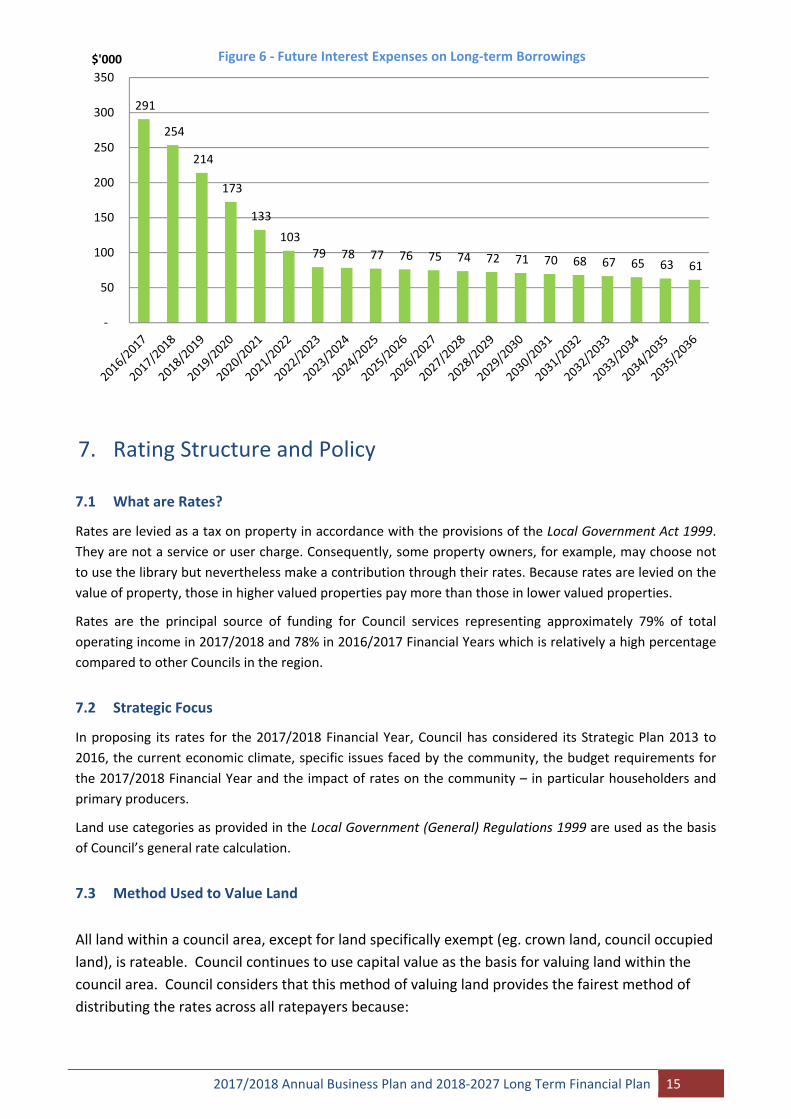
The following two graphs show that outstanding fixed rate loan balance at the end of each financial year
and annual interest repayment. Accordingly, after 30 June 2022, Council will have only the Mallala CWMS
loan which is self‐funded and repaid from the CWMS Charge and not from general rate revenue.
4,739
4,124
3,474
2,787
2,297
1,790 1,767 1,717 1,663 1,604 1,539 1,468 1,391
‐
500
1,000
1,500
2,000
2,500
3,000
3,500
4,000
4,500
5,000
$'000 Figure 5 ‐ Outstanding Long‐term Loan Balance
2017/2018 Annual Business Plan and 2018‐2027 Long Term Financial Plan 15
7. Rating Structure and Policy
7.1 What are Rates?
Rates are levied as a tax on property in accordance with the provisions of the Local Government Act 1999.
They are not a service or user charge. Consequently, some property owners, for example, may choose not
to use the library but nevertheless make a contribution through their rates. Because rates are levied on the
value of property, those in higher valued properties pay more than those in lower valued properties.
Rates are the principal source of funding for Council services representing approximately 79% of total
operating income in 2017/2018 and 78% in 2016/2017 Financial Years which is relatively a high percentage
compared to other Councils in the region.
7.2 Strategic Focus
In proposing its rates for the 2017/2018 Financial Year, Council has considered its Strategic Plan 2013 to
2016, the current economic climate, specific issues faced by the community, the budget requirements for
the 2017/2018 Financial Year and the impact of rates on the community – in particular householders and
primary producers.
Land use categories as provided in the Local Government (General) Regulations 1999 are used as the basis
of Council’s general rate calculation.
7.3 Method Used to Value Land
All land within a council area, except for land specifically exempt (eg. crown land, council occupied
land), is rateable. Council continues to use capital value as the basis for valuing land within the
council area. Council considers that this method of valuing land provides the fairest method of
distributing the rates across all ratepayers because:
291
254
214
173
133
103 79 78 77 76 75 74 72 71 70 68 67 65 63 61
‐
50
100
150
200
250
300
350
$'000 Figure 6 ‐ Future Interest Expenses on Long‐term Borrowings

2017/2018 Annual Business Plan and 2018‐2027 Long Term Financial Plan 16
Property value is a relatively good indicator of market value of a property, providing the fairest
method of calculating rates and therefore, it is the most appropriate measure of relative wealth in
the community;
As a measure of wealth it most closely reflects the capacity to pay of property owners; and
It accords with the taxation principle, that people should contribute to the community social and
physical infrastructure, in accord with their capacity to pay, as measured by property wealth.
Other valuation methods available are site value (value of land only) and annual value (value of rental
potential of property). These are not considered appropriate with regard to Adelaide Plains Council.
Council will be adopting the valuations made by the Valuer‐General and which are applicable for the
financial year commencing 1 July 2017. If a property owner is dissatisfied with a property valuation, then
an objection may be made to the Valuer‐General in writing, within 60 days of receiving notice of the
valuation, explaining the basis for the objection. Further contact details can be obtained from Council’s
Rates Officer on (08) 8527 0200. It is important to note that Council has no role in the valuation process.
7.4 Impact of Rates
The following data in Table 5 provides a summary of differential rates income & valuations based on
valuation and property data from the State Valuer General as at 30 June 2017.
Table 5: Rates Modelling
Differential Rate Total District Valuation Total Rates Generated for
2017/2018 ‐ All Assessments
2016/2017 2017/2018 2016/2017 2017/2018
Residential 850,361,766 877,926,500 4,114,867 4,349,039
Commercial ‐ Office/Shops 4,712,500 4,864,500 29,667 31,427
Commercial ‐ Other 20,811,600 23,123,446 125,786 143,765
Industry ‐ Light 1,003,000 1,024,000 6,289 6,572
Industry ‐ Other 16,742,000 15,505,830 99,793 94,746
Primary Production 687,073,640 687,372,513 2,925,638 3,000,959
Vacant Land 55,645,500 69,230,500 289,423 362,112
Other 3,718,229 11,825,850 16,035 59,667
Total 1,640,068,235 1,690,873,139 7,607,499 8,048,287
Rate in $ Increase in Rate in the Dollar 2016/2017 2017/2018
Residential 0.00451651 0.004629423 2.50
Commercial ‐ Office/Shops 0.00587105 0.006017826 2.50
Commercial ‐ Other 0.00587105 0.006017826 2.50
Industry ‐ Light 0.00587105 0.006017826 2.50
Industry ‐ Other 0.00587105 0.006017826 2.50
Primary Production 0.00410602 0.004208671 2.50
Vacant Land 0.00451651 0.004629423 2.50
Other 0.00451651 0.004629423 2.50
7.5 Differential General Rates
Every resident benefits in some part from the general amenity of the council area, whether that is at the
present time or in the future. The amenity includes the local economy, general council operations and the
ability to use council facilities.

2017/2018 Annual Business Plan and 2018‐2027 Long Term Financial Plan 17
It is acknowledged that the system of council rates is in essence a system of taxation against property
prescribed through the provisions of the Local Government Act 1999. However, Council has assessed that
the level of differential rating imposed is governed in part by the ability to pay, the potential for income tax
deductions and the perception of accessibility or useability of council services by the residents and
consumers. To this end, Council has decided that:
a) Commercial Properties
Commercial properties generally have available to them, their employees and customers the same
services as other ratepayers. However, in most cases commercial users have a greater impact on the
main services such as road maintenance and generally derive a greater benefit from the services
provided. In addition, commercial properties have potential taxation benefits.
b) Industrial Properties
Industrial properties generally have available to them, their employees and customers the same
services as other ratepayers. However, in most cases industrial users have a greater impact on the
main services such as road maintenance and generally derive a greater benefit from the services
provided, particularly where, for example, large amounts of raw or unrefined product is delivered to
site for processing utilising Council’s infrastructure. In addition, industrial properties have potential
taxation benefits.
c) Primary Production Properties
Primary Production properties tend to be more remote from some of the services provided by
Council. In terms of infrastructure adjacent their properties they may not have sealed or formed
roads, footpaths or street lighting. However they do have capacity to enjoy the formed roads,
footpaths or street lighting and enjoy the same level of amenity as other residents of the Council
area. In addition, primary production properties have potential taxation benefits.
7.6 Fixed Charge
A Council may impose a fixed amount payable by way of rates, provided that it has not imposed a minimum
charge. Where two or more adjoining properties have the same owner and are occupied by the same
occupier, only one fixed charge is payable by the ratepayer.
In 2017/2018 the fixed charge is $102.50 ($100.00 in 2016/2017) and this will be applicable to 4,370
rateable properties. Council considers it appropriate that all rateable properties make a base level
contribution to the cost of administering Council’s activities and to the cost of creating and maintaining the
physical infrastructure that supports each property.
7.7 Natural Resource Management Board Levies
The whole of the Council area is located within the boundaries of the Adelaide and Mount Lofty Ranges
Natural Resource Management Board. Contributions are sought in 2017/2018 totalling $169,894.
Council is operating as a revenue collector for the Natural Resource Management Boards in this regard. It
does not retain this revenue or determine how the revenue is spent.
7.8 Service Charges
Community Wastewater Management System (CWMS)
Council provides a Community Wastewater Management System to residential and commercial properties
in Mallala and Middle Beach. Table 6 below shows the estimated costs of the of operating and maintaining

2017/2018 Annual Business Plan and 2018‐2027 Long Term Financial Plan 18
this service for the 2017/2018 Financial Year including funds required to repayment Council loan obtained
for the Mallala CWMS Scheme.
Table 6: CWMS Budget for 2017/2018
Description Mallala Scheme Middle Beach Scheme
Interest on Investments 1,000
CWMS Charge 191,622 19,920
Total Income 192,622 19,920
Less : Operating Expenses and Loan Repayments
Depreciation 86,442 6,685
Salaries and Wages 31,960 ‐
Interest Payments ‐ CWMS Loan 83,996 ‐
Principal Repayment ‐ CWMS Loan 18,651 ‐
Consultants 10,000 ‐
Consumables and Hardware 12,150 1,150
Contractors 19,000 ‐
Electricity 7,500 4,000
Insurance 10,000 826
ESCOSA Licence Fee 300 ‐
Materials 10,000 ‐
Postage and Freight 100 ‐
Service Contracts 21,000 7,000
Telephone 2,800 ‐
Water 500 ‐
Rubble 1,500 ‐
Total Expenses and Loan Repayments 315,899 19,661
Net Cash Surplus/(Deficit) (123,277) 259
Council recovers above cost through the imposition of a service charge of $586.00 per unit for all properties
where the service is available. Where the service is provided to rebated land, a service charge is still levied
against the land.
The Council has not increased Mallala CWMS charge in 2017/2018 from the prior year amount of $586.00.
However, in relation to Middle Beach Scheme, the CWMS charge for the “small tank” has been increased to
same as “large tank” ($405.00) as smaller tanks are pumped twice yearly hence the Council is pumping the
equivalent amount of sludge/effluent from all properties. Therefore, irrespective of the tank size, all
properties connected to the Middle Beach CWMS system should pay a similar charge.
Kerbside Waste Collection Program
The Council also provides a three bin refuse collection service (Domestic Waste, Recycling and Organic)
within the townships of Mallala, Two Wells and Dublin and a two bin refuse collection service (Domestic
Waste and Recycling) in rural and coastal settlement areas. The service is also provided to those ratepayers
in Council’s area that are able to access the service along the designated collection routes. In addition,
Council provides a weekly service in which all public bins (street, parks and reserves and sporting club bins)
with in the district are emptied to ensure the continued ambiance of public space.
The full cost of operating and maintaining kerbside waste collection program for 2017/2018 is estimated to
be $0.506m. The two trucks that deliver the program have already passed their useful life and due for
replacement, costing around $0.600m.
However, the management is currently working with Barossa Regional Procurement Group to ascertain
whether the delivery of Council’s waste collection program through a dedicated contactor is more efficient
2017/2018 Annual Business Plan and 2018‐2027 Long Term Financial Plan 19
and cost effective. Therefore, pending the outcome of the tender process, Council proposes not to increase
2016/2017 waste levy of $180 in 2017/2018 Financial Year for each property within the designated
township, rural or coastal settlements bin service areas.
Where the service is provided to rebated land, a service charge is still levied against the land.
Some residents may have to utilise one of 21 collection points to have their bin emptied as the waste
collection truck does not traverse all roads in the district. Those residents are entitle to following waste levy
reductions if the resident’s collection point is greater than 500 metres from the access point to their land.
i. If greater than 500 metres but no more than 2 kilometres from the resident’s access point to their
land, 75% of the annual levy is charged ($135);
ii. If greater than 2 kilometres but less than 5 kilometres, 50% of the annual levy is charged ($90);
iii. 5 kilometres or more from the resident’s access point to their land, no annual levy is charged.
7.9 Mandatory Township Refuse Charges
The waste levy is mandatory for properties located within the townships of Mallala, Two Wells and Dublin
from 2017/2018 Financial Year which was an option in prior years.
7.10 Payment of Rates
Under section 181 of the Local Government Act 1999, Council must provide the opportunity for all
ratepayers to pay rates by quarterly instalments. Council payment dates for the 2017/2018 Financial Year
will be 1 September 2017, 1 December 2017, 2 March 2018 and 1 June 2018.
Late Payment of Rates
The Local Government Act 1999 provides that Councils impose an initial penalty of 2% on any payment for
rates, whether by instalment or otherwise, that is received late. A payment that continues to be late is
then charged an interest rate, set each year according to a formula in the Act, for each month it continues
to be late. Council allows a further three working days after the due date for payment as a grace period.
Thereafter late payment penalties are applied in accordance with the Local Government Act 1999.
Council issues a final notice for payment of rates when rates are overdue i.e. unpaid by the due date.
Should rates remain unpaid more than 28 days after the issue of the final notice, then the Council will refer
the debt to their debt collection agency for collection. All Courts costs incurred by Council in the recovery
of outstanding rates and fines are payable by the ratepayer. When Council receives a payment in respect of
overdue rates, Council applies the money received as follows:
i. firstly – in payment of any costs awarded to, or recoverable by, the Council in any court proceedings
undertaken by the Council for the recovery of the rates;
ii. secondly – in satisfaction for any liability for interest;
iii. thirdly – in payment of any fine;
iv. fourthly – in satisfaction of liabilities for rates in the order in which those liabilities arose in payment
of rates, in date order of their imposition (starting with the oldest account first).
7.11 Remission and Postponement of Rates
Postponement or Rates ‐ Hardship
Section 182 of the Local Government Act 1999 permits Council, on the application of the ratepayer, to
partially or wholly remit rates or to postpone rates, on the basis of hardship. Where a ratepayer is suffering
hardship in paying rates they are invited to contact Council’s Rates Officer, on (08) 8527 0200 to discuss the
matter. Such enquiries are treated confidentially by Council.
2017/2018 Annual Business Plan and 2018‐2027 Long Term Financial Plan 20
Seniors Rate Postponement
Section 182A of the Local Government Act 1999 provides the option for State Senior Card holders to apply
to postpone part of their council rates on a long term basis. The deferred amount is subject to monthly
interest charge, with the accrued debt being payable on the disposal or sale of the property. Postponement
is similar to a reverse mortgage by relying on the equity in the property. A ratepayer who has a State
Seniors Card may apply for postponement of a portion of the council rates payable on property they own if
it is their principal place of residence and if no other person other than their spouse has an interest as
owner of the property and there is appropriate equity in the property. Further information can be
obtained from Council’s Rates Officers on (08) 8527 0200.
7.12 Rebate of Rates
The Local Government Act 1999 requires Councils to rebate the rates payable for certain land uses. This
includes 100% rate rebates granted on Places of Worship, Public Cemeteries, Hospitals and land occupied
by Universities, and 75% rate rebates have been granted on Educational facilities (subject to some
qualifications).
Discretionary rebates may be applied by the Council under section 166 of the Act. Council annually
considers many applications for rate rebates and has in the past, and is again for the 2017/2018 Financial
Year, proposing to rebate rates charged to various district community and sporting organisations.
7.13 Sale of Land for Non‐Payment of Council Rates
The Local Government Act 1999 provides that a Council may sell any property where the rates have been in
arrears for three years or more. The Council is required to notify the principal ratepayer and the owner (if
not the same person) of the land of its intention to sell the land and provide the owner with details of the
outstanding amounts. If payment of the outstanding amount is not received within one month the
property may be sold. Except in extraordinary circumstances, the Council enforces the sale of land for
arrears of rates.
8. How to Measure Council Performance
The measure of the Council’s success is driven by the achievement of the strategic objectives outlined in
the Strategic Plan 2013‐2016 which also identifies the desired outcomes expected from the strategic
objectives. In addition to the strategic outcomes, the Council also measures its achievements through the
following non‐financial and financial Indicators.
Non‐Financial Indicators
To ensure that the Council delivers on the strategic objectives set out in the Strategic Plan 2013‐2016 and
Annual Business Plan, it is paramount that annual budget activities and projects are completed on time
while delivering project outcomes as planned. Therefore, the progress of the activities and projects will be
closely monitored to ensure that there will be no project delays and budget overruns.
Financial Indicators
When evaluating activities undertaken during any given financial year, the Council considers a number of
factors, one being the future financial sustainability of the Council.
A series of financial indicators have been developed by the local government sector to assist in determining
whether a council is financially sustainable or moving to a position of financial sustainability.
2017/2018 Annual Business Plan and 2018‐2027 Long Term Financial Plan 21
Financial indicators which are used by the Council to measure performance and financial sustainability as
recommended by the Model Financial Statements approved by the Minister for Local Governments and
Local Government Association of South Australia are:
1. Operating Surplus Ratio ‐ Desired level is 0% and 10% on average over long term;
2. Asset Sustainability Ratio ‐ Desired level is greater than 90% but less than 110% on average over
long term; or
3. Net Financial Liabilities Ratio‐ Desired level is greater than 0% but no more than 100% on average
over long term.
a) Operating Surplus/ (Deficit) Ratio
The Council’s long term financial sustainability is dependent upon ensuring that, on average over
time, its operating income is higher than operating expenses (i.e. an Operating Surplus).
The operating surplus ratio is the operating surplus (deficit) expressed as a percentage of operating
income. A positive ratio indicates the percentage of operating income available to help fund
proposed capital expenditure. A negative ratio indicates the percentage increase in operating income
or the approximate decrease in operating expenses required to achieve a break‐even operating
result.
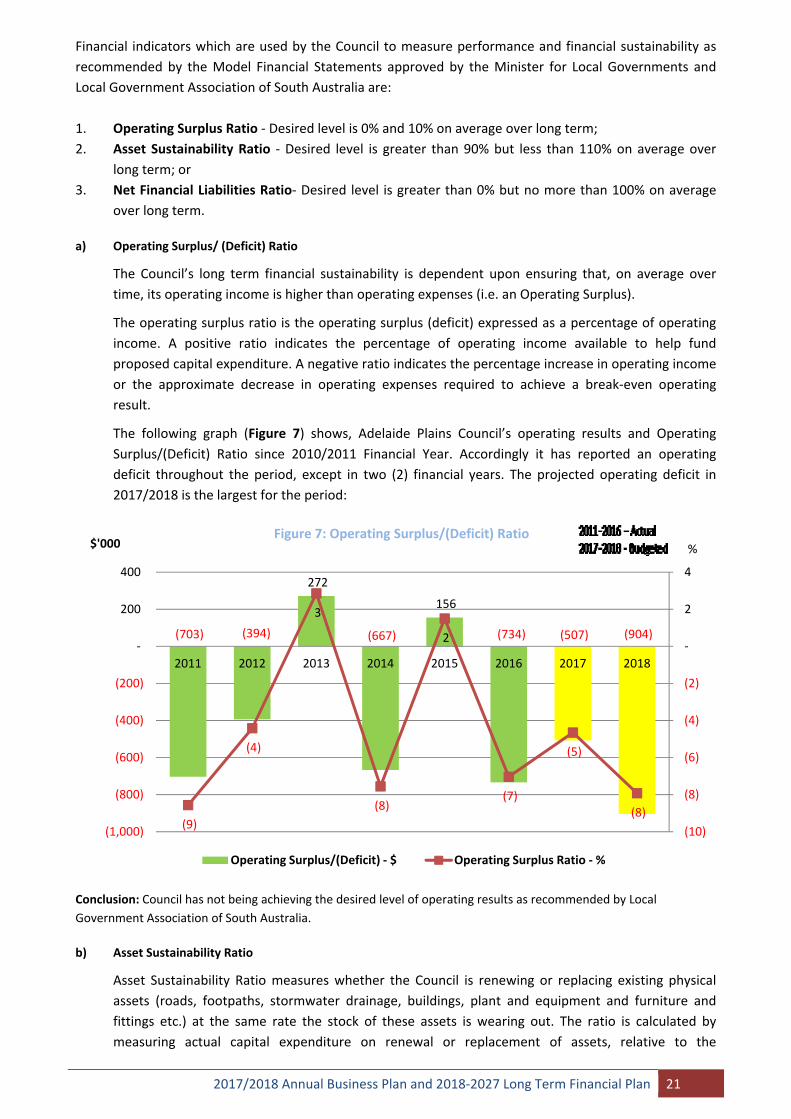
The following graph (Figure 7) shows, Adelaide Plains Council’s operating results and Operating
Surplus/(Deficit) Ratio since 2010/2011 Financial Year. Accordingly it has reported an operating
deficit throughout the period, except in two (2) financial years. The projected operating deficit in
2017/2018 is the largest for the period:
Conclusion: Council has not being achieving the desired level of operating results as recommended by Local
Government Association of South Australia.
b) Asset Sustainability Ratio
Asset Sustainability Ratio measures whether the Council is renewing or replacing existing physical
assets (roads, footpaths, stormwater drainage, buildings, plant and equipment and furniture and
fittings etc.) at the same rate the stock of these assets is wearing out. The ratio is calculated by
measuring actual capital expenditure on renewal or replacement of assets, relative to the
(703) (394)
272
(667)
156
(734) (507) (904)
(9)
(4)
3
(8)
2
(7)
(5)
(8)
(10)
(8)
(6)
(4)
(2)
‐
2
4
(1,000)
(800)
(600)
(400)
(200)
‐
200
400
2011 2012 2013 2014 2015 2016 2017 2018
%$'000Figure 7: Operating Surplus/(Deficit) Ratio
Operating Surplus/(Deficit) ‐ $ Operating Surplus Ratio ‐ %

2017/2018 Annual Business Plan and 2018‐2027 Long Term Financial Plan 22
expenditure on renewal or replacement of assets as per Council’s Infrastructure and Assets
Management Plans.
Conclusion: Council has not being achieving the desired level of Assets Sustainability Ratio as
recommended by Local Government Association of South Australia.
c) Net Financial Liabilities Ratio
This ratio indicates the extent to which the net financial liabilities of the Council or its total
indebtedness can be met by Council’s total operating revenue. Net financial liabilities measure a
council’s indebtedness. It is a broader measure than net debt as it includes all of a council’s
obligations including provisions for employee entitlements and creditors.
The net financial liabilities ratio is calculated by expressing net financial liabilities at the end of a
financial year as a percentage of operating income for the year. Net financial liabilities equals total
liabilities less financial assets where financial assets include cash, investments, loans to community
groups, receivables and prepayments. Where the ratio is increasing, it indicates a greater amount of
a council’s operating revenues is required to service its financial obligations.
Conclusion: Council has being operating within the range recommended by the by Local Government
Association of South Australia for Net Financial Liability Ratio.
40
163
56
22
209
378
99
41
‐
50
100
150
200
250
300
350
400
2011 2012 2013 2014 2015 2016 2017 2018
Figure 8: Asset Sustainability Ratio (%)
43
60 68
88 92
84
100
67
‐
20
40
60
80
100
120
2011 2012 2013 2014 2015 2016 2017 2018
Figure 9: Net Financial Liabilities Ratio (%)

2017/2018 Annual Business Plan and 2018‐2027 Long Term Financial Plan 23
9. Long Term Financial Plan 2017/2018 to 2026/2027
Background
Section 122(1a) of the Local Government Act 1999 requires councils to develop and adopt:
(a) a Long Term Financial Plan (LTFP) for a period of at least 10 years; and
(b) an infrastructure and asset management plan, relating to the management and development of
infrastructure and major assets by the council for a period of at least 10 years (and these plans will
also be taken to form part of the council’s strategic management plans).
Section 122(4)(a)(i) the Act requires that the LTFP should be reviewed as soon as practical after the
adoption of the Annual Business Plan. However, section 122(4)(b) of the Act specifies that the Council must
undertake a comprehensive review of its Long Term Financial Plans within two (2) years after each general
election of the council.
The purpose of a Council’s LTFP is to express, in financial terms, the activities that it proposes to undertake
over the medium to longer term to achieve its stated objectives. It is similar to, but usually less detailed
than, the annual budget. Just like the budget, it is a guide for future action although its preparation
requires the Council to think about not just one year but the longer‐term impact of revenue and
expenditure proposals. The aggregation of future strategic plans and business initiatives and their intended
outlays and anticipated revenues, enables the accumulating overall financial and economic implications to
be readily identified and, if warranted, proposed future activities to be revised. The LTFP should specify and
take account of:
Expected expenses and capital outlays for each year of the plan;
Expected revenues for each year and their source;
Any variations in net debt required as a result of expected cash flow needs;
Performance measures to enable assessment of the Council’s financial sustainability over the period
of the plan.
9.1 Long Term Financial Objective of the Adelaide Plains Council
Long Term Financial Objective of Adelaide Plains Council is to be “a Council which delivers on its strategic
Objectives by managing its financial resources in a sustainable and equitable manner by incremental
growth and service cost containment to reduce the operating deficit over time; as opposed to burdening
the ratepayers of the Council with short term excessive increases to their annual council rate bill”.
Financial sustainability means having a financial position capable of meeting long‐term service and
infrastructure levels and standards, acceptable to the community, without substantial increases in rates or
cuts to services. The Long Term Financial Plan has been developed based on following budget principles.
They are;
Principle 1: Breakeven budget
Cost of annual Council’s services and programs, including depreciation of assets, are fully funded by the
current ratepayers being the consumers of those Council services, programs and assets.
Principle 2: Rate Stability
Annual rate collections are fair and equitable for the ratepayers with the aim to keep rate revenue
increases stable over the medium term.
Principle 3: Infrastructure and Asset Management

2017/2018 Annual Business Plan and 2018‐2027 Long Term Financial Plan 24
Maintain Infrastructure and Assets in line with the Council’s Infrastructure Asset Management Plans.
Principle 4: Prudent Debt Management
Prudent use of debt to invest in new long term assets to ensure intergenerational equity between current
and future users.
The Long Term Financial Plan (LTFP) provides the financial projections and budget framework to guide the
development of the detailed annul budget and provide a level of assurance to Elected Members and the
community on the sustainability of Council operations.
A 10 year Long Term Financial Plan summarises the financial impacts of Council’s strategic directions and
provides an indication of the sustainability of these plans. By evaluating our financial strategies over a
planning horizon of 10 years we can determine how decisions we make now and for the 2017/2018 budget
will impact on future and ensure the impact of rates is spread equitably across generations of ratepayers so
that planned service standards over the long term and infrastructure levels can be met without unplanned
and disruptive increases in rates or cuts to services.
The Long Term Financial Plan is prospective information. Actual results are likely to vary from the
information presented. Consequently, the information presented is prepared on the basis of best estimate
assumptions as to future events which Council expects are likely to take place. These estimates arise from
information known as at 30th June 2017.
Long Term Financial Plan has been developed as part of Council’s ongoing financial planning to assist
Council to plan within a longer term strategic framework. Key inputs and influences on the Long Term
Financial Plan include:
An assessment of Council's current financial position for achieving longer term financial
sustainability;
Alignment with the Strategic Plan;
Consideration of Council’s appropriate role and responsibilities;
Alignment with Council Programs;
Alignment with Corporate Programs and internal support strategies;
Alignment with agreed service provision and delivery standards;
Alignment with Infrastructure and Asset Management Plans; and
Costing of proposed strategies before they are agreed.
The LTFP for the period 2018‐2027 shows that Council is expected to make operating deficits for the next
four (4) financial years with a 3.00% increase in average rate (2.50% increase in rate the dollar by the
Council & 0.50% valuation increase by Valuer General) and 0.60% growth, excluding the impact of Two
Wells developments. Although the LTFP forecasts an operating surplus from year 5 (2021/2022) onwards,
Council should make it priority to return to budget breakeven earlier if possible, without putting more
financial burden on the Adelaide Plains community by a combination of actions such as;
a) Commitment to the annually Adopted Budget without bringing in new spending proposals during
the financial year unless they are cost neutral or really necessary to address significant community
issues;
b) Set all council discretionary fees & charges, including service charges on a cost recovery basis;
c) Commitment to Improve the efficiency & the productivity of the Council operations;
d) Reduce council’s operating/capital expenditure further to a level sustainable & accepted by the
Community;
e) Targeting government grants to supplement Council rates revenue in delivering Council programs
(co‐contribution from the Council may be required);

2017/2018 Annual Business Plan and 2018‐2027 Long Term Financial Plan 25
f) Introduce separate rate to meet expenses associated with deed of agreement (Two Wells
roundabout & levees) signed with the developers of Two Wells housing estate;
g) Increase Fixed Charge in line with the rate in the dollar;
h) Implement a freeze on recruitment of staff for new (& unfunded) positions (not the replacement of
existing positions); and
i) Continue to participate in collaborative procurements through LGA Procurement & Barossa
Regional Procurement Group (BRPG) to receive group discount on purchases etc.
9.2 Assumptions Used in the Preparation of Long Term Financial Plan 2017/2018 to 2026/2027
Table 7 below summarises the assumptions that were used in the preparation of 2017/2018 Budget and 10
year LTFP based on best available information as of 30 June 2017.
Table 7: Assumptions used in preparation of 10 year LTFP
Description Assumptions
Rates ‐ General Rates From year 1 to 10 a 3.00% increase in existing average rate (consists of 2.50%
rate in the $ increase by the Council & 0.50% valuation increase by the Valuer General) and 0.60% growth from new assessment. Long‐term Financial Plan does not include the financial impact of Two Wells housing development.
‐ CWMS Charge No change from the current level of $580. However, may be need to review the charge once the full cost of operating the scheme is known upon the hand over of the scheme to the Council later this year.
‐ Reuse Collection Charge No change from current level of $180 pending the outcome of tender process currently undertaken by BRPG.
‐ NRM Levy 1.30% from year 1 to 10.
‐ Fixed Charge 2.50% increase from year 1 to 10. Equivalent to rate in the $ increase. Statutory charges 1.30% on average over next 10 years User charges 1.30% on average over next 10 years Grants, subsidies and contributions
Based on confirmed grant funding only. No estimates were made for R2R grant after 2018/2019 as Federal Government is yet to confirm the amounts available to APC beyond 2018/2019. (i.e. R2R grant of $360,177 for 17/18 & $180,089 for 18/19 have been included in the budget. Financial Assistance Grants (FAGs) remain constant at 2017/2018 level of $1,294,389 for the next 10 years as the financial impact of Federal Government decision to return to FAGs indexation and supplementary road funding for SA from 2017/2018 Financial Year is yet to be determined.
Investment Income An estimated fixed income of $1,500 per year. Reimbursements 2.00% on average over next 10 years Other Income 2.00% on average over next 10 years Employee Costs 1.80% on average over next 10 years Materials, contracts and other expenses 1.30% on average over next 10 years
Depreciation 2.00% on average over next 10 years Finance Costs Based on actual interest payable on existing loans and expected interest
expense on new cash advance loans at 3.75%.
The following page shows Council’s Long Term Financial Plan for the 10 year period developed based on
above assumptions.
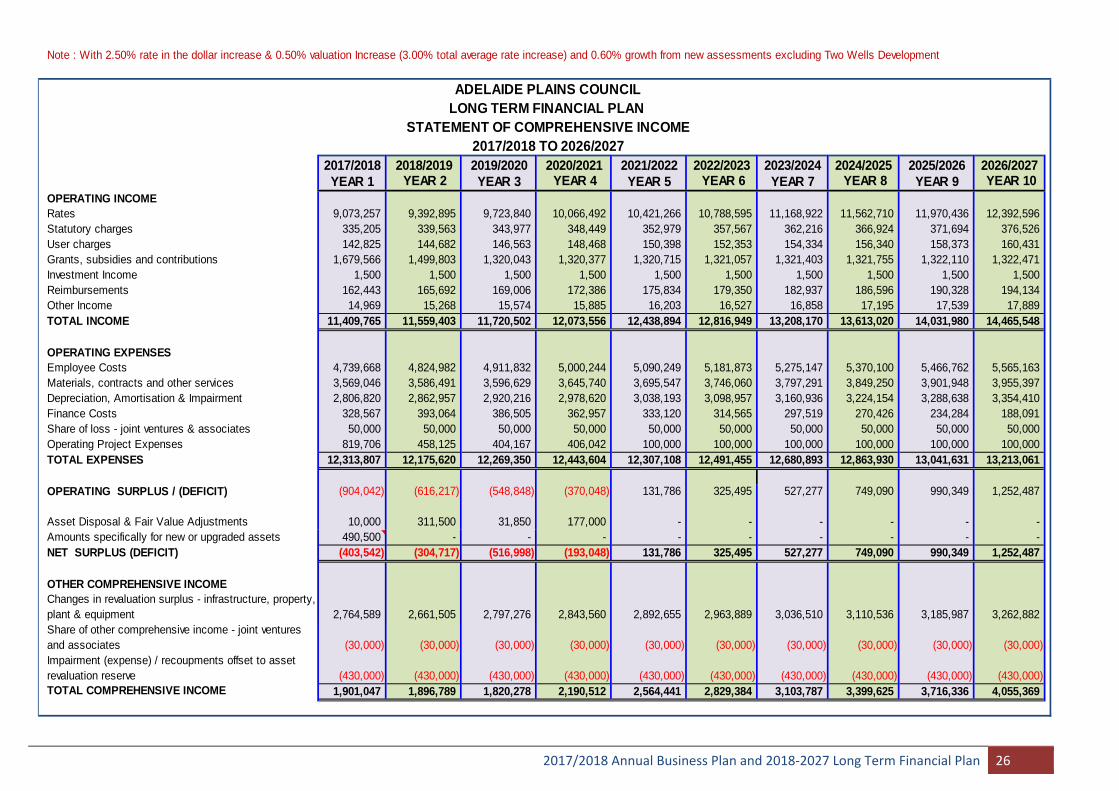
2017/2018 Annual Business Plan and 2018‐2027 Long Term Financial Plan 26
Note : With 2.50% rate in the dollar increase & 0.50% valuation Increase (3.00% total average rate increase) and 0.60% growth from new assessments excluding Two Wells Development
2017/2018 2018/2019 2019/2020 2020/2021 2021/2022 2022/2023 2023/2024 2024/2025 2025/2026 2026/2027YEAR 1 YEAR 2 YEAR 3 YEAR 4 YEAR 5 YEAR 6 YEAR 7 YEAR 8 YEAR 9 YEAR 10
OPERATING INCOMERates 9,073,257 9,392,895 9,723,840 10,066,492 10,421,266 10,788,595 11,168,922 11,562,710 11,970,436 12,392,596 Statutory charges 335,205 339,563 343,977 348,449 352,979 357,567 362,216 366,924 371,694 376,526 User charges 142,825 144,682 146,563 148,468 150,398 152,353 154,334 156,340 158,373 160,431 Grants, subsidies and contributions 1,679,566 1,499,803 1,320,043 1,320,377 1,320,715 1,321,057 1,321,403 1,321,755 1,322,110 1,322,471 Investment Income 1,500 1,500 1,500 1,500 1,500 1,500 1,500 1,500 1,500 1,500 Reimbursements 162,443 165,692 169,006 172,386 175,834 179,350 182,937 186,596 190,328 194,134 Other Income 14,969 15,268 15,574 15,885 16,203 16,527 16,858 17,195 17,539 17,889 TOTAL INCOME 11,409,765 11,559,403 11,720,502 12,073,556 12,438,894 12,816,949 13,208,170 13,613,020 14,031,980 14,465,548
OPERATING EXPENSESEmployee Costs 4,739,668 4,824,982 4,911,832 5,000,244 5,090,249 5,181,873 5,275,147 5,370,100 5,466,762 5,565,163 Materials, contracts and other services 3,569,046 3,586,491 3,596,629 3,645,740 3,695,547 3,746,060 3,797,291 3,849,250 3,901,948 3,955,397 Depreciation, Amortisation & Impairment 2,806,820 2,862,957 2,920,216 2,978,620 3,038,193 3,098,957 3,160,936 3,224,154 3,288,638 3,354,410 Finance Costs 328,567 393,064 386,505 362,957 333,120 314,565 297,519 270,426 234,284 188,091 Share of loss - joint ventures & associates 50,000 50,000 50,000 50,000 50,000 50,000 50,000 50,000 50,000 50,000 Operating Project Expenses 819,706 458,125 404,167 406,042 100,000 100,000 100,000 100,000 100,000 100,000 TOTAL EXPENSES 12,313,807 12,175,620 12,269,350 12,443,604 12,307,108 12,491,455 12,680,893 12,863,930 13,041,631 13,213,061
OPERATING SURPLUS / (DEFICIT) (904,042) (616,217) (548,848) (370,048) 131,786 325,495 527,277 749,090 990,349 1,252,487
Asset Disposal & Fair Value Adjustments 10,000 311,500 31,850 177,000 - - - - - - Amounts specifically for new or upgraded assets 490,500 - - - - - - - - - NET SURPLUS (DEFICIT) (403,542) (304,717) (516,998) (193,048) 131,786 325,495 527,277 749,090 990,349 1,252,487
OTHER COMPREHENSIVE INCOMEChanges in revaluation surplus - infrastructure, property, plant & equipment 2,764,589 2,661,505 2,797,276 2,843,560 2,892,655 2,963,889 3,036,510 3,110,536 3,185,987 3,262,882 Share of other comprehensive income - joint ventures and associates (30,000) (30,000) (30,000) (30,000) (30,000) (30,000) (30,000) (30,000) (30,000) (30,000) Impairment (expense) / recoupments offset to asset revaluation reserve (430,000) (430,000) (430,000) (430,000) (430,000) (430,000) (430,000) (430,000) (430,000) (430,000) TOTAL COMPREHENSIVE INCOME 1,901,047 1,896,789 1,820,278 2,190,512 2,564,441 2,829,384 3,103,787 3,399,625 3,716,336 4,055,369
ADELAIDE PLAINS COUNCILLONG TERM FINANCIAL PLAN
STATEMENT OF COMPREHENSIVE INCOME2017/2018 TO 2026/2027

2016-2017 Draft Annual Business Plan, Budget & Long Term Financial Plan (2016 to 2026) P a g e | 27
2017/2018 Annual Business Plan and 2018‐2027 Long Term Financial Plan 27
2017/2018 2018/2019 2019/2020 2020/2021 2021/2022 2022/2023 2023/2024 2024/2025 2025/2026 2026/2027
YEAR 1 YEAR 2 YEAR 3 YEAR 4 YEAR 5 YEAR 6 YEAR 7 YEAR 8 YEAR 9 YEAR 10 ASSETSCurrent AssetsCash and cash equivalents 21,472 4,928 85,351 229,963 112,707 178,166 220,127 284,341 365,993 421,717 Trade & other receivables 584,651 584,651 584,651 584,651 584,651 584,651 584,651 584,651 584,651 584,651 Inventories 266,000 266,000 266,000 266,000 266,000 266,000 266,000 266,000 266,000 266,000
Total Current Assets 872,123 855,579 936,002 1,080,614 963,358 1,028,817 1,070,778 1,134,992 1,216,644 1,272,368
Non-Current AssetsFinancial Assets (Investment in GRFMA) 4,758,438 4,678,438 4,598,438 4,518,438 4,438,438 4,358,438 4,278,438 4,198,438 4,118,438 4,038,438 Infrastructure, Property, Plant and Equipment 88,716,846 93,242,520 94,785,329 96,421,841 98,796,304 101,216,986 103,684,525 106,199,556 108,762,718 111,374,648 Other Non-current Assets 442,400 442,400 442,400 442,400 442,400 442,400 442,400 442,400 442,400 442,400
Total Non -Current Assets 93,917,684 98,363,358 99,826,167 101,382,679 103,677,142 106,017,824 108,405,363 110,840,394 113,323,556 115,855,486 Total Assets 94,789,806 99,218,937 100,762,169 102,463,293 104,640,499 107,046,642 109,476,141 111,975,387 114,540,200 117,127,854
LIABILITIESCurrent LiabilitiesTrade & Other Payables 1,189,400 1,189,400 1,189,400 1,189,400 1,189,400 1,189,400 1,189,400 1,189,400 1,189,400 1,189,400 Borrowings 2,816,658 6,036,046 6,248,387 6,266,234 5,902,241 5,503,287 4,854,380 3,980,522 2,856,715 1,417,962 Provisions 748,000 748,000 748,000 748,000 748,000 748,000 748,000 748,000 748,000 748,000
Total Current Liabilities 4,754,058 7,973,446 8,185,787 8,203,634 7,839,641 7,440,687 6,791,780 5,917,922 4,794,115 3,355,362
Non-current LiabilitiesBorrowings 3,473,790 2,786,743 2,297,356 1,790,122 1,766,880 1,742,593 1,717,213 1,690,691 1,662,976 1,634,013 Provisions 73,229 73,229 73,229 73,229 73,229 73,229 73,229 73,229 73,229 73,229
Total Non-current Liabilities 3,547,019 2,859,972 2,370,585 1,863,351 1,840,109 1,815,822 1,790,442 1,763,920 1,736,205 1,707,242 Total Liabilities 8,301,077 10,833,419 10,556,372 10,066,985 9,679,751 9,256,509 8,582,222 7,681,842 6,530,320 5,062,605 NET ASSETS 86,488,730 88,385,519 90,205,797 92,396,308 94,960,749 97,790,133 100,893,920 104,293,545 108,009,881 112,065,249
EQUITYAccumulated Surplus 29,713,115 29,408,399 28,891,401 28,698,353 28,830,138 29,155,633 29,682,910 30,432,000 31,422,349 32,674,836 Asset Revaluation Reserve 56,680,665 58,882,170 61,219,446 63,603,006 66,035,661 68,539,550 71,116,060 73,766,595 76,492,582 79,295,464 Other Reserves 94,950 94,950 94,950 94,950 94,950 94,950 94,950 94,950 94,950 94,950 TOTAL EQUITY 86,488,730 88,385,519 90,205,797 92,396,308 94,960,749 97,790,133 100,893,920 104,293,545 108,009,881 112,065,249
ADELAIDE PLAINS COUNCILLONG TERM FINANCIAL PLAN
STATEMENT OF FINANCIAL POSITION2017/2018 TO 2026/2027

2016-2017 Draft Annual Business Plan, Budget & Long Term Financial Plan (2016 to 2026) P a g e | 28
2017/2018 Annual Business Plan and 2018‐2027 Long Term Financial Plan 28
2017/2018 2018/2019 2019/2020 2020/2021 2021/2022 2022/2023 2023/2024 2024/2025 2025/2026 2026/2027YEAR 1 YEAR 2 YEAR 3 YEAR 4 YEAR 5 YEAR 6 YEAR 7 YEAR 8 YEAR 9 YEAR 10
ACCUMULATED SURPLUSBalance at end of previous reporting period 30,116,657 29,713,115 29,408,399 28,891,401 28,698,353 28,830,138 29,155,633 29,682,910 30,432,000 31,422,349 Net Result for Year (403,542) (304,717) (516,998) (193,048) 131,786 325,495 527,277 749,090 990,349 1,252,487 Balance at end of period 29,713,115 29,408,399 28,891,401 28,698,353 28,830,138 29,155,633 29,682,910 30,432,000 31,422,349 32,674,836
ASSET REVALUATION RESERVEBalance at end of previous reporting period 54,376,076 56,680,665 58,882,170 61,219,446 63,603,006 66,035,661 68,539,550 71,116,060 73,766,595 76,492,582 Gain on revaluation of infrastructure, property, plant & eq 2,764,589 2,661,505 2,797,276 2,843,560 2,892,655 2,963,889 3,036,510 3,110,536 3,185,987 3,262,882 Impairment (expense) / recoupments offset to asset reva (430,000) (430,000) (430,000) (430,000) (430,000) (430,000) (430,000) (430,000) (430,000) (430,000) Share of other comprehensive income - equity accounted (30,000) (30,000) (30,000) (30,000) (30,000) (30,000) (30,000) (30,000) (30,000) (30,000) Balance at end of period 56,680,665 58,882,170 61,219,446 63,603,006 66,035,661 68,539,550 71,116,060 73,766,595 76,492,582 79,295,464
OTHER RESERVESBalance at end of previous reporting period 94,950 94,950 94,950 94,950 94,950 94,950 94,950 94,950 94,950 94,950 Balance at end of period 94,950 94,950 94,950 94,950 94,950 94,950 94,950 94,950 94,950 94,950
TOTAL EQUITY AT END OF REPORTING PERIOD
86,488,730 88,385,519 90,205,797 92,396,308 94,960,749 97,790,133 100,893,920 104,293,545 108,009,881 112,065,249
ADELAIDE PLAINS COUNCILLONG TERM FINANCIAL PLAN
STATEMENT OF CHANGES IN EQUITY2017/2018 TO 2026/2027

2016-2017 Draft Annual Business Plan, Budget & Long Term Financial Plan (2016 to 2026) P a g e | 29
2017/2018 Annual Business Plan and 2018‐2027 Long Term Financial Plan 29
2017/2018 2018/2019 2019/2020 2020/2021 2021/2022 2022/2023 2023/2024 2024/2025 2025/2026 2026/2027
YEAR 1 YEAR 2 YEAR 3 YEAR 4 YEAR 5 YEAR 6 YEAR 7 YEAR 8 YEAR 9 YEAR 10 CASH FLOWS FROM OPERATING ACTIVITIES
Receipts Rates - general & other 9,073,257 9,392,895 9,723,840 10,066,492 10,421,266 10,788,595 11,168,922 11,562,710 11,970,436 12,392,596 Fees & other charges 335,205 339,563 343,977 348,449 352,979 357,567 362,216 366,924 371,694 376,526 User charges 142,825 144,682 146,563 148,468 150,398 152,353 154,334 156,340 158,373 160,431 Investment receipts 1,500 1,500 1,500 1,500 1,500 1,500 1,500 1,500 1,500 1,500 Grants utilised for operating purposes 1,679,566 1,499,803 1,320,043 1,320,377 1,320,715 1,321,057 1,321,403 1,321,755 1,322,110 1,322,471 Reimbursements 162,443 165,692 169,006 172,386 175,834 179,350 182,937 186,596 190,328 194,134 Other revenues 14,969 15,268 15,574 15,885 16,203 16,527 16,858 17,195 17,539 17,889 Payments Employee costs (4,739,668) (4,824,982) (4,911,832) (5,000,244) (5,090,249) (5,181,873) (5,275,147) (5,370,100) (5,466,762) (5,565,163) Materials, contracts & other expenses (4,388,752) (4,044,617) (4,000,797) (4,051,782) (3,795,547) (3,846,060) (3,897,291) (3,949,250) (4,001,948) (4,055,397) Finance payments (328,567) (393,064) (386,505) (362,957) (333,120) (314,565) (297,519) (270,426) (234,284) (188,091) Net Cash provided by (or used in) Operating Activitie 1,952,778 2,296,740 2,421,368 2,658,572 3,219,978 3,474,451 3,738,213 4,023,244 4,328,986 4,656,898
CASH FLOWS FROM INVESTING ACTIVITIESReceipts
Grants specifically for new or upgraded assets 490,500 - - - - - - - - - Sale of replaced assets 10,000 311,500 31,850 177,000 - - - - - -
PaymentsExpenditure on renewal/replacement of assets (1,164,779) (4,153,466) (1,746,589) (1,934,772) (2,750,000) (2,785,750) (2,821,965) (2,858,650) (2,895,813) (2,933,458) Expenditure on new/upgraded assets (934,180) (1,003,660) (349,160) (266,800) (200,000) (200,000) (200,000) (200,000) (200,000) (200,000)
Net Cash provided by (or used in) Investing Activitie (1,598,459) (4,845,626) (2,063,899) (2,024,572) (2,950,000) (2,985,750) (3,021,965) (3,058,650) (3,095,813) (3,133,458)
CASH FLOWS FROM FINANCING ACTIVITIESReceipts Proceeds from Borrowings 137,696 3,182,304 410,000 - 120,000 - - - - - Payments Repayments of Borrowings (614,893) (649,962) (687,046) (489,387) (507,234) (423,241) (674,287) (900,380) (1,151,522) (1,467,715) Net Cash provided by (or used in) Financing Activities (477,197) 2,532,342 (277,046) (489,387) (387,234) (423,241) (674,287) (900,380) (1,151,522) (1,467,715) Net Increase (Decrease) in cash held (122,877) (16,544) 80,423 144,612 (117,256) 65,460 41,961 64,214 81,652 55,724
Cash & cash equivalents at beginning of period 144,349 21,472 4,928 85,351 229,963 112,707 178,166 220,127 284,341 365,993 Cash & cash equivalents at end of period 21,472 4,928 85,351 229,963 112,707 178,166 220,127 284,341 365,993 421,717
STATEMENT OF CASH FLOWS2017/2018 TO 2026/2027
ADELAIDE PLAINS COUNCILLONG TERM FINANCIAL PLAN

2016-2017 Draft Annual Business Plan, Budget & Long Term Financial Plan (2016 to 2026) P a g e | 30
2017/2018 Annual Business Plan and 2018‐2027 Long Term Financial Plan 30
2017/2018 2018/2019 2019/2020 2020/2021 2021/2022 2022/2023 2023/2024 2024/2025 2025/2026 2026/2027YEAR 1 YEAR 2 YEAR 3 YEAR 4 YEAR 5 YEAR 6 YEAR 7 YEAR 8 YEAR 9 YEAR 10
Operating Revenues 11,409,765 11,559,403 11,720,502 12,073,556 12,438,894 12,816,949 13,208,170 13,613,020 14,031,980 14,465,548 less Operating Expenses (12,313,807) (12,175,620) (12,269,350) (12,443,604) (12,307,108) (12,491,455) (12,680,893) (12,863,930) (13,041,631) (13,213,061) Operating Surplus / (Deficit) before Capital Amounts (904,042) (616,217) (548,848) (370,048) 131,786 325,495 527,277 749,090 990,349 1,252,487 less Net Outlays on Existing Assets
Capital Expenditure on renewal and replacement of Existing Assets 1,164,779 4,153,466 1,746,589 1,934,772 2,750,000 2,785,750 2,821,965 2,858,650 2,895,813 2,933,458 less Depreciation, Amortisation and Impairment (2,806,820) (2,862,957) (2,920,216) (2,978,620) (3,038,193) (3,098,957) (3,160,936) (3,224,154) (3,288,638) (3,354,410) less Proceeds from Sale of Replaced Assets (10,000) (311,500) (31,850) (177,000) - - - - - -
(1,652,042) 979,009 (1,205,477) (1,220,848) (288,193) (313,207) (338,971) (365,504) (392,825) (420,952) less Net Outlays on New and Upgraded Assets
Capital Expenditure on New and Upgraded Assets 934,180 1,003,660 349,160 266,800 200,000 200,000 200,000 200,000 200,000 200,000 less Amounts received specifically for New and Upgraded Assets (490,500) - - - - - - - - -
443,680 1,003,660 349,160 266,800 200,000 200,000 200,000 200,000 200,000 200,000
Net Lending / (Borrowing) for Financial Year 304,320 (2,598,886) 307,469 584,000 219,978 438,701 666,248 914,594 1,183,174 1,473,439
ADELAIDE PLAINS COUNCIL
UNIFORM PRESENTATION OF FINANCES2017/2018 TO 2026/2027
LONG TERM FINANCIAL PLAN
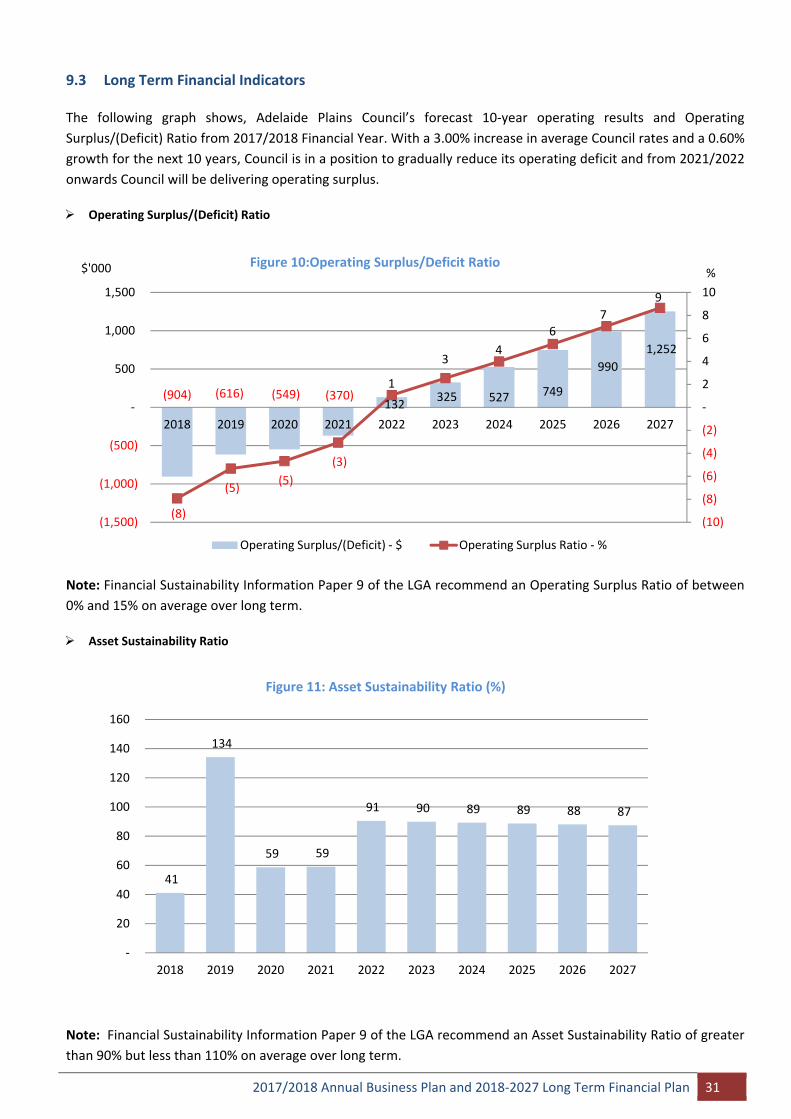
2017/2018 Annual Business Plan and 2018‐2027 Long Term Financial Plan 31
9.3 Long Term Financial Indicators
The following graph shows, Adelaide Plains Council’s forecast 10‐year operating results and Operating
Surplus/(Deficit) Ratio from 2017/2018 Financial Year. With a 3.00% increase in average Council rates and a 0.60%
growth for the next 10 years, Council is in a position to gradually reduce its operating deficit and from 2021/2022
onwards Council will be delivering operating surplus.
Operating Surplus/(Deficit) Ratio
Note: Financial Sustainability Information Paper 9 of the LGA recommend an Operating Surplus Ratio of between
0% and 15% on average over long term.
Asset Sustainability Ratio
Note: Financial Sustainability Information Paper 9 of the LGA recommend an Asset Sustainability Ratio of greater
than 90% but less than 110% on average over long term.
(904) (616) (549) (370)132
325 527 749
990
1,252
(8)
(5)(5)
(3)
1
3 4
6
7
9
(10)
(8)
(6)
(4)
(2)
‐
2
4
6
8
10
(1,500)
(1,000)
(500)
‐
500
1,000
1,500
2018 2019 2020 2021 2022 2023 2024 2025 2026 2027
%$'000 Figure 10:Operating Surplus/Deficit Ratio
Operating Surplus/(Deficit) ‐ $ Operating Surplus Ratio ‐ %
41
134
59 59
91 90 89 89 88 87
‐
20
40
60
80
100
120
140
160
2018 2019 2020 2021 2022 2023 2024 2025 2026 2027
Figure 11: Asset Sustainability Ratio (%)
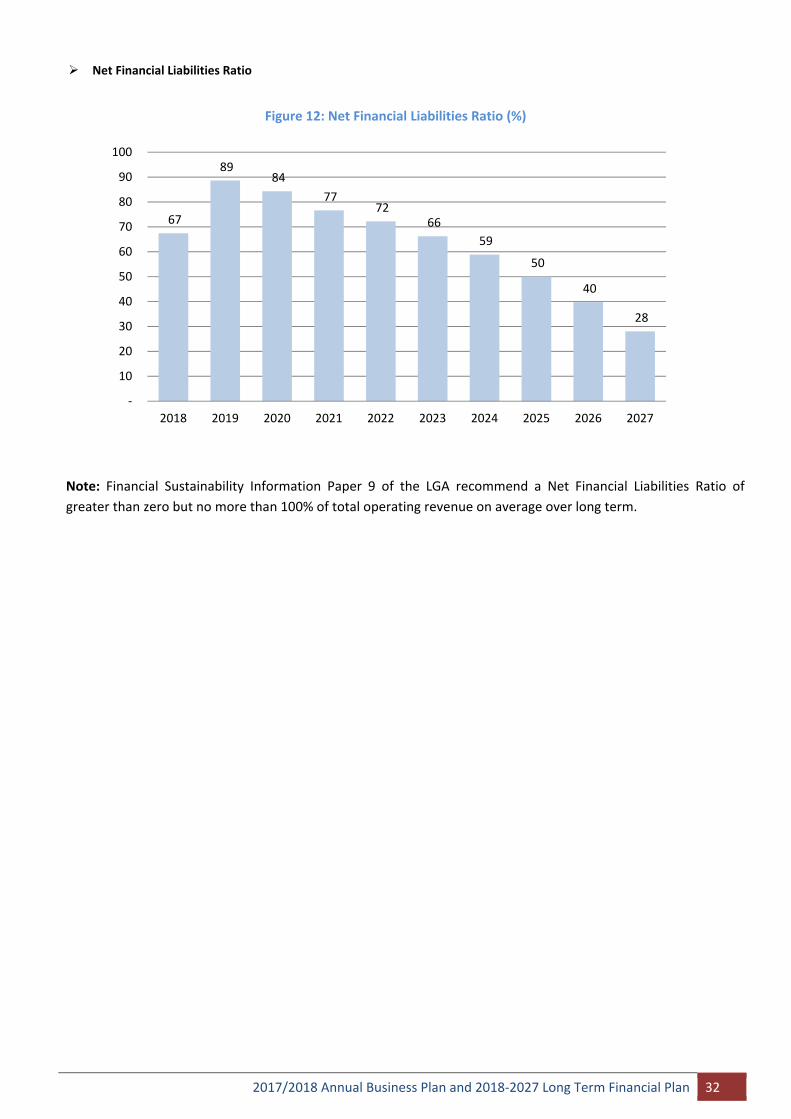
2017/2018 Annual Business Plan and 2018‐2027 Long Term Financial Plan 32
Net Financial Liabilities Ratio
Note: Financial Sustainability Information Paper 9 of the LGA recommend a Net Financial Liabilities Ratio of
greater than zero but no more than 100% of total operating revenue on average over long term.
67
89 84
77 72
66
59
50
40
28
‐
10
20
30
40
50
60
70
80
90
100
2018 2019 2020 2021 2022 2023 2024 2025 2026 2027
Figure 12: Net Financial Liabilities Ratio (%)