Annual Budget - Nyandeni Local Municipalitynyandenilm.gov.za/wp-content/uploads/documents/EC155...3...
61
1 NYANDENI LOCAL MUNICIPALITY Annual Budget 3 Year Plan: 2015/16 to 2018
Transcript of Annual Budget - Nyandeni Local Municipalitynyandenilm.gov.za/wp-content/uploads/documents/EC155...3...
1
NYANDENI LOCAL MUNICIPALITY
Annual Budget
3 Year Plan: 2015/16 to 2018
2
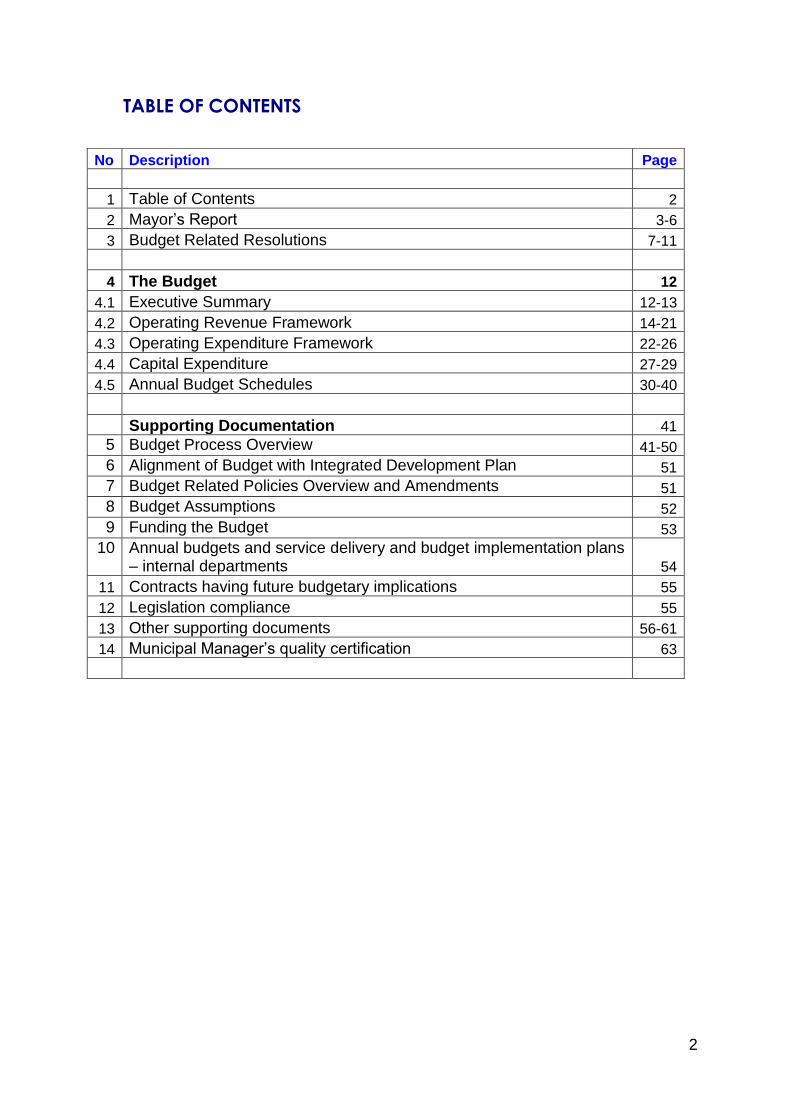
TABLE OF CONTENTS
No Description Page
1 Table of Contents 2
2 Mayor’s Report 3-6
3 Budget Related Resolutions 7-11
4 The Budget 12
4.1 Executive Summary 12-13
4.2 Operating Revenue Framework 14-21
4.3 Operating Expenditure Framework 22-26
4.4 Capital Expenditure 27-29
4.5 Annual Budget Schedules 30-40
Supporting Documentation 41
5 Budget Process Overview 41-50
6 Alignment of Budget with Integrated Development Plan 51
7 Budget Related Policies Overview and Amendments 51
8 Budget Assumptions 52
9 Funding the Budget 53
10 Annual budgets and service delivery and budget implementation plans – internal departments 54
11 Contracts having future budgetary implications 55
12 Legislation compliance 55
13 Other supporting documents 56-61
14 Municipal Manager’s quality certification 63

Annual Budget 2015-16 to 2018 Page 3
2. MAYOR’S REPORT
Section 153 of the Constitution of the Republic of South Africa, 1996, prescribe that a
municipality must (a) structure and manage its administration and budgeting and
planning processes to give priority to the basic needs of the community, and to
promote the social and economic development of the community; and (b) participate
in national and provincial development programmes
To give effect to the above constitutional provisions, section 34 of the Local
Government: Municipal Systems Act, 2000, prescribe that a municipal council must
review its integrated development plan (I) annually in accordance with an
assessment of its performance measurements in terms of section 41 and (ii) to the
extent that changing circumstances so demand.
The IDP Review for 2015/16 has taken into account the national and provincial
planning imperatives unpacked below
BACK TO BASICS LOCAL GOVERNMENT STRATEGY
Back to Basics Local Government Strategy which has identified the following pillars
• Putting people first
• Delivering basic services
• Good governance
• Sound financial management and
• Building capacity
Concerted efforts has been made to incorporate these pillars into integrated
Development Strategy in this regard will call upon all stakeholders to work with the
municipality in achieving the objectives of the strategy.
Eastern Cape Provincial Medium Term Strategic Framework

Annual Budget 2015-16 to 2018 Page 4
In 2014, on the occasion of the State of the Province Address the Honourable
Premier P Masualle announced seven Provincial Medium Term Strategic Framework
Priorities, and these are
Priority 1: Promoting quality education and skills development
Priority 2: Better health care for all
Priority 3: Stimulating rural development, land reform and food security
Priority 4: Transforming the economy to create jobs and sustainability livelihoods
Priority 5: Intensifying the fight against crime and corruption
Priority 6: Integrated human settlement and building cohesive communities
Priority 7: Strengthening the developmental state and good governance
In line with the above developmental trajectory the municipality has identified and
adopted the following key programmes for 2015/2016 financial year
1. On Good Governance and Public Participation
Strengthening Public Participation through our signature programme of civil
education and support to ward committees
Conduct Community Satisfaction Surveys
Improve Complaints management system
Development of Nyandeni Development Plan (2030 Vision) taking tune
from the Provincial Development Plan
Improving Communication
Strengthening Intergovernmental Relations
Support to Ematholeni: Children First programme (ECD)
Development of Good Governance Framework
2. On Financial Viability and Management
Improving Revenue management
Credit Control
Implementation of the Audit Action Plan and preparation for 2014/2015
Strengthening Supply Chain Management systems and processes
Expenditure management
Asset management
3. On Basic Service Delivery and Infrastructure

Annual Budget 2015-16 to 2018 Page 5
Electrification programme
Accelerating delivery of Access roads and maintenance of the existing road
network
Storm water management
Integrated waste management
Transport Planning and Public Safety
Environmental Management and compliance
4. On Local Economic Development
Support to small scale farming
Massive crop production programme through ILIMA LABANTU Initiative
Local Tourism development and promotion
Support to SMME’s and Cooperatives
Development of Local SDF’s and land use management
5. On Institutional Development and Transformation
Development of new Policies and reviewal of existing policies
Development of Bylaws
Organisational Structure review
Employment Equity Plan
Expansion of existing Offices in Ngqeleni
Filling of budget vacant posts
Employee wellness programmes
Office support and Facilities Management
Improving ICT management and systems
Medium Term Strategic Service Delivery objectives
This section reflect the service delivery highlights for 2014/2015
1. To Improve Municipal Planning and policy development
IDP, budget and SDBIP for 2014/2015 were compiled and Adopted by
Council on time and in accordance with the norms and standards as
prescribed by National Treasury
Financial policies have been reviewed and adopted by council
Received unqualified audit opinion for 2013/2014 financial year
2. To ensure a tool for measuring achievement of pre-determined
objectives

Annual Budget 2015-16 to 2018 Page 6
Mid-year performance assessment report compiled and adopted by
Council
MSA s46 report compiled and approved by Council
Annual report for 2013/14 tabled to Council and Oversight report
approved by council on 23 February 2015
3. Internal auditing and internal control
A detailed Audit Plan developed and is being implemented
Audit and Performance Management Committee is in place
4. To ensure good governance and public participation
All wards committees have been established and are participating in
municipal development programmes
IDP and Budget Public Hearings were conducted
Fraud Prevention Policy has been developed
Risk Management Framework, Register and policy developed
Civil Education Programme conducted
5. To improve livelihood in urban and rural areas through infrastructure
development and maintenance
Continuous Streets lights have been maintained in both towns of Libode
and Ngqeleni
The municipality has achieved the annual target of constructing and
maintaining 206.7 km.
Roads forum is in place and functional
Integrated Waste Management Plan (IMWP) have been developed and
adopted by Council
Permit application for Landfill site has been approved
Maintenance and construction of access road done
Implemented electrification programme in collaboration with the
Department of Energy
Construction of Transport Hub in progress
Construction of Community Stadium in ward 7 in progress
SANRAL is responsible for construction, upgrading and maintenance of
National and Provincial Roads

Annual Budget 2015-16 to 2018 Page 7
3BUDGET RELATED RESOLUTIONS Annual Budget for 2015/16
3.1 Council resolves that the multi-year annual budget of capital and operating expenditure
for 2015/2016 and the indicated two outer years of 2016/2017 and 2017/2018 which willbeen tabled for public scrutiny be approved as set out by the following amended tables:
Table A1 Budget summary
Table A2 : Budgeted financial performance (revenue and expenditure by standard
classification)
Table A3 : Budgeted financial performance (revenue and expenditure by
municipal vote)
Table A4 : Budget financial performance (revenue and expenditure)
Table A5 : Budgeted capital expenditure by vote and funding
Table A6 : Budgeted financial position
Table A7 : Budgeted cash flows
Table A8 : Cash backed reserves / accumulate surplus reconciliation
Table A9 : Asset management
Multi Year Capital Budget
3.2Council resolves that multi-year capital appropriations by vote and associated funding
reflected in Table A5 be approved.
Property Rates and other Municipal Tax
3.3. That, in terms of section 24 of the Local Government Municipal Property Rates Act,
Act 6 of 2004, rates differentiating among the different categories of properties
determined by the actual use, the zoning and/or permitted use of properties, for
property tax be levied on market value of all rateable properties within the municipal
area for the financial year 1 July 2015 to 30 June 2016, provided that rebates, as
indicated, on application be allowed:

Annual Budget 2015-16 to 2018 Page 8
Tariffs and Charges
3.4 Council resolves that the following tariffs and charges be applied.
1.HALL HIRE CHARGES 2014/2015 AT 5.9 CPIX
2015/2016 at 6%
2016/2017 2017/2018
Meeting, workshop, conference Memorial & Religious services Concerts, Contests & shows Wedding, Parties Gospel concerts, shows (day/night), traditional shows, exhibition, launch, farewell, graduation, celebration, day of prayer
R169.00 R284.00 R567.00 R708.00 R426.00
R177.00 R301.00 R601.00 R750.00 R452.00
R188.00 R319.00 R637.00 R796.00 R479.00
R199.00 R338.00 R675.00 R843.00 R508.00
2. SECURITY FEES Memorial, religious services Concerts, contests & shows (day/night) Parties, discos Weddings Gospel concerts, shows (day/night)
R 284.00 R 849.00 R1 417.00 R 991.00 R 284.00
R301.00 R900.00 R1 502.00 R1 050.00 R301.00
R319.00 R954.00 R1 592.00 R1 113.00 R319.00
R338.00 R1 011.00 R1 688.00 R1 180.00 R338.00
3. WOODSALE Head load Bakkie Truck Lantjies Lantjies Poles Tree
R14.00 R212.00 R426.00 R7.00 R13.00 R5.00 R21.00
R15.00 R225.00 R452.00 R7.40 R14.00 R5.30 R22.00
R16.00 R238.00 R479.00 R7.90 R15.00 R5.60 R24.00
R17.00 R252.00 R507.00 R8.00 R15.00 R6.00 R25.00
4. POUND FEES Entrance fee Driving fee Day charges Outgoing fees Cattle, horse Sheep & Goat
R70.00 R57.00 R28.00 R70.00 R57.00 R29.00
R74.00 R60.00 R30.00 R74.00 R60.00 R31.00
R79.00 R64.00 R31.00 R79.00 R64.00 R33.00
R83.00 R68.00 R33.00 R83.00 R68.00 R35.00
5. REFUSE REMOVAL Households Businesses: General : Big Retailers Government: Category 1 :Category2 Churches
R25.00 R142.00 R374.00 R142.00 2722.00 R25.00
R27.00 R151.00 R396.00 R151.00 R2885.00 R26.50
R28.00 R160.00 R420.00 R160.00 R3 058.00 R28.00
R30.00 R169.00 R445.00 R169.00 R3 242.00 R30.00
6. CEMETERY Living in town Outside town
R294.00 R413.00
R312.00 R438.00
R330.00 R464.00
R350.00 R492.00
7. TENDER FEES R50 000.00-R200 000.0 R200 000.00-R500 000.00 R500 000.00-R800 000.00 R800 000.00-R1000 000.00 Or More
R212.00 R284.00 R355.00 R426.00
R225.00 R301.00 R376.00 R452.00
R238.00 R319.00 R399.00 R479.00
R252.00 R338.00 R423.00 R507.00
8. BUSINESS LICENCE
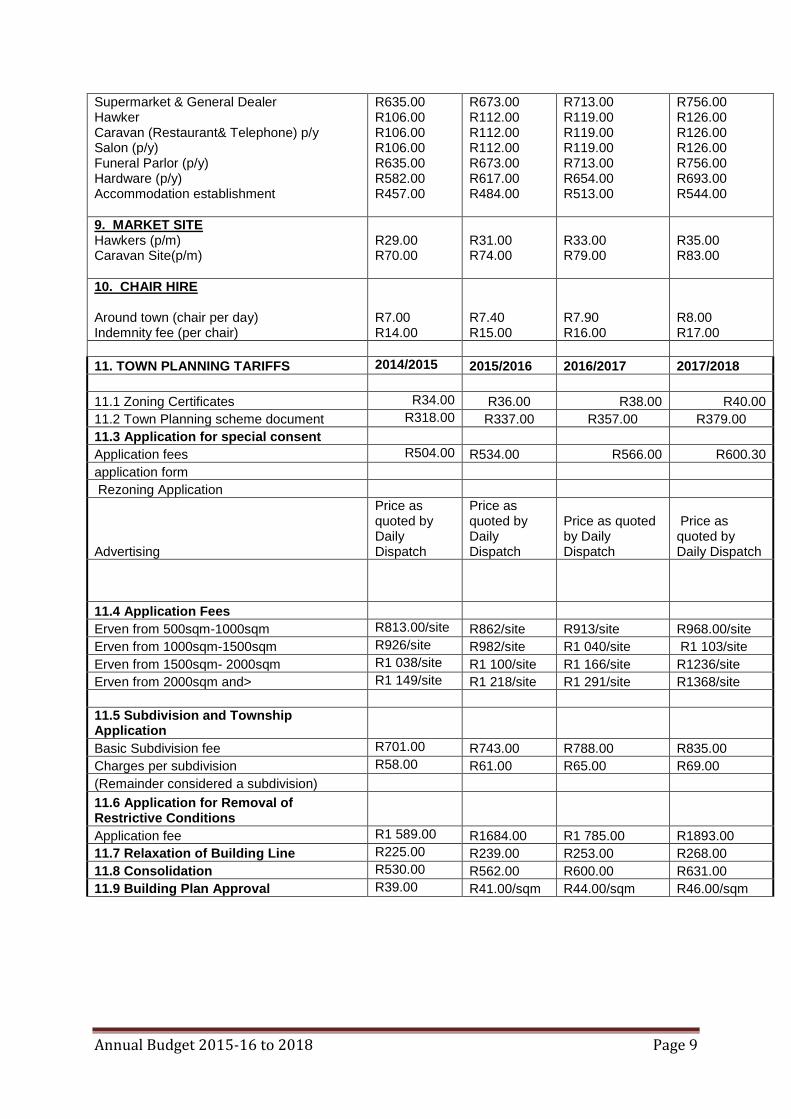
Annual Budget 2015-16 to 2018 Page 9
Supermarket & General Dealer Hawker Caravan (Restaurant& Telephone) p/y Salon (p/y) Funeral Parlor (p/y) Hardware (p/y) Accommodation establishment
R635.00 R106.00 R106.00 R106.00 R635.00 R582.00 R457.00
R673.00 R112.00 R112.00 R112.00 R673.00 R617.00 R484.00
R713.00 R119.00 R119.00 R119.00 R713.00 R654.00 R513.00
R756.00 R126.00 R126.00 R126.00 R756.00 R693.00 R544.00
9. MARKET SITE Hawkers (p/m) Caravan Site(p/m)
R29.00 R70.00
R31.00 R74.00
R33.00 R79.00
R35.00 R83.00
10. CHAIR HIRE Around town (chair per day) Indemnity fee (per chair)
R7.00 R14.00
R7.40 R15.00
R7.90 R16.00
R8.00 R17.00
11. TOWN PLANNING TARIFFS 2014/2015 2015/2016 2016/2017 2017/2018
11.1 Zoning Certificates R34.00 R36.00 R38.00 R40.00
11.2 Town Planning scheme document R318.00 R337.00 R357.00 R379.00
11.3 Application for special consent
Application fees R504.00 R534.00 R566.00 R600.30
application form
Rezoning Application
Advertising
Price as quoted by Daily Dispatch
Price as quoted by Daily Dispatch
Price as quoted by Daily Dispatch
Price as quoted by Daily Dispatch
11.4 Application Fees
Erven from 500sqm-1000sqm R813.00/site R862/site R913/site R968.00/site
Erven from 1000sqm-1500sqm R926/site R982/site R1 040/site R1 103/site
Erven from 1500sqm- 2000sqm R1 038/site R1 100/site R1 166/site R1236/site
Erven from 2000sqm and> R1 149/site R1 218/site R1 291/site R1368/site
11.5 Subdivision and Township Application
Basic Subdivision fee R701.00 R743.00 R788.00 R835.00
Charges per subdivision R58.00 R61.00 R65.00 R69.00
(Remainder considered a subdivision)
11.6 Application for Removal of Restrictive Conditions
Application fee R1 589.00 R1684.00 R1 785.00 R1893.00
11.7 Relaxation of Building Line R225.00 R239.00 R253.00 R268.00
11.8 Consolidation R530.00 R562.00 R600.00 R631.00
11.9 Building Plan Approval R39.00 R41.00/sqm R44.00/sqm R46.00/sqm

Annual Budget 2015-16 to 2018 Page 10
RATES TARRIF DETERMINATION OF TARIF AS PER CATERGORY AS FROM 1 JULY 2015-30 JUNE 2016
CATERGORY TARRIF
Residential Property 0.0078
Businesses 0.0116
Government1 0.0116
government2 0.0116
Agriculture1 0.0101
Agriculture2 0.0101
Institutions 0.0116
Clinics 0.0116
Hospital 0.0116
Schools 0.0116
Trading Stations 0.0116
R 61 Road 0.0019
N2 Road 0.0019
Category2
2014/2015 2015/2016 2016/2017 2017/2018
Refuse Removal R142.00 R150.50 R160.00 R169.00
Bags (1000*R0,80) (1000*.95) R953.00
(1000*R1,01) R1 010.00
(1000*R1,07) R1 070.00
(1000*R1,13) R1 130
Mileage (24km*2days*4weeks in month) R1 627 R1 627.00 R1 725.00 R1 828.00 R1 938.00
R2 722 R2 885.50 R3 058.00
R3 237.00
NOTES
Property rates –no change in tariffs
Other tariffs – 6% increase based on CPIX across the board will be a fair percentage so as to be close to the tariffs levied by other rural municipalities.
On Refuse Removal -6% increase.
General business is classified as your small micro medium enterprises (SMME’S).
-Big Retailers are classified as those bigger than general business, e.g:- Superspar, U-Save, Build it etc.
-Category1 for government Offices and other government institutions.
-Category2 will be your Hospitals.

Annual Budget 2015-16 to 2018 Page 11
Measurable Performance Objectives 3.5 Council resolves that the measurable performance objectives for revenue from each
source and for each vote reflect the budget.
Integrated Development Plan
3.6 Council resolves to approve the implementation of the Integrated Development Plan.
Budget Related Polices
3.7 Council resolves that the following budget related polices be approved
Supply Chain Management
Fleet Management
Asset Management
Credit Control and Debt Collection
Budget Policy
Bad debts write off
Rates policy
Tariff policy
Banking and investment policy
Virement policy
Expenditure Management Policy
Cashflow
3.8 Council resolves that the projects identified for implementation are subject to funds
available from grants in respect of Equitable share, Integrated National Electrification
Programme,(Municipal) Grant,Expanded Public Works Programme Incentive Grant,
Municipal Infrastructure Grant.
Annual Budget 2015-16 to 2018 Page 12
4THE BUDGET This section contains an Executive Summary of the annual budget, highlighting the processes and assumptions which lead to the compilation of the draft annual budget.
4.1 Executive Summary
Overview The budget process is governed by the Municipal Finance Management Act 56 of 2003 and the Municipal Systems Act 32 of 2000. The objective process is to ensure good governance and accountability and enables the municipality to involve residents and other stakeholders in the budgeting process. In terms of Section 16 (1) and (2) of the Municipal Finance Management Act no 56 of 2003: (1) The council of a municipality must for each financial year approve an annual budget
for the municipality before the start of that financial year. (2) In order for the municipality to comply with subsection (1), the mayor of the
municipality must table the annual budget at a council meeting at least 90 days before the start of the budget year.
In terms of Section 24 (1) and (2) of the Municipal Finance Management Act (MFMA) No 56, 2003: “(1) The municipal council must at least 30 days before the start of the budget year consider approval of the annual budget. (2) An annual budget – (a) must be approved before the start of the budget year; (b) is approved by the adoption by the council of a resolution referred to in section 17(3)(a)(i); and (c) must be approved together with the adoption of resolutions as may be necessary – (i) imposing any municipal tax for the budget year; (ii) setting any municipal tariffs for the budget year; (iii) approving measurable performance objectives for revenue from each source and for each vote in the budget; (iv) approving any changes to the municipality’s integrated development plan; and (v) approving any changes to the municipality’s budget-related policies.”
The application of sound financial management principles for the compilation of the NLM’s financial plan is essential and critical to ensure that the NLM remains financially viable and that municipal services are provided sustainably, economically and equitably to all communities
The NLM’s business and service delivery priorities were reviewed as part of this year’s planning and budget process. Where appropriate, funds were transferred from low- to high-priority programmes so as to maintain sound financial stewardship.
The following budget principles and guidelines directly informed the compilation of the 2015/16 MTREF:

Annual Budget 2015-16 to 2018 Page 13
The 2014/15 Adjustments Budget priorities and targets, as well as the base line allocations contained in that Adjustments Budget were adopted as the upper limits for the new baselines for the 2015/16draft annual budget;
Intermediate service level standards were used to inform the measurable objectives, targets and backlog eradication goals;
Tariff and property rate increases should be affordable and should generally not exceed inflation as measured by the CPI, except where there are price increases in the inputs of services that are beyond the control of the municipality. In addition, tariffs need to remain or move towards being cost reflective, and should take into account the need to address infrastructure backlogs;
There will be no budget allocated to national and provincial funded projects unless the necessary grants to the municipality are reflected in the national and provincial budget and have been gazetted as required by the annual Division of Revenue Act;
National Treasury’s MFMA Circular No. 66 ,67,70 , 72, 74 and 75 were used to guide the compilation of the 2015/16 MTREF.
In view of the aforementioned, the following table is a consolidated overview of the proposed 2015/16 Medium-term Revenue and Expenditure Framework: TABLE 1 CONSOLIDATED OVERVIEW OF 2015/16 MTERF
R thousand
Adjustment Budget 2014/15
Budget Year 2015/16
Budget Year +1 2016/17
Budget Year +2 2017/18
Total Operating Revenue Total Operating Expenditure
220 587 000 258 684 000
267 166 000 317 760 000
263564 000 328 739 000
259 776000 335 205 000
Surplus /(deficit) for the year
(38 097 000) (50 594 000) (65 175 000) (75 429 000)
Total Capital Expenditure
67 102 000 77 318 000 70 819 000 65 312 000
Total operating revenue has grown by 21 per cent or R46, 5 million for the 2015/16 financial year when compared to the 2014/15 Adjustments Budget. For the two outer years, operational revenue will decrease by 1.35% or R3.6 million, and decreased by 1.44 or R3,7 million. Total operating expenditure for the 2015/16 financial year has been appropriated at R317 760 000million and translates into a deficit where total expenditure exceeds the total revenue. When compared to the 2014/15 Adjustments Budget, operational expenditure has grown by an amount of R59 076 000 which is 22.84 per cent, and in 2016/17 by 3.46 per cent (R10,9 million), and increasedin 2017/18 by 1.97 per cent(R6,46 million)for each of the respective outer years of the MTREF. The municipality has a deficit of R50 594 000 for 2015/16, R65 175 000 for 2016/17, and R75429 for 2017/18. This is due to the depreciation that has been budgeted for 2015/16 until 2017/18. Depreciation is a non-cash item but the municipality still needs to show it its budget. The capital budget of R77318 000 for 2015/16 hasincreased by an amount of R10216 000 which is 15.22% as compared to previous year. The increase is due to the funding that has been sourced from the equitable share to fund the capital expenditures. For the two outer

Annual Budget 2015-16 to 2018 Page 14
years, capital expenditure has decreased by R6 499 000 and R5 507 000 which is 8 per cent and 7,78 per cent. A substantial portion of the capital budget is currently funded from the conditional grants over the MTERF.
4.2 OPERATING REVENUE FRAMEWORK
The NLM will be implementing its revenue enhancement strategy which is built around the following key components
National Treasury’s guidelines and macroeconomic policy;
The municipality’s Property Rates Policy approved in terms of the Municipal Property Rates Act, 2004 (Act 6 of 2004) (MPRA);
The municipality‟s Indigent Policy and rendering of free basic services; and
Tariff policies of the NLM.
Implementation of its Credit Control and Debt Collection policy and by-laws

Annual Budget 2015-16 to 2018 Page 15

16
The following table is a summary of the 2015/16 MTREF (classified by main revenue source): Table 2 Summary of revenue classified by main revenue source
Budgeted Financial Performance (revenue )
Description Ref 2011/12 2012/13 2013/14 Current Year 2014/15 2015/16 Medium Term Revenue &
Expenditure Framework
R thousand 1 Audited
Outcome Audited
Outcome Audited
Outcome Original Budget
Adjusted Budget
Full Year Forecast
Pre-audit outcome
Budget Year
2015/16
Budget Year +1 2016/17
Budget Year +2 2017/18
Revenue By Source
Property rates 2 4 356 4 692 5 259 5 005 5 005 5 005 5 005 5 317 5 637 5 980 Property rates - penalties & collection
charges
Service charges - electricity revenue 2 –
–
–
–
–
–
–
–
–
–
Service charges - water revenue 2 –
–
–
–
–
–
–
–
–
–
Service charges - sanitation revenue 2 –
–
–
–
–
–
–
–
–
–
Service charges - refuse revenue 2 159 168 178 200 200 200 200 212 225 238
Service charges - other
Rental of facilities and equipment 102 137 144 165 165 165 165 175 185 197
Interest earned - external investments 2 552 2 850 4 743 5 000 5 000 5 000 5 000 5 300 5 618 5 955
Interest earned - outstanding debtors
Dividends received
Fines 602 277 59 50 50 50 50 53 56 60
Licences and permits 1 647 1 696 3 252 6 500 6 500 6 500 6 500 8 890 9423 9998
Agency services
Transfers recognised - operational 122 525 131 018 157 576 173 502 183 230 183 230 183 230 245 817 240 878 235 626
Other revenue 2 1 096 5 928 1 451 16 125 20 438 20 438 20 438 1 402 1 541 1 732
Gains on disposal of PPE
Total Revenue (excluding capital transfers and contributions)
133 038 146 766 172 663 206 547 220 587 220 587 220 587 267 166 263564 259776
Annual Budget 2015-16 to 2018 Page 17
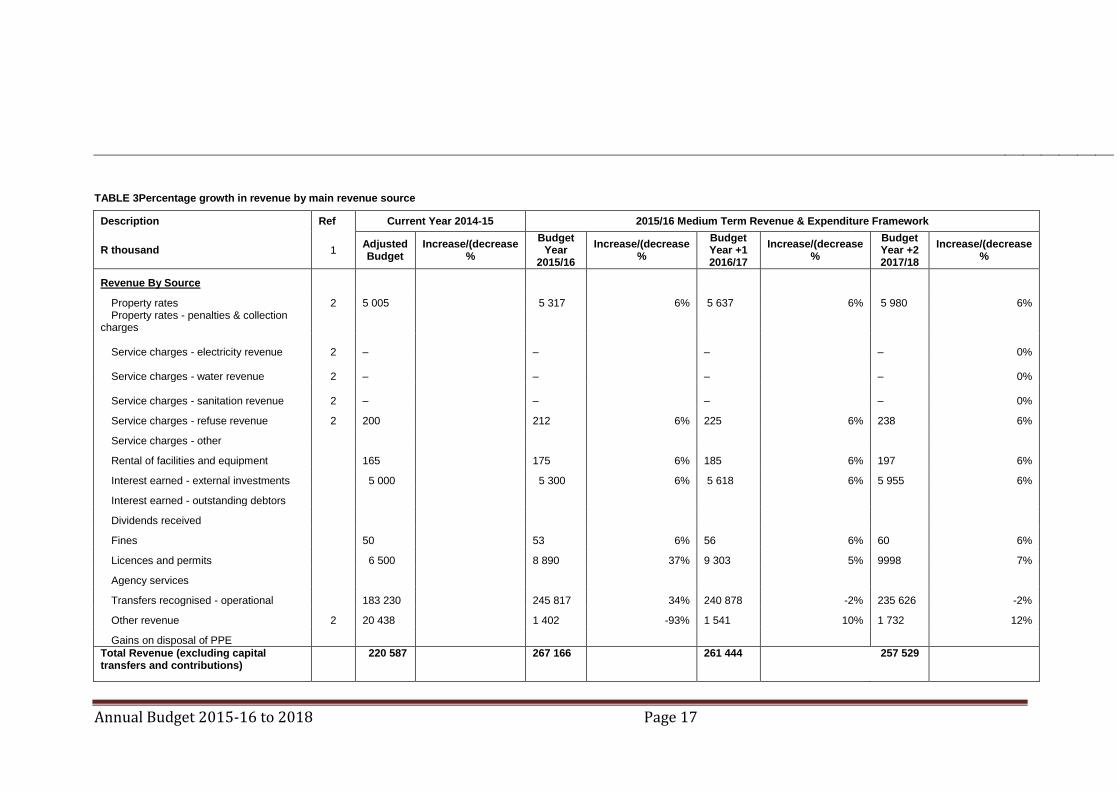
TABLE 3Percentage growth in revenue by main revenue source
Description Ref Current Year 2014-15 2015/16 Medium Term Revenue & Expenditure Framework
R thousand 1 Adjusted Budget
Increase/(decrease %
Budget Year
2015/16
Increase/(decrease %
Budget Year +1 2016/17
Increase/(decrease %
Budget Year +2 2017/18
Increase/(decrease %
Revenue By Source
Property rates 2 5 005
5 317 6% 5 637 6% 5 980 6% Property rates - penalties & collection
charges
Service charges - electricity revenue 2 –
–
–
– 0%
Service charges - water revenue 2 –
–
–
– 0%
Service charges - sanitation revenue 2 –
–
–
– 0%
Service charges - refuse revenue 2 200
212 6% 225 6% 238 6%
Service charges - other
Rental of facilities and equipment 165
175 6% 185 6% 197 6%
Interest earned - external investments 5 000
5 300 6% 5 618 6% 5 955 6%
Interest earned - outstanding debtors
Dividends received
Fines 50
53 6% 56 6% 60 6%
Licences and permits 6 500
8 890 37% 9 303 5% 9998 7%
Agency services
Transfers recognised - operational 183 230
245 817 34% 240 878 -2% 235 626 -2%
Other revenue 2 20 438
1 402 -93% 1 541 10% 1 732 12%
Gains on disposal of PPE
Total Revenue (excluding capital transfers and contributions)
220 587 267 166 261 444 257 529

Annual Budget 2015-16 to 2018 Page 18
19
In line with the formats prescribed by the Municipal Budget and Reporting Regulations, capital transfers and contributions are excluded from the operating statement, as inclusion of these revenue sources would distort the calculation of the operating surplus/deficit. Revenue generated from rates and services charges forms 2 percent of the revenue basket for the NLM. In the 2015/16 financial year, revenue from rates and taxes totalled R5317 000 million or 2 per cent, and the figure excludethe revenue forgone. In 2016/17 it shows an amount of R6million, and in 2017/18 year show an amount of R5, 9 million. The revenue generated from rates and taxes has increased by 6 per cent in 2015/16, and consistently increased by 6 per cent for the two outer years. The above mentioned rates and taxes revenue for the 2015/16 -18 MTERF exclude revenue foregone arising from discounts and rebates associated with the tariff policies of the Municipality. The revenue forgone for each year shows an amount of R1 010 000, R1 070 000 and R1 130 000. Revenue forgone shows a constant percentage of 6% each year
Upon implementing the Municipal Property Rates Act, the municipality has a Tariff Policy. The tariff policy has considered the rebates for some of customers that may be regarded as indigent.

20

21
In 2015/16 financial year, the operational grants show an increase of R78 695 000 which is 47%. For the two outer years, the operational grants have decreased by R4 939 000 and R5 252 000 which 2% consistently Table 5 Comparison of proposed rates to belevied for the 2015/16 financial year RATES TARRIF DETERMINATION OF TARIF AS PER CATERGORY AS FROM 1 JULY 2015-30 JUNE 2016
CATERGORY TARRIF
Residential Property 0.0078
Businesses 0.0116
Government1 0.0116
government2 0.0116
Agriculture1 0.0101
Agriculture2 0.0101
Institutions 0.0116
Clinics 0.0116
Hospital 0.0116
Schools 0.0116
Trading Stations 0.0116
R 61 Road 0.0019
N2 Road 0.0019
Category2
2014/2015 2015/2016 2016/2017 2018/2019
Refuse Removal R142.00 R150.50 R160.00 R169.00
Bags (1000*R0,80) (1000*.95) R953.00
(1000*R1,01) R1 010.00
(1000*R1,07) R1 070.00
(1000*R1,13) R1 130
Mileage (24km*2days*4weeks in month) R1 627 R1 627.00 R1 725.00 R1 828.00 R1 938.00
R2 722 R2 885.50 R3 058.00
R3 237.00
There is no change on the tariffs for rates and taxes. Upon checking the collection rate within the institution, the tariffs have not been increased. On refuse removal, there is a small increase of 6% on the proposed tariffs. Where the municipality is supplying the customers with the refuse bags, the tariff has increased to R1 010 rands.
22
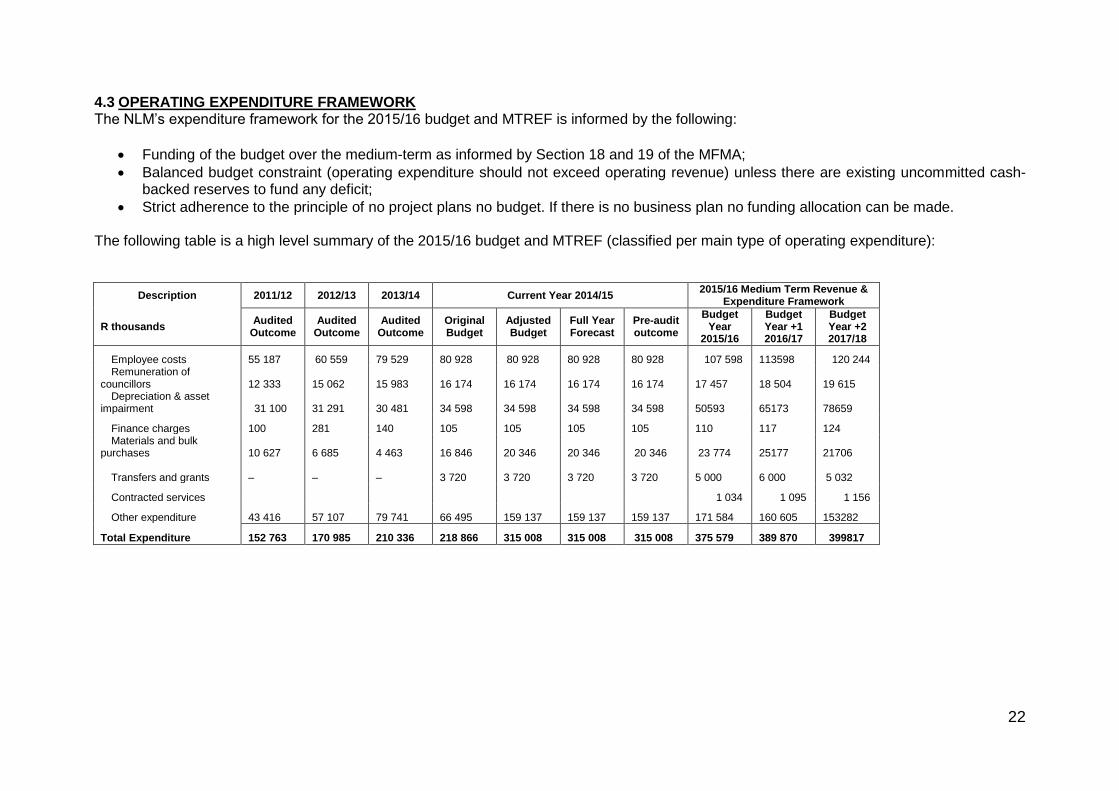
4.3 OPERATING EXPENDITURE FRAMEWORK The NLM’s expenditure framework for the 2015/16 budget and MTREF is informed by the following:
Funding of the budget over the medium-term as informed by Section 18 and 19 of the MFMA;
Balanced budget constraint (operating expenditure should not exceed operating revenue) unless there are existing uncommitted cash-backed reserves to fund any deficit;
Strict adherence to the principle of no project plans no budget. If there is no business plan no funding allocation can be made. The following table is a high level summary of the 2015/16 budget and MTREF (classified per main type of operating expenditure):
Description 2011/12 2012/13 2013/14 Current Year 2014/15 2015/16 Medium Term Revenue &
Expenditure Framework
R thousands Audited
Outcome Audited
Outcome Audited
Outcome Original Budget
Adjusted Budget
Full Year Forecast
Pre-audit outcome
Budget Year
2015/16
Budget Year +1 2016/17
Budget Year +2 2017/18
Employee costs 55 187 60 559 79 529 80 928 80 928 80 928 80 928 107 598 113598 120 244 Remuneration of
councillors 12 333 15 062 15 983 16 174 16 174 16 174 16 174 17 457 18 504 19 615 Depreciation & asset
impairment 31 100 31 291 30 481 34 598 34 598 34 598 34 598 50593 65173 78659
Finance charges 100 281 140 105 105 105 105 110 117 124 Materials and bulk
purchases 10 627 6 685 4 463 16 846 20 346 20 346 20 346 23 774 25177 21706
Transfers and grants –
–
– 3 720 3 720 3 720 3 720 5 000 6 000 5 032
Contracted services
1 034 1 095 1 156
Other expenditure 43 416 57 107 79 741 66 495 159 137 159 137 159 137 171 584 160 605 153282
Total Expenditure 152 763 170 985 210 336 218 866 315 008 315 008 315 008 375 579 389 870 399817
Annual Budget 2015-16 to 2018 Page 23

24
Employee Related Costs The municipality has taken into consideration the multi year Salary and Wage Collective Agreement for the period 1 July 2012 to 30 June 2015 although it has come to an end. For the outer years the inflation rate based on the CPI for 2016 has been considered. The cost associated with the remuneration of councilors is determined by the Minister of Co-operative Governance and Traditional Affairs in accordance with the Remuneration of Public Office Bearers Act, 1998 (Act 20 of 1998). The most recent proclamation in this regard has been taken into account in compiling the NLM’s budget. The overall amount of the Salaries and Wages is R124,4 million, and for two outer years, its R132,1million (6.15%) and R139,8 million (5.85%). Depreciation,asset and debtors impairment: Depreciation and debtors impairment has been provided for at R50,6 million in 2015/16, R65,1 million in 2016/17 and R78,6 million in 2017/18. Other Expenditures: The other expenditure include R4000 000 for the audit fees, and a part of capital expenditures worth R77 318 000. The general expenditure is worth R90 161 000. Materials and Other Bulk Purchases: This includes the repairs and maintenance. The amount for 2015/16 budget year is R23, 7million. For the two outer years it has increased by 6% and decreased by 14% each year. The following table gives a breakdown of the main expenditure categories of the total operating budget for the 2015/16 financial year.
PERCENTAGE ALLOCATION FOR 2014/2015 FINANCIAL YEAR.
EXPENDITURE ITEM EXPENDITURE PERCENTAGE %
Personnel expenditure 50 % General expenditure 40 % Repairs and Maintenance 10%
TOTAL % 100 %
Annual Budget 2015-16 to 2018 Page 25

26
4.4 CAPITAL EXPENDITURE
Vote Description Ref 2011/12 2012/13 2013/14 Current Year 2014/15 2015/16 Medium Term Revenue &
Expenditure Framework
R thousand 1 Audited
Outcome Audited
Outcome Audited
Outcome Original Budget
Adjusted Budget
Full Year Forecast
Pre-audit outcome
Budget Year
2015/16
Budget Year +1 2016/17
Budget Year +2 2017/18
Capital expenditure - Vote
Single-year expenditureto be appropriated 2
Vote 1 - MUNICIPAL GOVERNANCE &
ADMINISTRATION
– 515
–
–
–
–
– 1 300
–
–
Vote 2 - BUDGET & TREASURY 956 531 2 481 3 600 3 600 3 600 3 600
500 230
559
Vote 3 - CORPORATE SERVICES 1 083 1 501 2 739 7 895 7 895 7 895 7 895 4 356 1 442 1 523
Vote 4 - COMMUNITY & SOCIAL SERVICES
–
–
–
685
685
685
685 3 141 249
263
Vote 5 - PLANNING AND DEVELOPMENT
–
–
–
–
–
–
–
–
–
–
Vote 6 - INFRASTRUCTURE 36 506 12 241 60 439 73 922 54 922 54 922 54 922 68021 69198 62967
Total Capital Expenditure - Vote 38 545 14 789 65 660 86 102 67 102 67 102 67 102 77 318 70 819 65 312
When comparing the previous budget of R67,1 million, there is an increase of R10,2million which is 15%. In a total budget of R77,3 million for
the budget year 2015/16, an amount of R56 million is allocated to the construction of the access roads. For the two outer years the there is a
decrease of 8%, and 7.78% each year.
When comparing each vote from previous year budget, there is a decrease in most of the votes except for the Infrastructure. This is due to the
proposed construction of the Workshop for the Yellow Plant machinery in the Infrastructure Vote

Annual Budget 2015-16 to 2018 Page 27
28
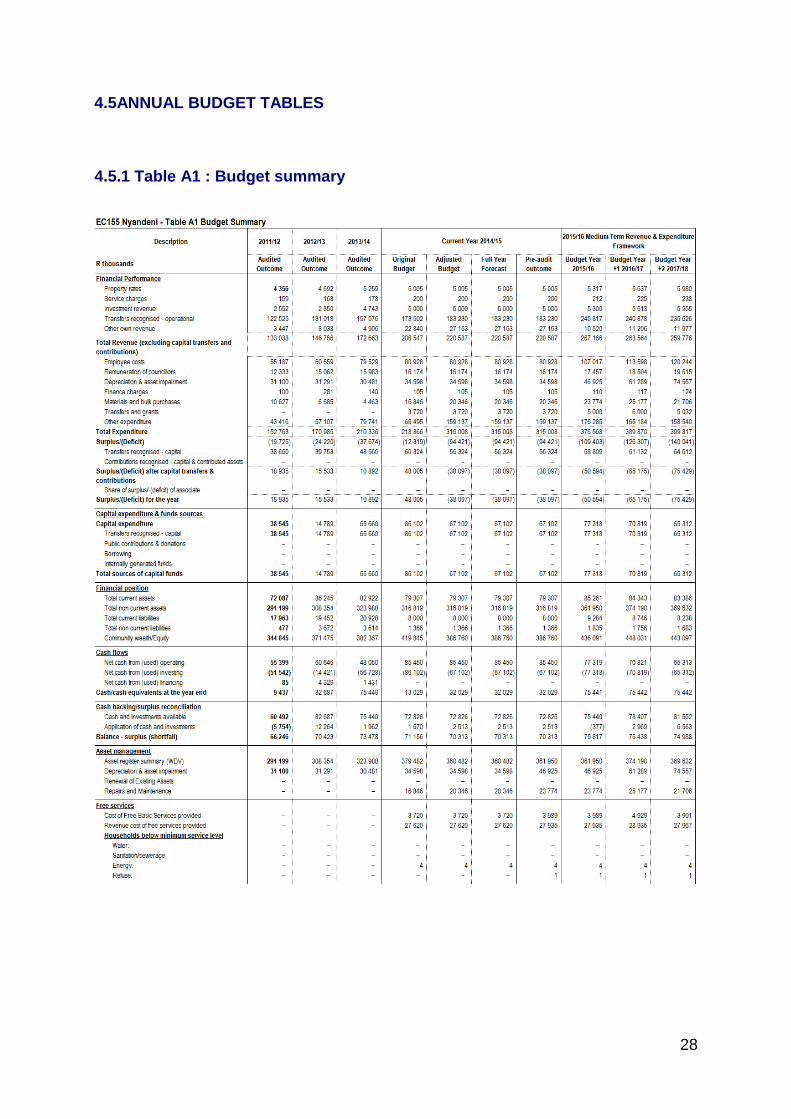
4.5ANNUAL BUDGET TABLES 4.5.1 Table A1 : Budget summary

Annual Budget 2015-16 to 2018 Page 29
Explanatory Notes
Table A1 is a budget summary and provides a concise overview of the NLM’s budget from all of the major financial perspectives (operating, capital expenditure, financial position, cash flow, and MFMA funding compliance).
The table provides an overview of the amounts approved by Council for operating performance, resources deployed to capital expenditure, financial position, cash and funding compliance, as well as the municipality’s commitment to eliminating basic service delivery backlogs.
Financial management reforms emphasises the importance of the municipal budget being funded. This requires the simultaneous assessment of the Financial Performance, Financial Position and Cash Flow Budgets, along with the Capital Budget. The Budget Summary provides the key information in this regard:

30
4.5.2 Table A2 : Budgeted financial performance (revenue and expenditure by standard classification)
Explanatory Notes Table A2 is a view of the budgeted financial performance in relation to revenue and expenditure per standard classification. The modified GFS standard classification divides the municipal services into 15 functional areas. Municipal revenue, operating expenditure and capital expenditure are then classified in terms if each of these functional areas which enables the National Treasury to compile „whole of government‟ reports.

Annual Budget 2015-16 to 2018 Page 31
4.5 3 Table A3 : Budgeted financial performance (revenue and expenditure by municipal vote)
Explanatory Notes Table A3 is a view of the budgeted financial performance in relation to the revenue and expenditure per municipal vote. This table facilitates the view of the budgeted operating performance in relation to the organisational structure of the NLM.
Annual Budget 2015-16 to 2018 Page 32
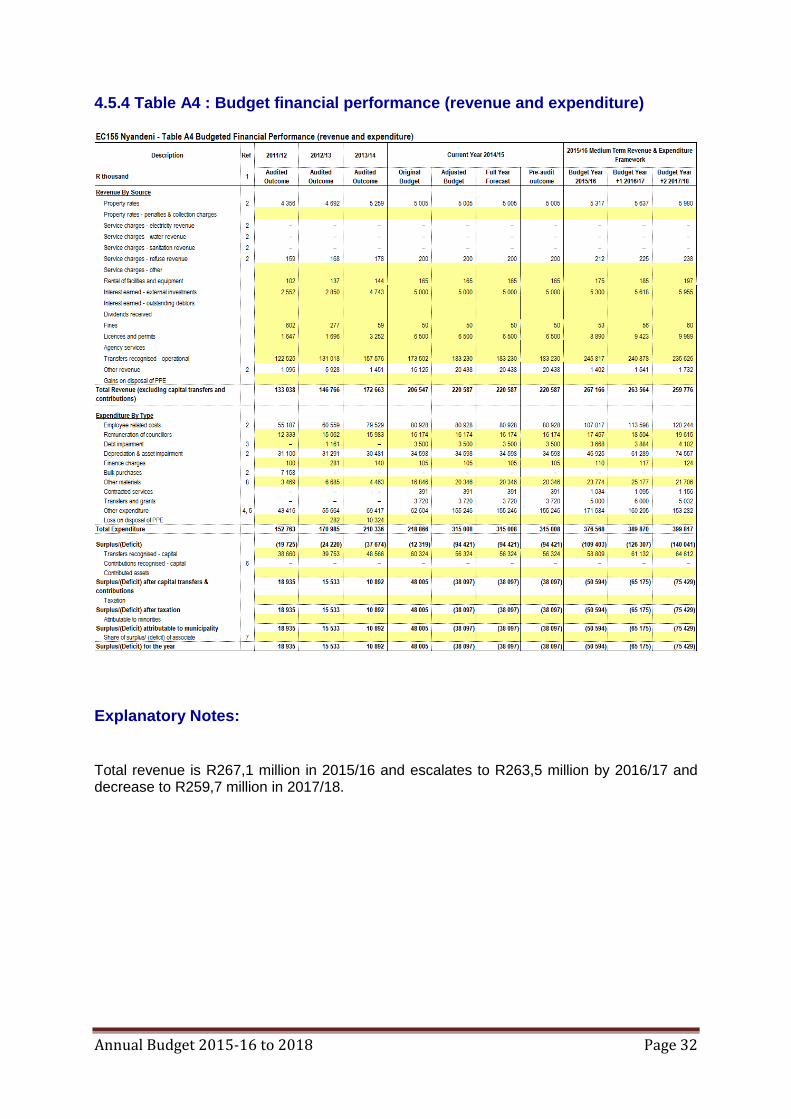
4.5.4 Table A4 : Budget financial performance (revenue and expenditure)
Explanatory Notes: Total revenue is R267,1 million in 2015/16 and escalates to R263,5 million by 2016/17 and decrease to R259,7 million in 2017/18.

Annual Budget 2015-16 to 2018 Page 33
4.5.5 Table A5 : Budgeted capital expenditure by vote and funding
Explanatory Notes When comparing the previous budget of R67,1 million, there is an increase of R10,2million which is 15%. In a total budget of R77,3 million for the budget year 2015/16, an amount of R56 million is allocated to the construction of the access roads. For the two outer years the there is a decrease of 8%, and 7.78% each year.

Annual Budget 2015-16 to 2018 Page 34
4.5.6 Table A6 : Budgeted financial position
Explanatory Notes: Table A6 is consistent with international standards of good financial management practice, and improves understandability for councillors and management of the impact of the budget on the statement of financial position (balance sheet). The municipality cashflow shows a positive position for 2015/16 where current assets reflect an amount of R85 million. Short term call investments reflect an amount of R49,4 million in 2015/16. The total assets are budgeted at R447 million for 2015/16 budget year. 4.5.7 Table A7 : Budgeted cash flows

Annual Budget 2015-16 to 2018 Page 35
Explanatory Notes The budgeted cash flow statement is the first measurement in determining if the budget is funded. It shows the expected level of cash in-flow versus cash out-flow that is likely to result from the implementation of the budget.
The cash flow of the municipality shows an increase for the 2015/16 MTERF. This is due to the increase in our operation and conditional grants.
Annual Budget 2015-16 to 2018 Page 36
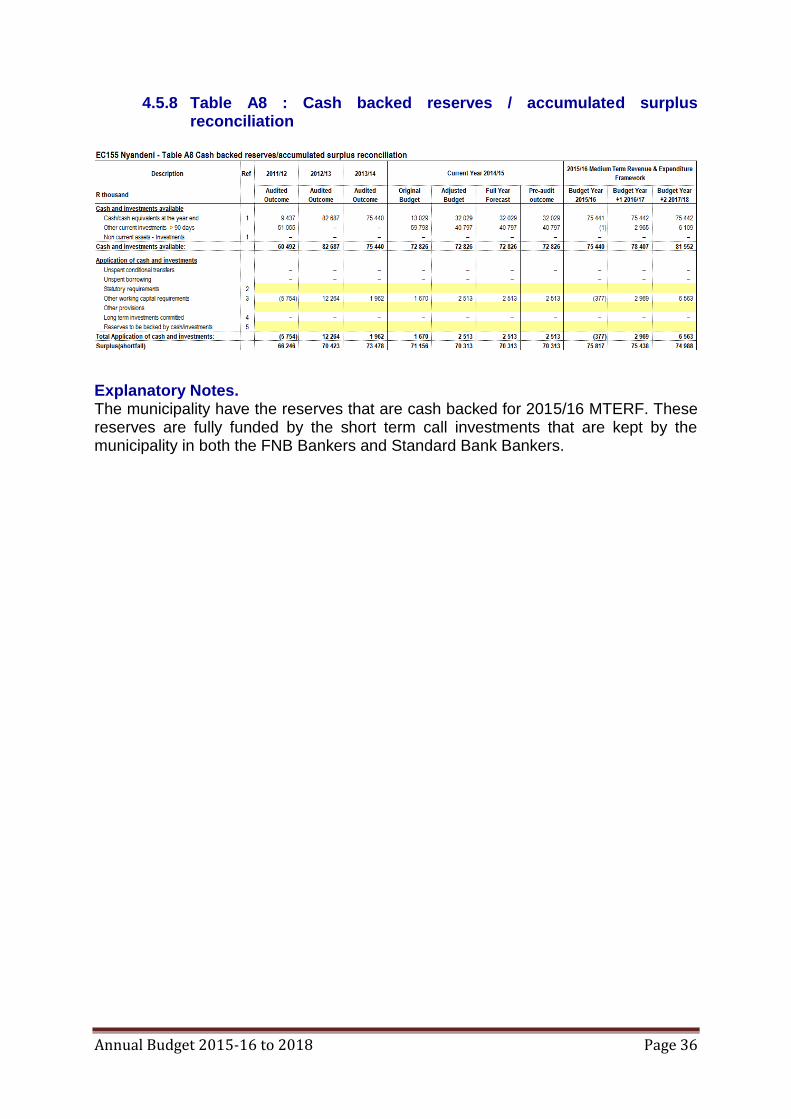
4.5.8 Table A8 : Cash backed reserves / accumulated surplus reconciliation
Explanatory Notes. The municipality have the reserves that are cash backed for 2015/16 MTERF. These reserves are fully funded by the short term call investments that are kept by the municipality in both the FNB Bankers and Standard Bank Bankers.

Annual Budget 2015-16 to 2018 Page 37
4.5.9 Table A9 : Asset management

Annual Budget 2015-16 to 2018 Page 38
Explanatory Notes Table A9 provides an overview of municipal capital allocations to its assets and the renewal of existing assets, which is dominated by the construction of the access road as well as spending on repairs and maintenance by asset class.
National Treasury has recommended that municipalities should allocate at least 40 per cent of their capital budget to the renewal of existing assets, and allocations to repairs and maintenance should be 8 per cent of PPE. Currently in the municipal budget 20% is allocated to capital expenditure and 6% is allocated to repairs and maintenance when taking into consideration the total budget.

Annual Budget 2015-16 to 2018 Page 39
5 Annual Budget Process Overview 5.1 Background Integrated Development Planning is a process through which municipalities prepare a
strategicdevelopment plan which extends over a five-year period. The Integrated
Development Plan (IDP) is aproduct of the IDP process. The NLM IDP is the principal
strategic planning instrument which guidesand informs all planning, budgeting, management
and decision-making processes in the municipality.Through Integrated Development
Planning which necessitates the involvement of all relevantstakeholders, a municipality:
Identifies its key development priorities;
Formulates a clear vision, mission and values;
Formulates appropriate strategies;
Develops the appropriate organisational structure and systems to realise the vision and
mission;and
Aligns resources with the developmental priorities.
In terms of the Systems Act, all municipalities have to undertake an IDP process to produce
IDPs.As the IDP is a legislative requirement it has a legal status and supersedes all other
plans that guidedevelopment at local government level.
In a nutshell, the IDP process entails an assessment of the existing level of development and
theidentification of key development priorities. The vision and mission statements for the
long-termdevelopment flow from the aforesaid, with specificreference to critical
developmental and internaltransformational needs. The development strategies and
objectives will be directed at bridging the gapbetween the existing level of development and
the vision and mission. A very critical phase of the IDPprocess is to link planning to the
municipal budget (i.e. allocation of internal or external funding to theidentified projects);
because this will ensure that the IDP directs the development and implementationof projects.
Our responsibility as a sphere ofgovernment is to ensure that the quality of life ofall who live
and work in Nyandeni is improved.We will continue to engage in both progressiveand
meaningful discussions with our communitiesto shape a clear path from which governance
anddevelopment will draw guidance and direction.The council will continue to pursue and
encouragecommunity participation programmes, to ensurethat our plans are in line with
community needs.

Annual Budget 2015-16 to 2018 Page 40
We have a responsibility to contribute to theprocess of transforming the lives of our
peoplefrom the conditions of abject poverty andunderdevelopment. In our fight against
poverty and underdevelopment, we are committedto ensuring that equitable service
deliverybecomes the norm in Nyandeni. For this reasonNLM has to focus inter alia, on the
following:
• Build sustainable communities by payingspecial attention to health education,
servicedelivery, human settlements, environmentand safety;
• Develop infrastructure to equalise servicesupgrade and ensure accessibility and unityin
Nyandeni;
• Grow the economy to be linked with thenational and provincial economies, empowerthe
people of the region and build requiredskills; and
• Developing and implementing integratedplans and strategies for economic and
socialdevelopment; service delivery; infrastructuredevelopment; provisionof basic
services; human development; safetyand security; participatory governance;youth
development; women empowerment; building integrated andsustainable communities
and protection ofthe environment.
DEVELOPMENT OF THE INTEGRATEDDEVELOPMENT PLAN
Guiding Principles
The development of the Integrated Development Plan(IDP) in terms of the Municipal
Systems Act wasguided and informed by the following principles:
• It must support and work towards achievingthe Vision, Mission, Values and theStrategic
Priorities of the NLM;
• Focus on service delivery in terms of theeradication of backlogs and the maintenanceof
infrastructure;
• Address community priorities (needs) asidentified in the 2013-2018 IDP as well asnewly
identified priorities; and
• The review of theIDP focused on formulating measurableperformance indicator targets
for five, threeand one year. These targets informed thepreparation of the multi-year
budgets, aswell as the draft SDBIP.

41
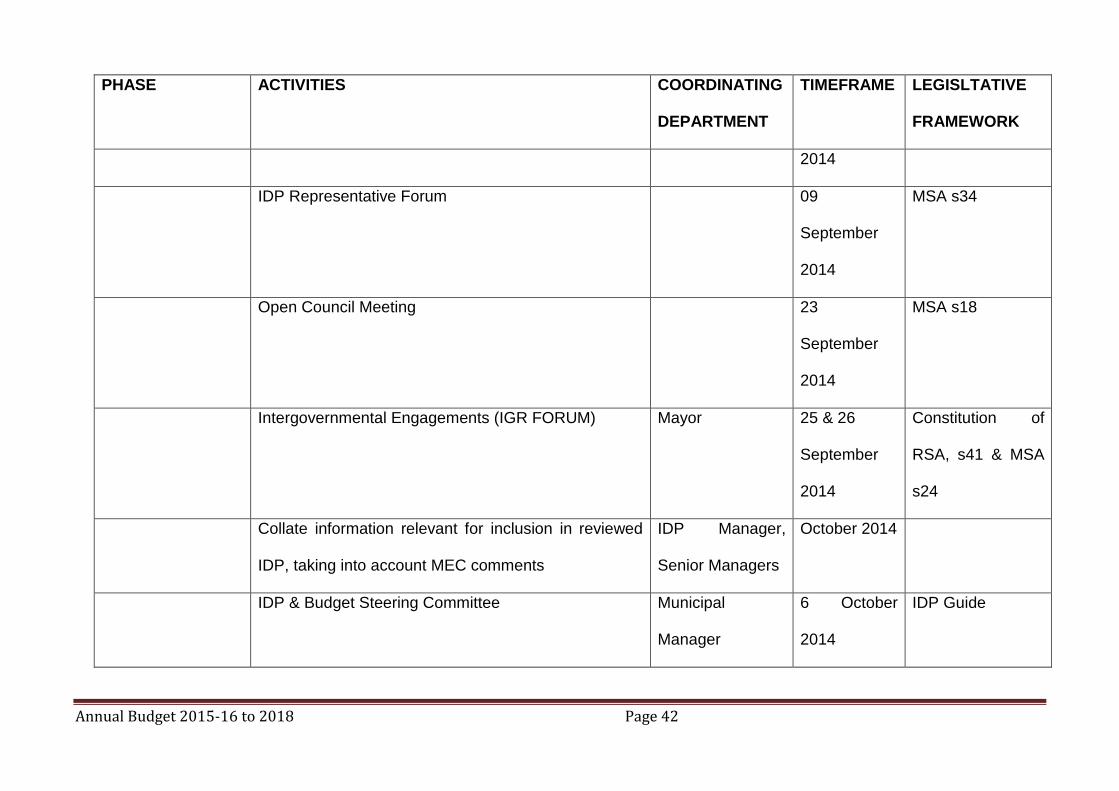
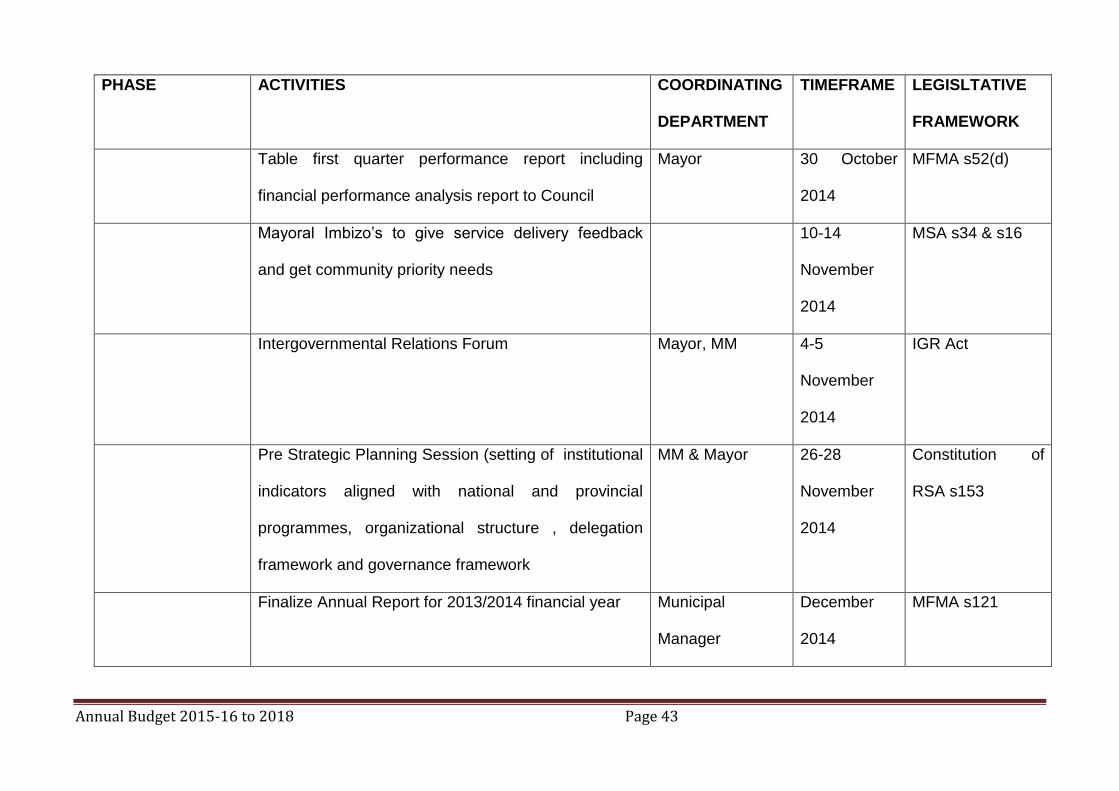
The deadlines in the process plan for the Development of the 2015/2016IDP and preparation of the Multi-Year Budgetfor the 2015/16 year is reflected
below
Schedule of key deadlines
PHASE ACTIVITIES COORDINATING
DEPARTMENT
TIMEFRAME LEGISLTATIVE
FRAMEWORK
Table IDP, PMS and Annual Budget Process Plan for
2015/16 to the Executive Committee adoption
including the following documents
Annual Financial Statements
Performance Information report (MSA-s46)
Municipal
Manager
23 August
2014
MFMA 21(1)(b) &
53 (1) (b)
Tabling of IDP & Budget Process Plan, AFS &
Performance information report to council for adoption
Mayor 28 August
2014
MFMA 21(1)(b) &
53 (1) (b)
Annual Financial Statements and Performance
Assessment Information Report submitted to Auditor
General
Chief Financial
Officer, MM
29 August
2014
MFMA 126 (1) (a)
Advertise budget & IDP time schedule SM: Operations September
Annual Budget 2015-16 to 2018 Page 42
PHASE ACTIVITIES COORDINATING
DEPARTMENT
TIMEFRAME LEGISLTATIVE
FRAMEWORK
2014
IDP Representative Forum 09
September
2014
MSA s34
Open Council Meeting 23
September
2014
MSA s18
Intergovernmental Engagements (IGR FORUM) Mayor 25 & 26
September
2014
Constitution of
RSA, s41 & MSA
s24
Collate information relevant for inclusion in reviewed
IDP, taking into account MEC comments
IDP Manager,
Senior Managers
October 2014
IDP & Budget Steering Committee Municipal
Manager
6 October
2014
IDP Guide
Annual Budget 2015-16 to 2018 Page 43
PHASE ACTIVITIES COORDINATING
DEPARTMENT
TIMEFRAME LEGISLTATIVE
FRAMEWORK
Table first quarter performance report including
financial performance analysis report to Council
Mayor 30 October
2014
MFMA s52(d)
Mayoral Imbizo’s to give service delivery feedback
and get community priority needs
10-14
November
2014
MSA s34 & s16
Intergovernmental Relations Forum Mayor, MM 4-5
November
2014
IGR Act
Pre Strategic Planning Session (setting of institutional
indicators aligned with national and provincial
programmes, organizational structure , delegation
framework and governance framework
MM & Mayor 26-28
November
2014
Constitution of
RSA s153
Finalize Annual Report for 2013/2014 financial year Municipal
Manager
December
2014
MFMA s121
Annual Budget 2015-16 to 2018 Page 44
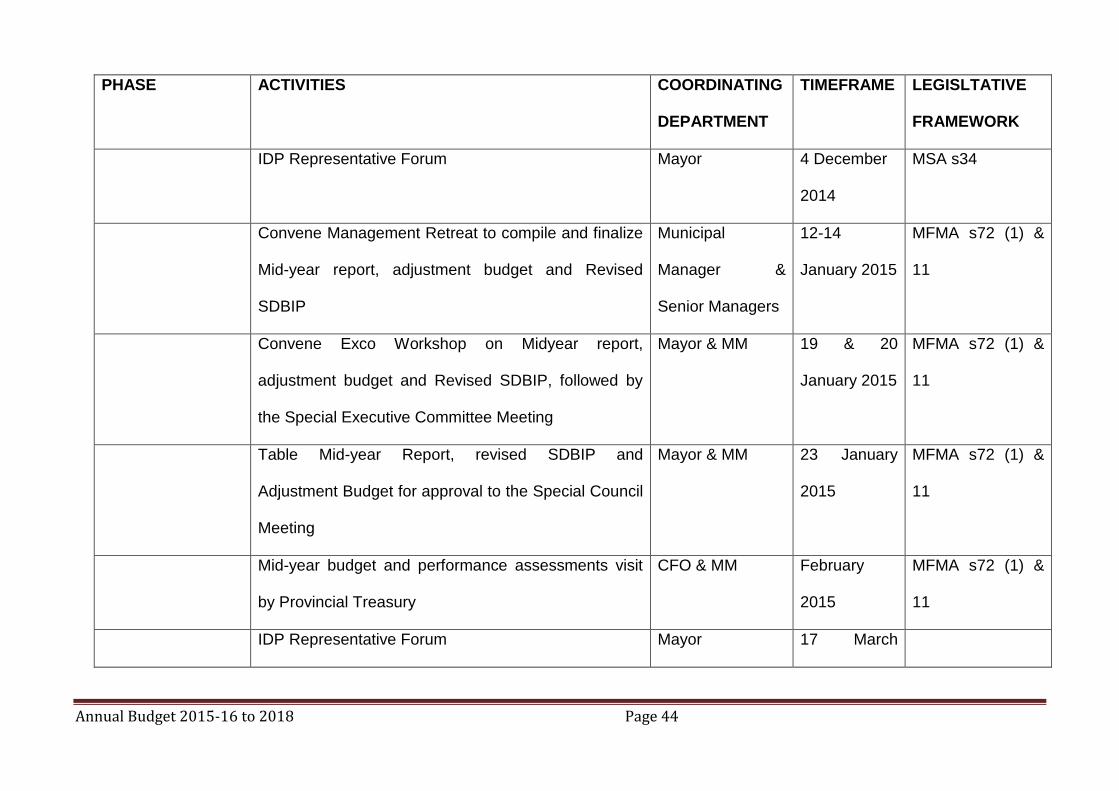
PHASE ACTIVITIES COORDINATING
DEPARTMENT
TIMEFRAME LEGISLTATIVE
FRAMEWORK
IDP Representative Forum Mayor 4 December
2014
MSA s34
Convene Management Retreat to compile and finalize
Mid-year report, adjustment budget and Revised
SDBIP
Municipal
Manager &
Senior Managers
12-14
January 2015
MFMA s72 (1) &
11
Convene Exco Workshop on Midyear report,
adjustment budget and Revised SDBIP, followed by
the Special Executive Committee Meeting
Mayor & MM 19 & 20
January 2015
MFMA s72 (1) &
11
Table Mid-year Report, revised SDBIP and
Adjustment Budget for approval to the Special Council
Meeting
Mayor & MM 23 January
2015
MFMA s72 (1) &
11
Mid-year budget and performance assessments visit
by Provincial Treasury
CFO & MM February
2015
MFMA s72 (1) &
11
IDP Representative Forum Mayor 17 March

Annual Budget 2015-16 to 2018 Page 45
PHASE ACTIVITIES COORDINATING
DEPARTMENT
TIMEFRAME LEGISLTATIVE
FRAMEWORK
2015
COUNCIL SITTING Presentation of Draft IDP, Annual Budget, Draft
SDBIP, Tariffs and budget related policies to the
Executive Committee
Municipal
Manager & CFO
19 March
2015
Tabling of Draft IDP, Annual Budget, Draft SDBIP,
Tariffs and budget related policies
Mayor 26 March
2015
MFMA s16 (2)
Adoption of the Oversight report Speaker, MPAC 26 March
2015
MFMA s129)1)
Intergovernmental Relations Forum MM & Mayor 31 March
2015
IGR Act
Conduct IDP & Budget Public Hearings Mayor 13-17 April
2015
Table third quarter performance report including Mayor 30 April 2015 MFMA s52(d)

Annual Budget 2015-16 to 2018 Page 46
PHASE ACTIVITIES COORDINATING
DEPARTMENT
TIMEFRAME LEGISLTATIVE
FRAMEWORK
financial performance analysis report to Council
IDP Representative Forum Mayor 05 May 2015
Intergovernmental Relations Forum Mayor 12 May 2015
Table Reviewed IDP, Annual Budget, Tariffs,
Organizational Structure and budget related policies
for approval by Council
Mayor 28 May 2015 MFMA s24 (1)
Approval of the SDBIP by the Mayor Municipal
Manager
June 2015
Table fourth quarter performance report including
financial performance analysis report to Council
Municipal
Manage
July 2015 MFMA s52 (d)

Annual Budget 2015-16 to 2018 Page 47

48
6 Alignment of Budget with Integrated Development Plan
The IDP, however, contains information on developmental needs submitted by the
community that maynot be covered in the Budget. There should not be an expectation that
everything contained in the IDPis funded. There are numerous needs submitted that are not
the responsibility of the NLM, but that ofeither the National or Provincial governments.
However, these inputs will be analysed and discussedstakeholders such as government
departments, ward committees, CDW, NGO’s and private sector to refine what can be
implemented. The funding process is based on the prioritiesidentified in the IDP, as shown in
the relevant tables in this document.
7 Budget Related Policies Overview and Amendments
Section 18 of the Municipal Finance Management Act(MFMA) states that the Budget can
only be funded byrealistically anticipated revenue to be collected, and cash-
backedaccumulated funds from previous years, which was notcommitted for other
purposes.Furthermore, National Treasury Circular 42 stipulates thatthe Budget be managed
in a full accrual manner reflecting atransparent budget and accounting system approach.The
MFMA further requires the municipality to adopt andimplement a tariff policy. Council has
approved for public participation policies for mainservices provided by the municipality, which
are attached asannexures to this document.Council is required to adopt budgetary provisions
based onrealisticanticipated revenue for the budget year from eachrevenue source as per
therequirements of the MFMA (Chapter 4,17 (1) (a) and (3) (b)).
The policies to be attached are as follows:
Supply Chain Management Policy
Cash Management & Investment Policy
Property Rates Policy
Tariff Policy
Bad debts & Write Off Policy
Credit Control and Debt Collection Policy
Asset management Policy
Budget Policy
Indigent Policy

Annual Budget 2015-16 to 2018 Page 49
8 Budget Assumptions
8.1 National Treasury provided guidance in MFMA Circular No. 75 issued in terms of
Municipal Finance Management Act No. 56 of 2003 regarding inflation:-
Fiscal Year 2014 2015 2016 2017 2018
Actual Estimate Forecast
CPI Inflation 5.8 5.6 4.8 5.9 5.6
8.2 The inflation rate to be used for calculating wage increases
Municipalities must take into account the multi-year Salary and Wage Collective Agreement for the period 1 July 2012 to 30 June 2015. The agreement provides for a wage increase bas The Salary and Wage Collective Agreement for the period 01 July 2012 to 30 June 2015 has come to an end. The South African Local Government Association issued a press release on 03 March 2015 indicating that it tabled the following offer for salaries and wages increase: • 2015/16 Financial Year – 4.4 per cent (inflation linked) • 2016/17 and 2017/18 Financial Years – inflation related increase plus additional 0.25 per cent As the negotiations are still underway, municipalities are advised to use the above proposed guidelines in preparing their 2015/16 budgets.
8.3Municipalities are advised to structure their 2015/16 electricity tariffs based on the 12.20
per cent guideline and provide for a 14.24 per cent increase in the cost of bulk purchases
for the tabled 2015/16 budgets and MTREF. Any changes to these guidelines will be
communicated to municipalities in a further Budget Circular for the 2015/16 financial year to
be issued shortly after the tabling of the National Budget
8.4Collection rates
In accordance with relevant legislation and national directives, revenue recovery rates are
based on realistic and sustainable trends. Nyandeni’s collection rate is set at an average of
38% and is based on a combination of actual rates achievedto date and estimated outcomes
of the current financial period.

Annual Budget 2015-16 to 2018 Page 50
9 Funding the Budget (including fiscal overview and sources of funding)
9.1 FUNDING OF THE CAPITAL BUDGET
The 2015/2016 capital budget amounts to R77 318 000, and for the two outer years its
R70 819 000, and R65312000. It is predominantly funded through the MIG funding.
9.2 FUNDING OF THE OPERATING BUDGET
The Operating Budget is funded from the following main sources:
• Assessment Rates;
• Tariffs levied for Services, i.e. Refuse Collection;
• Other income and
• Operating Grants and Subsidies.
Assessment Rates. The Municipal Property Rates Act will be implemented on July 1 2015.
The assessment rates will be levied on both land and improvements value. In terms of
section46 of the Act, the market value of a property, if sold on the date of valuation in the
open market by a willing seller to a willing buyer, is to be realised in the valuation roll.
Income derived from services is mainly used to fund the cost rendering the service (both
operating andcapital needs).
The total budget for the assessment rates is R5,3 million for the current year, and for two
outer years is R5,6 million and 5,9million.
The income received in the form of the Equitable Share Grant is R216,7 million and for the
two outer years is R217,95 million and R212,5 million.
Other Grants and subsidies are as follows:
Grant Name Financial Year Amount
FMG 2015/16 R1 600 000
MSIG 2015/16 R 930 000
EPWP 2015/16 R1 219 000
51
10 Annual budgets and service delivery and budget implementation plans
– Internal departments
In terms of Section 53 (1) (c) (ii) of the Municipal Finance Management Act, the Service
Delivery and Budget Implementation Plan (SDBIP) is defined as a detailed plan approved by
the mayor of a municipality for implementing its delivery of municipal services and its annual
budget, and which must indicate the following –
(a) Monthly projections of –
(i) Revenue to be collected, by source, and
(ii) Operational and capital expenditure, by vote.
(b) Service delivery targets and performance indicators for each quarter, and
(c) Other matters prescribed.
The Honourable Mayor, in accordance with Section 53 of the MFMA, is expected to approve
the SDBIP within 28 days after the approval of the Budget. In addition, the Honourable Mayor
must ensure that the revenue and expenditure projections for each month and the service
delivery targets and performance indicators as set out in the SDBIP are made public within
14 days after its approval.
The SDBIP gives effect to the Integrated Development Plan and the Budget of the
municipality. It is an expression of the objectives of the Council in quantifiable outcomes
which will be implemented by the administration for the financial period from 1 July 2015 to
30 June 2016 (the financial year). It includes the service delivery targets and performance
indicators for each quarter, which should be linked to the performance agreements of senior
management. It therefore facilitates oversight of
financial and non-financial performance of the municipality, and allows the Municipal
Manager to monitor the performance of the Section 56 Managers, the Mayor/Council to
monitor the performance of the Municipal Manager, and the community to monitor the
performance of the Council.
The DSDBIP for the 2015/2016 financial year has been prepared for submission to Treasury.

Annual Budget 2015-16 to 2018 Page 52
11. Contracts having future budgetary implications
In terms of the NLM’s Supply Chain Management Policy, no contracts are awarded beyond the medium-term revenue and expenditure framework (three years). In ensuring adherence to this contractual time frame limitation, all reports submitted to either the Bid Evaluation and Adjudication Committees must obtain formal financial comments from the Financial Management Division of the Treasury Department. 12. Legislation Compliance Compliance with the MFMA implementation requirements have been substantially adhered to through the following activities:
1. In year reporting
Reporting to National Treasury in electronic format was fully complied with on a monthly basis. Section 71 reporting to the Mayor (within 10 working days) has progressively improved and includes monthly published financial performance on the NLM’s website.
2. Budget and Treasury Office
The Budget and Treasury Office has been established in accordance with the MFMA.
3. Audit Committee An Audit Committee has been established and is fully functional.
. 4. Service Delivery and Implementation Plan
The detail SDBIP document will be finalised after approval of the 2015/16 MTREF in May 2015 directly aligned and informed by the 2015/16 MTREF.
5. Annual Report
Annual report is compiled in terms of the MFMA and National Treasury requirements but there is still a need for improvement.
6. MFMA Training
The MFMA training is being implemented as there are staff members that have enrolled in the Municipal Finance Certificate Programme
53
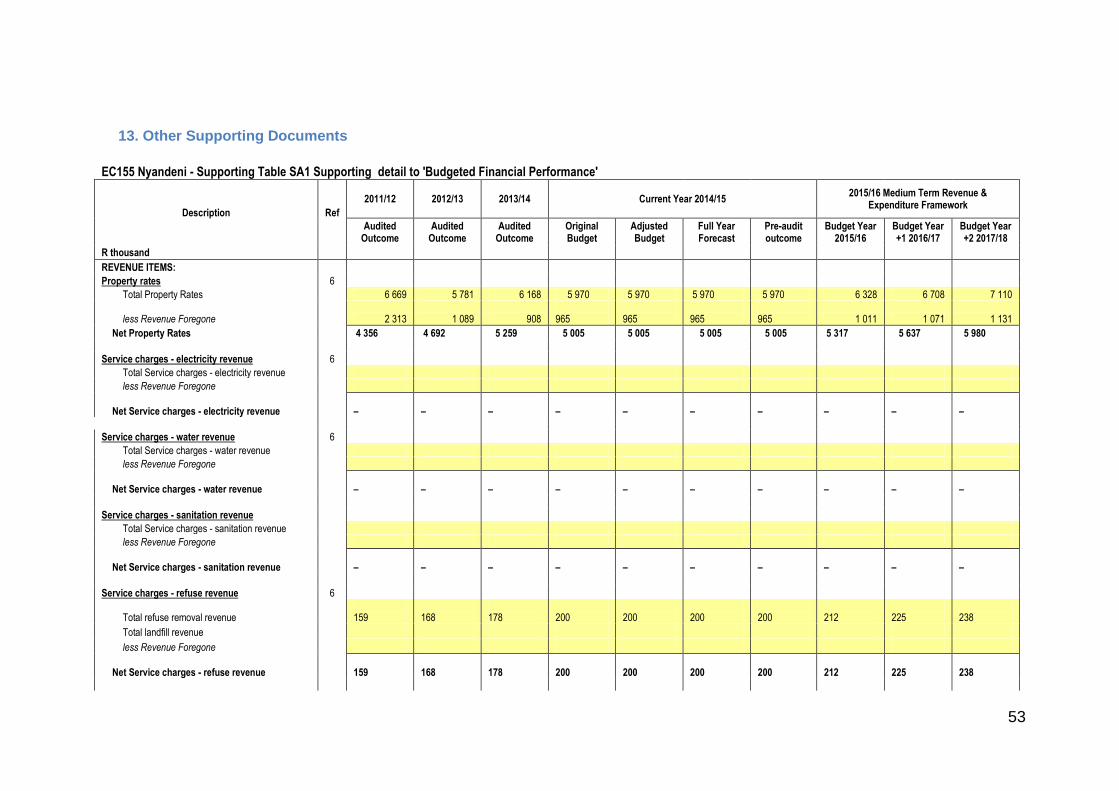
13. Other Supporting Documents
EC155 Nyandeni - Supporting Table SA1 Supporting detail to 'Budgeted Financial Performance'
Description Ref
2011/12 2012/13 2013/14 Current Year 2014/15 2015/16 Medium Term Revenue &
Expenditure Framework
Audited Outcome
Audited Outcome
Audited Outcome
Original Budget
Adjusted Budget
Full Year Forecast
Pre-audit outcome
Budget Year 2015/16
Budget Year +1 2016/17
Budget Year +2 2017/18
R thousand
REVENUE ITEMS:
Property rates 6
Total Property Rates 6 669 5 781 6 168 5 970 5 970 5 970 5 970 6 328 6 708 7 110
less Revenue Foregone 2 313 1 089 908 965
965
965
965 1 011 1 071 1 131
Net Property Rates 4 356 4 692 5 259 5 005 5 005 5 005 5 005 5 317 5 637 5 980
Service charges - electricity revenue 6
Total Service charges - electricity revenue
less Revenue Foregone
Net Service charges - electricity revenue –
–
–
–
–
–
–
–
–
–
Service charges - water revenue 6
Total Service charges - water revenue
less Revenue Foregone
Net Service charges - water revenue –
–
–
–
–
–
–
–
–
–
Service charges - sanitation revenue
Total Service charges - sanitation revenue
less Revenue Foregone
Net Service charges - sanitation revenue –
–
–
–
–
–
–
–
–
–
Service charges - refuse revenue 6
Total refuse removal revenue 159
168
178
200
200
200
200
212
225
238
Total landfill revenue
less Revenue Foregone
Net Service charges - refuse revenue 159
168
178
200
200
200
200
212
225
238

Annual Budget 2015-16 to 2018 Page 54
Other Revenue by source
Insurance claim 1
196
–
Library fees 11
2
40
40
40
40
42
45
48
Plan fees 4
19
13
25
25
25
25
27
28
30
Other income 474
89
132 15 100 19 413 19 413 19 413
95
101
107
Tender sales 228
222
404
250
250
250
250
265
281
298
Training-LGSETA 95
331
398
500
500
500
500
750
850 1 000
Vending & Hawking fees 15
56
7
10
10
10
10
11
11
12
Auction Sale 0
–
57
–
–
–
–
Fees earned 45
44
–
–
–
–
Commissions received 87
116
140
200
200
200
200
212
225
238
Recoveries 4 670 –
–
–
–
–
Fair value gain on short term investments 3 191
171
254
–
–
–
–
Total 'Other' Revenue 1 1 096 5 928 1 451 16 125 20 438 20 438 20 438 1 402 1 541 1 732
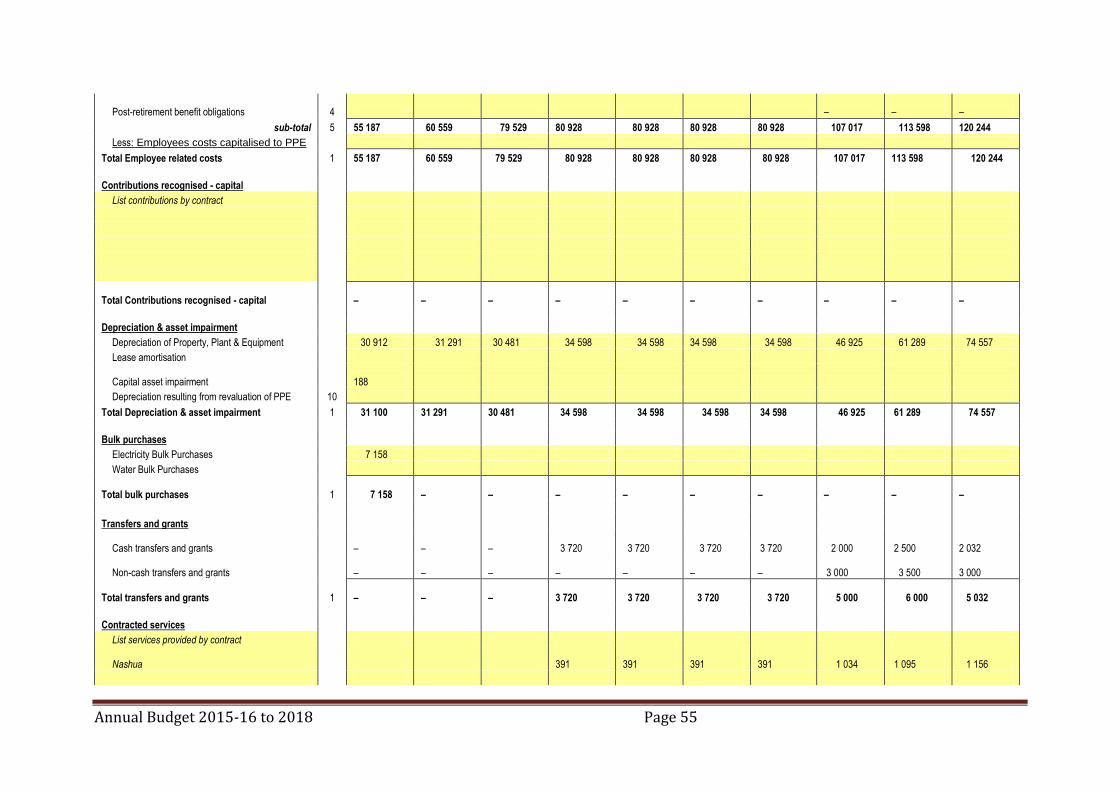
EXPENDITURE ITEMS:
Employee related costs
Basic Salaries and Wages 2 33 348 36 677 48 605 52 690 52 690 52 690 52 690 67 100 71 226 75 393
Pension and UIF Contributions 9 858 3 376 4 776 7 400 7 400 7 400 7 400 11 783 12 508 13 240
Medical Aid Contributions 351 6 900 7 864 5 742 5 742 5 742 5 742 12 981 13 780 14 586
Overtime 2 843 3 401 4 804 53
53
53
53
50
53
56
Performance Bonus – 5 848 5 848 5 848 5 848 5 489 5 826 6 167
Motor Vehicle Allowance 4 763 5 890 5 972 2 286 2 286 2 286 2 286 3 068 3 256 3 447
Cellphone Allowance 176
–
–
–
–
Housing Allowances 1 684 2 207 3 116 2 407 2 407 2 407 2 407 3 103 3 294 3 487
Other benefits and allowances 2 163 1 395 2 613 4 152 4 152 4 152 4 152 3 114 3 306 3 499
Payments in lieu of leave 167 1 251
–
–
–
Long service awards 545
529
350
350
350
350
328
348
369
Annual Budget 2015-16 to 2018 Page 55
Post-retirement benefit obligations 4 –
–
–
sub-total 5 55 187 60 559 79 529 80 928 80 928 80 928 80 928 107 017 113 598 120 244
Less: Employees costs capitalised to PPE
Total Employee related costs 1 55 187 60 559 79 529 80 928 80 928 80 928 80 928 107 017 113 598 120 244
Contributions recognised - capital
List contributions by contract
Total Contributions recognised - capital –
–
–
–
–
–
–
–
–
–
Depreciation & asset impairment
Depreciation of Property, Plant & Equipment 30 912 31 291 30 481 34 598 34 598 34 598 34 598 46 925 61 289 74 557
Lease amortisation
Capital asset impairment 188
Depreciation resulting from revaluation of PPE 10
Total Depreciation & asset impairment 1 31 100 31 291 30 481 34 598 34 598 34 598 34 598 46 925 61 289 74 557
Bulk purchases
Electricity Bulk Purchases 7 158
Water Bulk Purchases
Total bulk purchases 1 7 158 –
–
–
–
–
–
–
–
–
Transfers and grants
Cash transfers and grants –
–
– 3 720 3 720 3 720 3 720 2 000 2 500 2 032
Non-cash transfers and grants –
–
–
–
–
–
– 3 000 3 500 3 000
Total transfers and grants 1 –
–
– 3 720 3 720 3 720 3 720 5 000 6 000 5 032
Contracted services
List services provided by contract
Nashua 391
391
391
391 1 034 1 095 1 156

Annual Budget 2015-16 to 2018 Page 56
sub-total 1 –
–
–
391
391
391
391 1 034 1 095 1 156
Allocations to organs of state:
Electricity
Water
Sanitation
Other
Total contracted services –
–
–
391
391
391
391 1 034 1 095 1 156
Other Expenditure By Type
Collection costs
Contributions to 'other' provisions
Consultant fees 401 5 265 3 350
100
100
100
100
105
111
117
Audit fees 3 847 3 264 2 441 3 000 3 000 3 000 3 000 4 000 4 236 4 473
General expenses 3 39 043 47 006 60 980 59 504 85 044 85 044 85 044 90 161 85 039 83 379
Fair value loss on short term investments 124
130
228

Annual Budget 2015-16 to 2018 Page 57
Impairment Loss/Reversal of impairment 2 418
Capital expenditure 67 102 67 102 67 102 77 318 70 819 65 312
Total 'Other' Expenditure 1 43 416 55 664 69 417 62 604 155 246 155 246 155 246 171 584 160 205 153 282
Repairs and Maintenance by Expenditure Item 8
Employee related costs
Other materials 16 846 20 346 20 346 23 774 25 177 21 706
Contracted Services
Other Expenditure
Total Repairs and Maintenance Expenditure 9 –
–
– 16 846 20 346 20 346
– 23 774 25 177 21 706

Annual Budget 2015-16 to 2018 Page 58

Annual Budget 2015-16 to 2018 Page 59

60
14 Municipal Manager's Quality Certificate
I MrsNNomandela, Municipal Manager of the Nyandeni Local Municipalityhereby certify that
theannual budget and supporting documentation have been prepared in accordance with
theMunicipal Finance Management Act 56 of 2003 and the regulations made under the Act,
and that the final annual budget and supporting documents are consistent with the Integrated
Development Plan of the municipality.
Signature
________________________________________
Mrs N. Nomandela
Municipal Manager
Nyandeni Local Municipality
Date
_______________________________________

61