Annual Average Unit Cost Trends In Montgomery County Solid Waste Management · PDF...
33
Annual Average Unit Cost Trends In Montgomery County Solid Waste Management FY02 – FY13 Prepared by: Anthony Skinner, Business Manager Rick Hands, Senior Financial Specialist Department Environmental Protection Division of Solid Waste Services
Transcript of Annual Average Unit Cost Trends In Montgomery County Solid Waste Management · PDF...
Annual Average Unit Cost Trends
In Montgomery County
Solid Waste Management
FY02 – FY13
Prepared by:
Anthony Skinner, Business Manager
Rick Hands, Senior Financial Specialist
Department Environmental Protection
Division of Solid Waste Services
Table of Contents
I THE REPORT
INTRODUCTION AND PURPOSE 3
SOLID WASTE OVERVIEW 4
ANALYSIS AND APPROACH TO FINANCIAL INFORMATION 5
Accounting Principles 7
Operating Expense Breakouts 8
RESULTS OF OPERATIONS
County Refuse Collection 10
Satellite Sites 10
Hazardous Waste Disposal, Residential and Commercial 11
Transfer Station 11
Out of County Refuse Disposal 12
Resource Recovery Facility & Related Waste Transfer 13
Post-Closure Care of Oaks and Gude Landfills, and Site 2 Maintenance 14
Recycling Outreach, Education, Enforcement, and Waste Reduction 15
Curbside Collection of Recyclable Materials 15
Dickerson Compost Facility & Related Yard Waste Grinding 16
Recycling Center 17
Enforcement Chargebacks 19
SUMMARY 20
APPENDICIES
A - Definitions 21
B - Allocated Costs: Activities 22
C - Costs Per-Ton: Activities 28
D - Crosswalk: Disposal Fund Programs to Activities 32
E - Crosswalk: Tonnage Streams to Activities 33
3
INTRODUCTION AND PURPOSE
The purpose of this report is twofold, (A) to provide a trend analysis with respect to the cost-
effectiveness of the County’s various solid waste management activities (cost centers), and (B) to
communicate with interested parties about the cost of those activities.
Comparing costs experienced from one time period to the next provides a type of internal
benchmarking. To be meaningful, annual expenses in such a time series must be defined consistently
with respect to the scope of the business activities to which they relate. Those costs should be normalized
to a measure well understood to drive or otherwise strongly relate to those expenses. For many solid
waste activities that cost-driving measure is “tonnage.” For other solid waste activities tonnage may be
less of a cost driver, but still a predominate measure of what it is that is being managed.
Often, the Department of Environmental Protection, Division of Solid Waste Services (SWS)
receives a question such as, “What does it cost to recycle, or to dispose of, a ton of trash?” Solid waste is
not a homogeneous substance, like water, but rather is comprised of many different types of materials—
virtually every substance in our culture. Consequently, managing solid waste services encompasses a
variety of activities and the resulting parameters represent activity-based measures of cost performance in
the form of “annual average unit costs”. We believe a time series of such consistently defined unit costs
can aid in identifying increases and decreases in the cost-effectiveness of the County’s solid waste
management activities. Annual expenses in such a time series are defined in a way with respect to the
scope of business activities to which they relate, and are normalized to a measure of what drives those
expenses. Moreover, if the expenses associated with each activity are uniformly defined in a manner
respecting full-cost accounting, then the approach can help communicate with interested parties the costs
of the County’s solid waste management.

4
SOLID WASTE OVERVIEW
The Department of Environmental Protection, Division of Solid Waste Services (SWS) manages
solid waste generated within the County in an environmentally and economically sound manner. The
Division of Solid Waste Services operates the County’s integrated solid waste management system which
consists of: methods and technologies, source reduction, recycling, waste-to-energy, contractual out-of-
county landfilling, maintenance of closed landfills, and a reserve permitted landfill. Also, the Division
provides contractual refuse collection services to single-family households in the lower part of the County
and contractual recycling collection throughout the County to single-family households outside of
municipalities.
Specifically the solid waste system: provides for the collection, transfer, mass burning, and
landfilling of solid waste; promotes reuse, recycling, and composting; directly provides recycling
collection services to residential units of six or fewer families in all unincorporated parts of the County;
provides Refuse collection to approximately 91,000 residences; and licenses the private haulers which
serve the County.
The operation and funding of the solid waste system is governed by (a) Chapter 48 of the
Montgomery County Code and (b) the County’s covenants contained in the Master Authorization, which
is a contractual obligation of the County for the benefit of counterparties to Long Term Obligations.
Under County law, the County has the authority to set System Benefit Charges (SBC) at a level sufficient
to comply with the Rate Covenant. Pursuant to the Master Authorization, the Rate Covenant requires that
the County fix, charge and collect fees for disposal services. The SBC are a user-fee assessed for the use
of the County’s solid waste system and the benefits derived from the use. Although it is not a tax, it is
delivered via property tax bills. The fees are set to recover the costs of solid waste operations.
The County has a Solid Waste Disposal Fund that is managed as an enterprise fund to account for
all financial activities of the solid waste system. The primary source of revenue for the County is the
SBC, which are collected on the property tax bill of residences and businesses. A rate-setting
methodology was developed to equitably calculate the SBC and this calculation reflects as closely as
possible the actual costs to the County for providing solid waste services within its solid waste
management district. Since 1994, when the County implemented the SBC, system revenues collected
through these charges constitute approximately 70% of the Solid Waste Disposal Fund’s revenues. The
second largest source of revenue is the Tipping Fees, which are charged to the haulers delivering refuse
for which disposal charges are not prepaid via the property tax bill.
5
ANALYSIS AND APPROACH TO FINANCIAL INFORMATION
As has been noted, the County conducts a variety of solid waste management activities. For the
purposes of this report, we have comprised a set of 12 solid waste management activities/cost centers,
which take into account the costs (full cost accounting – method whereby all costs are recognized) and
tonnages associated with each activity. We have done our best efforts to present each set of activities in a
distinct and traceable manner based on available cost-accounting and tonnage records. Compiling cost
accounting information for each activity, based on the budgetary alignment of the various activities
functions, was greatly facilitated by the implementation of the County’s ERP/ORACLE e-Business Suite
and Business Intelligent report. The result was a more accurate alignment of costs with each activity and
less time was spent on cross-functional allocation based on the perceived interrelatedness of certain
activities. We rely more and more on the ERP Systems cost budgetary alignment in order to develop the
appropriate cost accounting for each activity and less on interpretation. Below is the list of budgeted
activities/cost centers:
County Refuse Collection
Satellite Sites
Hazardous Waste Disposal, Residential and Commercial
Transfer Station
Out of County Refuse Disposal
Resource Recovery Facility & Related Waste Transfer
Post-Closure Care of Oaks and Gude Landfills, and Site 2 Maintenance
Recycling Outreach, Education, Enforcement, and Waste Reduction
Curbside Collection of Recyclable Materials
Dickerson Compost Facility & Related Yard Waste Grinding
Recycling Center
Enforcement Chargebacks
The programs expenses and revenues for all solid waste services are recorded in two funds –
Refuse Collection and Disposal. All costs recorded in the Refuse Collection Fund are allocated to the
“County Refuse Collection” activity. The Disposal Fund contains the revenues and expenses for all other
solid waste programs. These programs’ costs and applicable revenues are allocated to their respective
activities. See Appendix D for a crosswalk from program to activity.
The Statement of Revenues, Expenses, and Fund Balance for both funds – Refuse Collection and
Disposal are on a Generally Accepted Accounting Principles (GAAP) basis. This means that bond
principal payments and encumbrances are not included and the basis of accounting is full accrual. The
allocated expenses agree with the GAAP expenses reported in the County’s Comprehensive Annual
Financial Reports (CAFR).
The Refuse Collection Fund’s expenses are allocated to the Refuse Collection activity or cost
center. These expenses include salaries, insurance, retirement, and other operating expenses. Since these

6
expenses are on a GAAP basis, capital outlay expenses are not included. Capital Outlay is charged
through depreciation expense. Additionally, indirect costs, rents, and desk-top computer modernization
are allocated according to personnel expenses.
The Disposal Fund’s expenses are allocated to 11 different activities or cost centers depending on
the program. The activities or cost centers are closely aligned with the budgetary programs listed in the
County’s annual budget book. These expenses include salaries, insurance, retirement, and other operating
expenses. Since these expenses are on a GAAP basis, capital outlay expenses are not included. Capital is
charged through depreciation expense. Additionally, indirect costs, rents, and desk-top computer
modernization are allocated according to personnel expenses.
Ten of the activities were normalized to the annual tonnages managed by those activities, yielding
annual average unit costs. For each of these 10 activities, a bar graph shows the unit costs when the
annual expenses are normalized to those annual tonnages. Thus, for all but two activities, each page of
text is accompanied by a time series bar graph depicting the resulting annual average unit costs ($/ton).
Two of the activities—“Enforcement Chargebacks” and “County Landfill Operations”—cannot be
meaningfully normalized to any tonnages. The total expenses for these activities are presented so that all
solid waste management expenses and trends are recognized.
For each activity, the results are presented in time-series fashion, and the linear regression best-fit
trend for the entire 12 -year period appears as a distinctive black dashed line. Since the value of money
changes with time (e.g. inflation), it is necessary, as with any time series involving money, to recognize
that changing value. Economists sometimes introduce the concept of “nominal dollars”, converting each
year’s expenditures into inflation-adjusted results. For the purposes of this report, and its graphical
presentation of results, that abstraction is avoided. Rather, each year’s actual expenses are presented in
terms of each year’s dollar values (e.g. unadjusted for inflation) and each graphical result includes a
continuous red-colored curve showing the annual value of the Consumer Price Index.
This report derives a set of Annual Average Unit Costs (AAUC) that encompasses all County
solid waste management expenses for fiscal years 2002 through 2013. For the purposes of this report the
meaning of AAUC are defined in the following fashion:
The term: Refers to:
“Annual” Each result is calculated on the basis of an entire County fiscal
year, from July 1 through June 30.
“Average” Both numerator and denominator values are measured over the
same full (fiscal) year period—yielding, for a particular
management activity, the cost for managing the average ton
during that year.
“Unit” One ton (e.g. the costs of the activity are normalized to the
tonnage of solid waste managed by the activity during the year).
“Cost” The County’s full cost accounting expense of conducting a
defined scope of activity.
7
Finally, it is important to recognize that the measures derived in this report cannot be used to
predict how County costs might change in response to shifts in tonnage from one type of activity to
another. Answering such a question as “What happens to County costs if a certain type of waste is
shifted from trash can to recycling bin?” requires a different kind of cost parameter—what economist call
“incremental” or “marginal” unit costs. This report does not derive incremental or marginal unit costs.
The reader is cautioned that the Annual Average Unit Cost results derived here should not be used to
evaluate “what-if” scenarios.
Accounting Principles
Full Cost Accounting: Montgomery County manages solid waste under accounting standards and
practices that isolate all of its solid waste management costs from the costs of other County enterprises
and general government functions. That cost-isolation enables full cost accounting wherein costs that
would otherwise be blended-in with general government functions are, instead, fully recognized as solid
waste management costs. Such costs as administration, use of shared buildings and shared equipment,
overhead and indirect costs can be substantial, and failing to recognize them as solid waste management
costs would not serve the purpose of accurately communicating about the costs of solid waste
management. Therefore, this analysis takes full advantage of the cost-isolation detail available in the
County’s accounting system and presents the measures in terms of full cost.
Generally Accepted Accounting Principles: To enable meaningful year-to-year comparisons, this
analysis is prepared on the basis of generally accepted accounting principles (GAAP) rather than a
budgetary (cash) basis. The GAAP presentation basis is very useful, for example, because in GAAP, the
cost of a capital asset is reported as its depreciation expense over its useful life rather than as single-year
expenditure. Additionally, expenses are recognized when incurred (not when paid for) and revenues are
recognized when earned (not when received). This basis of accounting allows for a more complete picture
of the solid waste activities.
Reconcile to Audited County Financial Statements: Placing the analysis on a GAAP basis also helps the
analysis to reconcile directly to the Statement of Revenues and Expenses contained in the County’s
audited Comprehensive Annual Financial Reports (CAFR).
Accounting of Tonnages: Montgomery County conducts an accounting of all solid waste flows that
occurred during the County’s fiscal year. These tonnages are used in the denominators of the average
unit cost per ton calculation for applicable activities. See Appendix E for crosswalk of tonnage streams to
activities.
8
Operating Expense Breakouts
We have distinguished the different types of expenses because we believe that in the context of a
time series, in particular, such breakouts help to clarify sources or contributions to overall cost trends.
See Appendix B for activities’ (cost centers’) allocated expenses, as well as, revenues and credits. Total
breakouts are as follows:
□ Credits or Offsets,
□ Recycling Revenue,
□ Allocated Administrative Expenses,
□ Chargebacks (from other units of County government),
□ Interest and Depreciation on Fixed Assets,
□ Debt Service , and
□ Other Operating Expenses.
Credits and Offsets: In some cases the County has contracted facility operations to a third party, the
scope of work includes marketing a product with the stipulation that sales benefit the County in the form
of lowered operating costs billed to the County. This benefit is referred to as a “credit and offsets”
against operating expense. For example, the Resource Recovery Facility program (RRF), receives
revenues for both electricity and ferrous sold, along with investment income. These revenue and income
sources are not considered recognizable revenue by the County, and they offset the operating expenses
incurred to operate the RRF facility. The contractor operating the RRF facility will reduce their invoiced
expenses by the amount of the revenue and income received during that period. For the sake of this
report, these amounts are shown as offsets, not actual revenues received. The expense reports have
already been reduced according to the revenue and income generated by those sources. See Appendix B
for credits/offsets amounts.
Recycling Revenues: Some solid waste management activities generate revenue to the County in the form
of sales of recyclable materials from the County recycling center. See Appendix B for recycling revenue
amounts.
Allocated Administrative Expenses: Expenses tracked in County budgetary programs entitled
“Administration”, “Waste System Program Development”, “Revenue Analysis and System Evaluation”,
and “Automation” are not directly associated with specific tonnage-based activities. Full-cost accounting
requires an attribution of those administrative costs among each tonnage-related activity. The reason for
the attribution arise from the need to manage people, therefore those administrative expenses were
distributed among the twelve cost center activities in proportion to the work years budgeted in each non-
administrative budgetary program. See Appendix B for administrative expense amounts.
Chargebacks: These are expenses of other County agencies which, for various reasons, are charged to
the Solid Waste Fund. The chargebacks from the Department of Finance and the Office of the County
Attorney are distributed among the 11 activities in the same fashion as allocated administrative expenses
discussed above. Other chargebacks are for scopes of services directly related to the Division of Solid
Waste Services’ budgetary programs, and thus, are readily associated with the 11 tonnage-related
measures. See Appendix B for chargeback amounts.
Interest and Depreciation Expenses: The County may purchase a capital asset in one of two ways—
either by an outlay of sufficient capital in one year (capital outlay), or by financing the purchase, such that
it pays out debt service (scheduled principal and interest) over multiple-years. In both cases, GAAP
accounting assures appropriate recognition of the resulting expenses over multiple years rather than in the
9
year acquired. In 1993, the County sold Solid Waste Revenue Bonds in order to finance many of its solid
waste assets, and these bonds were subsequently re-financed to take advantage of lower interest rates
available in 2003 and 2013. On a cash basis, the County experiences payments of scheduled principal
and interest. In GAAP, the acquired asset is depreciated (a payout for borrowed principal is not a GAAP
expense, depreciation taking its place) and interest payments are expressed on an accrual basis rather than
on the basis of cash paid out during the accounting period. Depreciation and interest expenses resulting
from County solid waste bond issues are allocated among the activities in this report consistent with the
usage records of the bond proceeds. In the case of any capital outlay, cash is traded for an asset, and the
asset is then “expensed”, for GAAP purposes, over the useful life of the item purchased. For
safeguarding purposes as well as accounting, SWS tracks the location and use of each of its capital assets,
and in cooperation with the Department Finance, SWS also maintains a schedule of depreciation for those
assets. Those tools provide the basis for properly attributing County depreciation expense to each unit
cost measure. See Appendix B for both interest and depreciation amounts (combined).
Debt Service: Montgomery County’s Solid Waste Disposal System includes the Montgomery County
RRF facility. This facility, also known as a Waste-to-Energy Facility, is owned, for accounting purposes,
by a third party—the Northeast Maryland Waste Disposal Authority (the Authority). The capacity of that
facility is 100% dedicated to and controlled by Montgomery County, however, the Authority (not the
County) issued bonds to finance its construction. The County intends to become owner of the RRF when
the Authority’s bonds are paid off, in April 2016, but because it is not the owner during that period, the
capital cost of that facility is not depreciated as a County expense. For services provided by the
Authority, including dedicated use of the RRF, the County pays the Authority in a manner that enables
the Authority to pay off the bonds it issued for the County facility. In effect, part of the annual operating
costs that the County pays for use of the RRF, represent the net debt service of the Authority (scheduled
principle and interest, less all investment earnings of trustee accounts). Therefore, it is of interest, for the
purposes of this report, to give a break-out to that portion of County operating costs resulting from that
third party debt service. See Appendix B for debt service amounts.
Other Operating Expenses: This represents the total of all expenses associated with an activity less the
above-noted breakouts. See Appendix B for other operating expense amounts.

10
COST PER TON OF OPERATIONS
County Refuse Collection
This activity encompasses all
solid waste management
operations involved in
providing curbside collection
of waste set out for disposal
from single-family and town
homes in the County’s Refuse
Collection District. There are
approximately 91,000 homes
in this district. All costs
associated with the County’s
refuse collection service are
included in this measure. The
service includes once-per-week
collection of regular household refuse set out for disposal, plus up to five bulk pick-ups per year of non-
metallic items, per home served. All waste collected is delivered to the County’s Transfer Station.
Satellite Site
This activity encompasses those
solid waste management operations
involved in providing a Satellite
bulky waste “Drop-Off” Site at the
Poolesville Highway Services depot.
The Satellite Site helps to limit the
temptation to litter roadways with
bulky waste. Only loads less than
500 lbs. are allowed and no regular
household garbage. (Residents in
the outlying parts of the County do
not receive County Refuse
Collection and must contract with
private-sector collectors, the latter tending to charge substantial extra fees for bulky waste collection.)
Another purpose of this site is to provide convenience to residents located farther from the County’s
Transfer Station.
79.2
1
67.8
8
74.7
4
86
.06
116.7
7 217.9
6
158.9
6
120.8
6
106.5
0
100.6
9
107.6
1
161.1
2
0
50
100
150
200
250
300
350
$-
$50
$100
$150
$200
$250
FY02 FY03 FY04 FY05 FY06 FY07 FY08 FY09 FY10 FY11 FY12 FY13
Satellite Sites $Cost/Ton
Cost / Ton
CPI
Linear (Cost /Ton)
11
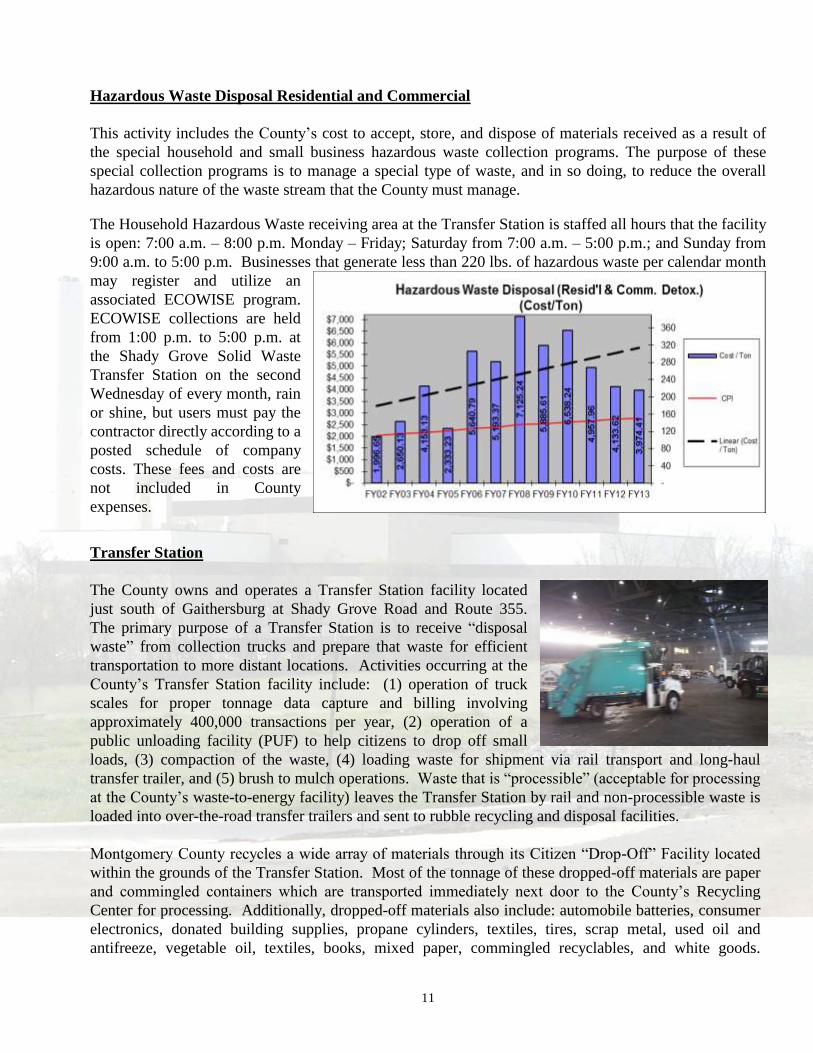
Hazardous Waste Disposal Residential and Commercial
This activity includes the County’s cost to accept, store, and dispose of materials received as a result of
the special household and small business hazardous waste collection programs. The purpose of these
special collection programs is to manage a special type of waste, and in so doing, to reduce the overall
hazardous nature of the waste stream that the County must manage.
The Household Hazardous Waste receiving area at the Transfer Station is staffed all hours that the facility
is open: 7:00 a.m. – 8:00 p.m. Monday – Friday; Saturday from 7:00 a.m. – 5:00 p.m.; and Sunday from
9:00 a.m. to 5:00 p.m. Businesses that generate less than 220 lbs. of hazardous waste per calendar month
may register and utilize an
associated ECOWISE program.
ECOWISE collections are held
from 1:00 p.m. to 5:00 p.m. at
the Shady Grove Solid Waste
Transfer Station on the second
Wednesday of every month, rain
or shine, but users must pay the
contractor directly according to a
posted schedule of company
costs. These fees and costs are
not included in County
expenses.
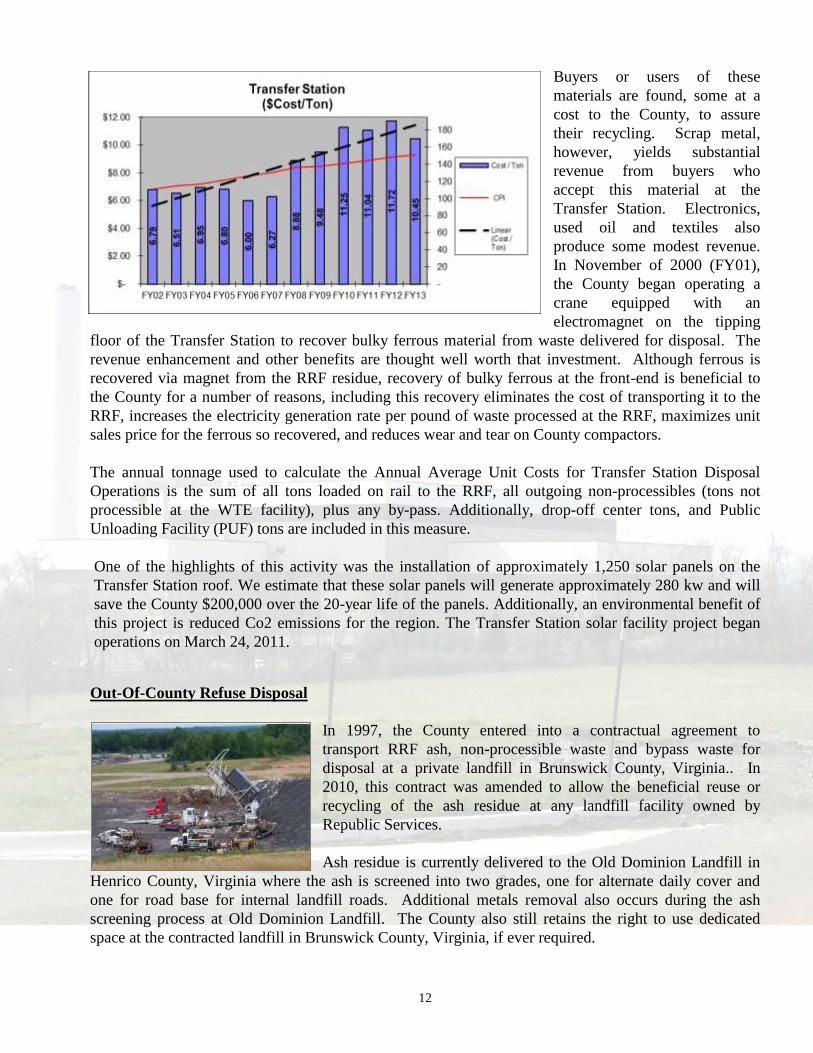
Transfer Station
The County owns and operates a Transfer Station facility located
just south of Gaithersburg at Shady Grove Road and Route 355.
The primary purpose of a Transfer Station is to receive “disposal
waste” from collection trucks and prepare that waste for efficient
transportation to more distant locations. Activities occurring at the
County’s Transfer Station facility include: (1) operation of truck
scales for proper tonnage data capture and billing involving
approximately 400,000 transactions per year, (2) operation of a
public unloading facility (PUF) to help citizens to drop off small
loads, (3) compaction of the waste, (4) loading waste for shipment via rail transport and long-haul
transfer trailer, and (5) brush to mulch operations. Waste that is “processible” (acceptable for processing
at the County’s waste-to-energy facility) leaves the Transfer Station by rail and non-processible waste is
loaded into over-the-road transfer trailers and sent to rubble recycling and disposal facilities.
Montgomery County recycles a wide array of materials through its Citizen “Drop-Off” Facility located
within the grounds of the Transfer Station. Most of the tonnage of these dropped-off materials are paper
and commingled containers which are transported immediately next door to the County’s Recycling
Center for processing. Additionally, dropped-off materials also include: automobile batteries, consumer
electronics, donated building supplies, propane cylinders, textiles, tires, scrap metal, used oil and
antifreeze, vegetable oil, textiles, books, mixed paper, commingled recyclables, and white goods.
12
Buyers or users of these
materials are found, some at a
cost to the County, to assure
their recycling. Scrap metal,
however, yields substantial
revenue from buyers who
accept this material at the
Transfer Station. Electronics,
used oil and textiles also
produce some modest revenue.
In November of 2000 (FY01),
the County began operating a
crane equipped with an
electromagnet on the tipping
floor of the Transfer Station to recover bulky ferrous material from waste delivered for disposal. The
revenue enhancement and other benefits are thought well worth that investment. Although ferrous is
recovered via magnet from the RRF residue, recovery of bulky ferrous at the front-end is beneficial to
the County for a number of reasons, including this recovery eliminates the cost of transporting it to the
RRF, increases the electricity generation rate per pound of waste processed at the RRF, maximizes unit
sales price for the ferrous so recovered, and reduces wear and tear on County compactors.
The annual tonnage used to calculate the Annual Average Unit Costs for Transfer Station Disposal
Operations is the sum of all tons loaded on rail to the RRF, all outgoing non-processibles (tons not
processible at the WTE facility), plus any by-pass. Additionally, drop-off center tons, and Public
Unloading Facility (PUF) tons are included in this measure.
One of the highlights of this activity was the installation of approximately 1,250 solar panels on the
Transfer Station roof. We estimate that these solar panels will generate approximately 280 kw and will
save the County $200,000 over the 20-year life of the panels. Additionally, an environmental benefit of
this project is reduced Co2 emissions for the region. The Transfer Station solar facility project began
operations on March 24, 2011.
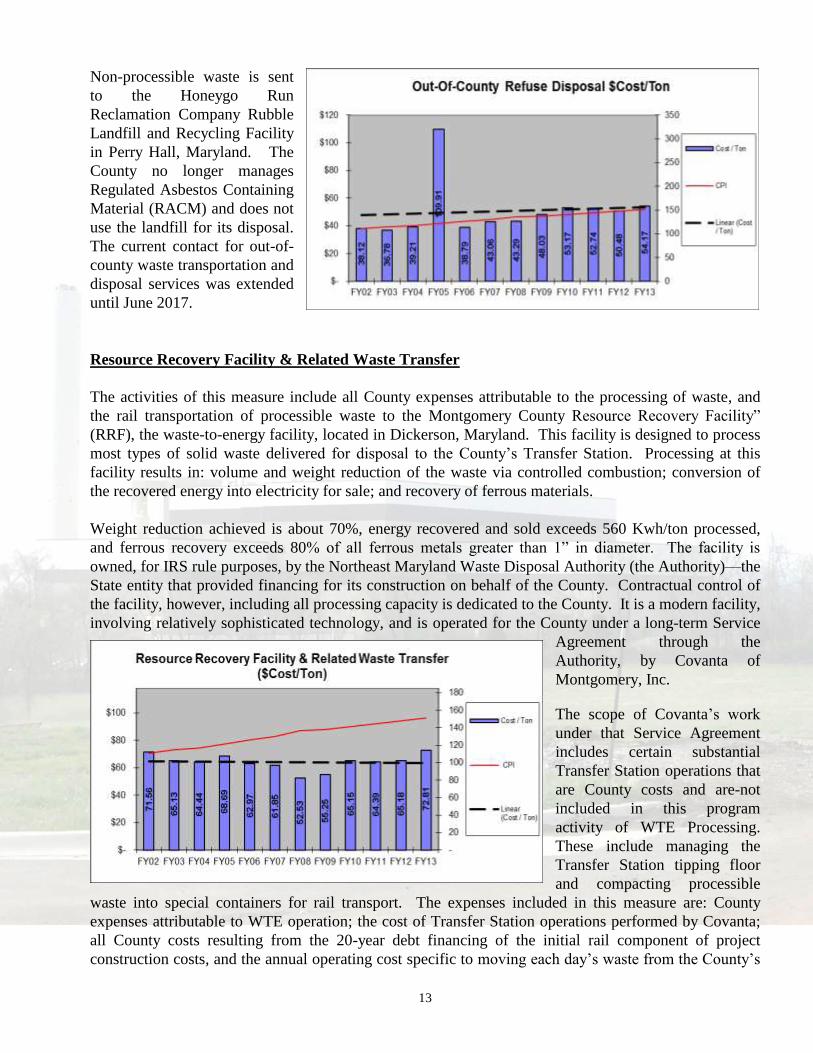
Out-Of-County Refuse Disposal
In 1997, the County entered into a contractual agreement to
transport RRF ash, non-processible waste and bypass waste for
disposal at a private landfill in Brunswick County, Virginia.. In
2010, this contract was amended to allow the beneficial reuse or
recycling of the ash residue at any landfill facility owned by
Republic Services.
Ash residue is currently delivered to the Old Dominion Landfill in
Henrico County, Virginia where the ash is screened into two grades, one for alternate daily cover and
one for road base for internal landfill roads. Additional metals removal also occurs during the ash
screening process at Old Dominion Landfill. The County also still retains the right to use dedicated
space at the contracted landfill in Brunswick County, Virginia, if ever required.
13
Non-processible waste is sent
to the Honeygo Run
Reclamation Company Rubble
Landfill and Recycling Facility
in Perry Hall, Maryland. The
County no longer manages
Regulated Asbestos Containing
Material (RACM) and does not
use the landfill for its disposal.
The current contact for out-of-
county waste transportation and
disposal services was extended
until June 2017.
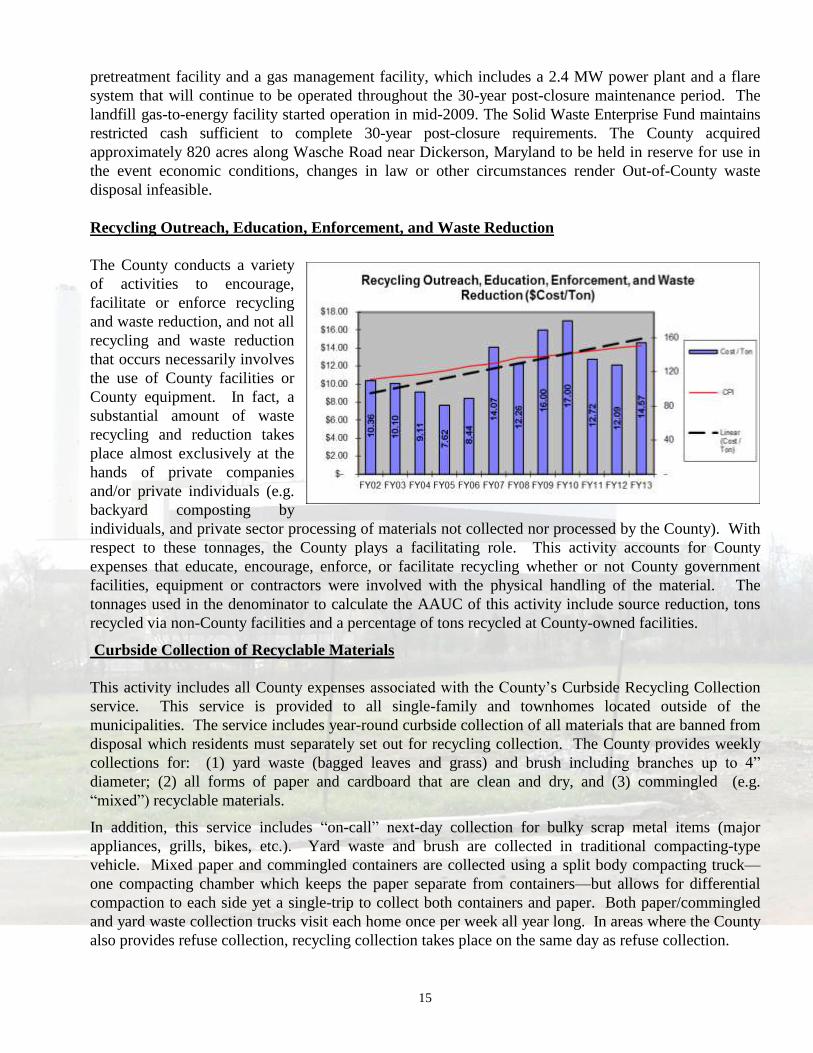
Resource Recovery Facility & Related Waste Transfer
The activities of this measure include all County expenses attributable to the processing of waste, and
the rail transportation of processible waste to the Montgomery County Resource Recovery Facility”
(RRF), the waste-to-energy facility, located in Dickerson, Maryland. This facility is designed to process
most types of solid waste delivered for disposal to the County’s Transfer Station. Processing at this
facility results in: volume and weight reduction of the waste via controlled combustion; conversion of
the recovered energy into electricity for sale; and recovery of ferrous materials.
Weight reduction achieved is about 70%, energy recovered and sold exceeds 560 Kwh/ton processed,
and ferrous recovery exceeds 80% of all ferrous metals greater than 1” in diameter. The facility is
owned, for IRS rule purposes, by the Northeast Maryland Waste Disposal Authority (the Authority)—the
State entity that provided financing for its construction on behalf of the County. Contractual control of
the facility, however, including all processing capacity is dedicated to the County. It is a modern facility,
involving relatively sophisticated technology, and is operated for the County under a long-term Service
Agreement through the
Authority, by Covanta of
Montgomery, Inc.
The scope of Covanta’s work
under that Service Agreement
includes certain substantial
Transfer Station operations that
are County costs and are-not
included in this program
activity of WTE Processing.
These include managing the
Transfer Station tipping floor
and compacting processible
waste into special containers for rail transport. The expenses included in this measure are: County
expenses attributable to WTE operation; the cost of Transfer Station operations performed by Covanta;
all County costs resulting from the 20-year debt financing of the initial rail component of project
construction costs, and the annual operating cost specific to moving each day’s waste from the County’s

14
Transfer Station to its Waste-to-Energy facility. To calculate the unit costs for this measure, the tonnage
used in the denominator of this measure is the annual tonnage loaded on rail and sent to the WTE facility
during the subject fiscal period.
The majority of the County’s expense for this activity is comprised of the net debt service of the
Authority; this amount is scheduled and billed to the County through the Service Agreement. The
facility was refinance in FY2003 and FY2013 to take advantage of lower interest rates, thereby lowering
that component of County expense. Sales of electricity and recovered ferrous provide large off-set
credits against operating costs otherwise billable to the County.
Montgomery County pioneered the development of a solid waste rail transport system that provides for
the reliable movement of waste from its Transfer Station to its Waste-to-Energy (WTE) facility located
in Dickerson Maryland. The rail transport component of the County’s Solid Waste Management
System avoids over 25,000 truck trips per year from the Transfer Station to the WTE Facility, thereby
minimizing truck traffic on County roads. The Rail Component of the County system includes special
containers, rail cars, side track, rail yards and overhead gantry-based on-loading and off-loading facilities
at each end of the system. The actual movement of each day’s waste-laden train of railcars is carried out
by CSX Transportation, a subcontractor, and on tracks owned by CSX. The County pays for this
transportation within the scope of its Waste-to-Energy operating Service Agreement.
Post-Closure Care of Oaks and Gude Landfills, and Site 2 Maintenance
County Landfill activities
include the ongoing monitoring
and maintenance of the
County’s two closed landfills
(Gude and Oaks), and the
maintenance of land held in
reserve by the County (Site 2)
for possible future landfilling.
The cost of maintaining these
closed landfills is an ongoing
obligation of the County.
Since these expenses do not
relate to any current year
tonnages, they cannot be
meaningfully normalized. Therefore, they are presented in time-series fashion in raw form as total
expenses attributed to the maintenance of these three sites.
The closed Gude Landfill is located on an approximately 120-acre tract in the central part of the County
just north of Rockville. Checks are performed for the presence of landfill gas in gas monitoring wells
along the perimeter of the site. Closed since 1982, the County currently monitors the ground water
quality at the site. The County has retained a contractor to maintain an active methane gas collection
system at the Gude Landfill. Some methane extracted from the closed Landfill is used to generate
electricity at a small 0.8 MW on-site power plant. The rest is destroyed through a ground flare system. A
larger power plant was previously at the site from 1985 to 2006. The new facility was completed in mid-
2009 and is smaller due to reduced expectations concerning gas generation over the next 20 years.
The Oaks Landfill is located on a 545 acre tract near Laytonsville, Maryland. The landfill stopped
receiving waste in 1997, and final capping was completed in 2001. The Oaks Landfill has a leachate
15
pretreatment facility and a gas management facility, which includes a 2.4 MW power plant and a flare
system that will continue to be operated throughout the 30-year post-closure maintenance period. The
landfill gas-to-energy facility started operation in mid-2009. The Solid Waste Enterprise Fund maintains
restricted cash sufficient to complete 30-year post-closure requirements. The County acquired
approximately 820 acres along Wasche Road near Dickerson, Maryland to be held in reserve for use in
the event economic conditions, changes in law or other circumstances render Out-of-County waste
disposal infeasible.
Recycling Outreach, Education, Enforcement, and Waste Reduction
The County conducts a variety
of activities to encourage,
facilitate or enforce recycling
and waste reduction, and not all
recycling and waste reduction
that occurs necessarily involves
the use of County facilities or
County equipment. In fact, a
substantial amount of waste
recycling and reduction takes
place almost exclusively at the
hands of private companies
and/or private individuals (e.g.
backyard composting by
individuals, and private sector processing of materials not collected nor processed by the County). With
respect to these tonnages, the County plays a facilitating role. This activity accounts for County
expenses that educate, encourage, enforce, or facilitate recycling whether or not County government
facilities, equipment or contractors were involved with the physical handling of the material. The
tonnages used in the denominator to calculate the AAUC of this activity include source reduction, tons
recycled via non-County facilities and a percentage of tons recycled at County-owned facilities.
Curbside Collection of Recyclable Materials
This activity includes all County expenses associated with the County’s Curbside Recycling Collection
service. This service is provided to all single-family and townhomes located outside of the
municipalities. The service includes year-round curbside collection of all materials that are banned from
disposal which residents must separately set out for recycling collection. The County provides weekly
collections for: (1) yard waste (bagged leaves and grass) and brush including branches up to 4”
diameter; (2) all forms of paper and cardboard that are clean and dry, and (3) commingled (e.g.
“mixed”) recyclable materials.
In addition, this service includes “on-call” next-day collection for bulky scrap metal items (major
appliances, grills, bikes, etc.). Yard waste and brush are collected in traditional compacting-type
vehicle. Mixed paper and commingled containers are collected using a split body compacting truck—
one compacting chamber which keeps the paper separate from containers—but allows for differential
compaction to each side yet a single-trip to collect both containers and paper. Both paper/commingled
and yard waste collection trucks visit each home once per week all year long. In areas where the County
also provides refuse collection, recycling collection takes place on the same day as refuse collection.

16
The scope of this activity
includes collection from
curbside and delivery to the
County Recycling Center only.
It does not include costs for
processing the collected
materials; a separate measure
was developed to address the
different processing and
marketing activities that the
County must carry out in order
to recycle these materials.
It should be noted that the
County has contracted for collection services on the basis of seven year contracts, with cost per service
unit indexed to the CPI, but otherwise fixed, and allowing the County two additional years at its option.
As a result of these collection contracts, the County provides separate curbside collection for 212,496
single-family households for yard trim, glass bottles and jars, metal and plastic containers, and all types of
clean, unsoiled paper.
Dickerson Compost Facility & Related Yard Waste Grinding
Yard waste composting is a
key component of the County’s
recycling infrastructure.
Dickerson Composting
activities includes: the grinding
of leaves and grass received at
the Transfer Station, which
leaves and grass will be
composted, loading of that
material for transport to the
facility, transportation of the
ground-up leaves and grass
from the Transfer Station to the
facility, the actual composting
of that material at the facility, and the marketing of the compost products.
With respect to County Compost operating expenses, it is important to recognize that the sales of
compost product represent revenues to the third-party operating contractor (e.g. are not booked as
revenue to the County) but, rather, are netted-out of the operating expenses chargeable to the County by
that contractor. Thus, those third-party revenues represent credits against operating costs.
Delivery of yard waste to the County’s Dickerson Composing Facility has been restricted, by agreement
with the Sugarloaf Citizen’s Association (SCA), to 77,000 tons per fiscal year. During years in which
that allowance has been insufficient, the County located backup composting capacity at out-of-County
locations. The annual tonnages used to normalize the County’s total annual composting and related
grinding expense is the sum of deliveries to the Dickerson Compost Facility during the fiscal year plus

17
any tonnage delivered to back-up composing facilities plus tonnages from the grinding of brush at the
Transfer Station.
Wood yard trim material (e.g. brush) is not amenable to composting. The County’s experience,
however, is that this material can be recycled, if processed to form a desirable mulch product. Most of
the mulch is sold to a mulch contractor who further processes the mulch and then sells it. Revenue from
the mulch partially offsets wood waste management and grinding costs. The County also has several
free piles of mulch for residents, including one next to the County’s Recycling Center. County
processing includes grinding all natural wood waste using three heavy-duty horizontal- grinders. This
activity occurs at the Transfer Station.
All leaves and grass composted at the Composting Facility are collected either by vacuum truck or
curbside collection service and is transported to Dickerson from either the County’s centrally-located
Transfer Station, or, in the case of some vacuumed leaves, from the Brookville Depot which is located in
the eastern part of the County. The function is achieved by multiple contract services involving 18-wheel
transfer trailer, and, in the case of yard waste leaving the Transfer Station, also partly by rail link to the
Dickerson site employing special cars and mobile tipping chassis. When the train can accommodate the
service, transportation of yard waste by rail is more economically feasible than trucking; also truck
traffic is a concern to the residents in the facility area.
One of the FY11 highlights of this program is that Solid Waste initiated development of a formal
Environmental Management System (EMS) following the guidelines issued by International Standards
Organization (ISO) 14001 for operations of its Yard Trim Composting Facility in Dickerson, Maryland.
This EMS goes beyond regulatory compliance, establishing a formal process of continual advances in
environmental stewardship.
Recycling Center
This activity captures the cost
of processing and marketing
container materials of the type
that County single-family
residents are required to place
in their blue bins at curbside,
and the processing of paper at
Office Paper Systems, Inc.
(OPS). Materials such as —
glass bottles and jars, aluminum
cans and aluminum foil, ferrous
and bimetal cans, and almost all
types of plastic containers that
held nontoxic materials—are all
processed at the County’s Recycling Center. Residential mixed paper is processed at OPS. Glass bottles
are sorted by color and accepted Freight on Board (FOB) at the Recycling Center by recycling buyers.
Aluminum cans are segregated, baled and sold at top dollar, as is aluminum foil separately baled and
sold as a separate grade, as are ferrous and bi-metal cans. The plastic containers are now sorted by type,
baled, and shipped to plastics buyers.
18
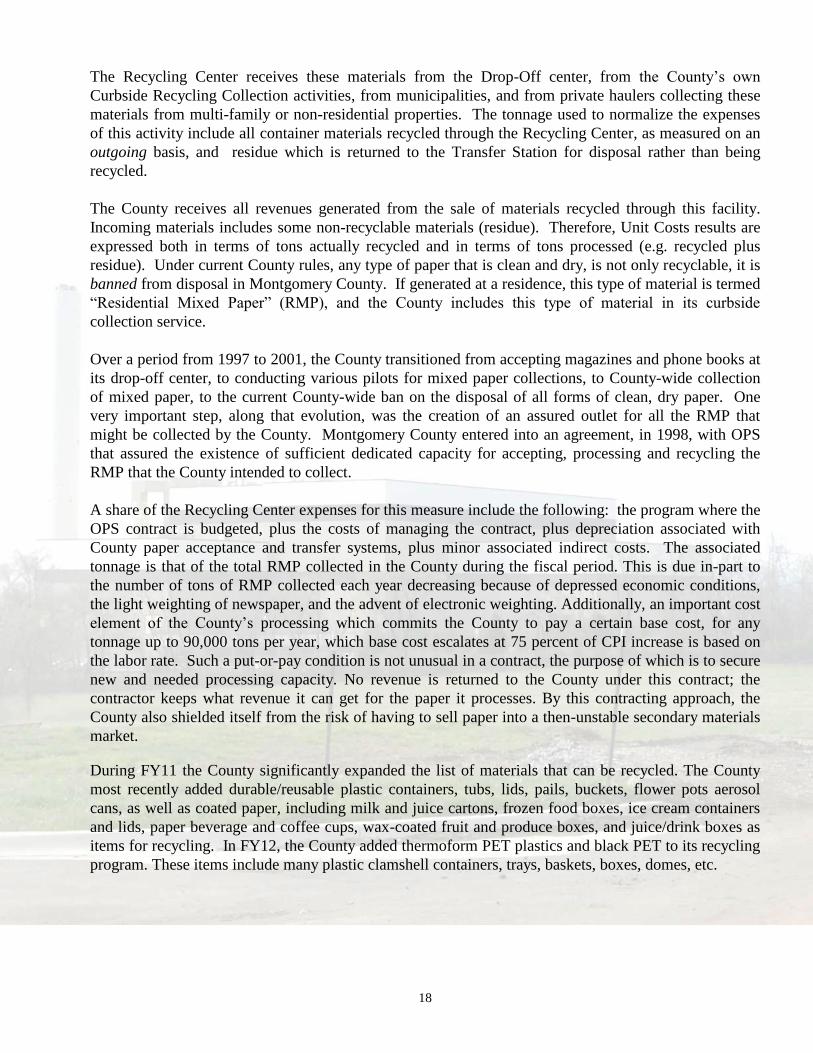
The Recycling Center receives these materials from the Drop-Off center, from the County’s own
Curbside Recycling Collection activities, from municipalities, and from private haulers collecting these
materials from multi-family or non-residential properties. The tonnage used to normalize the expenses
of this activity include all container materials recycled through the Recycling Center, as measured on an
outgoing basis, and residue which is returned to the Transfer Station for disposal rather than being
recycled.
The County receives all revenues generated from the sale of materials recycled through this facility.
Incoming materials includes some non-recyclable materials (residue). Therefore, Unit Costs results are
expressed both in terms of tons actually recycled and in terms of tons processed (e.g. recycled plus
residue). Under current County rules, any type of paper that is clean and dry, is not only recyclable, it is
banned from disposal in Montgomery County. If generated at a residence, this type of material is termed
“Residential Mixed Paper” (RMP), and the County includes this type of material in its curbside
collection service.
Over a period from 1997 to 2001, the County transitioned from accepting magazines and phone books at
its drop-off center, to conducting various pilots for mixed paper collections, to County-wide collection
of mixed paper, to the current County-wide ban on the disposal of all forms of clean, dry paper. One
very important step, along that evolution, was the creation of an assured outlet for all the RMP that
might be collected by the County. Montgomery County entered into an agreement, in 1998, with OPS
that assured the existence of sufficient dedicated capacity for accepting, processing and recycling the
RMP that the County intended to collect.
A share of the Recycling Center expenses for this measure include the following: the program where the
OPS contract is budgeted, plus the costs of managing the contract, plus depreciation associated with
County paper acceptance and transfer systems, plus minor associated indirect costs. The associated
tonnage is that of the total RMP collected in the County during the fiscal period. This is due in-part to
the number of tons of RMP collected each year decreasing because of depressed economic conditions,
the light weighting of newspaper, and the advent of electronic weighting. Additionally, an important cost
element of the County’s processing which commits the County to pay a certain base cost, for any
tonnage up to 90,000 tons per year, which base cost escalates at 75 percent of CPI increase is based on
the labor rate. Such a put-or-pay condition is not unusual in a contract, the purpose of which is to secure
new and needed processing capacity. No revenue is returned to the County under this contract; the
contractor keeps what revenue it can get for the paper it processes. By this contracting approach, the
County also shielded itself from the risk of having to sell paper into a then-unstable secondary materials
market.
During FY11 the County significantly expanded the list of materials that can be recycled. The County
most recently added durable/reusable plastic containers, tubs, lids, pails, buckets, flower pots aerosol
cans, as well as coated paper, including milk and juice cartons, frozen food boxes, ice cream containers
and lids, paper beverage and coffee cups, wax-coated fruit and produce boxes, and juice/drink boxes as
items for recycling. In FY12, the County added thermoform PET plastics and black PET to its recycling
program. These items include many plastic clamshell containers, trays, baskets, boxes, domes, etc.

19
Enforcement Chargebacks
The Department of Housing and Community Affairs (DHCA), together with the Department of
Environmental Protection (DEP), provide a variety of solid waste enforcement support activities. For
the study period, the County’s costs for these activities has been budgeted in the “Solid Waste
Enforcement Program”, which is comprised entirely of the chargebacks to these two agencies, plus
associated indirect costs (transfers from the Disposal Fund to the General Fund) in proportion to the
work years budgeted within those chargebacks.
DHCA activities, under this
program, include staff response
to citizen complaints dealing
with: storage and removal of
solid waste; illegal solid waste
dumping activities in the
County; storage of unregistered
vehicles on private property
throughout the County; storage
of inoperable vehicles on private
property; improper screening of
dumpsters, particularly those in
shopping areas; and control and
regulation of weeds throughout the County. The DHCA program also includes a “Clean or Lien”
component, which, when necessary, pays for the removal of dangerous or unsightly trash, perimeter
grass, and weeds on properties which the owners have failed to maintain as required.
Under this chargeback, the Department of Environmental Protection (DEP) conducts a variety of other
environmental compliance activities not directly associated with any particular solid waste facility. DEP
provides environmental monitoring and compliance activities directly related to County solid waste
facilities under other chargebacks; expenses for those DEP chargebacks are allocated in association with
unit cost measures already derived.
Since these DHCA and DEP expenses cannot be attributable to the management of any particular solid
waste tonnage flow, they cannot be normalized to tonnage to create a meaningful Annual Average Unit
Cost measure.

20
SUMMARY
This report has provided an activity-based full-cost accounting of Montgomery County integrated
solid waste management in Montgomery County for the 12-year period of FY2002 through FY2013.
The annual costs of all but two major County solid waste management activities have been normalized
to the annual tonnage of material managed by each activity, yielding broad trend lines in terms of the
annual average unit costs of those activities.
This unit cost approach is useful for internal benchmarking and for tracking cost-performance.
While both annual expenses and solid waste tonnages can be influenced by weather and other
externalities; the analytical approach demonstrated here has yielded some clear trends.
The range of activities involved in Montgomery County’s integrated solid waste management
system is broad, but adherence to full-cost accounting, together with an activity-based approach, makes
possible a meaningful type of communication about the actual costs of solid waste management. We
believe that this report’s detailed analytical approach, using a unified overall presentation, will provide a
basis upon which to communicate to the interested public about the full cost of solid waste management
at any desired level of detail.
Solid Waste’s recycling programs encourage responsible environmental practices for the public
by offering free drop-offs for almost any type of material; as well as a strong residential curbside
collection program. Substantial gains in recycling have reduced the environmental footprint related to
waste management in Montgomery County. Through the use of rail transportation for both refuse and
yard waste sent to the RRF Facility and the Dickerson Compost Facility respectively, the County
removed the equivalent of 120 tractor trailers from the road each day.

21
Appendix A – DEFINITIONS
Consumer Price Index (CPI) - A measure that examines the weighted average of prices of a basket of
consumer goods and services, such as transportation, food and medical care. The CPI is calculated by
taking price changes for each item in the predetermined basket of goods and averaging them; the goods
are weighted according to their importance. Changes in CPI are used to assess price changes associated
with the cost of living. This report uses the CPI for all urban consumers for the Washington-Baltimore
area (January 1 of each year), not seasonally adjusted.
Full Cost Accounting (FCA) – According to the EPA (EPA530-K-96-001), FCA is an accounting
practice that can help local governments identify and manage the actual costs of municipal solid waste
(MSW) services. It helps decision- makers understand the direct and indirect operating costs of MSW
services, as well as upfront (past) and backend (future) expenses. Through FCA, decision-makers
identify, analyze, and report all monetary costs of resources associated with MSW management
activities.
Generally Accepted Accounting Principles (GAAP)- According to Auditing Standards Board (ASB,
AU Section 411), GAAP is a technical accounting term that encompasses the conventions, rules, and
procedures necessary to define accepted accounting practice at a particular time. It includes not only
broad guidelines of general application, but also detailed practices and procedures. Those conventions,
rules, and procedures provide a standard by which to measure financial presentation.
Capital Assets (fixed assets) – that assets that are used in a productive capacity, which are relatively
long-lived (useful life greater than one year) and provide future benefit that is readily measurable. The
County’s definition includes the above definition plus the cost of the fixed asset must be greater than
$5,000 for years 2002-2010 and $10,000 for year 2011 through 2013.
Depreciation – The periodic charge to income that results from the systematic and rational allocation of
the cost over the life of a capital asset. The County uses the straight-line method of calculating
depreciation (e.g. capital asset costing $50,000 and use live is 5 years, depreciation expense over the
next five years is $10,000 per year.)
Master Authorization – is a contract between the County and other parties, namely bondholders and
long-term contract holders. The MA assures them that appropriate policies and procedures are in place to
insure that there will be sufficient flow of funds to repay bondholders and contract holders for the
duration of the bonds and contracts.
Municipal Solid Waste (MSW) - The Montgomery County Government defines solid waste as:
Garbage (e.g., coffee grounds), Refuse (e.g., wall board, and empty containers), Sludge from a waste
treatment plant, a water supply treatment plant, or an air pollution control facility (e.g., scrubber sludge).
Other discarded material, including solid, semi-solid, liquid, or contained gaseous material resulting
from industrial, commercial, mining, agricultural, and community activities (e.g., boiler slag or fly ash).
A good definition of municipal solid waste is that it includes durable goods, non-durable goods,
containers and packaging, food wastes and yard trimmings, and miscellaneous inorganic wastes.

22
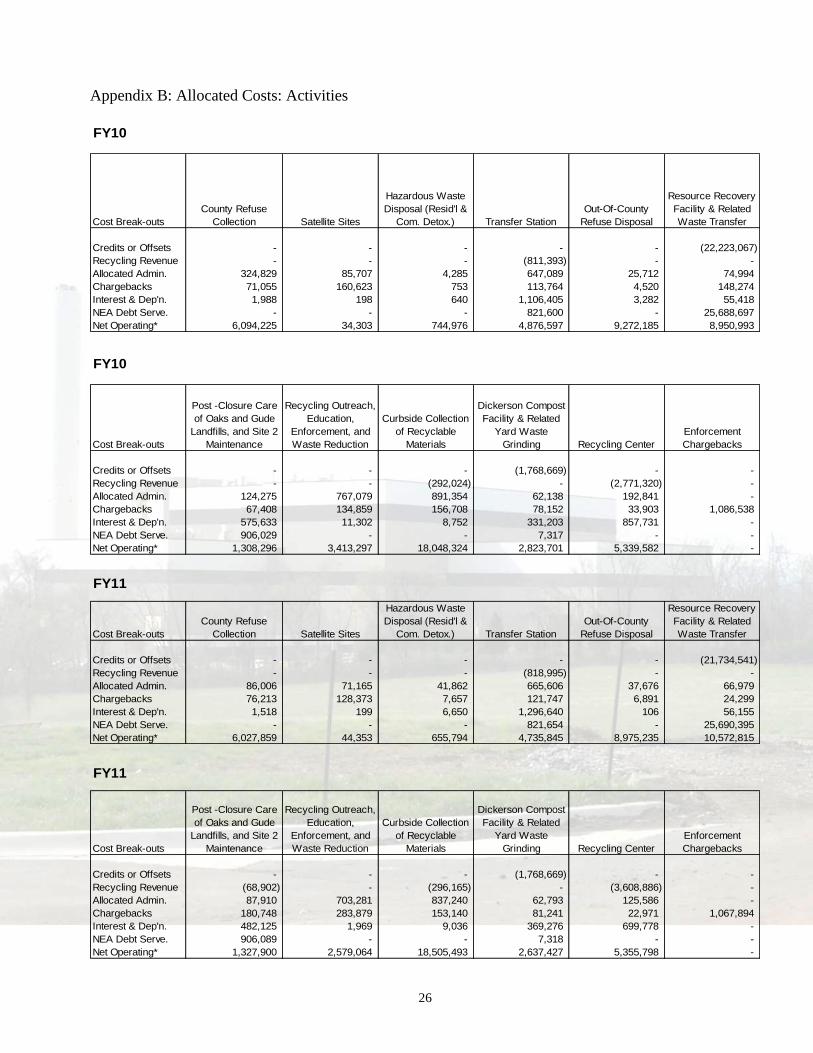
Appendix B - Allocated Costs: Activities
FY02
Cost Break-outs
County Refuse
Collection Satellite Sites
Hazardous Waste
Disposal (Resid'l &
Com. Detox.) Transfer Station
Out-Of-County
Refuse Disposal
Resource Recovery
Facility & Related
Waste Transfer
Credits or Offsets - - - - - (14,849,740)
Recycling Revenue - - - (90,357) - -
Allocated Admin. 213,699 99,062 21,013 222,139 24,015 112,570
Chargebacks 26,111 502,497 835 8,832 955 47,344
Interest & Dep'n. - 342 387 929,751 83 388,787
NEA Debt Serve. - - - 952,703 - 29,787,849
Net Operating* 5,148,201 158,014 554,796 2,415,257 8,640,415 10,830,158
FY02
Cost Break-outs
Post -Closure Care
of Oaks and Gude
Landfills, and Site 2
Maintenance
Recycling Outreach,
Education,
Enforcement, and
Waste Reduction
Curbside Collection
of Recyclable
Materials
Dickerson Compost
Facility & Related
Yard Waste
Grinding Recycling Center
Enforcement
Chargebacks
Credits or Offsets - - - (1,003,243) - -
Recycling Revenue (89,341) - (28,918) - (1,150,273) -
Allocated Admin. 51,032 337,711 484,803 52,533 156,097 -
Chargebacks 174,196 116,317 19,275 115,096 6,206 794,103
Interest & Dep'n. 1,618,079 6,560 8,326 937,882 1,066,020 -
NEA Debt Serve. 1,050,605 - - 8,485 - -
Net Operating* 1,293,735 2,094,647 9,906,952 1,094,164 3,821,237 -
FY03
Cost Break-outs
County Refuse
Collection Satellite Sites
Hazardous Waste
Disposal (Resid'l &
Com. Detox.) Transfer Station
Out-Of-County
Refuse Disposal
Resource Recovery
Facility & Related
Waste Transfer
Credits or Offsets - - - - - (15,704,497)
Recycling Revenue - - - (129,219) - -
Allocated Admin. 229,568 82,627 15,023 185,285 - 100,154
Chargebacks 30,536 334,967 811 10,004 - 54,502
Interest & Dep'n. 3,963 138 639 888,193 33 393,073
NEA Debt Serve. - - - 892,523 - 27,906,206
Net Operating* 5,245,739 173,179 463,200 2,607,360 8,765,849 11,848,735
FY03
Cost Break-outs
Post -Closure Care
of Oaks and Gude
Landfills, and Site 2
Maintenance
Recycling Outreach,
Education,
Enforcement, and
Waste Reduction
Curbside Collection
of Recyclable
Materials
Dickerson Compost
Facility & Related
Yard Waste
Grinding Recycling Center
Enforcement
Chargebacks
Credits or Offsets - - - (1,272,245) - -
Recycling Revenue (50,834) - (41,470) (1,725) (1,061,489) -
Allocated Admin. 72,612 320,492 430,662 45,069 130,200 -
Chargebacks 171,159 113,151 23,252 127,329 7,030 835,080
Interest & Dep'n. 1,586,593 535 11,522 642,100 1,414,028 -
NEA Debt Serve. 984,240 - - 7,949 - -
Net Operating* 705,703 2,108,103 10,628,425 1,258,774 4,229,785 -

23
Appendix B – Allocated Costs: Activities
FY04
Cost Break-outs
County Refuse
Collection Satellite Sites
Hazardous Waste
Disposal (Resid'l &
Com. Detox.) Transfer Station
Out-Of-County
Refuse Disposal
Resource Recovery
Facility & Related
Waste Transfer
Credits or Offsets - - - - - (18,087,604)
Recycling Revenue - - - (216,693) - -
Allocated Admin. 275,878 101,829 18,514 234,516 24,686 123,429
Chargebacks 27,815 430,940 555 7,026 740 42,054
Interest & Dep'n. 5,272 143 662 1,114,686 35 407,268
NEA Debt Serve. - - - 888,750 - 27,788,240
Net Operating* 5,190,204 208,056 545,095 3,496,750 11,994,861 12,864,248
FY04
Cost Break-outs
Post -Closure Care
of Oaks and Gude
Landfills, and Site 2
Maintenance
Recycling Outreach,
Education,
Enforcement, and
Waste Reduction
Curbside Collection
of Recyclable
Materials
Dickerson Compost
Facility & Related
Yard Waste
Grinding Recycling Center
Enforcement
Chargebacks
Credits or Offsets - - - (944,061) - -
Recycling Revenue 5,000 - (76,566) - (2,281,016) -
Allocated Admin. 64,800 394,974 580,118 55,543 160,458 -
Chargebacks 203,658 88,138 17,381 132,340 4,808 892,737
Interest & Dep'n. 973,381 554 11,938 803,610 1,327,454 -
NEA Debt Serve. 980,079 - - 7,915 - -
Net Operating* 659,222 1,874,172 13,300,721 2,267,680 4,138,235 -
FY05
Cost Break-outs
County Refuse
Collection Satellite Sites
Hazardous Waste
Disposal (Resid'l &
Com. Detox.) Transfer Station
Out-Of-County
Refuse Disposal
Resource Recovery
Facility & Related
Waste Transfer
Credits or Offsets - - - - - (15,693,238)
Recycling Revenue - - - (287,021) - -
Allocated Admin. 273,460 106,840 20,033 247,068 20,033 136,889
Chargebacks 38,960 365,721 872 21,209 872 40,946
Interest & Dep'n. 5,272 96 643 692,081 18 401,873
NEA Debt Serve. - - - 889,571 - 27,813,922
Net Operating* 5,142,897 220,019 844,082 3,381,329 13,839,485 10,926,915
FY05
Cost Break-outs
Post -Closure Care
of Oaks and Gude
Landfills, and Site 2
Maintenance
Recycling Outreach,
Education,
Enforcement, and
Waste Reduction
Curbside Collection
of Recyclable
Materials
Dickerson Compost
Facility & Related
Yard Waste
Grinding Recycling Center
Enforcement
Chargebacks
Credits or Offsets - - - (1,143,239) - -
Recycling Revenue - - (103,898) - (3,146,213) -
Allocated Admin. 73,453 500,814 694,461 60,098 170,277 -
Chargebacks 172,482 96,341 30,218 159,962 7,409 886,249
Interest & Dep'n. 935,842 4,420 7,692 672,744 1,117,692 -
NEA Debt Serve. 980,985 - - 7,922 - -
Net Operating* 1,130,589 1,796,349 18,639,532 2,215,000 4,269,382 -

24
Appendix B – Allocated Costs: Activities
FY06
Cost Break-outs
County Refuse
Collection Satellite Sites
Hazardous Waste
Disposal (Resid'l &
Com. Detox.) Transfer Station
Out-Of-County
Refuse Disposal
Resource Recovery
Facility & Related
Waste Transfer
Credits or Offsets - - - - - (18,296,223)
Recycling Revenue - - - (670,018) - -
Allocated Admin. 334,194 95,859 19,172 268,406 - 137,399
Chargebacks 25,895 475,648 762 10,669 - 37,199
Interest & Dep'n. 4,617 266 684 645,308 - 425,917
NEA Debt Serve. - - - 889,542 - 27,813,008
Net Operating* 5,140,186 198,181 899,789 3,311,792 11,297,432 10,992,790
FY06
Cost Break-outs
Post -Closure Care
of Oaks and Gude
Landfills, and Site 2
Maintenance
Recycling Outreach,
Education,
Enforcement, and
Waste Reduction
Curbside Collection
of Recyclable
Materials
Dickerson Compost
Facility & Related
Yard Waste
Grinding Recycling Center
Enforcement
Chargebacks
Credits or Offsets - - - (1,155,970) - -
Recycling Revenue (13,995) - (246,494) - (2,823,911) -
Allocated Admin. 92,664 504,860 594,328 73,492 150,180 -
Chargebacks 186,718 77,077 23,624 155,570 5,969 808,931
Interest & Dep'n. 951,125 15,849 19,565 651,283 1,113,994 -
NEA Debt Serve. 980,953 - - 7,922 - -
Net Operating* 1,561,727 1,954,766 15,424,267 2,410,709 4,659,859 -
FY07
Cost Break-outs
County Refuse
Collection Satellite Sites
Hazardous Waste
Disposal (Resid'l &
Com. Detox.) Transfer Station
Out-Of-County
Refuse Disposal
Resource Recovery
Facility & Related
Waste Transfer
Credits or Offsets - - - - - (20,224,264)
Recycling Revenue - - - (926,442) - -
Allocated Admin. 316,818 109,920 21,275 471,592 21,275 118,784
Chargebacks 22,440 467,483 417 174,590 417 9,565
Interest & Dep'n. 1,988 536 736 620,426 104 60,711
NEA Debt Serve. - - - 889,500 - 27,811,697
Net Operating* 5,333,815 125,877 882,101 3,289,133 11,673,223 8,686,087
FY07
Cost Break-outs
Post -Closure Care
of Oaks and Gude
Landfills, and Site 2
Maintenance
Recycling Outreach,
Education,
Enforcement, and
Waste Reduction
Curbside Collection
of Recyclable
Materials
Dickerson Compost
Facility & Related
Yard Waste
Grinding Recycling Center
Enforcement
Chargebacks
Credits or Offsets - - - (1,051,636) - -
Recycling Revenue - - (340,356) - (3,382,419) -
Allocated Admin. 70,916 602,786 716,252 72,689 148,924 -
Chargebacks 123,516 16,659 14,026 132,686 2,916 843,999
Interest & Dep'n. 882,867 12,939 16,013 484,810 1,091,590 -
NEA Debt Serve. 980,907 - - 7,922 - -
Net Operating* 4,670,416 3,792,207 16,064,519 2,423,456 4,888,230 -

25
Appendix B – Allocated Costs: Activities
FY08
Cost Break-outs
County Refuse
Collection Satellite Sites
Hazardous Waste
Disposal (Resid'l &
Com. Detox.) Transfer Station
Out-Of-County
Refuse Disposal
Resource Recovery
Facility & Related
Waste Transfer
Credits or Offsets - - - - - (31,471,394)
Recycling Revenue - - - (956,515) - -
Allocated Admin. 418,657 139,394 26,979 598,045 26,979 150,635
Chargebacks 72,949 303,934 4,115 91,222 4,115 54,424
Interest & Dep'n. 1,988 474 4,933 999,838 667 61,568
NEA Debt Serve. - - - 989,625 - 30,942,266
Net Operating* 5,974,928 110,797 1,012,024 4,349,359 11,174,096 (759,049)
6,468,522 554,599 1,048,051 6,071,575 11,205,858 30,449,844
FY08
Cost Break-outs
Post -Closure Care
of Oaks and Gude
Landfills, and Site 2
Maintenance
Recycling Outreach,
Education,
Enforcement, and
Waste Reduction
Curbside Collection
of Recyclable
Materials
Dickerson Compost
Facility & Related
Yard Waste
Grinding Recycling Center
Enforcement
Chargebacks
Credits or Offsets - - - (1,164,954) - -
Recycling Revenue - - (347,246) - (3,833,226) -
Allocated Admin. 89,932 764,419 908,310 92,180 188,856 -
Chargebacks 339,673 116,600 287,691 14,061 28,807 1,044,701
Interest & Dep'n. 771,264 12,400 7,915 441,041 839,252 -
NEA Debt Serve. 1,091,320 - - 8,813 - -
Net Operating* 1,065,662 3,340,617 17,439,691 2,836,078 5,215,495 -
FY09
Cost Break-outs
County Refuse
Collection Satellite Sites
Hazardous Waste
Disposal (Resid'l &
Com. Detox.) Transfer Station
Out-Of-County
Refuse Disposal
Resource Recovery
Facility & Related
Waste Transfer
Credits or Offsets - - - - - (23,922,229)
Recycling Revenue - - - (825,775) - -
Allocated Admin. 374,769 144,177 27,905 655,773 27,905 134,875
Chargebacks 71,304 261,283 4,264 100,194 4,264 31,357
Interest & Dep'n. 1,988 301 6,595 864,875 58 55,526
NEA Debt Serve. - - - 733,323 - 22,928,560
Net Operating* 6,016,250 37,121 765,270 4,237,674 9,252,205 6,708,462
FY09
Cost Break-outs
Post -Closure Care
of Oaks and Gude
Landfills, and Site 2
Maintenance
Recycling Outreach,
Education,
Enforcement, and
Waste Reduction
Curbside Collection
of Recyclable
Materials
Dickerson Compost
Facility & Related
Yard Waste
Grinding Recycling Center
Enforcement
Chargebacks
Credits or Offsets - - - (1,134,836) - -
Recycling Revenue - - (299,688) - (2,621,491) -
Allocated Admin. 97,668 827,855 976,682 88,367 195,336 -
Chargebacks 213,209 126,486 149,225 103,576 29,845 1,058,422
Interest & Dep'n. 696,557 11,261 34,908 375,792 1,094,129 -
NEA Debt Serve. 808,680 - - 6,531 - -
Net Operating* 2,640,444 3,845,316 18,083,830 2,803,953 5,191,420 -
26
Appendix B: Allocated Costs: Activities
FY10
Cost Break-outs
County Refuse
Collection Satellite Sites
Hazardous Waste
Disposal (Resid'l &
Com. Detox.) Transfer Station
Out-Of-County
Refuse Disposal
Resource Recovery
Facility & Related
Waste Transfer
Credits or Offsets - - - - - (22,223,067)
Recycling Revenue - - - (811,393) - -
Allocated Admin. 324,829 85,707 4,285 647,089 25,712 74,994
Chargebacks 71,055 160,623 753 113,764 4,520 148,274
Interest & Dep'n. 1,988 198 640 1,106,405 3,282 55,418
NEA Debt Serve. - - - 821,600 - 25,688,697
Net Operating* 6,094,225 34,303 744,976 4,876,597 9,272,185 8,950,993
FY10
Cost Break-outs
Post -Closure Care
of Oaks and Gude
Landfills, and Site 2
Maintenance
Recycling Outreach,
Education,
Enforcement, and
Waste Reduction
Curbside Collection
of Recyclable
Materials
Dickerson Compost
Facility & Related
Yard Waste
Grinding Recycling Center
Enforcement
Chargebacks
Credits or Offsets - - - (1,768,669) - -
Recycling Revenue - - (292,024) - (2,771,320) -
Allocated Admin. 124,275 767,079 891,354 62,138 192,841 -
Chargebacks 67,408 134,859 156,708 78,152 33,903 1,086,538
Interest & Dep'n. 575,633 11,302 8,752 331,203 857,731 -
NEA Debt Serve. 906,029 - - 7,317 - -
Net Operating* 1,308,296 3,413,297 18,048,324 2,823,701 5,339,582 -
FY11
Cost Break-outs
County Refuse
Collection Satellite Sites
Hazardous Waste
Disposal (Resid'l &
Com. Detox.) Transfer Station
Out-Of-County
Refuse Disposal
Resource Recovery
Facility & Related
Waste Transfer
Credits or Offsets - - - - - (21,734,541)
Recycling Revenue - - - (818,995) - -
Allocated Admin. 86,006 71,165 41,862 665,606 37,676 66,979
Chargebacks 76,213 128,373 7,657 121,747 6,891 24,299
Interest & Dep'n. 1,518 199 6,650 1,296,640 106 56,155
NEA Debt Serve. - - - 821,654 - 25,690,395
Net Operating* 6,027,859 44,353 655,794 4,735,845 8,975,235 10,572,815
FY11
Cost Break-outs
Post -Closure Care
of Oaks and Gude
Landfills, and Site 2
Maintenance
Recycling Outreach,
Education,
Enforcement, and
Waste Reduction
Curbside Collection
of Recyclable
Materials
Dickerson Compost
Facility & Related
Yard Waste
Grinding Recycling Center
Enforcement
Chargebacks
Credits or Offsets - - - (1,768,669) - -
Recycling Revenue (68,902) - (296,165) - (3,608,886) -
Allocated Admin. 87,910 703,281 837,240 62,793 125,586 -
Chargebacks 180,748 283,879 153,140 81,241 22,971 1,067,894
Interest & Dep'n. 482,125 1,969 9,036 369,276 699,778 -
NEA Debt Serve. 906,089 - - 7,318 - -
Net Operating* 1,327,900 2,579,064 18,505,493 2,637,427 5,355,798 -
27
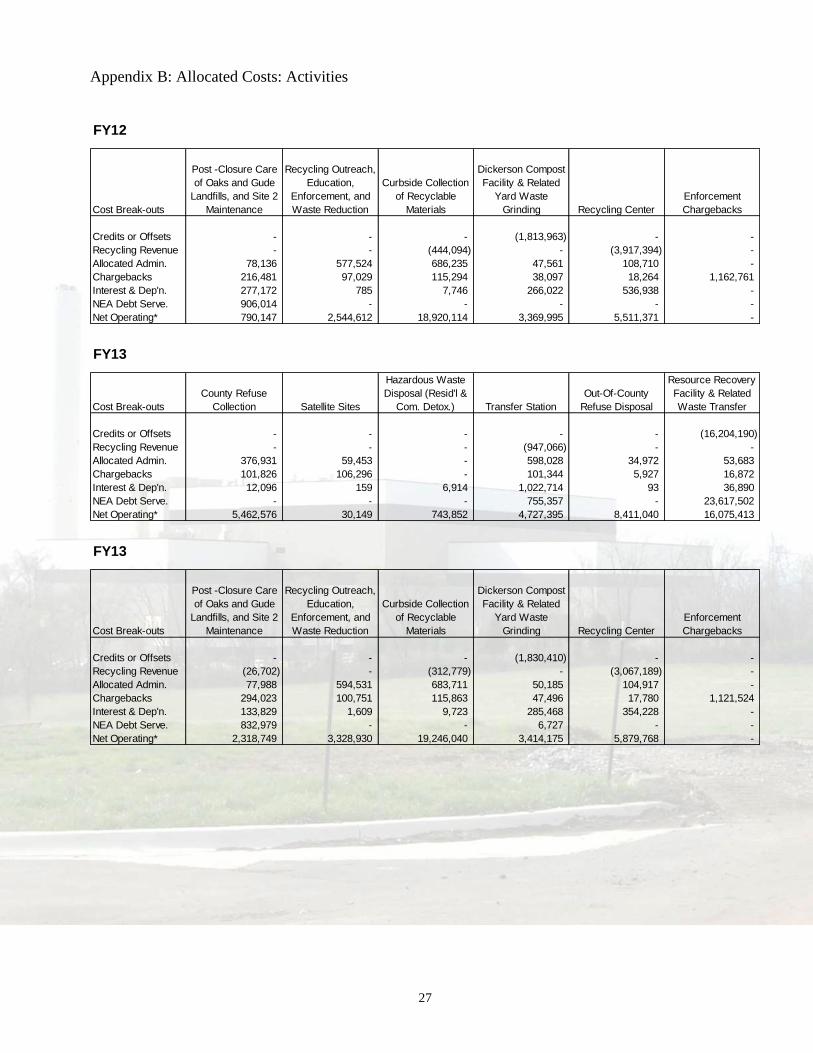
Appendix B: Allocated Costs: Activities
FY12
Cost Break-outs
Post -Closure Care
of Oaks and Gude
Landfills, and Site 2
Maintenance
Recycling Outreach,
Education,
Enforcement, and
Waste Reduction
Curbside Collection
of Recyclable
Materials
Dickerson Compost
Facility & Related
Yard Waste
Grinding Recycling Center
Enforcement
Chargebacks
Credits or Offsets - - - (1,813,963) - -
Recycling Revenue - - (444,094) - (3,917,394) -
Allocated Admin. 78,136 577,524 686,235 47,561 108,710 -
Chargebacks 216,481 97,029 115,294 38,097 18,264 1,162,761
Interest & Dep'n. 277,172 785 7,746 266,022 536,938 -
NEA Debt Serve. 906,014 - - - - -
Net Operating* 790,147 2,544,612 18,920,114 3,369,995 5,511,371 -
FY13
Cost Break-outs
County Refuse
Collection Satellite Sites
Hazardous Waste
Disposal (Resid'l &
Com. Detox.) Transfer Station
Out-Of-County
Refuse Disposal
Resource Recovery
Facility & Related
Waste Transfer
Credits or Offsets - - - - - (16,204,190)
Recycling Revenue - - - (947,066) - -
Allocated Admin. 376,931 59,453 - 598,028 34,972 53,683
Chargebacks 101,826 106,296 - 101,344 5,927 16,872
Interest & Dep'n. 12,096 159 6,914 1,022,714 93 36,890
NEA Debt Serve. - - - 755,357 - 23,617,502
Net Operating* 5,462,576 30,149 743,852 4,727,395 8,411,040 16,075,413
FY13
Cost Break-outs
Post -Closure Care
of Oaks and Gude
Landfills, and Site 2
Maintenance
Recycling Outreach,
Education,
Enforcement, and
Waste Reduction
Curbside Collection
of Recyclable
Materials
Dickerson Compost
Facility & Related
Yard Waste
Grinding Recycling Center
Enforcement
Chargebacks
Credits or Offsets - - - (1,830,410) - -
Recycling Revenue (26,702) - (312,779) - (3,067,189) -
Allocated Admin. 77,988 594,531 683,711 50,185 104,917 -
Chargebacks 294,023 100,751 115,863 47,496 17,780 1,121,524
Interest & Dep'n. 133,829 1,609 9,723 285,468 354,228 -
NEA Debt Serve. 832,979 - - 6,727 - -
Net Operating* 2,318,749 3,328,930 19,246,040 3,414,175 5,879,768 -
28
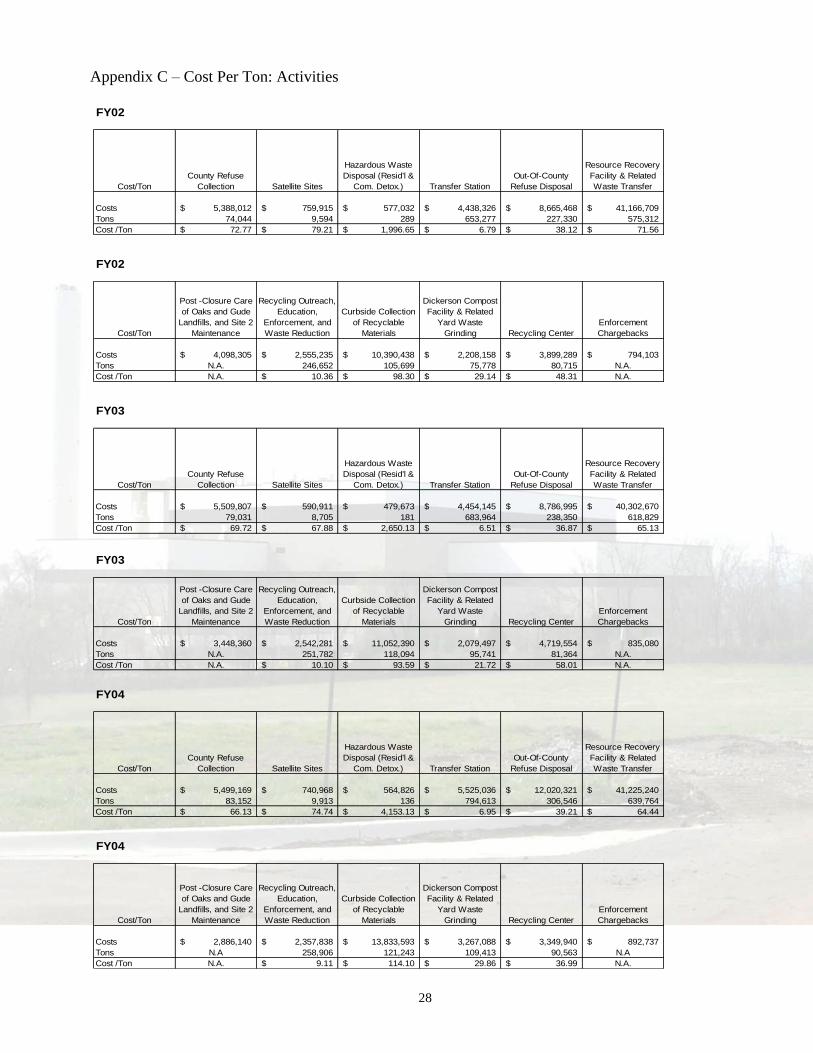
Appendix C – Cost Per Ton: Activities
FY02
Cost/Ton
County Refuse
Collection Satellite Sites
Hazardous Waste
Disposal (Resid'l &
Com. Detox.) Transfer Station
Out-Of-County
Refuse Disposal
Resource Recovery
Facility & Related
Waste Transfer
Costs 5,388,012$ 759,915$ 577,032$ 4,438,326$ 8,665,468$ 41,166,709$
Tons 74,044 9,594 289 653,277 227,330 575,312
Cost /Ton 72.77$ 79.21$ 1,996.65$ 6.79$ 38.12$ 71.56$
FY02
Cost/Ton
Post -Closure Care
of Oaks and Gude
Landfills, and Site 2
Maintenance
Recycling Outreach,
Education,
Enforcement, and
Waste Reduction
Curbside Collection
of Recyclable
Materials
Dickerson Compost
Facility & Related
Yard Waste
Grinding Recycling Center
Enforcement
Chargebacks
Costs 4,098,305$ 2,555,235$ 10,390,438$ 2,208,158$ 3,899,289$ 794,103$
Tons N.A. 246,652 105,699 75,778 80,715 N.A.
Cost /Ton N.A. 10.36$ 98.30$ 29.14$ 48.31$ N.A.
FY03
Cost/Ton
County Refuse
Collection Satellite Sites
Hazardous Waste
Disposal (Resid'l &
Com. Detox.) Transfer Station
Out-Of-County
Refuse Disposal
Resource Recovery
Facility & Related
Waste Transfer
Costs 5,509,807$ 590,911$ 479,673$ 4,454,145$ 8,786,995$ 40,302,670$
Tons 79,031 8,705 181 683,964 238,350 618,829
Cost /Ton 69.72$ 67.88$ 2,650.13$ 6.51$ 36.87$ 65.13$
FY03
Cost/Ton
Post -Closure Care
of Oaks and Gude
Landfills, and Site 2
Maintenance
Recycling Outreach,
Education,
Enforcement, and
Waste Reduction
Curbside Collection
of Recyclable
Materials
Dickerson Compost
Facility & Related
Yard Waste
Grinding Recycling Center
Enforcement
Chargebacks
Costs 3,448,360$ 2,542,281$ 11,052,390$ 2,079,497$ 4,719,554$ 835,080$
Tons N.A. 251,782 118,094 95,741 81,364 N.A.
Cost /Ton N.A. 10.10$ 93.59$ 21.72$ 58.01$ N.A.
FY04
Cost/Ton
County Refuse
Collection Satellite Sites
Hazardous Waste
Disposal (Resid'l &
Com. Detox.) Transfer Station
Out-Of-County
Refuse Disposal
Resource Recovery
Facility & Related
Waste Transfer
Costs 5,499,169$ 740,968$ 564,826$ 5,525,036$ 12,020,321$ 41,225,240$
Tons 83,152 9,913 136 794,613 306,546 639,764
Cost /Ton 66.13$ 74.74$ 4,153.13$ 6.95$ 39.21$ 64.44$
FY04
Cost/Ton
Post -Closure Care
of Oaks and Gude
Landfills, and Site 2
Maintenance
Recycling Outreach,
Education,
Enforcement, and
Waste Reduction
Curbside Collection
of Recyclable
Materials
Dickerson Compost
Facility & Related
Yard Waste
Grinding Recycling Center
Enforcement
Chargebacks
Costs 2,886,140$ 2,357,838$ 13,833,593$ 3,267,088$ 3,349,940$ 892,737$
Tons N.A 258,906 121,243 109,413 90,563 N.A
Cost /Ton N.A. 9.11$ 114.10$ 29.86$ 36.99$ N.A.

29
Appendix C – Cost Per Ton: Activities
FY05
Cost/Ton
County Refuse
Collection Satellite Sites
Hazardous Waste
Disposal (Resid'l &
Com. Detox.) Transfer Station
Out-Of-County
Refuse Disposal
Resource Recovery
Facility & Related
Waste Transfer
Costs 5,460,589$ 692,676$ 865,629$ 4,944,237$ 13,860,407$ 39,320,545$
Tons 80,730 8,048 371 726,676 126,112 572,441
Cost /Ton 67.64$ 86.06$ 2,333.23$ 6.80$ 109.91$ 68.69$
FY05
Cost/Ton
Post -Closure Care
of Oaks and Gude
Landfills, and Site 2
Maintenance
Recycling Outreach,
Education,
Enforcement, and
Waste Reduction
Curbside Collection
of Recyclable
Materials
Dickerson Compost
Facility & Related
Yard Waste
Grinding Recycling Center
Enforcement
Chargebacks
Costs 3,293,351$ 2,397,924$ 19,268,005$ 3,115,726$ 2,418,546$ 886,249$
Tons N.A. 314,576 123,599 92,420 96,534 N.A.
Cost /Ton N.A. 7.62$ 155.89$ 33.71$ 25.05$ N.A.
FY06
Cost/Ton
County Refuse
Collection Satellite Sites
Hazardous Waste
Disposal (Resid'l &
Com. Detox.) Transfer Station
Out-Of-County
Refuse Disposal
Resource Recovery
Facility & Related
Waste Transfer
Costs 5,504,892$ 769,955$ 920,407$ 4,455,699$ 11,297,432$ 39,406,312$
Tons 76,378 6,594 163 743,224 291,273 625,782
Cost /Ton 72.07$ 116.77$ 5,640.79$ 6.00$ 38.79$ 62.97$
FY06
Cost/Ton
Post -Closure Care
of Oaks and Gude
Landfills, and Site 2
Maintenance
Recycling Outreach,
Education,
Enforcement, and
Waste Reduction
Curbside Collection
of Recyclable
Materials
Dickerson Compost
Facility & Related
Yard Waste
Grinding Recycling Center
Enforcement
Chargebacks
Costs 3,759,193$ 2,552,552$ 15,815,290$ 3,298,977$ 3,106,091$ 808,931$
Tons N.A. 302,465 127,701 102,628 101,466 N.A.
Cost /Ton N.A. 8.44$ 123.85$ 32.14$ 30.61$ N.A.
FY07
Cost/Ton
County Refuse
Collection Satellite Sites
Hazardous Waste
Disposal (Resid'l &
Com. Detox.) Transfer Station
Out-Of-County
Refuse Disposal
Resource Recovery
Facility & Related
Waste Transfer
Costs 5,675,061$ 703,816$ 904,529$ 4,518,798$ 11,695,019$ 36,686,843$
Tons 74,213 3,229 174 720,607 271,593 593,185
Cost /Ton 76.47$ 217.96$ 5,193.37$ 6.27$ 43.06$ 61.85$
FY07
Cost/Ton
Post -Closure Care
of Oaks and Gude
Landfills, and Site 2
Maintenance
Recycling Outreach,
Education,
Enforcement, and
Waste Reduction
Curbside Collection
of Recyclable
Materials
Dickerson Compost
Facility & Related
Yard Waste
Grinding Recycling Center
Enforcement
Chargebacks
Costs 6,728,621$ 4,424,592$ 16,470,455$ 3,121,563$ 2,749,241$ 843,999$
Tons N.A. 314,514 109,024 98,938 101,381 N.A.
Cost /Ton N.A. 14.07$ 151.07$ 31.55$ 27.12$ N.A.
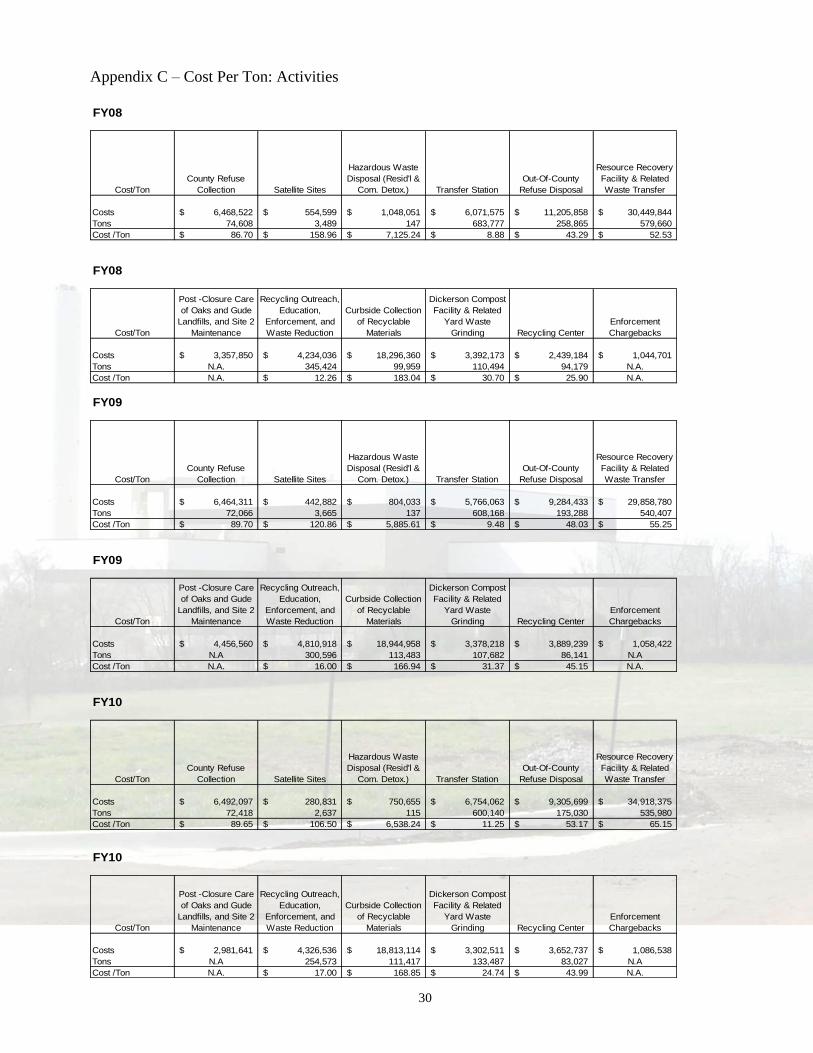
30
Appendix C – Cost Per Ton: Activities
FY08
Cost/Ton
County Refuse
Collection Satellite Sites
Hazardous Waste
Disposal (Resid'l &
Com. Detox.) Transfer Station
Out-Of-County
Refuse Disposal
Resource Recovery
Facility & Related
Waste Transfer
Costs 6,468,522$ 554,599$ 1,048,051$ 6,071,575$ 11,205,858$ 30,449,844$
Tons 74,608 3,489 147 683,777 258,865 579,660
Cost /Ton 86.70$ 158.96$ 7,125.24$ 8.88$ 43.29$ 52.53$
FY08
Cost/Ton
Post -Closure Care
of Oaks and Gude
Landfills, and Site 2
Maintenance
Recycling Outreach,
Education,
Enforcement, and
Waste Reduction
Curbside Collection
of Recyclable
Materials
Dickerson Compost
Facility & Related
Yard Waste
Grinding Recycling Center
Enforcement
Chargebacks
Costs 3,357,850$ 4,234,036$ 18,296,360$ 3,392,173$ 2,439,184$ 1,044,701$
Tons N.A. 345,424 99,959 110,494 94,179 N.A.
Cost /Ton N.A. 12.26$ 183.04$ 30.70$ 25.90$ N.A.
FY09
Cost/Ton
County Refuse
Collection Satellite Sites
Hazardous Waste
Disposal (Resid'l &
Com. Detox.) Transfer Station
Out-Of-County
Refuse Disposal
Resource Recovery
Facility & Related
Waste Transfer
Costs 6,464,311$ 442,882$ 804,033$ 5,766,063$ 9,284,433$ 29,858,780$
Tons 72,066 3,665 137 608,168 193,288 540,407
Cost /Ton 89.70$ 120.86$ 5,885.61$ 9.48$ 48.03$ 55.25$
FY09
Cost/Ton
Post -Closure Care
of Oaks and Gude
Landfills, and Site 2
Maintenance
Recycling Outreach,
Education,
Enforcement, and
Waste Reduction
Curbside Collection
of Recyclable
Materials
Dickerson Compost
Facility & Related
Yard Waste
Grinding Recycling Center
Enforcement
Chargebacks
Costs 4,456,560$ 4,810,918$ 18,944,958$ 3,378,218$ 3,889,239$ 1,058,422$
Tons N.A 300,596 113,483 107,682 86,141 N.A
Cost /Ton N.A. 16.00$ 166.94$ 31.37$ 45.15$ N.A.
FY10
Cost/Ton
County Refuse
Collection Satellite Sites
Hazardous Waste
Disposal (Resid'l &
Com. Detox.) Transfer Station
Out-Of-County
Refuse Disposal
Resource Recovery
Facility & Related
Waste Transfer
Costs 6,492,097$ 280,831$ 750,655$ 6,754,062$ 9,305,699$ 34,918,375$
Tons 72,418 2,637 115 600,140 175,030 535,980
Cost /Ton 89.65$ 106.50$ 6,538.24$ 11.25$ 53.17$ 65.15$
FY10
Cost/Ton
Post -Closure Care
of Oaks and Gude
Landfills, and Site 2
Maintenance
Recycling Outreach,
Education,
Enforcement, and
Waste Reduction
Curbside Collection
of Recyclable
Materials
Dickerson Compost
Facility & Related
Yard Waste
Grinding Recycling Center
Enforcement
Chargebacks
Costs 2,981,641$ 4,326,536$ 18,813,114$ 3,302,511$ 3,652,737$ 1,086,538$
Tons N.A 254,573 111,417 133,487 83,027 N.A
Cost /Ton N.A. 17.00$ 168.85$ 24.74$ 43.99$ N.A.

31
Appendix C – Cost Per Ton: Activities
FY11
Cost/Ton
County Refuse
Collection Satellite Sites
Hazardous Waste
Disposal (Resid'l &
Com. Detox.) Transfer Station
Out-Of-County
Refuse Disposal
Resource Recovery
Facility & Related
Waste Transfer
Costs 6,191,596$ 244,091$ 711,963$ 6,822,498$ 9,019,907$ 36,410,644$
Tons 67,905 2,424 144 617,821 171,021 565,439
Cost /Ton 91.18$ 100.69$ 4,957.96$ 11.04$ 52.74$ 64.39$
FY11
Cost/Ton
Post -Closure Care
of Oaks and Gude
Landfills, and Site 2
Maintenance
Recycling Outreach,
Education,
Enforcement, and
Waste Reduction
Curbside Collection
of Recyclable
Materials
Dickerson Compost
Facility & Related
Yard Waste
Grinding Recycling Center
Enforcement
Chargebacks
Costs 2,915,871$ 3,568,194$ 19,208,744$ 3,158,054$ 2,595,247$ 1,067,894$
Tons N.A. 280,529 116,364 132,220 84,646 N.A.
Cost /Ton N.A. 12.72$ 165.07$ 23.88$ 30.66$ N.A.
FY12
Cost/Ton
County Refuse
Collection Satellite Sites
Hazardous Waste
Disposal (Resid'l &
Com. Detox.) Transfer Station
Out-Of-County
Refuse Disposal
Resource Recovery
Facility & Related
Waste Transfer
Costs 6,136,322$ 198,871$ 672,705$ 6,903,976$ 8,410,995$ 35,239,865$
Tons 73,614 1,848 163 589,234 166,615 540,644
Cost /Ton 83.36$ 107.61$ 4,133.62$ 11.72$ 50.48$ 65.18$
FY12
Cost/Ton
Post -Closure Care
of Oaks and Gude
Landfills, and Site 2
Maintenance
Recycling Outreach,
Education,
Enforcement, and
Waste Reduction
Curbside Collection
of Recyclable
Materials
Dickerson Compost
Facility & Related
Yard Waste
Grinding Recycling Center
Enforcement
Chargebacks
Costs 2,267,950$ 3,219,949$ 19,285,294$ 3,721,675$ 2,257,890$ 1,162,761$
Tons N.A. 266,281 105,097 107,389 82,671 N.A.
Cost /Ton N.A. 12.09$ 183.50$ 34.66$ 27.31$ N.A.
FY13
Cost/Ton
County Refuse
Collection Satellite Sites
Hazardous Waste
Disposal (Resid'l &
Com. Detox.) Transfer Station
Out-Of-County
Refuse Disposal
Resource Recovery
Facility & Related
Waste Transfer
Costs 5,953,428$ 196,057$ 750,766$ 6,257,772$ 8,452,032$ 39,800,359$
Tons 69,568 1,217 189 598,573 156,029 546,664
Cost /Ton 85.58$ 161.12$ 3,974.41$ 10.45$ 54.17$ 72.81$
FY13
Cost/Ton
Post -Closure Care
of Oaks and Gude
Landfills, and Site 2
Maintenance
Recycling Outreach,
Education,
Enforcement, and
Waste Reduction
Curbside Collection
of Recyclable
Materials
Dickerson Compost
Facility & Related
Yard Waste
Grinding Recycling Center
Enforcement
Chargebacks
Costs 3,630,866$ 4,025,821$ 19,742,558$ 3,804,051$ 3,289,504$ 1,121,524$
Tons N.A. 276,326 95,532 97,785 81,123 N.A.
Cost /Ton N.A. 14.57$ 206.66$ 38.90$ 40.55$ N.A.

32
Appendix D – Crosswalk: Disposal Fund Programs to Activities
Resource Post-Closure Care Dickerson Compost
Disposal Fund Programs Hazardous Waste Recovery of Oaks & Gude Recycling Outreach, Curbside Facility & Related
Disposal (Resid'l) Out-Of-County Facility & Related Landfills and Site 2 Education, Enforcement Collection of Yard Waste Recycling Enforcement
Satellite Sites (& Com. Detox.) Transfer Station Refuse Disposal Waste Transfer Maintenance and Waste Reduction Recycle Materials Grinding Center Chargebacks
Solid Waste Administration X X X X X X X X X X
Revenue Analysis and System Evaluation X X X X X X X X X X
Waste System Program Development X X X X X X X X X X
Automation X X X X X X X X X X
Debt Service- Interest Expense (Revenue Bonds) X X X
Multi - Family Recycling X
Commerical Recycling X
Reduction of Yard trim Materials X
Recycling Outreach and Education X
Support For Recycling Volunteers X
Waste Reduction X
Residentail Household Hazardous Waste X
Waste Detoxification - Commerical X
Resource Recovery Facility X
Transfer Station Handling Non-Processible Materials X
Transfer Station Handling of By-Pass Tons X
Maintenance Yard Waste Containers X
Transfer Station: PUF X
Transfer Station: Maintenance X
Transfer Station: Expansion X
Transfer Station: Miscellaneous X
NEA Net Debt Service: WTE at Dickerson X
NEA Net Debt Service: Transportation Compnent X
NEA Net Debt Service: TS Improvements X
NEA Net Debt Service: Oaks Landfill X
NEA Net Debt Service: Yardwaste X
Dickerson Compost Facility X
Dickerson Master Plan X X X
Satellite Drop Off Sites X
Site 2 Landfill X
Oaks Landfill X
Gude Landfill X
Solid Waste Transfer Station X
MRF Operations X
Paper Recycling Operations X
Out of County Haul X
SWD - Residential Recycling Collections X
Regulation of Refuse & Recycling Collect. X X
Charges from County Attorney - Disposal X X X X X X X X X X
Charges from Finance: Property Tax Billing X X X X X X X X X X
Charges from Finance: Financial Statement Prep X X X X X X X X X X
Charges from DEP - Oaks X
Charges from DEP - Gude X
Charges from DFS - Site 2 X
Charges from DEP - Site 2 X
Charges from DPWT - Satellite Sites X
Charges from DHCA Enforcement X
Charges from DEP - Enforcement X
Charges from DEP - Waste Reduction X
Charges from DFS - Compost Facility X
Charges from DEP - RRF X
Charges from DEP - Dickerson Master Plan X X X
Disposal Fund Cost Center
Allocation

33
Appendix E – Crosswalk: Tonnage to Activities
Out-Of- Resource Post Closure Care Recycling Curbside Dickerson
County HHW County Recovery Fac. of Oaks and Gude Outreach, Enforcement Collection Compost Fac. & Enforcement
Refuse Satellite Comm. & Transfer Refuse & Related Landfills and Education & of Recyclable Related Yard Recycling Chargebacks
Stream Name Collection Sites Resid'l Station Disposal Waste Transfer Site 2 Maintenance Waste Reduction Materials Waste Grinding Center
Satellite Sites X
County Refuse Collection (Area) A X
Loaded on Rail to RRF X X X
By Pass Tons X
Ash Landfilled & Recycled X
HHW (resid'l. & Comm.) X
Non-Processibles (not MSW) to Local Users X
Non-Processibles (not MSW) to Out-of-County Landfill X X
MFR Commingles X X X X
MRF Mixed Paper X X X X
Other Recycling at Transfer Station:
Oil, Bat, ATF,CB,Tires,DDD,MAT,WG,TX X X
Yard Trim Delivered to Transfer Station
County Contract Hauler Collected X X
Dropped -Off at PUF "Car Ramp" X
Other YardTrim to Compost Facility X
Residue from Compost Facility (included in tons to RRF) X
Brush: Ground at Transfer Station & Distributed as Mulch X
MSW Tonnages Not Through County Facilities
Yard Waste Source Reduction X
Recycled Via Non-County Facilities X