Annual and large-scale variation of breeding output of ... Guðjónsson.pdf · Apendix ......
49
Annual and large-scale variation of breeding output of Greylag geese (Anser anser) in Iceland Helgi Guðjónsson Faculty of Life and Environmental Sciences University of Iceland 2014
Transcript of Annual and large-scale variation of breeding output of ... Guðjónsson.pdf · Apendix ......

Annual and large-scale variation of breeding output of Greylag geese (Anser
anser) in Iceland
Helgi Guðjónsson
Faculty of Life and Environmental
Sciences
University of Iceland 2014

Annual and large-scale variation of breeding output of Greylag geese (Anser
anser) in Iceland
Helgi Guðjónsson
90 ECTS thesis submitted in partial fulfillment of a Magister Scientiarum degree in Biology
Advisors
Jón Einar Jónsson Tómas Grétar Gunnarsson
External examiner
Arnór Þórir Sigfússon
Faculty of Life and Environmental Sciences School of Engineering and Natural Sciences
University of Iceland Reykjavik, May 2014

Annual and large-scale variation of breeding output of Greylag geese (Anser anser) in
Iceland
Variations of breeding output of Greylag geese in Iceland
90 ECTS thesis submitted in partial fulfillment of a Magister Scientiarum degree in
Biology
Copyright © 2014 Helgi Guðjónsson
All rights reserved
Faculty of Life and Environmental Sciences
School of Engineering and Natural Sciences
University of Iceland
Askja, Sturlugötu 7
107, Reykjavik
Iceland
Telephone: 525 4000
Bibliographic information:
Helgi Guðjónsson, 2014, Annual and large-scale variation of breeding output of Greylag
geese (Anser anser) in Iceland, Master’s thesis, Faculty of Life and Environmental studies,
University of Iceland, pp. 41.
Printing: Háskólaprent
Reykjavik, Iceland, May 2014

Abstract
In this study differences in the breeding output of greylag geese across Iceland were
assessed over two years. The aim was to produce a large-scale comparison of parameters
that relate to breeding output (timing of breeding, reproductive investment and brood sizes)
and identify large-scale variation in these within Iceland and possibly between years.
During the two years of sampling a total of 360 Greylag goose nests were visited across
Iceland and factors relating to breeding output were measured. In addition 888 Greylag
goose pairs were surveyed to estimated large-scale variation in brood sizes. Incubation
phenology varied significantly between parts of the country and started on average on the
30th
of April in West- and South Iceland, but significantly later in North Iceland (10th
of
May) and East Iceland (20th
of May). Clutch size did vary between research areas as East
Iceland had a smaller clutch size than South and West Iceland. Little to no variation was
found in clutch volume between areas and it was independent of year. East Iceland was
found to have the smallest brood size on average while West and North Iceland had the
largest brood sizes. Annual variation was relatively little and when annual means for the
whole country were inspected the only significant difference found was in the mean
number of goslings, where brood size was smaller in 2013. Regional variation in start of
incubation is most likely related to mean temperatures as the south and west parts of the
country have the most temperate climate. It is therefore likely that South and West Iceland,
generally have more favourable breeding conditions. Further potential causes for
differences in breeding output between regions in Iceland are discussed and what
implications this has for a sustainable utilization of the Greylag goose population.

v
Útdráttur
Markmið verkefnisins var að afla gagna um breytileika í varpárangri (varptíma, fjölda
eggja og fjölda uppkominna unga) grágæsa milli mismunandi landshluta og mögulega milli
ára. Þessar upplýsingar gagnast fyrir nýtingu og verndun grágæsastofnsins. Á árunum
2012-2013 voru 360 grágæsahreiður rannsökuð og þættir sem hafa áhrif á varpárangur
mældir. Að auki voru 888 grágæsafjölskyldur taldar til að rannsaka breytileika í ungafjölda
milla landsvæða. Mikill munur var á upphafi varptíma milli landsvæða og byrjaði að
meðaltali 30. apríl á Vesturlandi og Suðurlandi, en hófst mun síðar á Norðurlandi (10. maí)
og seinast á austurlandi (20. maí). Urpt var nokkuð breytileg milli svæða og reyndist minni
urpt á Austurlandi en á Vesturlandi og Suðurlandi. Breytileiki var lítill í rúmmáli urptar
milli landshluta og var það óháð ári. Á Austurlandi voru að meðaltali fæstir unga á par en
ungar á par voru flestir á Vesturlandi og Norðurlandi. Breytileiki í mældum þáttum var
tiltölulega lítill milli ára en þegar heildarmeðaltöl voru skoðuð reyndist aðeins vera
marktækur munur á meðalfjölda unga á par og reyndust þeir vera færri 2013. Líklegt er að
munur milli landshluta og ára tengist hitastigi en skilyrði til varps virtust almennt
hagstæðari á Suðurlandi og Vesturlandi. Breytileiki í æxlunarárangri grágæsa og nýting og
vernd grágæsastofnsins er rædd.

vi
Table of Contents
List of Figures .................................................................................................................... vii
List of Tables ..................................................................................................................... viii
Acknowledgements .............................................................................................................. 1
Introduction ......................................................................................................................... 2 The state of the Greylag goose population ....................................................................... 2 Links between habitat choice and fitness ......................................................................... 4
Nesting ecology & breeding success ................................................................................ 5 The Icelandic Greylag goose ............................................................................................ 7
References............................................................................................................................. 9
Annual and large-scale variation in breeding output of Greylag geese (Anser
anser) in Iceland ............................................................................................................ 14
Abstract .............................................................................................................................. 15
Introduction ....................................................................................................................... 16
Materials & methods ......................................................................................................... 17 Study areas ...................................................................................................................... 17
Nest survey .............................................................................................................. 18 Gosling survey ......................................................................................................... 18
Measures of productivity ................................................................................................ 18 Nest search ............................................................................................................... 18
Gosling surveys ....................................................................................................... 19 Data analysis ................................................................................................................... 19
Results ................................................................................................................................. 19 General variation in productivity .................................................................................... 19 Between area productivity .............................................................................................. 19
Annual variation in productivity ..................................................................................... 20
Discussion ........................................................................................................................... 20
Acknowledgements ............................................................................................................ 23
References........................................................................................................................... 24
Figures ................................................................................................................................ 28
Tables .................................................................................................................................. 31
Apendix ............................................................................................................................... 34

vii
List of Figures
Figure 1. Autumn population size of greylag and pink-footed geese 1960–2012 in
Britain, as recorded by the Wildfowl & Wetlands Trust goose survey.
Annual total counts and 5-year running means are shown for greylag
geese (squares and right y-axis) and pink-footed geese (triangles and left
y-axis) (WWT data 2014). .................................................................................. 2
Figure 1. Location of study areas and nest sampling locations. The elypses show the
areas where surveys of broods were performed. West Iceland (Vertical
symbols), South Iceland (Horizontal symbols), North Iceland (Square
hatching symbols) and East Iceland (Diagonal symbols).The large non
sampled area in the southeast of Iceland is dominated by sparsely
vegetated glacial sand plains. Locations of nests that were sampled are
marked with circles. .......................................................................................... 28
Figure 2. Annual and between area variation in mean (±se) (a) clutch size, (b)
estimated start of incubation, (c) clutch volume, (d) brood size, (e) length
of eggs and (f) width of eggs. White columns indicate values for 2012
and black columns indicate values for 2013. East Iceland lacks data in
b,c,e and f for 2013 and was therefore not included. See Fig 1.for
research area locations and details and Table 1 for n values. ........................... 29
Figure 3. Annual and between area variation in mean temperature (±se) in april for
the two sample years. Meteorological data from closest weather station to
corresponding researh area (Icelandic Met Office, 2014). Names of the
weather stations are given in parentheses. ........................................................ 30

viii
List of Tables
Table 1. Numbers of Greylag goose nests, eggs, pairs with goslings and goslings
monitored in each area in each year of the study. ............................................. 31
Table 2. Results of ANOVA models of annual and between area variation in
components of productivity of Greylag Geese in Iceland, between 2012
and 2013............................................................................................................ 32
Table 3. Results of Welch two sample t-test exploring annual variation in
components of productivity of Greylag Geese in Iceland, between 2012
and 2013, in study areas.................................................................................... 33

1
Acknowledgements
I want to thank everyone that helped me during this study especially my instructors Jón
Einar Jónsson and Tómas Grétar Gunnarsson. Their guidance and relaxed attitude was a
great help during my studies.
I want to thank Árni Ásgeirsson and Sverrir Thorstensen for their help in the field during
sampling and I want to thank Árni’s father, Ásgeir, for transporting us between islands in
Breiðafjörður on his boat. I also want to thank Halldór Walter Stefánsson and Aðalsteinn
Örn Snæþórsson for helping my study by gathering data and allowing me to use it in my
study.
Ríkey Kjartansdóttir and my parents Sigríður Siemsen and Guðjón Haraldsson are thanked
specially for their patience and willingness to listen to me talk about little else than gees
during these two years and for stopping during our travels to allow me to count geese all
over the country.
I would also like to thank my fellow students and friends in Askja who have helped me
retain some form of physical shape with our many Bandy and Frisbee sessions.
Finally I would like to thank Veiðikortasjóður (Hunter’s license fund) for funding this
project.

2
Introduction
The state of the Greylag goose population
Greylag geese are common breeding birds in most areas of the Palearctic but the Icelandic
breeding population winters almost exclusively in Britain and Ireland (Madsen et al. 1999).
There are two large breeding goose populations in Iceland, the Pink-footed goose (Anser
brachyrhynchus) and the Greylag goose (Anser anser). The Greylag goose, greylag from
now on, nests almost exclusively in lowland areas below 200 m above sea level in Iceland,
the pink-footed goose has on the other hand a more aggregated distribution in the
highlands (Mitchel et al. 1999). Since 1982, the trajectory of the two populations has
diverged greatly, so that Pink-footed geese are now almost three times as numerous as
greylags (Figure 1). Greylags have been regularly counted in autumn in Britain since the
early 1950´s and they have increased from 20,000-30,000 birds in the 1950´s to c.a.
100,000 in the early 1990´s. In the later 1990´s both populations stopped increasing and the
greylag population declined until 2000 when the population was estimated at 80,000
individuals, which is about 20% decrease in population size. It is not clear what caused
this, although it is possible that a decrease in temperature is somewhat connected
(Icelandic Meterological Office 2014). Since then both populations have rapidly increase
again and today greylags are estimated at 105,000 while the Pink-footed goose is estimated
at 350,000 individuals (Mitchell et al. 1999; Frederiksen et al. 2004a; WWT data 2014,
Figure 1). Since 2000 there has been a considerable increase in cereal agriculture in
Iceland, which coincides with the increase in both goose populations (Statistics Iceland
2014). It is therefore possible that this change in agricultural practices is connected to the
growth of both goose species.
Figure 1. Autumn population size of greylag and pink-footed geese 1960–2012 in Britain, as recorded by the
Wildfowl & Wetlands Trust goose survey. Annual total counts and 5-year running means are shown for
greylag geese (squares and right y-axis) and pink-footed geese (triangles and left y-axis) (WWT data 2014).
0,000
20,000
40,000
60,000
80,000
100,000
120,000
140,000
0,000
50,000
100,000
150,000
200,000
250,000
300,000
350,000
400,000
1960 1965 1970 1975 1980 1985 1990 1995 2000 2005 2010
Au
tum
n c
ou
nt
Year
3
Both goose populations are common quarry species in Iceland and bag statistics
show that hunters in Iceland shot on average about 40 thousand greylags per year and
about 15 thousand pink-footed geese, in the period 2000-2010 (The Environment Agency
of Iceland 2014). The hunting season for greylags in Iceland is from 20th
of August to 15th
of March (The Environment Agency of Iceland 2014) and is timed so the geese should
have finished moulting and the goslings are able to take flight. Despite of the extensive
hunting the greylag population has been increasing and the Pink-footed goose has
increased drastically in numbers (Mitchell 2013; Frederiksen et al. 2004a). Furthermore, it
is estimated that in Great Britain about 15-20 thousand greylags are hunted every year
(Hart & Harradine 2003). Frederiksen et al. (2004a) has suggested that the population size
of greylags may be underestimated in the census in the winter grounds in Great Britain. It
is also possible that strong density dependence is operating which allows the population to
compensate for the high hunting pressure or that it would be growing in the absence of
hunting (cf. Sutherland 2001). In many long-lived species such as geese, population
changes have primarily been linked to a response to changes in survival rates, with
fecundity playing a minor role (Sæther et al. 1996; Pistorius et al. 2004; Pistorius et al.
2006). The biggest factors causing this are changes in the bird’s habitat or the development
of their habitat (Sutherland 1996).
Recent changes in agricultural policy have led to extensive areas of largely uniform,
intensely managed areas of grassland and cereals. This change has increased the carrying
capacity of the European land mass for grazing birds and while the effect has been
negative for many species the larger terrestrial herbivorous migratory waterbirds, such as
swans and geese, have benefitted from the recent changes in abundance of farmland and
have been increasing in population size the last few decades (Madsen et al 1999; Fox et al.
2005). Many goose populations have become increasingly reliant on cultivated land to feed
upon, especially during the winter months, when geese utilize specially grown and bred
high-quality crops. It is very likely that the conversion of natural habitats to agricultural
land has been the dominant factor in the increase in goose numbers the last 50 years
(Madsen et al. 1999). This increase in goose populations has led to increasing conflicts
with farmers but has also resulted in increased information gathering relating to their
abundance and population size over a long time (Fox et al. 2010). This conflict is not only
present in Iceland, for example extensive research has been done in Scotland on the many
methods used to mitigate damage by goose grazing. These methods are numerous but most
commonly used are (culling, non-lethal scaring, compensation schemes for affected
farmers and the creation of alternative feeding areas), the most effective way has been to
utilize an integrated strategy with input from stakeholders at all levels. The strategy
consists of a combination of top-down and bottom-up management whereby the
government controls which management methods are to be used while groups on the local
level ensure that the methods are tailored to each area (Cope et al. 2006; Tombre et al.
2013). Most of these methods are non-lethal as many populations are protected under the
1979 European Union Birds Directive (Directive 79/409/EEC).
In general, the management of goose-agricultural conflict has been dealt with mostly
at the local level and there is a need for more concentrated effort to ensure success, both
internationally and at the local level. In areas with no management schemes, farmers rely
almost exclusively on scaring to defend their crops. Scaring, though, has been questioned
on ethical grounds even though it is non-lethal and the birds in question are not
endangered. Scaring is both time consuming for farmers and is often less than successful if

4
not coordinated with neighbors (Eythórsson 2004). In some areas the establishment of a
compensation scheme for farmers that are paid not utilize scare tactics has led to a
condition which has benefitted both the agriculture in the region and the wintering goose
population (Cope et al. 2003). This method is not though without its drawbacks as the
question arises whether this means that all goose grazing in agricultural land should be
compensated. This method is also often difficult to employ as few agree from which
governmental budget the compensations come from, who are entitled to it, how much, and
on what grounds. Furthermore, it is both complicated and expensive to accurately measure
grazing damage (Tombre et al. 2013).
Links between habitat choice and fitness
In the arctic and northern temperate regions migratory geese are among the dominant
herbivores (Smith & Odum 1981; Jasmin et al. 2008; Kerbes et al 2009) and geese interact
strongly with anthropogenic interests as they are both an important quarry for hunters and
their increasing utilization of agricultural farmland has led to increasing conflicts with the
agricultural industry. Geese are among the most successful species in utilizing agricultural
development and the increase of cultivated land (Abraham et al. 2005; Fox et al. 2005).
Geese are able to take advantage of both cultivated land and natural wetlands but the
highest food intake rate is usually on cultivated land (Fox et al. 2005; Jónsson & Afton
2006). In cultivated areas, energy density (KJ/g food) is higher and geese have to spend
less time grazing as they would have to in natural habitats (Jónsson & Afton 2006). The
ever constant pressure of creating better crops has successfully created plants with high
protein and energy content as well as high digestibility. In addition, modern sowing
techniques, growth regulators, fertilizers and pesticides have been further managed to
ensure stable food production at ever increasing plant densities. This trend has also highly
benefitted geese by enhancing food intake rate and availability (Fox et al. 2005). In many
instances geese have become so highly dependent on the availability of farmland that they
have changed their habitat preferences from natural wetlands to agricultural fields
(Alerstam & Högsted 1982).
Greylag habitat choice is somewhat different between breeding-, wintering- and
staging grounds. In wintering- and staging grounds greylags mostly take advantage of
farmland and utilize sandbanks of estuaries, rivers, reservoirs and other large bodies of
water for roosting (Owen et al 1986). During the breeding season breeding geese are
mainly found in dwarf-birch bogs, marshes and river plains while non-breeding greylags
are almost exclusively found on farmland (Gunnarsson et al. 2006). In addition greylags
tend to favor areas that have a close proximity to lakes, rivers and wetlands (Gunnarsson et
al. 2006). A few days after the goslings have hatched, greylag families tend to congregate
into larger groups, which is about the same time as the adult become flightless (Madsen et
al. 1999). During this time they are mostly found on farmland with convenient water
sources as escape routes and on natural grasslands close to water. This journey from the
main nesting site is most often performed when the goslings are only a few days old and
the distance traveled can be over 30 km (Mainguy et al. 2006). The quality of the brood
rearing habitat is very important as fledgling survival during autumn migration is often
related to body mass (Owen & Black 2002). It is also very beneficial for the geese to nest
close to high quality brood rearing areas as goslings that do not have to travel long
distances have been found grow faster (Mainguy et al. 2006).

5
It is energetically expensive to produce eggs and raise goslings and the quantity of
material that is required for egg production is high in relation to body weight (Reed 1973).
Raising the goslings is also not without cost as gosling fitness has been linked to future
adult reproductive value (Nikolai & Sedinger 2012). Goslings and adults have different
nutritional requirements because of body size, as goslings require higher concentration of
nutrients and energy in their diet while adults need a greater biomass (Sedinger 1997). If a
brood rearing habitat is high in food quality but insufficient in biomass it may have an
adverse effect on the energy intake of the adults. Raising of high quality broods may
therefore have a carry-over effect on future adult reproductive value (Inger et al. 2010;
Nikolai & Sedinger 2012).
As the highest quality areas are the most sought after they are subject to heavy
grazing during the breeding season. An increased population size or density of individuals
in feeding areas has been known to cause a decrease in food availability and, consequently,
a decrease in fecundity and/or survival (Williams et al. 1993). As geese are philopatric to
nesting areas and faithful to traditional feeding grounds, it is clear that as a population
grows the grazing of high quality areas will intensify (Cooke et al. 1975; Cooke &
Abraham 1980). The resulting environmental degradation then has an influence on the
energy intake of grazers. As an environment degrades the geese need to feed more
intensely, for a greater period of time and with an increasing rate of pace, still, net resulting
in a declining energy intake rate (Vickery et al. 1995). In heavily grazed areas a correlation
has been found between the degrading environment and declines in various fecundity and
survival parameters, for instance mean clutch size (Cooch et al. 1989), gosling growth rate
(Williams et al. 1993), and first-year (post-fledging) survival (Francis et al. 1992; Sedinger
et al. 1995). In addition, Williams et al. (1993) showed that gosling survival was lower for
those families that frequented heavily grazed areas while those that sought out alternate
feeding areas had broods with higher survival. This density dependence effect is well
known in many animal populations and regulates populations that are increasing in size.
This effect is sometimes exploited in popular quarry species to keep fecundity high while
the population is kept in a stable state with hunting (Sutherland 2001).
Conditions experienced in one season can have a drastic effect on fitness in
subsequent seasons and is known as a carry-over effect, this is particularly evident among
migratory species. As geese are migratory they spend different periods of the year in
geographically distinct places and it is reasonable to assume that habitat occupancy and the
resulting condition of individual birds is likely affected by events in the previous season. In
addition, conditions of individuals and population density of the current season will
influence individuals and populations in subsequent seasons (Norris & Marra 2007). Such
seasonal interaction is not only limited to individuals as it can also interact at the
population level. Interactions on the individual level occur when events and conditions in
one season produce non-lethal, carry-over effects that influence individuals the subsequent
season while interactions on the population level occur when a change in population size in
one season influences recruitment rates the following season (Sutherland 1996; Norris &
Marra 2007).
Nesting ecology & breeding success
Bird populations are very susceptible to environmental changes as breeding success
depends both on food availability and timing of breeding to coincide with climax in food

6
availability. Mortality rates of adult greylags on the winter grounds in Great Britain are
mostly influenced by availability of convenient farmland (Gill et al. 1997; Swann et al.
2005). If the quality of the wintering grounds is sufficient then the energy reserves stored
by geese during spring migration allows them to initiate nesting before food supplies
become abundant (Raveling 1979). Usually geese have the highest body weight and
maximum amount of fat reserves at the start of the breeding season in preparation for
migration, territorial defense and egg production (Ryder 1970; Reed 1973; Raveling 1979).
It has therefore been suggested that for many geese species fat reserves are attained mainly
in the few weeks before migrating north, although their body condition throughout winter
undoubtedly influences the rate at which they obtain fat reserves and their ability to carry it
(Reed 1973). Migratory birds that breed in the high Arctic are limited by a short summer
season. During this time they have to complete breeding, moult, raise young and prepare
for the return journey before winter sets in. For them to succeed, nesting as early as the
snow melts is highly beneficial (Raveling 1979; Madsen et al. 2007). Snow cover in
breeding grounds has been found to heavily affect both timing and reproductive success in
high Arctic breeding geese (Madsen et al. 2007). Despite of this, little connection has been
found between precipitation and reproductive success. On the other hand, more correlation
has been found between spring temperatures in breeding areas and start of incubation
(Summers & Underhill 1987).
Start of incubation is very important to most birds as offspring that hatch sooner in
the spring often have better life expectancy but this is also often connected to food
availability and how mature the offspring are at the time of autumn migration (Poussart et
al. 2000; Prop et al. 2003; Durant et al. 2004; Frederiksen et al. 2004b). It is therefore of
great importance for birds to coincide the hatching of offspring with the climax in food
availability. Geese are among birds that have precocial offspring that are relatively
independent at hatching and the nest is therefore soon abandoned after the offspring have
hatched. It is normal for birds with precocial offspring to hatch eggs synchronously even if
incubation is initiated before the final egg of the clutch has been laid (Hanssen et al. 2002).
One mechanism that birds may use to achieve this is by decreasing egg size after the start
of incubation in an effort to either ensure synchronous hatching or to decrease fitness cost
of late hatching eggs (Gladbach et al. 2010; Hanssen et al. 2002). Another mechanism
proposed is that embryos in late eggs can be stimulated to accelerate development and
hatch in a shorter time than earlier eggs (Hanssen et al., 2002). This decrease in incubation
time of late laid eggs may lead those offspring to be less developed than their siblings, and
offspring from small and late laid eggs have in addition a slower growth rate (Anderson &
Alisauskas 2002; Hanssen et al. 2002).
An early start of incubation is known to be often positively related to fitness in birds
as those individuals that first lay eggs are generally those that are in the best physical
condition, lay the largest clutches and have the best nesting success (Erikstad et al. 1993;
Bêty et al. 2004; Arnold et al. 2004). The number of eggs shows a correlation to the
physical condition of geese and ducks (Ankney & MacInnes 1978; Erikstad et al. 1993;
Öst et al. 2008; Gladbach et al. 2010). Nesting of geese is often synchronized, commonly
up to 90% of nests are initiated within an 8 day period (Lepage, Gauthier & Menu 2000).
Clutch size has been shown to decrease with a later start of nesting in many species of
birds, and the life expectancy of offspring often shows a negative regression to date of
hatching (Lepage et al. 2000; Arnold et.al 2004; Traylor & Alisauskas 2006). The
relationship between the start of incubation and nesting success has in addition been found
7
to be curvilinear as both early and late nests have a higher rate of failure than those that
initiate nesting near the median (Lepage et al. 2000). Age has also been known to influence
reproductive success in birds and a study by Black & Owen (1995) suggested that age at
breeding can have a considerable effect reproductive success. Low reproductive success in
the early years of breeding was attributed to females, which might be due to inexperience
in food and feeding area selection. Low reproductive success in later years of breeding was
on the other hand attributed to males, as their fighting ability declines with age which
influences their ability to attain and defend suitable nesting sites (Black & Owen 1995). A
few studies have also found a strong correlation between lemming abundance and breeding
success of geese, which is consistent with the hypothesis that predators, such as Arctic
Foxes, that usually prey on lemmings switch over to geese and other birds when lemming
numbers are low (Summers & Underhill 1987; Nolet et al. 2013).
As previously discussed, reproductive success is influenced by many things and can
even be influenced by conditions in previous seasons. Species with extended parental care,
for instance geese, are also influenced by parental status as this can affect them later in life
(Lepage et al. 2000; Inger et al. 2010). Goose families are dominant over individuals and
are often able to monopolize the best quality resources, but it has been shown that later in
the non-breeding season adults with families utilize resources of lower quality than non-
breeders, this has been attributed to parents being constrained by the lowered foraging
efficiency of the juveniles (Inger et al. 2010). Adult geese that recently raised juveniles
have also been found to be less likely than expected to breed again in the next breeding
season and it has been suggested that this may be caused by conditions during the non-
breeding period that are carried over into the subsequent season (Inger et al. 2010).
The Icelandic Greylag goose
In Iceland the most likely threat to the greylag habitat are change in land-use patterns in
lowland areas, for instance an increase in commercial afforestation, increasing pressure to
bodies of water (for instance through building of summerhouses and fish farming),
increased traffic due to recreation, and increased amount of farming in the species nesting
habitat (Gunnarsson et al. 2006; Gunnarsson et al. 2008). It is also not foreseen what the
effects of river regulation for electricity production will have in lowland areas of Iceland
but it is well known that such changes can change the animal communities on and along
rivers (Nilsson & Dynesius 1994). It is known that dams have a high impact on the
ecosystems and biodiversity has been known to decrease when the flow of rivers is
regulated (Kingsford & Johnson 1998; Kingsford 2000). It is therefore important to carry
out research to better understand what effect increasing anthropogenic activities will have
on the greylag population. More information is also needed about the nesting ecology of
greylags in Iceland and the factors that influence productivity. The recent study by
Gunnarsson et al. (2008) made a quantitative assessment on nesting habitat choice of
greylags on a country-wide scale (Gunnarsson et.al. 2008). The connection between habitat
choice and breeding success is still unknown but such information would allow
prioritization of habitat conservation by importance to greylags.
To ensure a sustainable utilization of an animal population, the crucial factors that
limit population size must be monitored and a good understanding on demographic rates
must be obtained (Caughley & Sinclair 1994). Recent studies on greylags in Iceland have
shed light on many factors influencing population changes and habitat choice of greylags

8
in Iceland. What we lack are studies on variation in breeding success and output between
parts of the country and an assessment on what areas are most important to the greylag
population. In this study differences in the breeding output of greylag geese across Iceland
were assessed over two years. The aim was to produce a large-scale comparison of
parameters that relate to breeding output (timing of breeding, reproductive investment and
brood sizes) and identify large-scale variation in these within Iceland and between years.

9
References
Alerstam, T. & Högstedt, G. 1982. Bird migration and reproduction in relation to habitats
for survival and breeding. Ornis Scandinavica. 13(1): 25-37.
Ankney, C.D. & MacInnes, C. D. 1978. Nutrient reserves and reproductive performance
of female lesser snow geese. Auk 95: 459-471.
Arnold, J., Hatch, J., & Nisbet, I. 2004. Seasonal declines in reproductive success of the
common tern Sterna hirundo: timing or parental quality? Journal of Avian Biology. 35
(1): 33–45.
Bêty, J., Giroux J.F. & Gauthier, G. 2004. Individual variation in timing of migration:
causes and reproductive consequences in greater snow geese (Anser caerulescens
caerulescens). Behavioural Ecology and Sociobiology. 57: 1-8.
Black, J.M. & Owen, M. 1995. Reproductive performance and assertive pairing in
relation to age in barnacle geese. Journal of Animal Ecology. 64: 234-244.
Cooch, E.G., Lang, D.B., Rockweel, R.F. & Cooke, F. 1989. Long-term decline in
fecundity in a snow goose population: evidence for density dependence? Journal of
Animal Ecology. 58: 711-726.
Cooke, F. & Abraham, K.F. 1980. Habitat and locality selection in lesser snow geese: the
role of previous experience. Proceedings 18th
International Ornithological Congress.
Berlin. pp. 998-1004.
Cooke, F., MacInnes, C.D. & Prevett, P.P. 1975. Gene flow between breeding
populations of lesser snow geese. The Auk. 92: 493-510.
Cope, D.R., Pettifor, R.A., Griffin, L.R., Rowcliffe, J.M. 2003. Integrating farming and
wildlife conservation: the Barnacle Goose Management Scheme. Biol Conserv 110:
113-122.
Cope, D.R., Vickery, J.A. & Rowcliffe, J.M. 2006. From conflict to coexistence: a case
study of geese and agriculture in Scotland. Waterbirds around the world. Eds. G.C.
Boere, C.A. Galbraith & D.A. Stroud. The Stationery Office, Edinburgh, UK. pp. 791-
794.
Durant, J.M., Anker-Nilssen, T., Hjermann, D.O. & Stenseth, N.C. 2004. Regime
shifts in the breeding of an Atlantic puffin population. Ecology Letters. 7: 388-394.
Erikstad, K.E., Bustnes, J.O. & Moum, T. 1993. Clutch-size determination in precocial
birds: a study of the common eider. Auk. 110: 623-628.
Eythórsson E. 2004. (In Norwegian) Gjess til besvær. Utfordringer i forvaltningen av ville
gåsebestander med utgangspunkt i beiteproblematikken i Vesterålen (Troublesome
geese. Challenges for goose management, with perspectives from the grazing conflict in
Vesterålen, North Norway). Norut NIBR Finnmark. Report 2004: 2. pp. 48.
10
Fox, A. D., Ebbinge, B. S., Mitchell, C., Heinicke, T., Aarvak, T., Colhoun, K., … van
der Jeugd, H. 2010. Current estimates of goose population sizes in western Europe, a
gap analysis and an assessment of trends. Ornis Svecic. 20(3-4): 115–127.
Fox, A. D., Madsen, J., Boyd, H., Kuijken, E., Norriss, D. W., Tombre, I. M., &
Stroud, D. a. 2005. Effects of agricultural change on abundance, fitness components
and distribution of two arctic-nesting goose populations. Global Change Biology. 11:
881–893.
Francis, C.M., Richards, M.H., Cooke, F. & Rockwell , R.F. 1992. Long-term changes
in survuval rates of lesser snow geese. Ecology. 73: 1346-1362.
Frederiksen, M. (2002). Indirect estimation of the number of migratory Greylag and Pink-
footed Geese shot in Britain. Wildfowl. 53: 27–34.
Frederiksen, M., Hearn, R.D., Michell, C., Sigfússon, A., Swann, R.L. & Fox, A.D. 2004a. The dynamics of hunted Icelandic goose populations: a reassessment of the
evidence. Journal of Applied Ecology. 41: 315-334.
Frederiksen, M., Harris, M.P., Daunt, F., Rothery, P. & Wanless, S. 2004b. Scale-
dependent climate signals drive breeding phenology of three seabird species. Global
Change Biology. 10: 1214-1221.
Gill, J. A. 1996. Habitat choice in pink-footed geese: Quantifying the constraints
determining winter site use. Journal of Applied Ecology. 33: 884–892.
Gladbach, A., Gladbach, D. J., & Quillfeldt, P. 2010. Seasonal clutch size decline and
individual variation in the timing of breeding are related to female body condition in a
non-migratory species, the Upland Goose Chloephaga picta leucoptera. Journal of
Ornithology. 151(4): 817–825.
Gunnarsson, T. G., Appleton, G. F., & Gill, J. A. 2008. Búsvæðaval og stofnvernd
grágæsa á láglendi. Bliki. 29: 11–18.
Gunnarsson, T. G., Gill, J. A., Appleton, G. F., Gíslason, H., Gardarsson, A.,
Watkinson, A. R., & Sutherland, W. J. 2006. Large-scale habitat associations of birds
in lowland Iceland: Implications for conservation. Biological Conservation. 128(2):
265–275.
Hanssen, S., Engebretsen, H. & Erikstad, K. 2002. Incubation start and egg size in
relation to body reserves in the common eider. Behavioral Ecology and Sociobiology.
52(4): 282-288.
Hart, S. & Harradine, J. 2003. Pilot Studies to Quantify the Annual Shooting Kill of Grey
Geese in Scotland. British Association for Shooting & Conservation Report to the
Scottish Executive, BASC, Rossett, UK.
Icelandic Meterological Office. 2014. Icelandic meterological data. Retrieved Jan. 01,
2014, from http://vedur.datamarket.net/

11
Inger, R., Harrison, X. A., Ruxton, G. D., Newton, J., Colhoun, K., Gudmundsson, G.
A., McElwaine, G., et al. 2010. Carry-over effects reveal reproductive costs in a long-
distance migrant. The Journal of animal ecology. 79(5): 974-982.
Jasmin, J.N., Rochefort, L., & Gauthier, G. 2008. Goose grazing influences the fine-
scale structure of a bryophyte community in arctic wetlands. Polar Biology. 31(9):
1043–1049.
Jón Einar Jónsson & A. D. Afton. 2006. Differing time and energy budgets of lesser
snow geese in rice-prairies and coastal marshes in southwest Louisiana. Waterbirds. 29
(4): 451-458.
Kerbes, R. H., Kotanen, P. M., & Jefferies, R. L. 2009. Destruction of Wetland Habitats
by Lesser Snow Geese : A Keystone Species on the West Coast of Hudson Bay. Journal
of Applied Ecology. 27(1): 242–258.
Kingsford, R. T. 2000. Review Ecological impacts of dams, water diversions and river
management on floodplain wetlands in Australia. Austral Ecology. 25: 109–127.
Kingsford, R. T., & Johnson, W. 1998. Impact of Water Diversions on Colonially-
nesting Waterbirds in the Macquarie Marshes of Arid Australia. Colonial Waterbirds.
21(2): 159–170.
Lepage, D., Gauthier, G. & Menu, S. 2000. Reproductive consequences of egg-laying
decisions in snow geese. Journal of Animal Ecology. 69(3): 414-427.
Madsen J, Cracknell G. Fox T. 1999. Goose Populations of the Western Palearctic. A
Review of Status and Distribution. Wetlands International Publication 48. Wetlands
International/ National Environmental Research Institute, Wageningen, the
Netherlands/Rønde, Denmark.
Madsen, J., Tamstorf, M., Klaassen, M., Eide, N., Glahder, C., Rigét, F., Nyegaard,
H. & Cottaar, F. 2007. Effects of snow cover on the timing and success of
reproduction in high-Arctic pink-footed geese Anser brachyrhynchus. Polar Biology.
30(11): 1363-1372.
Mainguy, J., Gauthier, G., Giroux, J. & Bêty, J. 2006. Gosling growth and survival in
relation to brood movements in Greater snow geese (Chen caerulescens atlantica). The
Auk. 123(4):1077-1089.
Mitchell, C. 2013. Status and distribution of Icelandic-breeding geese : results of the 2012
international census Goose & Swan Monitoring, (August).
Nikolai, C.A. & Sedinger, J.S. 2012. Trade-offs between offspring fitness and future
reproduction of adult female black brent. Journal of Animal Ecology. 81:798-8005.
Nilsson, C. & Dynesius, M. 1994. Ecological effects of river regulation on mammals and
birds – a review. Regulated Rivers – Research and Management. 9: 45-53.

12
Nolet, B. A., Bauer, S., Feige, N., Kokorev, Y. I., Popov, I. Y., & Ebbinge, B. S. 2013.
Faltering lemming cycles reduce productivity and population size of a migratory Arctic
goose species. The Journal of animal ecology. 82(4): 804-813.
Norris, R.D. & Marra, P.P. 2007. Seasonal interactions, habitat quality, and population
dynamics in migratory birds. The Condor. 109: 535-547.
Oro, D., Hernández, N., Jover, L., & Genovart, M. (2013). From recruitment to
senescence: food shapes the age-dependent pattern of breeding performance in a long-
lived bird. Ecology. 95(2): 446–457.
Owen, M., Atkinson-Willes, G.L. & Salmon, D.G. 1986. Wildfowl in Great Britain. 2dn
Edition. University Press. Cambridge. 613pp.
Owen, M., & BLACK, J. M. 1989. Factors affecting the survival of Barnacle Geese on
migration from the breeding grounds. Journal of Animal Ecology. 58:603-617.
Vickery, J.A., Sutherland, W.J., Watkinson, A.R., Lane, S.J. & Rowcliff, J.M. 1995.
Habitat switching by Dark-bellied Brent geese Branta-B-Bernicla (L) in relation to food
depletion. Oecologia. 103(4): 499-508.
Pistorius, P. a., Bester, M. N., Lewis, M. N., Taylor, F. E., Campagna, C., & Kirkman,
S. P. 2004. Adult female survival, population trend, and the implications of early
primiparity in a capital breeder, the southern elephant seal (Mirounga leonina). Journal
of Zoology. 263(2): 107–119.
Pistorius, P. a., Follestad, A., & Taylor, F. E. 2006. Declining winter survival and fitness
implications associated with latitudinal distribution in Norwegian Greylag Geese Anser
anser. Ibis. 148(1): 114–125.
Poussart, C., Larochelle, J., & Gauthier, G. 2000. The thermal regime of eggs during
laying and incubation in Greater Snow Geese. Condor. 102(2): 292–300.
Prop, J., Black, J. M., & Shimmings, P. 2003. Travel schedules to the high arctic:
barnacle geese trade-off the timing of migration with accumulation of fat deposits.
Oikos. 103(2): 403–414.
Raveling, D.G. 1979. The annual cycle of body composition of Canada geese with special
reference to control of reproduction. The Auk. 96: 234-252.
Reed, A. 1973. Geese, nutrition and farm land. Wildfowl Ecology Symposium. 27: 153-
156.
Sedinger, J.S. 1997. Adaptations to and consequences of an herbivorous diet in grouse and
waterfowl. Condor. 99: 314–326.
Sedinger, J. S., Flint, P. L., & Lindberg, M. S. 1995. Environmental influence on life-
history traits: Growth, survival, and fecundity in black brant (branta
bernicla). Ecology. 76(8): 2404.
13
Smith, T. J., & Odum, W. E. 1981. The effects of grazing by snow geese on coastal salt
marshes. Ecology. 62(1): 98–106.
Statistics Iceland. 2014. Production of field crops from 1977. Retrieved May. 25, 2014,
from http://www.statice.is
Summers, R. & Underhill, L. 1987. Factors related to breeding production of Brent
Geese Branta b. bernicla and waders (Charadrii) on the Taimyr Peninsula. Bird Study.
34(2): 161-171.
Sutherland, W.J. 1996. From individual behaviour to population ecology. – Oxford
University Press. Oxford.
Sutherland, W. J. 2001. Sustainable exploitation : a review of principles and methods.
Wildlife Biology. 7(3): 131–140.
Swann, B. (R. L. ., Brockway, I. K., Frederiksen, M., Hearn, R. D., Mitchell, C. R., &
Sigfússon, A. 2005. Within-winter movements and site fidelity of Icelandic Greylag
Geese Anser anser. Bird Study. 52(1): 25–36.
Sæther, B.-E., Ringsby, T.H. & Røskaft, E. 1996. Life history variation, population
processes and priorities in species conservation: towards a reunion of research
paradigms. Oikos. 77: 217–226.
Tombre, I. Eythórsson, E. & Madsen, J. 2013. Towards a solution to the goose-
agriculture conflict in North Norway, 1988-2012: the interplay between policy,
stakeholder influence and goose population dynamics. PloS one. 8(8): e71912.
Traylor, J.J. & R.T. Alisauskas. 2006. Effects of intrinsic and extrinsic factors on
survival of white-winged scoter (Melanitta fusca deglandi) ducklings. Auk. 123: 67-81.
The Environment Agency of Iceland. 2014. Veiðitölur. Retrieved from
http://ust.is/einstaklingar/veidi/veiditolur/
Walter, SE. & Rusch, DH. 1997. Accuracy of egg flotation in determining age of Canada
goose nests. Wildlife Society Bulletin. 25(4): 854-857.
Wildfowl & Wildlife Trust. 2014. Greylag & Pink-footed goose population numbers.
WWT data.
Williams, T. D., Cooch, T. G., Jefferies, R. L. & Cooke, F. 1993. Environmental
degradation, food limitation and reproductive output: juvenile survival in lesser snow
geese. Journal og Animal Ecology. 62: 766-777.
Öst, M., Smith, B.D. & Kilpi, M. 2008. Social and maternal factors affecting duckling
survival in eiders (Somateria mollissima). Journal of Animal Ecology. 77: 315-325.
14
Manuscript
Annual and large-scale variation in breeding output of Greylag geese
(Anser anser) in Iceland
Helgi Guðjónsson1, Jón Einar Jónsson
2, Halldór Walter Stefánsson
3, Aðalsteinn Örn
Snæþórsson4
& Tómas Grétar Gunnarsson5
1University of Iceland, Department of Life- and Environmental Sciences. Askja, IS-101,
Reykjavík, Iceland
2University of Iceland,Snæfellsnes Research Center, Hafnargata 3, IS-340 Stykkishólmur,
Iceland.
3East Iceland Natural History Institute, Mýrargata 10, IS-740 Neskaupstaður and
Tjarnarbraut 39a, IS-700 Egilsstaðir, Iceland
4North East Iceland Nature Center, Hafnarstétt 3, IS-640 Húsavík, Iceland
5University of Iceland, South Iceland Research Center, Fjolheimar, Bankavegur, IS-800
Iceland.
15
Abstract
Capsule Large-scale variation in breeding output of Greylag geese (Anser anser) is
relatively little but detectable variation is most likely linked to spring temperature.
Aims To ensure a sustainable utilization of animal populations, information on parameters
that limit population size and on demographic rates must be obtained. Greylags are a
favourite quarry species in Iceland but data on breeding demography are scarce. We made
a large-scale comparison of parameters that relate to breeding output to identify spatial and
annual variation.
Methods In 2012 and 2013, a total of 360 greylag nests were visited across Iceland and
parameters relating to breeding output were measured (timing of breeding, reproductive
investment and brood sizes). In addition, 888 greylag families were surveyed in the same
period to estimate large-scale variation in brood sizes.
Results Incubation phenology varied significantly between parts of the country and started
on average on the 30th
of April in West- and South Iceland, but significantly later in cooler
parts of Iceland, North Iceland (10th
May) and East Iceland (20th
May). In 2012 we found
no difference in clutch size between areas but in 2013 East Iceland had a smaller clutch
size than South and West Iceland. Overall, clutch size was around 4-6 eggs and was similar
between years. We found little to no variation in clutch volume between areas and this was
independent of year. Mean brood size varied from 3-5 between regions, where East Iceland
was found to have the smallest brood size on average while West and North Iceland had
the largest brood size. The parameter showing the largest difference between years was the
brood size, where brood sizes were smaller in West and South Iceland in 2013.
Conclusion Regional variation in the start of incubation is most likely related to ambient
temperatures as the South and West parts of the country have a relatively more temperate
climate than the North and East. There are indications that conditions for breeding may be
more favourable in South and West Iceland. We discuss further potential causes for
differences in breeding output between regions in Iceland and what implications this has
for a sustainable hunting of the greylag population.
16
Introduction
Agricultural changes have had a profound effect on many species of birds the last few
decades. Recent changes in agricultural policy have led to extensive areas of largely
uniform, intensely managed areas of grassland and cereals. This change has increased the
carrying capacity of the European land mass for grazing birds and while the effect has been
negative for many species the larger terrestrial herbivorous migratory waterbirds, such as
swans and geese, have benefitted from the recent changes in abundance of farmland and
have been increasing in population size the last few decades (Madsen et al 1999; Abraham
et al. 2005; Fox et al. 2005). Geese take advantage of both cultivated land and natural
wetlands but the highest food intake rates are usually on cultivated land (Fox et al. 2005;
Jónsson & Afton 2006). It is very likely that the conversion of natural habitats to
agricultural land has been the dominant factor in the increase in goose numbers the last 50
years (Madsen et.al 1999). This has led to increasing conflicts with farmers but has also
resulted in increased data collection on their abundance and population size over long time
scales (Fox et al. 2010). Many geese are also a common quarry species and considerable
interests lie in the continuation and stability of populations. To ensure a sustainable
utilization of an animal population, the crucial factors that limit population size must be
monitored and a detailed understanding on demographic rates must be obtained (Caughley
& Sinclair 1994; Sutherland 2001).
In many long-lived species such as geese, population changes have primarily been
linked to a response to changes in adult survival rates, with fecundity generally playing a
smaller role (Sæther et al. 1996; Pistorius et al. 2004; Pistorius et al. 2006). Important
drivers of variation both in survival and productivity are changes in the bird’s habitat or the
development of their habitat (Sutherland 1996). Adult survival of geese on the wintering
grounds is mostly influenced by availability of suitable farmland (Gill 1996; Swann et al.
2005). On the nesting grounds the limitation of breeding success is usually the most
important driver of population changes (besides hunting) but it is mostly influenced by
availability of suitable habitat and the spatial distribution of populations in relation to
habitat.
Several common correlates to fitness can be useful for estimating variation in habitat
quality and reproductive output. An early start of incubation is often positively related to
fitness in birds as those individuals that first lay eggs are generally those that are in the best
physical condition, lay the largest clutches and have the best nesting success (Erikstad et
al. 1993; Arnold et al. 2004; Bêty et al. 2004). Offspring that hatch earlier in spring have
often a better life expectancy but this is often connected to food availability and how
mature the offspring are at the time of autumn migration (Poussartet al. 2000; Prop et al.
2003; Durant et al. 2004; Frederiksen et al. 2004a). The number of eggs shows a
correlation to the physical condition of geese and ducks (Ankney & MacInnes 1978;
Erikstad et al. 1993; Öst et al. 2008; Gladbach et al. 2010). Gladbach et al. (2010) also
concluded that the mean egg volume and total clutch volume increased with female body
condition and that hatching date is earlier for females in better body condition. Clutch
volume and clutch size may therefore give a good indicator of physical condition of
breeding geese. Clutch size decreases with later nesting in many species of birds (Arnold
et.al 2004) and the life expectancy of offspring often show a negative regression to date of
hatching among ducks (Traylor & Alisauskas 2006).

17
The Greylag goose (Anser anser), greylag from now on, is the most common
breeding goose across the lowlands of Iceland, i.e., below 200 meters above sea-level in
Iceland, where large-scale habitat selection and distribution have been assessed
(Gunnarsson et al. 2008). The Icelandic population overwinters mostly in Great Britain and
returns to the breeding grounds in Iceland early in the spring in March and April (Swann et
al. 2005; Gunnarsson & Tómasson 2011). Variation in space and time, in parameters which
relate to breeding output, are however unknown, but this information is needed for
successful management and conservation. Bag statistics show that hunters in Iceland shoot
on average about 40 thousand greylags per year, average of hunting statistics 2000-2010
(The Environment Agency of Iceland 2014). Despite of the extensive hunting the greylag
population has been slowly increasing and is estimated at approx. 105 thousand individuals
in late autumn after hunting in Iceland, 2012 census (Mitchell 2013). Furthermore, it is
estimated that in Great Britain about 15-20 thousand greylags are hunted every year (Hart
& Harradine 2003). Frederiksen et al. (2004b) suggested that the population size was
underestimated in the census on the winter grounds in Great Britain which could explain
how the population was doing well despite the intensive hunting. It is also possible that
strong density dependence is operating which allows the population to compensate for the
high hunting pressure or that it would be growing in the absence of hunting (cf. Sutherland
2001). In Iceland the most likely threat to the greylag habitat are changes in land-use
patterns in lowland areas, for instance an increase in commercial afforestation, increasing
pressure to bodies of water (for instance through building of summerhouses and fish
farming), increased traffic due to recreation, and increased amount of farming in the
species nesting habitats (Gunnarsson et al. 2006; Gunnarsson et al. 2008). It is also not
foreseen what the effects of river regulation for electricity production will have in lowland
areas of Iceland but it is well known that such changes can change the animal communities
on and along rivers (Nilsson & Dynesius 1994). It is known that dams have a high impact
on the ecosystem and biodiversity has been known to decrease when the flow of rivers is
regulated (Kingsford & Johnson 1998; Kingsford 2000).
In this study we assessed differences in the breeding output of greylags across
Iceland over two years. The aim was to produce a large-scale comparison of parameters
that relate to breeding output (timing of breeding, reproductive investment and brood sizes)
and identify large-scale variation in these parameters within Iceland and between years.
Materials & methods
Study areas
Fieldwork was conducted during the spring and summers of 2012-2013. Study areas were
chosen across the country to capture possible large-scale variation in breeding parameters
(Figure 1). Greylags nest almost exclusively in the lowlands of Iceland (under 200 meters
above sea-level (Tómas Grétar Gunnarsson et al. 2008) and they are found around the
whole country. The study was split into two phases: nest survey and gosling survey.

18
Nest survey
Each study area was visited in both years on a period from the first of May to the first of
June. Sampling in each area took 2-3 days on average and the first area visited was West
Iceland, then South and East and lastly the North. Major rivers and wetlands in each area
were searched to locate breeding colonies and sample nests. Most nests were situated in
small islands in rivers but in West Iceland nests were in islands in the Breiðafjörður bay
(Figure 1). The search effort for nests differed between areas as the nest concentration and
the supply of suitable nesting habitat varied between areas.
Gosling survey
Greylag flocks were surveyed during a three month period (June - August). Each area was
covered at least once each month during the survey time. Brood surveys were conducted
on a larger scale than the nest search since post-laying geese disperse, often over large
areas. The search was conducted by driving parallel to major rivers and selected lakes in
the catchment area, or along the coastline, as in the case of Breiðafjörður. Frequent stops
were made and the area surveyed for geese with binoculars and spotting scopes.
The surveyed areas (Figure 1) in South Iceland ranged from the banks of Ölfusá to
Eystri Rangá. The surveyed area for West Iceland was extended south and we included the
area from Borgarfjörður to Kollafjörður. For North Iceland the surveyed area ranged from
Vatndalsá and east to Víkingavatn. The East Iceland surveyed area ranged from the river
Jökulsá á Brú to Lagarfljót lake.
Measures of productivity
Nest search
Greylag clutch size (eggs per nest), egg size (length & width), clutch volume (total volume
of eggs per nest) and estimated start of incubation were measured for each nest. To
minimize disturbance, risk of desertion and the effects of cooling of eggs, the time at each
nest and colony was kept as short as possible. When measurements at each nest were
completed, the eggs were covered with nest down to minimize the risk of predation and to
reduce heat loss. Start of incubation was estimated by egg flotation (Westerskov 1950)
and first day of incubation back-calculated by: Days from start of incubation = sampling
date x 4.67 – 2.33 (Walter & Rusch 1997). We finally subtracted days from start of
incubation from the sampling date and received estimated start of incubation, in ordinal
days. To calculate egg volume we used the equation: Volume (cm³) = 0.507 x length x
width2 (Westerskov 1950). Clutch volume was found by combining the total volume of
eggs in each nest.
In 2012, measurements for North Iceland included only clutch size and timing of
incubation and in 2013 only clutch size was recorded for East Iceland (Table 1). We
included all nests that were visited in the analysis and did not differentiate between nests
by clutch size. Since geese start incubation over a number of days, we could not accurately
differentiate between nests where the goose had finished laying eggs or those that still had
not finished, despite floating of eggs.

19
Gosling surveys
Brood sizes were estimated from the first week of June to the first week of September each
year. Each time greylags were sighted the number of all greylags, with and without
goslings, were recorded and the total number of geese at each location. From those
measurements the average brood sizes could be compared between areas and years. Brood
size was the number of goslings with each pair or individual adult greylag over the course
of each sampling period, averaged over areas and years. We could not be sure whether we
saw the same broods or new ones when we re-visited locations between months and hence
we included all broods recorded in each area during the sampling period in the data.
Data analysis
Area and pooled annual variation in clutch size, egg size, clutch volume, start of incubation
and mean brood size was assessed by ANOVA. We used Tukey’s Honest Significant
Difference as a post-ANOVA test to help distinguish differences between areas in the
ANOVA. For an independent test for comparing difference between years within each area
we used Welch two sample t-test. Year and area were explanatory variables. Statistical
analyses were performed in R 2.15.2 (R Core Team, 2013).
The map of the research areas was made with ArcMap 10.1 using the ISN93 projection and
based on the IS50V database.
Results
General variation in productivity
In the two years of sampling a total of 360 greylag nests and 888 greylag pairs with
goslings were sampled across Iceland (Table 1). Overall, the average clutch size was 4.7
and ranged from 1 to 10 (Figure 2a). Length was on average 84.0 mm and ranged from
54.1 - 94.2mm. Average width was 57.7 mm and ranged from 49.3 – 62.1mm. The average
clutch volume was 658 cm3 and ranged from 123.4 cm
3 to 1369.0 cm
3. The average start of
incubation was on day 124 (4th
of May) and ranged from 100 (10th
of April) to 157 (6th
of
June). In the gosling surveys, overall average brood size was 3.6 and ranged from 1-12
goslings per pair.
Between area productivity
Greylag clutch size did vary between areas and was independent of year, as no interaction
between Area*Year was found (Table 2). Both length and width of eggs varied between
years but were dependent on area (Area*Year interaction significant) (Table 2). There was
no variation in clutch volume between areas (Table 2). Start of incubation differed between
20
areas independent of year (Table 2). Brood sizes differed greatly between areas, depending
on year (Table 2).
Clutch size was smaller in East Iceland than both South and West Iceland and North
Iceland was in between (Figure 2a). Start of incubation was almost the same between
West- and South Iceland (Figure 2b). West- and South Iceland started incubation on
average on day 119 (30th
of April), North Iceland started on average ten days later (10th
of
May) and last came East Iceland on average ten days after that (20th
of May) (Figure 2b).
There was very little variation in clutch volume between areas (Figure 2c). Mean brood
size varied from 3-5 goslings between areas, and East Iceland had the smallest brood size
on average (Figure 2d) while West and North Iceland had the largest brood size. West
Iceland had the largest brood size in 2012 but in the following year that number declined
and was similar to North Iceland (Figure 2d).
Annual variation in productivity
In the second year of sampling, fewer nests were found in South and West Iceland when
re-visiting study areas from the previous year (Table 1). Annual clutch size, with all areas
pooled, varied little between years and little difference was found in annual length and
width between years (Table 2). Estimated start of incubation varied little and was
consistent between years (Table 2). Brood size showed a positive interaction between years
and an area-year interaction (Table 2). When inspecting annual means the only significant
annual difference found was in the mean brood size, with smaller mean brood sizes in in
2013.
Clutch size within areas was found to increase slightly in West Iceland between years
(Table 3). Length of eggs showed a slight increase in West Iceland between years but there
was little difference in South Iceland (Table 3). Width of eggs differed slightly between
years in South Iceland where it was smaller in 2013 but there was no significant change in
West Iceland (Table 3). A slight increase in clutch volume between years was found in
West Iceland while there was no noticeable difference in South Iceland (Table 3).
Estimated start of incubation did not vary within areas between years (Table 3). Brood size
was noticeably lower in West Iceland and slightly lower in South Iceland in 2013 while
there was little variation in North and East Iceland between years (Table 3).
Discussion
During the two study years we found that there was some noticeable difference in all
parameters either between years or areas except for in clutch volume. Out of six
parameters that were measured we found a significant difference between areas in three
(clutch size, start of incubation and brood size) and one between years (brood size). Clutch
size differed between areas as East Iceland had fewer eggs than the South and West
Iceland. In addition we found a variation in egg length and width where in 2013 West
Iceland had both longer and wider eggs than the other areas. Start of incubation differed
greatly between areas but not between years. We found that South and West Iceland were
earliest and virtually identical in the start of incubation and then came the North and finally

21
East Iceland. The South and West study areas were almost identical in most measured
parameters although West Iceland showed a bit more variation in most parameters between
years than the South. North Iceland differed mostly from South and West by having a later
start in incubation. East Iceland seemed to have consistently both smaller clutches and
brood sizes than the other areas between years and the latest start of incubation. In general
there was little annual difference in mean annual values except for brood size, which were
smaller in 2013.
Clutch size average 4.7 eggs and was similar between years which, with the small
differences in clutch volume, suggest that conditions for adults were sufficiently good for
egg production in both years. In 2013 we found fewer nests in south- and west Iceland than
in the previous year when we visited the same locations. It is well known for some ducks
and other long lived species to skip breeding or abandoning the nest right after laying eggs
if conditions are unfavorable and survival is potentially poor (Coulson 1984). We do not
know if this was only an annual variation, a result of a colder spring in 2013 than in 2012
or a result of our sampling the previous year. It is though highly unlikely that the sampling
had different effect in the south and west Iceland than in the north and east. A possible
explanation for this is when conditions are not as favorable only the high-quality
individuals lay eggs and those in poor condition skip breeding (Oro et al. 2013). We
suggest that this explains why there were fewer nests in 2013 but little change in clutch
size or clutch volume.
We saw a considerable difference in the start of incubation between parts of the
country and this difference was independent of year. This difference could be linked to
differences in temperature in the different parts of the country (Einarsson 1987). Spring
temperature for the different areas shows a similar trend as the start of incubation (Figure
3). This may suggest that spring temperature influences breeding phenology, possibly
through timing of vegetation growth and body condition of females (Summers & Underhill
1987; Gladbach et al. 2010). Brood sizes were lower in 2013 except for North Iceland, but
the difference might be explained by the smaller sample size of 2012. The results from the
gosling survey show also a significant difference on mean brood size between the research
areas. Mean brood size was smaller in East Iceland than in the other areas. It might
therefore be possible that the delay in the start of incubation is having an adverse effect on
the life expectancy of the goslings (Lepage et al. 2000). There was a significant decrease in
brood size in South- and West Iceland in 2013, and there might be a possible link between
the decrease in gosling survival and the lower temperature. Temperature affects many
factors, for instance length of growth season for plants (Walker et al. 2006), and it is
possible that the delayed start of incubation and the shorter growth season are having a
negative effect on the life expectancy of goslings. Lower brood size in East Iceland might
be caused by a range of factors, including predation (Young 1972; Summers & Underhill
1987; Ebbinge 1989; Hersteinsson & Macdonald 1996), weather and temperature
difference (Einarsson 1987; Summers & Underhill 1987; Sedinger 1992), and food
availability (Mainguy et al. 2006) but the contribution of each is unknown.
The most notable difference between study areas is the start of incubation and the
brood size. The earlier start in incubation in the South and West Iceland would give the
goslings a considerable advantage as they have longer time to develop and grow. This
coincides with a longer growth season in the South and West Iceland in a milder climate.
We therefore suggest that South and West Iceland, generally have more favourable
breeding conditions. South Iceland has the largest surface area dedicated to farmland in the

22
country (National Land Survey of Iceland 2009) and is therefore highly important for
breeding greylags as well as non-breeding. This study has mainly investigated the
differences in breeding output between areas in Iceland. However, breeding greylags are
more common per unit area in the East and Northeast, which is probably due to different
availability of suitable habitat types around the country (Gunnarsson et al. 2008). So even
though breeding conditions seem more favourable in the South and West, areas in the East
and North are very important in the overall production of greylags across Iceland.
Conversely, since these two years were highly different we suggest that these birds are
robust regarding spring temperatures as we found little variation between years in clutch
size and clutch volume. Furthermore, if the birds arrive in sufficient body condition, their
success may be indifferent of spring conditions physical condition of the birds is
sufficiently high when they arrive they are not as dependent on the conditions in breeding
grounds (Reed 1973; Raveling 1979; Summers & Underhill 1987; Madsen et al. 2007).
This study is a significant step towards a better understanding of breeding output of
Greylag geese in Iceland. For a sustainable hunting of the greylag population a more long
term study is needed that would also account for long term changes in temperature and
weather conditions during the spring. A large-scale marking program where the success of
individual geese breeding in different habitats and across Iceland, followed over more
years, would add significantly to our understanding of the large-scale demographic
processes which are needed to develop a successful management strategy for this
population.

23
Acknowledgements
We would like to thank Sverrir Thorstensen and Árni Ásgeirsson for assisting in the field.
We thank the land owners for allowing us to conduct our study on their land. For financial
support, we thank The Environmental Agency of Iceland (Hunter’s license fund).

24
References
Abraham, K. F., Jefferies, R. L. and Alisauskas, R. T. 2005. The dynamics of landscape
change and snow geese in mid-continent North America. Global Change Biology.
11: 841–855.
Ankney, C.D. & MacInnes, C. D. 1978. Nutrient reserves and reproductive performance
of female lesser snow geese. Auk 95: 459-471.
Arnold, J., Hatch, J., & Nisbet, I. 2004. Seasonal declines in reproductive success of the
common tern Sterna hirundo: timing or parental quality? Journal of Avian Biology. 35
(1): 33–45.
Bêty, J., Giroux J.F. & Gauthier, G. 2004. Individual variation in timing of migration:
causes and reproductive consequences in greater snow geese (Anser caerulescens
caerulescens). Behavioural Ecology and Sociobiology. 57: 1-8.
Caughley, G. & Sinclair, A.R.E. 1994. Wildlife Ecology and Management. - Blackwell
Science, Oxford, 334.
Coulson, J. C. 1984. The population dynamics of the Eider Duck Somateria
mollissima and evidence of extensive non-breeding by adult ducks. Ibis. 126: 525–543.
Durant, J.M., Anker-Nilssen, T., Hjermann, D.O. & Stenseth, N.C. 2004. Regime
shifts in the breeding of an Atlantic puffin population. Ecology Letters. 7: 388-394.
Ebbinge, B. S. 1989. A multifactorial explanation for variation in breeding performance of
Brent Geese Branta bernicla. Ibis. 131: 196–204.
Einarsson, M. A. 1984. Climate of Iceland. World survey of climatology, 15, 673-697.
Erikstad, K.E., Bustnes, J.O. & Moum, T. 1993. Clutch-size determination in precocial
birds: a study of the common eider. Auk. 110: 623-628.
Fox, A. D., Ebbinge, B. S., Mitchell, C., Heinicke, T., Aarvak, T., Colhoun, K., … van
der Jeugd, H. 2010. Current estimates of goose population sizes in western Europe, a
gap analysis and an assessment of trends. Ornis Svecic. 20(3-4): 115–127.
Fox, A. D., Madsen, J., Boyd, H., Kuijken, E., Norriss, D. W., Tombre, I. M., &
Stroud, D. a. 2005. Effects of agricultural change on abundance, fitness components
and distribution of two arctic-nesting goose populations. Global Change Biology. 11:
881–893.
Frederiksen, M. (2002). Indirect estimation of the number of migratory Greylag and Pink-
footed Geese shot in Britain. Wildfowl, 53: 27–34.
Frederiksen, M., Harris, M.P., Daunt, F., Rothery, P. & Wanless, S. 2004a. Scale-
dependent climate signals drive breeding phenology of three seabird species. Global
Change Biology. 10: 1214-1221.

25
Frederiksen, M., Hearn, R.D., Michell, C., Sigfússon, A., Swann, R.L. & Fox, A.D. 2004b. The dynamics of hunted Icelandic goose populations: a reassessment of the
evidence. Journal of Applied Ecology. 41: 315-334.
Gill, J. A. 1996. Habitat choice in pink-footed geese: Quantifying the constraints
determining winter site use. Journal of Applied Ecology. 33: 884–892.
Gladbach, A., Gladbach, D. J., & Quillfeldt, P. 2010. Seasonal clutch size decline and
individual variation in the timing of breeding are related to female body condition in a
non-migratory species, the Upland Goose Chloephaga picta leucoptera. Journal of
Ornithology. 151(4): 817–825.
Gunnarsson, T. G., Appleton, G. F., & Gill, J. A. 2008. Búsvæðaval og stofnvernd
grágæsa á láglendi. Bliki. 29: 11–18.
Gunnarsson, T. G., Gill, J. A., Appleton, G. F., Gíslason, H., Gardarsson, A.,
Watkinson, A. R., & Sutherland, W. J. 2006. Large-scale habitat associations of birds
in lowland Iceland: Implications for conservation. Biological Conservation. 128(2):
265–275.
Gunnarsson, T. G. & Tómasson, G. 2011. Flexibility in spring arrival of migratory birds
at northern latitudes under rapid temperature changes. Bird Study. 58: 1-12.
Hart, S. & Harradine, J. 2003. Pilot Studies to Quantify the Annual Shooting Kill of Grey
Geese in Scotland. British Association for Shooting & Conservation Report to the
Scottish Executive, BASC, Rossett, UK.
Hersteinsson, P. and Macdonald, D. W. 1996. Diet of arctic foxes (Alopex lagopus) in
Iceland. Journal of Zoology. 240: 457–474.
Icelandic Meterological Office. 2014. Icelandic meterological data. Retrieved Jan. 01,
2014, from http://vedur.datamarket.net/
Jón Einar Jónsson & A. D. Afton. 2006. Differing time and energy budgets of lesser
snow geese in rice-prairies and coastal marshes in southwest Louisiana. Waterbirds. 29
(4): 451-458.
Kerbes, R. H., Kotanen, P. M., & Jefferies, R. L. 2009. Destruction of Wetland Habitats
by Lesser Snow Geese : A Keystone Species on the West Coast of Hudson Bay. Journal
of Applied Ecology. 27(1): 242–258.
Kingsford, R. T. 2000. Review Ecological impacts of dams , water diversions and river
management on floodplain wetlands in Australia. Austral Ecology. 25: 109–127.
Kingsford, R. T., & Johnson, W. 1998. Impact of Water Diversions on Colonially-
nesting Waterbirds in the Macquarie Marshes of Arid Australia. Colonial Waterbirds.
21(2): 159–170.
Madsen J, Cracknell G. Fox T. 1999. Goose Populations of the Western Palearctic. A
Review of Status and Distribution. Wetlands International Publication 48. Wetlands

26
International/ National Environmental Research Institute, Wageningen, the
Netherlands/Rønde, Denmark.
Madsen, J., Tamstorf, M., Klaassen, M., Eide, N., Glahder, C., Rigét, F., Nyegaard,
H. & Cottaar, F. 2007. Effects of snow cover on the timing and success of
reproduction in high-Arctic pink-footed geese Anser brachyrhynchus. Polar Biology.
30(11): 1363-1372.
Mitchell, C. 2013. Status and distribution of Icelandic-breeding geese : results of the 2012
international census Goose & Swan Monitoring, (August).
National Land Survey of Iceland. 2009. Corine-landflokkunin á Íslandi (no. VE000792).
Akranes, Iceland: Author. Retrieved from http://www.lmi.is/wp-
content/uploads/2011/09/corineskyrsla-langa-isl.pdf
Nilsson, C. & Dynesius, M. 1994. Ecological effects of river regulation on mammals and
birds – a review. Regulated Rivers – Research and Management. 9: 45-53.
Oro, D., Hernández, N., Jover, L., & Genovart, M. (2013). From recruitment to
senescence: food shapes the age-dependent pattern of breeding performance in a long-
lived bird. Ecology. 95(2): 446–457.
Pistorius, P. a., Bester, M. N., Lewis, M. N., Taylor, F. E., Campagna, C., & Kirkman,
S. P. 2004. Adult female survival, population trend, and the implications of early
primiparity in a capital breeder, the southern elephant seal (Mirounga leonina). Journal
of Zoology. 263(2): 107–119.
Pistorius, P. a., Follestad, A., & Taylor, F. E. 2006. Declining winter survival and fitness
implications associated with latitudinal distribution in Norwegian Greylag Geese Anser
anser. Ibis. 148(1): 114–125.
Poussart, C., Larochelle, J., & Gauthier, G. 2000. The thermal regime of eggs during
laying and incubation in Greater Snow Geese. Condor. 102(2): 292–300.
Prop, J., Black, J. M., & Shimmings, P. 2003. Travel schedules to the high arctic:
barnacle geese trade-off the timing of migration with accumulation of fat deposits.
Oikos. 103(2): 403–414.
R Core Team. 2013. R: A language and environment for statistical computing. R
Foundation for Statistical Computing, Vienna, Austria. ISBN 3-900051-07-0, URL
http://www.R-project.org/
Raveling, D.G. 1979. The annual cycle of body composition of Canada geese with special
reference to control of reproduction. The Auk. 96: 234-252.
Reed, A. 1973. Geese, nutrition and farm land. Wildfowl Ecology Symposium. 27: 153-
156.
Sedinger, J.S. 1992. Ecology of prefledging waterfowl. In: Ecology and Management of
Breeding Waterfowl (eds Batt BDJ, Afton AD, Anderson MG et al.), pp. 109–127.
University of Minnesota Press, Minneapolis, USA.

27
Summers, R. & Underhill, L. 1987. Factors related to breeding production of Brent
Geese Branta b. bernicla and waders (Charadrii) on the Taimyr Peninsula. Bird Study.
34(2): 161-171.
Sutherland, W.J. 1996. From individual behaviour to population ecology. – Oxford
University Press. Oxford.
Sutherland, W. J. 2001. Sustainable exploitation : a review of principles and methods.
Wildlife Biology. 7(3): 131–140.
Swann, B. (R. L. ., Brockway, I. K., Frederiksen, M., Hearn, R. D., Mitchell, C. R., &
Sigfússon, A. 2005. Within-winter movements and site fidelity of Icelandic Greylag
Geese Anser anser. Bird Study. 52(1): 25–36.
Sæther, B.-E., Ringsby, T.H. & Røskaft, E. 1996. Life history variation, population
processes and priorities in species conservation: towards a reunion of research
paradigms. Oikos. 77: 217–226.
Traylor, J.J. & R.T. Alisauskas. 2006. Effects of intrinsic and extrinsic factors on
survival of white-winged scoter (Melanitta fusca deglandi) ducklings. Auk. 123: 67-81.
The Environment Agency of Iceland. 2014. Veiðitölur. Retrieved from
http://ust.is/einstaklingar/veidi/veiditolur/
Walker, M. D., Wahren, C. H., Hollister, R. D., Henry, G. H. R., Ahlquist, L. E.,
Alatalo, J. M., … Wookey, P. A. 2006. Plant community responses to experimental
warming across the tundra biome. Proceedings of the National Academy of Sciences of
the United States of America. 103(5), 1342–6.
Walter, SE. & Rusch, DH. 1997. Accuracy of egg flotation in determining age of Canada
goose nests. Wildlife Society Bulletin. 25(4): 854-857.
Westerskov, K. 1950. Methods for determining the age of game bird eggs. The Journal of
Wildlife Management. 14(1): 56–67.
Young, J. G. 1972. Breeding biology of feral Greylag Geese in south-west
Scotland. Wildfowl. 23(23): 5.
Öst, M., Smith, B.D. & Kilpi, M. 2008. Social and maternal factors affecting duckling
survival in eiders (Somateria mollissima). Journal of Animal Ecology. 77: 315-325.

28
Figures
Figure 1. Location of study areas and nest sampling locations. The elypses show the areas where surveys of
broods were performed. West Iceland (Vertical symbols), South Iceland (Horizontal symbols), North Iceland
(Square hatching symbols) and East Iceland (Diagonal symbols).The large non sampled area in the southeast
of Iceland is dominated by sparsely vegetated glacial sand plains. Locations of nests that were sampled are
marked with circles.

29
n=39 n=82
n=30 n=26
n=23 n=52
n=67
n=41
0
1
2
3
4
5
6
WestIceland
SouthIceland
EastIceland
NorthIceland
Clu
tch
siz
e
(a)
2012
2013
n=39 n=82
n=30
n=26
n=23 n=52
n=40
100
105
110
115
120
125
130
135
140
145
WestIceland
SouthIceland
EastIceland
NorthIceland
Est.
sSta
rt o
f in
cub
atio
n
(b)
2012
2013
n=39 n=82
n=30
n=23 n=52
n=41
0
100
200
300
400
500
600
700
800
900
WestIceland
SouthIceland
EastIceland
NorthIceland
Clu
tch
Vo
lum
e (c
m³)
(c)
2012
2013
n=93
n=143
n=152
n=18 n=102
n=134 n=158
n=88
0
1
2
3
4
5
6
WestIceland
SouthIceland
EastIceland
NorthIceland
Bro
od
siz
e
(d)
2012
2013
n=175
n=275
n=124
n=120
n=256 n=186
81,5
82,0
82,5
83,0
83,5
84,0
84,5
85,0
85,5
86,0
WestIceland
SouthIceland
EastIceland
NorthIceland
Len
gth
(m
m)
(e)
2012
2013
n=175
n=275
n=124
n=120
n=256
n=186
56,0
56,5
57,0
57,5
58,0
58,5
WestIceland
SouthIceland
EastIceland
NorthIceland
Wid
th (
mm
)
(f)
2012
2013
Figure 2. Annual and between area variation in mean (±se) (a) clutch size, (b) estimated start of incubation, (c)
clutch volume, (d) brood size, (e) length of eggs and (f) width of eggs. White columns indicate values for 2012
and black columns indicate values for 2013. East Iceland lacks data in b,c,e and f for 2013 and was therefore not
included. See Fig 1.for research area locations and details and Table 1 for n values.

30
Figure 3. Annual and between area variation in mean temperature (±se) in april for the two sample years.
Meteorological data from closest weather station to corresponding researh area (Icelandic Met Office, 2014).
Names of the weather stations are given in parentheses.
-2
-1
0
1
2
3
4
5
West Iceland(Stykkishólmur)
South Iceland (Hella) East Iceland(Egilsstaðir)
North Iceland(Akureyri)
Tem
per
atu
re (
C°)
2012
2013
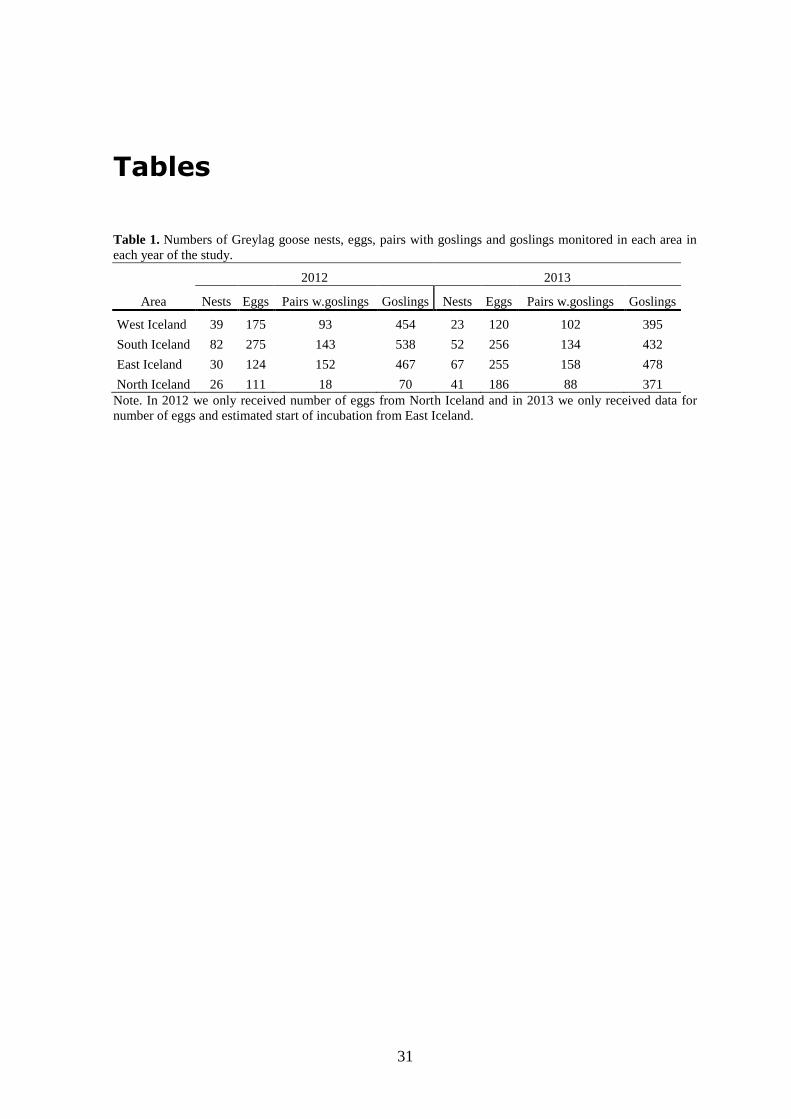
31
Tables
Table 1. Numbers of Greylag goose nests, eggs, pairs with goslings and goslings monitored in each area in
each year of the study.
Area
2012 2013
Nests Eggs Pairs w.goslings Goslings Nests Eggs Pairs w.goslings Goslings
West Iceland 39 175 93 454 23 120 102 395
South Iceland 82 275 143 538 52 256 134 432
East Iceland 30 124 152 467 67 255 158 478
North Iceland 26 111 18 70 41 186 88 371
Note. In 2012 we only received number of eggs from North Iceland and in 2013 we only received data for
number of eggs and estimated start of incubation from East Iceland.

32
Table 2. Results of ANOVA models of annual and between area
variation in components of productivity of Greylag Geese in
Iceland, between 2012 and 2013.
Area Year Area*Year
Clutch size F 6.127 0.119 1.135
df 3 1 3
p <0.001 0.73 0.335
Length (mm) F 3.570 1.630 13.429
df 3 1 1
p 0.0136 0.203 <0.001
Width (mm) F 2.733 1.626 4.592
df 3 1 1
p 0.0426 0.203 0.0323
Clutch Volume
(cm³)
F 1.242 1.242 0.833
df 3 3 1
p 0.295 0.295 0.362
Est. Start of
incubation
F 133.600 0.247 0.26
df 3 1 2
p <0.001 0,62 0.771
Brood size F 22.640 5.296 3.579
df 3 1 3
p <0.001 0.0216 0.0136
Note. See Table 1 for details on sample sizes.

33
Table 3. Results of Welch two sample t-test exploring annual
variation in components of productivity of Greylag Geese in Iceland,
between 2012 and 2013, in study areas.
West
Iceland
South
Iceland
East
Iceland
North
Iceland
Clutch size t -1,971 -0,345 1,106 -0,703
df 58,96 109,42 71,37 40,84
p 0,053 0,731 0,272 0,486
Length (mm) t -3,178 1,889
df 279,21 528,97
p 0,002 0,059
Width (mm) t -1,094 2,210
df 254,22 517,27
p 0,275 0,028
Clutch Volume
(cm³) t -2,010 -0,724
df 56,36 103,57
p 0,049 0,471
Est. Start of
incubation t -0,893 -0,319 0,412
df 38,27 128,41 45,47
p 0,378 0,750 0,682
Brood size t 3,303 2,404 0,290 -0,569
df 180,83 266,66 305,31 29,26
p 0,001 0,017 0,772 0,574
Note. See Table 1 for details on sample sizes.

34
Apendix
Apendix 1. Locations of areas visited, measured components and number of nests sampled in 2012.
Area Year Location name GPS location # nests measured Clutch
size
Length
(mm)
Width
(mm)
Flotation
test date
West Iceland 2012 Elliðaey, Breiðafjörður N65 08.715 W22 48.492 18 x x x x 3.5.2012
West Iceland 2012 Þormóðsey, Breiðafjörður N65 04.032 W22 54.393 18 x x x x 4.5.2012
West Iceland 2012 Bænhúshólmi, Breiðafjörður N65 04.220 W22 45.418 3 x x x x 4.5.2012
South Iceland 2012 Auðsholt, Ölfusá N63 56.382 W21 10.268 30 x x x x 9.5.2012 & 21.5.2012
South Iceland 2012 Landeyjar, Hvítá N64 00.166 W20 51.114 9 x x x x 15.5.2012
South Iceland 2012 Bolholtsey, Ytri Rangá N63 53.555 W20 15.529 36 x x x x 16.5.2012
North Iceland 2012 Víkingavatn, Öxarfjörður N66 06.081 W16 50.073 30 x
x 28.5.2012
East Iceland 2012 Hrafnabjörg/Hallgeirsstaðir, Hróarstunga N65 28.860 W14 35.256 9 x x x x 9.5.2012 & 17.5.2012
East Iceland 2012 Galtastaðir/Hrærekslækur, Hróarstunga N65 39.281 W14 20.760 9 x x x x 9.6.2012
East Iceland 2012 Litli Bakki, Hróarstunga N65 30.337 W14 31.532 8 x x x x 7.6.2012
East Iceland 2012 Dratthalastaðir, Hróarstunga N65 32.603 W14 19.859 4 x x x x 9.6.2012
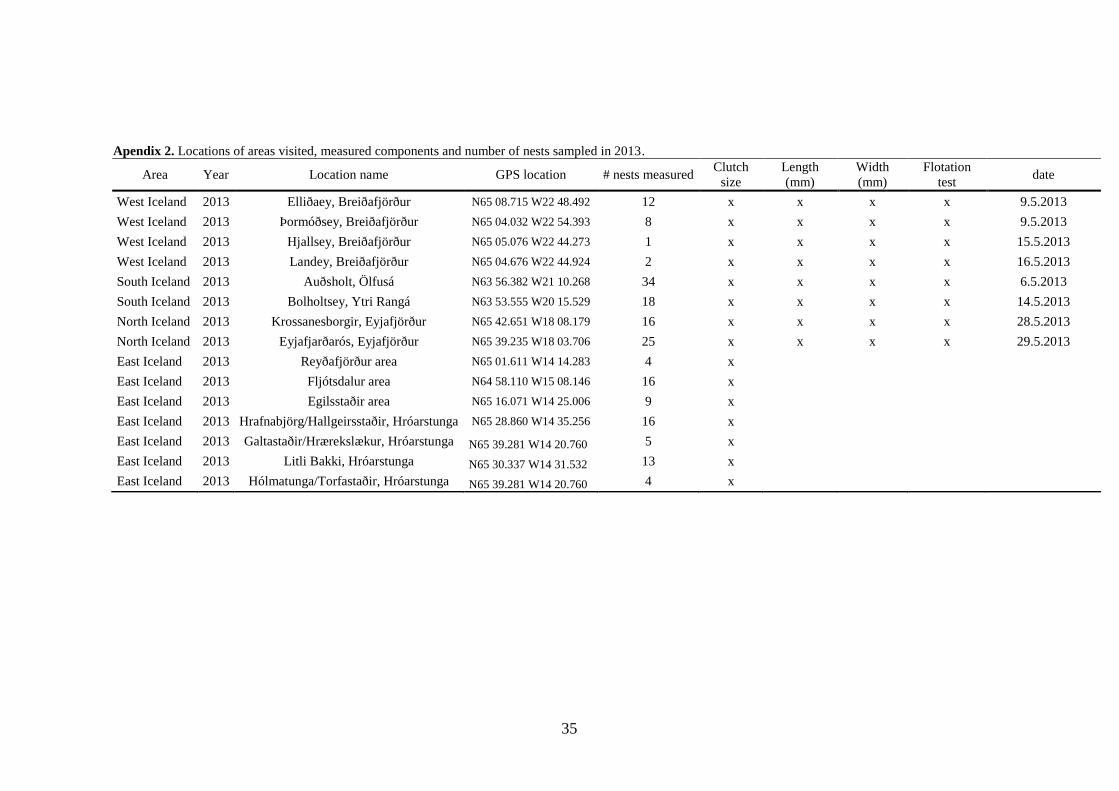
35
Apendix 2. Locations of areas visited, measured components and number of nests sampled in 2013.
Area Year Location name GPS location # nests measured Clutch
size
Length
(mm)
Width
(mm)
Flotation
test date
West Iceland 2013 Elliðaey, Breiðafjörður N65 08.715 W22 48.492 12 x x x x 9.5.2013
West Iceland 2013 Þormóðsey, Breiðafjörður N65 04.032 W22 54.393 8 x x x x 9.5.2013
West Iceland 2013 Hjallsey, Breiðafjörður N65 05.076 W22 44.273 1 x x x x 15.5.2013
West Iceland 2013 Landey, Breiðafjörður N65 04.676 W22 44.924 2 x x x x 16.5.2013
South Iceland 2013 Auðsholt, Ölfusá N63 56.382 W21 10.268 34 x x x x 6.5.2013
South Iceland 2013 Bolholtsey, Ytri Rangá N63 53.555 W20 15.529 18 x x x x 14.5.2013
North Iceland 2013 Krossanesborgir, Eyjafjörður N65 42.651 W18 08.179 16 x x x x 28.5.2013
North Iceland 2013 Eyjafjarðarós, Eyjafjörður N65 39.235 W18 03.706 25 x x x x 29.5.2013
East Iceland 2013 Reyðafjörður area N65 01.611 W14 14.283 4 x
East Iceland 2013 Fljótsdalur area N64 58.110 W15 08.146 16 x
East Iceland 2013 Egilsstaðir area N65 16.071 W14 25.006 9 x
East Iceland 2013 Hrafnabjörg/Hallgeirsstaðir, Hróarstunga N65 28.860 W14 35.256 16 x
East Iceland 2013 Galtastaðir/Hrærekslækur, Hróarstunga N65 39.281 W14 20.760 5 x
East Iceland 2013 Litli Bakki, Hróarstunga N65 30.337 W14 31.532 13 x
East Iceland 2013 Hólmatunga/Torfastaðir, Hróarstunga N65 39.281 W14 20.760 4 x

36
Apendix 3. Locations and number of geese per site in gosling surveys of 2012-2013.
Area Year Location name GPS location Pairs with
goslings
Total
goslings
Total
geese Gosling/Adult date
South Iceland 2013 Stokkseyri N63 49.599 W20 59.579 0 0 9 0,000 13.6.2013
Auðsholt (Ölfusá) N63 56.512 W21 10.255 3 10 56 0,179 13.6.2013
Tannastaðir (Ölfusá) N63 58.734 W20 58.934 24 77 231 0,333 13.6.2013
Vaðnes (Hvítá) N64 00.225 W20 51.542 17 55 201 0,274 13.6.2013
Auðsholt (Ölfusá) N63 56.512 W21 10.255 10 34 74 0,459 9.7.2013
Tannastaðir (Ölfusá) N63 58.734 W20 58.934 17 56 418 0,134 9.7.2013
Vaðnes (Hvítá) N64 00.225 W20 51.542 30 110 279 0,394 9.7.2013
Auðsholt (Ölfusá) N63 56.512 W21 10.255 6 22 87 0,253 6.8.2013
Tannastaðir (Ölfusá) N63 58.734 W20 58.934 4 16 138 0,116 6.8.2013
Vaðnes (Hvítá) N64 00.225 W20 51.542 23 52 176 0,295 6.8.2013
West Iceland 2013 Vatn við Esjurætur (Kollafjörður) N64 12.162 W21 42.479 6 32 88 0,364 20.6.2013
Útkot (Hvalfjörður) N64 17.196 W21 48.811 1 1 25 0,040 20.6.2013
Laxárnes (Hvalfjörður) N64 19.909 W21 37.909 1 3 11 0,273 20.6.2013
Kalastaði (Hvalfjörður) N64 23.867 W21 40.957 3 12 76 0,158 20.6.2013
Lækjarnestangi (Grunnafjörður) N64 23.823 W21 52.210 1 3 7 0,429 20.6.2013
Hvítááreyrar (Borgarfjörður) N64 31.886 W21 47.532 2 6 103 0,058 20.6.2013
Grímstaðarvatn (Borgarfjörður) N64 34.936 W21 42.986 2 9 21 0,429 20.6.2013
Vík v.seinni tanga (Vigrafjörður) N65 01.420 W22 44.463 0 0 59 0,000 20.6.2013
Vogsbotn (v. Stykkishólm) N65 03.228 W22 45.953 3 9 30 0,300 20.6.2013
Berserkseyri (Hraunsfjörður) N64 57.579 W23 04.139 7 18 48 0,375 20.6.2013
Vestravík (Hvalfjörður) N64 19.177 W21 53.006 2 6 16 0,375 20.6.2013
Hraunsfjörður (Snæfellsnesi) N64 57.096 W23 00.847 2 13 25 0,520 13.6.2013
Brjánslækur (Vatnsfjörður) - Breiðafjörður N65 31.786 W23 11.696 3 6 18 0,333 28.6.2013
Vatnsfjörður (Breiðafjörður) N65 34.104 W23 09.345 2 9 17 0,529 28.6.2013
Fossá, nesið milli Vatnsfjarðar og Kjálkafjarðar N65 32.367 W23 03.410 0 0 64 0,000 28.6.2013
Tjörnin við Kolgrafarfj. Brúna (Kolgrafarfjörður) N64 57.502 W23 05.467 0 1 3 0,333 1.7.2013

37
Kolgrafir (Kolgrafarfjörður) N64 57.502 W23 05.467 1 4 43 0,093 1.7.2013
Berserkseyri (Hraunsfjörður) N64 57.579 W23 04.139 0 0 23 0,000 1.7.2013
Vogsbotn v. Stykkishólm (Vogsbotn) N65 03.078 W22 45.581 2 5 9 0,556 3.7.2013
Vatn við Esjurætur (Kollafjörður) N64 12.162 W21 42.479 9 38 102 0,373 17.7.2013
Útkot (Hvalfjörður) N64 17.196 W21 48.811 0 0 7 0,000 17.7.2013
Kalastaðir (Hvalfjörður) N64 19.909 W21 37.909 0 0 16 0,000 17.7.2013
Hvítáreyrar (Borgarfjörður) N64 31.886 W21 47.532 3 11 228 0,048 17.7.2013
Hólsvatn (Borgarfjörður) N64 30.851 W22 07.074 0 0 400 0,000 17.7.2013
Berserkseyri (Hraunsfjörður) N64 57.579 W23 04.139 9 32 68 0,471 17.7.2013
Kúludalsá II (Hvalfjörður) N64 19.177 W21 53.006 7 21 127 0,165 17.7.2013
Vatn við Esjurætur (Kollafjörður) N64 12.162 W21 42.479 3 14 23 0,609 12.8.2013
Pollur v. Esjuveg (lækur f.n. Ljárdal) N64 13.388 W21 48.619 3 9 17 0,529 12.8.2013
Útkot (Hvalfjörður) N64 19.909 W21 37.909 2 4 18 0,222 12.8.2013
Hjarðarland (Hvalfjörður) N64 17.470 W21 49.522 3 13 95 0,137 12.8.2013
Laxárnes (Hvalfjörður) N64 20.059 W21 37.465 6 25 227 0,110 12.8.2013
Láxá í Kjós, tún N megin (Hvalfjörður) N64 20.613 W21 37.166 3 19 284 0,067 12.8.2013
Miðsandur (Hvalfjörður) N64 23.935 W21 27.982 0 0 19 0,000 12.8.2013
Kalastaðir (Hvalfjörður) N64 23.867 W21 40.957 1 6 8 0,750 12.8.2013
Láxár ós (Grunnafjörður) N64 23.287 W21 50.843 4 23 235 0,098 12.8.2013
Lækjarnestangi (Grunnafjörður) N64 23.700 W21 52.202 6 30 139 0,216 12.8.2013
Eyrar í Hvítá (Borgarfjörður) N64 31.881 W21 47.633 1 3 110 0,027 12.8.2013
Vík v.seinni tanga (Vigrafjörður) N65 01.420 W22 44.463 0 0 30 0,000 12.8.2013
Vogsbotn (v. Stykkishólm) N65 03.228 W22 45.953 0 0 19 0,000 12.8.2013
Berserkseyrará (Hraunsfjörður) N64 57.579 W23 04.139 2 10 22 0,455 12.8.2013
North Iceland 2013 Húseyjarkvísl (Varmahlíð) N65 33.220 W19 26.081 1 5 8 0,625 27.6.2013
Miklabær-Silfrastaðir (Héraðsvötn) N65 33.037 W19 21.505 5 13 42 0,310 27.6.2013
Stóra tjörn (Héraðsvötn) N65 26.266 W19 12.818 1 5 9 0,556 28.6.2013
Víkingavatn (Öxarfjörður) N66 06.085 W16 50.069 8 22 102 0,216 28.6.2013
Pollur v. N1 (Akureyri) N65 39.993 W18 04.936 7 30 58 0,517 28.6.2013

38
Pollur v. N1 (Akureyri) N65 39.821 W18 04.885 4 15 31 0,484 30.6.2013
Litli Garður v. Flugvöllinn (Eyjafjörður) N65 39.500 W18 04.809 4 18 34 0,529 30.6.2013
Hólmarnir (Eyjafjörður) N65 39.090 W18 03.541 1 5 11 0,455 30.6.2013
Brekkulækur (Eyjafjarðarós) N65 39.721 W18 02.412 7 36 80 0,450 30.6.2013
Fagranes (Blanda) N65 35.265 W20 04.351 1 8 13 0,615 30.6.2013
Blönduós (Blanda) N65 39.467 W20 17.167 9 69 167 0,413 30.6.2013
Blönduós (Blanda) N65 39.467 W20 17.167 13 51 410 0,124 23.7.2013
Pollur v. N1 (Akureyri) N65 39.993 W18 04.936 6 19 45 0,422 23.7.2013
Blönduós (Blanda) N65 39.467 W20 17.167 22 75 350 0,214 26.7.2013
East Iceland 2013 Fljótsbotn (Hérað) N65 04.465 W14 50.665 3 10
17.6.2013
Stóra Steinsvað (Hérað) N65 29.033 W14 21.115 1 5
20.6.2013
Hesteyrar (Hérað) N65 22.155 W14 22.949 1 4
20.6.2013
Laxárós (Hérað) N65 27.251 W14 38.414 4 13
30.6.2013
Skipalækur (Hérað) N65 16.789 W14 26.147 1 6
30.6.2013
Fljótsbotn (Hérað) N65 04.465 W14 50.665 11 32
12.7.2013
Hrafnkelsstaðir (Hérað) N65 03.070 W14 53.299 11 26
12.7.2013
Skriðuklaustur (Hérað) N65 02.421 W14 57.213 4 9
12.7.2013
Múli í Fljótsdal (Hérað) N64 57.711 W15 04.508 2 5
12.7.2013
Arnheiðarstaðir (Hérað) N65 07.682 W14 45.907 0 0
12.7.2013
Vallanes (Hérað) N65 12.700 W14 31.528 0 0
12.7.2013
Fljótsbakki (Hérað) N65 21.622 W14 23.541 1 3
12.7.2013
Vífilsnes (Hérað) N65 23.538 W14 24.411 17 49
12.7.2013
Ekra (Hérað) N65 31.353 W14 21.735 5 17
12.7.2013
Torftjörn (Hérað) N65 14.982 W14 23.958 1 1
12.7.2013
Selfljót - Hjaltastaðablá (Hérað) N65 34.705 W14 02.875 2 9
12.7.2013
Grímsárlón-Lundur (Hérað) N65 08.345 W14 32.232 3 10
13.7.2013
Hvanná-Hofteigur (Hérað) N65 22.057 W14 48.394 23 82
14.7.2013
Eyrar (Hérað) N65 17.513 W13 51.229 14 42
15.7.2013
Litli Bakki (Hérað) N65 30.337 W14 31.532 3 8
15.7.2013
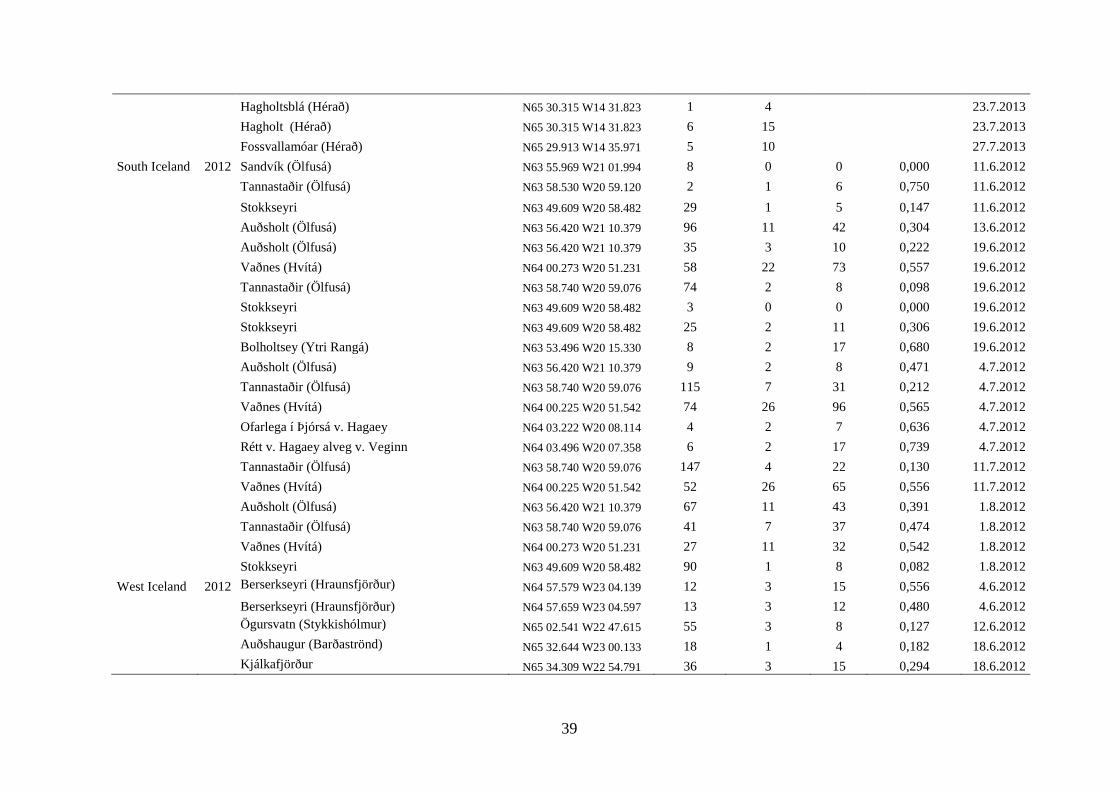
39
Hagholtsblá (Hérað) N65 30.315 W14 31.823 1 4
23.7.2013
Hagholt (Hérað) N65 30.315 W14 31.823 6 15
23.7.2013
Fossvallamóar (Hérað) N65 29.913 W14 35.971 5 10
27.7.2013
South Iceland 2012 Sandvík (Ölfusá) N63 55.969 W21 01.994 8 0 0 0,000 11.6.2012
Tannastaðir (Ölfusá) N63 58.530 W20 59.120 2 1 6 0,750 11.6.2012
Stokkseyri N63 49.609 W20 58.482 29 1 5 0,147 11.6.2012
Auðsholt (Ölfusá) N63 56.420 W21 10.379 96 11 42 0,304 13.6.2012
Auðsholt (Ölfusá) N63 56.420 W21 10.379 35 3 10 0,222 19.6.2012
Vaðnes (Hvítá) N64 00.273 W20 51.231 58 22 73 0,557 19.6.2012
Tannastaðir (Ölfusá) N63 58.740 W20 59.076 74 2 8 0,098 19.6.2012
Stokkseyri N63 49.609 W20 58.482 3 0 0 0,000 19.6.2012
Stokkseyri N63 49.609 W20 58.482 25 2 11 0,306 19.6.2012
Bolholtsey (Ytri Rangá) N63 53.496 W20 15.330 8 2 17 0,680 19.6.2012
Auðsholt (Ölfusá) N63 56.420 W21 10.379 9 2 8 0,471 4.7.2012
Tannastaðir (Ölfusá) N63 58.740 W20 59.076 115 7 31 0,212 4.7.2012
Vaðnes (Hvítá) N64 00.225 W20 51.542 74 26 96 0,565 4.7.2012
Ofarlega í Þjórsá v. Hagaey N64 03.222 W20 08.114 4 2 7 0,636 4.7.2012
Rétt v. Hagaey alveg v. Veginn N64 03.496 W20 07.358 6 2 17 0,739 4.7.2012
Tannastaðir (Ölfusá) N63 58.740 W20 59.076 147 4 22 0,130 11.7.2012
Vaðnes (Hvítá) N64 00.225 W20 51.542 52 26 65 0,556 11.7.2012
Auðsholt (Ölfusá) N63 56.420 W21 10.379 67 11 43 0,391 1.8.2012
Tannastaðir (Ölfusá) N63 58.740 W20 59.076 41 7 37 0,474 1.8.2012
Vaðnes (Hvítá) N64 00.273 W20 51.231 27 11 32 0,542 1.8.2012
Stokkseyri N63 49.609 W20 58.482 90 1 8 0,082 1.8.2012
West Iceland 2012 Berserkseyri (Hraunsfjörður) N64 57.579 W23 04.139 12 3 15 0,556 4.6.2012
Berserkseyri (Hraunsfjörður) N64 57.659 W23 04.597 13 3 12 0,480 4.6.2012
Ögursvatn (Stykkishólmur) N65 02.541 W22 47.615 55 3 8 0,127 12.6.2012
Auðshaugur (Barðaströnd) N65 32.644 W23 00.133 18 1 4 0,182 18.6.2012
Kjálkafjörður N65 34.309 W22 54.791 36 3 15 0,294 18.6.2012

40
Mjóafjörður N65 36.988 W22 50.910 14 0 0 0,000 18.6.2012
Kollafjörður N64 12.162 W21 42.479 9 0 0 0,000 18.6.2012
Reykhólar (tjörn við mastur) N65 26.682 W22 12.820 2 1 6 0,750 18.6.2012
Vatn við Esjurætur (Kollafjörður) N64 12.108 W21 42.518 47 9 38 0,447 7.6.2012
Hofsvík (Kjalarnes) N64 13.572 W21 48.807 12 3 7 0,368 7.6.2012
Vatn í botni hvalfjarðar N64 23.086 W21 21.226 22 2 16 0,421 7.6.2012
Vatn við Esjurætur (Kollafjörður) N64 12.108 W21 42.518 27 6 32 0,542 27.6.2012
Gröf (Hvalfjörður) N64 19.927 W21 50.725 68 3 14 0,171 27.6.2012
Galtarvík (Hvalfjörður) N64 20.326 W21 49.157 18 9 53 0,746 27.6.2012
Árdalur (Borgarfjörður) N64 31.788 W21 48.512 395 0 0 0,000 27.6.2012
Í mýri v. Árdal (Borgarfjörður) N64 31.923 W21 47.116 11 3 16 0,593 27.6.2012
Vatn við Esjurætur (Kollafjörður) N64 12.108 W21 42.518 41 16 82 0,667 17.7.2012
Botnsvogur (Hvalfjörður) N64 22.348 W21 24.265 4 2 8 0,667 17.7.2012
Botnsvogur N megin (Hvalfjörður) N64 23.325 W21 23.916 6 3 13 0,684 17.7.2012
Merkjalækur (Hvalfjörður) N64 24.053 W21 40.403 162 15 75 0,316 17.7.2012
Andakílsós (Borgarfjörður) N64 31.881 W21 47.633 14 3 18 0,563 17.7.2012
Galtarlækur (Hvalfjörður) N64 20.651 W21 48.081 12 5 22 0,647 17.7.2012
North Iceland 2012 Grjótáreyri (Hrútafjörður) N65 09.128 W21 03.725 0 0 62 0,000 8.8.2012
Hvalshöfði (Hrútafjörður) N65 10.815 W21 03.514 0 0 21 0,000 8.8.2012
Oddstaðaeyri (Hrútafjörður) N65 11.086 W21 03.870 1 6 22 0,273 8.8.2012
Miðfjarðará ós (Miðfjörður) N65 20.417 W20 53.849 0 0 90 0,000 8.8.2012
Miðfjarðarvatn (Miðfjörður) N65 21.043 W20 45.701 1 4 30 0,133 8.8.2012
Flaga (Vatnsdalsá) N65 26.480 W20 18.995 0 0 2 0,000 8.8.2012
Blönduós (Blanda) N65 39.485 W20 17.343 0 0 90 0,000 8.8.2012
Grafarvatn (Blönduós) N65 39.892 W20 13.895 0 0 29 0,000 8.8.2012
Strjúgsstaðir (Blanda) N65 34.537 W20 00.463 0 0 16 0,000 8.8.2012
Auðólfsstaðir (Blanda) N65 33.046 W19 56.154 3 21 205 0,102 8.8.2012
Ytri Húsabakki (Héraðsvötn) N65 36.634 W19 28.347 1 3 5 0,600 9.8.2012
Ytri Húsabakki (Héraðsvötn) N65 36.399 W19 27.503 1 6 8 0,750 9.8.2012

41
Glaumbæjareyja (Héraðsvötn) N65 36.835 W19 26.979 0 0 50 0,000 9.8.2012
Borgarey (Héraðsvötn) N65 37.211 W19 25.980 0 0 180 0,000 9.8.2012
Hamraborg (Héraðsvötn) N65 43.373 W19 31.837 0 0 22 0,000 9.8.2012
Helluland 3 (Héraðsvötn) N65 43.197 W19 31.790 0 0 3 0,000 9.8.2012
Helluland 3 (Héraðsvötn) N65 42.866 W19 31.865 0 0 25 0,000 9.8.2012
Garðsvatn (Héraðsvötn) N65 43.501 W19 27.191 0 0 116 0,000 9.8.2012
Garðsvatn (Héraðsvötn) N65 43.501 W19 27.191 0 0 72 0,000 9.8.2012
Ytra Gil (Eyjafjarðará) N65 37.448 W18 04.345 1 5 71 0,070 9.8.2012
Teigur (Eyjafjarðará) N65 36.493 W18 04.793 0 0 47 0,000 9.8.2012
Botn (Eyjafjarðará) N65 33.775 W18 05.605 0 0 49 0,000 9.8.2012
Stokkahlaðir E megin (Eyjafjarðará) N65 33.365 W18 05.881 0 0 10 0,000 9.8.2012
Espigrund (Eyjafjarðará) N65 32.771 W18 07.025 0 0 77 0,000 9.8.2012
Rútstaðir (Eyjafjarðará) N65 30.450 W18 08.452 0 0 19 0,000 9.8.2012
Brekkulækur (Eyjafjarðarós) N65 39.614 W18 02.715 9 21 193 0,109 9.8.2012
Rifkelsstaðir (Eyjafjarðará) N65 32.140 W18 06.525 1 4 145 0,028 9.8.2012
Note. We do not have locations of goose sightings in East Iceland in 2012.