Annual and CSR report 2018 - Cloud Object Storage
80
Annual and CSR report 2018
Transcript of Annual and CSR report 2018 - Cloud Object Storage

Annual and CSR report 2018
2 CSR report 2018MMG AS Finances 2018Group Finances 2018 Annual report 2018
Facts 2018
In 2018 Møller Mobility Group achieved one of its highest profits ever, despite the major changes and widespread uncertainty in the automotive industry.
The car industry is facing its biggest challenges in modern times. It is not only the technology that is developing with quantum leaps, but also the way we use cars. As a result, our customers’ needs and demands are also changing. For Møller Mobility Group, this means that we need to invest to prepare for a completely different reality in the future, while continuing to maintain profitability under pres-sure. Against this backdrop, we are very satisfied with the results for 2018.
The Group had a turnover of NOK 26.2 billion last year, which is a 7% decrease from the previous year. Profit before tax was NOK 880 million in 2018, also down from 2017, but still one of the best results in the company’s history.
The profit for 2018 reflects the overall developments in the Group’s main markets. Norway accounts for roughly three quar-ters of Møller’s business, and both Norway and Sweden saw total
car sales decrease by some 7%. In the Baltic markets, the Group strengthened its position, with increased sales and improved underlying profitability for the import and dealership operations combined.
2018 was a very special year, with both reduced volumes and pressure on margins. The transition to an electric fleet further accel-erated in 2018, and the suppliers were unable to meet the massive demand in Norway. In addition, introduction of the new emissions testing standard WLTP entailed a number of challenges for us last year. At the start of 2019, many Norwegian customers were on a wait-ing list for an electric car. A substantial proportion of them are waiting for the new Audi e-tron, which we will deliver this year.
While imports and sales of new cars declined in 2018, the profitability of used car sales and the aftersales market developed positively last year.
Contents
ANNUAL REPORT 2018
Corporate management: A car is no longer just a car 6
Executive Vice President Håvard Andersen: Møller Mobility
Group is actively shaping tomorrow’s transport solutions 8
Managing Director Mariann Hornnes: Møller Mobility Group
will be at the forefront of development 10
Report from Harald A. Møller 12
Report from Møller Bil AS 14
Report from Volkswagen Møller Bilfinans 16
Our sustainable social mission 19
Environment 20
Mobility 21
Employees 22
Møller Medvind: Opening doors to work for young people 23
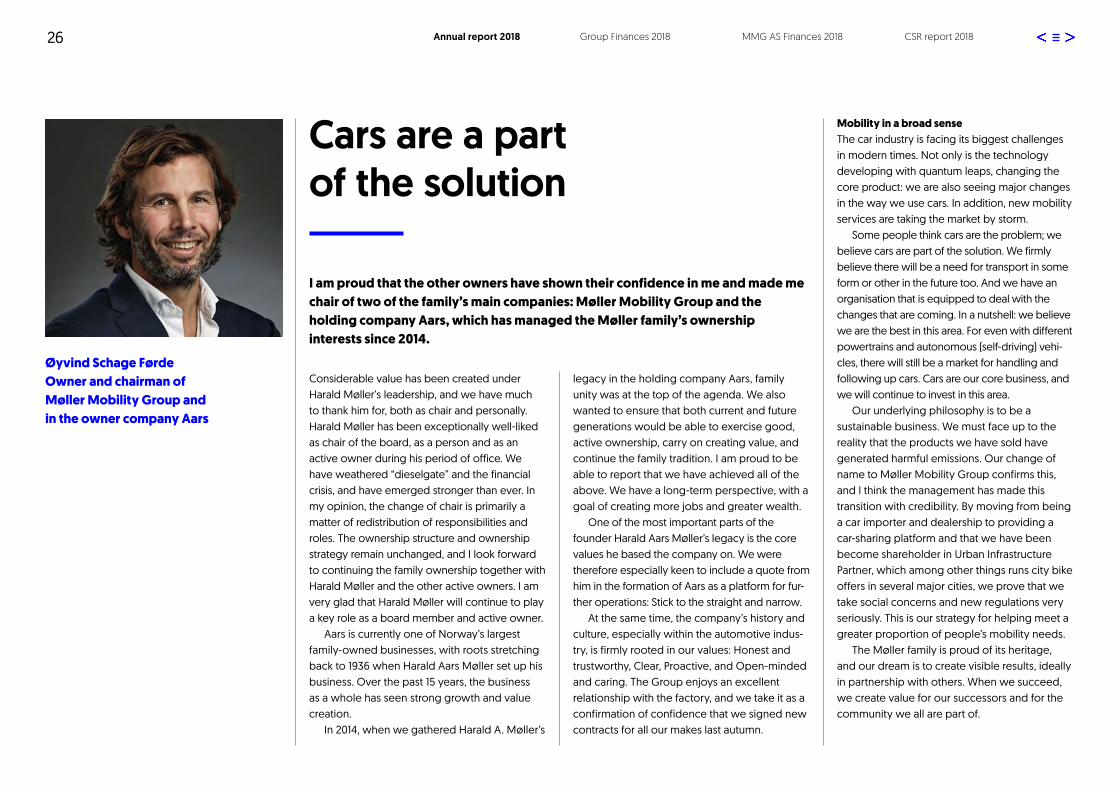
Owner and chairman Øyvind Schage Førde:
Cars are a part of the solution 26
Key figures 2018–2014 27
Board of Directors’ Report 28
MØLLER MOBILITY GROUP CONSOLIDATED
FINANCIAL STATEMENT 34
MØLLER MOBILITY GROUP FINANCIAL STATEMENTS 52
Auditor’s Report 63
CSR REPORT 2018 65
Environment 68
Mobility 72
Employees 73
Society 78
0
5 000
10 000
15 000
20 000
25 000
30 000
2010 2011 2012 2013 2014 2015 2016 2017 20180100200300400500600700800900100011001200
Financial results 2010 – 2018
Operating revenue
Profit before tax

3 CSR report 2018MMG AS Finances 2018Group Finances 2018 Annual report 2018
Møller Mobility Group is a family-owned group involved in the import, sale, servicing and financing of Volkswagen, Audi, Škoda and SEAT cars. The company is represented in Norway, Sweden, Estonia, Latvia and Lithuania.
Møller Mobility Group
Car ImportsHarald A. Møller AS is Norway’s largest car importer. The company is responsible for import-ing, distributing and servicing Volkswagen, Audi, Škoda and SEAT cars in Norway. Close to one in every four new cars sold in Norway has been imported by Harald A. Møller AS.
Møller Baltic Import SE imports Volkswagen into Estonia, Latvia and Lithuania, and Audi into Latvia and Lithuania.
Car DealersMøller Mobility Group has a total of 67 car dealers in Norway, Sweden, Estonia, Latvia and Lithuania. Møller Bil Norge is Norway’s larg-est car dealer chain and has 42 dealers and 11 specialised repair workshops throughout the country. Møller Bil Sverige is Sweden’s second largest Volkswagen, Audi, Škoda and Seat dealer group and has a total of 12 sales outlets in central Sweden. Møller Auto Baltic has 13 sales outlets in Estonia, Latvia and Lithuania.
Financial ServicesVolkswagen Møller Bilfinans AS is jointly owned by Møller Mobility Group (49%) and Volks-wagen Financial Services AG (51%). The company offers loans, leasing and insurance linked to the respective brands’ sales of new and used cars. Volkswagen Møller Bilfinans is Norway’s largest leasing company and a fully integrated part of the Volkswagen, Audi, Škoda and SEAT value chain in Norway.
Key figures2018
4,260> Employees in Norway, Sweden, Estonia,
Latvia and Lithuania
26.2> Turnover for the year
(NOK billions)
880> Result before taxes
(NOK millions)
53,956> Cars imported. All brands in all our
markets
41,974> Number of new cars sold by Møller Bil
29,355> Number of used cars sold by Møller Bil
Møller Mobility Group
Car DealersCar Imports Financial Services

CSR report 2018MMG AS Finances 20184 Group Finances 2018 Annual report 2018
Value we createSociety• Sustainable mobility solutions• Local value creation• Employment
Customers• Quality• Sustainable options and choices
Employees• Meaningful work• Development opportunities• Equality and diversity
Owners• Long-term value creation• Return on operations• Power to invest in sustainability
Value creation at Møller Mobility Group
Strategic
Integrated strategy, optimum value chain, financial resources, ability to invest, sc
alabl
e bu
sines
s m
od
ell MILJØ MEDARBEIDERE
MOBILITET
MILJØ
MEDMENNESKER
Operational
MILJØ EMPLOYEES
MOBILITY
ENVIRONMENT
SOCIETYFlexibility, expertise, sustainable products, focus on health
and
safe
ty
Solid foundationOur foundation• Long-term ownership• Financial strength
Business• Largest auto organisation
in the Nordics• Leading car makes• The factory
Our culture• Integrated core values• Expertise
Society• Sustainable mobility• Responsible employer• Addressing the megatrends
Bold ambitions• We develop tomorrow’s mobility
services• Our goal is to be biggest and best in
our markets
Business goals – The RACE:• Reduce risk and cost• Add new revenues• Create new mobility services• Establish strong digital presence
Our commitment to sustainabilityMøller Mobility Group will contribute to a sustainable society. Through new, sustainable mobility solutions and targeted environmental work, we will contribute to a greener everyday life for everyone.
Business drivers
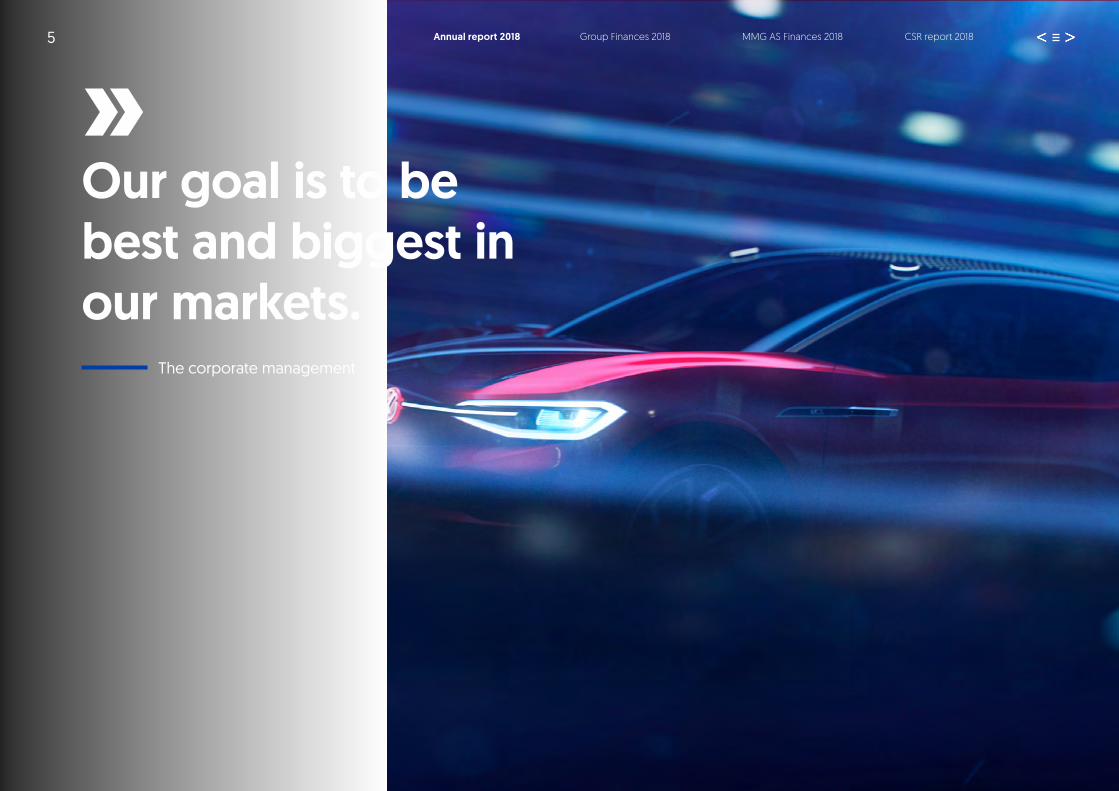
5
Our goal is to be best and biggest in our markets.
»
The corporate management
CSR report 2018MMG AS Finances 2018Group Finances 2018 Annual report 2018

6 CSR report 2018MMG AS Finances 2018Group Finances 2018 Annual report 2018
The Group had a turnover of NOK 26.2 billion last year, which is a 7% decrease from the previous year. Profit before tax was NOK 880 million in 2018, also down from 2017, but still one of the best results in the company’s history.
The car industry is facing its biggest challenges in modern times. Not only is the technology developing with quantum leaps, changing the core product: we are also seeing major changes in the way we use cars. In addition, new mobility services are taking the market by storm. As a result, our customers’ needs and demands are also changing. For Møller Mobility Group, this means that we need to invest to prepare for a completely different reality in the future, while the profitability of our traditional operations is under pressure.
2018 was a very special year, with both reduced volumes and pressure on margins. The transition to an electric fleet further accelerated in 2018, and the suppliers were unable to meet the massive demand. In addition, introduction of the new emissions testing standard WLTP entailed a number of challenges for us.
While imports and sales of new cars declined in 2018, the profitability of used car sales and the aftersales market developed positively. The decline in sales was met promptly with effec-tive measures to rein in the Group’s costs, after several years of cost growth. This has had a major impact on the bottom line. Total under-lying operating costs in Norway were reduced by 4% compared with 2017. At the same time, the Group invested in digitalisation, new mobility solutions and the launch of SEAT. A major feature of the new SEAT line is that the entire purchasing process takes place online. This has entailed a lot of learning about exciting new sales processes.
The Group’s financing activities saw a moder-ate improvement in results last year and deliv-ered the best operating profit in the company’s history. Overall, last year’s results were the fourth best result in the Group’s history – a feat we are very proud of.
New services in the offingMøller Mobility Group, the largest auto group in the Nordic region, is now implementing a strategy whereby 30% of the revenues from the Group’s traditional operations are to be replaced by revenue from new services by 2030. This requires extensive investments in digitali-sation, major changes to the business model, and development of new meeting places for customer service. The strategy also includes introduction of brand new services, such as the launch of the car-sharing scheme Hyre and investment in Urban Infrastructure Partner.
These investments give Møller Mobility Group a far greater reach as a mobility provider, while helping further develop our mobility strategy. We are satisfied that we are now represented in two leading environments, both of which will
In 2018 Møller Mobility Group achieved one of its highest profits ever, despite the major changes and widespread uncertainty in the automotive industry.
A car is no longer just a car
be active in shaping the sustainable mobility solutions of the future.
Solid positionA solid financial status and strong market posi-tions mean we are able to take a leading role in the enormous upheavals that the car industry is undergoing. Møller Mobility Group still enjoys a very strong overall market position in Norway.
We believe that total car sales in our markets will remain stable in 2019, and that the transition to electric cars will continue. More than half of the new cars sold in the Norwegian market this year will probably be emissions-free. We expect increased sales as a result of the launch of new models, such as the Audi e-tron, leading to strengthened market shares in 2019. The expected total market in Norway is 150,000 pas-senger cars and 36,000 commercial vehicles.
In Sweden we experienced a moderate weakening in 2018, but it is still an interesting car market. The expected total market is 335,000 passenger cars. In the Baltics we expect further growth from the 2018 level. In summary, we are very optimistic about both 2019 and 2020.
We are proud of our partnership with the world’s leading auto supplier. The Volkswagen Group is investing enormous sums in the mobil-ity services of the future, and we are looking forward to a wide range of exciting launches in the next few years.
Our strategic focus areas remain unchanged. As always, customer satisfaction is at the top of the agenda; we are going to be market leader in chargeable cars, and we will continue to implement our “RACE” strategy.
A car is no longer just a car. Tomorrow’s mobil-ity solutions are here, and Møller Mobility Group is going to be a driving force in this development.
Corporate management by CFO Anna Nord Bjercke

CSR report 2018MMG AS Finances 20187 Group Finances 2018 Annual report 2018
We are serious about our ambitions of offering our customers smart mobility solutions as well as physical products.
»
Håvard Andersen Executive Vice President Strategy And Business Development
8 CSR report 2018MMG AS Finances 2018Group Finances 2018 Annual report 2018
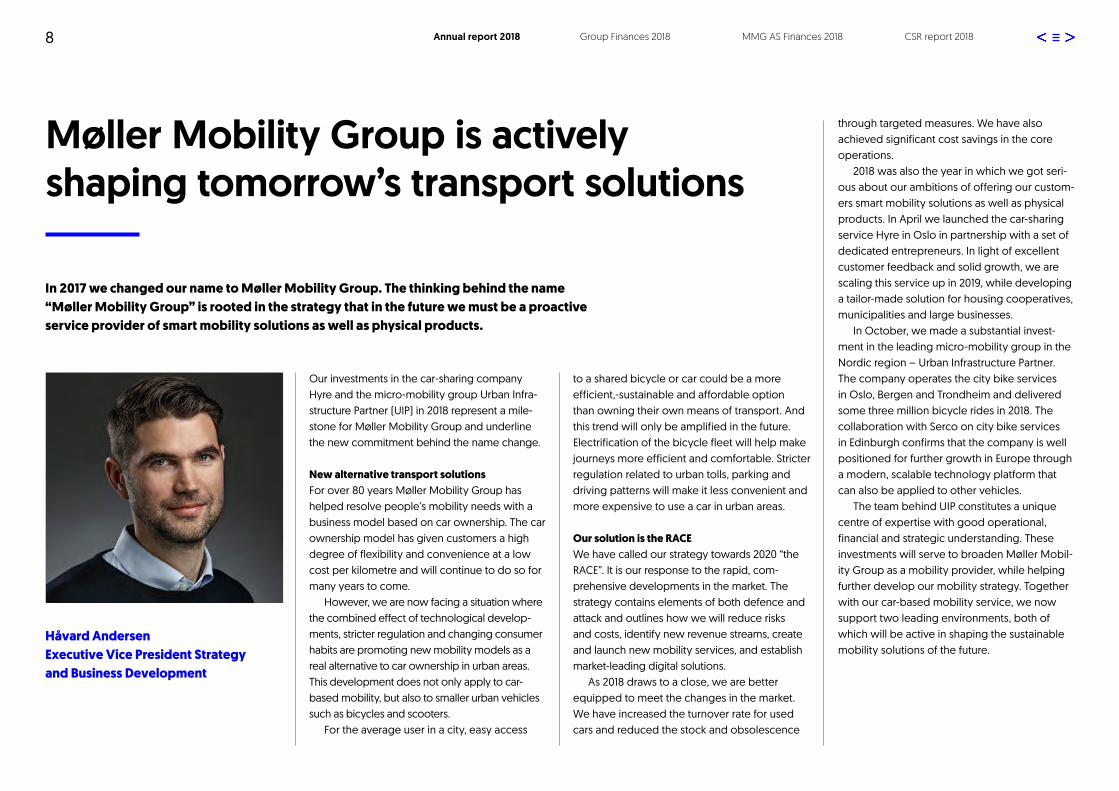
In 2017 we changed our name to Møller Mobility Group. The thinking behind the name “Møller Mobility Group” is rooted in the strategy that in the future we must be a proactive service provider of smart mobility solutions as well as physical products.
Møller Mobility Group is actively shaping tomorrow’s transport solutions
Our investments in the car-sharing company Hyre and the micro-mobility group Urban Infra-structure Partner (UIP) in 2018 represent a mile-stone for Møller Mobility Group and underline the new commitment behind the name change.
New alternative transport solutionsFor over 80 years Møller Mobility Group has helped resolve people’s mobility needs with a business model based on car ownership. The car ownership model has given customers a high degree of flexibility and convenience at a low cost per kilometre and will continue to do so for many years to come.
However, we are now facing a situation where the combined effect of technological develop-ments, stricter regulation and changing consumer habits are promoting new mobility models as a real alternative to car ownership in urban areas. This development does not only apply to car-based mobility, but also to smaller urban vehicles such as bicycles and scooters.
For the average user in a city, easy access
to a shared bicycle or car could be a more efficient,-sustainable and affordable option than owning their own means of transport. And this trend will only be amplified in the future. Electrification of the bicycle fleet will help make journeys more efficient and comfortable. Stricter regulation related to urban tolls, parking and driving patterns will make it less convenient and more expensive to use a car in urban areas.
Our solution is the RACE We have called our strategy towards 2020 “the RACE”. It is our response to the rapid, com-prehensive developments in the market. The strategy contains elements of both defence and attack and outlines how we will reduce risks and costs, identify new revenue streams, create and launch new mobility services, and establish market-leading digital solutions.
As 2018 draws to a close, we are better equipped to meet the changes in the market. We have increased the turnover rate for used cars and reduced the stock and obsolescence
through targeted measures. We have also achieved significant cost savings in the core operations.
2018 was also the year in which we got seri-ous about our ambitions of offering our custom-ers smart mobility solutions as well as physical products. In April we launched the car-sharing service Hyre in Oslo in partnership with a set of dedicated entrepreneurs. In light of excellent customer feedback and solid growth, we are scaling this service up in 2019, while developing a tailor-made solution for housing cooperatives, municipalities and large businesses.
In October, we made a substantial invest-ment in the leading micro-mobility group in the Nordic region – Urban Infrastructure Partner. The company operates the city bike services in Oslo, Bergen and Trondheim and delivered some three million bicycle rides in 2018. The collaboration with Serco on city bike services in Edinburgh confirms that the company is well positioned for further growth in Europe through a modern, scalable technology platform that can also be applied to other vehicles.
The team behind UIP constitutes a unique centre of expertise with good operational, financial and strategic understanding. These investments will serve to broaden Møller Mobil-ity Group as a mobility provider, while helping further develop our mobility strategy. Together with our car-based mobility service, we now support two leading environments, both of which will be active in shaping the sustainable mobility solutions of the future.
Håvard AndersenExecutive Vice President Strategy and Business Development

CSR report 2018MMG AS Finances 20189 Group Finances 2018 Annual report 201899
The most effective solutions for easy mobility, expressed as MOVE.
»
Mariann Hornnes Managing Director Møller Digital
CSR report 2018MMG AS Finances 2018Group Finances 2018 Annual report 2018
CSR report 2018MMG AS Finances 201810 Group Finances 2018 Annual report 2018
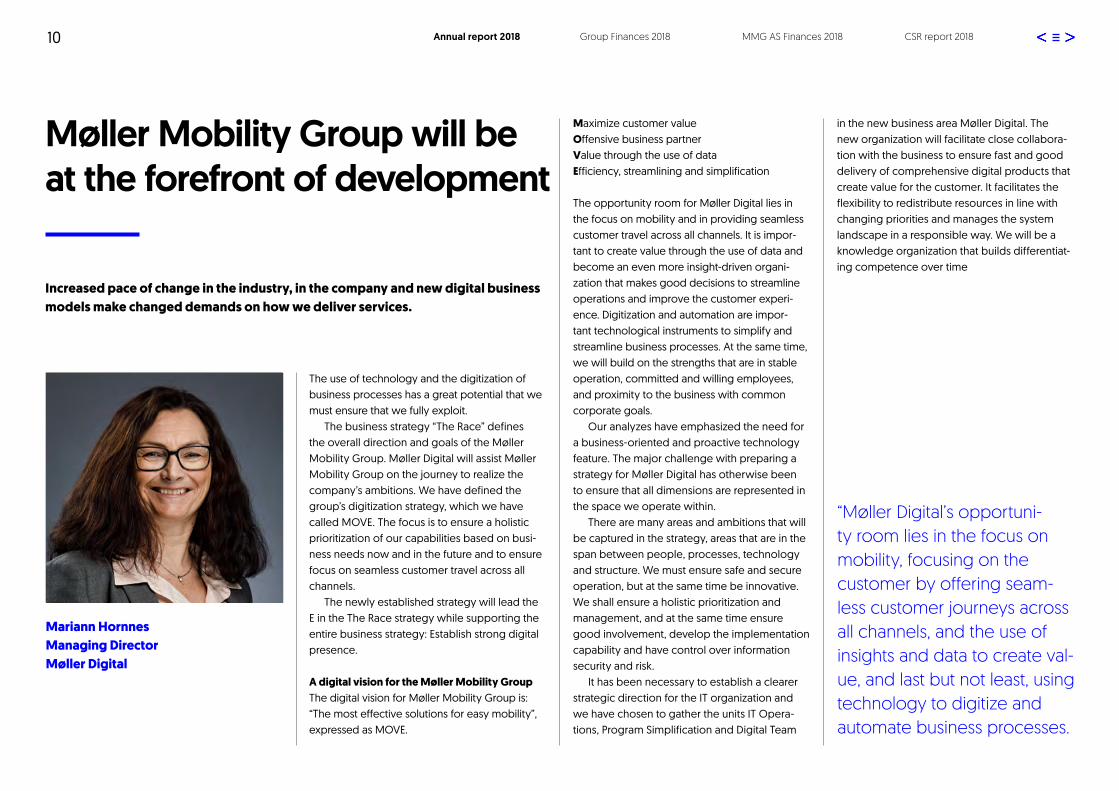
Mariann HornnesManaging Director Møller Digital
The use of technology and the digitization of business processes has a great potential that we must ensure that we fully exploit.
The business strategy “The Race” defines the overall direction and goals of the Møller Mobility Group. Møller Digital will assist Møller Mobility Group on the journey to realize the company’s ambitions. We have defined the group’s digitization strategy, which we have called MOVE. The focus is to ensure a holistic prioritization of our capabilities based on busi-ness needs now and in the future and to ensure focus on seamless customer travel across all channels.
The newly established strategy will lead the E in the The Race strategy while supporting the entire business strategy: Establish strong digital presence.
A digital vision for the Møller Mobility GroupThe digital vision for Møller Mobility Group is:“The most effective solutions for easy mobility”, expressed as MOVE.
Maximize customer valueOffensive business partnerValue through the use of dataEfficiency, streamlining and simplification
The opportunity room for Møller Digital lies in the focus on mobility and in providing seamless customer travel across all channels. It is impor-tant to create value through the use of data and become an even more insight-driven organi-zation that makes good decisions to streamline operations and improve the customer experi-ence. Digitization and automation are impor-tant technological instruments to simplify and streamline business processes. At the same time, we will build on the strengths that are in stable operation, committed and willing employees, and proximity to the business with common corporate goals.
Our analyzes have emphasized the need for a business-oriented and proactive technology feature. The major challenge with preparing a strategy for Møller Digital has otherwise been to ensure that all dimensions are represented in the space we operate within.
There are many areas and ambitions that will be captured in the strategy, areas that are in the span between people, processes, technology and structure. We must ensure safe and secure operation, but at the same time be innovative. We shall ensure a holistic prioritization and management, and at the same time ensure good involvement, develop the implementation capability and have control over information security and risk.
It has been necessary to establish a clearer strategic direction for the IT organization and we have chosen to gather the units IT Opera-tions, Program Simplification and Digital Team
Increased pace of change in the industry, in the company and new digital business models make changed demands on how we deliver services.
Møller Mobility Group will be at the forefront of development
in the new business area Møller Digital. The new organization will facilitate close collabora-tion with the business to ensure fast and good delivery of comprehensive digital products that create value for the customer. It facilitates the flexibility to redistribute resources in line with changing priorities and manages the system landscape in a responsible way. We will be a knowledge organization that builds differentiat-ing competence over time
“Møller Digital’s opportuni-ty room lies in the focus on mobility, focusing on the customer by offering seam-less customer journeys across all channels, and the use of insights and data to create val-ue, and last but not least, using technology to digitize and automate business processes.

CSR report 2018MMG AS Finances 201811 Group Finances 2018 Annual report 2018
Our value chain
Financial servicesVolkswagen Møller Bilfinans contributes to the dealers’ success by offering competitive financing products in Norway.
The importersMøller Mobility Group has two import companies: Harald A. Møller in Norway and Møller Baltic Import. Harald A. Møller imports the brands Volkswagen, Volkswagen Com-mercial Vehicles, Audi, Škoda and SEAT in Norway, while Møller Baltic Import imports Audi in Latvia and Lithuania and Volkswagen in Latvia, Lithuania and Estonia. Through their market expertise and financial strength, the importers provide the dealers with the power to succeed.
In 2018, Harald A. Møller started importing and selling SEAT in Nor-way. This takes place at a new sales model where the end customer buys a car directly from the importer via a digital platform.
The dealersMøller Bil and Møller Auto are respon-sible for sales and aftersales service of our brands in Norway, Sweden, Lith-uania, Latvia and Estonia. The goals for our 67 dealers are to increase customer satisfaction and fully exploit the potential of the Møller Bil brand.
NORWAY Møller Bil is Norway’s largest car dealer chain with 42 dealerships and 2,863 employees.
SWEDEN Møller Bil is Sweden’s second largest dealer group within Volkswa-gen, Audi, Škoda and Seat with 12 dealerships and 661 employees.
ESTONIA Møller Auto has four deal-erships and 207 employees.
LATVIA Møller Auto has five dealer-ships and 307 employees.
LITHUANIA Møller Auto has four dealerships in Lithuania and 222 employees.
32,000> number of cars insured.
27,000> number of cars financed.
53,956> number of cars imported in 2018.
41,874> number of new cars sold in Norway, Sweden and the Baltics in 2018.
The factoryVolkswagen Group is the world’s largest automaker. The group has formulated a new strategy, ”Together 2025”, where half of the business will be as we know it today, while the other half will focus on new areas. Mobility, digitaliza-tion and sustainable development are the main drivers.
The requirements for future mobility will transform the automotive indus-try’s business models, and Volkswa-gen shall be at the forefront. Møller Mobility Group has collaborated with Volkswagen AG since 1948, and the factory’s strategy has also inspired Møller Mobility Group’s strategy and operations.
10.8 mill.> number of cars manufactured by Volkswagen AG in 2018.
Our customersMøller Mobility Group has more than 500,000 customer metings each year. Our customers are our most important investment, meaning all Møller Mobility Group employees must create the best customer experiences every single day. Our core values translated into practice is an important foundation for creating positive experiences – both for the customer and for us in Møller Mobility Group.
We shall always strive to provide our customers with the very best solutions, and it is important for us to address the customers’ require-ments for future mobility.
500,000> number of customer meetings in 2018.

121212
One of our strategic objectives is therefore still to be best at chargeable solutions.
»
Ulf Tore Hekneby Managing Director at Harald A. Møller AS
CSR report 2018MMG AS Finances 2018Group Finances 2018 Annual report 2018

13 CSR report 2018MMG AS Finances 2018Group Finances 2018 Annual report 2018
Our brands are a unique strength
We have successfully completed a cost-savings programme in Norway and achieved a record-high turnover in the Baltics, where a hailstorm damaged over 700 cars belonging to Møller Baltic Imports. Against this backdrop, we are very happy with the overall results for 2018.
Volkswagen was Norway’s best-selling passenger car make for the ninth year running and Norway’s best-selling van make for the 14th consecutive year. In addition we signed new importer agreements with all factories, we signed new contracts with all our dealers, Skoda was voted importer of the year by the car mag-azine Bilnytt, and the Audi e-tron is finally here. 2019 will be the year of the e-tron in Norway!
HighlightsIn September 2017, we signed a contract with SEAT and re-launched the brand in April 2018. The fully digital purchasing process is an exciting innovation at a time where digital platforms are becoming an ever greater part of everyday life – and the automotive industry.
The transition from NEDC to WLTP for emis-sions testing yielded production challenges and meant we did not manage to get as many cars into the country as we would have liked. And naturally, this affected the bottom line. We achieved very good customer satisfaction ratings for all our makes, and Norway is the European leader in terms of implementation of the upgrade of cars related to the diesel scandal. Many readers are probably also aware that we signed an agreement with the Norwe-gian Armed Forces for delivery of 360 Amaroks, the largest single contract the importer has ever concluded with a Norwegian customer. We also launched the e-Crafter as our first electric van. Electrification is now in full swing in this segment too.
Major changesVolkswagen AG is currently building the world’s largest battery factory, has launched the auto-motive industry’s most ambitious electrification initiative – “Roadmap E”, and is going to launch
80 electric models by 2025. Around 50 of these will be fully electric and 30 will be chargeable hybrids. Once this is in place, we will be well equipped to position ourselves at the forefront in the competition with new and established auto businesses. One of our strategic objectives is therefore still to be best at chargeable solutions.
Ulf Tore HeknebyManaging DirectorHarald A. Møller AS
Harald A. Møller had a turnover of almost NOK 15 billion in 2018 and got the third best result in history with NOK 658 million. This is a decline from 2017, which was a record year. The decrease is largely attributable to demanding challenges with major changes, due to switching from NEDC to WLTP for emissions testing and the sharp increase in electrification in the car market in Norway.
Harald A. Møller AS> Norway’s largest car importer> New sales record in the Baltic States> Steady, good customer satisfaction
survey scores> Volkswagen was Norway’s best-selling
passenger car for the ninth year running > Turnover of NOK 14.9 billion
Report from Harald A. Møller AS

1414
The human communication between us and the customer remains fundamental to our success.
»
Petter Hellman Managing Director at Møller Bil AS
CSR report 2018MMG AS Finances 2018Group Finances 2018 Annual report 2018

15 CSR report 2018MMG AS Finances 2018Group Finances 2018 Annual report 2018
We have therefore implemented measures to cut costs and improve efficiency, along with a dedicated used-car programme and a top-line focus on tightening up the value chain. It is very gratifying to see that these measures have had their intended effect.
In the used car segment, we have had a clear focus on turnover rates, and gross earnings are now back to a satisfactory level. In 2018 we reduced stocks in all our countries by 23.9%, and the repurchase portfolio has stopped growing. We have also taken some structural steps, including establishing a dedicated used car centre in Bergen. The used car segment is thus well established and prepared for large volumes and the coming challenges, such as the technological shift. In 2019 we will continue to work on sales growth, gross profit and turnover rates. We are also well underway with digitalis-ing the used car process.
We achieved a total turnover of over NOK 20.1 billion and a combined profit before tax of NOK 249 million. We sold a total of 41,874 new
«Bilindustrien står overfor store endringer, men vi har et godt utgangspunkt for å vinne The RACE.»
Petter HellmanManaging DirectorMøller Bil AS
Demanding changes
In 2017, we experienced falling profits in the Norwegian dealership chain, due to squeezed margins on new and used cars. Costs had risen by roughly 7% in recent years, leaving us vulnerable to volume loss and margin squeeze.
Møller Bil 2018> Cars sold > 41,874 new> 29,355 used> Turnover of NOK 20.1 billion
Report from Møller Bil AS
cars (-10.9%) and 29,355 used cars (+3.5%). We are very pleased with the year’s performance.
We achieved a good result for Møller Bil in Norway, despite a 9% decrease in turnover. Tar-geted measures led to a 5% reduction in costs compared with 2017. The underlying result is on par with 2017. Møller Bil in Sweden returned a weaker profit, with a 13% reduction in new car volumes, while Møller Auto Baltic achieved a record result with increased turnover in all areas.
We have started work on the new Audi plant in Gothenburg (due to open in summer 2019), opened a new Volkswagen plant in Tallinn and opened a new Volkswagen showroom in Västerås. Møller Bil also strengthened its posi-tion in Hedmark by signing a letter of intent with the owners of Hamjern Bil AS for the purchase of the SKODA dealer.
Short and long termGoing forwards, it will be important to strike a balance between measures that will yield improvements in the short term and those that will have a more long-term effect. This will be an important management task both at the local level in the individual dealerships and for the central management of Møller Bil. We must keep our customers happy, ensure sound operations and constantly deliver results, at the same time as we must look ahead to the future, manage risks and invest in digital solutions. Change is always challenging, because it requires that we speed up and slow down at the same time. The situation varies from region to region, but the main priorities for Møller Bil as a whole will be to:• Fight for volumes and continue the good
development in earnings in Norway• Keep fixed costs under control
• Continue to increase turnover rates and gross earnings on used cars
• Continue to increase aftersales turnover
The customer always comes first in Møller Bil. We are currently working on establishing an even stronger interaction between the customers, digital solutions and Møller Bil in the sales and service processes going forwards. Although digital solutions simplify our everyday lives in many ways, the human communication between us and the customer remains fundamental to our success.
Møller Mobility Group’s major investments in digital customer solutions require enterprising employees with expertise in line with the new commercial opportunities. Digital knowledge will therefore become increasingly important.

1616
There is a clear trend in society away from owning and towards leasing.
»Arne Lyslo Kristiansen Managing Director Volkswagen Møller Bilfinans
CSR report 2018MMG AS Finances 2018Group Finances 2018 Annual report 2018

CSR report 2018MMG AS Finances 201817 Group Finances 2018 Annual report 2018
The company had its best operating year ever, with a pre-tax profit of NOK 315 million (non-re-curring effect in 2016 of NOK 95 million). In 2019, the company will grow further. Volkswagen Møller Bilfinans is an integrated and important part of the value chain of Volkswagen, Audi, SEAT and Škoda in Norway. With over 27,000 vehicles financed in 2018 and over 32,000 cars insured, Volkswagen Møller Bilfinans is by far a part of the success that Volkswagen, Audi, SEAT and Škoda enjoy.
Volkswagen Møller Bilfinans is particularly dominant on the private leasing market. There is a clear trend in society away from owning and towards leasing. This trend applies to both pri-vate individuals and large companies that prefer to let professional partners manage their entire fleet with all the associated costs. This is the crux of car administration.
Great Place to WorkVolkswagen Møller Bilfinans climbed five places in 2018 and came in sixth place over Norway’s best
work places in the category 50-199 employees. Through a comprehensive analysis of the corpo-rate culture and a survey among the employees, focusing on credibility, respect, fairness, pride and camaraderie, Great Place to Work ranks the best businesses within four categories: more than 500 employees, 200–499 employees, 50–199 employees and 20–50 employees.
Arne Lyslo KristiansenManaging DirectorVolkswagen Møller Bilfinans
All time high
Volkswagen Møller Bilfinans is Norway’s largest leasing company with almost 20% of the leasing market.
Report from Volkswagen Møller Bilfinans
Volkswagen Møller Bilfinans> Volkswagen Møller Bilfinans is Norway’s
largest leasing company with almost 20% of the leasing market.
> 81,500 contracts in the portfolio.> In total, over 27,000 new contracts were
signed and over 32,000 cars insured in 2018.
”Volkswagen Møller Bilfinans climbed five places in 2018 and came in sixth place over Norway’s best work places in the category 50-199 employees.”

18
Our social mission is an integral, sustainable part of how we conduct long-term, profitable business.
»
Paul Hegna Executive Vice President Communications And Public Affairs
CSR report 2018MMG AS Finances 2018Group Finances 2018 Annual report 2018
CSR report 2018MMG AS Finances 201819 Group Finances 2018 Annual report 2018
MILJØ EMPLOYEES
MOBILITY
ENVIRONMENT
SOCIETY
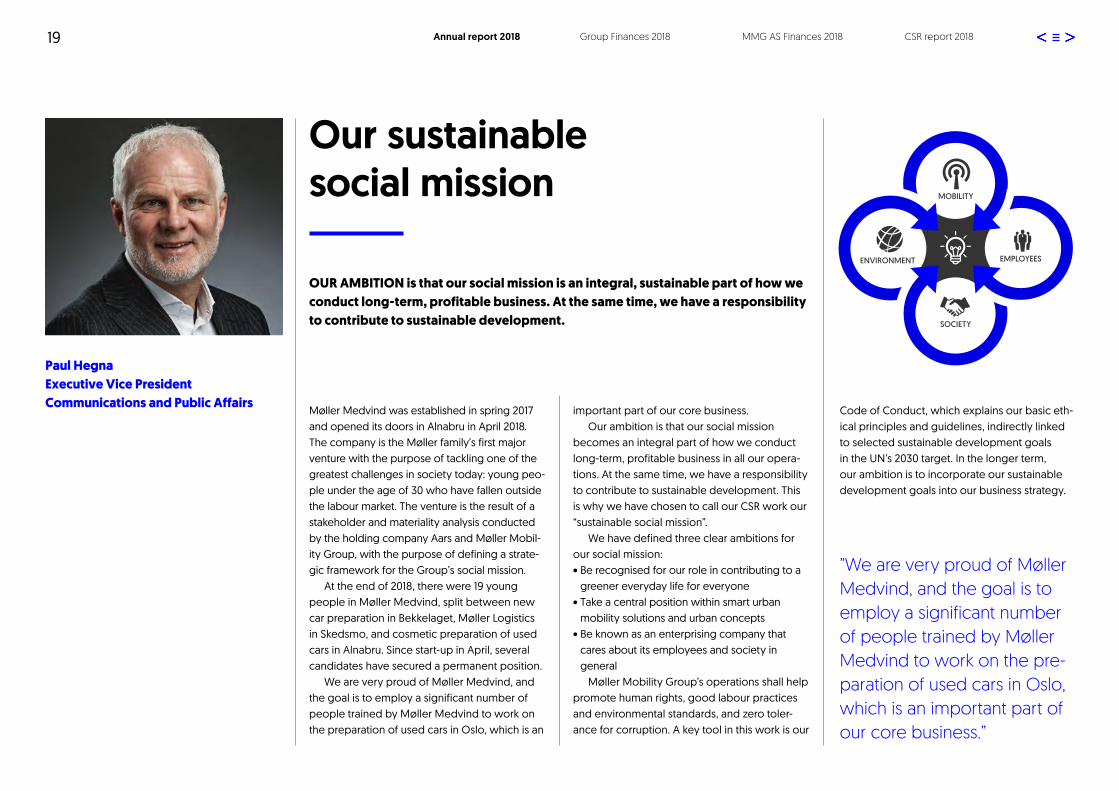
Our sustainable social mission
OUR AMBITION is that our social mission is an integral, sustainable part of how we conduct long-term, profitable business. At the same time, we have a responsibility to contribute to sustainable development.
Paul HegnaExecutive Vice President Communications and Public Affairs
Møller Medvind was established in spring 2017 and opened its doors in Alnabru in April 2018. The company is the Møller family’s first major venture with the purpose of tackling one of the greatest challenges in society today: young peo-ple under the age of 30 who have fallen outside the labour market. The venture is the result of a stakeholder and materiality analysis conducted by the holding company Aars and Møller Mobil-ity Group, with the purpose of defining a strate-gic framework for the Group’s social mission.
At the end of 2018, there were 19 young people in Møller Medvind, split between new car preparation in Bekkelaget, Møller Logistics in Skedsmo, and cosmetic preparation of used cars in Alnabru. Since start-up in April, several candidates have secured a permanent position.
We are very proud of Møller Medvind, and the goal is to employ a significant number of people trained by Møller Medvind to work on the preparation of used cars in Oslo, which is an
”We are very proud of Møller Medvind, and the goal is to employ a significant number of people trained by Møller Medvind to work on the pre-paration of used cars in Oslo, which is an important part of our core business.”
important part of our core business.Our ambition is that our social mission
becomes an integral part of how we conduct long-term, profitable business in all our opera-tions. At the same time, we have a responsibility to contribute to sustainable development. This is why we have chosen to call our CSR work our “sustainable social mission”.
We have defined three clear ambitions for our social mission:• Be recognised for our role in contributing to a
greener everyday life for everyone• Take a central position within smart urban
mobility solutions and urban concepts• Be known as an enterprising company that
cares about its employees and society in general
Møller Mobility Group’s operations shall help promote human rights, good labour practices and environmental standards, and zero toler-ance for corruption. A key tool in this work is our
Code of Conduct, which explains our basic eth-ical principles and guidelines, indirectly linked to selected sustainable development goals in the UN’s 2030 target. In the longer term, our ambition is to incorporate our sustainable development goals into our business strategy.

CSR report 2018MMG AS Finances 2018Group Finances 2018 Annual report 2018
“2018 was the year of the zero-emissions car,” according to the Information Council for Road Traffic (OFV)’s website.
“2018 saw new passenger cars that run on alternative fuels cement their strong position in the market. The sale of zero-emissions cars really took off in 2018. In 2017, 20.9% of all first-time registered cars were zero-emissions cars; this figure jumped to a massive 31.2% in 2018. Including chargeable hybrids, zero-emissions cars and the chargeable hybrids make up 49.1% of the market, up 10.2 percentage points from 2017,” they continue.
This confirms Norway’s position as the world leader in respect of sales of alternative fuel cars.
Average CO2 emissions for all passenger cars registered in Norway amounted to 71 g/km in 2018. In 2017 newly registered passenger cars emitted an average of 82 g of CO2/km, 11 g less than in 2016. Average CO2 emissions have been reduced by 42 g/km in the past six years and by 87 g/km in the past ten years.
A growing number of customers are choos-ing cars with a new powertrain, and sales of
chargeable cars accounted for a staggering 49% of new car sales in Norway in 2018, compared with just under 40% in 2017 and 29% in 2016, making Norway the world leader in electric vehicles.
CO2 emissions in Norway in 2018 (change from 2017):• All passenger cars 71 g/km (-11 g/km)• Petrol cars (all, including petrol-electric hybrids) 94 g/km (0 g/km)• Diesel cars (all, including diesel-electric hybrids) 131 g/km (+5 g/km)
CO2 emissions for our makes in 2018 (2017):• Volkswagen 66 g CO2/km (65 g)• Audi 92 g CO2/km (96 g)• ŠKODA 131 g CO2/km (130 g)
Volkswagen Group has launched the automotive industry’s most ambitious electrification initiative with “Roadmap E”, whereby the Group’s brands will launch 80 electric models by 2025. Around 50 of these will be fully electric and 30 will be chargeable hybrids. The initiative entails that
Volkswagen will have an electric version of all the models in its entire portfolio by 2030 at the latest.
Volkswagen AG is also building the world’s largest battery factory, at the same time as the vehicle charging infrastructure in Europe and the USA is being expanded massively. In Europe, the vehicle charging network is being built with 350 kW ultra-fast charging stations, which will ensure that batteries can be charged in a short period of time. Construction of charging stations began in 2017, and the goal is to have 400 electric vehicle charging stations in Europe by 2020. In Norway, charging stations are being built in collaboration with Circle K.
Møller Mobility Group wants to be a valued resource on automotive and environmental issues, enable our customers to make good environmental choices, and be a market leader in chargeable cars.
Environment
The UN’s sustainable development goals (SDGs) are a global plan of action for social development and a basis for prioritising efforts over the next 15 years. There are a total of 17 goals with a number of underlying targets. Volkswagen AG has committed to these goals. Four goals are particularly relevant for Møller Mobility Group.
The UN’s sustainable development goal 13: ”Take urgent action to com-bat climate change and its impacts.”
“We believe that in 2025 all new passenger cars sold by the Group will be emissions-free.”
> Sales of chargeable vehicles Over half of all sales of Volkswagen passenger cars were chargeable in 2018
> Zero emissions by 2025 Møller Mobility Group’s ambition is that all new passenger cars sold by the Group will be emissions-free by 2025
> Active buildings Møller Bil has now implemented active energy monitoring at all dealerships, in Norway, Swe-den and the Baltics. There is energy monitor-ing in 55 buildings in Norway, 20 buildings in Sweden and 14 buildings in the Baltics
20 CSR report 2018MMG AS Finances 2018Group Finances 2018 Annual report 2018

21
Norway has ratified the international Paris Agree-ment on climate change, thereby committing to making necessary, forward-looking changes in the transport sector in order to reduce green-house gas emissions. In a nutshell, we must make much smarter use of what we have than we do today. Therefore, new, energy-efficient mobility solutions are also part of our social mission. In addition, the automotive industry is currently at a complex intersection of technological change, urbanisation, digitalisation and a sharing econ-omy, and customers are increasingly demand-ing smart mobility solutions. It is therefore no surprise that mobility has been incorporated into Volkswagen AG’s and our own strategy.
Volkswagen Group is the world’s largest automaker. The group has formulated a strategy “TOGETHER 2025”, outlining a proactive focus on new mobility solutions – across all the brands. The Volkswagen group itself states that this is the biggest change process in the company’s history, with a focus on changing the Group’s core business and tapping potential new revenue streams. The Volkswagen group has
also established the company MOIA to develop mobility services.
In our strategy, we set a course to take a key position within urban smart mobility solutions and urban concepts. Møller Mobility Group is preparing to replace more than 30% of our cur-rent revenues with earnings from new mobility services by 2030. So far we have changed our name to Møller Mobility Group, launched the car-sharing service Hyre, established Mobili-tyLab, and invested in the company Urban Infra-structure Partner (UIP). All of this serves to further develop our mobility strategy and broadens our reach as a mobility provider.
Micro-mobility as a real alternativeWe are facing a situation where the sum of technological developments, stricter regulation and changing consumer habits is promoting new mobility models as a real alternative to car ownership in urban areas. This development does not only apply to car-based mobility, but also to smaller urban vehicles such as bicycles and e-scooters – collectively known as micro-mobility.
Stricter regulation related to urban tolls, parking and driving patterns will make it less convenient and more expensive to use a car in urban areas. At the same time, the environmen-tal footprint of using a shared micro-mobility service is much lower than car-based transport.
The market is moving towards mobility concepts that are multimodal, i.e. systems where one ticket provides access to a variety of modes of transport. Bicycles are faster than walking, cheaper than taxis, more flexible than public transport, require less maintenance and are cheaper than driving your own car – and can also be combined with other transportation methods.
Møller Mobility Group’s goal for the future is to be a proactive provider of smart mobility services as well as physical products. Climate change is an important driver behind this decision.
Mobility
UN SDG 11: ”Make cities and human settlements inclusive, safe, resilient and sustainable”
UN SDG 9: ”Build resilient infra-structure, promote inclusive and sustainable industrialisation, and foster innovation.”
“We see excellent growth conditions for forward-looking ’micro-mobility’ service providers operating in good interaction with the city and the city’s transport network.”
CSR report 2018MMG AS Finances 2018Group Finances 2018 Annual report 2018

22
Employees
Møller Mobility Group wants to be known as an enterprising company that cares about its employees and people in general.
It is important for us to invest in our employees, ensure that they have the right skills and exper-tise and are given challenging tasks. Working for Møller Mobility Group is demanding, engaging and fun. At year-end 2018, the Group had a total of 4,260 employees – a decrease of 85 from the previous year. There were 661 employees in Sweden, a total of 736 in the three Baltic States, and 2,863 in Norway.
Møller Mobility Group’s core values are the cornerstones of the Group’s corporate culture and provide important guidelines for managers and employees on how to treat one another and our customers. Møller Mobility Group has also drawn up a Code of Conduct, which clarifies our basic ethical principles and provides guidelines. We maintain a continuous focus on this work. This was followed up in autumn 2017 through an internal Questback survey carried out by Deloitte and continued in 2018 through the “Most Important Day of the Year” initiative, involving all the employees in Møller Mobility Group. We want to ensure all our employees are equally well equipped to be able to make
safe, good decisions. In this day and age, where we increasingly hear about bullying, harass-ment, and corruption, our core values and our founder’s personal mantra “Always stick to the straight and narrow” are an essential foundation for everything we do. We received a lot of good feedback and positive comments from last year’s Most Important Day of the Year event. In 2018, we processed 29 reports of unacceptable circum-stances with varying degrees of severity. Both the central management and the heads of our sub-sidiaries encourage and stimulate the employees to report any unacceptable circumstances.
Manager developmentOur Group has many operational units that to a great extent have to be run as independent profit centres, and developing our managers and recruiting new ones is therefore a high-pri-ority area. Møller Mobility Group has focused on developing its own managers for almost 30 years. Internal recruitment and the transfer of competence between the companies, especially between importers and dealers, are important
cornerstones for the company’s growth and development.
In winter 2018, the 18th Manager Candidate Programme (LKP) concluded for a total of 22 participants, and a new LKP programme (no. 19) was started in the autumn for a total of 21 participants. In the Baltic States, a new middle manager programme called “Engage” started up for a total of 14 participants.
The Group management has had two gather-ings with contributions from external providers with the goal of improving coordination and developing the Group’s senior management team. With the recent addition of several new people on the senior management team, and to ensure that the senior management is a real management team and not merely a group of managers, this work has been an important and necessary investment.
In 2018, the Group’s HR department was expanded to include Møller Mobility Group’s combined HR activities in Norway, Sweden and the Baltic States. Through dedicated HR business partner functions, HR will be incorporated as
UN SDG 8: “Promote sus-tained, inclusive and sustain-able economic growth, full and productive employment and decent work for all.”
part of the management teams in the business units and help turn strategic plans into specific HR activities. This strengthening of HR will be an impor-tant tool for us to develop and attract the resources we need in a demanding and exciting period for the automotive industry.
“The increasing rate of change has revealed a need for a stronger, more strategic HR function.”
Nina Moi Edvardsen, Chief Human Resources Officer
CSR report 2018MMG AS Finances 2018Group Finances 2018 Annual report 2018

CSR report 2018MMG AS Finances 2018Group Finances 2018 Annual report 201823
Møller Medvind was established in spring 2017 and opened its doors in Alnabru in April 2018. The company is helping resolve one of the greatest challenges in society today: young people under the age of 30 who have fallen outside the labour market. Møller Medvind aims to create perma-nent, profitable workplaces for this target group – based on standard commercial principles. The goal is that Møller Medvind will run with a profit from 2020.
At the end of 2018, there were 19 young people in Møller Medvind, split between new car preparation in Bekkelaget, Møller Logistics in Skedsmo, and cosmetic preparation of used cars in Alnabru. Since start-up in April, several candidates have secured a permanent position.
Doubling in 2019Headed by Bjørn Erik Tangen, Møller Medvind at Alnabru will continue to build up its capacity and competencies in the preparation of used cars in Oslo, with a potential for preparation of up to 6,000 cars a year. This will result in more than twice as many young people in jobs during 2019. Møller Medvind is also working to establish a trade certificate in the preparation of used cars for young people who want to take a “learning candidate” programme. In addition, our new employees will also receive training in other subjects related to preparation. In this way, we will create attractive workers who can also be employed elsewhere in our business or at other companies.
We are pleased to report that the quality and
Mari Schage FørdeOwner and Chair of the board at Møller Medvind
Møller Medvind:Opening doors to work for young people
the feedback from customers is very good. Our ambition is to be the best at preparing used cars. This creates proud employees and satisfied customers. We have also trained two of our pre-parers as car photographers. It is important that the pictures do the great cars full visual justice when they are put up for sale.
Another goal is to outperform the many unprofessional players in this industry. This is a job we do not only for ourselves, but that bene-fits the whole of society.
We believe that the best way to help young people who are down on their luck is to give them work in one of our businesses. Young people recruited through the Norwegian Labour and Welfare Administration (NAV) are given practical work training and vocational training before being offered a permanent job in the Møller Medvind programme and eventually in our businesses and external companies.
“The Inclusion Project is a joint voluntary social mission to get more people in work. In my capacity as the owner and chair of the board of Møller Medvind, I had the pleasure of attending the opening of the Inclusion Project on 20 June.”
“It’s not only enriching for the young people on the scheme, but also for the ownership. Having the opportunity to work so closely with people who, despite their young age, have had life experiences that make them unique in many ways, changes us as a company. This is all pos-sible thanks to the good, close collaboration with NAV in Oslo,” she says. Here with general manager Bjørn Erik Tangen.
24 CSR report 2018MMG AS Finances 2018Group Finances 2018 Annual report 2018
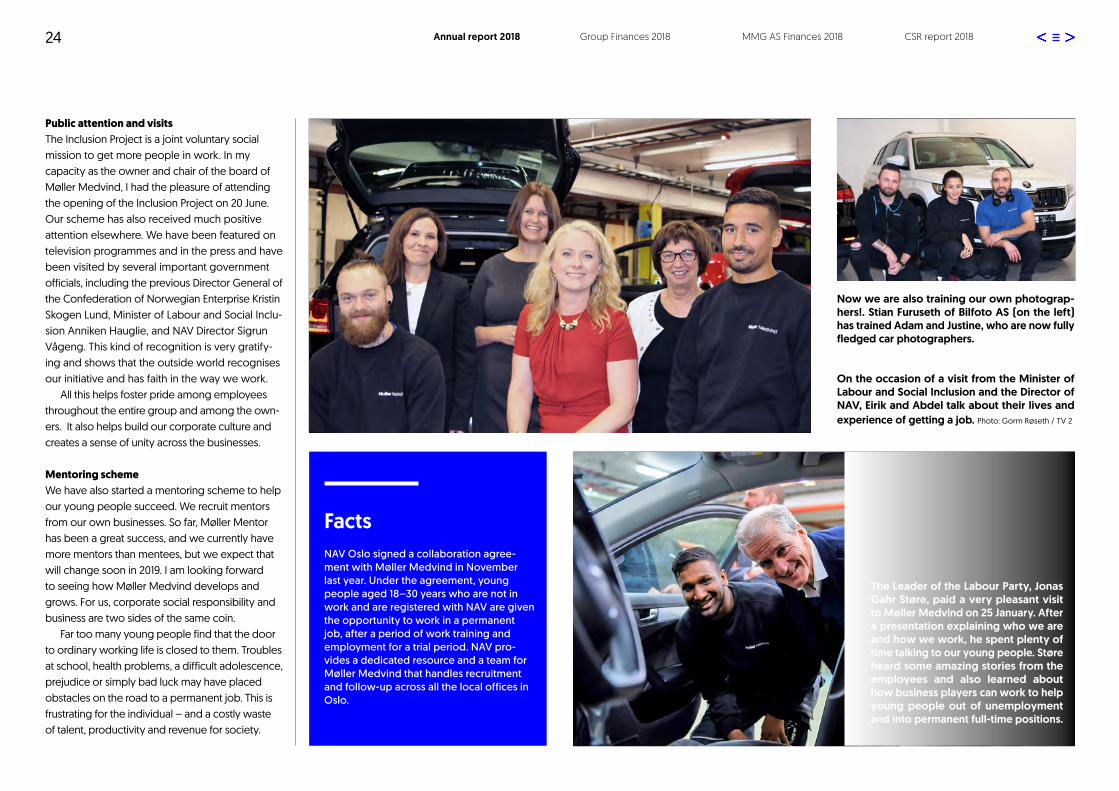
Public attention and visits The Inclusion Project is a joint voluntary social mission to get more people in work. In my capacity as the owner and chair of the board of Møller Medvind, I had the pleasure of attending the opening of the Inclusion Project on 20 June. Our scheme has also received much positive attention elsewhere. We have been featured on television programmes and in the press and have been visited by several important government officials, including the previous Director General of the Confederation of Norwegian Enterprise Kristin Skogen Lund, Minister of Labour and Social Inclu-sion Anniken Hauglie, and NAV Director Sigrun Vågeng. This kind of recognition is very gratify-ing and shows that the outside world recognises our initiative and has faith in the way we work.
All this helps foster pride among employees throughout the entire group and among the own-ers. It also helps build our corporate culture and creates a sense of unity across the businesses.
Mentoring schemeWe have also started a mentoring scheme to help our young people succeed. We recruit mentors from our own businesses. So far, Møller Mentor has been a great success, and we currently have more mentors than mentees, but we expect that will change soon in 2019. I am looking forward to seeing how Møller Medvind develops and grows. For us, corporate social responsibility and business are two sides of the same coin.
Far too many young people find that the door to ordinary working life is closed to them. Troubles at school, health problems, a difficult adolescence, prejudice or simply bad luck may have placed obstacles on the road to a permanent job. This is frustrating for the individual – and a costly waste of talent, productivity and revenue for society.
On the occasion of a visit from the Minister of Labour and Social Inclusion and the Director of NAV, Eirik and Abdel talk about their lives and experience of getting a job. Photo: Gorm Røseth / TV 2
Now we are also training our own photograp-hers!. Stian Furuseth of Bilfoto AS (on the left) has trained Adam and Justine, who are now fully fledged car photographers.
FactsNAV Oslo signed a collaboration agree-ment with Møller Medvind in November last year. Under the agreement, young people aged 18–30 years who are not in work and are registered with NAV are given the opportunity to work in a permanent job, after a period of work training and employment for a trial period. NAV pro-vides a dedicated resource and a team for Møller Medvind that handles recruitment and follow-up across all the local offices in Oslo.
The Leader of the Labour Party, Jonas Gahr Støre, paid a very pleasant visit to Møller Medvind on 25 January. After a presentation explaining who we are and how we work, he spent plenty of time talking to our young people. Støre heard some amazing stories from the employees and also learned about how business players can work to help young people out of unemployment and into permanent full-time positions.

25
The Møller family is proud of its heritage, and our dream is to create visible results, ideally in partnership with others.
»
Øyvind Schage Førde Owner and chairman of Møller Mobility Group and in the owner company Aars
CSR report 2018MMG AS Finances 2018Group Finances 2018 Annual report 2018
CSR report 2018MMG AS Finances 201826 Group Finances 2018 Annual report 2018
Cars are a part of the solution
I am proud that the other owners have shown their confidence in me and made me chair of two of the family’s main companies: Møller Mobility Group and the holding company Aars, which has managed the Møller family’s ownership interests since 2014.
Øyvind Schage FørdeOwner and chairman ofMøller Mobility Group andin the owner company Aars
Considerable value has been created under Harald Møller’s leadership, and we have much to thank him for, both as chair and personally. Harald Møller has been exceptionally well-liked as chair of the board, as a person and as an active owner during his period of office. We have weathered “dieselgate” and the financial crisis, and have emerged stronger than ever. In my opinion, the change of chair is primarily a matter of redistribution of responsibilities and roles. The ownership structure and ownership strategy remain unchanged, and I look forward to continuing the family ownership together with Harald Møller and the other active owners. I am very glad that Harald Møller will continue to play a key role as a board member and active owner.
Aars is currently one of Norway’s largest family-owned businesses, with roots stretching back to 1936 when Harald Aars Møller set up his business. Over the past 15 years, the business as a whole has seen strong growth and value creation.
In 2014, when we gathered Harald A. Møller’s
legacy in the holding company Aars, family unity was at the top of the agenda. We also wanted to ensure that both current and future generations would be able to exercise good, active ownership, carry on creating value, and continue the family tradition. I am proud to be able to report that we have achieved all of the above. We have a long-term perspective, with a goal of creating more jobs and greater wealth.
One of the most important parts of the founder Harald Aars Møller’s legacy is the core values he based the company on. We were therefore especially keen to include a quote from him in the formation of Aars as a platform for fur-ther operations: Stick to the straight and narrow.
At the same time, the company’s history and culture, especially within the automotive indus-try, is firmly rooted in our values: Honest and trustworthy, Clear, Proactive, and Open-minded and caring. The Group enjoys an excellent relationship with the factory, and we take it as a confirmation of confidence that we signed new contracts for all our makes last autumn.
Mobility in a broad senseThe car industry is facing its biggest challenges in modern times. Not only is the technology developing with quantum leaps, changing the core product: we are also seeing major changes in the way we use cars. In addition, new mobility services are taking the market by storm.
Some people think cars are the problem; we believe cars are part of the solution. We firmly believe there will be a need for transport in some form or other in the future too. And we have an organisation that is equipped to deal with the changes that are coming. In a nutshell: we believe we are the best in this area. For even with different powertrains and autonomous (self-driving) vehi-cles, there will still be a market for handling and following up cars. Cars are our core business, and we will continue to invest in this area.
Our underlying philosophy is to be a sustainable business. We must face up to the reality that the products we have sold have generated harmful emissions. Our change of name to Møller Mobility Group confirms this, and I think the management has made this transition with credibility. By moving from being a car importer and dealership to providing a car-sharing platform and that we have been become shareholder in Urban Infrastructure Partner, which among other things runs city bike offers in several major cities, we prove that we take social concerns and new regulations very seriously. This is our strategy for helping meet a greater proportion of people’s mobility needs.
The Møller family is proud of its heritage, and our dream is to create visible results, ideally in partnership with others. When we succeed, we create value for our successors and for the community we all are part of.

27 CSR report 2018MMG AS Finances 2018Group Finances 2018 Annual report 2018
Key figures Møller Mobility Group 2018–2014
09.05.2019 10:52
KEY FIGURES
(Amounts in NOK millions) 2018 2017 2016 2015 2014
Operating revenue 26 173 28 273 26 387 24 131 20 601ProfitOperating profit 762 1 038 1 069 1 033 606EBITDA 1 1 179 1 389 1 408 1 301 934Profit before tax 880 1 121 1 180 1 103 671Profit for the year 689 861 912 824 511CapitalEquity at 31 Dec. 3 286 3 225 2 934 2 624 2 324Total assets at 31 Dec 8 172 8 050 7 267 6 484 5 507Equity ratio 40,2 40,1 40,4 40,5 42,2ProfitabilityReturn on equity in % 2 22,2 29,4 32,8 33,3 21,8Return on total assets in % 3 10,8 14,6 17,2 18,4 12,4Number of employeesNumber of employees 4 260 4 345 4 274 4 107 3 926Total payrolland personnel costs 2 829 2 812 2 616 2 457 2 310
1) Including results in assosiated companies 2) Return on equity: profit for the year as a percentage of average equity3) Return on total assets: the result before tax plus financial costs as a percentage of average total assets.
CSR report 2018MMG AS Finances 2018Group Finances 2018 Annual report 201828
Board of directors’ report 2018
THE NATURE, SCOPE AND LOCATION OF THE GROUPThe core business of Møller Mobility Group is import, sales, service, financing and repair of the brands Volkswagen, Volkswagen Com-mercial Vehicles, Audi and Škoda. The business is located in Norway, Sweden, Estonia, Latvia and Lithuania. Møller Mobility Group’s ambition is to become a leading provider of sustainable mobility, and the goal is to create value for its customers, employees, owners and partners. Ever since Harald Aars Møller started his own car company in 1936, the core values, Honest and Trustworthy, Clear, Proactive, and Open-minded and Caring, have played a central role in the company.
Møller Mobility Group is owned by Aars AS. Aars AS is a holding company focusing on asset management and allocation of capital to its subsidiaries. Aars AS also owns Møller Eiendom, which owns a large percentage of Møller Mobility Group’s car facilities. Møller Mobility Group rents the premises on long-term contracts.
Møller Mobility Group is organised into three business areas: Car Import, Car Dealers, and Car Finance. Each business area has independ-ent responsibility and authority within the
agreed framework of strategies and targets, to achieve long-term value development. Where appropriate, common functions are used to safeguard economies of scale across the business areas.
Car ImportsCar import operations in Norway and the Baltics are organised as one business area. Harald A. Møller AS is Norway’s largest car importer with a total market share of over 20 percent in recent years. The four brands – Volkswagen passenger cars, Volkswagen Commercial Vehicles, Audi and Škoda – all have very strong positions in the Norwegian market. In 2018, Harald A. Møller also started importing and selling SEAT in Norway through a new sales model where the end customer buys a car directly from the importer via a digital platform. Harald A. Møller AS is the dealer network leader for all the car brands and is also in charge of logistics for vehicles, parts and accessories for all the dealers in Norway.
Møller Baltic Import imports Volkswagen passenger cars and Volkswagen Commercial Vehicles to all three Baltic countries and Audi to Latvia and Lithuania. The importer is located in Riga.
Car DealersThe Group’s car dealers are organised in the company Møller Bil AS, with joint manage-ment and programme functions for new cars, used cars, the aftersales market, marketing and property across the markets. Møller Bil is subdivided into five regions: Greater Oslo, Western Norway, Central Norway, Sweden and the Baltics. The dealers are engaged in sales of new and used cars and operations of mechanical workshops and repair workshops. The dealers operate as independent units, but work is coordinated and experience is shared where appropriate – also across national borders.
In Norway, Møller Bil AS owns a significant part of the Norwegian dealer network. With 43 dealers and 11 specialised repair centres spread across the country, Møller Bil is Norway’s largest car dealer network. Møller Bil covers around 60 percent of the Norwe-gian market for Volkswagen and Audi, with a primary focus on the biggest cities. The market share for Škoda is around 50 percent.
The Group’s dealers in Sweden are also organ-ised as a chain under the name Møller Bil. The network consists of 12 dealers in Mälardalen, with a shared administration in Uppsala. Møller
Bil Sverige markets Volkswagen passenger cars, Volkswagen Commercial Vehicles, Audi, Škoda and SEAT, and accounts for approxi-mately 10 percent of the Swedish importer’s sales.
The dealers in the Baltics are organised in the same way as in Norway and Sweden under the name Møller Auto. The network has shared management for the three countries, located in Riga. Møller Auto consists of 13 dealers who are largely located in the three capitals: Riga, Tallinn and Vilnius.
Car FinanceCar Finance operates in Norway and is run by the company Volkswagen Møller Bilfinans AS. This is a jointly controlled company with Volkswagen Financial Services AG. Møller Mobility Group owns 49 percent of the company, which offers loans, leasing and hire- purchase products, and insurance linked to the respective brands’ sales of new and used cars.
MACRO-ECONOMICS AND FRAMEWORK CONDITIONSThe macro-economic development has been positive in all the Group’s markets in 2018. GDP growth was good in the Baltics and Sweden, but somewhat lower in Norway. Unemploy-

CSR report 2018MMG AS Finances 2018Group Finances 2018 Annual report 2018
ment has continued to decrease in the Baltics and has remained stable at a low level in Norway and Sweden. Interest rates are still low. At the same time, the increased focus on the environment has resulted in major changes in the framework conditions for the automotive industry. In 2018, the European emissions testing system for type approval changed from NEDC to WLTP. This was a demanding change that resulted in major delivery challenges for Volkswagen’s brands towards the end of 2018. From 1 January 2020, car manufacturers will have to comply with the EU’s new emission targets. This means that the average CO2 emissions per registered car from a manufacturer must not exceed 95 g/km. This will intensify the development of low-emis-sions vehicles, as failure to meet the emissions target will incur substantial additional costs for the manufacturers in the form of fines. The effects of this were already beginning to be seen in 2018, with a sharp increase in the number of electric car models, especially in the Norwegian market.
Norway has Europe’s most favourable tax system for electric cars. The government has indicated that this will continue for a few more years. There are also a number of tax discounts for chargeable hybrids. A very large number of electric cars have been sold thanks to the tax system in Norway, and sales of chargeable hybrids are also rising. Sales of chargeable cars increased from 62,258 in 2017 to 72,628 in 2018, accounting for 49 percent of the total market.
By 2022, Volkswagen AG will invest over EUR 34 billion in electric cars and technology
development related to autonomous vehicles, digitalisation and mobility solutions. Volks-wagen AG has launched the automotive industry’s most ambitious electrification initia-tive with “Roadmap E”, whereby the Group’s brands will launch 80 chargeable models by 2025. Around 50 of these will be fully electric and 30 will be chargeable hybrids. Mobility, digitalisation and sustainable solutions are the industry’s main drivers going forward – in addition to conventional car sales. The fact that the factory is an early mover means that Møller Mobility Group is well equipped to meet the expected changes in the automotive industry.
The diesel scandalUpgrade of the cars affected by the Volks-wagen diesel scandal continued with full speed throughout 2018, and by the end of the year 89 percent of all the affected cars in Norway and about 62 percent of the affected cars in the Baltics had been upgraded. The upgrades are being carried out as guarantee work with normal coverage. The cars have retained all their technical data in accordance with their type approvals. The situation has not had any negative financial consequences for the Group in 2018. Internal customer surveys in connection with upgrades show that the cus-tomers are pleased with the handling of the case. The upgrades will continue through 2019.
The car marketA total of 147,929 new passenger cars were sold in Norway in 2018, a decline of 7 percent compared with 2017. Some 37,204 commer-cial vehicles under 3.5 tonnes were sold, an increase of 4 percent from 2017. The market in
general has been characterised by the elec-trification of the Norwegian car fleet. Electric vehicles’ share of new car sales increased from 20.8 percent to 31.2 percent in 2018. Six of the top ten car models sold in 2018 were fully electric, and many customers are on a waiting list for new electric cars at the beginning of 2019. Moreover, the transition from NEDC to WLTP for emissions testing for type approval resulted in major delivery problems during parts of the year. Combined with the electri-fication, this is the main reason why the total market for passenger cars in Norway was lower than in 2017 and why VW, Skoda and Audi had slightly lower market shares.
In Sweden too, the total market for passenger cars decreased by 7 percent in 2018, ending the year at 353,729 cars, while the market for commercial vehicles under 3.5 tonnes increased by 2 percent to 56,617 vehicles. One of the main reasons for the decline in the passenger car market was higher taxes on vehicles with fossil powertrains from 1 July 2018 (“bonus-malus”).
In the Baltics, the market remained strong, with growth of 10 percent to a total of 75,554 passenger cars and 11,447 commercial vehicles under 3.5 tonnes.
ANNUAL FINANCIAL STATEMENTSThe consolidated profit before tax for 2018 amounted to NOK 880 million, compared with NOK 1,121 million in 2017. This is the fourth best result in the Group’s history. The year was characterised by an accelerated shift towards electric cars in the Norwegian market, as well
as challenges related to the introduction of the new type approval system in the EU. The profit for the year is NOK 241 million lower than in 2017, but it is still a very good result in view of the major changes and challenges that have characterised the year.
Sales revenue amounted to NOK 26.2 billion, which is NOK 2.1 billion lower than in 2017. The decrease is primarily attributable to a 14 percent decrease in the number of registered cars for the Group’s brands in Norway to 43,151 cars. Inability to deliver due to the switch from NEDC to WLTP for emissions testing, as well as lower access than required to electric cars, are the main reasons for the decline. In Sweden, the number of new cars delivered fell by 13 percent to 11,244. In the Baltics, the market growth continued, and 10,805 cars from Moller Baltic Import were registered, an increase of 10 percent. The total number of sold used cars increased by 3.5 percent, due to a sharp increase in the Baltics, while the figures for Norway and Sweden were largely unchanged. A total of 29,355 used cars were sold in 2018. Turnover in aftersales increased in all the mar-kets in 2018. The Baltics had the largest growth with a 5 percent increase in sales revenue.
The profit before tax was NOK 880 million, a decrease of 21 percent compared with 2017. The profit from the car dealers in the Baltic States were all-time high, while car imports and dealer operations elsewhere returned lower results than in 2017. The decline is largely attributable to the decline in sales, which has also resulted in further pressure on the gross profit on new cars. A number of success-
29

CSR report 2018MMG AS Finances 2018Group Finances 2018 Annual report 2018
ful, targeted initiatives helped to boost the turnover rate and gross profit on used cars in 2018. The decline in sales revenues was met with robust measures to keep costs down in the Group, with a significant impact on the final profit. Total underlying operating costs in Norway were reduced by 4% compared with 2017. At the same time, the Group focused on digitalisation, new mobility solutions and the launch of SEAT, and incurred additional costs in connection with increased provisions for repurchases, severance agreements, and not least large costs in connection with a hailstorm in Germany that damaged over 700 cars belonging to Møller Baltic Import.
The degree of financing on sold cars is still high, at approximately 42 percent for new cars and 29 percent for used cars, and the share of the profit from Volkswagen Møller Bilfinans is almost at the same level as in the record year 2016. The proportion of loans is increasing at the expense of leasing, and the leasing port-folio has grown less than in 2017. Net financial costs in the Group were NOK 27 million lower in 2018 than in 2017, primarily due to positive currency effects.
Net cash flow from operations was NOK 584 million, which is substantially lower than in 2017, when the corresponding figure was NOK 1,787 million. The main reason for the change is that the working capital was reduced in 2017 to a record low level, before bouncing back up to a more normalised level in 2018, driven primarily by the stock of new cars.
Investments, liquidity and financingThe Group’s total investments amounted to NOK 312 million in 2018, compared with NOK 377 million in 2017. The largest investments are in digital solutions and upgrading and devel-opment of the Group’s IT systems. In addition, minor upgrades have been made at several facilities, to increase capacity and to adapt to new standards from the manufacturers.
The stock of used cars is low as a result of tar-geted measures to increase the turnover rate, but at 31 December 2018 the stock of new cars was higher than the previous year. This is due to the fact that the supply of vehicles that have been approved according to the new type approval system, which created problems in the autumn, improved towards the end of the year. Working capital has therefore increased, and net interest-bearing debt was NOK 564 million at year-end, against a record-low NOK 105 million at the end of 2017.
Møller Mobility Group’s financing structure remained unchanged throughout 2018. The Group is financed by two bonds, each with a net value of NOK 400 million, that mature in 2019 and 2022 respectively, and a syndicated loan of NOK 1 billion, due in 2021. The bonds ensure the Group good, long-term financing, and at the same time the Group gains an alternative source of financing to bank financ-ing. The bonds are listed on the Nordic ABM exchange to ensure liquidity for investors. The syndicated loan is a framework agreement with flexible elements to finance the ongoing fluctuations in working capital. The Group had not made any withdrawals from this facility
at the end of 2018. Liquidity and the financing situation are good.
At 31 December 2018, the Group’s share capital amounted to NOK 3,286 million, correspond-ing to 40% of the total assets. This gives Møller Mobility Group a very strong financial position.
The Group’s dealers have commitments totalling NOK 8.1 billion linked to the future repurchase of cars from financing companies. This is an increase of 14 percent from 2017, due to the growth in sales of private-leasing con-tracts in the Norwegian and Swedish markets. The Group is exposed to market-based risk in that the market price for cars could fall below the guaranteed repurchase value. Provisions have been made for estimated losses in the portfolio. Overall, earnings are good on the sale of used repurchase cars, and the Board is of the opinion that this risk is under control based on the current financial position and market conditions.
The constant increase in the sale of charge-able cars entails a greater need for provisions related to the collection and processing of lithium batteries. The Group assesses this need on an ongoing basis and at 31 December 2018 had a total provision of NOK 135 million relating to this, up from NOK 70 million at the end of 2017.
When importing cars and parts, the transaction currency used is the euro, except for imports of Škoda, where payment is made in Norwegian kroner. Prices in euro are regulated accord-ing to currency agreements with the factory,
where most of the risk is born by the factory. Møller Mobility Group bears the transaction risk during the credit period, as well as a long-term strategic risk associated with the eurozone’s competitiveness. Currency spot and forward contracts and options are used to reduce the settlement risk. The Group’s investments in Sweden and the Baltic States are also subject to currency fluctuations. This risk is reduced by these businesses being funded in local currency. Equity is not hedged beyond the expected one-year dividend, which is secured by currency forward contracts until payment.
THE BUSINESS AREASCar ImportThe business area Car Import consists of Harald A. Møller AS, which imports Volks-wagen, Audi, Škoda, SEAT and Volkswagen Commercial Vehicles in Norway, and Møller Baltic Imports, which imports Volkswagen passenger cars and Volkswagen Commercial Vehicles in all the Baltic Countries, and Audi in Latvia and Lithuania.
Harald A. Møller had total operating revenues of NOK 12,304 million, down 13 percent from 2017. Profit before tax amounted to NOK 629 million in 2018, compared with NOK 806 mil-lion in 2017. The decline in profits is mainly due to reduced car sales, with the greatest decline attributable to Audi. This year’s profit is never-theless the third best in the company’s history. Harald A. Møller AS retained its position as Norway’s largest car importer, and our car brands had a total market share of 22.1 percent of the Norwegian car and commercial vehicle market, compared with 25.1 percent in 2017.
30
CSR report 2018MMG AS Finances 2018Group Finances 2018 Annual report 2018
Volkswagen was the most sold brand for the ninth consecutive year, but delivery challenges resulted in the market share being somewhat lower than in the previous year, ending at 13.6 percent. Škoda had a good year, considering it does not yet offer any rechargeable models. It achieved a market share of 5.2 percent, down from 5.7 percent in 2017. For Audi, the year was marked by delivery problems related to the transition from NEDC to WLTP for type approval, combined with the fact that many Audi customers are waiting for the fully electric Audi e-tron. This make’s market share declined from 4.8 percent to 3.3 percent. Over 7,500 customers had pre-reserved the Audi e-tron at the end of 2018, and Audi expects a solid rise in 2019. Volkswagen Commercial Vehicles achieved a market share of 27.9 percent in 2018, making it the best-selling commercial vehicle make for the 14th consecutive year. Sales of parts and accessories were affected by the decline in sales of new cars and decreased by 4.3 percent compared with 2017.
Møller Baltic Import’s revenues increased by a massive 20 percent in 2018 to NOK 2,614 million, while profit before tax fell from NOK 48 million to NOK 29 million. The profit was heavily affected by costs related to a hailstorm that damaged over 700 new vehicles on their way to the Baltics. The margins on new cars are still low due to strong price competition. Volkswagen passenger cars had a market share of 10.7 percent, while Audi had a market share of 1.5 percent. Volkswagen Commercial Vehicles had a market share of 14.1 percent. The market shares are down slightly from 2017, apart from Volkswagen Commercial Vehicles,
which has made good progress. Estonia in particular still has great potential for improve-ment in terms of both Volkswagen passenger cars and Volkswagen Commercial Vehicles. The situation is expected to improve in 2019 after the opening of new Volkswagen dealer-ships in Ülemiste in Estonia in autumn 2018.
Car DealersMøller Bil, which has operations in Norway, Sweden and the Baltics, achieved a combined profit before tax of NOK 249 million in 2018, compared with NOK 362 million in 2017. The profit before tax for the Norwegian dealer net-work amounted to NOK 180 million, compared with NOK 299 million in 2017. The decrease is due to increased provisions related to buy-back cars and severance packages in con-nection with cost reductions. The underlying profit is on par with 2017 despite the fact that sales revenues were 9 percent lower. Effective measures have led to a 5 percent reduction in operating costs, and the profit from used cars has also improved. The Swedish car dealers recorded a profit of NOK 71 million, compared with the all time high figure of NOK 100 million in 2017. The decline is driven by a weaker total market for new cars in Sweden. The dealer-ships in the Baltics achieved their best-ever profit of NOK 46 million, compared with NOK 41 million in 2017. Sales revenue is increasing in all areas, and cost control is good.
Car FinanceVolkswagen Møller Bilfinans achieved a record-high profit before tax of NOK 315 million, compared with NOK 282 million in 2017. The Group’s share of 49% after tax
amounted to NOK 127 million, compared with NOK 117 million in 2017. Losses remain low, and although the interest margin has fallen slightly, the increased financing portfolio contributed to a higher profit.
The degree of financing remains high, and the total assets under management increased by a further 11 percent to NOK 19,533 million at 31 December 2018.
PERSONNEL, WORK ENVIRONMENT, THE ENVIRONMENT AND CORPORATE SOCIAL RESPONSIBILITYAt year-end 2018, Møller Mobility Group had a total of 4,260 employees, a decrease of 85 from the previous year. There are 661 employees in Sweden, a combined total of 736 employees in the three Baltic States, and 2,863 employees in Norway.
The proportion of women in the Group was approximately 16 percent at the end of 2018. At the beginning of 2019, there were three women in the Group management and a growing number of women in senior positions in the Group in general. We want to further increase these numbers, and we always encourage women to take part in our internal management programmes.
The Group’s work environment is considered to be good. Occupational health and safety and the work environment are monitored on an ongoing basis, in collaboration with the occupational health service.
Møller Mobility Group is a member of the UN
Global Compact. This is described in more detail in our Corporate Social Responsibility Report, which covers personnel, the work environment, the external environment and corporate social responsibility. For a more detailed description of these areas, please see the CSR Report.
MØLLER MOBILITY GROUP ASThe parent company, Møller Mobility Group AS, is in a solid financial position. The financial statements for 2018 have been prepared on the assumption that the parent company and the Group are going concerns, and the Board confirms that the basis for this assumption exists. It is the Board’s opinion that the annual financial statements and accompanying notes provide comprehensive information about the company’s operations and financial position at 31 December 2018. There have been no events following the end of the year that would affect an assessment of the company. There have been a number of equity allocations between the subsidiaries and the parent company in 2018, resulting in a substantial increase in the profit before tax for the parent company relative to 2017. In 2018, Møller Mobility Group AS had a profit after tax of NOK 1,290 million, which the Board proposes be allocated as follows:
Dividends and group contributions NOK 300 millionTransferred to other equity NOK 990 millionTotal allocated NOK 1 290 million
In addition to this, an additional dividend of NOK 300 million was distributed in 2018. The
31

CSR report 2018MMG AS Finances 2018Group Finances 2018 Annual report 2018
company had a book equity of NOK 2,622 mil-lion at the end of 2018, up from NOK 1,933 mil-lion in 2017. The company had 27 employees at 31 December 2018. The working environment is good, and the company does not pollute the external environment. The company’s head office is in Oslo.
OUTLOOK FOR 2019 AND BEYONDThe outlook for the Norwegian economy in 2019 is largely positive, with continued low unemployment and growth expected in investments, especially in the oil industry. The interest rate is still low but is expected to rise moderately, at the same time as the Norwe-gian krone is expected to strengthen slightly through the year. The shift from fossil-fuelled to chargeable cars is expected to continue with full force in Norway, and Møller Mobility Group estimates that half of the market for new cars will be electric in 2019. As per March 2019, the total market for new passenger cars in Norway is up by 14% compared with 2018,
and the number of electric cars has almost doubled, amounting to 48%. New emissions testing for commercial vehicles and petrol cars from 1 September 2019 may also affect car sales and the delivery situation during the year. From 1 January 2020, the EU’s new emission requirements will apply to all car manufactur-ers, with heavy fines for producers who are unable to achieve average CO2 emissions of max 95 grams per km for the total number of registered cars. This will further accelerate sales of low-emissions vehicles. Overall, Møller Mobility Group expects a relatively stable total market with sales of 150,000 passenger cars and 36,000 light commercial vehicles in Norway in 2019. The market in Sweden is expected to decline slightly in 2019 to approx-imately 335,000 passenger cars. In the Baltics, moderate further growth from the current levels is still expected.
There has been a surge in online trade in a wide range of industries in the past few years.
Online trade has been relatively limited in the automotive industry so far, but is expected to increase going forward. Møller Mobility Group continued to focus on new digital solutions in 2018 through the “Mitt Bilhold” service plat-form, reservation solutions for new cars, and the relaunch of SEAT in the Norwegian market with a fully digital sales solution. In 2019, the Group will continue its efforts to develop digital solutions for sales of cars and customer communication.
The emerging sharing economy and new pur-chasing and consumption patterns will have a huge impact on our value chain, and will also pave the way for new opportunities. Møller Mobility Group is now represented in two leading environments, both of which will be active in shaping the sustainable mobility solu-tions of the future. In 2017, the Group devel-oped a car-sharing service in partnership with the start-up company HYRE. The launch in 2018 was very successful, and the service is being
further developed in 2019. In 2018, the Group also invested in the micro-mobility company Urban Infrastructure Partner (UIP) and is now a minority owner with a 20% stake in the com-pany. UIP has a leading position in Norway within the operation and management of city bike services in Oslo, Bergen and Trondheim, and a scalable technological platform that provides significant growth opportunities in Europe.
The Board is moderately optimistic about the car markets in our geographical areas. In gen-eral, the Board is of the opinion that there will continue to be uncertainty about important framework conditions outside the company’s control. This applies to the general economic situation, but also to some extent to the car manufacturer’s arrangements and the author-ities’ influence through laws, taxes and duties, especially with respect to the tax regime for cars in Norway.
32
The Board of Møller Mobility Group ASOslo, 24 April 2019
Øyvind Schage Førde Harald A. Møller Jon Morten Møller Chair of the Board and Group CEO Board member Board member
Jacob Schram Kristin Solheim Genton Catrine Klouman Board membe Board member Board member

33 CSR report 2018MMG AS Finances 2018Group Finances 2018 Annual report 2018
Consolidated financial statements Møller Mobility Group Consolidated income statement 34
Group assets at 31 Dec. 35
Group equity and liabilities at 31 Dec. 36
Consolidated cash flow statement 37
Accounting policies 38
Notes to the consolidated financial statementNote 1 Segment information 41
Note 2 Payroll and other personnel costs 42
Note 3 Other operating costs 42
Note 4 Investments in associated companies 43
Note 5 Other financial income and financial costs 43
Note 6 Tangible fixed assets, intangible assets and goodwill 44
Note 7 Investments in other shares and units 44
Note 8 Pensions 45
Note 9 Stock 45
Note 10 Accounts receivable 46
Note 11 Other receivables 46
Note 12 Bank deposits 46
Note 13 Share capital and shareholder information 46
Note 14 Other current liabilities 47
Note 15 Related parties 47
Note 16 Pledges, guarantees and commitments 47
Note 17 Share capital 48
Note 18 Debt, financing and financial risk 48
Note 19 Taxes 50
Note 20 Significant transactions in the financial year 51
Financial statements Møller Mobility Group AS Income statement Mobility Group AS 52
Assets Møller Mobility Group AS at 31 Dec. 53
Equity and liabilities Møller Mobility Group AS at 31 Dec. 54
Cash flow statement 55
Notes Møller Mobility Group ASNote 1 Other operating revenues 56
Note 2 Payroll and other personnel costs 56
Note 3 Income from investments in subsidiaries 56
Note 4 Other financial income and financial costs 57
Note 5 Tangible fixed assets and intangible assets 57
Note 6 Investments in subsidiaries 57
Note 7 Investments in associated companies 58
Note 8 Pensions 58
Note 9 Balances with companies in the Aars Group 59
Note 10 Related parties 59
Note 11 Bank deposits 60
Note 12 Guarantees and commitments 60
Note 13 Share capital 60
Note 14 Liabilities, financing and financial risk 61
Note 15 Taxes 62
Auditor’s report 63
Finanical statements and notes 2018

34 CSR report 2018MMG AS Finances 2018Group Finances 2018 Annual report 2018
Consolidated income statementCONSOLIDATED INCOME STATEMENT
(Amounts in NOK millions) Note 2018 2017OPERATING REVENUESales revenue 25 700 27 871Other operating revenue 473 402Total operating revenue 1 26 173 28 273
OPERATING COSTSCost of goods 20 377 22 225Payroll and other personnel costs 2 2 829 2 812Depreciation and write-downs 6 291 234Other operating costs 3 1 914 1 964Total operating costs 25 411 27 235OPERATING PROFIT 762 1 038
FINANCIAL ITEMSIncome from investments in associated companies 4 126 117Other financial income 5 100 40Other financial costs 5 (107) (75)Total financial items 118 83
PROFIT BEFORE TAX 880 1 121
Taxes 19 191 260NET PROFIT 689 861
Majority 677 852Minorities 12 9
GROUP ASSETS AT 31 DEC.
(Amounts in NOK millions) Note 2018 2017ASSETSDeferred tax asset 19 271 243Intangible assets 6 254 276Goodwill 6 27 33Total intangible assets 552 552
Tangible fixed assets 6 632 628
Investments in associated companies 4 1 287 888Investments in shares 7 3 2Other receivables 11 10 13Total financial fixed assets 1 300 903
TOTAL FIXED ASSETS 2 484 2 084
Stock 9 3 629 3 335
Accounts receivable 10 1 313 1 345Other receivables 11 486 513Total receivables 1 798 1 858
Cash and cash equivalents 12 261 774
TOTAL CURRENT ASSETS 5 688 5 966
TOTAL ASSETS 8 172 8 050
GROUP EQUITY AND LIABILITIES AT 31 DEC.
(Amounts in NOK millions) Note 2018 2017EQUITYShare capital 13 48 48Other equity 3 177 3 122Minorities' interest 61 56TOTAL EQUITY 17 3 286 3 225
LIABILITIESDeferred tax 19 43 33Pension liabilities 8 53 54Other provisions and contingent liabilities 25 25Total provisions for liabilities 121 112
Liabilities to financial institutions 799 797Other non-current liabilities 17 17Total non-current liabilities 16, 18 816 815
Liabilities to financial institutions 18 9 64Accounts payable 736 756Tax payable 19 162 238Public duties payable 765 950Dividends and group contributions 312 213Other current liabilities 14 1 966 1 678Total current liabilities 3 950 3 898
TOTAL LIABILITIES 4 886 4 825
TOTAL EQUITY AND LIABILITIES 8 172 8 050
CONSOLIDATED CASH FLOW STATEMENT
(Amounts in NOK millions) Note 2018 2017CASH FLOW FROM OPERATIONSProfit before tax 880 1 121Depreciation and write-downs 6 291 234Gains from sale of fixed assets / companies (13) (22)Tax payable (267) (323)Own financing 891 1 010Change in stock (293) 208Change in accounts receivable and payables 3 248Change in other items (17) 321NET CASH FLOW FROM OPERATIONS 584 1 787
CASH FLOW FROM INVESTMENTSInvestments in tangible and intangible assets (312) (377)Sale of business assets (sales sum) 55 49Payments in connection with purchase of shares in subsidiaries and businesses (75) -Capital paid to AC (196) (74)Proceeds from sale of shares in associated companies 4 - 5Proceeds from sale of shares in subsidiaries - 33Proceeds and payments associated with financial fixed assets 2 (2)NET CASH FLOW FROM INVESTMENTS (526) (366)
CASH FLOW FROM FINANCINGNew loans 1 202Repayment of loans - (300)Dividends paid (517) (573)NET CASH FLOW FROM FINANCING (516) (671)
Change in cash and cash equivalents during year (458) 750 Cash reserve at 1 Jan. 710 (40)Cash reserve at 31 Dec. 252 710
Specification of cash reserve at 31 Dec.Means of payment 12 261 774Overdraft / current market loans 18 (9) (64)Cash reserve at 31 Dec. 252 710
Oslo, 26. mars 2015I styret for MøllerGruppen AS
...........................................Harald Møller
Styreleder
...........................................Øyvind Schage Førde
Styremedlem
...........................................Jon Morten Møller
Board member
..........................................Jacob SchramStyremedlem
..........................................Kristin Solheim Genton
Styremedlem
...........................................Jan Tellef Thorleifsson
Styremedlem
.........................................Pål SyversenKonsernsjef
Oslo, 24. april 2019The Board of Directors of Møller Mobility Group AS
...........................................Øyvind Schage FørdeChairman of the Board
...........................................Harald MøllerBoard member
..........................................Jacob SchramBoard Member
..........................................Kristin Solheim Genton
Board member
...........................................Cathrine Klouman
Board member
.........................................Terje Male
CEO

35 CSR report 2018MMG AS Finances 2018Group Finances 2018 Annual report 2018
Group assets
CONSOLIDATED INCOME STATEMENT
(Amounts in NOK millions) Note 2018 2017OPERATING REVENUESales revenue 25 700 27 871Other operating revenue 473 402Total operating revenue 1 26 173 28 273
OPERATING COSTSCost of goods 20 377 22 225Payroll and other personnel costs 2 2 829 2 812Depreciation and write-downs 6 291 234Other operating costs 3 1 914 1 964Total operating costs 25 411 27 235OPERATING PROFIT 762 1 038
FINANCIAL ITEMSIncome from investments in associated companies 4 126 117Other financial income 5 100 40Other financial costs 5 (107) (75)Total financial items 118 83
PROFIT BEFORE TAX 880 1 121
Taxes 19 191 260NET PROFIT 689 861
Majority 677 852Minorities 12 9
GROUP ASSETS AT 31 DEC.
(Amounts in NOK millions) Note 2018 2017ASSETSDeferred tax asset 19 271 243Intangible assets 6 254 276Goodwill 6 27 33Total intangible assets 552 552
Tangible fixed assets 6 632 628
Investments in associated companies 4 1 287 888Investments in shares 7 3 2Other receivables 11 10 13Total financial fixed assets 1 300 903
TOTAL FIXED ASSETS 2 484 2 084
Stock 9 3 629 3 335
Accounts receivable 10 1 313 1 345Other receivables 11 486 513Total receivables 1 798 1 858
Cash and cash equivalents 12 261 774
TOTAL CURRENT ASSETS 5 688 5 966
TOTAL ASSETS 8 172 8 050
GROUP EQUITY AND LIABILITIES AT 31 DEC.
(Amounts in NOK millions) Note 2018 2017EQUITYShare capital 13 48 48Other equity 3 177 3 122Minorities' interest 61 56TOTAL EQUITY 17 3 286 3 225
LIABILITIESDeferred tax 19 43 33Pension liabilities 8 53 54Other provisions and contingent liabilities 25 25Total provisions for liabilities 121 112
Liabilities to financial institutions 799 797Other non-current liabilities 17 17Total non-current liabilities 16, 18 816 815
Liabilities to financial institutions 18 9 64Accounts payable 736 756Tax payable 19 162 238Public duties payable 765 950Dividends and group contributions 312 213Other current liabilities 14 1 966 1 678Total current liabilities 3 950 3 898
TOTAL LIABILITIES 4 886 4 825
TOTAL EQUITY AND LIABILITIES 8 172 8 050
CONSOLIDATED CASH FLOW STATEMENT
(Amounts in NOK millions) Note 2018 2017CASH FLOW FROM OPERATIONSProfit before tax 880 1 121Depreciation and write-downs 6 291 234Gains from sale of fixed assets / companies (13) (22)Tax payable (267) (323)Own financing 891 1 010Change in stock (293) 208Change in accounts receivable and payables 3 248Change in other items (17) 321NET CASH FLOW FROM OPERATIONS 584 1 787
CASH FLOW FROM INVESTMENTSInvestments in tangible and intangible assets (312) (377)Sale of business assets (sales sum) 55 49Payments in connection with purchase of shares in subsidiaries and businesses (75) -Capital paid to AC (196) (74)Proceeds from sale of shares in associated companies 4 - 5Proceeds from sale of shares in subsidiaries - 33Proceeds and payments associated with financial fixed assets 2 (2)NET CASH FLOW FROM INVESTMENTS (526) (366)
CASH FLOW FROM FINANCINGNew loans 1 202Repayment of loans - (300)Dividends paid (517) (573)NET CASH FLOW FROM FINANCING (516) (671)
Change in cash and cash equivalents during year (458) 750 Cash reserve at 1 Jan. 710 (40)Cash reserve at 31 Dec. 252 710
Specification of cash reserve at 31 Dec.Means of payment 12 261 774Overdraft / current market loans 18 (9) (64)Cash reserve at 31 Dec. 252 710
Oslo, 26. mars 2015I styret for MøllerGruppen AS
...........................................Harald Møller
Styreleder
...........................................Øyvind Schage Førde
Styremedlem
...........................................Jon Morten Møller
Board member
..........................................Jacob SchramStyremedlem
..........................................Kristin Solheim Genton
Styremedlem
...........................................Jan Tellef Thorleifsson
Styremedlem
.........................................Pål SyversenKonsernsjef
Oslo, 24. april 2019The Board of Directors of Møller Mobility Group AS
...........................................Øyvind Schage FørdeChairman of the Board
...........................................Harald MøllerBoard member
..........................................Jacob SchramBoard Member
..........................................Kristin Solheim Genton
Board member
...........................................Cathrine Klouman
Board member
.........................................Terje Male
CEO

36 CSR report 2018MMG AS Finances 2018Group Finances 2018 Annual report 2018
Group equity and liabilities
CONSOLIDATED INCOME STATEMENT
(Amounts in NOK millions) Note 2018 2017OPERATING REVENUESales revenue 25 700 27 871Other operating revenue 473 402Total operating revenue 1 26 173 28 273
OPERATING COSTSCost of goods 20 377 22 225Payroll and other personnel costs 2 2 829 2 812Depreciation and write-downs 6 291 234Other operating costs 3 1 914 1 964Total operating costs 25 411 27 235OPERATING PROFIT 762 1 038
FINANCIAL ITEMSIncome from investments in associated companies 4 126 117Other financial income 5 100 40Other financial costs 5 (107) (75)Total financial items 118 83
PROFIT BEFORE TAX 880 1 121
Taxes 19 191 260NET PROFIT 689 861
Majority 677 852Minorities 12 9
GROUP ASSETS AT 31 DEC.
(Amounts in NOK millions) Note 2018 2017ASSETSDeferred tax asset 19 271 243Intangible assets 6 254 276Goodwill 6 27 33Total intangible assets 552 552
Tangible fixed assets 6 632 628
Investments in associated companies 4 1 287 888Investments in shares 7 3 2Other receivables 11 10 13Total financial fixed assets 1 300 903
TOTAL FIXED ASSETS 2 484 2 084
Stock 9 3 629 3 335
Accounts receivable 10 1 313 1 345Other receivables 11 486 513Total receivables 1 798 1 858
Cash and cash equivalents 12 261 774
TOTAL CURRENT ASSETS 5 688 5 966
TOTAL ASSETS 8 172 8 050
GROUP EQUITY AND LIABILITIES AT 31 DEC.
(Amounts in NOK millions) Note 2018 2017EQUITYShare capital 13 48 48Other equity 3 177 3 122Minorities' interest 61 56TOTAL EQUITY 17 3 286 3 225
LIABILITIESDeferred tax 19 43 33Pension liabilities 8 53 54Other provisions and contingent liabilities 25 25Total provisions for liabilities 121 112
Liabilities to financial institutions 799 797Other non-current liabilities 17 17Total non-current liabilities 16, 18 816 815
Liabilities to financial institutions 18 9 64Accounts payable 736 756Tax payable 19 162 238Public duties payable 765 950Dividends and group contributions 312 213Other current liabilities 14 1 966 1 678Total current liabilities 3 950 3 898
TOTAL LIABILITIES 4 886 4 825
TOTAL EQUITY AND LIABILITIES 8 172 8 050
CONSOLIDATED CASH FLOW STATEMENT
(Amounts in NOK millions) Note 2018 2017CASH FLOW FROM OPERATIONSProfit before tax 880 1 121Depreciation and write-downs 6 291 234Gains from sale of fixed assets / companies (13) (22)Tax payable (267) (323)Own financing 891 1 010Change in stock (293) 208Change in accounts receivable and payables 3 248Change in other items (17) 321NET CASH FLOW FROM OPERATIONS 584 1 787
CASH FLOW FROM INVESTMENTSInvestments in tangible and intangible assets (312) (377)Sale of business assets (sales sum) 55 49Payments in connection with purchase of shares in subsidiaries and businesses (75) -Capital paid to AC (196) (74)Proceeds from sale of shares in associated companies 4 - 5Proceeds from sale of shares in subsidiaries - 33Proceeds and payments associated with financial fixed assets 2 (2)NET CASH FLOW FROM INVESTMENTS (526) (366)
CASH FLOW FROM FINANCINGNew loans 1 202Repayment of loans - (300)Dividends paid (517) (573)NET CASH FLOW FROM FINANCING (516) (671)
Change in cash and cash equivalents during year (458) 750 Cash reserve at 1 Jan. 710 (40)Cash reserve at 31 Dec. 252 710
Specification of cash reserve at 31 Dec.Means of payment 12 261 774Overdraft / current market loans 18 (9) (64)Cash reserve at 31 Dec. 252 710
Oslo, 26. mars 2015I styret for MøllerGruppen AS
...........................................Harald Møller
Styreleder
...........................................Øyvind Schage Førde
Styremedlem
...........................................Jon Morten Møller
Board member
..........................................Jacob SchramStyremedlem
..........................................Kristin Solheim Genton
Styremedlem
...........................................Jan Tellef Thorleifsson
Styremedlem
.........................................Pål SyversenKonsernsjef
Oslo, 24. april 2019The Board of Directors of Møller Mobility Group AS
...........................................Øyvind Schage FørdeChairman of the Board
...........................................Harald MøllerBoard member
..........................................Jacob SchramBoard Member
..........................................Kristin Solheim Genton
Board member
...........................................Cathrine Klouman
Board member
.........................................Terje Male
CEO
The Board of Directors of Møller Mobility Group AS
Oslo, 24 April 2019
Øyvind Schage FørdeChair of the Board and Group CEO
Harald A. MøllerBoard member
Jon Morten MøllerBoard member
Jacob SchramBoard member
Kristin Solheim GentonBoard member
Cathrine KloumanBoard member

37 CSR report 2018MMG AS Finances 2018Group Finances 2018 Annual report 2018
Consolidated cash flow statement
CONSOLIDATED INCOME STATEMENT
(Amounts in NOK millions) Note 2018 2017OPERATING REVENUESales revenue 25 700 27 871Other operating revenue 473 402Total operating revenue 1 26 173 28 273
OPERATING COSTSCost of goods 20 377 22 225Payroll and other personnel costs 2 2 829 2 812Depreciation and write-downs 6 291 234Other operating costs 3 1 914 1 964Total operating costs 25 411 27 235OPERATING PROFIT 762 1 038
FINANCIAL ITEMSIncome from investments in associated companies 4 126 117Other financial income 5 100 40Other financial costs 5 (107) (75)Total financial items 118 83
PROFIT BEFORE TAX 880 1 121
Taxes 19 191 260NET PROFIT 689 861
Majority 677 852Minorities 12 9
GROUP ASSETS AT 31 DEC.
(Amounts in NOK millions) Note 2018 2017ASSETSDeferred tax asset 19 271 243Intangible assets 6 254 276Goodwill 6 27 33Total intangible assets 552 552
Tangible fixed assets 6 632 628
Investments in associated companies 4 1 287 888Investments in shares 7 3 2Other receivables 11 10 13Total financial fixed assets 1 300 903
TOTAL FIXED ASSETS 2 484 2 084
Stock 9 3 629 3 335
Accounts receivable 10 1 313 1 345Other receivables 11 486 513Total receivables 1 798 1 858
Cash and cash equivalents 12 261 774
TOTAL CURRENT ASSETS 5 688 5 966
TOTAL ASSETS 8 172 8 050
GROUP EQUITY AND LIABILITIES AT 31 DEC.
(Amounts in NOK millions) Note 2018 2017EQUITYShare capital 13 48 48Other equity 3 177 3 122Minorities' interest 61 56TOTAL EQUITY 17 3 286 3 225
LIABILITIESDeferred tax 19 43 33Pension liabilities 8 53 54Other provisions and contingent liabilities 25 25Total provisions for liabilities 121 112
Liabilities to financial institutions 799 797Other non-current liabilities 17 17Total non-current liabilities 16, 18 816 815
Liabilities to financial institutions 18 9 64Accounts payable 736 756Tax payable 19 162 238Public duties payable 765 950Dividends and group contributions 312 213Other current liabilities 14 1 966 1 678Total current liabilities 3 950 3 898
TOTAL LIABILITIES 4 886 4 825
TOTAL EQUITY AND LIABILITIES 8 172 8 050
CONSOLIDATED CASH FLOW STATEMENT
(Amounts in NOK millions) Note 2018 2017CASH FLOW FROM OPERATIONSProfit before tax 880 1 121Depreciation and write-downs 6 291 234Gains from sale of fixed assets / companies (13) (22)Tax payable (267) (323)Own financing 891 1 010Change in stock (293) 208Change in accounts receivable and payables 3 248Change in other items (17) 321NET CASH FLOW FROM OPERATIONS 584 1 787
CASH FLOW FROM INVESTMENTSInvestments in tangible and intangible assets (312) (377)Sale of business assets (sales sum) 55 49Payments in connection with purchase of shares in subsidiaries and businesses (75) -Capital paid to AC (196) (74)Proceeds from sale of shares in associated companies 4 - 5Proceeds from sale of shares in subsidiaries - 33Proceeds and payments associated with financial fixed assets 2 (2)NET CASH FLOW FROM INVESTMENTS (526) (366)
CASH FLOW FROM FINANCINGNew loans 1 202Repayment of loans - (300)Dividends paid (517) (573)NET CASH FLOW FROM FINANCING (516) (671)
Change in cash and cash equivalents during year (458) 750 Cash reserve at 1 Jan. 710 (40)Cash reserve at 31 Dec. 252 710
Specification of cash reserve at 31 Dec.Means of payment 12 261 774Overdraft / current market loans 18 (9) (64)Cash reserve at 31 Dec. 252 710
Oslo, 26. mars 2015I styret for MøllerGruppen AS
...........................................Harald Møller
Styreleder
...........................................Øyvind Schage Førde
Styremedlem
...........................................Jon Morten Møller
Board member
..........................................Jacob SchramStyremedlem
..........................................Kristin Solheim Genton
Styremedlem
...........................................Jan Tellef Thorleifsson
Styremedlem
.........................................Pål SyversenKonsernsjef
Oslo, 24. april 2019The Board of Directors of Møller Mobility Group AS
...........................................Øyvind Schage FørdeChairman of the Board
...........................................Harald MøllerBoard member
..........................................Jacob SchramBoard Member
..........................................Kristin Solheim Genton
Board member
...........................................Cathrine Klouman
Board member
.........................................Terje Male
CEO
38 CSR report 2018MMG AS Finances 2018Group Finances 2018 Annual report 2018
The consolidated financial statements present financial information about the Group as a whole when group companies are treated as a single accounting unit. The companies that Møller Mobility Group has a controlling influence over are consolidated. The consoli-dated financial statements include the parent company Møller Mobility Group AS and the companies listed in note 5 to Møller Mobility Group AS’s accounts, and their subsidiaries. Subsidiaries are consolidated from the moment control is transferred to the Group (acquisition date), and consolidation ceases when control of the subsidiary ceases.
Elimination of internal transactions All transactions and balances between group companies are eliminated. Stock and other business assets are adjusted for unrealised internal profit.
Elimination of shares in subsidiaries Shares in subsidiaries are consolidated using the acquisition method. The cost price of the shares in the individual subsidiary is elimi-nated against the subsidiary’s equity on the acquisition date. The subsequent increase or decrease in value is added to the assets and liabilities on the balance sheet as increased / reduced value associated with and accounted
for during the asset’s remaining lifetime. Increased / reduced values that cannot be attributed to specific assets or liabilities are recognised as goodwill / badwill on the bal-ance sheet and depreciated / recognised as income over their financial lifetime.
In the case of acquisitions of subsidiaries with a minority, 100% of identifiable assets and liabilities are recognised on the balance sheet, while for goodwill only the majority share is recognised.
Disposal of subsidiaries Where the Group reduces its stake to 50% or lower, profit/ (loss) is recorded as though the entire company had been sold. This means that the remaining stake is measured at fair value.
Conversion of foreign subsidiaries Balance sheet items in foreign subsidiaries are translated using the closing rate, while earn-ings are translated using the weighted average exchange rate. Translation differences relating to foreign subsidiaries are charged to equity.
Minority interests Minority interests are extracted as separate items in the income statement and on the
balance sheet. In the income statement the minorities’ share of the result after tax is calcu-lated and shown.
Minority interests on the balance sheet rep-resent the minorities’ share of the companies’ equity, taking into account the minorities’ share of increased / reduced values and internal profits.
Associated companies and joint ventures Shares in companies in which the Group holds between 20% and 50%, and over which the Group has significant influence and where the investment is long term in nature are consoli-dated in accordance with the equity method in the consolidated financial statements. This means the Group’s share of the net profit after tax and depreciation of any increased values are recognised under financial items and added to the carrying amount of the share. Internal sales of the business assets of associ-ated companies are corrected for unrealised internal profit.
Stakes in joint ventures are treated according to the same policy. In the company accounts, associated companies are accounted for using the cost method. The investment is valued at the lower of cost and fair value.
Individual stakes in smaller companies with limited value and profit are treated as ordinary share investments, which are assessed at the lower of cost price and fair value.
ACCRUALS, CLASSIFICATION AND MEASUREMENT POLICIES Fundamental accounting policies The financial statements have been prepared in accordance with the Norwegian Accounting Act and generally accepted accounting pol-icies based on the fundamental principles of historical cost, comparability, going concern, congruence and prudence. Transactions are recognised at the value of the remuneration on the transaction date. Income is recognised when earned, and costs are matched with earned income.
Classification of assets and liabilities Goods, current receivables and current lia-bilities include items due for payment within one year of their acquisition, and items related to goods circulation. The current portion of non-current liabilities due within one year is classified as non-current liabilities. Other items are classified as non-current assets or non-cur-rent liabilities.
Accounting policies

39 CSR report 2018MMG AS Finances 2018Group Finances 2018 Annual report 2018
Estimates Estimates are used to measure income, costs, balance sheet items and other liabilities for which there are no market values. This applies to the measurement of warranty liabilities, obsolete stock, pensions, and goodwill, other long-term provisions and deferred losses on repurchase liabilities. Future
events may lead to changes in the estimates. Estimates and underlying conditions are assessed continually. Changes to accounting estimates are recognised in the period the change occurs.
Income recognition The Group sells products and services, which are recognised on delivery. For sales of new cars with repurchase agreements, the sale is recognised on delivery. Subsequent repur-chases and sales of repurchased cars are recognised as separate transactions. Total repurchase liabilities are detailed in note 15.
For sales of new cars, vehicle import duty to the State comprises a significant amount. This is not shown as revenue, but is only included as current liabilities in the financial statements. The proportion of sales revenue related to future aftersales contracts is recognised as unearned income upon the sale and is recog-nised as income as the services are provided.
Tangible and intangible fixed assets Tangible fixed assets and intangible assets on the balance sheet are stated at cost less ordinary depreciation. Ordinary depreciation and amortisation in the income statement is on
a straight-line basis and is based on estimates of the financial and technical lifespan.
On indication that the carrying amount of a fixed asset is higher than its fair value, a test for impairment will be conducted. The test is conducted for the lowest level of the fixed assets that have independent cash flow. If the carrying amount is higher than both the value and the recoverable amount (present value of continued use or ownership), the asset is written down to the higher of sales value and recoverable amount. Write-downs are reversed if the basis for the write-down no longer exists.
Lease agreements that are not recognised (operational leasing) are presented in the financial statements as an operational cost and the annual leasing amount is presented in note 6. Leased assets are recognised on the balance sheet if the lease transfers substan-tially all the risks and rewards incidental to ownership of the assets.
Shares and units Shares in subsidiaries of a strategic nature and other long-term investments are classified as fixed assets and recognised at the lower of cost price and fair value. Dividends from subsidiaries are recognised in the same year as the company sells them. Dividends from other companies are recognised as income when the dividends are paid.
Short-term investments are classified as current assets and are measured at the lower of cost price and fair value.
Stock Stocks of cars are assessed at the lower of cost price and assumed retail price after sales costs. An individual assessment is made of each car. Parts and equipment are recognised at aver-age procurement cost (in accordance with the FIFO principle). Write-downs are made for obsolescence.
Accounts receivable and other receivables Accounts receivable and other receivables are recognised on the balance sheet at their nominal rate after the deduction of confirmed and expected losses.
Other financial investments Short-term financial investments are recog-nised at market value.
Taxes Taxes consist of tax payable and changes to deferred tax. Tax payable is fixed based on the year’s taxable result. Deferred tax on the bal-ance sheet is calculated based on temporary differences between taxable and accounting values and tax losses carried forward. Deferred tax assets where future use is uncertain are not recorded. Deferred tax and deferred tax assets are presented net on the balance sheet when there is a basis for offsetting. If the tax rate has changed since the previous year, the new tax rate is used to calculate deferred tax.
Deferred tax and deferred tax assets on acqui-sitions are calculated based on the difference between fair value and book value in acquired companies for identifiable assets and liabilities. Deferred tax is not calculated on goodwill and
increased value of properties upon acquisi-tion. Deferred tax on temporary differences associated with investments in subsidiaries is included, unless the temporary difference is unlikely to be reversed in the immediate future.
Pensions The Norwegian companies have a defined-contribution group pension scheme, which is covered by insurance companies.
In addition, the Norwegian companies have a few unfunded pension liabilities, which are charged directly to operations and calcu-lated by an actuary. Most of the Norwegian companies are covered by the contractual early retirement scheme (the “AFP” scheme) through the Norwegian Federation of Trade Unions (LO) and the Confederation of Nor-wegian Enterprise (NHO). Although this is a defined-benefit scheme, there is no direct allo-cation of assets and liabilities for each individ-ual company. The scheme is therefore treated as a defined-contribution plan for accounting purposes where premiums are charged as a cost as they are incurred.
The Swedish companies have group pension schemes (defined-benefit and defined-con-tribution schemes), which are governed by collective agreements. The companies in Lithuania, Latvia and Estonia do not have pen-sion plans.
The accounting for pensions has now changed from following the Norwegian Accounting Standard (NRS 6) to accounting in accordance

40 CSR report 2018MMG AS Finances 2018Group Finances 2018 Annual report 2018
with IAS 19. This means that on the transition date actuarial gains and/or losses were set to zero and charged to equity. In accordance with the new policy, the year’s actuarial gains and/or losses were charged to equity.
Defined-contribution pensions are calculated on an ongoing basis in the financial state-ments, with the Group contributing a certain percentage share of the employee’s salary to the insurance company. The contributions are invested in funds, and employees can choose between various savings profiles. Apart from this, the Group has no other liabilities to its employees in this scheme.
Financial instruments When hedging future interest costs, where the hedging instruments are intended to protect the Group from variations in future cash flows, the hedging instrument is not recorded in the balance sheet as long as the hedging is con-sidered effective. Gains or losses are recorded at net in line with the result for the hedged item. For interest rate swap agreements where the hedging is not considered effective, the hedging instrument is recorded at market value in the balance sheet. Changes in market value are recorded in the income statement as they arise.
For currency forward contracts, the intention of which is to hedge assets and liabilities, where the hedge is considered to be effective, both the hedging instrument and the hedged item are evaluated at fair value, and gains and losses are recognised. When hedging net investments in foreign currency and where the
hedge is considered effective, the currency forward contract is evaluated at fair value. Changes to fair value are charged directly to equity.
Foreign currency Monetary items denominated in foreign currencies are measured at the balance sheet date, and related foreign exchange gains/(losses) are recognised as financial items. This applies to cash and cash equivalents, receiv-ables and liabilities. For non-cash items, the price at the transaction date is used as a basis for the acquisition cost and is not translated later. This applies mainly to stock and tangible fixed assets. The sale and purchase of goods and services in foreign currencies is calcu-lated at the exchange rate on the date of the transaction.
The Group uses Norwegian kroner (NOK) as its presentation currency. The Group is exposed to changes in currency in SEK and EUR. Within the Group loans are granted in SEK and EUR.
Warranty allocations The Group incurs warranty liabilities through sales of new cars in accordance with the warranties provided by the various manu-facturers and regulations in the individual country. The manufacturers normally provide warranties according to applicable guidelines, but importers and dealers provide warranties in addition to these in accordance with local laws and any goodwill payment. Warranty periods vary from one to 12 years.
With the sale of used cars, the dealer generally
handles the warranty liabilities, in addition to the remaining manufacturer’s warranty.
Ongoing provisions and assessments are made for future liabilities.
Contingent liabilities Contingent liabilities are not recognised in the financial statements. Contingent liabilities are recognised when it is more than 50% likely that a liability will be incurred and the liability can be measured reliably.
Repurchase agreements The Group has a portfolio of sold new cars with guaranteed repurchase prices. The repur-chase prices vary from 50–70% depending on the rental period, mileage and model of car. The agreements are not recognised on the balance sheet. The liabilities are continuously assessed, and provisions are made for any anticipated losses.
Cash flow statement The indirect method is used when preparing the cash flow statement. Liquid assets include cash, cash equivalents, financial investments (money market funds) and bank overdrafts.
LONG-TERM PARTNERSHIP CONTRACTS Volkswagen ag, audi ag, and škoda auto-mobilava as (companies in the volkswagen group) Harald A. Møller AS’s contracts with Volkswa-gen, Volkswagen Commercial Vehicles, Škoda and Audi have an average notice period of two years.
The contracts with Audi and Volkswagen in the Baltic States have an average notice period of two years. The Volkswagen contract applies to Estonia, Latvia and Lithuania, while the Audi contract applies to Latvia and Lithuania.
Volkswagen Financial Services AG (company in the Volkswagen Group)
In 2009, Volkswagen Financial Services AG and Møller Mobility Group AS set up the company Volkswagen Møller Bilfinans AS to sell car financing products in Norway. Volkswagen Financial Services AG owns 51% and Møller Mobility Group AS 49% of the company. The current shareholders have preferential rights if shares are put up for sale.
Volkswagen Møller Bilfinans AS is treated as an associated company and incorporated using the equity method.

41 CSR report 2018MMG AS Finances 2018Group Finances 2018 Annual report 2018
NotesNOTES TO THE CONSOLIDATED FINANCIAL STATEMENTS
All figures are in NOK millions.
Note 1 - Segment information
The business consists of the following business areas: Car Imports (Norway and Baltics), Car Dealers (Norway, Sweden and Baltics) and Car Finance (Norway).
The business areas report the following key figures:2018
Car Imports Car Dealers Car Finance Other companies Eliminations Group
Operating revenue 14 918 20 154 - 330 (9 229) 26 173Operating profit/(loss) 659 284 - (176) (5) 762Depreciation and write-downs 37 118 - 134 2 291Income from investments in associated companies - - 127 (1) - 126EBITDA 696 401 127 (42) (2) 1 180Other financial results (1) (35) - 27 - (8)Profit/(loss) before tax 658 249 127 (149) (5) 880
Assets 3 577 4 779 632 4 895 (5 711) 8 172
Norway Baltics Oslo West-Norway Mid-Norway Sweden BalticsOperating revenue 12 304 2 614 5 637 4 485 3 496 3 890 2 588EBITDA 664 33 86 137 62 95 59Profit/(loss) before tax 629 29 51 93 36 71 46Assets 2 907 670 1 237 1 023 891 632 718
2017
Car Imports Car Dealers Car Finance Other companies Eliminations Group
Operating revenue 16 247 21 784 - 318 (10 076) 28 273Operating profit/(loss) 858 391 - (126) (85) 1 038Depreciation and write-downs 22 123 - 87 2 234Income from investments in associated companies - - 117 - - 117EBITDA 881 514 117 (39) (83) 1 389Other financial results (4) (29) - (1) - (34)Profit/(loss) before tax 854 362 117 (127) (85) 1 121
Assets 3 094 5 028 518 3 880 (4 471) 8 050
Norway Baltics Oslo West-Norway Mid-Norway Sweden BalticsOperating revenue 14 070 2 177 6 550 5 003 3 683 4 158 2 332EBITDA 831 50 163 151 94 124 52Profit/(loss) before tax 806 48 122 106 71 100 41Assets 2 777 317 1 465 1 087 902 707 535
Note 2 - Payroll and other personnel costs
2018 2017Salaries 2 229 2 197Employer's NI contributions 352 345Pension costs 158 157Other personnel costs 90 114Total payroll and other personnel costs 2 829 2 812
Average number of employees 4 303 4 296Loans to employees 20 29
2018 2017Salaries, bonuses, pension costs and other remuneration for the CEO 8 7Board fees 2 2Total remuneration of senior executives 10 9
Loans to employees are mainly interest-bearing car loans where the companies have security in a car. The interest rate on these loans is 2.1%. In the event of sale, liquidation or other reorganisation, general managers in the Group are entitled to salary for one year, under certain terms.
2018 2017Audit fees and audit-related services 4 4Tax, fees and other consultancy services - 1Total auditor's fees (excl. VAT) 4 5
Note 3 - Other operating costs
2018 2017Operating costs (rent, electricity, maintenance, car costs, etc.) 965 949Sales costs (advertising, warranties, etc.) 714 758Administration costs (IT services, fees, travel expenses, gifts, bad debts) 236 257Total other operating costs 1 914 1 964
Note 4 - Investments in associated companies
Voting Equity Carrying Internal Additions Share of profit Carryingrights/ in company amount profit disposals after tax amount
Company name stake 31.12.18 01.01.18 2018 31.12.18Volkswagen Møller Bilfinans AS * 49,00 % 3 006 888 14 183 127 1 212UIP Holding AS** 20,55 % 16 - - 75 (1) 74Total 888 14 259 126 1 287
Investments in associated companies are incorporated in accordance with the equity method.
Note 5 - Other financial income and financial costs
2018 2017Interest income 5 5Currency gains 93 34Other financial income 2 2Total other financial income 100 40
Interest costs 22 23Currency losses 75 42Other financial costs 10 10Total other financial costs 107 75
Note 6 - Tangible fixed assets, intangible assets and goodwill
Machinery and Vehicles Buildings Intangible Goodwill* Totalfixtures assets
Acquisition cost at 1 Jan. 988 136 422 566 106 2 218Additions 87 85 36 119 - 327Disposals (57) (82) (1) (8) - (147)Currency translation difference (4) - - - (2) (6)Acquisition cost at 31 Dec. 1 014 140 457 678 104 2 392Accumulated depreciation at 1 Jan. 670 21 227 290 73 1 281Year's depreciation and write-downs 87 32 30 135 7 291Disposals (56) (32) - (1) - (89)Currency translation difference (1) - - - (2) (3)Depreciated at 31 Dec. 701 20 258 424 78 1 481Carrying amount at 31 Dec. 313 120 199 254 27 913* Goodwill in connection with acquisition of new companies, and goodwill in company financial statements.
Straight-line depreciation plan 3-7 years 3-7 years 20-50 years 3-10 years 5-10 years
Annual rental of off balance sheet business assets 14 404 418
Duration of rental of business assets 1-5 years 1-5 years 1-15 years
Tekst
Specification of goodwill in connection with acquisitions:Business unit Acquisition Depreciation Acquisition Accumulated Carrying Year's
date period cost* depreciation* amount* depreciationCar Dealers Norway 2016 10 years 4 1 3 1Car Dealers Sweden 2014 10 years 28 12 16 3
2011 10 years 32 25 7 3Car Dealers Sweden 2008 10 years 40 40 - -Total goodwill in connection with acquisitions 104 78 26 7* Incl. currency translation difference
Note 7 - Investments in other shares and units
Note 8 - Pensions
2018 2017Interest cost of pension liabilities 1 3Year's pension costs for funded and unfunded pensions 1 3Defined-contribution pension 109 107Defined-benefit pension not calculated by an actuary 48 46Total pension costs 158 157
Carrying amount pension obligations calculated by an actuary Calculated pension liabilities at 1 Jan. 2018 (54) (51)Actuarial gains and/or losses are charged to equity (2) -The year's pension costs (1) (3)The year's pension payments 2 2Currency translation difference 2 (2)Pension liabilities (53) (54)
Number of people covered by all pension plans 3 467 3 500
Financial assumptions Sweden NorwayReturn on pension assets - 0,0 %Discount rate 2,3 % 2,6 %Annual salary growth / annual G adjustment 2,0 % 0,0 %
The actuarial assumptions relating to demographic factors are the normal assumptions used by the insurance industry, adapted to the Group's age structure and retirement. All pension liabilities include the employers' National Insurance contribution.
Note 9 - Stock
2018 2017New cars 1 883 1 373Used cars and demonstration cars 1 419 1 688Parts and equipment 263 264Other stock 64 10Total stock 3 629 3 335
Note 10 - Accounts receivable
2018 2017Accounts receivable 1 319 1 345Provisions for bad debt (8) (11)Accounts receivable Aars Group 2 11Total accounts receivable 1 313 1 345
Note 11 - Other receivables
2018 2017Loans to employees 9 13Other long term receivables 1 - Total non-current receivables 10 13
2018 2017Advances to suppliers 6 9Loans to employees 12 16Net VAT credit 4 3Other prepaid expenses 66 101Accrued income 246 181Other current receivables 151 202Total current receivables 486 513
Note 12 - Bank depositsThe Group has bank deposits totalling NOK 261 million. There are no restricted funds to cover tax owed. Tax deductions are secured bya bank guarantee (see note 16).
Note 13 - Share capital and shareholder information
Shareholders in Møller Mobility Group AS at 31 Dec. 2018 Number StakeA shares:Jan H. Møller 103 0,375 %B shares:Jan H. Møller 1 0,004 %Aars AS 24 778 90,102 %Møller MI AS 2 618 9,520 %Total 27 500 100,00 %
The share capital consists of 27,500 shares with a nominal value of NOK 1,734, in total NOK 48 million. There are two classes of share. All shares have equal voting rights. Aars AS votes for 98.112 % of the shares, 8.01 % is indirectly through Møller MI AS. Class A shares are guaranteed an annual dividendof NOK 5 million, collected from Møller Mobility Group AS and Møller Eiendom Holding AS.
Note 14 - Other current liabilities
2018 2017Provision for warranties and other liabilities 851 699Accrued costs and prepaid income 510 485Holiday pay and accrued salary 354 349Advances from customers 251 146Total other current liabilities 1 966 1 678
Note 15 - Related parties
Company Company relationship Transaction type 2018 2017Volkswagen Møller Bilfinans AS Associated company Sale of cars 3 572 4 227Total sales 3 572 4 227
Volkswagen Møller Bilfinans AS Associated company Purchase of cars 1 439 1 587Møller Eiendom Associated group Rent costs 219 187Total purchases 1 658 1 774
Volkswagen Møller Bilfinans AS Associated company Balances at 31 December 49 150Infocare AS Sister Balances at 31 December 24 -Aars AS Parent Balances at 31 December 249 183
Note 16 - Pledges, guarantees and commitments
2018 2017Fixtures 47 45Accounts receivable and stock 879 458Total carrying amount of assets with encumbrances 926 503
Guarantees 2018 2017Repurchase agreements for cars 8 073 7 063Vehicle import duty, Customs Region Oslo and Akershus 135 135Withholding tax 119 115Employees 7 8
Note 17 - Share capital
2018 Majority Minorities TotalEquity at 1 Jan. 2018 3 169 56 3 225Change in accounting principles regarding associated company (note 4) (13) - (13)Profit/(loss) for the year 677 12 689Annual dividend* (578) (10) (588)Group contributions (22) - (22)Pension Sweden (2) - (2)Currency translation differences this year, etc. (5) 3 (2)Equity at 31 Dec. 2018 3 225 61 3 286* Includes an additional dividend of NOK 300 million
Accumulated translation differences at 31 December 2018 amounted to NOK 100 million.
2017 Majority Minorities TotalEquity at 1 Jan. 2017 2 880 53 2 934Profit/(loss) for the year 852 9 861Annual dividend* (578) (6) (584)Group contributions (22) - (22)Currency translation differences this year, etc. 36 - 36Equity at 31 Dec. 2017 3 169 56 3 225* Includes an additional dividend of NOK 400 million
Note 18 - Debt, financing and financial risk
2018 2017Overdraft* 9 64Total current interest-bearing liabilities 9 64
Bond issue 800 800Arrangement costs (1) (3)Total bond issue 799 797Other long-term interest-bearing liabilities 17 17Total non-current interest-bearing liabilities 816 815
MaturityDue in less than 2 years 409 464Due in 2-5 years 416 415Total 825 879
Key figuresUnused committed credit facilities 1 100 1 168* Overdraft outside the cashpool
Car Imports Car Dealers
Car Imports Car Dealers
Car Dealers Baltics
At 31 December 2018 the CEO and board members own 0.34% and 0.44% stakes, respectively, in Møller MI AS. Møller MI AS is an investment company where senior executives have the opportunity to invest. The CEO is the CEO of Møller Mobility Group AS and is employed and paid by the parent company. Bonus schemes have been established here where the size of the payment depends on the results achieved for the year, combined with other qualitative assessment criteria, and where the bonus is considered to be part of the normal remuneration for this type of position. Two executives are entitled to two years' salary in the event of major reorganisations.
Some subsidiaries in Møller Mobility Group have a number of minor equity investments with holdings of 20-35%, such as repair and lacquer workshops and the tyre hotel. These are not treated as associated companies since they have limited value and small profits. At 31 December 2018 these investments had a total carrying amount of NOK 3 million.
The Norwegian and Swedish companies in the Group have secured collective pension agreements. The companies in the three Baltic states do not have pension plans. In Norway we have an ongoing defined-contribution scheme. The defined-contribution plan is charged as a cost on an ongoing basis in the financial statements as the Group pays an amount of savings to the insurance company based on the individual employee's salary. The scheme has been adapted to comply with the new Act on occupational pensions, and the threshold between the lower and the higher savings rate is 7.1 x the National Insurance basic amount ("G"). In addition to saving for a retirement pension, disability pension and surviving children's pension are also covered. These payments do not have a paid-up policy element, meaning there is no future liability related to disability and children's pensions beyond the current premium payments.
The Group is a member of the contractual early retirement scheme (the "AFP" scheme) through the Norwegian Federation of Trade Unions (LO) and the Confederation of Norwegian Enterprise (NHO). The AFP scheme provides a life-long supplement to the standard pension. Employees can choose to start drawing on the AFP pension scheme from the age of 62. The pension scheme is a defined-benefit, multi-employer pension plan funded by premiums that are determined as a percentage of the individual's salary. There is no reliable measurement and allocation of liabilities and assets in the scheme. Therefore, in the financial statements the scheme is treated as a defined-contribution pension scheme where the premium payments are charged as a cost on an ongoing basis and no provisions are made in the financial statements.
Our Swedish companies have pension plans in accordance with a collective agreement. The scheme in Sweden is a combination of defined-benefit and defined-contribution plans based on job category, age and income. The defined-benefit plan is partially financed by means of premium payments, while the rest is financed through the accumulation of pension liabilities in the balance sheet. The pension liabilities related to the part of the scheme that is not insured are calculated by an actuary. These liabilities will be reduced in line with the ongoing pension payments. All future pension savings are now insured, but these amounts are not calculated by an actuary, as the scheme is such that assets and liabilities are not allocated directly to the individual company in the collective pension fund. Møller Mobility Group bases its accounting of defined-benefit pensions on IAS 19 (see the note on accounting policies). This entails that the year's actuarial gains and/or losses are charged to equity.
Møller Mobility Group AS has a committed credit facility totalling NOK 1,000 million. Subsidiaries that comprise more than 80% of the gross turnover and equity in the Group are guarantors. At 31 December 2018 no withdrawals had been made from this facility. In addition, Møller Mobility Group also has an overdraft facility of NOK 100 million, which is secured through joint and several liability (cashpool). At 31 December 2018 no withdrawals had been made from this facility either.
The guarantees for employees concern shareholders in Møller MI AS who have loans in Nordea that amounted to NOK 7 million at 31 December 2018. The guarantee is secured by collateral in shares. The Group companies included in the joint registration of VAT have joint and several liability for any debt. At 31 December 2018 Møller Mobility Group AS owes NOK 365 million in VAT, via the joint registration registered in Aars AS.
In 2014 the Group's companies in Latvia were imposed a corporate fine totalling EUR 7 million because of alleged price-fixing. Møller Mobility Group strongly disagrees with the grounds for the fine and holds that the fine is disproportionate and discriminatory in relation to the alleged violations. The case has been brought before the Latvian courts, and the Administrative Regional Court pronounced its judgment in October 2018. Two of the companies have been fully acquitted, representing EUR 5.2 million of the fines, while two of the companies have been found partially guilty, but to a less serious degree than in the original ruling. The Norwegian Competition Authority has appealed this judgment to the Supreme Court of Latvia. The Supreme Court may choose at its own discretion whether to hear this case or reject it. No provisions have been made for this in the financial statements for 2018.
LIABILITIESCurrent liabilitiesMøller Mobility Group has a committed credit facility of NOK 1,000 million that runs to 2021. The credit facilities are not secured, but all significant companies in Møller Mobility Group are jointly and severally liable for the liabilities. Møller Mobility Group AS is the registered borrower. At 31 December 2018 no withdrawals had been made from this facility. There are requirements (covenants) concerning financial key figures in the contract, linked to equity and cash flow, which are fulfilled at the end of the year. These liabilities are classified as current liabilities since all withdrawals from the facility will be of a short-term nature. For further information, see note 16.
Non-current liabilitiesMøller Mobility Group has long-term financing through two bond issues of together NOK 1,000 million, of which NOK 200 million is owned by the company itself. These bonds will mature in November 2019 and March 2022. The bond issue is not secured, but is coordinated with the syndicated bank loan in terms of joint and several liability within the Group, and has the same equity ratio requirements. Other long-term interest-bearing liabilities are deposits from employees.
FINANCIAL RISKThe Group has companies involved in selling, financing and servicing cars. The Group's activities involve financial risk associated with currency, rates, credit and liquidity. The Group manages risk with the objective of ensuring predictable cash flows and sufficient liquidity to meet natural fluctuations in working capital.
Currency riskThe Group sells products in local currency. In Norway, the Group is exposed to short-term currency risk relating to imports of products in EUR. Car manufacturers bear significant long-term currency risk through agreements. Short-term currency risk is hedged in the spot and forwards market. The forward contracts are market-assessed (mark-to-market) and the value is recorded as foreign exchange gains at year-end. Unrealised exchange losses of NOK 2.5 million were recognised in the income statement at year-end.
In addition the Group has currency risk associated with the Swedish and Baltic companies. The risks are mitigated by having local external liabilities in the local currency. Møller Mobility Group does not generally hedge equity in foreign companies, but does strive to secure the expected dividend with a horizon of one year. Møller Mobility Group's total secured amount at year-end was SEK 60 million and EUR 6 million.Unrealised exchange losses amounted to NOK 3.7 million at year-end.
Interest rate riskMøller Mobility Group is largely financed through a long-term bond issue with a floating interest rate. This entails a risk related to developments in interest costs. This risk is partially hedged by a portion of the debt being swapped to fixed interest rates through interest rate swaps. At 31 December 2018 the Group had interest rate swap agreements of NOK 400 million with a fixed interest rate of 2.2% and a remaining term matching the underlying loans. The interest swap agreements hedge 50% of the interest costs related to the bond issue at year-end. The date for determining the liquid element in the hedging contract is adapted according to the rollover of the underlying loans. The agreements were signed with a view to running until maturity. In light of this, Møller Mobility Group has chosen to record the agreements as hedge agreements, which means that ongoing changes in market value are not recorded in the income statement. At the balance sheet date, the market value of the contract was positive in the amount of NOK 2.2 million.
Credit riskA significant part of the Group's turnover is cash-based. There will be a temporary credit risk associated with sales by importer companies to external dealers and in cases where cars or workshop services are sold on credit. The risks are hedged with tight credit procedures and close monitoring of accounts receivable. Historically, losses have been low. At 31 December 2018, NOK 8 million has been allocated for losses on claims and actual losses in 2018 were NOK 6 million.
Liquidity riskThe Group operates in a cyclical industry with relatively large fluctuations in working capital. There is therefore a risk associated with short-term access to liquidity. This is
The amortization period for goodwill that is strategic investments is normally amortized over 10 years. These are investments where Møller Mobility Group has a long-term perspective and which is within the Group's core business. Other items are amortized over 5 years. Intangible assets of NOK 276 million relate to software and development costs for IT systems.
*The main rule is that uniform accounting principles are used for similar transactions and events, to provide the most accurate information about the investor’s overall operations. Volkswagen Møller Bilfinans switched to IFRS on 1 January 2018. It is not practicable to restate the entire financial statements such that they are in accordance with the Norwegian Accounting Act and generally accepted accounting policies. We have therefore chosen to apply different principles, in accordance with Norwegian accounting standard NRS (F) Investments in associates and joint ventures (June 2018), section 3.8. The main difference in the accounting policies at 31 December 2018 relates to provisions for losses in the leasing portfolio (IFRS 9). The conversion effect in Volkswagen Møller Bilfinans amounts to NOK -13 million in the opening balance equity, and this effect has been charged directly to equity in Møller Mobility Group on the same basis as a change in accounting policy.
** Equity and profit as of 31.12.17.

42 CSR report 2018MMG AS Finances 2018Group Finances 2018 Annual report 2018
NOTES TO THE CONSOLIDATED FINANCIAL STATEMENTS
All figures are in NOK millions.
Note 1 - Segment information
The business consists of the following business areas: Car Imports (Norway and Baltics), Car Dealers (Norway, Sweden and Baltics) and Car Finance (Norway).
The business areas report the following key figures:2018
Car Imports Car Dealers Car Finance Other companies Eliminations Group
Operating revenue 14 918 20 154 - 330 (9 229) 26 173Operating profit/(loss) 659 284 - (176) (5) 762Depreciation and write-downs 37 118 - 134 2 291Income from investments in associated companies - - 127 (1) - 126EBITDA 696 401 127 (42) (2) 1 180Other financial results (1) (35) - 27 - (8)Profit/(loss) before tax 658 249 127 (149) (5) 880
Assets 3 577 4 779 632 4 895 (5 711) 8 172
Norway Baltics Oslo West-Norway Mid-Norway Sweden BalticsOperating revenue 12 304 2 614 5 637 4 485 3 496 3 890 2 588EBITDA 664 33 86 137 62 95 59Profit/(loss) before tax 629 29 51 93 36 71 46Assets 2 907 670 1 237 1 023 891 632 718
2017
Car Imports Car Dealers Car Finance Other companies Eliminations Group
Operating revenue 16 247 21 784 - 318 (10 076) 28 273Operating profit/(loss) 858 391 - (126) (85) 1 038Depreciation and write-downs 22 123 - 87 2 234Income from investments in associated companies - - 117 - - 117EBITDA 881 514 117 (39) (83) 1 389Other financial results (4) (29) - (1) - (34)Profit/(loss) before tax 854 362 117 (127) (85) 1 121
Assets 3 094 5 028 518 3 880 (4 471) 8 050
Norway Baltics Oslo West-Norway Mid-Norway Sweden BalticsOperating revenue 14 070 2 177 6 550 5 003 3 683 4 158 2 332EBITDA 831 50 163 151 94 124 52Profit/(loss) before tax 806 48 122 106 71 100 41Assets 2 777 317 1 465 1 087 902 707 535
Note 2 - Payroll and other personnel costs
2018 2017Salaries 2 229 2 197Employer's NI contributions 352 345Pension costs 158 157Other personnel costs 90 114Total payroll and other personnel costs 2 829 2 812
Average number of employees 4 303 4 296Loans to employees 20 29
2018 2017Salaries, bonuses, pension costs and other remuneration for the CEO 8 7Board fees 2 2Total remuneration of senior executives 10 9
Loans to employees are mainly interest-bearing car loans where the companies have security in a car. The interest rate on these loans is 2.1%. In the event of sale, liquidation or other reorganisation, general managers in the Group are entitled to salary for one year, under certain terms.
2018 2017Audit fees and audit-related services 4 4Tax, fees and other consultancy services - 1Total auditor's fees (excl. VAT) 4 5
Note 3 - Other operating costs
2018 2017Operating costs (rent, electricity, maintenance, car costs, etc.) 965 949Sales costs (advertising, warranties, etc.) 714 758Administration costs (IT services, fees, travel expenses, gifts, bad debts) 236 257Total other operating costs 1 914 1 964
Note 4 - Investments in associated companies
Voting Equity Carrying Internal Additions Share of profit Carryingrights/ in company amount profit disposals after tax amount
Company name stake 31.12.18 01.01.18 2018 31.12.18Volkswagen Møller Bilfinans AS * 49,00 % 3 006 888 14 183 127 1 212UIP Holding AS** 20,55 % 16 - - 75 (1) 74Total 888 14 259 126 1 287
Investments in associated companies are incorporated in accordance with the equity method.
Note 5 - Other financial income and financial costs
2018 2017Interest income 5 5Currency gains 93 34Other financial income 2 2Total other financial income 100 40
Interest costs 22 23Currency losses 75 42Other financial costs 10 10Total other financial costs 107 75
Note 6 - Tangible fixed assets, intangible assets and goodwill
Machinery and Vehicles Buildings Intangible Goodwill* Totalfixtures assets
Acquisition cost at 1 Jan. 988 136 422 566 106 2 218Additions 87 85 36 119 - 327Disposals (57) (82) (1) (8) - (147)Currency translation difference (4) - - - (2) (6)Acquisition cost at 31 Dec. 1 014 140 457 678 104 2 392Accumulated depreciation at 1 Jan. 670 21 227 290 73 1 281Year's depreciation and write-downs 87 32 30 135 7 291Disposals (56) (32) - (1) - (89)Currency translation difference (1) - - - (2) (3)Depreciated at 31 Dec. 701 20 258 424 78 1 481Carrying amount at 31 Dec. 313 120 199 254 27 913* Goodwill in connection with acquisition of new companies, and goodwill in company financial statements.
Straight-line depreciation plan 3-7 years 3-7 years 20-50 years 3-10 years 5-10 years
Annual rental of off balance sheet business assets 14 404 418
Duration of rental of business assets 1-5 years 1-5 years 1-15 years
Tekst
Specification of goodwill in connection with acquisitions:Business unit Acquisition Depreciation Acquisition Accumulated Carrying Year's
date period cost* depreciation* amount* depreciationCar Dealers Norway 2016 10 years 4 1 3 1Car Dealers Sweden 2014 10 years 28 12 16 3
2011 10 years 32 25 7 3Car Dealers Sweden 2008 10 years 40 40 - -Total goodwill in connection with acquisitions 104 78 26 7* Incl. currency translation difference
Note 7 - Investments in other shares and units
Note 8 - Pensions
2018 2017Interest cost of pension liabilities 1 3Year's pension costs for funded and unfunded pensions 1 3Defined-contribution pension 109 107Defined-benefit pension not calculated by an actuary 48 46Total pension costs 158 157
Carrying amount pension obligations calculated by an actuary Calculated pension liabilities at 1 Jan. 2018 (54) (51)Actuarial gains and/or losses are charged to equity (2) -The year's pension costs (1) (3)The year's pension payments 2 2Currency translation difference 2 (2)Pension liabilities (53) (54)
Number of people covered by all pension plans 3 467 3 500
Financial assumptions Sweden NorwayReturn on pension assets - 0,0 %Discount rate 2,3 % 2,6 %Annual salary growth / annual G adjustment 2,0 % 0,0 %
The actuarial assumptions relating to demographic factors are the normal assumptions used by the insurance industry, adapted to the Group's age structure and retirement. All pension liabilities include the employers' National Insurance contribution.
Note 9 - Stock
2018 2017New cars 1 883 1 373Used cars and demonstration cars 1 419 1 688Parts and equipment 263 264Other stock 64 10Total stock 3 629 3 335
Note 10 - Accounts receivable
2018 2017Accounts receivable 1 319 1 345Provisions for bad debt (8) (11)Accounts receivable Aars Group 2 11Total accounts receivable 1 313 1 345
Note 11 - Other receivables
2018 2017Loans to employees 9 13Other long term receivables 1 - Total non-current receivables 10 13
2018 2017Advances to suppliers 6 9Loans to employees 12 16Net VAT credit 4 3Other prepaid expenses 66 101Accrued income 246 181Other current receivables 151 202Total current receivables 486 513
Note 12 - Bank depositsThe Group has bank deposits totalling NOK 261 million. There are no restricted funds to cover tax owed. Tax deductions are secured bya bank guarantee (see note 16).
Note 13 - Share capital and shareholder information
Shareholders in Møller Mobility Group AS at 31 Dec. 2018 Number StakeA shares:Jan H. Møller 103 0,375 %B shares:Jan H. Møller 1 0,004 %Aars AS 24 778 90,102 %Møller MI AS 2 618 9,520 %Total 27 500 100,00 %
The share capital consists of 27,500 shares with a nominal value of NOK 1,734, in total NOK 48 million. There are two classes of share. All shares have equal voting rights. Aars AS votes for 98.112 % of the shares, 8.01 % is indirectly through Møller MI AS. Class A shares are guaranteed an annual dividendof NOK 5 million, collected from Møller Mobility Group AS and Møller Eiendom Holding AS.
Note 14 - Other current liabilities
2018 2017Provision for warranties and other liabilities 851 699Accrued costs and prepaid income 510 485Holiday pay and accrued salary 354 349Advances from customers 251 146Total other current liabilities 1 966 1 678
Note 15 - Related parties
Company Company relationship Transaction type 2018 2017Volkswagen Møller Bilfinans AS Associated company Sale of cars 3 572 4 227Total sales 3 572 4 227
Volkswagen Møller Bilfinans AS Associated company Purchase of cars 1 439 1 587Møller Eiendom Associated group Rent costs 219 187Total purchases 1 658 1 774
Volkswagen Møller Bilfinans AS Associated company Balances at 31 December 49 150Infocare AS Sister Balances at 31 December 24 -Aars AS Parent Balances at 31 December 249 183
Note 16 - Pledges, guarantees and commitments
2018 2017Fixtures 47 45Accounts receivable and stock 879 458Total carrying amount of assets with encumbrances 926 503
Guarantees 2018 2017Repurchase agreements for cars 8 073 7 063Vehicle import duty, Customs Region Oslo and Akershus 135 135Withholding tax 119 115Employees 7 8
Note 17 - Share capital
2018 Majority Minorities TotalEquity at 1 Jan. 2018 3 169 56 3 225Change in accounting principles regarding associated company (note 4) (13) - (13)Profit/(loss) for the year 677 12 689Annual dividend* (578) (10) (588)Group contributions (22) - (22)Pension Sweden (2) - (2)Currency translation differences this year, etc. (5) 3 (2)Equity at 31 Dec. 2018 3 225 61 3 286* Includes an additional dividend of NOK 300 million
Accumulated translation differences at 31 December 2018 amounted to NOK 100 million.
2017 Majority Minorities TotalEquity at 1 Jan. 2017 2 880 53 2 934Profit/(loss) for the year 852 9 861Annual dividend* (578) (6) (584)Group contributions (22) - (22)Currency translation differences this year, etc. 36 - 36Equity at 31 Dec. 2017 3 169 56 3 225* Includes an additional dividend of NOK 400 million
Note 18 - Debt, financing and financial risk
2018 2017Overdraft* 9 64Total current interest-bearing liabilities 9 64
Bond issue 800 800Arrangement costs (1) (3)Total bond issue 799 797Other long-term interest-bearing liabilities 17 17Total non-current interest-bearing liabilities 816 815
MaturityDue in less than 2 years 409 464Due in 2-5 years 416 415Total 825 879
Key figuresUnused committed credit facilities 1 100 1 168* Overdraft outside the cashpool
Car Imports Car Dealers
Car Imports Car Dealers
Car Dealers Baltics
At 31 December 2018 the CEO and board members own 0.34% and 0.44% stakes, respectively, in Møller MI AS. Møller MI AS is an investment company where senior executives have the opportunity to invest. The CEO is the CEO of Møller Mobility Group AS and is employed and paid by the parent company. Bonus schemes have been established here where the size of the payment depends on the results achieved for the year, combined with other qualitative assessment criteria, and where the bonus is considered to be part of the normal remuneration for this type of position. Two executives are entitled to two years' salary in the event of major reorganisations.
Some subsidiaries in Møller Mobility Group have a number of minor equity investments with holdings of 20-35%, such as repair and lacquer workshops and the tyre hotel. These are not treated as associated companies since they have limited value and small profits. At 31 December 2018 these investments had a total carrying amount of NOK 3 million.
The Norwegian and Swedish companies in the Group have secured collective pension agreements. The companies in the three Baltic states do not have pension plans. In Norway we have an ongoing defined-contribution scheme. The defined-contribution plan is charged as a cost on an ongoing basis in the financial statements as the Group pays an amount of savings to the insurance company based on the individual employee's salary. The scheme has been adapted to comply with the new Act on occupational pensions, and the threshold between the lower and the higher savings rate is 7.1 x the National Insurance basic amount ("G"). In addition to saving for a retirement pension, disability pension and surviving children's pension are also covered. These payments do not have a paid-up policy element, meaning there is no future liability related to disability and children's pensions beyond the current premium payments.
The Group is a member of the contractual early retirement scheme (the "AFP" scheme) through the Norwegian Federation of Trade Unions (LO) and the Confederation of Norwegian Enterprise (NHO). The AFP scheme provides a life-long supplement to the standard pension. Employees can choose to start drawing on the AFP pension scheme from the age of 62. The pension scheme is a defined-benefit, multi-employer pension plan funded by premiums that are determined as a percentage of the individual's salary. There is no reliable measurement and allocation of liabilities and assets in the scheme. Therefore, in the financial statements the scheme is treated as a defined-contribution pension scheme where the premium payments are charged as a cost on an ongoing basis and no provisions are made in the financial statements.
Our Swedish companies have pension plans in accordance with a collective agreement. The scheme in Sweden is a combination of defined-benefit and defined-contribution plans based on job category, age and income. The defined-benefit plan is partially financed by means of premium payments, while the rest is financed through the accumulation of pension liabilities in the balance sheet. The pension liabilities related to the part of the scheme that is not insured are calculated by an actuary. These liabilities will be reduced in line with the ongoing pension payments. All future pension savings are now insured, but these amounts are not calculated by an actuary, as the scheme is such that assets and liabilities are not allocated directly to the individual company in the collective pension fund. Møller Mobility Group bases its accounting of defined-benefit pensions on IAS 19 (see the note on accounting policies). This entails that the year's actuarial gains and/or losses are charged to equity.
Møller Mobility Group AS has a committed credit facility totalling NOK 1,000 million. Subsidiaries that comprise more than 80% of the gross turnover and equity in the Group are guarantors. At 31 December 2018 no withdrawals had been made from this facility. In addition, Møller Mobility Group also has an overdraft facility of NOK 100 million, which is secured through joint and several liability (cashpool). At 31 December 2018 no withdrawals had been made from this facility either.
The guarantees for employees concern shareholders in Møller MI AS who have loans in Nordea that amounted to NOK 7 million at 31 December 2018. The guarantee is secured by collateral in shares. The Group companies included in the joint registration of VAT have joint and several liability for any debt. At 31 December 2018 Møller Mobility Group AS owes NOK 365 million in VAT, via the joint registration registered in Aars AS.
In 2014 the Group's companies in Latvia were imposed a corporate fine totalling EUR 7 million because of alleged price-fixing. Møller Mobility Group strongly disagrees with the grounds for the fine and holds that the fine is disproportionate and discriminatory in relation to the alleged violations. The case has been brought before the Latvian courts, and the Administrative Regional Court pronounced its judgment in October 2018. Two of the companies have been fully acquitted, representing EUR 5.2 million of the fines, while two of the companies have been found partially guilty, but to a less serious degree than in the original ruling. The Norwegian Competition Authority has appealed this judgment to the Supreme Court of Latvia. The Supreme Court may choose at its own discretion whether to hear this case or reject it. No provisions have been made for this in the financial statements for 2018.
LIABILITIESCurrent liabilitiesMøller Mobility Group has a committed credit facility of NOK 1,000 million that runs to 2021. The credit facilities are not secured, but all significant companies in Møller Mobility Group are jointly and severally liable for the liabilities. Møller Mobility Group AS is the registered borrower. At 31 December 2018 no withdrawals had been made from this facility. There are requirements (covenants) concerning financial key figures in the contract, linked to equity and cash flow, which are fulfilled at the end of the year. These liabilities are classified as current liabilities since all withdrawals from the facility will be of a short-term nature. For further information, see note 16.
Non-current liabilitiesMøller Mobility Group has long-term financing through two bond issues of together NOK 1,000 million, of which NOK 200 million is owned by the company itself. These bonds will mature in November 2019 and March 2022. The bond issue is not secured, but is coordinated with the syndicated bank loan in terms of joint and several liability within the Group, and has the same equity ratio requirements. Other long-term interest-bearing liabilities are deposits from employees.
FINANCIAL RISKThe Group has companies involved in selling, financing and servicing cars. The Group's activities involve financial risk associated with currency, rates, credit and liquidity. The Group manages risk with the objective of ensuring predictable cash flows and sufficient liquidity to meet natural fluctuations in working capital.
Currency riskThe Group sells products in local currency. In Norway, the Group is exposed to short-term currency risk relating to imports of products in EUR. Car manufacturers bear significant long-term currency risk through agreements. Short-term currency risk is hedged in the spot and forwards market. The forward contracts are market-assessed (mark-to-market) and the value is recorded as foreign exchange gains at year-end. Unrealised exchange losses of NOK 2.5 million were recognised in the income statement at year-end.
In addition the Group has currency risk associated with the Swedish and Baltic companies. The risks are mitigated by having local external liabilities in the local currency. Møller Mobility Group does not generally hedge equity in foreign companies, but does strive to secure the expected dividend with a horizon of one year. Møller Mobility Group's total secured amount at year-end was SEK 60 million and EUR 6 million.Unrealised exchange losses amounted to NOK 3.7 million at year-end.
Interest rate riskMøller Mobility Group is largely financed through a long-term bond issue with a floating interest rate. This entails a risk related to developments in interest costs. This risk is partially hedged by a portion of the debt being swapped to fixed interest rates through interest rate swaps. At 31 December 2018 the Group had interest rate swap agreements of NOK 400 million with a fixed interest rate of 2.2% and a remaining term matching the underlying loans. The interest swap agreements hedge 50% of the interest costs related to the bond issue at year-end. The date for determining the liquid element in the hedging contract is adapted according to the rollover of the underlying loans. The agreements were signed with a view to running until maturity. In light of this, Møller Mobility Group has chosen to record the agreements as hedge agreements, which means that ongoing changes in market value are not recorded in the income statement. At the balance sheet date, the market value of the contract was positive in the amount of NOK 2.2 million.
Credit riskA significant part of the Group's turnover is cash-based. There will be a temporary credit risk associated with sales by importer companies to external dealers and in cases where cars or workshop services are sold on credit. The risks are hedged with tight credit procedures and close monitoring of accounts receivable. Historically, losses have been low. At 31 December 2018, NOK 8 million has been allocated for losses on claims and actual losses in 2018 were NOK 6 million.
Liquidity riskThe Group operates in a cyclical industry with relatively large fluctuations in working capital. There is therefore a risk associated with short-term access to liquidity. This is
The amortization period for goodwill that is strategic investments is normally amortized over 10 years. These are investments where Møller Mobility Group has a long-term perspective and which is within the Group's core business. Other items are amortized over 5 years. Intangible assets of NOK 276 million relate to software and development costs for IT systems.
*The main rule is that uniform accounting principles are used for similar transactions and events, to provide the most accurate information about the investor’s overall operations. Volkswagen Møller Bilfinans switched to IFRS on 1 January 2018. It is not practicable to restate the entire financial statements such that they are in accordance with the Norwegian Accounting Act and generally accepted accounting policies. We have therefore chosen to apply different principles, in accordance with Norwegian accounting standard NRS (F) Investments in associates and joint ventures (June 2018), section 3.8. The main difference in the accounting policies at 31 December 2018 relates to provisions for losses in the leasing portfolio (IFRS 9). The conversion effect in Volkswagen Møller Bilfinans amounts to NOK -13 million in the opening balance equity, and this effect has been charged directly to equity in Møller Mobility Group on the same basis as a change in accounting policy.
** Equity and profit as of 31.12.17.

43 CSR report 2018MMG AS Finances 2018Group Finances 2018 Annual report 2018
NOTES TO THE CONSOLIDATED FINANCIAL STATEMENTS
All figures are in NOK millions.
Note 1 - Segment information
The business consists of the following business areas: Car Imports (Norway and Baltics), Car Dealers (Norway, Sweden and Baltics) and Car Finance (Norway).
The business areas report the following key figures:2018
Car Imports Car Dealers Car Finance Other companies Eliminations Group
Operating revenue 14 918 20 154 - 330 (9 229) 26 173Operating profit/(loss) 659 284 - (176) (5) 762Depreciation and write-downs 37 118 - 134 2 291Income from investments in associated companies - - 127 (1) - 126EBITDA 696 401 127 (42) (2) 1 180Other financial results (1) (35) - 27 - (8)Profit/(loss) before tax 658 249 127 (149) (5) 880
Assets 3 577 4 779 632 4 895 (5 711) 8 172
Norway Baltics Oslo West-Norway Mid-Norway Sweden BalticsOperating revenue 12 304 2 614 5 637 4 485 3 496 3 890 2 588EBITDA 664 33 86 137 62 95 59Profit/(loss) before tax 629 29 51 93 36 71 46Assets 2 907 670 1 237 1 023 891 632 718
2017
Car Imports Car Dealers Car Finance Other companies Eliminations Group
Operating revenue 16 247 21 784 - 318 (10 076) 28 273Operating profit/(loss) 858 391 - (126) (85) 1 038Depreciation and write-downs 22 123 - 87 2 234Income from investments in associated companies - - 117 - - 117EBITDA 881 514 117 (39) (83) 1 389Other financial results (4) (29) - (1) - (34)Profit/(loss) before tax 854 362 117 (127) (85) 1 121
Assets 3 094 5 028 518 3 880 (4 471) 8 050
Norway Baltics Oslo West-Norway Mid-Norway Sweden BalticsOperating revenue 14 070 2 177 6 550 5 003 3 683 4 158 2 332EBITDA 831 50 163 151 94 124 52Profit/(loss) before tax 806 48 122 106 71 100 41Assets 2 777 317 1 465 1 087 902 707 535
Note 2 - Payroll and other personnel costs
2018 2017Salaries 2 229 2 197Employer's NI contributions 352 345Pension costs 158 157Other personnel costs 90 114Total payroll and other personnel costs 2 829 2 812
Average number of employees 4 303 4 296Loans to employees 20 29
2018 2017Salaries, bonuses, pension costs and other remuneration for the CEO 8 7Board fees 2 2Total remuneration of senior executives 10 9
Loans to employees are mainly interest-bearing car loans where the companies have security in a car. The interest rate on these loans is 2.1%. In the event of sale, liquidation or other reorganisation, general managers in the Group are entitled to salary for one year, under certain terms.
2018 2017Audit fees and audit-related services 4 4Tax, fees and other consultancy services - 1Total auditor's fees (excl. VAT) 4 5
Note 3 - Other operating costs
2018 2017Operating costs (rent, electricity, maintenance, car costs, etc.) 965 949Sales costs (advertising, warranties, etc.) 714 758Administration costs (IT services, fees, travel expenses, gifts, bad debts) 236 257Total other operating costs 1 914 1 964
Note 4 - Investments in associated companies
Voting Equity Carrying Internal Additions Share of profit Carryingrights/ in company amount profit disposals after tax amount
Company name stake 31.12.18 01.01.18 2018 31.12.18Volkswagen Møller Bilfinans AS * 49,00 % 3 006 888 14 183 127 1 212UIP Holding AS** 20,55 % 16 - - 75 (1) 74Total 888 14 259 126 1 287
Investments in associated companies are incorporated in accordance with the equity method.
Note 5 - Other financial income and financial costs
2018 2017Interest income 5 5Currency gains 93 34Other financial income 2 2Total other financial income 100 40
Interest costs 22 23Currency losses 75 42Other financial costs 10 10Total other financial costs 107 75
Note 6 - Tangible fixed assets, intangible assets and goodwill
Machinery and Vehicles Buildings Intangible Goodwill* Totalfixtures assets
Acquisition cost at 1 Jan. 988 136 422 566 106 2 218Additions 87 85 36 119 - 327Disposals (57) (82) (1) (8) - (147)Currency translation difference (4) - - - (2) (6)Acquisition cost at 31 Dec. 1 014 140 457 678 104 2 392Accumulated depreciation at 1 Jan. 670 21 227 290 73 1 281Year's depreciation and write-downs 87 32 30 135 7 291Disposals (56) (32) - (1) - (89)Currency translation difference (1) - - - (2) (3)Depreciated at 31 Dec. 701 20 258 424 78 1 481Carrying amount at 31 Dec. 313 120 199 254 27 913* Goodwill in connection with acquisition of new companies, and goodwill in company financial statements.
Straight-line depreciation plan 3-7 years 3-7 years 20-50 years 3-10 years 5-10 years
Annual rental of off balance sheet business assets 14 404 418
Duration of rental of business assets 1-5 years 1-5 years 1-15 years
Tekst
Specification of goodwill in connection with acquisitions:Business unit Acquisition Depreciation Acquisition Accumulated Carrying Year's
date period cost* depreciation* amount* depreciationCar Dealers Norway 2016 10 years 4 1 3 1Car Dealers Sweden 2014 10 years 28 12 16 3
2011 10 years 32 25 7 3Car Dealers Sweden 2008 10 years 40 40 - -Total goodwill in connection with acquisitions 104 78 26 7* Incl. currency translation difference
Note 7 - Investments in other shares and units
Note 8 - Pensions
2018 2017Interest cost of pension liabilities 1 3Year's pension costs for funded and unfunded pensions 1 3Defined-contribution pension 109 107Defined-benefit pension not calculated by an actuary 48 46Total pension costs 158 157
Carrying amount pension obligations calculated by an actuary Calculated pension liabilities at 1 Jan. 2018 (54) (51)Actuarial gains and/or losses are charged to equity (2) -The year's pension costs (1) (3)The year's pension payments 2 2Currency translation difference 2 (2)Pension liabilities (53) (54)
Number of people covered by all pension plans 3 467 3 500
Financial assumptions Sweden NorwayReturn on pension assets - 0,0 %Discount rate 2,3 % 2,6 %Annual salary growth / annual G adjustment 2,0 % 0,0 %
The actuarial assumptions relating to demographic factors are the normal assumptions used by the insurance industry, adapted to the Group's age structure and retirement. All pension liabilities include the employers' National Insurance contribution.
Note 9 - Stock
2018 2017New cars 1 883 1 373Used cars and demonstration cars 1 419 1 688Parts and equipment 263 264Other stock 64 10Total stock 3 629 3 335
Note 10 - Accounts receivable
2018 2017Accounts receivable 1 319 1 345Provisions for bad debt (8) (11)Accounts receivable Aars Group 2 11Total accounts receivable 1 313 1 345
Note 11 - Other receivables
2018 2017Loans to employees 9 13Other long term receivables 1 - Total non-current receivables 10 13
2018 2017Advances to suppliers 6 9Loans to employees 12 16Net VAT credit 4 3Other prepaid expenses 66 101Accrued income 246 181Other current receivables 151 202Total current receivables 486 513
Note 12 - Bank depositsThe Group has bank deposits totalling NOK 261 million. There are no restricted funds to cover tax owed. Tax deductions are secured bya bank guarantee (see note 16).
Note 13 - Share capital and shareholder information
Shareholders in Møller Mobility Group AS at 31 Dec. 2018 Number StakeA shares:Jan H. Møller 103 0,375 %B shares:Jan H. Møller 1 0,004 %Aars AS 24 778 90,102 %Møller MI AS 2 618 9,520 %Total 27 500 100,00 %
The share capital consists of 27,500 shares with a nominal value of NOK 1,734, in total NOK 48 million. There are two classes of share. All shares have equal voting rights. Aars AS votes for 98.112 % of the shares, 8.01 % is indirectly through Møller MI AS. Class A shares are guaranteed an annual dividendof NOK 5 million, collected from Møller Mobility Group AS and Møller Eiendom Holding AS.
Note 14 - Other current liabilities
2018 2017Provision for warranties and other liabilities 851 699Accrued costs and prepaid income 510 485Holiday pay and accrued salary 354 349Advances from customers 251 146Total other current liabilities 1 966 1 678
Note 15 - Related parties
Company Company relationship Transaction type 2018 2017Volkswagen Møller Bilfinans AS Associated company Sale of cars 3 572 4 227Total sales 3 572 4 227
Volkswagen Møller Bilfinans AS Associated company Purchase of cars 1 439 1 587Møller Eiendom Associated group Rent costs 219 187Total purchases 1 658 1 774
Volkswagen Møller Bilfinans AS Associated company Balances at 31 December 49 150Infocare AS Sister Balances at 31 December 24 -Aars AS Parent Balances at 31 December 249 183
Note 16 - Pledges, guarantees and commitments
2018 2017Fixtures 47 45Accounts receivable and stock 879 458Total carrying amount of assets with encumbrances 926 503
Guarantees 2018 2017Repurchase agreements for cars 8 073 7 063Vehicle import duty, Customs Region Oslo and Akershus 135 135Withholding tax 119 115Employees 7 8
Note 17 - Share capital
2018 Majority Minorities TotalEquity at 1 Jan. 2018 3 169 56 3 225Change in accounting principles regarding associated company (note 4) (13) - (13)Profit/(loss) for the year 677 12 689Annual dividend* (578) (10) (588)Group contributions (22) - (22)Pension Sweden (2) - (2)Currency translation differences this year, etc. (5) 3 (2)Equity at 31 Dec. 2018 3 225 61 3 286* Includes an additional dividend of NOK 300 million
Accumulated translation differences at 31 December 2018 amounted to NOK 100 million.
2017 Majority Minorities TotalEquity at 1 Jan. 2017 2 880 53 2 934Profit/(loss) for the year 852 9 861Annual dividend* (578) (6) (584)Group contributions (22) - (22)Currency translation differences this year, etc. 36 - 36Equity at 31 Dec. 2017 3 169 56 3 225* Includes an additional dividend of NOK 400 million
Note 18 - Debt, financing and financial risk
2018 2017Overdraft* 9 64Total current interest-bearing liabilities 9 64
Bond issue 800 800Arrangement costs (1) (3)Total bond issue 799 797Other long-term interest-bearing liabilities 17 17Total non-current interest-bearing liabilities 816 815
MaturityDue in less than 2 years 409 464Due in 2-5 years 416 415Total 825 879
Key figuresUnused committed credit facilities 1 100 1 168* Overdraft outside the cashpool
Car Imports Car Dealers
Car Imports Car Dealers
Car Dealers Baltics
At 31 December 2018 the CEO and board members own 0.34% and 0.44% stakes, respectively, in Møller MI AS. Møller MI AS is an investment company where senior executives have the opportunity to invest. The CEO is the CEO of Møller Mobility Group AS and is employed and paid by the parent company. Bonus schemes have been established here where the size of the payment depends on the results achieved for the year, combined with other qualitative assessment criteria, and where the bonus is considered to be part of the normal remuneration for this type of position. Two executives are entitled to two years' salary in the event of major reorganisations.
Some subsidiaries in Møller Mobility Group have a number of minor equity investments with holdings of 20-35%, such as repair and lacquer workshops and the tyre hotel. These are not treated as associated companies since they have limited value and small profits. At 31 December 2018 these investments had a total carrying amount of NOK 3 million.
The Norwegian and Swedish companies in the Group have secured collective pension agreements. The companies in the three Baltic states do not have pension plans. In Norway we have an ongoing defined-contribution scheme. The defined-contribution plan is charged as a cost on an ongoing basis in the financial statements as the Group pays an amount of savings to the insurance company based on the individual employee's salary. The scheme has been adapted to comply with the new Act on occupational pensions, and the threshold between the lower and the higher savings rate is 7.1 x the National Insurance basic amount ("G"). In addition to saving for a retirement pension, disability pension and surviving children's pension are also covered. These payments do not have a paid-up policy element, meaning there is no future liability related to disability and children's pensions beyond the current premium payments.
The Group is a member of the contractual early retirement scheme (the "AFP" scheme) through the Norwegian Federation of Trade Unions (LO) and the Confederation of Norwegian Enterprise (NHO). The AFP scheme provides a life-long supplement to the standard pension. Employees can choose to start drawing on the AFP pension scheme from the age of 62. The pension scheme is a defined-benefit, multi-employer pension plan funded by premiums that are determined as a percentage of the individual's salary. There is no reliable measurement and allocation of liabilities and assets in the scheme. Therefore, in the financial statements the scheme is treated as a defined-contribution pension scheme where the premium payments are charged as a cost on an ongoing basis and no provisions are made in the financial statements.
Our Swedish companies have pension plans in accordance with a collective agreement. The scheme in Sweden is a combination of defined-benefit and defined-contribution plans based on job category, age and income. The defined-benefit plan is partially financed by means of premium payments, while the rest is financed through the accumulation of pension liabilities in the balance sheet. The pension liabilities related to the part of the scheme that is not insured are calculated by an actuary. These liabilities will be reduced in line with the ongoing pension payments. All future pension savings are now insured, but these amounts are not calculated by an actuary, as the scheme is such that assets and liabilities are not allocated directly to the individual company in the collective pension fund. Møller Mobility Group bases its accounting of defined-benefit pensions on IAS 19 (see the note on accounting policies). This entails that the year's actuarial gains and/or losses are charged to equity.
Møller Mobility Group AS has a committed credit facility totalling NOK 1,000 million. Subsidiaries that comprise more than 80% of the gross turnover and equity in the Group are guarantors. At 31 December 2018 no withdrawals had been made from this facility. In addition, Møller Mobility Group also has an overdraft facility of NOK 100 million, which is secured through joint and several liability (cashpool). At 31 December 2018 no withdrawals had been made from this facility either.
The guarantees for employees concern shareholders in Møller MI AS who have loans in Nordea that amounted to NOK 7 million at 31 December 2018. The guarantee is secured by collateral in shares. The Group companies included in the joint registration of VAT have joint and several liability for any debt. At 31 December 2018 Møller Mobility Group AS owes NOK 365 million in VAT, via the joint registration registered in Aars AS.
In 2014 the Group's companies in Latvia were imposed a corporate fine totalling EUR 7 million because of alleged price-fixing. Møller Mobility Group strongly disagrees with the grounds for the fine and holds that the fine is disproportionate and discriminatory in relation to the alleged violations. The case has been brought before the Latvian courts, and the Administrative Regional Court pronounced its judgment in October 2018. Two of the companies have been fully acquitted, representing EUR 5.2 million of the fines, while two of the companies have been found partially guilty, but to a less serious degree than in the original ruling. The Norwegian Competition Authority has appealed this judgment to the Supreme Court of Latvia. The Supreme Court may choose at its own discretion whether to hear this case or reject it. No provisions have been made for this in the financial statements for 2018.
LIABILITIESCurrent liabilitiesMøller Mobility Group has a committed credit facility of NOK 1,000 million that runs to 2021. The credit facilities are not secured, but all significant companies in Møller Mobility Group are jointly and severally liable for the liabilities. Møller Mobility Group AS is the registered borrower. At 31 December 2018 no withdrawals had been made from this facility. There are requirements (covenants) concerning financial key figures in the contract, linked to equity and cash flow, which are fulfilled at the end of the year. These liabilities are classified as current liabilities since all withdrawals from the facility will be of a short-term nature. For further information, see note 16.
Non-current liabilitiesMøller Mobility Group has long-term financing through two bond issues of together NOK 1,000 million, of which NOK 200 million is owned by the company itself. These bonds will mature in November 2019 and March 2022. The bond issue is not secured, but is coordinated with the syndicated bank loan in terms of joint and several liability within the Group, and has the same equity ratio requirements. Other long-term interest-bearing liabilities are deposits from employees.
FINANCIAL RISKThe Group has companies involved in selling, financing and servicing cars. The Group's activities involve financial risk associated with currency, rates, credit and liquidity. The Group manages risk with the objective of ensuring predictable cash flows and sufficient liquidity to meet natural fluctuations in working capital.
Currency riskThe Group sells products in local currency. In Norway, the Group is exposed to short-term currency risk relating to imports of products in EUR. Car manufacturers bear significant long-term currency risk through agreements. Short-term currency risk is hedged in the spot and forwards market. The forward contracts are market-assessed (mark-to-market) and the value is recorded as foreign exchange gains at year-end. Unrealised exchange losses of NOK 2.5 million were recognised in the income statement at year-end.
In addition the Group has currency risk associated with the Swedish and Baltic companies. The risks are mitigated by having local external liabilities in the local currency. Møller Mobility Group does not generally hedge equity in foreign companies, but does strive to secure the expected dividend with a horizon of one year. Møller Mobility Group's total secured amount at year-end was SEK 60 million and EUR 6 million.Unrealised exchange losses amounted to NOK 3.7 million at year-end.
Interest rate riskMøller Mobility Group is largely financed through a long-term bond issue with a floating interest rate. This entails a risk related to developments in interest costs. This risk is partially hedged by a portion of the debt being swapped to fixed interest rates through interest rate swaps. At 31 December 2018 the Group had interest rate swap agreements of NOK 400 million with a fixed interest rate of 2.2% and a remaining term matching the underlying loans. The interest swap agreements hedge 50% of the interest costs related to the bond issue at year-end. The date for determining the liquid element in the hedging contract is adapted according to the rollover of the underlying loans. The agreements were signed with a view to running until maturity. In light of this, Møller Mobility Group has chosen to record the agreements as hedge agreements, which means that ongoing changes in market value are not recorded in the income statement. At the balance sheet date, the market value of the contract was positive in the amount of NOK 2.2 million.
Credit riskA significant part of the Group's turnover is cash-based. There will be a temporary credit risk associated with sales by importer companies to external dealers and in cases where cars or workshop services are sold on credit. The risks are hedged with tight credit procedures and close monitoring of accounts receivable. Historically, losses have been low. At 31 December 2018, NOK 8 million has been allocated for losses on claims and actual losses in 2018 were NOK 6 million.
Liquidity riskThe Group operates in a cyclical industry with relatively large fluctuations in working capital. There is therefore a risk associated with short-term access to liquidity. This is
The amortization period for goodwill that is strategic investments is normally amortized over 10 years. These are investments where Møller Mobility Group has a long-term perspective and which is within the Group's core business. Other items are amortized over 5 years. Intangible assets of NOK 276 million relate to software and development costs for IT systems.
*The main rule is that uniform accounting principles are used for similar transactions and events, to provide the most accurate information about the investor’s overall operations. Volkswagen Møller Bilfinans switched to IFRS on 1 January 2018. It is not practicable to restate the entire financial statements such that they are in accordance with the Norwegian Accounting Act and generally accepted accounting policies. We have therefore chosen to apply different principles, in accordance with Norwegian accounting standard NRS (F) Investments in associates and joint ventures (June 2018), section 3.8. The main difference in the accounting policies at 31 December 2018 relates to provisions for losses in the leasing portfolio (IFRS 9). The conversion effect in Volkswagen Møller Bilfinans amounts to NOK -13 million in the opening balance equity, and this effect has been charged directly to equity in Møller Mobility Group on the same basis as a change in accounting policy.
** Equity and profit as of 31.12.17.

44 CSR report 2018MMG AS Finances 2018Group Finances 2018 Annual report 2018
NOTES TO THE CONSOLIDATED FINANCIAL STATEMENTS
All figures are in NOK millions.
Note 1 - Segment information
The business consists of the following business areas: Car Imports (Norway and Baltics), Car Dealers (Norway, Sweden and Baltics) and Car Finance (Norway).
The business areas report the following key figures:2018
Car Imports Car Dealers Car Finance Other companies Eliminations Group
Operating revenue 14 918 20 154 - 330 (9 229) 26 173Operating profit/(loss) 659 284 - (176) (5) 762Depreciation and write-downs 37 118 - 134 2 291Income from investments in associated companies - - 127 (1) - 126EBITDA 696 401 127 (42) (2) 1 180Other financial results (1) (35) - 27 - (8)Profit/(loss) before tax 658 249 127 (149) (5) 880
Assets 3 577 4 779 632 4 895 (5 711) 8 172
Norway Baltics Oslo West-Norway Mid-Norway Sweden BalticsOperating revenue 12 304 2 614 5 637 4 485 3 496 3 890 2 588EBITDA 664 33 86 137 62 95 59Profit/(loss) before tax 629 29 51 93 36 71 46Assets 2 907 670 1 237 1 023 891 632 718
2017
Car Imports Car Dealers Car Finance Other companies Eliminations Group
Operating revenue 16 247 21 784 - 318 (10 076) 28 273Operating profit/(loss) 858 391 - (126) (85) 1 038Depreciation and write-downs 22 123 - 87 2 234Income from investments in associated companies - - 117 - - 117EBITDA 881 514 117 (39) (83) 1 389Other financial results (4) (29) - (1) - (34)Profit/(loss) before tax 854 362 117 (127) (85) 1 121
Assets 3 094 5 028 518 3 880 (4 471) 8 050
Norway Baltics Oslo West-Norway Mid-Norway Sweden BalticsOperating revenue 14 070 2 177 6 550 5 003 3 683 4 158 2 332EBITDA 831 50 163 151 94 124 52Profit/(loss) before tax 806 48 122 106 71 100 41Assets 2 777 317 1 465 1 087 902 707 535
Note 2 - Payroll and other personnel costs
2018 2017Salaries 2 229 2 197Employer's NI contributions 352 345Pension costs 158 157Other personnel costs 90 114Total payroll and other personnel costs 2 829 2 812
Average number of employees 4 303 4 296Loans to employees 20 29
2018 2017Salaries, bonuses, pension costs and other remuneration for the CEO 8 7Board fees 2 2Total remuneration of senior executives 10 9
Loans to employees are mainly interest-bearing car loans where the companies have security in a car. The interest rate on these loans is 2.1%. In the event of sale, liquidation or other reorganisation, general managers in the Group are entitled to salary for one year, under certain terms.
2018 2017Audit fees and audit-related services 4 4Tax, fees and other consultancy services - 1Total auditor's fees (excl. VAT) 4 5
Note 3 - Other operating costs
2018 2017Operating costs (rent, electricity, maintenance, car costs, etc.) 965 949Sales costs (advertising, warranties, etc.) 714 758Administration costs (IT services, fees, travel expenses, gifts, bad debts) 236 257Total other operating costs 1 914 1 964
Note 4 - Investments in associated companies
Voting Equity Carrying Internal Additions Share of profit Carryingrights/ in company amount profit disposals after tax amount
Company name stake 31.12.18 01.01.18 2018 31.12.18Volkswagen Møller Bilfinans AS * 49,00 % 3 006 888 14 183 127 1 212UIP Holding AS** 20,55 % 16 - - 75 (1) 74Total 888 14 259 126 1 287
Investments in associated companies are incorporated in accordance with the equity method.
Note 5 - Other financial income and financial costs
2018 2017Interest income 5 5Currency gains 93 34Other financial income 2 2Total other financial income 100 40
Interest costs 22 23Currency losses 75 42Other financial costs 10 10Total other financial costs 107 75
Note 6 - Tangible fixed assets, intangible assets and goodwill
Machinery and Vehicles Buildings Intangible Goodwill* Totalfixtures assets
Acquisition cost at 1 Jan. 988 136 422 566 106 2 218Additions 87 85 36 119 - 327Disposals (57) (82) (1) (8) - (147)Currency translation difference (4) - - - (2) (6)Acquisition cost at 31 Dec. 1 014 140 457 678 104 2 392Accumulated depreciation at 1 Jan. 670 21 227 290 73 1 281Year's depreciation and write-downs 87 32 30 135 7 291Disposals (56) (32) - (1) - (89)Currency translation difference (1) - - - (2) (3)Depreciated at 31 Dec. 701 20 258 424 78 1 481Carrying amount at 31 Dec. 313 120 199 254 27 913* Goodwill in connection with acquisition of new companies, and goodwill in company financial statements.
Straight-line depreciation plan 3-7 years 3-7 years 20-50 years 3-10 years 5-10 years
Annual rental of off balance sheet business assets 14 404 418
Duration of rental of business assets 1-5 years 1-5 years 1-15 years
Tekst
Specification of goodwill in connection with acquisitions:Business unit Acquisition Depreciation Acquisition Accumulated Carrying Year's
date period cost* depreciation* amount* depreciationCar Dealers Norway 2016 10 years 4 1 3 1Car Dealers Sweden 2014 10 years 28 12 16 3
2011 10 years 32 25 7 3Car Dealers Sweden 2008 10 years 40 40 - -Total goodwill in connection with acquisitions 104 78 26 7* Incl. currency translation difference
Note 7 - Investments in other shares and units
Note 8 - Pensions
2018 2017Interest cost of pension liabilities 1 3Year's pension costs for funded and unfunded pensions 1 3Defined-contribution pension 109 107Defined-benefit pension not calculated by an actuary 48 46Total pension costs 158 157
Carrying amount pension obligations calculated by an actuary Calculated pension liabilities at 1 Jan. 2018 (54) (51)Actuarial gains and/or losses are charged to equity (2) -The year's pension costs (1) (3)The year's pension payments 2 2Currency translation difference 2 (2)Pension liabilities (53) (54)
Number of people covered by all pension plans 3 467 3 500
Financial assumptions Sweden NorwayReturn on pension assets - 0,0 %Discount rate 2,3 % 2,6 %Annual salary growth / annual G adjustment 2,0 % 0,0 %
The actuarial assumptions relating to demographic factors are the normal assumptions used by the insurance industry, adapted to the Group's age structure and retirement. All pension liabilities include the employers' National Insurance contribution.
Note 9 - Stock
2018 2017New cars 1 883 1 373Used cars and demonstration cars 1 419 1 688Parts and equipment 263 264Other stock 64 10Total stock 3 629 3 335
Note 10 - Accounts receivable
2018 2017Accounts receivable 1 319 1 345Provisions for bad debt (8) (11)Accounts receivable Aars Group 2 11Total accounts receivable 1 313 1 345
Note 11 - Other receivables
2018 2017Loans to employees 9 13Other long term receivables 1 - Total non-current receivables 10 13
2018 2017Advances to suppliers 6 9Loans to employees 12 16Net VAT credit 4 3Other prepaid expenses 66 101Accrued income 246 181Other current receivables 151 202Total current receivables 486 513
Note 12 - Bank depositsThe Group has bank deposits totalling NOK 261 million. There are no restricted funds to cover tax owed. Tax deductions are secured bya bank guarantee (see note 16).
Note 13 - Share capital and shareholder information
Shareholders in Møller Mobility Group AS at 31 Dec. 2018 Number StakeA shares:Jan H. Møller 103 0,375 %B shares:Jan H. Møller 1 0,004 %Aars AS 24 778 90,102 %Møller MI AS 2 618 9,520 %Total 27 500 100,00 %
The share capital consists of 27,500 shares with a nominal value of NOK 1,734, in total NOK 48 million. There are two classes of share. All shares have equal voting rights. Aars AS votes for 98.112 % of the shares, 8.01 % is indirectly through Møller MI AS. Class A shares are guaranteed an annual dividendof NOK 5 million, collected from Møller Mobility Group AS and Møller Eiendom Holding AS.
Note 14 - Other current liabilities
2018 2017Provision for warranties and other liabilities 851 699Accrued costs and prepaid income 510 485Holiday pay and accrued salary 354 349Advances from customers 251 146Total other current liabilities 1 966 1 678
Note 15 - Related parties
Company Company relationship Transaction type 2018 2017Volkswagen Møller Bilfinans AS Associated company Sale of cars 3 572 4 227Total sales 3 572 4 227
Volkswagen Møller Bilfinans AS Associated company Purchase of cars 1 439 1 587Møller Eiendom Associated group Rent costs 219 187Total purchases 1 658 1 774
Volkswagen Møller Bilfinans AS Associated company Balances at 31 December 49 150Infocare AS Sister Balances at 31 December 24 -Aars AS Parent Balances at 31 December 249 183
Note 16 - Pledges, guarantees and commitments
2018 2017Fixtures 47 45Accounts receivable and stock 879 458Total carrying amount of assets with encumbrances 926 503
Guarantees 2018 2017Repurchase agreements for cars 8 073 7 063Vehicle import duty, Customs Region Oslo and Akershus 135 135Withholding tax 119 115Employees 7 8
Note 17 - Share capital
2018 Majority Minorities TotalEquity at 1 Jan. 2018 3 169 56 3 225Change in accounting principles regarding associated company (note 4) (13) - (13)Profit/(loss) for the year 677 12 689Annual dividend* (578) (10) (588)Group contributions (22) - (22)Pension Sweden (2) - (2)Currency translation differences this year, etc. (5) 3 (2)Equity at 31 Dec. 2018 3 225 61 3 286* Includes an additional dividend of NOK 300 million
Accumulated translation differences at 31 December 2018 amounted to NOK 100 million.
2017 Majority Minorities TotalEquity at 1 Jan. 2017 2 880 53 2 934Profit/(loss) for the year 852 9 861Annual dividend* (578) (6) (584)Group contributions (22) - (22)Currency translation differences this year, etc. 36 - 36Equity at 31 Dec. 2017 3 169 56 3 225* Includes an additional dividend of NOK 400 million
Note 18 - Debt, financing and financial risk
2018 2017Overdraft* 9 64Total current interest-bearing liabilities 9 64
Bond issue 800 800Arrangement costs (1) (3)Total bond issue 799 797Other long-term interest-bearing liabilities 17 17Total non-current interest-bearing liabilities 816 815
MaturityDue in less than 2 years 409 464Due in 2-5 years 416 415Total 825 879
Key figuresUnused committed credit facilities 1 100 1 168* Overdraft outside the cashpool
Car Imports Car Dealers
Car Imports Car Dealers
Car Dealers Baltics
At 31 December 2018 the CEO and board members own 0.34% and 0.44% stakes, respectively, in Møller MI AS. Møller MI AS is an investment company where senior executives have the opportunity to invest. The CEO is the CEO of Møller Mobility Group AS and is employed and paid by the parent company. Bonus schemes have been established here where the size of the payment depends on the results achieved for the year, combined with other qualitative assessment criteria, and where the bonus is considered to be part of the normal remuneration for this type of position. Two executives are entitled to two years' salary in the event of major reorganisations.
Some subsidiaries in Møller Mobility Group have a number of minor equity investments with holdings of 20-35%, such as repair and lacquer workshops and the tyre hotel. These are not treated as associated companies since they have limited value and small profits. At 31 December 2018 these investments had a total carrying amount of NOK 3 million.
The Norwegian and Swedish companies in the Group have secured collective pension agreements. The companies in the three Baltic states do not have pension plans. In Norway we have an ongoing defined-contribution scheme. The defined-contribution plan is charged as a cost on an ongoing basis in the financial statements as the Group pays an amount of savings to the insurance company based on the individual employee's salary. The scheme has been adapted to comply with the new Act on occupational pensions, and the threshold between the lower and the higher savings rate is 7.1 x the National Insurance basic amount ("G"). In addition to saving for a retirement pension, disability pension and surviving children's pension are also covered. These payments do not have a paid-up policy element, meaning there is no future liability related to disability and children's pensions beyond the current premium payments.
The Group is a member of the contractual early retirement scheme (the "AFP" scheme) through the Norwegian Federation of Trade Unions (LO) and the Confederation of Norwegian Enterprise (NHO). The AFP scheme provides a life-long supplement to the standard pension. Employees can choose to start drawing on the AFP pension scheme from the age of 62. The pension scheme is a defined-benefit, multi-employer pension plan funded by premiums that are determined as a percentage of the individual's salary. There is no reliable measurement and allocation of liabilities and assets in the scheme. Therefore, in the financial statements the scheme is treated as a defined-contribution pension scheme where the premium payments are charged as a cost on an ongoing basis and no provisions are made in the financial statements.
Our Swedish companies have pension plans in accordance with a collective agreement. The scheme in Sweden is a combination of defined-benefit and defined-contribution plans based on job category, age and income. The defined-benefit plan is partially financed by means of premium payments, while the rest is financed through the accumulation of pension liabilities in the balance sheet. The pension liabilities related to the part of the scheme that is not insured are calculated by an actuary. These liabilities will be reduced in line with the ongoing pension payments. All future pension savings are now insured, but these amounts are not calculated by an actuary, as the scheme is such that assets and liabilities are not allocated directly to the individual company in the collective pension fund. Møller Mobility Group bases its accounting of defined-benefit pensions on IAS 19 (see the note on accounting policies). This entails that the year's actuarial gains and/or losses are charged to equity.
Møller Mobility Group AS has a committed credit facility totalling NOK 1,000 million. Subsidiaries that comprise more than 80% of the gross turnover and equity in the Group are guarantors. At 31 December 2018 no withdrawals had been made from this facility. In addition, Møller Mobility Group also has an overdraft facility of NOK 100 million, which is secured through joint and several liability (cashpool). At 31 December 2018 no withdrawals had been made from this facility either.
The guarantees for employees concern shareholders in Møller MI AS who have loans in Nordea that amounted to NOK 7 million at 31 December 2018. The guarantee is secured by collateral in shares. The Group companies included in the joint registration of VAT have joint and several liability for any debt. At 31 December 2018 Møller Mobility Group AS owes NOK 365 million in VAT, via the joint registration registered in Aars AS.
In 2014 the Group's companies in Latvia were imposed a corporate fine totalling EUR 7 million because of alleged price-fixing. Møller Mobility Group strongly disagrees with the grounds for the fine and holds that the fine is disproportionate and discriminatory in relation to the alleged violations. The case has been brought before the Latvian courts, and the Administrative Regional Court pronounced its judgment in October 2018. Two of the companies have been fully acquitted, representing EUR 5.2 million of the fines, while two of the companies have been found partially guilty, but to a less serious degree than in the original ruling. The Norwegian Competition Authority has appealed this judgment to the Supreme Court of Latvia. The Supreme Court may choose at its own discretion whether to hear this case or reject it. No provisions have been made for this in the financial statements for 2018.
LIABILITIESCurrent liabilitiesMøller Mobility Group has a committed credit facility of NOK 1,000 million that runs to 2021. The credit facilities are not secured, but all significant companies in Møller Mobility Group are jointly and severally liable for the liabilities. Møller Mobility Group AS is the registered borrower. At 31 December 2018 no withdrawals had been made from this facility. There are requirements (covenants) concerning financial key figures in the contract, linked to equity and cash flow, which are fulfilled at the end of the year. These liabilities are classified as current liabilities since all withdrawals from the facility will be of a short-term nature. For further information, see note 16.
Non-current liabilitiesMøller Mobility Group has long-term financing through two bond issues of together NOK 1,000 million, of which NOK 200 million is owned by the company itself. These bonds will mature in November 2019 and March 2022. The bond issue is not secured, but is coordinated with the syndicated bank loan in terms of joint and several liability within the Group, and has the same equity ratio requirements. Other long-term interest-bearing liabilities are deposits from employees.
FINANCIAL RISKThe Group has companies involved in selling, financing and servicing cars. The Group's activities involve financial risk associated with currency, rates, credit and liquidity. The Group manages risk with the objective of ensuring predictable cash flows and sufficient liquidity to meet natural fluctuations in working capital.
Currency riskThe Group sells products in local currency. In Norway, the Group is exposed to short-term currency risk relating to imports of products in EUR. Car manufacturers bear significant long-term currency risk through agreements. Short-term currency risk is hedged in the spot and forwards market. The forward contracts are market-assessed (mark-to-market) and the value is recorded as foreign exchange gains at year-end. Unrealised exchange losses of NOK 2.5 million were recognised in the income statement at year-end.
In addition the Group has currency risk associated with the Swedish and Baltic companies. The risks are mitigated by having local external liabilities in the local currency. Møller Mobility Group does not generally hedge equity in foreign companies, but does strive to secure the expected dividend with a horizon of one year. Møller Mobility Group's total secured amount at year-end was SEK 60 million and EUR 6 million.Unrealised exchange losses amounted to NOK 3.7 million at year-end.
Interest rate riskMøller Mobility Group is largely financed through a long-term bond issue with a floating interest rate. This entails a risk related to developments in interest costs. This risk is partially hedged by a portion of the debt being swapped to fixed interest rates through interest rate swaps. At 31 December 2018 the Group had interest rate swap agreements of NOK 400 million with a fixed interest rate of 2.2% and a remaining term matching the underlying loans. The interest swap agreements hedge 50% of the interest costs related to the bond issue at year-end. The date for determining the liquid element in the hedging contract is adapted according to the rollover of the underlying loans. The agreements were signed with a view to running until maturity. In light of this, Møller Mobility Group has chosen to record the agreements as hedge agreements, which means that ongoing changes in market value are not recorded in the income statement. At the balance sheet date, the market value of the contract was positive in the amount of NOK 2.2 million.
Credit riskA significant part of the Group's turnover is cash-based. There will be a temporary credit risk associated with sales by importer companies to external dealers and in cases where cars or workshop services are sold on credit. The risks are hedged with tight credit procedures and close monitoring of accounts receivable. Historically, losses have been low. At 31 December 2018, NOK 8 million has been allocated for losses on claims and actual losses in 2018 were NOK 6 million.
Liquidity riskThe Group operates in a cyclical industry with relatively large fluctuations in working capital. There is therefore a risk associated with short-term access to liquidity. This is
The amortization period for goodwill that is strategic investments is normally amortized over 10 years. These are investments where Møller Mobility Group has a long-term perspective and which is within the Group's core business. Other items are amortized over 5 years. Intangible assets of NOK 276 million relate to software and development costs for IT systems.
*The main rule is that uniform accounting principles are used for similar transactions and events, to provide the most accurate information about the investor’s overall operations. Volkswagen Møller Bilfinans switched to IFRS on 1 January 2018. It is not practicable to restate the entire financial statements such that they are in accordance with the Norwegian Accounting Act and generally accepted accounting policies. We have therefore chosen to apply different principles, in accordance with Norwegian accounting standard NRS (F) Investments in associates and joint ventures (June 2018), section 3.8. The main difference in the accounting policies at 31 December 2018 relates to provisions for losses in the leasing portfolio (IFRS 9). The conversion effect in Volkswagen Møller Bilfinans amounts to NOK -13 million in the opening balance equity, and this effect has been charged directly to equity in Møller Mobility Group on the same basis as a change in accounting policy.
** Equity and profit as of 31.12.17.

45 CSR report 2018MMG AS Finances 2018Group Finances 2018 Annual report 2018
NOTES TO THE CONSOLIDATED FINANCIAL STATEMENTS
All figures are in NOK millions.
Note 1 - Segment information
The business consists of the following business areas: Car Imports (Norway and Baltics), Car Dealers (Norway, Sweden and Baltics) and Car Finance (Norway).
The business areas report the following key figures:2018
Car Imports Car Dealers Car Finance Other companies Eliminations Group
Operating revenue 14 918 20 154 - 330 (9 229) 26 173Operating profit/(loss) 659 284 - (176) (5) 762Depreciation and write-downs 37 118 - 134 2 291Income from investments in associated companies - - 127 (1) - 126EBITDA 696 401 127 (42) (2) 1 180Other financial results (1) (35) - 27 - (8)Profit/(loss) before tax 658 249 127 (149) (5) 880
Assets 3 577 4 779 632 4 895 (5 711) 8 172
Norway Baltics Oslo West-Norway Mid-Norway Sweden BalticsOperating revenue 12 304 2 614 5 637 4 485 3 496 3 890 2 588EBITDA 664 33 86 137 62 95 59Profit/(loss) before tax 629 29 51 93 36 71 46Assets 2 907 670 1 237 1 023 891 632 718
2017
Car Imports Car Dealers Car Finance Other companies Eliminations Group
Operating revenue 16 247 21 784 - 318 (10 076) 28 273Operating profit/(loss) 858 391 - (126) (85) 1 038Depreciation and write-downs 22 123 - 87 2 234Income from investments in associated companies - - 117 - - 117EBITDA 881 514 117 (39) (83) 1 389Other financial results (4) (29) - (1) - (34)Profit/(loss) before tax 854 362 117 (127) (85) 1 121
Assets 3 094 5 028 518 3 880 (4 471) 8 050
Norway Baltics Oslo West-Norway Mid-Norway Sweden BalticsOperating revenue 14 070 2 177 6 550 5 003 3 683 4 158 2 332EBITDA 831 50 163 151 94 124 52Profit/(loss) before tax 806 48 122 106 71 100 41Assets 2 777 317 1 465 1 087 902 707 535
Note 2 - Payroll and other personnel costs
2018 2017Salaries 2 229 2 197Employer's NI contributions 352 345Pension costs 158 157Other personnel costs 90 114Total payroll and other personnel costs 2 829 2 812
Average number of employees 4 303 4 296Loans to employees 20 29
2018 2017Salaries, bonuses, pension costs and other remuneration for the CEO 8 7Board fees 2 2Total remuneration of senior executives 10 9
Loans to employees are mainly interest-bearing car loans where the companies have security in a car. The interest rate on these loans is 2.1%. In the event of sale, liquidation or other reorganisation, general managers in the Group are entitled to salary for one year, under certain terms.
2018 2017Audit fees and audit-related services 4 4Tax, fees and other consultancy services - 1Total auditor's fees (excl. VAT) 4 5
Note 3 - Other operating costs
2018 2017Operating costs (rent, electricity, maintenance, car costs, etc.) 965 949Sales costs (advertising, warranties, etc.) 714 758Administration costs (IT services, fees, travel expenses, gifts, bad debts) 236 257Total other operating costs 1 914 1 964
Note 4 - Investments in associated companies
Voting Equity Carrying Internal Additions Share of profit Carryingrights/ in company amount profit disposals after tax amount
Company name stake 31.12.18 01.01.18 2018 31.12.18Volkswagen Møller Bilfinans AS * 49,00 % 3 006 888 14 183 127 1 212UIP Holding AS** 20,55 % 16 - - 75 (1) 74Total 888 14 259 126 1 287
Investments in associated companies are incorporated in accordance with the equity method.
Note 5 - Other financial income and financial costs
2018 2017Interest income 5 5Currency gains 93 34Other financial income 2 2Total other financial income 100 40
Interest costs 22 23Currency losses 75 42Other financial costs 10 10Total other financial costs 107 75
Note 6 - Tangible fixed assets, intangible assets and goodwill
Machinery and Vehicles Buildings Intangible Goodwill* Totalfixtures assets
Acquisition cost at 1 Jan. 988 136 422 566 106 2 218Additions 87 85 36 119 - 327Disposals (57) (82) (1) (8) - (147)Currency translation difference (4) - - - (2) (6)Acquisition cost at 31 Dec. 1 014 140 457 678 104 2 392Accumulated depreciation at 1 Jan. 670 21 227 290 73 1 281Year's depreciation and write-downs 87 32 30 135 7 291Disposals (56) (32) - (1) - (89)Currency translation difference (1) - - - (2) (3)Depreciated at 31 Dec. 701 20 258 424 78 1 481Carrying amount at 31 Dec. 313 120 199 254 27 913* Goodwill in connection with acquisition of new companies, and goodwill in company financial statements.
Straight-line depreciation plan 3-7 years 3-7 years 20-50 years 3-10 years 5-10 years
Annual rental of off balance sheet business assets 14 404 418
Duration of rental of business assets 1-5 years 1-5 years 1-15 years
Tekst
Specification of goodwill in connection with acquisitions:Business unit Acquisition Depreciation Acquisition Accumulated Carrying Year's
date period cost* depreciation* amount* depreciationCar Dealers Norway 2016 10 years 4 1 3 1Car Dealers Sweden 2014 10 years 28 12 16 3
2011 10 years 32 25 7 3Car Dealers Sweden 2008 10 years 40 40 - -Total goodwill in connection with acquisitions 104 78 26 7* Incl. currency translation difference
Note 7 - Investments in other shares and units
Note 8 - Pensions
2018 2017Interest cost of pension liabilities 1 3Year's pension costs for funded and unfunded pensions 1 3Defined-contribution pension 109 107Defined-benefit pension not calculated by an actuary 48 46Total pension costs 158 157
Carrying amount pension obligations calculated by an actuary Calculated pension liabilities at 1 Jan. 2018 (54) (51)Actuarial gains and/or losses are charged to equity (2) -The year's pension costs (1) (3)The year's pension payments 2 2Currency translation difference 2 (2)Pension liabilities (53) (54)
Number of people covered by all pension plans 3 467 3 500
Financial assumptions Sweden NorwayReturn on pension assets - 0,0 %Discount rate 2,3 % 2,6 %Annual salary growth / annual G adjustment 2,0 % 0,0 %
The actuarial assumptions relating to demographic factors are the normal assumptions used by the insurance industry, adapted to the Group's age structure and retirement. All pension liabilities include the employers' National Insurance contribution.
Note 9 - Stock
2018 2017New cars 1 883 1 373Used cars and demonstration cars 1 419 1 688Parts and equipment 263 264Other stock 64 10Total stock 3 629 3 335
Note 10 - Accounts receivable
2018 2017Accounts receivable 1 319 1 345Provisions for bad debt (8) (11)Accounts receivable Aars Group 2 11Total accounts receivable 1 313 1 345
Note 11 - Other receivables
2018 2017Loans to employees 9 13Other long term receivables 1 - Total non-current receivables 10 13
2018 2017Advances to suppliers 6 9Loans to employees 12 16Net VAT credit 4 3Other prepaid expenses 66 101Accrued income 246 181Other current receivables 151 202Total current receivables 486 513
Note 12 - Bank depositsThe Group has bank deposits totalling NOK 261 million. There are no restricted funds to cover tax owed. Tax deductions are secured bya bank guarantee (see note 16).
Note 13 - Share capital and shareholder information
Shareholders in Møller Mobility Group AS at 31 Dec. 2018 Number StakeA shares:Jan H. Møller 103 0,375 %B shares:Jan H. Møller 1 0,004 %Aars AS 24 778 90,102 %Møller MI AS 2 618 9,520 %Total 27 500 100,00 %
The share capital consists of 27,500 shares with a nominal value of NOK 1,734, in total NOK 48 million. There are two classes of share. All shares have equal voting rights. Aars AS votes for 98.112 % of the shares, 8.01 % is indirectly through Møller MI AS. Class A shares are guaranteed an annual dividendof NOK 5 million, collected from Møller Mobility Group AS and Møller Eiendom Holding AS.
Note 14 - Other current liabilities
2018 2017Provision for warranties and other liabilities 851 699Accrued costs and prepaid income 510 485Holiday pay and accrued salary 354 349Advances from customers 251 146Total other current liabilities 1 966 1 678
Note 15 - Related parties
Company Company relationship Transaction type 2018 2017Volkswagen Møller Bilfinans AS Associated company Sale of cars 3 572 4 227Total sales 3 572 4 227
Volkswagen Møller Bilfinans AS Associated company Purchase of cars 1 439 1 587Møller Eiendom Associated group Rent costs 219 187Total purchases 1 658 1 774
Volkswagen Møller Bilfinans AS Associated company Balances at 31 December 49 150Infocare AS Sister Balances at 31 December 24 -Aars AS Parent Balances at 31 December 249 183
Note 16 - Pledges, guarantees and commitments
2018 2017Fixtures 47 45Accounts receivable and stock 879 458Total carrying amount of assets with encumbrances 926 503
Guarantees 2018 2017Repurchase agreements for cars 8 073 7 063Vehicle import duty, Customs Region Oslo and Akershus 135 135Withholding tax 119 115Employees 7 8
Note 17 - Share capital
2018 Majority Minorities TotalEquity at 1 Jan. 2018 3 169 56 3 225Change in accounting principles regarding associated company (note 4) (13) - (13)Profit/(loss) for the year 677 12 689Annual dividend* (578) (10) (588)Group contributions (22) - (22)Pension Sweden (2) - (2)Currency translation differences this year, etc. (5) 3 (2)Equity at 31 Dec. 2018 3 225 61 3 286* Includes an additional dividend of NOK 300 million
Accumulated translation differences at 31 December 2018 amounted to NOK 100 million.
2017 Majority Minorities TotalEquity at 1 Jan. 2017 2 880 53 2 934Profit/(loss) for the year 852 9 861Annual dividend* (578) (6) (584)Group contributions (22) - (22)Currency translation differences this year, etc. 36 - 36Equity at 31 Dec. 2017 3 169 56 3 225* Includes an additional dividend of NOK 400 million
Note 18 - Debt, financing and financial risk
2018 2017Overdraft* 9 64Total current interest-bearing liabilities 9 64
Bond issue 800 800Arrangement costs (1) (3)Total bond issue 799 797Other long-term interest-bearing liabilities 17 17Total non-current interest-bearing liabilities 816 815
MaturityDue in less than 2 years 409 464Due in 2-5 years 416 415Total 825 879
Key figuresUnused committed credit facilities 1 100 1 168* Overdraft outside the cashpool
Car Imports Car Dealers
Car Imports Car Dealers
Car Dealers Baltics
At 31 December 2018 the CEO and board members own 0.34% and 0.44% stakes, respectively, in Møller MI AS. Møller MI AS is an investment company where senior executives have the opportunity to invest. The CEO is the CEO of Møller Mobility Group AS and is employed and paid by the parent company. Bonus schemes have been established here where the size of the payment depends on the results achieved for the year, combined with other qualitative assessment criteria, and where the bonus is considered to be part of the normal remuneration for this type of position. Two executives are entitled to two years' salary in the event of major reorganisations.
Some subsidiaries in Møller Mobility Group have a number of minor equity investments with holdings of 20-35%, such as repair and lacquer workshops and the tyre hotel. These are not treated as associated companies since they have limited value and small profits. At 31 December 2018 these investments had a total carrying amount of NOK 3 million.
The Norwegian and Swedish companies in the Group have secured collective pension agreements. The companies in the three Baltic states do not have pension plans. In Norway we have an ongoing defined-contribution scheme. The defined-contribution plan is charged as a cost on an ongoing basis in the financial statements as the Group pays an amount of savings to the insurance company based on the individual employee's salary. The scheme has been adapted to comply with the new Act on occupational pensions, and the threshold between the lower and the higher savings rate is 7.1 x the National Insurance basic amount ("G"). In addition to saving for a retirement pension, disability pension and surviving children's pension are also covered. These payments do not have a paid-up policy element, meaning there is no future liability related to disability and children's pensions beyond the current premium payments.
The Group is a member of the contractual early retirement scheme (the "AFP" scheme) through the Norwegian Federation of Trade Unions (LO) and the Confederation of Norwegian Enterprise (NHO). The AFP scheme provides a life-long supplement to the standard pension. Employees can choose to start drawing on the AFP pension scheme from the age of 62. The pension scheme is a defined-benefit, multi-employer pension plan funded by premiums that are determined as a percentage of the individual's salary. There is no reliable measurement and allocation of liabilities and assets in the scheme. Therefore, in the financial statements the scheme is treated as a defined-contribution pension scheme where the premium payments are charged as a cost on an ongoing basis and no provisions are made in the financial statements.
Our Swedish companies have pension plans in accordance with a collective agreement. The scheme in Sweden is a combination of defined-benefit and defined-contribution plans based on job category, age and income. The defined-benefit plan is partially financed by means of premium payments, while the rest is financed through the accumulation of pension liabilities in the balance sheet. The pension liabilities related to the part of the scheme that is not insured are calculated by an actuary. These liabilities will be reduced in line with the ongoing pension payments. All future pension savings are now insured, but these amounts are not calculated by an actuary, as the scheme is such that assets and liabilities are not allocated directly to the individual company in the collective pension fund. Møller Mobility Group bases its accounting of defined-benefit pensions on IAS 19 (see the note on accounting policies). This entails that the year's actuarial gains and/or losses are charged to equity.
Møller Mobility Group AS has a committed credit facility totalling NOK 1,000 million. Subsidiaries that comprise more than 80% of the gross turnover and equity in the Group are guarantors. At 31 December 2018 no withdrawals had been made from this facility. In addition, Møller Mobility Group also has an overdraft facility of NOK 100 million, which is secured through joint and several liability (cashpool). At 31 December 2018 no withdrawals had been made from this facility either.
The guarantees for employees concern shareholders in Møller MI AS who have loans in Nordea that amounted to NOK 7 million at 31 December 2018. The guarantee is secured by collateral in shares. The Group companies included in the joint registration of VAT have joint and several liability for any debt. At 31 December 2018 Møller Mobility Group AS owes NOK 365 million in VAT, via the joint registration registered in Aars AS.
In 2014 the Group's companies in Latvia were imposed a corporate fine totalling EUR 7 million because of alleged price-fixing. Møller Mobility Group strongly disagrees with the grounds for the fine and holds that the fine is disproportionate and discriminatory in relation to the alleged violations. The case has been brought before the Latvian courts, and the Administrative Regional Court pronounced its judgment in October 2018. Two of the companies have been fully acquitted, representing EUR 5.2 million of the fines, while two of the companies have been found partially guilty, but to a less serious degree than in the original ruling. The Norwegian Competition Authority has appealed this judgment to the Supreme Court of Latvia. The Supreme Court may choose at its own discretion whether to hear this case or reject it. No provisions have been made for this in the financial statements for 2018.
LIABILITIESCurrent liabilitiesMøller Mobility Group has a committed credit facility of NOK 1,000 million that runs to 2021. The credit facilities are not secured, but all significant companies in Møller Mobility Group are jointly and severally liable for the liabilities. Møller Mobility Group AS is the registered borrower. At 31 December 2018 no withdrawals had been made from this facility. There are requirements (covenants) concerning financial key figures in the contract, linked to equity and cash flow, which are fulfilled at the end of the year. These liabilities are classified as current liabilities since all withdrawals from the facility will be of a short-term nature. For further information, see note 16.
Non-current liabilitiesMøller Mobility Group has long-term financing through two bond issues of together NOK 1,000 million, of which NOK 200 million is owned by the company itself. These bonds will mature in November 2019 and March 2022. The bond issue is not secured, but is coordinated with the syndicated bank loan in terms of joint and several liability within the Group, and has the same equity ratio requirements. Other long-term interest-bearing liabilities are deposits from employees.
FINANCIAL RISKThe Group has companies involved in selling, financing and servicing cars. The Group's activities involve financial risk associated with currency, rates, credit and liquidity. The Group manages risk with the objective of ensuring predictable cash flows and sufficient liquidity to meet natural fluctuations in working capital.
Currency riskThe Group sells products in local currency. In Norway, the Group is exposed to short-term currency risk relating to imports of products in EUR. Car manufacturers bear significant long-term currency risk through agreements. Short-term currency risk is hedged in the spot and forwards market. The forward contracts are market-assessed (mark-to-market) and the value is recorded as foreign exchange gains at year-end. Unrealised exchange losses of NOK 2.5 million were recognised in the income statement at year-end.
In addition the Group has currency risk associated with the Swedish and Baltic companies. The risks are mitigated by having local external liabilities in the local currency. Møller Mobility Group does not generally hedge equity in foreign companies, but does strive to secure the expected dividend with a horizon of one year. Møller Mobility Group's total secured amount at year-end was SEK 60 million and EUR 6 million.Unrealised exchange losses amounted to NOK 3.7 million at year-end.
Interest rate riskMøller Mobility Group is largely financed through a long-term bond issue with a floating interest rate. This entails a risk related to developments in interest costs. This risk is partially hedged by a portion of the debt being swapped to fixed interest rates through interest rate swaps. At 31 December 2018 the Group had interest rate swap agreements of NOK 400 million with a fixed interest rate of 2.2% and a remaining term matching the underlying loans. The interest swap agreements hedge 50% of the interest costs related to the bond issue at year-end. The date for determining the liquid element in the hedging contract is adapted according to the rollover of the underlying loans. The agreements were signed with a view to running until maturity. In light of this, Møller Mobility Group has chosen to record the agreements as hedge agreements, which means that ongoing changes in market value are not recorded in the income statement. At the balance sheet date, the market value of the contract was positive in the amount of NOK 2.2 million.
Credit riskA significant part of the Group's turnover is cash-based. There will be a temporary credit risk associated with sales by importer companies to external dealers and in cases where cars or workshop services are sold on credit. The risks are hedged with tight credit procedures and close monitoring of accounts receivable. Historically, losses have been low. At 31 December 2018, NOK 8 million has been allocated for losses on claims and actual losses in 2018 were NOK 6 million.
Liquidity riskThe Group operates in a cyclical industry with relatively large fluctuations in working capital. There is therefore a risk associated with short-term access to liquidity. This is
The amortization period for goodwill that is strategic investments is normally amortized over 10 years. These are investments where Møller Mobility Group has a long-term perspective and which is within the Group's core business. Other items are amortized over 5 years. Intangible assets of NOK 276 million relate to software and development costs for IT systems.
*The main rule is that uniform accounting principles are used for similar transactions and events, to provide the most accurate information about the investor’s overall operations. Volkswagen Møller Bilfinans switched to IFRS on 1 January 2018. It is not practicable to restate the entire financial statements such that they are in accordance with the Norwegian Accounting Act and generally accepted accounting policies. We have therefore chosen to apply different principles, in accordance with Norwegian accounting standard NRS (F) Investments in associates and joint ventures (June 2018), section 3.8. The main difference in the accounting policies at 31 December 2018 relates to provisions for losses in the leasing portfolio (IFRS 9). The conversion effect in Volkswagen Møller Bilfinans amounts to NOK -13 million in the opening balance equity, and this effect has been charged directly to equity in Møller Mobility Group on the same basis as a change in accounting policy.
** Equity and profit as of 31.12.17.

46 CSR report 2018MMG AS Finances 2018Group Finances 2018 Annual report 2018
NOTES TO THE CONSOLIDATED FINANCIAL STATEMENTS
All figures are in NOK millions.
Note 1 - Segment information
The business consists of the following business areas: Car Imports (Norway and Baltics), Car Dealers (Norway, Sweden and Baltics) and Car Finance (Norway).
The business areas report the following key figures:2018
Car Imports Car Dealers Car Finance Other companies Eliminations Group
Operating revenue 14 918 20 154 - 330 (9 229) 26 173Operating profit/(loss) 659 284 - (176) (5) 762Depreciation and write-downs 37 118 - 134 2 291Income from investments in associated companies - - 127 (1) - 126EBITDA 696 401 127 (42) (2) 1 180Other financial results (1) (35) - 27 - (8)Profit/(loss) before tax 658 249 127 (149) (5) 880
Assets 3 577 4 779 632 4 895 (5 711) 8 172
Norway Baltics Oslo West-Norway Mid-Norway Sweden BalticsOperating revenue 12 304 2 614 5 637 4 485 3 496 3 890 2 588EBITDA 664 33 86 137 62 95 59Profit/(loss) before tax 629 29 51 93 36 71 46Assets 2 907 670 1 237 1 023 891 632 718
2017
Car Imports Car Dealers Car Finance Other companies Eliminations Group
Operating revenue 16 247 21 784 - 318 (10 076) 28 273Operating profit/(loss) 858 391 - (126) (85) 1 038Depreciation and write-downs 22 123 - 87 2 234Income from investments in associated companies - - 117 - - 117EBITDA 881 514 117 (39) (83) 1 389Other financial results (4) (29) - (1) - (34)Profit/(loss) before tax 854 362 117 (127) (85) 1 121
Assets 3 094 5 028 518 3 880 (4 471) 8 050
Norway Baltics Oslo West-Norway Mid-Norway Sweden BalticsOperating revenue 14 070 2 177 6 550 5 003 3 683 4 158 2 332EBITDA 831 50 163 151 94 124 52Profit/(loss) before tax 806 48 122 106 71 100 41Assets 2 777 317 1 465 1 087 902 707 535
Note 2 - Payroll and other personnel costs
2018 2017Salaries 2 229 2 197Employer's NI contributions 352 345Pension costs 158 157Other personnel costs 90 114Total payroll and other personnel costs 2 829 2 812
Average number of employees 4 303 4 296Loans to employees 20 29
2018 2017Salaries, bonuses, pension costs and other remuneration for the CEO 8 7Board fees 2 2Total remuneration of senior executives 10 9
Loans to employees are mainly interest-bearing car loans where the companies have security in a car. The interest rate on these loans is 2.1%. In the event of sale, liquidation or other reorganisation, general managers in the Group are entitled to salary for one year, under certain terms.
2018 2017Audit fees and audit-related services 4 4Tax, fees and other consultancy services - 1Total auditor's fees (excl. VAT) 4 5
Note 3 - Other operating costs
2018 2017Operating costs (rent, electricity, maintenance, car costs, etc.) 965 949Sales costs (advertising, warranties, etc.) 714 758Administration costs (IT services, fees, travel expenses, gifts, bad debts) 236 257Total other operating costs 1 914 1 964
Note 4 - Investments in associated companies
Voting Equity Carrying Internal Additions Share of profit Carryingrights/ in company amount profit disposals after tax amount
Company name stake 31.12.18 01.01.18 2018 31.12.18Volkswagen Møller Bilfinans AS * 49,00 % 3 006 888 14 183 127 1 212UIP Holding AS** 20,55 % 16 - - 75 (1) 74Total 888 14 259 126 1 287
Investments in associated companies are incorporated in accordance with the equity method.
Note 5 - Other financial income and financial costs
2018 2017Interest income 5 5Currency gains 93 34Other financial income 2 2Total other financial income 100 40
Interest costs 22 23Currency losses 75 42Other financial costs 10 10Total other financial costs 107 75
Note 6 - Tangible fixed assets, intangible assets and goodwill
Machinery and Vehicles Buildings Intangible Goodwill* Totalfixtures assets
Acquisition cost at 1 Jan. 988 136 422 566 106 2 218Additions 87 85 36 119 - 327Disposals (57) (82) (1) (8) - (147)Currency translation difference (4) - - - (2) (6)Acquisition cost at 31 Dec. 1 014 140 457 678 104 2 392Accumulated depreciation at 1 Jan. 670 21 227 290 73 1 281Year's depreciation and write-downs 87 32 30 135 7 291Disposals (56) (32) - (1) - (89)Currency translation difference (1) - - - (2) (3)Depreciated at 31 Dec. 701 20 258 424 78 1 481Carrying amount at 31 Dec. 313 120 199 254 27 913* Goodwill in connection with acquisition of new companies, and goodwill in company financial statements.
Straight-line depreciation plan 3-7 years 3-7 years 20-50 years 3-10 years 5-10 years
Annual rental of off balance sheet business assets 14 404 418
Duration of rental of business assets 1-5 years 1-5 years 1-15 years
Tekst
Specification of goodwill in connection with acquisitions:Business unit Acquisition Depreciation Acquisition Accumulated Carrying Year's
date period cost* depreciation* amount* depreciationCar Dealers Norway 2016 10 years 4 1 3 1Car Dealers Sweden 2014 10 years 28 12 16 3
2011 10 years 32 25 7 3Car Dealers Sweden 2008 10 years 40 40 - -Total goodwill in connection with acquisitions 104 78 26 7* Incl. currency translation difference
Note 7 - Investments in other shares and units
Note 8 - Pensions
2018 2017Interest cost of pension liabilities 1 3Year's pension costs for funded and unfunded pensions 1 3Defined-contribution pension 109 107Defined-benefit pension not calculated by an actuary 48 46Total pension costs 158 157
Carrying amount pension obligations calculated by an actuary Calculated pension liabilities at 1 Jan. 2018 (54) (51)Actuarial gains and/or losses are charged to equity (2) -The year's pension costs (1) (3)The year's pension payments 2 2Currency translation difference 2 (2)Pension liabilities (53) (54)
Number of people covered by all pension plans 3 467 3 500
Financial assumptions Sweden NorwayReturn on pension assets - 0,0 %Discount rate 2,3 % 2,6 %Annual salary growth / annual G adjustment 2,0 % 0,0 %
The actuarial assumptions relating to demographic factors are the normal assumptions used by the insurance industry, adapted to the Group's age structure and retirement. All pension liabilities include the employers' National Insurance contribution.
Note 9 - Stock
2018 2017New cars 1 883 1 373Used cars and demonstration cars 1 419 1 688Parts and equipment 263 264Other stock 64 10Total stock 3 629 3 335
Note 10 - Accounts receivable
2018 2017Accounts receivable 1 319 1 345Provisions for bad debt (8) (11)Accounts receivable Aars Group 2 11Total accounts receivable 1 313 1 345
Note 11 - Other receivables
2018 2017Loans to employees 9 13Other long term receivables 1 - Total non-current receivables 10 13
2018 2017Advances to suppliers 6 9Loans to employees 12 16Net VAT credit 4 3Other prepaid expenses 66 101Accrued income 246 181Other current receivables 151 202Total current receivables 486 513
Note 12 - Bank depositsThe Group has bank deposits totalling NOK 261 million. There are no restricted funds to cover tax owed. Tax deductions are secured bya bank guarantee (see note 16).
Note 13 - Share capital and shareholder information
Shareholders in Møller Mobility Group AS at 31 Dec. 2018 Number StakeA shares:Jan H. Møller 103 0,375 %B shares:Jan H. Møller 1 0,004 %Aars AS 24 778 90,102 %Møller MI AS 2 618 9,520 %Total 27 500 100,00 %
The share capital consists of 27,500 shares with a nominal value of NOK 1,734, in total NOK 48 million. There are two classes of share. All shares have equal voting rights. Aars AS votes for 98.112 % of the shares, 8.01 % is indirectly through Møller MI AS. Class A shares are guaranteed an annual dividendof NOK 5 million, collected from Møller Mobility Group AS and Møller Eiendom Holding AS.
Note 14 - Other current liabilities
2018 2017Provision for warranties and other liabilities 851 699Accrued costs and prepaid income 510 485Holiday pay and accrued salary 354 349Advances from customers 251 146Total other current liabilities 1 966 1 678
Note 15 - Related parties
Company Company relationship Transaction type 2018 2017Volkswagen Møller Bilfinans AS Associated company Sale of cars 3 572 4 227Total sales 3 572 4 227
Volkswagen Møller Bilfinans AS Associated company Purchase of cars 1 439 1 587Møller Eiendom Associated group Rent costs 219 187Total purchases 1 658 1 774
Volkswagen Møller Bilfinans AS Associated company Balances at 31 December 49 150Infocare AS Sister Balances at 31 December 24 -Aars AS Parent Balances at 31 December 249 183
Note 16 - Pledges, guarantees and commitments
2018 2017Fixtures 47 45Accounts receivable and stock 879 458Total carrying amount of assets with encumbrances 926 503
Guarantees 2018 2017Repurchase agreements for cars 8 073 7 063Vehicle import duty, Customs Region Oslo and Akershus 135 135Withholding tax 119 115Employees 7 8
Note 17 - Share capital
2018 Majority Minorities TotalEquity at 1 Jan. 2018 3 169 56 3 225Change in accounting principles regarding associated company (note 4) (13) - (13)Profit/(loss) for the year 677 12 689Annual dividend* (578) (10) (588)Group contributions (22) - (22)Pension Sweden (2) - (2)Currency translation differences this year, etc. (5) 3 (2)Equity at 31 Dec. 2018 3 225 61 3 286* Includes an additional dividend of NOK 300 million
Accumulated translation differences at 31 December 2018 amounted to NOK 100 million.
2017 Majority Minorities TotalEquity at 1 Jan. 2017 2 880 53 2 934Profit/(loss) for the year 852 9 861Annual dividend* (578) (6) (584)Group contributions (22) - (22)Currency translation differences this year, etc. 36 - 36Equity at 31 Dec. 2017 3 169 56 3 225* Includes an additional dividend of NOK 400 million
Note 18 - Debt, financing and financial risk
2018 2017Overdraft* 9 64Total current interest-bearing liabilities 9 64
Bond issue 800 800Arrangement costs (1) (3)Total bond issue 799 797Other long-term interest-bearing liabilities 17 17Total non-current interest-bearing liabilities 816 815
MaturityDue in less than 2 years 409 464Due in 2-5 years 416 415Total 825 879
Key figuresUnused committed credit facilities 1 100 1 168* Overdraft outside the cashpool
Car Imports Car Dealers
Car Imports Car Dealers
Car Dealers Baltics
At 31 December 2018 the CEO and board members own 0.34% and 0.44% stakes, respectively, in Møller MI AS. Møller MI AS is an investment company where senior executives have the opportunity to invest. The CEO is the CEO of Møller Mobility Group AS and is employed and paid by the parent company. Bonus schemes have been established here where the size of the payment depends on the results achieved for the year, combined with other qualitative assessment criteria, and where the bonus is considered to be part of the normal remuneration for this type of position. Two executives are entitled to two years' salary in the event of major reorganisations.
Some subsidiaries in Møller Mobility Group have a number of minor equity investments with holdings of 20-35%, such as repair and lacquer workshops and the tyre hotel. These are not treated as associated companies since they have limited value and small profits. At 31 December 2018 these investments had a total carrying amount of NOK 3 million.
The Norwegian and Swedish companies in the Group have secured collective pension agreements. The companies in the three Baltic states do not have pension plans. In Norway we have an ongoing defined-contribution scheme. The defined-contribution plan is charged as a cost on an ongoing basis in the financial statements as the Group pays an amount of savings to the insurance company based on the individual employee's salary. The scheme has been adapted to comply with the new Act on occupational pensions, and the threshold between the lower and the higher savings rate is 7.1 x the National Insurance basic amount ("G"). In addition to saving for a retirement pension, disability pension and surviving children's pension are also covered. These payments do not have a paid-up policy element, meaning there is no future liability related to disability and children's pensions beyond the current premium payments.
The Group is a member of the contractual early retirement scheme (the "AFP" scheme) through the Norwegian Federation of Trade Unions (LO) and the Confederation of Norwegian Enterprise (NHO). The AFP scheme provides a life-long supplement to the standard pension. Employees can choose to start drawing on the AFP pension scheme from the age of 62. The pension scheme is a defined-benefit, multi-employer pension plan funded by premiums that are determined as a percentage of the individual's salary. There is no reliable measurement and allocation of liabilities and assets in the scheme. Therefore, in the financial statements the scheme is treated as a defined-contribution pension scheme where the premium payments are charged as a cost on an ongoing basis and no provisions are made in the financial statements.
Our Swedish companies have pension plans in accordance with a collective agreement. The scheme in Sweden is a combination of defined-benefit and defined-contribution plans based on job category, age and income. The defined-benefit plan is partially financed by means of premium payments, while the rest is financed through the accumulation of pension liabilities in the balance sheet. The pension liabilities related to the part of the scheme that is not insured are calculated by an actuary. These liabilities will be reduced in line with the ongoing pension payments. All future pension savings are now insured, but these amounts are not calculated by an actuary, as the scheme is such that assets and liabilities are not allocated directly to the individual company in the collective pension fund. Møller Mobility Group bases its accounting of defined-benefit pensions on IAS 19 (see the note on accounting policies). This entails that the year's actuarial gains and/or losses are charged to equity.
Møller Mobility Group AS has a committed credit facility totalling NOK 1,000 million. Subsidiaries that comprise more than 80% of the gross turnover and equity in the Group are guarantors. At 31 December 2018 no withdrawals had been made from this facility. In addition, Møller Mobility Group also has an overdraft facility of NOK 100 million, which is secured through joint and several liability (cashpool). At 31 December 2018 no withdrawals had been made from this facility either.
The guarantees for employees concern shareholders in Møller MI AS who have loans in Nordea that amounted to NOK 7 million at 31 December 2018. The guarantee is secured by collateral in shares. The Group companies included in the joint registration of VAT have joint and several liability for any debt. At 31 December 2018 Møller Mobility Group AS owes NOK 365 million in VAT, via the joint registration registered in Aars AS.
In 2014 the Group's companies in Latvia were imposed a corporate fine totalling EUR 7 million because of alleged price-fixing. Møller Mobility Group strongly disagrees with the grounds for the fine and holds that the fine is disproportionate and discriminatory in relation to the alleged violations. The case has been brought before the Latvian courts, and the Administrative Regional Court pronounced its judgment in October 2018. Two of the companies have been fully acquitted, representing EUR 5.2 million of the fines, while two of the companies have been found partially guilty, but to a less serious degree than in the original ruling. The Norwegian Competition Authority has appealed this judgment to the Supreme Court of Latvia. The Supreme Court may choose at its own discretion whether to hear this case or reject it. No provisions have been made for this in the financial statements for 2018.
LIABILITIESCurrent liabilitiesMøller Mobility Group has a committed credit facility of NOK 1,000 million that runs to 2021. The credit facilities are not secured, but all significant companies in Møller Mobility Group are jointly and severally liable for the liabilities. Møller Mobility Group AS is the registered borrower. At 31 December 2018 no withdrawals had been made from this facility. There are requirements (covenants) concerning financial key figures in the contract, linked to equity and cash flow, which are fulfilled at the end of the year. These liabilities are classified as current liabilities since all withdrawals from the facility will be of a short-term nature. For further information, see note 16.
Non-current liabilitiesMøller Mobility Group has long-term financing through two bond issues of together NOK 1,000 million, of which NOK 200 million is owned by the company itself. These bonds will mature in November 2019 and March 2022. The bond issue is not secured, but is coordinated with the syndicated bank loan in terms of joint and several liability within the Group, and has the same equity ratio requirements. Other long-term interest-bearing liabilities are deposits from employees.
FINANCIAL RISKThe Group has companies involved in selling, financing and servicing cars. The Group's activities involve financial risk associated with currency, rates, credit and liquidity. The Group manages risk with the objective of ensuring predictable cash flows and sufficient liquidity to meet natural fluctuations in working capital.
Currency riskThe Group sells products in local currency. In Norway, the Group is exposed to short-term currency risk relating to imports of products in EUR. Car manufacturers bear significant long-term currency risk through agreements. Short-term currency risk is hedged in the spot and forwards market. The forward contracts are market-assessed (mark-to-market) and the value is recorded as foreign exchange gains at year-end. Unrealised exchange losses of NOK 2.5 million were recognised in the income statement at year-end.
In addition the Group has currency risk associated with the Swedish and Baltic companies. The risks are mitigated by having local external liabilities in the local currency. Møller Mobility Group does not generally hedge equity in foreign companies, but does strive to secure the expected dividend with a horizon of one year. Møller Mobility Group's total secured amount at year-end was SEK 60 million and EUR 6 million.Unrealised exchange losses amounted to NOK 3.7 million at year-end.
Interest rate riskMøller Mobility Group is largely financed through a long-term bond issue with a floating interest rate. This entails a risk related to developments in interest costs. This risk is partially hedged by a portion of the debt being swapped to fixed interest rates through interest rate swaps. At 31 December 2018 the Group had interest rate swap agreements of NOK 400 million with a fixed interest rate of 2.2% and a remaining term matching the underlying loans. The interest swap agreements hedge 50% of the interest costs related to the bond issue at year-end. The date for determining the liquid element in the hedging contract is adapted according to the rollover of the underlying loans. The agreements were signed with a view to running until maturity. In light of this, Møller Mobility Group has chosen to record the agreements as hedge agreements, which means that ongoing changes in market value are not recorded in the income statement. At the balance sheet date, the market value of the contract was positive in the amount of NOK 2.2 million.
Credit riskA significant part of the Group's turnover is cash-based. There will be a temporary credit risk associated with sales by importer companies to external dealers and in cases where cars or workshop services are sold on credit. The risks are hedged with tight credit procedures and close monitoring of accounts receivable. Historically, losses have been low. At 31 December 2018, NOK 8 million has been allocated for losses on claims and actual losses in 2018 were NOK 6 million.
Liquidity riskThe Group operates in a cyclical industry with relatively large fluctuations in working capital. There is therefore a risk associated with short-term access to liquidity. This is
The amortization period for goodwill that is strategic investments is normally amortized over 10 years. These are investments where Møller Mobility Group has a long-term perspective and which is within the Group's core business. Other items are amortized over 5 years. Intangible assets of NOK 276 million relate to software and development costs for IT systems.
*The main rule is that uniform accounting principles are used for similar transactions and events, to provide the most accurate information about the investor’s overall operations. Volkswagen Møller Bilfinans switched to IFRS on 1 January 2018. It is not practicable to restate the entire financial statements such that they are in accordance with the Norwegian Accounting Act and generally accepted accounting policies. We have therefore chosen to apply different principles, in accordance with Norwegian accounting standard NRS (F) Investments in associates and joint ventures (June 2018), section 3.8. The main difference in the accounting policies at 31 December 2018 relates to provisions for losses in the leasing portfolio (IFRS 9). The conversion effect in Volkswagen Møller Bilfinans amounts to NOK -13 million in the opening balance equity, and this effect has been charged directly to equity in Møller Mobility Group on the same basis as a change in accounting policy.
** Equity and profit as of 31.12.17.

47 CSR report 2018MMG AS Finances 2018Group Finances 2018 Annual report 2018
NOTES TO THE CONSOLIDATED FINANCIAL STATEMENTS
All figures are in NOK millions.
Note 1 - Segment information
The business consists of the following business areas: Car Imports (Norway and Baltics), Car Dealers (Norway, Sweden and Baltics) and Car Finance (Norway).
The business areas report the following key figures:2018
Car Imports Car Dealers Car Finance Other companies Eliminations Group
Operating revenue 14 918 20 154 - 330 (9 229) 26 173Operating profit/(loss) 659 284 - (176) (5) 762Depreciation and write-downs 37 118 - 134 2 291Income from investments in associated companies - - 127 (1) - 126EBITDA 696 401 127 (42) (2) 1 180Other financial results (1) (35) - 27 - (8)Profit/(loss) before tax 658 249 127 (149) (5) 880
Assets 3 577 4 779 632 4 895 (5 711) 8 172
Norway Baltics Oslo West-Norway Mid-Norway Sweden BalticsOperating revenue 12 304 2 614 5 637 4 485 3 496 3 890 2 588EBITDA 664 33 86 137 62 95 59Profit/(loss) before tax 629 29 51 93 36 71 46Assets 2 907 670 1 237 1 023 891 632 718
2017
Car Imports Car Dealers Car Finance Other companies Eliminations Group
Operating revenue 16 247 21 784 - 318 (10 076) 28 273Operating profit/(loss) 858 391 - (126) (85) 1 038Depreciation and write-downs 22 123 - 87 2 234Income from investments in associated companies - - 117 - - 117EBITDA 881 514 117 (39) (83) 1 389Other financial results (4) (29) - (1) - (34)Profit/(loss) before tax 854 362 117 (127) (85) 1 121
Assets 3 094 5 028 518 3 880 (4 471) 8 050
Norway Baltics Oslo West-Norway Mid-Norway Sweden BalticsOperating revenue 14 070 2 177 6 550 5 003 3 683 4 158 2 332EBITDA 831 50 163 151 94 124 52Profit/(loss) before tax 806 48 122 106 71 100 41Assets 2 777 317 1 465 1 087 902 707 535
Note 2 - Payroll and other personnel costs
2018 2017Salaries 2 229 2 197Employer's NI contributions 352 345Pension costs 158 157Other personnel costs 90 114Total payroll and other personnel costs 2 829 2 812
Average number of employees 4 303 4 296Loans to employees 20 29
2018 2017Salaries, bonuses, pension costs and other remuneration for the CEO 8 7Board fees 2 2Total remuneration of senior executives 10 9
Loans to employees are mainly interest-bearing car loans where the companies have security in a car. The interest rate on these loans is 2.1%. In the event of sale, liquidation or other reorganisation, general managers in the Group are entitled to salary for one year, under certain terms.
2018 2017Audit fees and audit-related services 4 4Tax, fees and other consultancy services - 1Total auditor's fees (excl. VAT) 4 5
Note 3 - Other operating costs
2018 2017Operating costs (rent, electricity, maintenance, car costs, etc.) 965 949Sales costs (advertising, warranties, etc.) 714 758Administration costs (IT services, fees, travel expenses, gifts, bad debts) 236 257Total other operating costs 1 914 1 964
Note 4 - Investments in associated companies
Voting Equity Carrying Internal Additions Share of profit Carryingrights/ in company amount profit disposals after tax amount
Company name stake 31.12.18 01.01.18 2018 31.12.18Volkswagen Møller Bilfinans AS * 49,00 % 3 006 888 14 183 127 1 212UIP Holding AS** 20,55 % 16 - - 75 (1) 74Total 888 14 259 126 1 287
Investments in associated companies are incorporated in accordance with the equity method.
Note 5 - Other financial income and financial costs
2018 2017Interest income 5 5Currency gains 93 34Other financial income 2 2Total other financial income 100 40
Interest costs 22 23Currency losses 75 42Other financial costs 10 10Total other financial costs 107 75
Note 6 - Tangible fixed assets, intangible assets and goodwill
Machinery and Vehicles Buildings Intangible Goodwill* Totalfixtures assets
Acquisition cost at 1 Jan. 988 136 422 566 106 2 218Additions 87 85 36 119 - 327Disposals (57) (82) (1) (8) - (147)Currency translation difference (4) - - - (2) (6)Acquisition cost at 31 Dec. 1 014 140 457 678 104 2 392Accumulated depreciation at 1 Jan. 670 21 227 290 73 1 281Year's depreciation and write-downs 87 32 30 135 7 291Disposals (56) (32) - (1) - (89)Currency translation difference (1) - - - (2) (3)Depreciated at 31 Dec. 701 20 258 424 78 1 481Carrying amount at 31 Dec. 313 120 199 254 27 913* Goodwill in connection with acquisition of new companies, and goodwill in company financial statements.
Straight-line depreciation plan 3-7 years 3-7 years 20-50 years 3-10 years 5-10 years
Annual rental of off balance sheet business assets 14 404 418
Duration of rental of business assets 1-5 years 1-5 years 1-15 years
Tekst
Specification of goodwill in connection with acquisitions:Business unit Acquisition Depreciation Acquisition Accumulated Carrying Year's
date period cost* depreciation* amount* depreciationCar Dealers Norway 2016 10 years 4 1 3 1Car Dealers Sweden 2014 10 years 28 12 16 3
2011 10 years 32 25 7 3Car Dealers Sweden 2008 10 years 40 40 - -Total goodwill in connection with acquisitions 104 78 26 7* Incl. currency translation difference
Note 7 - Investments in other shares and units
Note 8 - Pensions
2018 2017Interest cost of pension liabilities 1 3Year's pension costs for funded and unfunded pensions 1 3Defined-contribution pension 109 107Defined-benefit pension not calculated by an actuary 48 46Total pension costs 158 157
Carrying amount pension obligations calculated by an actuary Calculated pension liabilities at 1 Jan. 2018 (54) (51)Actuarial gains and/or losses are charged to equity (2) -The year's pension costs (1) (3)The year's pension payments 2 2Currency translation difference 2 (2)Pension liabilities (53) (54)
Number of people covered by all pension plans 3 467 3 500
Financial assumptions Sweden NorwayReturn on pension assets - 0,0 %Discount rate 2,3 % 2,6 %Annual salary growth / annual G adjustment 2,0 % 0,0 %
The actuarial assumptions relating to demographic factors are the normal assumptions used by the insurance industry, adapted to the Group's age structure and retirement. All pension liabilities include the employers' National Insurance contribution.
Note 9 - Stock
2018 2017New cars 1 883 1 373Used cars and demonstration cars 1 419 1 688Parts and equipment 263 264Other stock 64 10Total stock 3 629 3 335
Note 10 - Accounts receivable
2018 2017Accounts receivable 1 319 1 345Provisions for bad debt (8) (11)Accounts receivable Aars Group 2 11Total accounts receivable 1 313 1 345
Note 11 - Other receivables
2018 2017Loans to employees 9 13Other long term receivables 1 - Total non-current receivables 10 13
2018 2017Advances to suppliers 6 9Loans to employees 12 16Net VAT credit 4 3Other prepaid expenses 66 101Accrued income 246 181Other current receivables 151 202Total current receivables 486 513
Note 12 - Bank depositsThe Group has bank deposits totalling NOK 261 million. There are no restricted funds to cover tax owed. Tax deductions are secured bya bank guarantee (see note 16).
Note 13 - Share capital and shareholder information
Shareholders in Møller Mobility Group AS at 31 Dec. 2018 Number StakeA shares:Jan H. Møller 103 0,375 %B shares:Jan H. Møller 1 0,004 %Aars AS 24 778 90,102 %Møller MI AS 2 618 9,520 %Total 27 500 100,00 %
The share capital consists of 27,500 shares with a nominal value of NOK 1,734, in total NOK 48 million. There are two classes of share. All shares have equal voting rights. Aars AS votes for 98.112 % of the shares, 8.01 % is indirectly through Møller MI AS. Class A shares are guaranteed an annual dividendof NOK 5 million, collected from Møller Mobility Group AS and Møller Eiendom Holding AS.
Note 14 - Other current liabilities
2018 2017Provision for warranties and other liabilities 851 699Accrued costs and prepaid income 510 485Holiday pay and accrued salary 354 349Advances from customers 251 146Total other current liabilities 1 966 1 678
Note 15 - Related parties
Company Company relationship Transaction type 2018 2017Volkswagen Møller Bilfinans AS Associated company Sale of cars 3 572 4 227Total sales 3 572 4 227
Volkswagen Møller Bilfinans AS Associated company Purchase of cars 1 439 1 587Møller Eiendom Associated group Rent costs 219 187Total purchases 1 658 1 774
Volkswagen Møller Bilfinans AS Associated company Balances at 31 December 49 150Infocare AS Sister Balances at 31 December 24 -Aars AS Parent Balances at 31 December 249 183
Note 16 - Pledges, guarantees and commitments
2018 2017Fixtures 47 45Accounts receivable and stock 879 458Total carrying amount of assets with encumbrances 926 503
Guarantees 2018 2017Repurchase agreements for cars 8 073 7 063Vehicle import duty, Customs Region Oslo and Akershus 135 135Withholding tax 119 115Employees 7 8
Note 17 - Share capital
2018 Majority Minorities TotalEquity at 1 Jan. 2018 3 169 56 3 225Change in accounting principles regarding associated company (note 4) (13) - (13)Profit/(loss) for the year 677 12 689Annual dividend* (578) (10) (588)Group contributions (22) - (22)Pension Sweden (2) - (2)Currency translation differences this year, etc. (5) 3 (2)Equity at 31 Dec. 2018 3 225 61 3 286* Includes an additional dividend of NOK 300 million
Accumulated translation differences at 31 December 2018 amounted to NOK 100 million.
2017 Majority Minorities TotalEquity at 1 Jan. 2017 2 880 53 2 934Profit/(loss) for the year 852 9 861Annual dividend* (578) (6) (584)Group contributions (22) - (22)Currency translation differences this year, etc. 36 - 36Equity at 31 Dec. 2017 3 169 56 3 225* Includes an additional dividend of NOK 400 million
Note 18 - Debt, financing and financial risk
2018 2017Overdraft* 9 64Total current interest-bearing liabilities 9 64
Bond issue 800 800Arrangement costs (1) (3)Total bond issue 799 797Other long-term interest-bearing liabilities 17 17Total non-current interest-bearing liabilities 816 815
MaturityDue in less than 2 years 409 464Due in 2-5 years 416 415Total 825 879
Key figuresUnused committed credit facilities 1 100 1 168* Overdraft outside the cashpool
Car Imports Car Dealers
Car Imports Car Dealers
Car Dealers Baltics
At 31 December 2018 the CEO and board members own 0.34% and 0.44% stakes, respectively, in Møller MI AS. Møller MI AS is an investment company where senior executives have the opportunity to invest. The CEO is the CEO of Møller Mobility Group AS and is employed and paid by the parent company. Bonus schemes have been established here where the size of the payment depends on the results achieved for the year, combined with other qualitative assessment criteria, and where the bonus is considered to be part of the normal remuneration for this type of position. Two executives are entitled to two years' salary in the event of major reorganisations.
Some subsidiaries in Møller Mobility Group have a number of minor equity investments with holdings of 20-35%, such as repair and lacquer workshops and the tyre hotel. These are not treated as associated companies since they have limited value and small profits. At 31 December 2018 these investments had a total carrying amount of NOK 3 million.
The Norwegian and Swedish companies in the Group have secured collective pension agreements. The companies in the three Baltic states do not have pension plans. In Norway we have an ongoing defined-contribution scheme. The defined-contribution plan is charged as a cost on an ongoing basis in the financial statements as the Group pays an amount of savings to the insurance company based on the individual employee's salary. The scheme has been adapted to comply with the new Act on occupational pensions, and the threshold between the lower and the higher savings rate is 7.1 x the National Insurance basic amount ("G"). In addition to saving for a retirement pension, disability pension and surviving children's pension are also covered. These payments do not have a paid-up policy element, meaning there is no future liability related to disability and children's pensions beyond the current premium payments.
The Group is a member of the contractual early retirement scheme (the "AFP" scheme) through the Norwegian Federation of Trade Unions (LO) and the Confederation of Norwegian Enterprise (NHO). The AFP scheme provides a life-long supplement to the standard pension. Employees can choose to start drawing on the AFP pension scheme from the age of 62. The pension scheme is a defined-benefit, multi-employer pension plan funded by premiums that are determined as a percentage of the individual's salary. There is no reliable measurement and allocation of liabilities and assets in the scheme. Therefore, in the financial statements the scheme is treated as a defined-contribution pension scheme where the premium payments are charged as a cost on an ongoing basis and no provisions are made in the financial statements.
Our Swedish companies have pension plans in accordance with a collective agreement. The scheme in Sweden is a combination of defined-benefit and defined-contribution plans based on job category, age and income. The defined-benefit plan is partially financed by means of premium payments, while the rest is financed through the accumulation of pension liabilities in the balance sheet. The pension liabilities related to the part of the scheme that is not insured are calculated by an actuary. These liabilities will be reduced in line with the ongoing pension payments. All future pension savings are now insured, but these amounts are not calculated by an actuary, as the scheme is such that assets and liabilities are not allocated directly to the individual company in the collective pension fund. Møller Mobility Group bases its accounting of defined-benefit pensions on IAS 19 (see the note on accounting policies). This entails that the year's actuarial gains and/or losses are charged to equity.
Møller Mobility Group AS has a committed credit facility totalling NOK 1,000 million. Subsidiaries that comprise more than 80% of the gross turnover and equity in the Group are guarantors. At 31 December 2018 no withdrawals had been made from this facility. In addition, Møller Mobility Group also has an overdraft facility of NOK 100 million, which is secured through joint and several liability (cashpool). At 31 December 2018 no withdrawals had been made from this facility either.
The guarantees for employees concern shareholders in Møller MI AS who have loans in Nordea that amounted to NOK 7 million at 31 December 2018. The guarantee is secured by collateral in shares. The Group companies included in the joint registration of VAT have joint and several liability for any debt. At 31 December 2018 Møller Mobility Group AS owes NOK 365 million in VAT, via the joint registration registered in Aars AS.
In 2014 the Group's companies in Latvia were imposed a corporate fine totalling EUR 7 million because of alleged price-fixing. Møller Mobility Group strongly disagrees with the grounds for the fine and holds that the fine is disproportionate and discriminatory in relation to the alleged violations. The case has been brought before the Latvian courts, and the Administrative Regional Court pronounced its judgment in October 2018. Two of the companies have been fully acquitted, representing EUR 5.2 million of the fines, while two of the companies have been found partially guilty, but to a less serious degree than in the original ruling. The Norwegian Competition Authority has appealed this judgment to the Supreme Court of Latvia. The Supreme Court may choose at its own discretion whether to hear this case or reject it. No provisions have been made for this in the financial statements for 2018.
LIABILITIESCurrent liabilitiesMøller Mobility Group has a committed credit facility of NOK 1,000 million that runs to 2021. The credit facilities are not secured, but all significant companies in Møller Mobility Group are jointly and severally liable for the liabilities. Møller Mobility Group AS is the registered borrower. At 31 December 2018 no withdrawals had been made from this facility. There are requirements (covenants) concerning financial key figures in the contract, linked to equity and cash flow, which are fulfilled at the end of the year. These liabilities are classified as current liabilities since all withdrawals from the facility will be of a short-term nature. For further information, see note 16.
Non-current liabilitiesMøller Mobility Group has long-term financing through two bond issues of together NOK 1,000 million, of which NOK 200 million is owned by the company itself. These bonds will mature in November 2019 and March 2022. The bond issue is not secured, but is coordinated with the syndicated bank loan in terms of joint and several liability within the Group, and has the same equity ratio requirements. Other long-term interest-bearing liabilities are deposits from employees.
FINANCIAL RISKThe Group has companies involved in selling, financing and servicing cars. The Group's activities involve financial risk associated with currency, rates, credit and liquidity. The Group manages risk with the objective of ensuring predictable cash flows and sufficient liquidity to meet natural fluctuations in working capital.
Currency riskThe Group sells products in local currency. In Norway, the Group is exposed to short-term currency risk relating to imports of products in EUR. Car manufacturers bear significant long-term currency risk through agreements. Short-term currency risk is hedged in the spot and forwards market. The forward contracts are market-assessed (mark-to-market) and the value is recorded as foreign exchange gains at year-end. Unrealised exchange losses of NOK 2.5 million were recognised in the income statement at year-end.
In addition the Group has currency risk associated with the Swedish and Baltic companies. The risks are mitigated by having local external liabilities in the local currency. Møller Mobility Group does not generally hedge equity in foreign companies, but does strive to secure the expected dividend with a horizon of one year. Møller Mobility Group's total secured amount at year-end was SEK 60 million and EUR 6 million.Unrealised exchange losses amounted to NOK 3.7 million at year-end.
Interest rate riskMøller Mobility Group is largely financed through a long-term bond issue with a floating interest rate. This entails a risk related to developments in interest costs. This risk is partially hedged by a portion of the debt being swapped to fixed interest rates through interest rate swaps. At 31 December 2018 the Group had interest rate swap agreements of NOK 400 million with a fixed interest rate of 2.2% and a remaining term matching the underlying loans. The interest swap agreements hedge 50% of the interest costs related to the bond issue at year-end. The date for determining the liquid element in the hedging contract is adapted according to the rollover of the underlying loans. The agreements were signed with a view to running until maturity. In light of this, Møller Mobility Group has chosen to record the agreements as hedge agreements, which means that ongoing changes in market value are not recorded in the income statement. At the balance sheet date, the market value of the contract was positive in the amount of NOK 2.2 million.
Credit riskA significant part of the Group's turnover is cash-based. There will be a temporary credit risk associated with sales by importer companies to external dealers and in cases where cars or workshop services are sold on credit. The risks are hedged with tight credit procedures and close monitoring of accounts receivable. Historically, losses have been low. At 31 December 2018, NOK 8 million has been allocated for losses on claims and actual losses in 2018 were NOK 6 million.
Liquidity riskThe Group operates in a cyclical industry with relatively large fluctuations in working capital. There is therefore a risk associated with short-term access to liquidity. This is
The amortization period for goodwill that is strategic investments is normally amortized over 10 years. These are investments where Møller Mobility Group has a long-term perspective and which is within the Group's core business. Other items are amortized over 5 years. Intangible assets of NOK 276 million relate to software and development costs for IT systems.
*The main rule is that uniform accounting principles are used for similar transactions and events, to provide the most accurate information about the investor’s overall operations. Volkswagen Møller Bilfinans switched to IFRS on 1 January 2018. It is not practicable to restate the entire financial statements such that they are in accordance with the Norwegian Accounting Act and generally accepted accounting policies. We have therefore chosen to apply different principles, in accordance with Norwegian accounting standard NRS (F) Investments in associates and joint ventures (June 2018), section 3.8. The main difference in the accounting policies at 31 December 2018 relates to provisions for losses in the leasing portfolio (IFRS 9). The conversion effect in Volkswagen Møller Bilfinans amounts to NOK -13 million in the opening balance equity, and this effect has been charged directly to equity in Møller Mobility Group on the same basis as a change in accounting policy.
** Equity and profit as of 31.12.17.

48 CSR report 2018MMG AS Finances 2018Group Finances 2018 Annual report 2018
NOTES TO THE CONSOLIDATED FINANCIAL STATEMENTS
All figures are in NOK millions.
Note 1 - Segment information
The business consists of the following business areas: Car Imports (Norway and Baltics), Car Dealers (Norway, Sweden and Baltics) and Car Finance (Norway).
The business areas report the following key figures:2018
Car Imports Car Dealers Car Finance Other companies Eliminations Group
Operating revenue 14 918 20 154 - 330 (9 229) 26 173Operating profit/(loss) 659 284 - (176) (5) 762Depreciation and write-downs 37 118 - 134 2 291Income from investments in associated companies - - 127 (1) - 126EBITDA 696 401 127 (42) (2) 1 180Other financial results (1) (35) - 27 - (8)Profit/(loss) before tax 658 249 127 (149) (5) 880
Assets 3 577 4 779 632 4 895 (5 711) 8 172
Norway Baltics Oslo West-Norway Mid-Norway Sweden BalticsOperating revenue 12 304 2 614 5 637 4 485 3 496 3 890 2 588EBITDA 664 33 86 137 62 95 59Profit/(loss) before tax 629 29 51 93 36 71 46Assets 2 907 670 1 237 1 023 891 632 718
2017
Car Imports Car Dealers Car Finance Other companies Eliminations Group
Operating revenue 16 247 21 784 - 318 (10 076) 28 273Operating profit/(loss) 858 391 - (126) (85) 1 038Depreciation and write-downs 22 123 - 87 2 234Income from investments in associated companies - - 117 - - 117EBITDA 881 514 117 (39) (83) 1 389Other financial results (4) (29) - (1) - (34)Profit/(loss) before tax 854 362 117 (127) (85) 1 121
Assets 3 094 5 028 518 3 880 (4 471) 8 050
Norway Baltics Oslo West-Norway Mid-Norway Sweden BalticsOperating revenue 14 070 2 177 6 550 5 003 3 683 4 158 2 332EBITDA 831 50 163 151 94 124 52Profit/(loss) before tax 806 48 122 106 71 100 41Assets 2 777 317 1 465 1 087 902 707 535
Note 2 - Payroll and other personnel costs
2018 2017Salaries 2 229 2 197Employer's NI contributions 352 345Pension costs 158 157Other personnel costs 90 114Total payroll and other personnel costs 2 829 2 812
Average number of employees 4 303 4 296Loans to employees 20 29
2018 2017Salaries, bonuses, pension costs and other remuneration for the CEO 8 7Board fees 2 2Total remuneration of senior executives 10 9
Loans to employees are mainly interest-bearing car loans where the companies have security in a car. The interest rate on these loans is 2.1%. In the event of sale, liquidation or other reorganisation, general managers in the Group are entitled to salary for one year, under certain terms.
2018 2017Audit fees and audit-related services 4 4Tax, fees and other consultancy services - 1Total auditor's fees (excl. VAT) 4 5
Note 3 - Other operating costs
2018 2017Operating costs (rent, electricity, maintenance, car costs, etc.) 965 949Sales costs (advertising, warranties, etc.) 714 758Administration costs (IT services, fees, travel expenses, gifts, bad debts) 236 257Total other operating costs 1 914 1 964
Note 4 - Investments in associated companies
Voting Equity Carrying Internal Additions Share of profit Carryingrights/ in company amount profit disposals after tax amount
Company name stake 31.12.18 01.01.18 2018 31.12.18Volkswagen Møller Bilfinans AS * 49,00 % 3 006 888 14 183 127 1 212UIP Holding AS** 20,55 % 16 - - 75 (1) 74Total 888 14 259 126 1 287
Investments in associated companies are incorporated in accordance with the equity method.
Note 5 - Other financial income and financial costs
2018 2017Interest income 5 5Currency gains 93 34Other financial income 2 2Total other financial income 100 40
Interest costs 22 23Currency losses 75 42Other financial costs 10 10Total other financial costs 107 75
Note 6 - Tangible fixed assets, intangible assets and goodwill
Machinery and Vehicles Buildings Intangible Goodwill* Totalfixtures assets
Acquisition cost at 1 Jan. 988 136 422 566 106 2 218Additions 87 85 36 119 - 327Disposals (57) (82) (1) (8) - (147)Currency translation difference (4) - - - (2) (6)Acquisition cost at 31 Dec. 1 014 140 457 678 104 2 392Accumulated depreciation at 1 Jan. 670 21 227 290 73 1 281Year's depreciation and write-downs 87 32 30 135 7 291Disposals (56) (32) - (1) - (89)Currency translation difference (1) - - - (2) (3)Depreciated at 31 Dec. 701 20 258 424 78 1 481Carrying amount at 31 Dec. 313 120 199 254 27 913* Goodwill in connection with acquisition of new companies, and goodwill in company financial statements.
Straight-line depreciation plan 3-7 years 3-7 years 20-50 years 3-10 years 5-10 years
Annual rental of off balance sheet business assets 14 404 418
Duration of rental of business assets 1-5 years 1-5 years 1-15 years
Tekst
Specification of goodwill in connection with acquisitions:Business unit Acquisition Depreciation Acquisition Accumulated Carrying Year's
date period cost* depreciation* amount* depreciationCar Dealers Norway 2016 10 years 4 1 3 1Car Dealers Sweden 2014 10 years 28 12 16 3
2011 10 years 32 25 7 3Car Dealers Sweden 2008 10 years 40 40 - -Total goodwill in connection with acquisitions 104 78 26 7* Incl. currency translation difference
Note 7 - Investments in other shares and units
Note 8 - Pensions
2018 2017Interest cost of pension liabilities 1 3Year's pension costs for funded and unfunded pensions 1 3Defined-contribution pension 109 107Defined-benefit pension not calculated by an actuary 48 46Total pension costs 158 157
Carrying amount pension obligations calculated by an actuary Calculated pension liabilities at 1 Jan. 2018 (54) (51)Actuarial gains and/or losses are charged to equity (2) -The year's pension costs (1) (3)The year's pension payments 2 2Currency translation difference 2 (2)Pension liabilities (53) (54)
Number of people covered by all pension plans 3 467 3 500
Financial assumptions Sweden NorwayReturn on pension assets - 0,0 %Discount rate 2,3 % 2,6 %Annual salary growth / annual G adjustment 2,0 % 0,0 %
The actuarial assumptions relating to demographic factors are the normal assumptions used by the insurance industry, adapted to the Group's age structure and retirement. All pension liabilities include the employers' National Insurance contribution.
Note 9 - Stock
2018 2017New cars 1 883 1 373Used cars and demonstration cars 1 419 1 688Parts and equipment 263 264Other stock 64 10Total stock 3 629 3 335
Note 10 - Accounts receivable
2018 2017Accounts receivable 1 319 1 345Provisions for bad debt (8) (11)Accounts receivable Aars Group 2 11Total accounts receivable 1 313 1 345
Note 11 - Other receivables
2018 2017Loans to employees 9 13Other long term receivables 1 - Total non-current receivables 10 13
2018 2017Advances to suppliers 6 9Loans to employees 12 16Net VAT credit 4 3Other prepaid expenses 66 101Accrued income 246 181Other current receivables 151 202Total current receivables 486 513
Note 12 - Bank depositsThe Group has bank deposits totalling NOK 261 million. There are no restricted funds to cover tax owed. Tax deductions are secured bya bank guarantee (see note 16).
Note 13 - Share capital and shareholder information
Shareholders in Møller Mobility Group AS at 31 Dec. 2018 Number StakeA shares:Jan H. Møller 103 0,375 %B shares:Jan H. Møller 1 0,004 %Aars AS 24 778 90,102 %Møller MI AS 2 618 9,520 %Total 27 500 100,00 %
The share capital consists of 27,500 shares with a nominal value of NOK 1,734, in total NOK 48 million. There are two classes of share. All shares have equal voting rights. Aars AS votes for 98.112 % of the shares, 8.01 % is indirectly through Møller MI AS. Class A shares are guaranteed an annual dividendof NOK 5 million, collected from Møller Mobility Group AS and Møller Eiendom Holding AS.
Note 14 - Other current liabilities
2018 2017Provision for warranties and other liabilities 851 699Accrued costs and prepaid income 510 485Holiday pay and accrued salary 354 349Advances from customers 251 146Total other current liabilities 1 966 1 678
Note 15 - Related parties
Company Company relationship Transaction type 2018 2017Volkswagen Møller Bilfinans AS Associated company Sale of cars 3 572 4 227Total sales 3 572 4 227
Volkswagen Møller Bilfinans AS Associated company Purchase of cars 1 439 1 587Møller Eiendom Associated group Rent costs 219 187Total purchases 1 658 1 774
Volkswagen Møller Bilfinans AS Associated company Balances at 31 December 49 150Infocare AS Sister Balances at 31 December 24 -Aars AS Parent Balances at 31 December 249 183
Note 16 - Pledges, guarantees and commitments
2018 2017Fixtures 47 45Accounts receivable and stock 879 458Total carrying amount of assets with encumbrances 926 503
Guarantees 2018 2017Repurchase agreements for cars 8 073 7 063Vehicle import duty, Customs Region Oslo and Akershus 135 135Withholding tax 119 115Employees 7 8
Note 17 - Share capital
2018 Majority Minorities TotalEquity at 1 Jan. 2018 3 169 56 3 225Change in accounting principles regarding associated company (note 4) (13) - (13)Profit/(loss) for the year 677 12 689Annual dividend* (578) (10) (588)Group contributions (22) - (22)Pension Sweden (2) - (2)Currency translation differences this year, etc. (5) 3 (2)Equity at 31 Dec. 2018 3 225 61 3 286* Includes an additional dividend of NOK 300 million
Accumulated translation differences at 31 December 2018 amounted to NOK 100 million.
2017 Majority Minorities TotalEquity at 1 Jan. 2017 2 880 53 2 934Profit/(loss) for the year 852 9 861Annual dividend* (578) (6) (584)Group contributions (22) - (22)Currency translation differences this year, etc. 36 - 36Equity at 31 Dec. 2017 3 169 56 3 225* Includes an additional dividend of NOK 400 million
Note 18 - Debt, financing and financial risk
2018 2017Overdraft* 9 64Total current interest-bearing liabilities 9 64
Bond issue 800 800Arrangement costs (1) (3)Total bond issue 799 797Other long-term interest-bearing liabilities 17 17Total non-current interest-bearing liabilities 816 815
MaturityDue in less than 2 years 409 464Due in 2-5 years 416 415Total 825 879
Key figuresUnused committed credit facilities 1 100 1 168* Overdraft outside the cashpool
Car Imports Car Dealers
Car Imports Car Dealers
Car Dealers Baltics
At 31 December 2018 the CEO and board members own 0.34% and 0.44% stakes, respectively, in Møller MI AS. Møller MI AS is an investment company where senior executives have the opportunity to invest. The CEO is the CEO of Møller Mobility Group AS and is employed and paid by the parent company. Bonus schemes have been established here where the size of the payment depends on the results achieved for the year, combined with other qualitative assessment criteria, and where the bonus is considered to be part of the normal remuneration for this type of position. Two executives are entitled to two years' salary in the event of major reorganisations.
Some subsidiaries in Møller Mobility Group have a number of minor equity investments with holdings of 20-35%, such as repair and lacquer workshops and the tyre hotel. These are not treated as associated companies since they have limited value and small profits. At 31 December 2018 these investments had a total carrying amount of NOK 3 million.
The Norwegian and Swedish companies in the Group have secured collective pension agreements. The companies in the three Baltic states do not have pension plans. In Norway we have an ongoing defined-contribution scheme. The defined-contribution plan is charged as a cost on an ongoing basis in the financial statements as the Group pays an amount of savings to the insurance company based on the individual employee's salary. The scheme has been adapted to comply with the new Act on occupational pensions, and the threshold between the lower and the higher savings rate is 7.1 x the National Insurance basic amount ("G"). In addition to saving for a retirement pension, disability pension and surviving children's pension are also covered. These payments do not have a paid-up policy element, meaning there is no future liability related to disability and children's pensions beyond the current premium payments.
The Group is a member of the contractual early retirement scheme (the "AFP" scheme) through the Norwegian Federation of Trade Unions (LO) and the Confederation of Norwegian Enterprise (NHO). The AFP scheme provides a life-long supplement to the standard pension. Employees can choose to start drawing on the AFP pension scheme from the age of 62. The pension scheme is a defined-benefit, multi-employer pension plan funded by premiums that are determined as a percentage of the individual's salary. There is no reliable measurement and allocation of liabilities and assets in the scheme. Therefore, in the financial statements the scheme is treated as a defined-contribution pension scheme where the premium payments are charged as a cost on an ongoing basis and no provisions are made in the financial statements.
Our Swedish companies have pension plans in accordance with a collective agreement. The scheme in Sweden is a combination of defined-benefit and defined-contribution plans based on job category, age and income. The defined-benefit plan is partially financed by means of premium payments, while the rest is financed through the accumulation of pension liabilities in the balance sheet. The pension liabilities related to the part of the scheme that is not insured are calculated by an actuary. These liabilities will be reduced in line with the ongoing pension payments. All future pension savings are now insured, but these amounts are not calculated by an actuary, as the scheme is such that assets and liabilities are not allocated directly to the individual company in the collective pension fund. Møller Mobility Group bases its accounting of defined-benefit pensions on IAS 19 (see the note on accounting policies). This entails that the year's actuarial gains and/or losses are charged to equity.
Møller Mobility Group AS has a committed credit facility totalling NOK 1,000 million. Subsidiaries that comprise more than 80% of the gross turnover and equity in the Group are guarantors. At 31 December 2018 no withdrawals had been made from this facility. In addition, Møller Mobility Group also has an overdraft facility of NOK 100 million, which is secured through joint and several liability (cashpool). At 31 December 2018 no withdrawals had been made from this facility either.
The guarantees for employees concern shareholders in Møller MI AS who have loans in Nordea that amounted to NOK 7 million at 31 December 2018. The guarantee is secured by collateral in shares. The Group companies included in the joint registration of VAT have joint and several liability for any debt. At 31 December 2018 Møller Mobility Group AS owes NOK 365 million in VAT, via the joint registration registered in Aars AS.
In 2014 the Group's companies in Latvia were imposed a corporate fine totalling EUR 7 million because of alleged price-fixing. Møller Mobility Group strongly disagrees with the grounds for the fine and holds that the fine is disproportionate and discriminatory in relation to the alleged violations. The case has been brought before the Latvian courts, and the Administrative Regional Court pronounced its judgment in October 2018. Two of the companies have been fully acquitted, representing EUR 5.2 million of the fines, while two of the companies have been found partially guilty, but to a less serious degree than in the original ruling. The Norwegian Competition Authority has appealed this judgment to the Supreme Court of Latvia. The Supreme Court may choose at its own discretion whether to hear this case or reject it. No provisions have been made for this in the financial statements for 2018.
LIABILITIESCurrent liabilitiesMøller Mobility Group has a committed credit facility of NOK 1,000 million that runs to 2021. The credit facilities are not secured, but all significant companies in Møller Mobility Group are jointly and severally liable for the liabilities. Møller Mobility Group AS is the registered borrower. At 31 December 2018 no withdrawals had been made from this facility. There are requirements (covenants) concerning financial key figures in the contract, linked to equity and cash flow, which are fulfilled at the end of the year. These liabilities are classified as current liabilities since all withdrawals from the facility will be of a short-term nature. For further information, see note 16.
Non-current liabilitiesMøller Mobility Group has long-term financing through two bond issues of together NOK 1,000 million, of which NOK 200 million is owned by the company itself. These bonds will mature in November 2019 and March 2022. The bond issue is not secured, but is coordinated with the syndicated bank loan in terms of joint and several liability within the Group, and has the same equity ratio requirements. Other long-term interest-bearing liabilities are deposits from employees.
FINANCIAL RISKThe Group has companies involved in selling, financing and servicing cars. The Group's activities involve financial risk associated with currency, rates, credit and liquidity. The Group manages risk with the objective of ensuring predictable cash flows and sufficient liquidity to meet natural fluctuations in working capital.
Currency riskThe Group sells products in local currency. In Norway, the Group is exposed to short-term currency risk relating to imports of products in EUR. Car manufacturers bear significant long-term currency risk through agreements. Short-term currency risk is hedged in the spot and forwards market. The forward contracts are market-assessed (mark-to-market) and the value is recorded as foreign exchange gains at year-end. Unrealised exchange losses of NOK 2.5 million were recognised in the income statement at year-end.
In addition the Group has currency risk associated with the Swedish and Baltic companies. The risks are mitigated by having local external liabilities in the local currency. Møller Mobility Group does not generally hedge equity in foreign companies, but does strive to secure the expected dividend with a horizon of one year. Møller Mobility Group's total secured amount at year-end was SEK 60 million and EUR 6 million.Unrealised exchange losses amounted to NOK 3.7 million at year-end.
Interest rate riskMøller Mobility Group is largely financed through a long-term bond issue with a floating interest rate. This entails a risk related to developments in interest costs. This risk is partially hedged by a portion of the debt being swapped to fixed interest rates through interest rate swaps. At 31 December 2018 the Group had interest rate swap agreements of NOK 400 million with a fixed interest rate of 2.2% and a remaining term matching the underlying loans. The interest swap agreements hedge 50% of the interest costs related to the bond issue at year-end. The date for determining the liquid element in the hedging contract is adapted according to the rollover of the underlying loans. The agreements were signed with a view to running until maturity. In light of this, Møller Mobility Group has chosen to record the agreements as hedge agreements, which means that ongoing changes in market value are not recorded in the income statement. At the balance sheet date, the market value of the contract was positive in the amount of NOK 2.2 million.
Credit riskA significant part of the Group's turnover is cash-based. There will be a temporary credit risk associated with sales by importer companies to external dealers and in cases where cars or workshop services are sold on credit. The risks are hedged with tight credit procedures and close monitoring of accounts receivable. Historically, losses have been low. At 31 December 2018, NOK 8 million has been allocated for losses on claims and actual losses in 2018 were NOK 6 million.
Liquidity riskThe Group operates in a cyclical industry with relatively large fluctuations in working capital. There is therefore a risk associated with short-term access to liquidity. This is
The amortization period for goodwill that is strategic investments is normally amortized over 10 years. These are investments where Møller Mobility Group has a long-term perspective and which is within the Group's core business. Other items are amortized over 5 years. Intangible assets of NOK 276 million relate to software and development costs for IT systems.
*The main rule is that uniform accounting principles are used for similar transactions and events, to provide the most accurate information about the investor’s overall operations. Volkswagen Møller Bilfinans switched to IFRS on 1 January 2018. It is not practicable to restate the entire financial statements such that they are in accordance with the Norwegian Accounting Act and generally accepted accounting policies. We have therefore chosen to apply different principles, in accordance with Norwegian accounting standard NRS (F) Investments in associates and joint ventures (June 2018), section 3.8. The main difference in the accounting policies at 31 December 2018 relates to provisions for losses in the leasing portfolio (IFRS 9). The conversion effect in Volkswagen Møller Bilfinans amounts to NOK -13 million in the opening balance equity, and this effect has been charged directly to equity in Møller Mobility Group on the same basis as a change in accounting policy.
** Equity and profit as of 31.12.17.

49 CSR report 2018MMG AS Finances 2018Group Finances 2018 Annual report 2018
NOTES TO THE CONSOLIDATED FINANCIAL STATEMENTS
All figures are in NOK millions.
Note 1 - Segment information
The business consists of the following business areas: Car Imports (Norway and Baltics), Car Dealers (Norway, Sweden and Baltics) and Car Finance (Norway).
The business areas report the following key figures:2018
Car Imports Car Dealers Car Finance Other companies Eliminations Group
Operating revenue 14 918 20 154 - 330 (9 229) 26 173Operating profit/(loss) 659 284 - (176) (5) 762Depreciation and write-downs 37 118 - 134 2 291Income from investments in associated companies - - 127 (1) - 126EBITDA 696 401 127 (42) (2) 1 180Other financial results (1) (35) - 27 - (8)Profit/(loss) before tax 658 249 127 (149) (5) 880
Assets 3 577 4 779 632 4 895 (5 711) 8 172
Norway Baltics Oslo West-Norway Mid-Norway Sweden BalticsOperating revenue 12 304 2 614 5 637 4 485 3 496 3 890 2 588EBITDA 664 33 86 137 62 95 59Profit/(loss) before tax 629 29 51 93 36 71 46Assets 2 907 670 1 237 1 023 891 632 718
2017
Car Imports Car Dealers Car Finance Other companies Eliminations Group
Operating revenue 16 247 21 784 - 318 (10 076) 28 273Operating profit/(loss) 858 391 - (126) (85) 1 038Depreciation and write-downs 22 123 - 87 2 234Income from investments in associated companies - - 117 - - 117EBITDA 881 514 117 (39) (83) 1 389Other financial results (4) (29) - (1) - (34)Profit/(loss) before tax 854 362 117 (127) (85) 1 121
Assets 3 094 5 028 518 3 880 (4 471) 8 050
Norway Baltics Oslo West-Norway Mid-Norway Sweden BalticsOperating revenue 14 070 2 177 6 550 5 003 3 683 4 158 2 332EBITDA 831 50 163 151 94 124 52Profit/(loss) before tax 806 48 122 106 71 100 41Assets 2 777 317 1 465 1 087 902 707 535
Note 2 - Payroll and other personnel costs
2018 2017Salaries 2 229 2 197Employer's NI contributions 352 345Pension costs 158 157Other personnel costs 90 114Total payroll and other personnel costs 2 829 2 812
Average number of employees 4 303 4 296Loans to employees 20 29
2018 2017Salaries, bonuses, pension costs and other remuneration for the CEO 8 7Board fees 2 2Total remuneration of senior executives 10 9
Loans to employees are mainly interest-bearing car loans where the companies have security in a car. The interest rate on these loans is 2.1%. In the event of sale, liquidation or other reorganisation, general managers in the Group are entitled to salary for one year, under certain terms.
2018 2017Audit fees and audit-related services 4 4Tax, fees and other consultancy services - 1Total auditor's fees (excl. VAT) 4 5
Note 3 - Other operating costs
2018 2017Operating costs (rent, electricity, maintenance, car costs, etc.) 965 949Sales costs (advertising, warranties, etc.) 714 758Administration costs (IT services, fees, travel expenses, gifts, bad debts) 236 257Total other operating costs 1 914 1 964
Note 4 - Investments in associated companies
Voting Equity Carrying Internal Additions Share of profit Carryingrights/ in company amount profit disposals after tax amount
Company name stake 31.12.18 01.01.18 2018 31.12.18Volkswagen Møller Bilfinans AS * 49,00 % 3 006 888 14 183 127 1 212UIP Holding AS** 20,55 % 16 - - 75 (1) 74Total 888 14 259 126 1 287
Investments in associated companies are incorporated in accordance with the equity method.
Note 5 - Other financial income and financial costs
2018 2017Interest income 5 5Currency gains 93 34Other financial income 2 2Total other financial income 100 40
Interest costs 22 23Currency losses 75 42Other financial costs 10 10Total other financial costs 107 75
Note 6 - Tangible fixed assets, intangible assets and goodwill
Machinery and Vehicles Buildings Intangible Goodwill* Totalfixtures assets
Acquisition cost at 1 Jan. 988 136 422 566 106 2 218Additions 87 85 36 119 - 327Disposals (57) (82) (1) (8) - (147)Currency translation difference (4) - - - (2) (6)Acquisition cost at 31 Dec. 1 014 140 457 678 104 2 392Accumulated depreciation at 1 Jan. 670 21 227 290 73 1 281Year's depreciation and write-downs 87 32 30 135 7 291Disposals (56) (32) - (1) - (89)Currency translation difference (1) - - - (2) (3)Depreciated at 31 Dec. 701 20 258 424 78 1 481Carrying amount at 31 Dec. 313 120 199 254 27 913* Goodwill in connection with acquisition of new companies, and goodwill in company financial statements.
Straight-line depreciation plan 3-7 years 3-7 years 20-50 years 3-10 years 5-10 years
Annual rental of off balance sheet business assets 14 404 418
Duration of rental of business assets 1-5 years 1-5 years 1-15 years
Tekst
Specification of goodwill in connection with acquisitions:Business unit Acquisition Depreciation Acquisition Accumulated Carrying Year's
date period cost* depreciation* amount* depreciationCar Dealers Norway 2016 10 years 4 1 3 1Car Dealers Sweden 2014 10 years 28 12 16 3
2011 10 years 32 25 7 3Car Dealers Sweden 2008 10 years 40 40 - -Total goodwill in connection with acquisitions 104 78 26 7* Incl. currency translation difference
Note 7 - Investments in other shares and units
Note 8 - Pensions
2018 2017Interest cost of pension liabilities 1 3Year's pension costs for funded and unfunded pensions 1 3Defined-contribution pension 109 107Defined-benefit pension not calculated by an actuary 48 46Total pension costs 158 157
Carrying amount pension obligations calculated by an actuary Calculated pension liabilities at 1 Jan. 2018 (54) (51)Actuarial gains and/or losses are charged to equity (2) -The year's pension costs (1) (3)The year's pension payments 2 2Currency translation difference 2 (2)Pension liabilities (53) (54)
Number of people covered by all pension plans 3 467 3 500
Financial assumptions Sweden NorwayReturn on pension assets - 0,0 %Discount rate 2,3 % 2,6 %Annual salary growth / annual G adjustment 2,0 % 0,0 %
The actuarial assumptions relating to demographic factors are the normal assumptions used by the insurance industry, adapted to the Group's age structure and retirement. All pension liabilities include the employers' National Insurance contribution.
Note 9 - Stock
2018 2017New cars 1 883 1 373Used cars and demonstration cars 1 419 1 688Parts and equipment 263 264Other stock 64 10Total stock 3 629 3 335
Note 10 - Accounts receivable
2018 2017Accounts receivable 1 319 1 345Provisions for bad debt (8) (11)Accounts receivable Aars Group 2 11Total accounts receivable 1 313 1 345
Note 11 - Other receivables
2018 2017Loans to employees 9 13Other long term receivables 1 - Total non-current receivables 10 13
2018 2017Advances to suppliers 6 9Loans to employees 12 16Net VAT credit 4 3Other prepaid expenses 66 101Accrued income 246 181Other current receivables 151 202Total current receivables 486 513
Note 12 - Bank depositsThe Group has bank deposits totalling NOK 261 million. There are no restricted funds to cover tax owed. Tax deductions are secured bya bank guarantee (see note 16).
Note 13 - Share capital and shareholder information
Shareholders in Møller Mobility Group AS at 31 Dec. 2018 Number StakeA shares:Jan H. Møller 103 0,375 %B shares:Jan H. Møller 1 0,004 %Aars AS 24 778 90,102 %Møller MI AS 2 618 9,520 %Total 27 500 100,00 %
The share capital consists of 27,500 shares with a nominal value of NOK 1,734, in total NOK 48 million. There are two classes of share. All shares have equal voting rights. Aars AS votes for 98.112 % of the shares, 8.01 % is indirectly through Møller MI AS. Class A shares are guaranteed an annual dividendof NOK 5 million, collected from Møller Mobility Group AS and Møller Eiendom Holding AS.
Note 14 - Other current liabilities
2018 2017Provision for warranties and other liabilities 851 699Accrued costs and prepaid income 510 485Holiday pay and accrued salary 354 349Advances from customers 251 146Total other current liabilities 1 966 1 678
Note 15 - Related parties
Company Company relationship Transaction type 2018 2017Volkswagen Møller Bilfinans AS Associated company Sale of cars 3 572 4 227Total sales 3 572 4 227
Volkswagen Møller Bilfinans AS Associated company Purchase of cars 1 439 1 587Møller Eiendom Associated group Rent costs 219 187Total purchases 1 658 1 774
Volkswagen Møller Bilfinans AS Associated company Balances at 31 December 49 150Infocare AS Sister Balances at 31 December 24 -Aars AS Parent Balances at 31 December 249 183
Note 16 - Pledges, guarantees and commitments
2018 2017Fixtures 47 45Accounts receivable and stock 879 458Total carrying amount of assets with encumbrances 926 503
Guarantees 2018 2017Repurchase agreements for cars 8 073 7 063Vehicle import duty, Customs Region Oslo and Akershus 135 135Withholding tax 119 115Employees 7 8
Note 17 - Share capital
2018 Majority Minorities TotalEquity at 1 Jan. 2018 3 169 56 3 225Change in accounting principles regarding associated company (note 4) (13) - (13)Profit/(loss) for the year 677 12 689Annual dividend* (578) (10) (588)Group contributions (22) - (22)Pension Sweden (2) - (2)Currency translation differences this year, etc. (5) 3 (2)Equity at 31 Dec. 2018 3 225 61 3 286* Includes an additional dividend of NOK 300 million
Accumulated translation differences at 31 December 2018 amounted to NOK 100 million.
2017 Majority Minorities TotalEquity at 1 Jan. 2017 2 880 53 2 934Profit/(loss) for the year 852 9 861Annual dividend* (578) (6) (584)Group contributions (22) - (22)Currency translation differences this year, etc. 36 - 36Equity at 31 Dec. 2017 3 169 56 3 225* Includes an additional dividend of NOK 400 million
Note 18 - Debt, financing and financial risk
2018 2017Overdraft* 9 64Total current interest-bearing liabilities 9 64
Bond issue 800 800Arrangement costs (1) (3)Total bond issue 799 797Other long-term interest-bearing liabilities 17 17Total non-current interest-bearing liabilities 816 815
MaturityDue in less than 2 years 409 464Due in 2-5 years 416 415Total 825 879
Key figuresUnused committed credit facilities 1 100 1 168* Overdraft outside the cashpool
Car Imports Car Dealers
Car Imports Car Dealers
Car Dealers Baltics
At 31 December 2018 the CEO and board members own 0.34% and 0.44% stakes, respectively, in Møller MI AS. Møller MI AS is an investment company where senior executives have the opportunity to invest. The CEO is the CEO of Møller Mobility Group AS and is employed and paid by the parent company. Bonus schemes have been established here where the size of the payment depends on the results achieved for the year, combined with other qualitative assessment criteria, and where the bonus is considered to be part of the normal remuneration for this type of position. Two executives are entitled to two years' salary in the event of major reorganisations.
Some subsidiaries in Møller Mobility Group have a number of minor equity investments with holdings of 20-35%, such as repair and lacquer workshops and the tyre hotel. These are not treated as associated companies since they have limited value and small profits. At 31 December 2018 these investments had a total carrying amount of NOK 3 million.
The Norwegian and Swedish companies in the Group have secured collective pension agreements. The companies in the three Baltic states do not have pension plans. In Norway we have an ongoing defined-contribution scheme. The defined-contribution plan is charged as a cost on an ongoing basis in the financial statements as the Group pays an amount of savings to the insurance company based on the individual employee's salary. The scheme has been adapted to comply with the new Act on occupational pensions, and the threshold between the lower and the higher savings rate is 7.1 x the National Insurance basic amount ("G"). In addition to saving for a retirement pension, disability pension and surviving children's pension are also covered. These payments do not have a paid-up policy element, meaning there is no future liability related to disability and children's pensions beyond the current premium payments.
The Group is a member of the contractual early retirement scheme (the "AFP" scheme) through the Norwegian Federation of Trade Unions (LO) and the Confederation of Norwegian Enterprise (NHO). The AFP scheme provides a life-long supplement to the standard pension. Employees can choose to start drawing on the AFP pension scheme from the age of 62. The pension scheme is a defined-benefit, multi-employer pension plan funded by premiums that are determined as a percentage of the individual's salary. There is no reliable measurement and allocation of liabilities and assets in the scheme. Therefore, in the financial statements the scheme is treated as a defined-contribution pension scheme where the premium payments are charged as a cost on an ongoing basis and no provisions are made in the financial statements.
Our Swedish companies have pension plans in accordance with a collective agreement. The scheme in Sweden is a combination of defined-benefit and defined-contribution plans based on job category, age and income. The defined-benefit plan is partially financed by means of premium payments, while the rest is financed through the accumulation of pension liabilities in the balance sheet. The pension liabilities related to the part of the scheme that is not insured are calculated by an actuary. These liabilities will be reduced in line with the ongoing pension payments. All future pension savings are now insured, but these amounts are not calculated by an actuary, as the scheme is such that assets and liabilities are not allocated directly to the individual company in the collective pension fund. Møller Mobility Group bases its accounting of defined-benefit pensions on IAS 19 (see the note on accounting policies). This entails that the year's actuarial gains and/or losses are charged to equity.
Møller Mobility Group AS has a committed credit facility totalling NOK 1,000 million. Subsidiaries that comprise more than 80% of the gross turnover and equity in the Group are guarantors. At 31 December 2018 no withdrawals had been made from this facility. In addition, Møller Mobility Group also has an overdraft facility of NOK 100 million, which is secured through joint and several liability (cashpool). At 31 December 2018 no withdrawals had been made from this facility either.
The guarantees for employees concern shareholders in Møller MI AS who have loans in Nordea that amounted to NOK 7 million at 31 December 2018. The guarantee is secured by collateral in shares. The Group companies included in the joint registration of VAT have joint and several liability for any debt. At 31 December 2018 Møller Mobility Group AS owes NOK 365 million in VAT, via the joint registration registered in Aars AS.
In 2014 the Group's companies in Latvia were imposed a corporate fine totalling EUR 7 million because of alleged price-fixing. Møller Mobility Group strongly disagrees with the grounds for the fine and holds that the fine is disproportionate and discriminatory in relation to the alleged violations. The case has been brought before the Latvian courts, and the Administrative Regional Court pronounced its judgment in October 2018. Two of the companies have been fully acquitted, representing EUR 5.2 million of the fines, while two of the companies have been found partially guilty, but to a less serious degree than in the original ruling. The Norwegian Competition Authority has appealed this judgment to the Supreme Court of Latvia. The Supreme Court may choose at its own discretion whether to hear this case or reject it. No provisions have been made for this in the financial statements for 2018.
LIABILITIESCurrent liabilitiesMøller Mobility Group has a committed credit facility of NOK 1,000 million that runs to 2021. The credit facilities are not secured, but all significant companies in Møller Mobility Group are jointly and severally liable for the liabilities. Møller Mobility Group AS is the registered borrower. At 31 December 2018 no withdrawals had been made from this facility. There are requirements (covenants) concerning financial key figures in the contract, linked to equity and cash flow, which are fulfilled at the end of the year. These liabilities are classified as current liabilities since all withdrawals from the facility will be of a short-term nature. For further information, see note 16.
Non-current liabilitiesMøller Mobility Group has long-term financing through two bond issues of together NOK 1,000 million, of which NOK 200 million is owned by the company itself. These bonds will mature in November 2019 and March 2022. The bond issue is not secured, but is coordinated with the syndicated bank loan in terms of joint and several liability within the Group, and has the same equity ratio requirements. Other long-term interest-bearing liabilities are deposits from employees.
FINANCIAL RISKThe Group has companies involved in selling, financing and servicing cars. The Group's activities involve financial risk associated with currency, rates, credit and liquidity. The Group manages risk with the objective of ensuring predictable cash flows and sufficient liquidity to meet natural fluctuations in working capital.
Currency riskThe Group sells products in local currency. In Norway, the Group is exposed to short-term currency risk relating to imports of products in EUR. Car manufacturers bear significant long-term currency risk through agreements. Short-term currency risk is hedged in the spot and forwards market. The forward contracts are market-assessed (mark-to-market) and the value is recorded as foreign exchange gains at year-end. Unrealised exchange losses of NOK 2.5 million were recognised in the income statement at year-end.
In addition the Group has currency risk associated with the Swedish and Baltic companies. The risks are mitigated by having local external liabilities in the local currency. Møller Mobility Group does not generally hedge equity in foreign companies, but does strive to secure the expected dividend with a horizon of one year. Møller Mobility Group's total secured amount at year-end was SEK 60 million and EUR 6 million.Unrealised exchange losses amounted to NOK 3.7 million at year-end.
Interest rate riskMøller Mobility Group is largely financed through a long-term bond issue with a floating interest rate. This entails a risk related to developments in interest costs. This risk is partially hedged by a portion of the debt being swapped to fixed interest rates through interest rate swaps. At 31 December 2018 the Group had interest rate swap agreements of NOK 400 million with a fixed interest rate of 2.2% and a remaining term matching the underlying loans. The interest swap agreements hedge 50% of the interest costs related to the bond issue at year-end. The date for determining the liquid element in the hedging contract is adapted according to the rollover of the underlying loans. The agreements were signed with a view to running until maturity. In light of this, Møller Mobility Group has chosen to record the agreements as hedge agreements, which means that ongoing changes in market value are not recorded in the income statement. At the balance sheet date, the market value of the contract was positive in the amount of NOK 2.2 million.
Credit riskA significant part of the Group's turnover is cash-based. There will be a temporary credit risk associated with sales by importer companies to external dealers and in cases where cars or workshop services are sold on credit. The risks are hedged with tight credit procedures and close monitoring of accounts receivable. Historically, losses have been low. At 31 December 2018, NOK 8 million has been allocated for losses on claims and actual losses in 2018 were NOK 6 million.
Liquidity riskThe Group operates in a cyclical industry with relatively large fluctuations in working capital. There is therefore a risk associated with short-term access to liquidity. This is
The amortization period for goodwill that is strategic investments is normally amortized over 10 years. These are investments where Møller Mobility Group has a long-term perspective and which is within the Group's core business. Other items are amortized over 5 years. Intangible assets of NOK 276 million relate to software and development costs for IT systems.
*The main rule is that uniform accounting principles are used for similar transactions and events, to provide the most accurate information about the investor’s overall operations. Volkswagen Møller Bilfinans switched to IFRS on 1 January 2018. It is not practicable to restate the entire financial statements such that they are in accordance with the Norwegian Accounting Act and generally accepted accounting policies. We have therefore chosen to apply different principles, in accordance with Norwegian accounting standard NRS (F) Investments in associates and joint ventures (June 2018), section 3.8. The main difference in the accounting policies at 31 December 2018 relates to provisions for losses in the leasing portfolio (IFRS 9). The conversion effect in Volkswagen Møller Bilfinans amounts to NOK -13 million in the opening balance equity, and this effect has been charged directly to equity in Møller Mobility Group on the same basis as a change in accounting policy.
** Equity and profit as of 31.12.17.
Note 19 - Taxes
Taxes in the income statement 2018 2017
Profit before tax 880 1 121
Tax payable in Norway 171 232Tax payable abroad 13 29Tax on paid group contributions 7 7Total tax payable 191 267
Change in deferred tax (12) (17)Effect of change in tax rate in Norway from 23% to 22% 12 10Tax cost 191 260Profit for the year 689 861
Effective tax rate 21,7 % 23,2 %
23% of the profit before tax (24% in 2017) 202 269Actual tax cost 191 260Deviation tax cost 11 9The deviation comprises:Permanent differences (including tax-free gains and dividends) 2 3Profits in associated companies (29) (28)Loss/gain on sales of shares 2 -Amortisation goodwill / excess value buildings 1 2Foreign companies (lower tax rate) (2) 5Effect of changed tax rate in Norway 12 10Shortfall / excess calculated tax in previous years 3 - Total (11) (9)
Tax on balance sheet
The calculation of deferred tax takes into account the following temporary differences: 2018 2017Accounts receivable and other receivables 3 6Stock 275 276Tangible fixed assets (52) (74)Current and non-current liabilities 879 739Pensions 23 16Latent dividend tax – Estonia (95) (61)Total deferred tax 1 033 903
Norway 23% 267 240Sweden 22% (22) (18)Lithuania and Latvia 15% 2 1Estonia 20% (19) (13)Net deferred tax 228 210
Deferred tax asset on balance sheet 271 243Deferred tax liability on balance sheet (43) (33)Carrying amount net deferred tax 228 210Deferred tax is included on the balance sheet as net within the various tax groups.
Change in deferred tax on the balance sheet is arrived at as follows:Deferred tax at 1 Jan. 210 214Additions / disposals acquired / sold companies - 1Deferred tax linked to internal profits in AC during the year* 9 (13)Year's recognised change in deferred tax - 7Tax paid on dividends from Estonia 8 2Currency translation differences 1 -Net deferred tax at 31 Dec. 228 210* Deferred tax linked to internal profits in AC (associated companies) is recognised on the balance sheet as part of the investment.
The tax payable on the balance sheet is arrived at as follows:Tax payable on the income statement 191 267Prepaid tax abroad (22) (23)Tax on paid group contributions (7) (7)Tax payable owed 162 238
Note 20 - Significant transactions in the financial year Transactions in 2018Møller Mobility Group has acquired a 20.55 % stake in UIP Holding AS. This is classified as an associated company in the consolidated financial statement.
Transactions in 2017Møller Mobility Group has not had any significant transactions in 2017.
Liquidity riskThe Group operates in a cyclical industry with relatively large fluctuations in working capital. There is therefore a risk associated with short-term access to liquidity. This is hedged by having flexible and committed framework financing of NOK 1,000 million where withdrawals are regulated according to need.
Buy back agreementsThe Group has risk associated with buy back agreements. Total buy back agreement liabilities were NOK 8 billion at 31 December 2018. The risk is associated with future market prices for used cars. The risk is hedged through certain procedures for entering contracts and returning cars. A continuous assessment of the liabilities is conducted, and provisions are made for any anticipated losses.
The income tax rates in Norway, Sweden and Lithuania in 2018 were 23%, 22% and 15%, respectively. From 2019, the tax rate in Norway will be 22%. Estonia and Latvia does not have income tax, they have dividend tax. Latent tax has been allocated for dividends.

50 CSR report 2018MMG AS Finances 2018Group Finances 2018 Annual report 2018
Note 19 - Taxes
Taxes in the income statement 2018 2017
Profit before tax 880 1 121
Tax payable in Norway 171 232Tax payable abroad 13 29Tax on paid group contributions 7 7Total tax payable 191 267
Change in deferred tax (12) (17)Effect of change in tax rate in Norway from 23% to 22% 12 10Tax cost 191 260Profit for the year 689 861
Effective tax rate 21,7 % 23,2 %
23% of the profit before tax (24% in 2017) 202 269Actual tax cost 191 260Deviation tax cost 11 9The deviation comprises:Permanent differences (including tax-free gains and dividends) 2 3Profits in associated companies (29) (28)Loss/gain on sales of shares 2 -Amortisation goodwill / excess value buildings 1 2Foreign companies (lower tax rate) (2) 5Effect of changed tax rate in Norway 12 10Shortfall / excess calculated tax in previous years 3 - Total (11) (9)
Tax on balance sheet
The calculation of deferred tax takes into account the following temporary differences: 2018 2017Accounts receivable and other receivables 3 6Stock 275 276Tangible fixed assets (52) (74)Current and non-current liabilities 879 739Pensions 23 16Latent dividend tax – Estonia (95) (61)Total deferred tax 1 033 903
Norway 23% 267 240Sweden 22% (22) (18)Lithuania and Latvia 15% 2 1Estonia 20% (19) (13)Net deferred tax 228 210
Deferred tax asset on balance sheet 271 243Deferred tax liability on balance sheet (43) (33)Carrying amount net deferred tax 228 210Deferred tax is included on the balance sheet as net within the various tax groups.
Change in deferred tax on the balance sheet is arrived at as follows:Deferred tax at 1 Jan. 210 214Additions / disposals acquired / sold companies - 1Deferred tax linked to internal profits in AC during the year* 9 (13)Year's recognised change in deferred tax - 7Tax paid on dividends from Estonia 8 2Currency translation differences 1 -Net deferred tax at 31 Dec. 228 210* Deferred tax linked to internal profits in AC (associated companies) is recognised on the balance sheet as part of the investment.
The tax payable on the balance sheet is arrived at as follows:Tax payable on the income statement 191 267Prepaid tax abroad (22) (23)Tax on paid group contributions (7) (7)Tax payable owed 162 238
Note 20 - Significant transactions in the financial year Transactions in 2018Møller Mobility Group has acquired a 20.55 % stake in UIP Holding AS. This is classified as an associated company in the consolidated financial statement.
Transactions in 2017Møller Mobility Group has not had any significant transactions in 2017.
Liquidity riskThe Group operates in a cyclical industry with relatively large fluctuations in working capital. There is therefore a risk associated with short-term access to liquidity. This is hedged by having flexible and committed framework financing of NOK 1,000 million where withdrawals are regulated according to need.
Buy back agreementsThe Group has risk associated with buy back agreements. Total buy back agreement liabilities were NOK 8 billion at 31 December 2018. The risk is associated with future market prices for used cars. The risk is hedged through certain procedures for entering contracts and returning cars. A continuous assessment of the liabilities is conducted, and provisions are made for any anticipated losses.
The income tax rates in Norway, Sweden and Lithuania in 2018 were 23%, 22% and 15%, respectively. From 2019, the tax rate in Norway will be 22%. Estonia and Latvia does not have income tax, they have dividend tax. Latent tax has been allocated for dividends.

51 CSR report 2018MMG AS Finances 2018Group Finances 2018 Annual report 2018
Note 19 - Taxes
Taxes in the income statement 2018 2017
Profit before tax 880 1 121
Tax payable in Norway 171 232Tax payable abroad 13 29Tax on paid group contributions 7 7Total tax payable 191 267
Change in deferred tax (12) (17)Effect of change in tax rate in Norway from 23% to 22% 12 10Tax cost 191 260Profit for the year 689 861
Effective tax rate 21,7 % 23,2 %
23% of the profit before tax (24% in 2017) 202 269Actual tax cost 191 260Deviation tax cost 11 9The deviation comprises:Permanent differences (including tax-free gains and dividends) 2 3Profits in associated companies (29) (28)Loss/gain on sales of shares 2 -Amortisation goodwill / excess value buildings 1 2Foreign companies (lower tax rate) (2) 5Effect of changed tax rate in Norway 12 10Shortfall / excess calculated tax in previous years 3 - Total (11) (9)
Tax on balance sheet
The calculation of deferred tax takes into account the following temporary differences: 2018 2017Accounts receivable and other receivables 3 6Stock 275 276Tangible fixed assets (52) (74)Current and non-current liabilities 879 739Pensions 23 16Latent dividend tax – Estonia (95) (61)Total deferred tax 1 033 903
Norway 23% 267 240Sweden 22% (22) (18)Lithuania and Latvia 15% 2 1Estonia 20% (19) (13)Net deferred tax 228 210
Deferred tax asset on balance sheet 271 243Deferred tax liability on balance sheet (43) (33)Carrying amount net deferred tax 228 210Deferred tax is included on the balance sheet as net within the various tax groups.
Change in deferred tax on the balance sheet is arrived at as follows:Deferred tax at 1 Jan. 210 214Additions / disposals acquired / sold companies - 1Deferred tax linked to internal profits in AC during the year* 9 (13)Year's recognised change in deferred tax - 7Tax paid on dividends from Estonia 8 2Currency translation differences 1 -Net deferred tax at 31 Dec. 228 210* Deferred tax linked to internal profits in AC (associated companies) is recognised on the balance sheet as part of the investment.
The tax payable on the balance sheet is arrived at as follows:Tax payable on the income statement 191 267Prepaid tax abroad (22) (23)Tax on paid group contributions (7) (7)Tax payable owed 162 238
Note 20 - Significant transactions in the financial year Transactions in 2018Møller Mobility Group has acquired a 20.55 % stake in UIP Holding AS. This is classified as an associated company in the consolidated financial statement.
Transactions in 2017Møller Mobility Group has not had any significant transactions in 2017.
Liquidity riskThe Group operates in a cyclical industry with relatively large fluctuations in working capital. There is therefore a risk associated with short-term access to liquidity. This is hedged by having flexible and committed framework financing of NOK 1,000 million where withdrawals are regulated according to need.
Buy back agreementsThe Group has risk associated with buy back agreements. Total buy back agreement liabilities were NOK 8 billion at 31 December 2018. The risk is associated with future market prices for used cars. The risk is hedged through certain procedures for entering contracts and returning cars. A continuous assessment of the liabilities is conducted, and provisions are made for any anticipated losses.
The income tax rates in Norway, Sweden and Lithuania in 2018 were 23%, 22% and 15%, respectively. From 2019, the tax rate in Norway will be 22%. Estonia and Latvia does not have income tax, they have dividend tax. Latent tax has been allocated for dividends.

52 CSR report 2018MMG AS Finances 2018Group Finances 2018 Annual report 2018
Income statementINCOME STATEMENT MØLLER MOBILITY GROUP AS
(Amounts in NOK millions) Note 2018 2017OPERATING REVENUEOther operating revenue 1 143 36Total operating revenue 143 36
OPERATING COSTSPayroll and other personnel costs 2 67 77Depreciation and write-downs 5 6 5Other operating costs 34 38Total operating costs 107 120OPERATING PROFIT 36 (85)
FINANCIAL ITEMSIncome from investments in subsidiaries 3 1 386 828Interest income from group companies 43 31Other financial income 4 86 30Interest costs from group companies (6) (3)Other financial costs 4 (86) (56)Total financial items 1 423 831
PROFIT BEFORE TAX 1 459 746
Taxes 15 169 156NET PROFIT 1 290 589
Proposed allocations in Møller Mobility Group AS:Group contributions after tax (22) (22)Dividends (278) (178)Transferred to/(from) other equity (990) (389)Allocated (1 290) (589)
Additional dividends decided before AGM date (300) (400)From other equity 300 400
ASSETS MØLLER MOBILITY GROUP AS AT 31 DEC.
(Amounts in NOK millions) Note 2018 2017ASSETSIntangible assets 5 11 11Total intangible assets 11 11
Tangible fixed assets 5 33 30
Investments in subsidiaries 6 569 598Investments in associated companies 7 915 644Investments in shares 1 1Group receivables 9 1 996 1 331Other receivables 5 5Total financial fixed assets 3 486 2 579
TOTAL FIXED ASSETS 3 529 2 620
Other receivables 9 7Group receivables 9 1 295 752Total receivables 1 304 760
Cash and cash equivalents 11 228 703
TOTAL CURRENT ASSETS 1 532 1 462
TOTAL ASSETS 5 061 4 083
EQUITY AND LIABILITIES MØLLER MOBILITY GROUP AS AT 31 DEC
(Amounts in NOK millions) Note 2018 2017EQUITYShare capital 48 48Other paid-in equity 1 1Other equity 2 573 1 884TOTAL EQUITY 13 2 622 1 933
LIABILITIESPension liabilities 8 1 2Total provisions for liabilities 1 2
Bond loans 799 797Liabilities to group companies 9 1 053 907Other non-current liabilities 17 17Total non-current liabilities 1 869 1 721
Liabilities to financial institutions - - Accounts payable 3 5Tax payable 15 147 141Public duties payable 4 3Dividends and group contributions 9 307 207Other current liabilities 32 29Liabilities to group companies 9 76 42Total current liabilities 568 426
TOTAL LIABILITIES 2 439 2 150
TOTAL EQUITY AND LIABILITIES 5 061 4 083
CASH FLOW STATEMENT MØLLER MOBILITY GROUP AS
(Amounts in NOK millions) 2018 2017CASH FLOW FROM OPERATIONSOrdinary profit before tax 1 459 746Recognised dividends / group contributions 3 (1 386) (828)Gains from sale of fixed assets / companies (112) 1Depreciation 5 6 5Taxes paid during the period (141) (205)Change in accounts receivable and payables (2) 1Change in intra-group receivables / liabilities (580) 759Change in other items 2 -Net cash flow from operations (754) 478
CASH FLOW FROM INVESTMENTSInvestment in tangible fixed assets (15) (19)Sales of tangible fixed assets 6 8Investments in subsidiaries 199 (11)Capital contributions in AC shares (196) (74)Received dividends / group contributions 908 986Net cash flow from investments 823 892
CASH FLOW FROM FINANCINGGroup contributions paid (67) (17)Annual dividend (178) (158)Additional dividends (300) (400)Payment / repayment of private long-term borrowings - 1New / repayment of long-term debt 1 (100)Net cash flow from financing (544) (673)
Net change in cash and cash equivalents during year (475) 696Cash reserve at 1 Jan. 703 0Cash reserve at 31 Dec. 228 696
Specification of cash reserve at 31 Dec.Means of payment 11 228 703Cash reserve at 31 Dec. 228 703
....................................Øyvind Schage FørdeChairman of the Board
....................................Jacob SchramBoard member
...........................................Harald Møller
Board member
..........................................Kristin Solheim Genton
Board member
....................................Jon Morten Møller
Board member
....................................Cathrine Klouman
Board member
...................................Terje Male
CEO
Oslo, 24 April 2019The Board of Directors of Møller Mobility Group AS

53 CSR report 2018MMG AS Finances 2018Group Finances 2018 Annual report 2018
Assets
INCOME STATEMENT MØLLER MOBILITY GROUP AS
(Amounts in NOK millions) Note 2018 2017OPERATING REVENUEOther operating revenue 1 143 36Total operating revenue 143 36
OPERATING COSTSPayroll and other personnel costs 2 67 77Depreciation and write-downs 5 6 5Other operating costs 34 38Total operating costs 107 120OPERATING PROFIT 36 (85)
FINANCIAL ITEMSIncome from investments in subsidiaries 3 1 386 828Interest income from group companies 43 31Other financial income 4 86 30Interest costs from group companies (6) (3)Other financial costs 4 (86) (56)Total financial items 1 423 831
PROFIT BEFORE TAX 1 459 746
Taxes 15 169 156NET PROFIT 1 290 589
Proposed allocations in Møller Mobility Group AS:Group contributions after tax (22) (22)Dividends (278) (178)Transferred to/(from) other equity (990) (389)Allocated (1 290) (589)
Additional dividends decided before AGM date (300) (400)From other equity 300 400
ASSETS MØLLER MOBILITY GROUP AS AT 31 DEC.
(Amounts in NOK millions) Note 2018 2017ASSETSIntangible assets 5 11 11Total intangible assets 11 11
Tangible fixed assets 5 33 30
Investments in subsidiaries 6 569 598Investments in associated companies 7 915 644Investments in shares 1 1Group receivables 9 1 996 1 331Other receivables 5 5Total financial fixed assets 3 486 2 579
TOTAL FIXED ASSETS 3 529 2 620
Other receivables 9 7Group receivables 9 1 295 752Total receivables 1 304 760
Cash and cash equivalents 11 228 703
TOTAL CURRENT ASSETS 1 532 1 462
TOTAL ASSETS 5 061 4 083
EQUITY AND LIABILITIES MØLLER MOBILITY GROUP AS AT 31 DEC
(Amounts in NOK millions) Note 2018 2017EQUITYShare capital 48 48Other paid-in equity 1 1Other equity 2 573 1 884TOTAL EQUITY 13 2 622 1 933
LIABILITIESPension liabilities 8 1 2Total provisions for liabilities 1 2
Bond loans 799 797Liabilities to group companies 9 1 053 907Other non-current liabilities 17 17Total non-current liabilities 1 869 1 721
Liabilities to financial institutions - - Accounts payable 3 5Tax payable 15 147 141Public duties payable 4 3Dividends and group contributions 9 307 207Other current liabilities 32 29Liabilities to group companies 9 76 42Total current liabilities 568 426
TOTAL LIABILITIES 2 439 2 150
TOTAL EQUITY AND LIABILITIES 5 061 4 083
CASH FLOW STATEMENT MØLLER MOBILITY GROUP AS
(Amounts in NOK millions) 2018 2017CASH FLOW FROM OPERATIONSOrdinary profit before tax 1 459 746Recognised dividends / group contributions 3 (1 386) (828)Gains from sale of fixed assets / companies (112) 1Depreciation 5 6 5Taxes paid during the period (141) (205)Change in accounts receivable and payables (2) 1Change in intra-group receivables / liabilities (580) 759Change in other items 2 -Net cash flow from operations (754) 478
CASH FLOW FROM INVESTMENTSInvestment in tangible fixed assets (15) (19)Sales of tangible fixed assets 6 8Investments in subsidiaries 199 (11)Capital contributions in AC shares (196) (74)Received dividends / group contributions 908 986Net cash flow from investments 823 892
CASH FLOW FROM FINANCINGGroup contributions paid (67) (17)Annual dividend (178) (158)Additional dividends (300) (400)Payment / repayment of private long-term borrowings - 1New / repayment of long-term debt 1 (100)Net cash flow from financing (544) (673)
Net change in cash and cash equivalents during year (475) 696Cash reserve at 1 Jan. 703 0Cash reserve at 31 Dec. 228 696
Specification of cash reserve at 31 Dec.Means of payment 11 228 703Cash reserve at 31 Dec. 228 703
....................................Øyvind Schage FørdeChairman of the Board
....................................Jacob SchramBoard member
...........................................Harald Møller
Board member
..........................................Kristin Solheim Genton
Board member
....................................Jon Morten Møller
Board member
....................................Cathrine Klouman
Board member
...................................Terje Male
CEO
Oslo, 24 April 2019The Board of Directors of Møller Mobility Group AS

54 CSR report 2018MMG AS Finances 2018Group Finances 2018 Annual report 2018
Equity and liabilities The Board of Directors of Møller Mobility Group AS
Oslo, 24 April 2019
Øyvind Schage FørdeChair of the Board and Group CEO
Harald A. MøllerBoard member
Jon Morten MøllerBoard member
Jacob SchramBoard member
Kristin Solheim GentonBoard member
Cathrine KloumanBoard member
INCOME STATEMENT MØLLER MOBILITY GROUP AS
(Amounts in NOK millions) Note 2018 2017OPERATING REVENUEOther operating revenue 1 143 36Total operating revenue 143 36
OPERATING COSTSPayroll and other personnel costs 2 67 77Depreciation and write-downs 5 6 5Other operating costs 34 38Total operating costs 107 120OPERATING PROFIT 36 (85)
FINANCIAL ITEMSIncome from investments in subsidiaries 3 1 386 828Interest income from group companies 43 31Other financial income 4 86 30Interest costs from group companies (6) (3)Other financial costs 4 (86) (56)Total financial items 1 423 831
PROFIT BEFORE TAX 1 459 746
Taxes 15 169 156NET PROFIT 1 290 589
Proposed allocations in Møller Mobility Group AS:Group contributions after tax (22) (22)Dividends (278) (178)Transferred to/(from) other equity (990) (389)Allocated (1 290) (589)
Additional dividends decided before AGM date (300) (400)From other equity 300 400
ASSETS MØLLER MOBILITY GROUP AS AT 31 DEC.
(Amounts in NOK millions) Note 2018 2017ASSETSIntangible assets 5 11 11Total intangible assets 11 11
Tangible fixed assets 5 33 30
Investments in subsidiaries 6 569 598Investments in associated companies 7 915 644Investments in shares 1 1Group receivables 9 1 996 1 331Other receivables 5 5Total financial fixed assets 3 486 2 579
TOTAL FIXED ASSETS 3 529 2 620
Other receivables 9 7Group receivables 9 1 295 752Total receivables 1 304 760
Cash and cash equivalents 11 228 703
TOTAL CURRENT ASSETS 1 532 1 462
TOTAL ASSETS 5 061 4 083
EQUITY AND LIABILITIES MØLLER MOBILITY GROUP AS AT 31 DEC
(Amounts in NOK millions) Note 2018 2017EQUITYShare capital 48 48Other paid-in equity 1 1Other equity 2 573 1 884TOTAL EQUITY 13 2 622 1 933
LIABILITIESPension liabilities 8 1 2Total provisions for liabilities 1 2
Bond loans 799 797Liabilities to group companies 9 1 053 907Other non-current liabilities 17 17Total non-current liabilities 1 869 1 721
Liabilities to financial institutions - - Accounts payable 3 5Tax payable 15 147 141Public duties payable 4 3Dividends and group contributions 9 307 207Other current liabilities 32 29Liabilities to group companies 9 76 42Total current liabilities 568 426
TOTAL LIABILITIES 2 439 2 150
TOTAL EQUITY AND LIABILITIES 5 061 4 083
CASH FLOW STATEMENT MØLLER MOBILITY GROUP AS
(Amounts in NOK millions) 2018 2017CASH FLOW FROM OPERATIONSOrdinary profit before tax 1 459 746Recognised dividends / group contributions 3 (1 386) (828)Gains from sale of fixed assets / companies (112) 1Depreciation 5 6 5Taxes paid during the period (141) (205)Change in accounts receivable and payables (2) 1Change in intra-group receivables / liabilities (580) 759Change in other items 2 -Net cash flow from operations (754) 478
CASH FLOW FROM INVESTMENTSInvestment in tangible fixed assets (15) (19)Sales of tangible fixed assets 6 8Investments in subsidiaries 199 (11)Capital contributions in AC shares (196) (74)Received dividends / group contributions 908 986Net cash flow from investments 823 892
CASH FLOW FROM FINANCINGGroup contributions paid (67) (17)Annual dividend (178) (158)Additional dividends (300) (400)Payment / repayment of private long-term borrowings - 1New / repayment of long-term debt 1 (100)Net cash flow from financing (544) (673)
Net change in cash and cash equivalents during year (475) 696Cash reserve at 1 Jan. 703 0Cash reserve at 31 Dec. 228 696
Specification of cash reserve at 31 Dec.Means of payment 11 228 703Cash reserve at 31 Dec. 228 703
....................................Øyvind Schage FørdeChairman of the Board
....................................Jacob SchramBoard member
...........................................Harald Møller
Board member
..........................................Kristin Solheim Genton
Board member
....................................Jon Morten Møller
Board member
....................................Cathrine Klouman
Board member
...................................Terje Male
CEO
Oslo, 24 April 2019The Board of Directors of Møller Mobility Group AS

55 CSR report 2018MMG AS Finances 2018Group Finances 2018 Annual report 2018
Cash flow statement
INCOME STATEMENT MØLLER MOBILITY GROUP AS
(Amounts in NOK millions) Note 2018 2017OPERATING REVENUEOther operating revenue 1 143 36Total operating revenue 143 36
OPERATING COSTSPayroll and other personnel costs 2 67 77Depreciation and write-downs 5 6 5Other operating costs 34 38Total operating costs 107 120OPERATING PROFIT 36 (85)
FINANCIAL ITEMSIncome from investments in subsidiaries 3 1 386 828Interest income from group companies 43 31Other financial income 4 86 30Interest costs from group companies (6) (3)Other financial costs 4 (86) (56)Total financial items 1 423 831
PROFIT BEFORE TAX 1 459 746
Taxes 15 169 156NET PROFIT 1 290 589
Proposed allocations in Møller Mobility Group AS:Group contributions after tax (22) (22)Dividends (278) (178)Transferred to/(from) other equity (990) (389)Allocated (1 290) (589)
Additional dividends decided before AGM date (300) (400)From other equity 300 400
ASSETS MØLLER MOBILITY GROUP AS AT 31 DEC.
(Amounts in NOK millions) Note 2018 2017ASSETSIntangible assets 5 11 11Total intangible assets 11 11
Tangible fixed assets 5 33 30
Investments in subsidiaries 6 569 598Investments in associated companies 7 915 644Investments in shares 1 1Group receivables 9 1 996 1 331Other receivables 5 5Total financial fixed assets 3 486 2 579
TOTAL FIXED ASSETS 3 529 2 620
Other receivables 9 7Group receivables 9 1 295 752Total receivables 1 304 760
Cash and cash equivalents 11 228 703
TOTAL CURRENT ASSETS 1 532 1 462
TOTAL ASSETS 5 061 4 083
EQUITY AND LIABILITIES MØLLER MOBILITY GROUP AS AT 31 DEC
(Amounts in NOK millions) Note 2018 2017EQUITYShare capital 48 48Other paid-in equity 1 1Other equity 2 573 1 884TOTAL EQUITY 13 2 622 1 933
LIABILITIESPension liabilities 8 1 2Total provisions for liabilities 1 2
Bond loans 799 797Liabilities to group companies 9 1 053 907Other non-current liabilities 17 17Total non-current liabilities 1 869 1 721
Liabilities to financial institutions - - Accounts payable 3 5Tax payable 15 147 141Public duties payable 4 3Dividends and group contributions 9 307 207Other current liabilities 32 29Liabilities to group companies 9 76 42Total current liabilities 568 426
TOTAL LIABILITIES 2 439 2 150
TOTAL EQUITY AND LIABILITIES 5 061 4 083
CASH FLOW STATEMENT MØLLER MOBILITY GROUP AS
(Amounts in NOK millions) 2018 2017CASH FLOW FROM OPERATIONSOrdinary profit before tax 1 459 746Recognised dividends / group contributions 3 (1 386) (828)Gains from sale of fixed assets / companies (112) 1Depreciation 5 6 5Taxes paid during the period (141) (205)Change in accounts receivable and payables (2) 1Change in intra-group receivables / liabilities (580) 759Change in other items 2 -Net cash flow from operations (754) 478
CASH FLOW FROM INVESTMENTSInvestment in tangible fixed assets (15) (19)Sales of tangible fixed assets 6 8Investments in subsidiaries 199 (11)Capital contributions in AC shares (196) (74)Received dividends / group contributions 908 986Net cash flow from investments 823 892
CASH FLOW FROM FINANCINGGroup contributions paid (67) (17)Annual dividend (178) (158)Additional dividends (300) (400)Payment / repayment of private long-term borrowings - 1New / repayment of long-term debt 1 (100)Net cash flow from financing (544) (673)
Net change in cash and cash equivalents during year (475) 696Cash reserve at 1 Jan. 703 0Cash reserve at 31 Dec. 228 696
Specification of cash reserve at 31 Dec.Means of payment 11 228 703Cash reserve at 31 Dec. 228 703
....................................Øyvind Schage FørdeChairman of the Board
....................................Jacob SchramBoard member
...........................................Harald Møller
Board member
..........................................Kristin Solheim Genton
Board member
....................................Jon Morten Møller
Board member
....................................Cathrine Klouman
Board member
...................................Terje Male
CEO
Oslo, 24 April 2019The Board of Directors of Møller Mobility Group AS

56 CSR report 2018MMG AS Finances 2018Group Finances 2018 Annual report 2018
NOTES MØLLER MOBILITY GROUP AS
All figures are in NOK millions.
Note 1 - Other operating revenue2018 2017
Gains from sale of group shares 112 -Other operating revenue 31 36Total other operating revenue 143 36
Note 2 - Payroll and other personnel costs
2018 2017Salaries 52 53Employer's NI contributions 8 8Pension costs 2 2Other personnel costs 5 12Total payroll and other personnel costs 67 77
Average number of employees 27 25Loans to employees 1 1
Loans to employees are mainly interest-bearing car loans where the company has security in a car. The interest rate on these loans is 2.1%. For information about the remuneration of senior executives, including the salary of the CEO of Møller Mobility Group, see note 2 to the consolidated financial statements.
Remuneration to the auditors in 2018 amounted to NOK 422,250 for auditing and NOK 43,940 for audit-related assistance. All amounts are stated exclusive of VAT
Note 3 - Income from investments in subsidiaries
2018 2017Harald A. Møller AS 681 657Møller Bil AS 606 122Møller Bil Holding AB 95 49Møller Synergi AS 3 -Total income from investments in subsidiaries 1 386 828
Note 4 - Other financial income and financial costs
2018 2017Currency gains 83 28Other financial income 3 2Total other financial income 86 30
Currency losses 61 32Other financial costs 25 24Total other financial costs 86 56
Note 5 - Tangible fixed assets and intangible assets
Tangible Intangible Totalfixed assets* assets
Acquisition cost at 1 Jan. 33 16 49Additions 13 2 15Disposals (7) - (7)Acquisition cost at 31 Dec. 38 18 56Accumulated depreciation at 1 Jan. 3 5 8Year's depreciation and write-downs 4 2 6Disposals (2) - (2)Depreciated at 31 Dec. 5 7 12Carrying amount at 31 Dec. 33 11 44
Straight line depreciation plan 3-7 years 3-10 years* Cars, fixtures and furnishings
Note 6 - Investments in subsidiaries
Business Stake/ Equity Carryingoffice voting 31.12.2018 amount
Company name rightsHarald A. Møller AS Oslo 100 % 428 509 342Møller Bil AS Oslo 100 % 89 162 109Møller IT AS Oslo 100 % 70 82 104Møller Synergi AS Oslo 100 % 4 2 9Hyre AS Oslo 100 % (6) (7) 5Total investments in subsidiaries 585 748 569* Includes dividends received / group contributions from subsidiaries totalling NOK 192 million.
The above table only shows shares owned directly by Møller Mobility Group AS. In total, the Group consists of 38 companies directly and indirectly ownedby Møller Mobility Group AS. As of 01.01.2018, Harald A. Møller AS and Møller Bil Klargjøring AS merged. The shares in Møller Bil Holding AB were sold to Møller Bil AS as of 06.08.2018.
Note 7 - Investments in associated companies
Business Voting Equity Profit/(loss) Carryingoffice rights/ in company after tax amount
Company name stake 31.12.2018 2018 31.12.2018Volkswagen Møller Bilfinans AS Oslo 49,00 % 3 006 259 840UIP Holding AS* Oslo 20,55 % 16 (18) 75Total investments in associated companies 3 022 241 915* Equity and profit as of 31.12.17.
The share of the profit/(loss) is not incorporated into the company financial statements; it is only incorporated into the consolidated financial statements of Møller Mobility Group.
Note 8 - Pensions
Pension costs 2018 2017Defined-contribution pension 2 2Pension costs 2 2
Carrying amount net pension obligations Calculated pension liabilities (1) (2)Net carrying amount pension liabilities (1) (2)
Number of people covered by all pension plans 27 27
Financial assumptionsReturn on pension assets 0,0 % 0,0 %Discount rate 2,3 % 2,3 %Annual salary growth / annual G adjustment 0,0 % 0,0 %
All pension liabilities include the employers' National Insurance contribution.
Note 9 - Balances with companies in the Aars Group
2018 2017Møller Bil Norge 1 078 975Harald A. Møller - 14Møller IT 254 204Møller Bil Sverige 146 126Moller Auto Baltic 518 12Total non-current receivables 1 996 1 331
The receivables consist of operating capital and loans to group companies (cashpool). The receivables are long-term financing of subsidiaries and have no specified repayment structure. The items must, in their entirety, be regarded as continuing for more than one year after the closure of the financial year.
2018 2017Bank deposits in subsidiaries (cashpool) 1 053 907Total non-current liabilities 1 053 907
2018 2017Receivables from group companies – dividends / group contributions 1 210 732Accounts receivable group 66 2Other receivables group 19 19 Total current receivables 1 295 752
2018 2017Group contributions 29 29Dividends 278 178Total group contributions and dividends 307 207
Group contributions to group companies 69 38Accounts payable group 7 4Total current liabilities to group companies 76 42
Note 10 - Related parties
Company Company relationship Transaction type 2018 2017All subsidiaries Subsidiary Financial income 43 31All subsidiaries Subsidiary Sale of administrative services 21 26Total sales 64 57
All subsidiaries Subsidiary Financial costs 6 3Møller Synergi AS Subsidiary Purchase of accounting services, etc. 1 1Harald A. Møller AS Subsidiary Purchase of IT, telephony, switchboard services 3 2Møller Bil AS Subsidiary Purchase of shares in subsidiaries - 11Total purchases 10 5
Note 11 - Bank deposits
Møller Mobility Group AS has bank deposits totalling NOK 228 million. The company has provided guarantees for tax owed by the subsidiaries amounting to NOK 119 million.
Note 12 - Guarantees and commitments
Guarantees and commitments 2018 2017Vehicle import duty, Customs Region Oslo and Akershus 177 135Withholding tax 119 115Employees 7 8Subsidiaries of Møller Mobility Group AS in the Baltic States - 133
The guarantees for employees concern shareholders in Møller MI AS who have loans in Nordea that amounted to NOK 7 million at 31 December 2018.The guarantee is secured by collateral in shares. Other guarantees apply to subsidiaries.
Note 13 - Share capital
Share Other paid-in Other Totalcapital equity equity
Equity at 1 Jan. 2018 48 1 1 884 1 933Group contributions paid - - (22) (22)Additional dividends - - (300) (300)Profit/(loss) for the year - - 1 290 1 290Currency hedging of equity in foreign subsidiaries - - (1) (1)Allocated to dividend - - (278) (278)Equity at 31 Dec. 2018 48 1 2 573 2 622
Share Other paid-in Other Totalcapital equity equity
Equity at 1 Jan. 2017 48 1 1 901 1 950Group contributions paid - - (22) (22)Additional dividends - - (400) (400)Profit/(loss) for the year - - 589 589Currency hedging of equity in foreign subsidiaries - - (6) (6)Allocated to dividend - - (178) (178)Equity at 31 Dec. 2017 48 1 1 884 1 933
For information about share capital and shareholder information, see note 13 to the consolidated financial statements.
Note 14 - Liabilities, financing and financial risk
Non-current liabilitiesBond loans 800 800Arrangement costs (1) (3)Total bond issue 799 797Other long-term interest-bearing liabilities 17 17Debt to other companies in Møller Mobility Group 1 053 907Total non-current interest-bearing liabilities 1 869 1 721
MaturityDue in less than 2 years 400 400Due in 2-5 years 1 469 1 321Total 1 869 1 721
Key figuresUnused committed credit facilities 1 100 1 168
Møller Mobility Group AS is Møller Mobility Group's internal bank.
Note 15 - Taxes
Taxes in the income statement 2018 2017
Profit before tax 1 459 746
Tax payable in Norway 163 150Tax on paid group contributions 6 7Total tax payable 169 157
Change in deferred tax - -Tax cost 169 157Profit for the year 1 290 589
Effective tax rate 11,6 % 21,0 %
23% of the profit before tax 336 179Actual tax cost 169 157Deviation tax cost 167 22The deviation comprises:Permanent differences (167) (22)Total (167) (22)
Tax on balance sheetThe calculation of deferred tax takes into account the following temporary differences: 2018 2017Tangible fixed assets 4 4Unrealised exchange rate losses on forward contracts (6) (5)Amortised borrowing costs 1 3Pension (1) (2)Total deferred tax (2) 0
Norway 23% - -Net deferred tax 0 0
Change in deferred tax on the balance sheet is arrived at as follows:Deferred tax at 1 Jan. - -Year's change in deferred tax - -Net deferred tax at 31 Dec. 0 0
The tax payable on the balance sheet is arrived at as follows:Tax payable on the income statement 169 156Tax on paid group contributions (22) (16)Tax payable owed (147) (141)
In 2018, income tax was 23%. This has been changed to 22% with effect from 2019.
Profit/(loss) for the year 2018
The company currently has a defined-contribution pension that has been adapted to comply with the new Act on occupational pensions. The defined-contribution pension is covered by the company through ongoing payments to an insurance company. The company has no further obligations beyond this.
The company is affiliated with the contractual early retirement scheme (the "AFP" scheme) through the Norwegian Federation of Trade Unions (LO) and the Confederation of Norwegian Enterprise (NHO). The new AFP scheme is a defined-benefit, multi-employer pension plan, and since the assets cannot be attributed to individual members, the scheme is treated as a defined-contribution pension scheme in the financial statements, and future obligations are not recognised on the balance sheet.The remaining pension liabilities in the balance sheet relate to a handful of unfunded pensions paid through operations.
Notes

57 CSR report 2018MMG AS Finances 2018Group Finances 2018 Annual report 2018
NOTES MØLLER MOBILITY GROUP AS
All figures are in NOK millions.
Note 1 - Other operating revenue2018 2017
Gains from sale of group shares 112 -Other operating revenue 31 36Total other operating revenue 143 36
Note 2 - Payroll and other personnel costs
2018 2017Salaries 52 53Employer's NI contributions 8 8Pension costs 2 2Other personnel costs 5 12Total payroll and other personnel costs 67 77
Average number of employees 27 25Loans to employees 1 1
Loans to employees are mainly interest-bearing car loans where the company has security in a car. The interest rate on these loans is 2.1%.For information about the remuneration of senior executives, including the salary of the CEO of Møller Mobility Group, see note 2 to the consolidated financial statements.
Remuneration to the auditors in 2018 amounted to NOK 422,250 for auditing and NOK 43,940 for audit-related assistance. All amounts are stated exclusive of VAT
Note 3 - Income from investments in subsidiaries
2018 2017Harald A. Møller AS 681 657Møller Bil AS 606 122Møller Bil Holding AB 95 49Møller Synergi AS 3 -Total income from investments in subsidiaries 1 386 828
Note 4 - Other financial income and financial costs
2018 2017Currency gains 83 28Other financial income 3 2Total other financial income 86 30
Currency losses 61 32Other financial costs 25 24Total other financial costs 86 56
Note 5 - Tangible fixed assets and intangible assets
Tangible Intangible Totalfixed assets* assets
Acquisition cost at 1 Jan. 33 16 49Additions 13 2 15Disposals (7) - (7)Acquisition cost at 31 Dec. 38 18 56Accumulated depreciation at 1 Jan. 3 5 8Year's depreciation and write-downs 4 2 6Disposals (2) - (2)Depreciated at 31 Dec. 5 7 12Carrying amount at 31 Dec. 33 11 44
Straight line depreciation plan 3-7 years 3-10 years* Cars, fixtures and furnishings
Note 6 - Investments in subsidiaries
Business Stake/ Equity Carryingoffice voting 31.12.2018 amount
Company name rightsHarald A. Møller AS Oslo 100% 428 509 342Møller Bil AS Oslo 100% 89 162 109Møller IT AS Oslo 100% 70 82 104Møller Synergi AS Oslo 100% 4 2 9Hyre AS Oslo 51% (6) (7) 5Total investments in subsidiaries 585 748 569* Includes dividends received / group contributions from subsidiaries totalling NOK 192 million.
The above table only shows shares owned directly by Møller Mobility Group AS. In total, the Group consists of 38 companies directly and indirectly ownedby Møller Mobility Group AS. As of 01.01.2018, Harald A. Møller AS and Møller Bil Klargjøring AS merged. The shares in Møller Bil Holding AB were sold to Møller Bil AS as of 06.08.2018.
Note 7 - Investments in associated companies
Business Voting Equity Profit/(loss) Carryingoffice rights/ in company after tax amount
Company name stake 31.12.2018 2018 31.12.2018Volkswagen Møller Bilfinans AS Oslo 49,00 % 3 006 259 840UIP Holding AS* Oslo 20,55 % 16 (18) 75Total investments in associated companies 3 022 241 915* Equity and profit as of 31.12.17.
The share of the profit/(loss) is not incorporated into the company financial statements; it is only incorporated into the consolidated financial statementsof Møller Mobility Group.
Note 8 - Pensions
Pension costs 2018 2017Defined-contribution pension 2 2Pension costs 2 2
Carrying amount net pension obligationsCalculated pension liabilities (1) (2)Net carrying amount pension liabilities (1) (2)
Number of people covered by all pension plans 27 27
Financial assumptionsReturn on pension assets 0,0 % 0,0 %Discount rate 2,3 % 2,3 %Annual salary growth / annual G adjustment 0,0 % 0,0 %
All pension liabilities include the employers' National Insurance contribution.
Note 9 - Balances with companies in the Aars Group
2018 2017Møller Bil Norge 1 078 975Harald A. Møller - 14Møller IT 254 204Møller Bil Sverige 146 126Moller Auto Baltic 518 12Total non-current receivables 1 996 1 331
The receivables consist of operating capital and loans to group companies (cashpool). The receivables are long-term financing of subsidiariesand have no specified repayment structure. The items must, in their entirety, be regarded as continuing for more than one year after the closure of the financial year.
2018 2017Bank deposits in subsidiaries (cashpool) 1 053 907Total non-current liabilities 1 053 907
2018 2017Receivables from group companies – dividends / group contributions 1 210 732Accounts receivable group 66 2Other receivables group 19 19Total current receivables 1 295 752
2018 2017Group contributions 29 29Dividends 278 178Total group contributions and dividends 307 207
Group contributions to group companies 69 38Accounts payable group 7 4Total current liabilities to group companies 76 42
Note 10 - Related parties
Company Company relationship Transaction type 2018 2017All subsidiaries Subsidiary Financial income 43 31All subsidiaries Subsidiary Sale of administrative services 21 26Total sales 64 57
All subsidiaries Subsidiary Financial costs 6 3Møller Synergi AS Subsidiary Purchase of accounting services, etc. 1 1Harald A. Møller AS Subsidiary Purchase of IT, telephony, switchboard services 3 2Møller Bil AS Subsidiary Purchase of shares in subsidiaries - 11Total purchases 10 5
Note 11 - Bank deposits
Møller Mobility Group AS has bank deposits totalling NOK 228 million. The company has provided guarantees for tax owed by the subsidiaries amounting to NOK 119 million.
Note 12 - Guarantees and commitments
Guarantees and commitments 2018 2017Vehicle import duty, Customs Region Oslo and Akershus 177 135Withholding tax 119 115Employees 7 8Subsidiaries of Møller Mobility Group AS in the Baltic States - 133
The guarantees for employees concern shareholders in Møller MI AS who have loans in Nordea that amounted to NOK 7 million at 31 December 2018.The guarantee is secured by collateral in shares. Other guarantees apply to subsidiaries.
Note 13 - Share capital
Share Other paid-in Other Totalcapital equity equity
Equity at 1 Jan. 2018 48 1 1 884 1 933Group contributions paid - - (22) (22)Additional dividends - - (300) (300)Profit/(loss) for the year - - 1 290 1 290Currency hedging of equity in foreign subsidiaries - - (1) (1)Allocated to dividend - - (278) (278)Equity at 31 Dec. 2018 48 1 2 573 2 622
Share Other paid-in Other Totalcapital equity equity
Equity at 1 Jan. 2017 48 1 1 901 1 950Group contributions paid - - (22) (22)Additional dividends - - (400) (400)Profit/(loss) for the year - - 589 589Currency hedging of equity in foreign subsidiaries - - (6) (6)Allocated to dividend - - (178) (178)Equity at 31 Dec. 2017 48 1 1 884 1 933
For information about share capital and shareholder information, see note 13 to the consolidated financial statements.
Note 14 - Liabilities, financing and financial risk
Non-current liabilitiesBond loans 800 800Arrangement costs (1) (3)Total bond issue 799 797Other long-term interest-bearing liabilities 17 17Debt to other companies in Møller Mobility Group 1 053 907Total non-current interest-bearing liabilities 1 869 1 721
MaturityDue in less than 2 years 400 400Due in 2-5 years 1 469 1 321Total 1 869 1 721
Key figuresUnused committed credit facilities 1 100 1 168
Møller Mobility Group AS is Møller Mobility Group's internal bank.
Note 15 - Taxes
Taxes in the income statement2018 2017
Profit before tax 1 459 746
Tax payable in Norway 163 150Tax on paid group contributions 6 7Total tax payable 169 157
Change in deferred tax - -Tax cost 169 157Profit for the year 1 290 589
Effective tax rate 11,6 % 21,0 %
23% of the profit before tax 336 179Actual tax cost 169 157Deviation tax cost 167 22The deviation comprises:Permanent differences (167) (22)Total (167) (22)
Tax on balance sheetThe calculation of deferred tax takes into account the following temporary differences: 2018 2017Tangible fixed assets 4 4Unrealised exchange rate losses on forward contracts (6) (5)Amortised borrowing costs 1 3Pension (1) (2)Total deferred tax (2) 0
Norway 23% - -Net deferred tax 0 0
Change in deferred tax on the balance sheet is arrived at as follows:Deferred tax at 1 Jan. - -Year's change in deferred tax - -Net deferred tax at 31 Dec. 0 0
The tax payable on the balance sheet is arrived at as follows:Tax payable on the income statement 169 156Tax on paid group contributions (22) (16)Tax payable owed (147) (141)
In 2018, income tax was 23%. This has been changed to 22% with effect from 2019.
Profit/(loss) for the year 2018
The company currently has a defined-contribution pension thathas been adapted to comply with the new Act on occupational pensions.The defined-contribution pension iscovered by the company through ongoing payments to an insurance company.The company has no further obligations beyond this.
The company is affiliated with the contractual early retirement scheme (the "AFP" scheme) through the Norwegian Federation of Trade Unions (LO) and the Confederation of Norwegian Enterprise (NHO).The new AFP scheme is a defined-benefit,multi-employer pension plan,and since the assets cannot be attributed to individual members,the scheme is treated as a defined-contribution pension scheme in the financial statements, and future obligations are not recognised on the balance sheet.The remaining pension liabilities in the balance sheet relate to a handful of unfunded pensions paid through operations.

58 CSR report 2018MMG AS Finances 2018Group Finances 2018 Annual report 2018
NOTES MØLLER MOBILITY GROUP AS
All figures are in NOK millions.
Note 1 - Other operating revenue2018 2017
Gains from sale of group shares 112 -Other operating revenue 31 36Total other operating revenue 143 36
Note 2 - Payroll and other personnel costs
2018 2017Salaries 52 53Employer's NI contributions 8 8Pension costs 2 2Other personnel costs 5 12Total payroll and other personnel costs 67 77
Average number of employees 27 25Loans to employees 1 1
Loans to employees are mainly interest-bearing car loans where the company has security in a car. The interest rate on these loans is 2.1%. For information about the remuneration of senior executives, including the salary of the CEO of Møller Mobility Group, see note 2 to the consolidated financial statements.
Remuneration to the auditors in 2018 amounted to NOK 422,250 for auditing and NOK 43,940 for audit-related assistance. All amounts are stated exclusive of VAT
Note 3 - Income from investments in subsidiaries
2018 2017Harald A. Møller AS 681 657Møller Bil AS 606 122Møller Bil Holding AB 95 49Møller Synergi AS 3 -Total income from investments in subsidiaries 1 386 828
Note 4 - Other financial income and financial costs
2018 2017Currency gains 83 28Other financial income 3 2Total other financial income 86 30
Currency losses 61 32Other financial costs 25 24Total other financial costs 86 56
Note 5 - Tangible fixed assets and intangible assets
Tangible Intangible Totalfixed assets* assets
Acquisition cost at 1 Jan. 33 16 49Additions 13 2 15Disposals (7) - (7)Acquisition cost at 31 Dec. 38 18 56Accumulated depreciation at 1 Jan. 3 5 8Year's depreciation and write-downs 4 2 6Disposals (2) - (2)Depreciated at 31 Dec. 5 7 12Carrying amount at 31 Dec. 33 11 44
Straight line depreciation plan 3-7 years 3-10 years* Cars, fixtures and furnishings
Note 6 - Investments in subsidiaries
Business Stake/ Equity Carryingoffice voting 31.12.2018 amount
Company name rightsHarald A. Møller AS Oslo 100 % 428 509 342Møller Bil AS Oslo 100 % 89 162 109Møller IT AS Oslo 100 % 70 82 104Møller Synergi AS Oslo 100 % 4 2 9Hyre AS Oslo 100 % (6) (7) 5Total investments in subsidiaries 585 748 569* Includes dividends received / group contributions from subsidiaries totalling NOK 192 million.
The above table only shows shares owned directly by Møller Mobility Group AS. In total, the Group consists of 38 companies directly and indirectly ownedby Møller Mobility Group AS. As of 01.01.2018, Harald A. Møller AS and Møller Bil Klargjøring AS merged. The shares in Møller Bil Holding AB were sold to Møller Bil AS as of 06.08.2018.
Note 7 - Investments in associated companies
Business Voting Equity Profit/(loss) Carryingoffice rights/ in company after tax amount
Company name stake 31.12.2018 2018 31.12.2018Volkswagen Møller Bilfinans AS Oslo 49,00 % 3 006 259 840UIP Holding AS* Oslo 20,55 % 16 (18) 75Total investments in associated companies 3 022 241 915* Equity and profit as of 31.12.17.
The share of the profit/(loss) is not incorporated into the company financial statements; it is only incorporated into the consolidated financial statements of Møller Mobility Group.
Note 8 - Pensions
Pension costs 2018 2017Defined-contribution pension 2 2Pension costs 2 2
Carrying amount net pension obligations Calculated pension liabilities (1) (2)Net carrying amount pension liabilities (1) (2)
Number of people covered by all pension plans 27 27
Financial assumptionsReturn on pension assets 0,0 % 0,0 %Discount rate 2,3 % 2,3 %Annual salary growth / annual G adjustment 0,0 % 0,0 %
All pension liabilities include the employers' National Insurance contribution.
Note 9 - Balances with companies in the Aars Group
2018 2017Møller Bil Norge 1 078 975Harald A. Møller - 14Møller IT 254 204Møller Bil Sverige 146 126Moller Auto Baltic 518 12Total non-current receivables 1 996 1 331
The receivables consist of operating capital and loans to group companies (cashpool). The receivables are long-term financing of subsidiaries and have no specified repayment structure. The items must, in their entirety, be regarded as continuing for more than one year after the closure of the financial year.
2018 2017Bank deposits in subsidiaries (cashpool) 1 053 907Total non-current liabilities 1 053 907
2018 2017Receivables from group companies – dividends / group contributions 1 210 732Accounts receivable group 66 2Other receivables group 19 19 Total current receivables 1 295 752
2018 2017Group contributions 29 29Dividends 278 178Total group contributions and dividends 307 207
Group contributions to group companies 69 38Accounts payable group 7 4Total current liabilities to group companies 76 42
Note 10 - Related parties
Company Company relationship Transaction type 2018 2017All subsidiaries Subsidiary Financial income 43 31All subsidiaries Subsidiary Sale of administrative services 21 26Total sales 64 57
All subsidiaries Subsidiary Financial costs 6 3Møller Synergi AS Subsidiary Purchase of accounting services, etc. 1 1Harald A. Møller AS Subsidiary Purchase of IT, telephony, switchboard services 3 2Møller Bil AS Subsidiary Purchase of shares in subsidiaries - 11Total purchases 10 5
Note 11 - Bank deposits
Møller Mobility Group AS has bank deposits totalling NOK 228 million. The company has provided guarantees for tax owed by the subsidiaries amounting to NOK 119 million.
Note 12 - Guarantees and commitments
Guarantees and commitments 2018 2017Vehicle import duty, Customs Region Oslo and Akershus 177 135Withholding tax 119 115Employees 7 8Subsidiaries of Møller Mobility Group AS in the Baltic States - 133
The guarantees for employees concern shareholders in Møller MI AS who have loans in Nordea that amounted to NOK 7 million at 31 December 2018.The guarantee is secured by collateral in shares. Other guarantees apply to subsidiaries.
Note 13 - Share capital
Share Other paid-in Other Totalcapital equity equity
Equity at 1 Jan. 2018 48 1 1 884 1 933Group contributions paid - - (22) (22)Additional dividends - - (300) (300)Profit/(loss) for the year - - 1 290 1 290Currency hedging of equity in foreign subsidiaries - - (1) (1)Allocated to dividend - - (278) (278)Equity at 31 Dec. 2018 48 1 2 573 2 622
Share Other paid-in Other Totalcapital equity equity
Equity at 1 Jan. 2017 48 1 1 901 1 950Group contributions paid - - (22) (22)Additional dividends - - (400) (400)Profit/(loss) for the year - - 589 589Currency hedging of equity in foreign subsidiaries - - (6) (6)Allocated to dividend - - (178) (178)Equity at 31 Dec. 2017 48 1 1 884 1 933
For information about share capital and shareholder information, see note 13 to the consolidated financial statements.
Note 14 - Liabilities, financing and financial risk
Non-current liabilitiesBond loans 800 800Arrangement costs (1) (3)Total bond issue 799 797Other long-term interest-bearing liabilities 17 17Debt to other companies in Møller Mobility Group 1 053 907Total non-current interest-bearing liabilities 1 869 1 721
MaturityDue in less than 2 years 400 400Due in 2-5 years 1 469 1 321Total 1 869 1 721
Key figuresUnused committed credit facilities 1 100 1 168
Møller Mobility Group AS is Møller Mobility Group's internal bank.
Note 15 - Taxes
Taxes in the income statement 2018 2017
Profit before tax 1 459 746
Tax payable in Norway 163 150Tax on paid group contributions 6 7Total tax payable 169 157
Change in deferred tax - -Tax cost 169 157Profit for the year 1 290 589
Effective tax rate 11,6 % 21,0 %
23% of the profit before tax 336 179Actual tax cost 169 157Deviation tax cost 167 22The deviation comprises:Permanent differences (167) (22)Total (167) (22)
Tax on balance sheetThe calculation of deferred tax takes into account the following temporary differences: 2018 2017Tangible fixed assets 4 4Unrealised exchange rate losses on forward contracts (6) (5)Amortised borrowing costs 1 3Pension (1) (2)Total deferred tax (2) 0
Norway 23% - -Net deferred tax 0 0
Change in deferred tax on the balance sheet is arrived at as follows:Deferred tax at 1 Jan. - -Year's change in deferred tax - -Net deferred tax at 31 Dec. 0 0
The tax payable on the balance sheet is arrived at as follows:Tax payable on the income statement 169 156Tax on paid group contributions (22) (16)Tax payable owed (147) (141)
In 2018, income tax was 23%. This has been changed to 22% with effect from 2019.
Profit/(loss) for the year 2018
The company currently has a defined-contribution pension that has been adapted to comply with the new Act on occupational pensions. The defined-contribution pension is covered by the company through ongoing payments to an insurance company. The company has no further obligations beyond this.
The company is affiliated with the contractual early retirement scheme (the "AFP" scheme) through the Norwegian Federation of Trade Unions (LO) and the Confederation of Norwegian Enterprise (NHO). The new AFP scheme is a defined-benefit, multi-employer pension plan, and since the assets cannot be attributed to individual members, the scheme is treated as a defined-contribution pension scheme in the financial statements, and future obligations are not recognised on the balance sheet.The remaining pension liabilities in the balance sheet relate to a handful of unfunded pensions paid through operations.

59 CSR report 2018MMG AS Finances 2018Group Finances 2018 Annual report 2018
NOTES MØLLER MOBILITY GROUP AS
All figures are in NOK millions.
Note 1 - Other operating revenue2018 2017
Gains from sale of group shares 112 -Other operating revenue 31 36Total other operating revenue 143 36
Note 2 - Payroll and other personnel costs
2018 2017Salaries 52 53Employer's NI contributions 8 8Pension costs 2 2Other personnel costs 5 12Total payroll and other personnel costs 67 77
Average number of employees 27 25Loans to employees 1 1
Loans to employees are mainly interest-bearing car loans where the company has security in a car. The interest rate on these loans is 2.1%. For information about the remuneration of senior executives, including the salary of the CEO of Møller Mobility Group, see note 2 to the consolidated financial statements.
Remuneration to the auditors in 2018 amounted to NOK 422,250 for auditing and NOK 43,940 for audit-related assistance. All amounts are stated exclusive of VAT
Note 3 - Income from investments in subsidiaries
2018 2017Harald A. Møller AS 681 657Møller Bil AS 606 122Møller Bil Holding AB 95 49Møller Synergi AS 3 -Total income from investments in subsidiaries 1 386 828
Note 4 - Other financial income and financial costs
2018 2017Currency gains 83 28Other financial income 3 2Total other financial income 86 30
Currency losses 61 32Other financial costs 25 24Total other financial costs 86 56
Note 5 - Tangible fixed assets and intangible assets
Tangible Intangible Totalfixed assets* assets
Acquisition cost at 1 Jan. 33 16 49Additions 13 2 15Disposals (7) - (7)Acquisition cost at 31 Dec. 38 18 56Accumulated depreciation at 1 Jan. 3 5 8Year's depreciation and write-downs 4 2 6Disposals (2) - (2)Depreciated at 31 Dec. 5 7 12Carrying amount at 31 Dec. 33 11 44
Straight line depreciation plan 3-7 years 3-10 years* Cars, fixtures and furnishings
Note 6 - Investments in subsidiaries
Business Stake/ Equity Carryingoffice voting 31.12.2018 amount
Company name rightsHarald A. Møller AS Oslo 100 % 428 509 342Møller Bil AS Oslo 100 % 89 162 109Møller IT AS Oslo 100 % 70 82 104Møller Synergi AS Oslo 100 % 4 2 9Hyre AS Oslo 100 % (6) (7) 5Total investments in subsidiaries 585 748 569* Includes dividends received / group contributions from subsidiaries totalling NOK 192 million.
The above table only shows shares owned directly by Møller Mobility Group AS. In total, the Group consists of 38 companies directly and indirectly ownedby Møller Mobility Group AS. As of 01.01.2018, Harald A. Møller AS and Møller Bil Klargjøring AS merged. The shares in Møller Bil Holding AB were sold to Møller Bil AS as of 06.08.2018.
Note 7 - Investments in associated companies
Business Voting Equity Profit/(loss) Carryingoffice rights/ in company after tax amount
Company name stake 31.12.2018 2018 31.12.2018Volkswagen Møller Bilfinans AS Oslo 49,00 % 3 006 259 840UIP Holding AS* Oslo 20,55 % 16 (18) 75Total investments in associated companies 3 022 241 915* Equity and profit as of 31.12.17.
The share of the profit/(loss) is not incorporated into the company financial statements; it is only incorporated into the consolidated financial statements of Møller Mobility Group.
Note 8 - Pensions
Pension costs 2018 2017Defined-contribution pension 2 2Pension costs 2 2
Carrying amount net pension obligations Calculated pension liabilities (1) (2)Net carrying amount pension liabilities (1) (2)
Number of people covered by all pension plans 27 27
Financial assumptionsReturn on pension assets 0,0 % 0,0 %Discount rate 2,3 % 2,3 %Annual salary growth / annual G adjustment 0,0 % 0,0 %
All pension liabilities include the employers' National Insurance contribution.
Note 9 - Balances with companies in the Aars Group
2018 2017Møller Bil Norge 1 078 975Harald A. Møller - 14Møller IT 254 204Møller Bil Sverige 146 126Moller Auto Baltic 518 12Total non-current receivables 1 996 1 331
The receivables consist of operating capital and loans to group companies (cashpool). The receivables are long-term financing of subsidiaries and have no specified repayment structure. The items must, in their entirety, be regarded as continuing for more than one year after the closure of the financial year.
2018 2017Bank deposits in subsidiaries (cashpool) 1 053 907Total non-current liabilities 1 053 907
2018 2017Receivables from group companies – dividends / group contributions 1 210 732Accounts receivable group 66 2Other receivables group 19 19 Total current receivables 1 295 752
2018 2017Group contributions 29 29Dividends 278 178Total group contributions and dividends 307 207
Group contributions to group companies 69 38Accounts payable group 7 4Total current liabilities to group companies 76 42
Note 10 - Related parties
Company Company relationship Transaction type 2018 2017All subsidiaries Subsidiary Financial income 43 31All subsidiaries Subsidiary Sale of administrative services 21 26Total sales 64 57
All subsidiaries Subsidiary Financial costs 6 3Møller Synergi AS Subsidiary Purchase of accounting services, etc. 1 1Harald A. Møller AS Subsidiary Purchase of IT, telephony, switchboard services 3 2Møller Bil AS Subsidiary Purchase of shares in subsidiaries - 11Total purchases 10 5
Note 11 - Bank deposits
Møller Mobility Group AS has bank deposits totalling NOK 228 million. The company has provided guarantees for tax owed by the subsidiaries amounting to NOK 119 million.
Note 12 - Guarantees and commitments
Guarantees and commitments 2018 2017Vehicle import duty, Customs Region Oslo and Akershus 177 135Withholding tax 119 115Employees 7 8Subsidiaries of Møller Mobility Group AS in the Baltic States - 133
The guarantees for employees concern shareholders in Møller MI AS who have loans in Nordea that amounted to NOK 7 million at 31 December 2018.The guarantee is secured by collateral in shares. Other guarantees apply to subsidiaries.
Note 13 - Share capital
Share Other paid-in Other Totalcapital equity equity
Equity at 1 Jan. 2018 48 1 1 884 1 933Group contributions paid - - (22) (22)Additional dividends - - (300) (300)Profit/(loss) for the year - - 1 290 1 290Currency hedging of equity in foreign subsidiaries - - (1) (1)Allocated to dividend - - (278) (278)Equity at 31 Dec. 2018 48 1 2 573 2 622
Share Other paid-in Other Totalcapital equity equity
Equity at 1 Jan. 2017 48 1 1 901 1 950Group contributions paid - - (22) (22)Additional dividends - - (400) (400)Profit/(loss) for the year - - 589 589Currency hedging of equity in foreign subsidiaries - - (6) (6)Allocated to dividend - - (178) (178)Equity at 31 Dec. 2017 48 1 1 884 1 933
For information about share capital and shareholder information, see note 13 to the consolidated financial statements.
Note 14 - Liabilities, financing and financial risk
Non-current liabilitiesBond loans 800 800Arrangement costs (1) (3)Total bond issue 799 797Other long-term interest-bearing liabilities 17 17Debt to other companies in Møller Mobility Group 1 053 907Total non-current interest-bearing liabilities 1 869 1 721
MaturityDue in less than 2 years 400 400Due in 2-5 years 1 469 1 321Total 1 869 1 721
Key figuresUnused committed credit facilities 1 100 1 168
Møller Mobility Group AS is Møller Mobility Group's internal bank.
Note 15 - Taxes
Taxes in the income statement 2018 2017
Profit before tax 1 459 746
Tax payable in Norway 163 150Tax on paid group contributions 6 7Total tax payable 169 157
Change in deferred tax - -Tax cost 169 157Profit for the year 1 290 589
Effective tax rate 11,6 % 21,0 %
23% of the profit before tax 336 179Actual tax cost 169 157Deviation tax cost 167 22The deviation comprises:Permanent differences (167) (22)Total (167) (22)
Tax on balance sheetThe calculation of deferred tax takes into account the following temporary differences: 2018 2017Tangible fixed assets 4 4Unrealised exchange rate losses on forward contracts (6) (5)Amortised borrowing costs 1 3Pension (1) (2)Total deferred tax (2) 0
Norway 23% - -Net deferred tax 0 0
Change in deferred tax on the balance sheet is arrived at as follows:Deferred tax at 1 Jan. - -Year's change in deferred tax - -Net deferred tax at 31 Dec. 0 0
The tax payable on the balance sheet is arrived at as follows:Tax payable on the income statement 169 156Tax on paid group contributions (22) (16)Tax payable owed (147) (141)
In 2018, income tax was 23%. This has been changed to 22% with effect from 2019.
Profit/(loss) for the year 2018
The company currently has a defined-contribution pension that has been adapted to comply with the new Act on occupational pensions. The defined-contribution pension is covered by the company through ongoing payments to an insurance company. The company has no further obligations beyond this.
The company is affiliated with the contractual early retirement scheme (the "AFP" scheme) through the Norwegian Federation of Trade Unions (LO) and the Confederation of Norwegian Enterprise (NHO). The new AFP scheme is a defined-benefit, multi-employer pension plan, and since the assets cannot be attributed to individual members, the scheme is treated as a defined-contribution pension scheme in the financial statements, and future obligations are not recognised on the balance sheet.The remaining pension liabilities in the balance sheet relate to a handful of unfunded pensions paid through operations.

60 CSR report 2018MMG AS Finances 2018Group Finances 2018 Annual report 2018
NOTES MØLLER MOBILITY GROUP AS
All figures are in NOK millions.
Note 1 - Other operating revenue2018 2017
Gains from sale of group shares 112 -Other operating revenue 31 36Total other operating revenue 143 36
Note 2 - Payroll and other personnel costs
2018 2017Salaries 52 53Employer's NI contributions 8 8Pension costs 2 2Other personnel costs 5 12Total payroll and other personnel costs 67 77
Average number of employees 27 25Loans to employees 1 1
Loans to employees are mainly interest-bearing car loans where the company has security in a car. The interest rate on these loans is 2.1%. For information about the remuneration of senior executives, including the salary of the CEO of Møller Mobility Group, see note 2 to the consolidated financial statements.
Remuneration to the auditors in 2018 amounted to NOK 422,250 for auditing and NOK 43,940 for audit-related assistance. All amounts are stated exclusive of VAT
Note 3 - Income from investments in subsidiaries
2018 2017Harald A. Møller AS 681 657Møller Bil AS 606 122Møller Bil Holding AB 95 49Møller Synergi AS 3 -Total income from investments in subsidiaries 1 386 828
Note 4 - Other financial income and financial costs
2018 2017Currency gains 83 28Other financial income 3 2Total other financial income 86 30
Currency losses 61 32Other financial costs 25 24Total other financial costs 86 56
Note 5 - Tangible fixed assets and intangible assets
Tangible Intangible Totalfixed assets* assets
Acquisition cost at 1 Jan. 33 16 49Additions 13 2 15Disposals (7) - (7)Acquisition cost at 31 Dec. 38 18 56Accumulated depreciation at 1 Jan. 3 5 8Year's depreciation and write-downs 4 2 6Disposals (2) - (2)Depreciated at 31 Dec. 5 7 12Carrying amount at 31 Dec. 33 11 44
Straight line depreciation plan 3-7 years 3-10 years* Cars, fixtures and furnishings
Note 6 - Investments in subsidiaries
Business Stake/ Equity Carryingoffice voting 31.12.2018 amount
Company name rightsHarald A. Møller AS Oslo 100 % 428 509 342Møller Bil AS Oslo 100 % 89 162 109Møller IT AS Oslo 100 % 70 82 104Møller Synergi AS Oslo 100 % 4 2 9Hyre AS Oslo 100 % (6) (7) 5Total investments in subsidiaries 585 748 569* Includes dividends received / group contributions from subsidiaries totalling NOK 192 million.
The above table only shows shares owned directly by Møller Mobility Group AS. In total, the Group consists of 38 companies directly and indirectly ownedby Møller Mobility Group AS. As of 01.01.2018, Harald A. Møller AS and Møller Bil Klargjøring AS merged. The shares in Møller Bil Holding AB were sold to Møller Bil AS as of 06.08.2018.
Note 7 - Investments in associated companies
Business Voting Equity Profit/(loss) Carryingoffice rights/ in company after tax amount
Company name stake 31.12.2018 2018 31.12.2018Volkswagen Møller Bilfinans AS Oslo 49,00 % 3 006 259 840UIP Holding AS* Oslo 20,55 % 16 (18) 75Total investments in associated companies 3 022 241 915* Equity and profit as of 31.12.17.
The share of the profit/(loss) is not incorporated into the company financial statements; it is only incorporated into the consolidated financial statements of Møller Mobility Group.
Note 8 - Pensions
Pension costs 2018 2017Defined-contribution pension 2 2Pension costs 2 2
Carrying amount net pension obligations Calculated pension liabilities (1) (2)Net carrying amount pension liabilities (1) (2)
Number of people covered by all pension plans 27 27
Financial assumptionsReturn on pension assets 0,0 % 0,0 %Discount rate 2,3 % 2,3 %Annual salary growth / annual G adjustment 0,0 % 0,0 %
All pension liabilities include the employers' National Insurance contribution.
Note 9 - Balances with companies in the Aars Group
2018 2017Møller Bil Norge 1 078 975Harald A. Møller - 14Møller IT 254 204Møller Bil Sverige 146 126Moller Auto Baltic 518 12Total non-current receivables 1 996 1 331
The receivables consist of operating capital and loans to group companies (cashpool). The receivables are long-term financing of subsidiaries and have no specified repayment structure. The items must, in their entirety, be regarded as continuing for more than one year after the closure of the financial year.
2018 2017Bank deposits in subsidiaries (cashpool) 1 053 907Total non-current liabilities 1 053 907
2018 2017Receivables from group companies – dividends / group contributions 1 210 732Accounts receivable group 66 2Other receivables group 19 19 Total current receivables 1 295 752
2018 2017Group contributions 29 29Dividends 278 178Total group contributions and dividends 307 207
Group contributions to group companies 69 38Accounts payable group 7 4Total current liabilities to group companies 76 42
Note 10 - Related parties
Company Company relationship Transaction type 2018 2017All subsidiaries Subsidiary Financial income 43 31All subsidiaries Subsidiary Sale of administrative services 21 26Total sales 64 57
All subsidiaries Subsidiary Financial costs 6 3Møller Synergi AS Subsidiary Purchase of accounting services, etc. 1 1Harald A. Møller AS Subsidiary Purchase of IT, telephony, switchboard services 3 2Møller Bil AS Subsidiary Purchase of shares in subsidiaries - 11Total purchases 10 5
Note 11 - Bank deposits
Møller Mobility Group AS has bank deposits totalling NOK 228 million. The company has provided guarantees for tax owed by the subsidiaries amounting to NOK 119 million.
Note 12 - Guarantees and commitments
Guarantees and commitments 2018 2017Vehicle import duty, Customs Region Oslo and Akershus 177 135Withholding tax 119 115Employees 7 8Subsidiaries of Møller Mobility Group AS in the Baltic States - 133
The guarantees for employees concern shareholders in Møller MI AS who have loans in Nordea that amounted to NOK 7 million at 31 December 2018.The guarantee is secured by collateral in shares. Other guarantees apply to subsidiaries.
Note 13 - Share capital
Share Other paid-in Other Totalcapital equity equity
Equity at 1 Jan. 2018 48 1 1 884 1 933Group contributions paid - - (22) (22)Additional dividends - - (300) (300)Profit/(loss) for the year - - 1 290 1 290Currency hedging of equity in foreign subsidiaries - - (1) (1)Allocated to dividend - - (278) (278)Equity at 31 Dec. 2018 48 1 2 573 2 622
Share Other paid-in Other Totalcapital equity equity
Equity at 1 Jan. 2017 48 1 1 901 1 950Group contributions paid - - (22) (22)Additional dividends - - (400) (400)Profit/(loss) for the year - - 589 589Currency hedging of equity in foreign subsidiaries - - (6) (6)Allocated to dividend - - (178) (178)Equity at 31 Dec. 2017 48 1 1 884 1 933
For information about share capital and shareholder information, see note 13 to the consolidated financial statements.
Note 14 - Liabilities, financing and financial risk
Non-current liabilitiesBond loans 800 800Arrangement costs (1) (3)Total bond issue 799 797Other long-term interest-bearing liabilities 17 17Debt to other companies in Møller Mobility Group 1 053 907Total non-current interest-bearing liabilities 1 869 1 721
MaturityDue in less than 2 years 400 400Due in 2-5 years 1 469 1 321Total 1 869 1 721
Key figuresUnused committed credit facilities 1 100 1 168
Møller Mobility Group AS is Møller Mobility Group's internal bank.
Note 15 - Taxes
Taxes in the income statement 2018 2017
Profit before tax 1 459 746
Tax payable in Norway 163 150Tax on paid group contributions 6 7Total tax payable 169 157
Change in deferred tax - -Tax cost 169 157Profit for the year 1 290 589
Effective tax rate 11,6 % 21,0 %
23% of the profit before tax 336 179Actual tax cost 169 157Deviation tax cost 167 22The deviation comprises:Permanent differences (167) (22)Total (167) (22)
Tax on balance sheetThe calculation of deferred tax takes into account the following temporary differences: 2018 2017Tangible fixed assets 4 4Unrealised exchange rate losses on forward contracts (6) (5)Amortised borrowing costs 1 3Pension (1) (2)Total deferred tax (2) 0
Norway 23% - -Net deferred tax 0 0
Change in deferred tax on the balance sheet is arrived at as follows:Deferred tax at 1 Jan. - -Year's change in deferred tax - -Net deferred tax at 31 Dec. 0 0
The tax payable on the balance sheet is arrived at as follows:Tax payable on the income statement 169 156Tax on paid group contributions (22) (16)Tax payable owed (147) (141)
In 2018, income tax was 23%. This has been changed to 22% with effect from 2019.
Profit/(loss) for the year 2018
The company currently has a defined-contribution pension that has been adapted to comply with the new Act on occupational pensions. The defined-contribution pension is covered by the company through ongoing payments to an insurance company. The company has no further obligations beyond this.
The company is affiliated with the contractual early retirement scheme (the "AFP" scheme) through the Norwegian Federation of Trade Unions (LO) and the Confederation of Norwegian Enterprise (NHO). The new AFP scheme is a defined-benefit, multi-employer pension plan, and since the assets cannot be attributed to individual members, the scheme is treated as a defined-contribution pension scheme in the financial statements, and future obligations are not recognised on the balance sheet.The remaining pension liabilities in the balance sheet relate to a handful of unfunded pensions paid through operations.
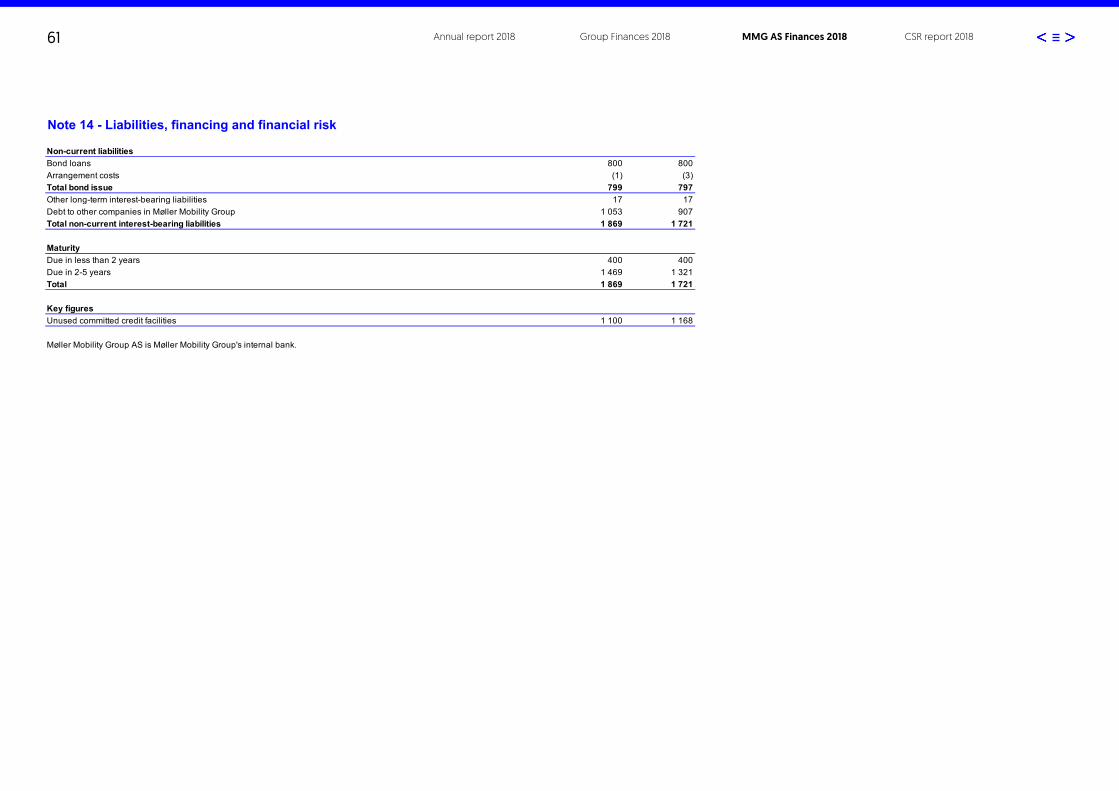
61 CSR report 2018MMG AS Finances 2018Group Finances 2018 Annual report 2018
NOTES MØLLER MOBILITY GROUP AS
All figures are in NOK millions.
Note 1 - Other operating revenue2018 2017
Gains from sale of group shares 112 -Other operating revenue 31 36Total other operating revenue 143 36
Note 2 - Payroll and other personnel costs
2018 2017Salaries 52 53Employer's NI contributions 8 8Pension costs 2 2Other personnel costs 5 12Total payroll and other personnel costs 67 77
Average number of employees 27 25Loans to employees 1 1
Loans to employees are mainly interest-bearing car loans where the company has security in a car. The interest rate on these loans is 2.1%. For information about the remuneration of senior executives, including the salary of the CEO of Møller Mobility Group, see note 2 to the consolidated financial statements.
Remuneration to the auditors in 2018 amounted to NOK 422,250 for auditing and NOK 43,940 for audit-related assistance. All amounts are stated exclusive of VAT
Note 3 - Income from investments in subsidiaries
2018 2017Harald A. Møller AS 681 657Møller Bil AS 606 122Møller Bil Holding AB 95 49Møller Synergi AS 3 -Total income from investments in subsidiaries 1 386 828
Note 4 - Other financial income and financial costs
2018 2017Currency gains 83 28Other financial income 3 2Total other financial income 86 30
Currency losses 61 32Other financial costs 25 24Total other financial costs 86 56
Note 5 - Tangible fixed assets and intangible assets
Tangible Intangible Totalfixed assets* assets
Acquisition cost at 1 Jan. 33 16 49Additions 13 2 15Disposals (7) - (7)Acquisition cost at 31 Dec. 38 18 56Accumulated depreciation at 1 Jan. 3 5 8Year's depreciation and write-downs 4 2 6Disposals (2) - (2)Depreciated at 31 Dec. 5 7 12Carrying amount at 31 Dec. 33 11 44
Straight line depreciation plan 3-7 years 3-10 years* Cars, fixtures and furnishings
Note 6 - Investments in subsidiaries
Business Stake/ Equity Carryingoffice voting 31.12.2018 amount
Company name rightsHarald A. Møller AS Oslo 100 % 428 509 342Møller Bil AS Oslo 100 % 89 162 109Møller IT AS Oslo 100 % 70 82 104Møller Synergi AS Oslo 100 % 4 2 9Hyre AS Oslo 100 % (6) (7) 5Total investments in subsidiaries 585 748 569* Includes dividends received / group contributions from subsidiaries totalling NOK 192 million.
The above table only shows shares owned directly by Møller Mobility Group AS. In total, the Group consists of 38 companies directly and indirectly ownedby Møller Mobility Group AS. As of 01.01.2018, Harald A. Møller AS and Møller Bil Klargjøring AS merged. The shares in Møller Bil Holding AB were sold to Møller Bil AS as of 06.08.2018.
Note 7 - Investments in associated companies
Business Voting Equity Profit/(loss) Carryingoffice rights/ in company after tax amount
Company name stake 31.12.2018 2018 31.12.2018Volkswagen Møller Bilfinans AS Oslo 49,00 % 3 006 259 840UIP Holding AS* Oslo 20,55 % 16 (18) 75Total investments in associated companies 3 022 241 915* Equity and profit as of 31.12.17.
The share of the profit/(loss) is not incorporated into the company financial statements; it is only incorporated into the consolidated financial statements of Møller Mobility Group.
Note 8 - Pensions
Pension costs 2018 2017Defined-contribution pension 2 2Pension costs 2 2
Carrying amount net pension obligations Calculated pension liabilities (1) (2)Net carrying amount pension liabilities (1) (2)
Number of people covered by all pension plans 27 27
Financial assumptionsReturn on pension assets 0,0 % 0,0 %Discount rate 2,3 % 2,3 %Annual salary growth / annual G adjustment 0,0 % 0,0 %
All pension liabilities include the employers' National Insurance contribution.
Note 9 - Balances with companies in the Aars Group
2018 2017Møller Bil Norge 1 078 975Harald A. Møller - 14Møller IT 254 204Møller Bil Sverige 146 126Moller Auto Baltic 518 12Total non-current receivables 1 996 1 331
The receivables consist of operating capital and loans to group companies (cashpool). The receivables are long-term financing of subsidiaries and have no specified repayment structure. The items must, in their entirety, be regarded as continuing for more than one year after the closure of the financial year.
2018 2017Bank deposits in subsidiaries (cashpool) 1 053 907Total non-current liabilities 1 053 907
2018 2017Receivables from group companies – dividends / group contributions 1 210 732Accounts receivable group 66 2Other receivables group 19 19 Total current receivables 1 295 752
2018 2017Group contributions 29 29Dividends 278 178Total group contributions and dividends 307 207
Group contributions to group companies 69 38Accounts payable group 7 4Total current liabilities to group companies 76 42
Note 10 - Related parties
Company Company relationship Transaction type 2018 2017All subsidiaries Subsidiary Financial income 43 31All subsidiaries Subsidiary Sale of administrative services 21 26Total sales 64 57
All subsidiaries Subsidiary Financial costs 6 3Møller Synergi AS Subsidiary Purchase of accounting services, etc. 1 1Harald A. Møller AS Subsidiary Purchase of IT, telephony, switchboard services 3 2Møller Bil AS Subsidiary Purchase of shares in subsidiaries - 11Total purchases 10 5
Note 11 - Bank deposits
Møller Mobility Group AS has bank deposits totalling NOK 228 million. The company has provided guarantees for tax owed by the subsidiaries amounting to NOK 119 million.
Note 12 - Guarantees and commitments
Guarantees and commitments 2018 2017Vehicle import duty, Customs Region Oslo and Akershus 177 135Withholding tax 119 115Employees 7 8Subsidiaries of Møller Mobility Group AS in the Baltic States - 133
The guarantees for employees concern shareholders in Møller MI AS who have loans in Nordea that amounted to NOK 7 million at 31 December 2018.The guarantee is secured by collateral in shares. Other guarantees apply to subsidiaries.
Note 13 - Share capital
Share Other paid-in Other Totalcapital equity equity
Equity at 1 Jan. 2018 48 1 1 884 1 933Group contributions paid - - (22) (22)Additional dividends - - (300) (300)Profit/(loss) for the year - - 1 290 1 290Currency hedging of equity in foreign subsidiaries - - (1) (1)Allocated to dividend - - (278) (278)Equity at 31 Dec. 2018 48 1 2 573 2 622
Share Other paid-in Other Totalcapital equity equity
Equity at 1 Jan. 2017 48 1 1 901 1 950Group contributions paid - - (22) (22)Additional dividends - - (400) (400)Profit/(loss) for the year - - 589 589Currency hedging of equity in foreign subsidiaries - - (6) (6)Allocated to dividend - - (178) (178)Equity at 31 Dec. 2017 48 1 1 884 1 933
For information about share capital and shareholder information, see note 13 to the consolidated financial statements.
Note 14 - Liabilities, financing and financial risk
Non-current liabilitiesBond loans 800 800Arrangement costs (1) (3)Total bond issue 799 797Other long-term interest-bearing liabilities 17 17Debt to other companies in Møller Mobility Group 1 053 907Total non-current interest-bearing liabilities 1 869 1 721
MaturityDue in less than 2 years 400 400Due in 2-5 years 1 469 1 321Total 1 869 1 721
Key figuresUnused committed credit facilities 1 100 1 168
Møller Mobility Group AS is Møller Mobility Group's internal bank.
Note 15 - Taxes
Taxes in the income statement 2018 2017
Profit before tax 1 459 746
Tax payable in Norway 163 150Tax on paid group contributions 6 7Total tax payable 169 157
Change in deferred tax - -Tax cost 169 157Profit for the year 1 290 589
Effective tax rate 11,6 % 21,0 %
23% of the profit before tax 336 179Actual tax cost 169 157Deviation tax cost 167 22The deviation comprises:Permanent differences (167) (22)Total (167) (22)
Tax on balance sheetThe calculation of deferred tax takes into account the following temporary differences: 2018 2017Tangible fixed assets 4 4Unrealised exchange rate losses on forward contracts (6) (5)Amortised borrowing costs 1 3Pension (1) (2)Total deferred tax (2) 0
Norway 23% - -Net deferred tax 0 0
Change in deferred tax on the balance sheet is arrived at as follows:Deferred tax at 1 Jan. - -Year's change in deferred tax - -Net deferred tax at 31 Dec. 0 0
The tax payable on the balance sheet is arrived at as follows:Tax payable on the income statement 169 156Tax on paid group contributions (22) (16)Tax payable owed (147) (141)
In 2018, income tax was 23%. This has been changed to 22% with effect from 2019.
Profit/(loss) for the year 2018
The company currently has a defined-contribution pension that has been adapted to comply with the new Act on occupational pensions. The defined-contribution pension is covered by the company through ongoing payments to an insurance company. The company has no further obligations beyond this.
The company is affiliated with the contractual early retirement scheme (the "AFP" scheme) through the Norwegian Federation of Trade Unions (LO) and the Confederation of Norwegian Enterprise (NHO). The new AFP scheme is a defined-benefit, multi-employer pension plan, and since the assets cannot be attributed to individual members, the scheme is treated as a defined-contribution pension scheme in the financial statements, and future obligations are not recognised on the balance sheet.The remaining pension liabilities in the balance sheet relate to a handful of unfunded pensions paid through operations.
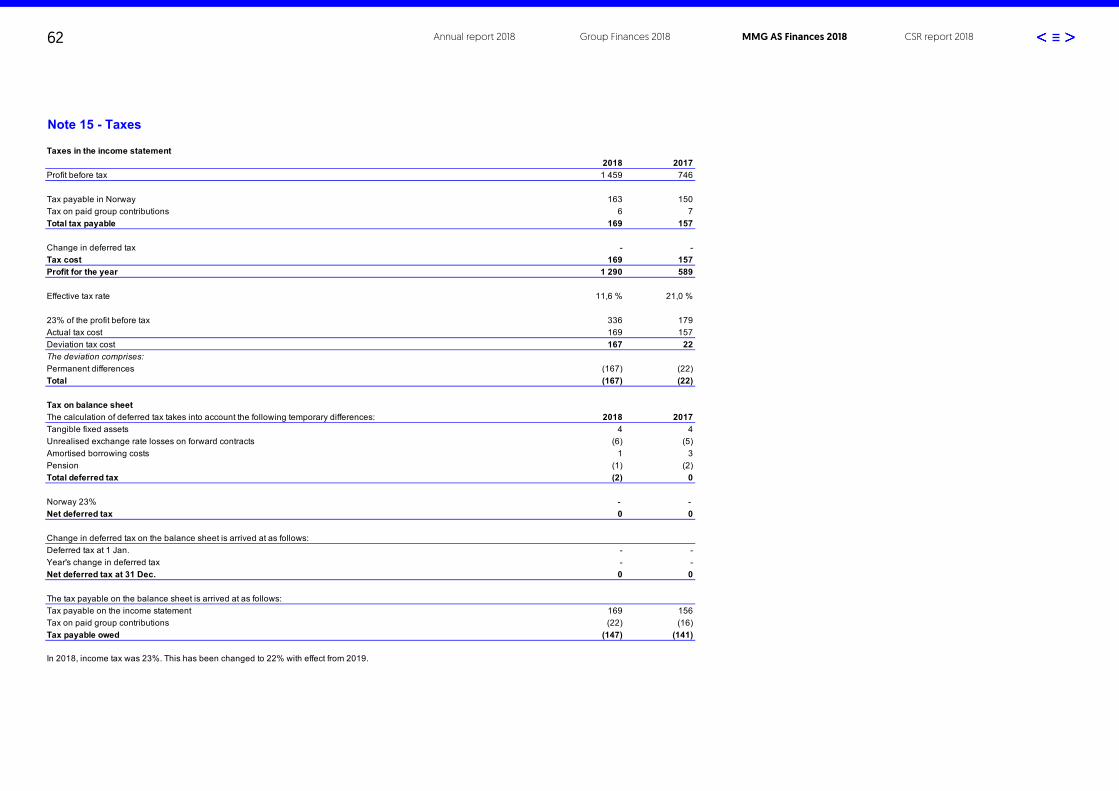
62 CSR report 2018MMG AS Finances 2018Group Finances 2018 Annual report 2018
NOTES MØLLER MOBILITY GROUP AS
All figures are in NOK millions.
Note 1 - Other operating revenue2018 2017
Gains from sale of group shares 112 -Other operating revenue 31 36Total other operating revenue 143 36
Note 2 - Payroll and other personnel costs
2018 2017Salaries 52 53Employer's NI contributions 8 8Pension costs 2 2Other personnel costs 5 12Total payroll and other personnel costs 67 77
Average number of employees 27 25Loans to employees 1 1
Loans to employees are mainly interest-bearing car loans where the company has security in a car. The interest rate on these loans is 2.1%. For information about the remuneration of senior executives, including the salary of the CEO of Møller Mobility Group, see note 2 to the consolidated financial statements.
Remuneration to the auditors in 2018 amounted to NOK 422,250 for auditing and NOK 43,940 for audit-related assistance. All amounts are stated exclusive of VAT
Note 3 - Income from investments in subsidiaries
2018 2017Harald A. Møller AS 681 657Møller Bil AS 606 122Møller Bil Holding AB 95 49Møller Synergi AS 3 -Total income from investments in subsidiaries 1 386 828
Note 4 - Other financial income and financial costs
2018 2017Currency gains 83 28Other financial income 3 2Total other financial income 86 30
Currency losses 61 32Other financial costs 25 24Total other financial costs 86 56
Note 5 - Tangible fixed assets and intangible assets
Tangible Intangible Totalfixed assets* assets
Acquisition cost at 1 Jan. 33 16 49Additions 13 2 15Disposals (7) - (7)Acquisition cost at 31 Dec. 38 18 56Accumulated depreciation at 1 Jan. 3 5 8Year's depreciation and write-downs 4 2 6Disposals (2) - (2)Depreciated at 31 Dec. 5 7 12Carrying amount at 31 Dec. 33 11 44
Straight line depreciation plan 3-7 years 3-10 years* Cars, fixtures and furnishings
Note 6 - Investments in subsidiaries
Business Stake/ Equity Carryingoffice voting 31.12.2018 amount
Company name rightsHarald A. Møller AS Oslo 100 % 428 509 342Møller Bil AS Oslo 100 % 89 162 109Møller IT AS Oslo 100 % 70 82 104Møller Synergi AS Oslo 100 % 4 2 9Hyre AS Oslo 100 % (6) (7) 5Total investments in subsidiaries 585 748 569* Includes dividends received / group contributions from subsidiaries totalling NOK 192 million.
The above table only shows shares owned directly by Møller Mobility Group AS. In total, the Group consists of 38 companies directly and indirectly ownedby Møller Mobility Group AS. As of 01.01.2018, Harald A. Møller AS and Møller Bil Klargjøring AS merged. The shares in Møller Bil Holding AB were sold to Møller Bil AS as of 06.08.2018.
Note 7 - Investments in associated companies
Business Voting Equity Profit/(loss) Carryingoffice rights/ in company after tax amount
Company name stake 31.12.2018 2018 31.12.2018Volkswagen Møller Bilfinans AS Oslo 49,00 % 3 006 259 840UIP Holding AS* Oslo 20,55 % 16 (18) 75Total investments in associated companies 3 022 241 915* Equity and profit as of 31.12.17.
The share of the profit/(loss) is not incorporated into the company financial statements; it is only incorporated into the consolidated financial statements of Møller Mobility Group.
Note 8 - Pensions
Pension costs 2018 2017Defined-contribution pension 2 2Pension costs 2 2
Carrying amount net pension obligations Calculated pension liabilities (1) (2)Net carrying amount pension liabilities (1) (2)
Number of people covered by all pension plans 27 27
Financial assumptionsReturn on pension assets 0,0 % 0,0 %Discount rate 2,3 % 2,3 %Annual salary growth / annual G adjustment 0,0 % 0,0 %
All pension liabilities include the employers' National Insurance contribution.
Note 9 - Balances with companies in the Aars Group
2018 2017Møller Bil Norge 1 078 975Harald A. Møller - 14Møller IT 254 204Møller Bil Sverige 146 126Moller Auto Baltic 518 12Total non-current receivables 1 996 1 331
The receivables consist of operating capital and loans to group companies (cashpool). The receivables are long-term financing of subsidiaries and have no specified repayment structure. The items must, in their entirety, be regarded as continuing for more than one year after the closure of the financial year.
2018 2017Bank deposits in subsidiaries (cashpool) 1 053 907Total non-current liabilities 1 053 907
2018 2017Receivables from group companies – dividends / group contributions 1 210 732Accounts receivable group 66 2Other receivables group 19 19 Total current receivables 1 295 752
2018 2017Group contributions 29 29Dividends 278 178Total group contributions and dividends 307 207
Group contributions to group companies 69 38Accounts payable group 7 4Total current liabilities to group companies 76 42
Note 10 - Related parties
Company Company relationship Transaction type 2018 2017All subsidiaries Subsidiary Financial income 43 31All subsidiaries Subsidiary Sale of administrative services 21 26Total sales 64 57
All subsidiaries Subsidiary Financial costs 6 3Møller Synergi AS Subsidiary Purchase of accounting services, etc. 1 1Harald A. Møller AS Subsidiary Purchase of IT, telephony, switchboard services 3 2Møller Bil AS Subsidiary Purchase of shares in subsidiaries - 11Total purchases 10 5
Note 11 - Bank deposits
Møller Mobility Group AS has bank deposits totalling NOK 228 million. The company has provided guarantees for tax owed by the subsidiaries amounting to NOK 119 million.
Note 12 - Guarantees and commitments
Guarantees and commitments 2018 2017Vehicle import duty, Customs Region Oslo and Akershus 177 135Withholding tax 119 115Employees 7 8Subsidiaries of Møller Mobility Group AS in the Baltic States - 133
The guarantees for employees concern shareholders in Møller MI AS who have loans in Nordea that amounted to NOK 7 million at 31 December 2018.The guarantee is secured by collateral in shares. Other guarantees apply to subsidiaries.
Note 13 - Share capital
Share Other paid-in Other Totalcapital equity equity
Equity at 1 Jan. 2018 48 1 1 884 1 933Group contributions paid - - (22) (22)Additional dividends - - (300) (300)Profit/(loss) for the year - - 1 290 1 290Currency hedging of equity in foreign subsidiaries - - (1) (1)Allocated to dividend - - (278) (278)Equity at 31 Dec. 2018 48 1 2 573 2 622
Share Other paid-in Other Totalcapital equity equity
Equity at 1 Jan. 2017 48 1 1 901 1 950Group contributions paid - - (22) (22)Additional dividends - - (400) (400)Profit/(loss) for the year - - 589 589Currency hedging of equity in foreign subsidiaries - - (6) (6)Allocated to dividend - - (178) (178)Equity at 31 Dec. 2017 48 1 1 884 1 933
For information about share capital and shareholder information, see note 13 to the consolidated financial statements.
Note 14 - Liabilities, financing and financial risk
Non-current liabilitiesBond loans 800 800Arrangement costs (1) (3)Total bond issue 799 797Other long-term interest-bearing liabilities 17 17Debt to other companies in Møller Mobility Group 1 053 907Total non-current interest-bearing liabilities 1 869 1 721
MaturityDue in less than 2 years 400 400Due in 2-5 years 1 469 1 321Total 1 869 1 721
Key figuresUnused committed credit facilities 1 100 1 168
Møller Mobility Group AS is Møller Mobility Group's internal bank.
Note 15 - Taxes
Taxes in the income statement 2018 2017
Profit before tax 1 459 746
Tax payable in Norway 163 150Tax on paid group contributions 6 7Total tax payable 169 157
Change in deferred tax - -Tax cost 169 157Profit for the year 1 290 589
Effective tax rate 11,6 % 21,0 %
23% of the profit before tax 336 179Actual tax cost 169 157Deviation tax cost 167 22The deviation comprises:Permanent differences (167) (22)Total (167) (22)
Tax on balance sheetThe calculation of deferred tax takes into account the following temporary differences: 2018 2017Tangible fixed assets 4 4Unrealised exchange rate losses on forward contracts (6) (5)Amortised borrowing costs 1 3Pension (1) (2)Total deferred tax (2) 0
Norway 23% - -Net deferred tax 0 0
Change in deferred tax on the balance sheet is arrived at as follows:Deferred tax at 1 Jan. - -Year's change in deferred tax - -Net deferred tax at 31 Dec. 0 0
The tax payable on the balance sheet is arrived at as follows:Tax payable on the income statement 169 156Tax on paid group contributions (22) (16)Tax payable owed (147) (141)
In 2018, income tax was 23%. This has been changed to 22% with effect from 2019.
Profit/(loss) for the year 2018
The company currently has a defined-contribution pension that has been adapted to comply with the new Act on occupational pensions. The defined-contribution pension is covered by the company through ongoing payments to an insurance company. The company has no further obligations beyond this.
The company is affiliated with the contractual early retirement scheme (the "AFP" scheme) through the Norwegian Federation of Trade Unions (LO) and the Confederation of Norwegian Enterprise (NHO). The new AFP scheme is a defined-benefit, multi-employer pension plan, and since the assets cannot be attributed to individual members, the scheme is treated as a defined-contribution pension scheme in the financial statements, and future obligations are not recognised on the balance sheet.The remaining pension liabilities in the balance sheet relate to a handful of unfunded pensions paid through operations.
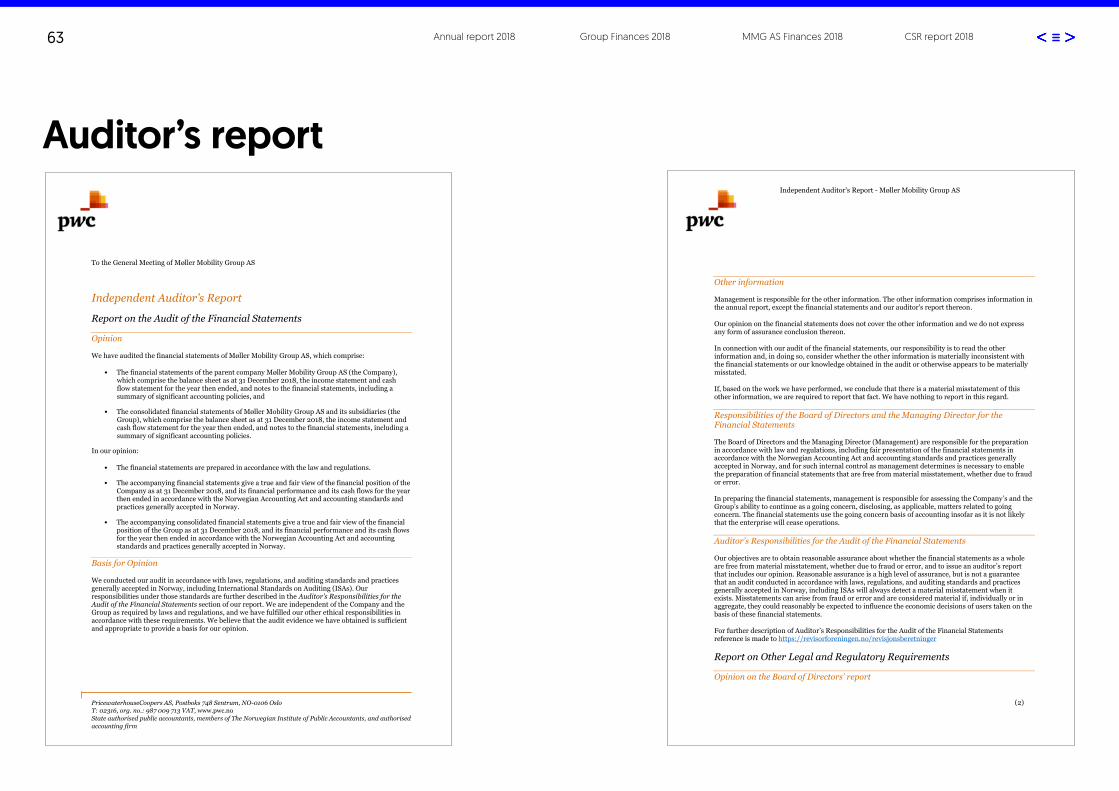
63 CSR report 2018Group Finances 2018 Annual report 2018 MMG AS Finances 2018
Auditor’s report Independent Auditor's Report - Møller Mobility Group AS
(2)
Other information
Management is responsible for the other information. The other information comprises information in the annual report, except the financial statements and our auditor's report thereon.
Our opinion on the financial statements does not cover the other information and we do not express any form of assurance conclusion thereon.
In connection with our audit of the financial statements, our responsibility is to read the other information and, in doing so, consider whether the other information is materially inconsistent with the financial statements or our knowledge obtained in the audit or otherwise appears to be materially misstated.
If, based on the work we have performed, we conclude that there is a material misstatement of this other information, we are required to report that fact. We have nothing to report in this regard.
Responsibilities of the Board of Directors and the Managing Director for the Financial Statements
The Board of Directors and the Managing Director (Management) are responsible for the preparation in accordance with law and regulations, including fair presentation of the financial statements in accordance with the Norwegian Accounting Act and accounting standards and practices generally accepted in Norway, and for such internal control as management determines is necessary to enable the preparation of financial statements that are free from material misstatement, whether due to fraud or error.
In preparing the financial statements, management is responsible for assessing the Company’s and the Group’s ability to continue as a going concern, disclosing, as applicable, matters related to going concern. The financial statements use the going concern basis of accounting insofar as it is not likely that the enterprise will cease operations.
Auditor’s Responsibilities for the Audit of the Financial Statements
Our objectives are to obtain reasonable assurance about whether the financial statements as a whole are free from material misstatement, whether due to fraud or error, and to issue an auditor’s report that includes our opinion. Reasonable assurance is a high level of assurance, but is not a guarantee that an audit conducted in accordance with laws, regulations, and auditing standards and practices generally accepted in Norway, including ISAs will always detect a material misstatement when it exists. Misstatements can arise from fraud or error and are considered material if, individually or in aggregate, they could reasonably be expected to influence the economic decisions of users taken on the basis of these financial statements.
For further description of Auditor’s Responsibilities for the Audit of the Financial Statements reference is made to https://revisorforeningen.no/revisjonsberetninger
Report on Other Legal and Regulatory Requirements
Opinion on the Board of Directors’ report
PricewaterhouseCoopers AS, Postboks 748 Sentrum, NO-0106 Oslo T: 02316, org. no.: 987 009 713 VAT, www.pwc.no State authorised public accountants, members of The Norwegian Institute of Public Accountants, and authorised accounting firm
To the General Meeting of Møller Mobility Group AS
Independent Auditor’s Report
Report on the Audit of the Financial Statements
Opinion
We have audited the financial statements of Møller Mobility Group AS, which comprise:
• The financial statements of the parent company Møller Mobility Group AS (the Company), which comprise the balance sheet as at 31 December 2018, the income statement and cash flow statement for the year then ended, and notes to the financial statements, including a summary of significant accounting policies, and
• The consolidated financial statements of Møller Mobility Group AS and its subsidiaries (the Group), which comprise the balance sheet as at 31 December 2018, the income statement and cash flow statement for the year then ended, and notes to the financial statements, including a summary of significant accounting policies.
In our opinion:
• The financial statements are prepared in accordance with the law and regulations.
• The accompanying financial statements give a true and fair view of the financial position of the Company as at 31 December 2018, and its financial performance and its cash flows for the year then ended in accordance with the Norwegian Accounting Act and accounting standards and practices generally accepted in Norway.
• The accompanying consolidated financial statements give a true and fair view of the financial position of the Group as at 31 December 2018, and its financial performance and its cash flows for the year then ended in accordance with the Norwegian Accounting Act and accounting standards and practices generally accepted in Norway.
Basis for Opinion
We conducted our audit in accordance with laws, regulations, and auditing standards and practices generally accepted in Norway, including International Standards on Auditing (ISAs). Our responsibilities under those standards are further described in the Auditor’s Responsibilities for the Audit of the Financial Statements section of our report. We are independent of the Company and the Group as required by laws and regulations, and we have fulfilled our other ethical responsibilities in accordance with these requirements. We believe that the audit evidence we have obtained is sufficient and appropriate to provide a basis for our opinion.
64 CSR report 2018Group Finances 2018 Annual report 2018 MMG AS Finances 2018
Independent Auditor's Report - Møller Mobility Group AS
(3)
Based on our audit of the financial statements as described above, it is our opinion that the information presented in the Board of Directors’ report concerning the financial statements, the going concern assumption and the proposed allocation of the result is consistent with the financial statements and complies with the law and regulations.
Opinion on Registration and Documentation
Based on our audit of the financial statements as described above, and control procedures we have considered necessary in accordance with the International Standard on Assurance Engagements (ISAE) 3000, Assurance Engagements Other than Audits or Reviews of Historical Financial Information, it is our opinion that management has fulfilled its duty to produce a proper and clearly set out registration and documentation of the Company’s accounting information in accordance with the law and bookkeeping standards and practices generally accepted in Norway.
Oslo, 24 April 2019 PricewaterhouseCoopers AS Vidar Lorentzen State Authorised Public Accountant Note: This translation from Norwegian has been prepared for information purposes only.

CSR report 2018
66 CSR report 2018MMG AS Finances 2018Group Finances 2018 Annual report 2018
MILJØ EMPLOYEES
MOBILITY
ENVIRONMENT
SOCIETY
Our sustainable social mission
Paul HegnaExecutive Vice President Communications and Public Affairs
The strategic framework for the Group’s social mission is based on a stakeholder and materiality analysis conducted by the holding company Aars and Møller Mobility Group.
The following social strategy focus areas were defined as priorities on the basis of the analysis:• Møller Mobility Group’s core values and culture• Energy-smart mobility and associated infra-
structure• Equality, diversity, inclusion and development• Integration and measures for people who fall
outside the labour market
These four areas were later reformulated into three concrete ambitions:• Be recognised for our role in contributing to a
greener everyday life for everyone• Take a central position within smart urban
mobility solutions and urban concepts• Be known as an enterprising company that
cares about its employees and society in general
The four pillars: Society, Environment, Employ-ees and Mobility form the basis of our social
mission and have been translated into concrete, scheduled measures that together reflect our ambitions.
Our overarching ambition is that our social mission becomes an integral part of how we conduct long-term, profitable business in all our operations. At the same time, we have a responsibility to contribute to sustainable devel-opment. This is why we have chosen to call our CSR work our “sustainable social mission”.
“Our ambition is that our social mission becomes an integral part of how we conduct long-term, profitable business in all our operations.”
67
Møller Mobility Group aims to take a key position within urban smart mobility solutions and urban concepts.
»
Paul Hegna Executive Vice President Communications and Public Affairs
CSR report 2018MMG AS Finances 2018Group Finances 2018 Annual report 2018

Miljø
MøllerGruppen er et familieeid konsern som er engasjert innen import, salg, service og finansiering av Volkswagen, Audi og ŠKODA. Selskapet er representert i Norge, Sverige og Baltikum.
68 CSR report 2018MMG AS Finances 2018Group Finances 2018 Annual report 201868
Norway is in a class of its own in terms of elec-trification of the auto fleet and vehicle charging infrastructure. Companies come to Norway to learn more about sales and servicing and how to develop a dynamic electric-vehicle market. In a few years, the entire car fleet in Norway will be electric. Electric vans are next up.
Volkswagen Group has launched the auto-motive industry’s most ambitious electrification initiative with “Roadmap E”, whereby the Group’s brands will launch 80 electric models by 2025. Some 50 will be fully electric and 30 will be chargeable hybrids. In 2025 Volkswagen Group will sell 3 million electric cars and invest over NOK 34 billion in e-mobility, autonomous vehi-cles, digitalisation and new mobility services. The “Roadmap E” electrification initiative also entails that Volkswagen will have an electric version of all the models in its entire portfolio by 2030. It is therefore also our clear ambition to remain a leader in this area in the future.
Sales of chargeable vehicles: Proportion of all registered new passenger cars that are charge-able (electric and plug-in hybrids): 49.1% (39 %).
The total share of electric vehicles in Norway had strong growth in 2018 too, jumping from 21% in 2017 to 31% in 2018. (Source: Information Council for Road Traffic OFV).
Our brands: Over half of all sales of Volkswa-gen passenger cars in 2018 were chargeable vehicles (53.4%). In 2018 Volkswagen’s electric cars had a market share of 17.1%. Volkswagen and Audi had a combined share of 18.5% of all sold chargeable hybrids.
Carbon emissions: In 2018 newly registered passenger cars in Norway emitted an average of 71 g of CO2 per kilometre. This is 11 g lower than in 2017. Average CO2 emissions have been reduced by more than 50 g/km in the past six years.
CO2 emissions in Norway in 2018 (change from 2017):• All passenger cars 71 g/km (- 11 g/km)• Petrol cars (all, including petrol-electric hybrids)
94 g/km (0 g/km)• Diesel cars (all, including diesel-electric hybrids)
131 g/km (+ 5 g/km)
Møller Mobility Group wants to be a valued resource on automotive and environmental issues, enable our customers to make good environmental choices, and be a market leader in chargeable cars.
Environment
0
13750
27500
41250
55000
68750
82500
96250
110000
2018201720162015201420132012201120102009200820072006
Diesel Gasoline BEV PHEV Hybrid Others
Development of fuel segments
CSR report 2018MMG AS Finances 2018Group Finances 2018 Annual report 2018

69
CO2 emissions for our makes:• Volkswagen 66 g CO2/km (65 g)• Audi 92 g CO2/km (96 g)• ŠKODA 131 g CO2/km (130 g)
Møller Bil KlargjøringMøller Bil Klargjøring was merged into Harald A. Møller on 1 January 2018 and is now part of Møller Logistikk Bekkelaget. The unit’s main task is technical and cosmetic preparation of all the cars that arrive in the country, and installation of some equipment. The company provides services to all 43 dealers in Møller Mobility Group, some private dealers, and a few key account customers via Harald A. Møller. In 2018 Møller Logistikk Bekke-laget has invested in two new washing machines. In 2019 Møller Logistikk Bekkelaget will invest in a new car washing tunnel to strengthen its position in the preparation of new cars. Møller Logistikk Bekkelaget is Eco-Lighthouse certified. In 2018 Møller Bil Klargjøring prepared 25,200 vehicles, which constitutes an average of 115 vehicles per day with a lead time of two days.
Waste – car recovery – 2018The Norwegian car industry has developed an excellent tool for the collection and recovery of scrapped cars through Autoretur. Autoretur recovered 143,767 vehicles in 2018, and more than 97% of the vehicles’ weight is recovered through material or energy recovery and reuse of parts. It is the car importers who are responsi-ble for the collection and recovery of scrapped vehicles.
The Autoretur scheme is intended to ensure the proper recovery and recycling of scrapped cars. It is important to reduce CO2 emissions and emissions of environmental toxins, and to increase the reuse of metals, which are a limited resource. The Autoretur scheme reduced Norway’s emissions by 230,000 tonnes of CO2 in 2017. This corresponds to roughly 1.5 billion vehi-cle kilometres, or roughly 102,000 cars’ annual emissions, assuming an annual driving distance of 15,000 kilometres (ref. Economics Norway’s environmental accounts). Autoretur also ensures that heavy metals such as lead, cadmium and mercury are properly treated.
In 2018, 141,210 vehicles were scrapped in Norway. A total of 188,109 tonnes of waste was treated. Of this, 152,338 tonnes underwent mate-rial recovery (81%), 18,283 tonnes underwent energy recovery (9.7%) and 12,605 tonnes were reused (6.7%). This means that 97.4% of the cars’ weight was recovered and only 2.6% was sent to waste disposal in 2018.
An average of 913 kg of metals is recovered from one scrapped car. Autoretur’s environ-mental accounts for 2018 will not be available until May 2019, after the deadline for this report. Autoretur is supervised by the Norwegian Envi-ronment Agency. (Source: Autoretur)
Waste management, NorwayMøller Mobility Group has a waste manage-ment contract with Ragnsells. The figures show a slightly higher total waste volume and source separation rate than in 2017.
Figures from the collection of waste, scrap and recyclable resources in 2018:• Total volume of waste: 3,655 tonnes• Source separation rate: 77%
The largest fractions are:> Oil and fuel: 21%> Metals: 21%> Cardboard and paper: 14%> Wood: 4%> Plastic packaging: 3%
Waste management, SwedenDuring the year, the operations in Sweden have switched to a single supplier for all waste. This provides better overview of our combined waste management, will serve to optimise waste collection, and ensure good sorting, thereby reducing the impact on the environment. A total of 527 employees (of 661) have now completed an approved environmental course (“Miljøko-rtet”) and 28 are currently taking it. During the autumn, the dealers in Örebro, Lindesberg and Karlskoga switched to Samhall as their cleaning partner for reasons of social sustainability. Sam-hall employs people who would otherwise not find work, for reasons ranging from disability to lack of language proficiency.
The total volume of non-hazardous waste
CSR report 2018MMG AS Finances 2018Group Finances 2018 Annual report 2018

70
was 704 (515) tonnes. The sorting of this waste has resulted in a reduction in carbon emissions of 555.7 tonnes.
Waste management BalticsThe dealers in the Baltic States comply with the waste management and reporting requirements that apply in Lithuania, Estonia and Latvia. This means that all the dealers have procedures for waste management and have also signed agreements with companies that utilise the waste, including hazardous waste such as batteries and tyres. No centralised form of reporting for this has been established in Møller Mobility Group yet.
Energy management in Møller Mobility GroupEnvironmental protection is firmly anchored in the Group, and considerable resources have been invested to reduce energy consumption and thus our environmental footprint. Active energy monitoring at all our sites seeks to deal with excessive energy consumption promptly. Simple measures that yield easy gains have been prioritised as a collaboration between local man-
0
100
200
300
400
500
7473727170696867666564636261605958575655545352515049484746454443424140393837363534333231302928272625242322212019181716151413121110987654321
74 selected buildings in Norway, Sweden and the BalticsThere is huge variation in energy consumption per square metre of heated space. This is partly due to differences in the buildings and their technologies, but is also related to their different uses. New sales and workshop buildings are thus at the lower end of the spectrum, while repair workshops have relatively high consumption, due to their greater need for both ventilation and temperature control.
Temperature-adjusted energy consumption per square meters in Norway – Sweden – Baltics 2018
CSR report 2018MMG AS Finances 2018Group Finances 2018 Annual report 2018

71
agers / operational staff and centrally contracted experts. More extensive measures are discussed with the building owner before investments are initiated. The use of new technology for smart control of energy use has been considered, but to date, no investments have been made.
In addition to the ongoing energy monitor-ing, previous schemes were evaluated in 2018, with an assessment of new strategies for the upcoming five-year period. As well as increased use of smart technology, measures for good information and awareness-raising work are considered important to foster ownership and focus on this important aspect of the environ-mental work.
Electric cars are growing rapidly, and a major programme for the installation of charging points is under way. All the charging stations will be equipped with their own energy monitoring system, ensuring that energy use for vehicle charging can be measured separately from other building-specific consumption.
Energy saving in NorwayIn 2018, two large solar power systems were installed in Stavanger and Lillestrøm. These will make a positive contribution to energy con-sumption in the buildings. The solution has an integrated system that provides detailed statistics on solar energy production, including separate measurement of own consumption and any sales.
The work on installation of centralised access to all building control systems has been contin-ued, and at year-end, 90% of all central oper-ations control systems can be accessed from a central platform. Central control systems will not be installed in small buildings, but a system to ensure easy access for monitoring and local central systems are being considered.
Optimum operation of heat pumps is essential to ensure both good energy efficiency and that this type of investment is profitable. The number of heat pumps is increasing, with a combination of geothermal-to-water, air-to-air and air-to-water systems. Establishing good operating routines for these heat pump systems was therefore a priority in 2018.
Energy saving in SwedenThe facilities in Sweden have undergone major remodelling in recent years, and work on the plants in Örebro and Västerås was completed in 2018.
The facilities in Uppsala are quite old, making it difficult to install automated control systems for energy use in the repair workshop. Adjustments in the facility have enabled a 10% reduction in energy consumption (324,000 kWh). These meas-ures were introduced in spring 2018. The full-year reduction is calculated at almost 15%.
Excellent work by local operating technicians has yielded good results in terms of improving energy efficiency at the dealerships in Sweden.
Energy saving in the BalticsEfforts to improve energy efficiency in the Baltics is hampered by poor access to energy data. The buildings in the Baltics have relatively high energy expenditure for heating and ventilation. Work to improve access to energy data will be continued and prioritised, with the aim of being able to detect functional errors and finding appropriate systems for managing energy consumption.
> Sales of chargeable vehicles Over half of all sales of Volkswagen pas-senger cars were chargeable in 2018
> Zero emissions by 2025 Møller Mobility Group’s ambition is that all new passenger cars sold by the Group will be emissions-free by 2025
> Good energy management Respect for the environment is firmly rooted in the Group, and active energy monitoring at all our sites seeks to deal with excessive energy consumption promptly.
The UN’s sustainable development goals (SDGs) are a global plan of action for social develop-ment and a basis for prioritising efforts over the next 15 years. There are a total of 17 goals with a number of underlying targets. Volkswagen AG has committed to these goals. Four goals are particularly relevant for Møller Mobility Group.
The UN’s sustainable develop-ment goal 13: “Take urgent action to combat climate change and its impacts.”
CSR report 2018MMG AS Finances 2018Group Finances 2018 Annual report 2018

72
Mobility has rapidly become an integral part of Volkswagen AG’s and our own strategy, and our goal is to take a key position within urban smart mobility solutions and urban concepts. Møller Mobility Group is preparing to replace more than 30% of our current revenues with earnings from new mobility services by 2030. Climate change is an important driver behind this decision. Norway has ratified the international Paris Agreement on climate change, thereby committing to mak-ing necessary, forward-looking changes in the transport sector in order to reduce greenhouse gas emissions. In a nutshell, we must make much smarter use of what we have than we do today. Therefore, new, energy-efficient mobility solu-tions are also part of our social mission.
Doing things on our own and with othersMøller Mobility Group has already invested in and will continue to make major investments in new mobility services, both in order to learn, but also to position ourselves with a view to developing tomorrow’s mobility solutions. We are going to launch our own services, but even
though we have knowledge and expertise that will be important to come up with the best solutions for the future, it is unrealistic to expect to find all the solutions ourselves. So far, together with our owners in Aars and the people at Start-upLab, we have taken the initiative to establish MobilityLab. MobilityLab is a collaboration involv-ing a number of other major players, including Cirkle K, Telenor, Posten, If, NSB, the Norwegian Institute of Transport Economics (TØI) and the City of Oslo.
The aim is to foster more technology compa-nies with a capacity for growth that contribute to solutions to the major transport challenges in the future, related to the movement of both goods and people, in addition to creating new jobs in Norway and new mobility solutions that can yield major socio-economic benefits. MobilityLab aims to be an important arena for our success in this area.
Car sharing and micro-mobilityWe have also launched a car sharing service “Hyre”, whereby customers can easily share their
car with others when they are not using it them-selves, thanks to a digital key. Through a mobile application, Hyre provides a safe, easy way to rent a car with automatic settlement of toll road charges and fuel consumption. In light of excel-lent customer feedback and solid growth, we are scaling this service up in 2019, while develop-ing a tailor-made solution for housing coopera-tives, municipalities and large businesses.
Møller Mobility Group has also invested in the company Urban Infrastructure Partner (UIP). This investment gives Møller Mobility Group far greater reach as a mobility provider, while helping further develop our mobility strategy. Together with Hyre, the Group’s car-based mobility solution, the company is now repre-sented in two leading environments, both of which will be active in shaping the sustainable mobility solutions of the future.
Strong commitment from the factoryVolkswagen Group is the world’s largest auto-maker. In its “Together 2025” strategy, the group has stated that half of the business will be as we
Møller Mobility Group’s goal is to be a proactive provider of smart mobility services as well as physical products.
Mobility
know it today, while the other half will focus on new areas. The Volkswagen group itself states that this marks the start of the biggest change process in the company’s history, with a focus on developing the group’s core business and tapping potential new revenue streams. The group has also established the company MOIA to develop Volkswagen Group’s mobility services.
UN SDG 11: ”Make cities and human settlements inclusive, safe, resilient and sustainable”
UN SDG 9: ”Build resilient infra-structure, promote inclusive and sustainable industrialisation, and foster innovation.”
CSR report 2018MMG AS Finances 2018Group Finances 2018 Annual report 2018

73
Employees
Møller Mobility Group maintains a continuous, systematic focus on the working environment, monitoring employee satisfaction, the opportuni-ties they have to use their skills, and how they are followed up.
At year-end 2018, the Group had a total of 4,260 employees – a decrease of 85 from the previous year. There were 661 employees in Sweden, a total of 736 in the three Baltic States, and 2,863 in Norway.
VALUES AND CULTUREMøller Mobility Group’s core values are the foundation on which the Group’s corporate cul-ture rests and provide important guidelines for managers and employees on how to treat one another and our customers. The ethical principles upon which the core values are based have pro-vided the platform for our growth and work ever since the company was founded. Our employ-ees are deeply imbued with our core values, and there is a constant focus on this in Sweden, Estonia, Lithuania, Latvia and Norway.
Ever since the company was founded by Har-ald A. Møller in 1936, our core values have been a cornerstone of the company. After all these years, these values are still just as relevant and important to us. Ultimately it is about living up to our founder Harald A. Møller’s eternally relevant motto: “Stick to the straight and narrow”.
CODE OF CONDUCTThe results of the internal Questback survey conducted by Deloitte in autumn 2017 were largely positive; for example, in respect of aware-ness of and compliance with the core values. However, the survey also revealed that a number of employees had experienced unacceptable behaviour, but not reported it, indicating a fear of speaking up.
These negative findings were discussed at length by both the group management and central management teams, and it was decided to hold a workshop with a view to rectifying this. The management team of the dealership unit was asked to discuss specific dilemmas in everyday life and report the findings. These were then assessed and sorted centrally, and ten representative dilemmas were selected, ranging from bullying in the workplace, drinking at social events, and awareness about posting on social media, to the handling of trade-in cars.
A well-organised, targeted workshop called “The Most Valuable Day of the Year” was then held for all employees in all five countries at the
end of August 2018. The feedback indicates that the initiative was experienced as well-prepared, relevant and directly useful.
At the same time as the Most Valuable Day of the Year, a new brochure on the Code of Conduct was handed out. In addition, our core values folder was reprinted in a pocket-sized edition in Møller Mobility Group’s new graphic identity.
WHISTLEBLOWINGIn 2018, we processed 29 reports of unaccept-able circumstances with varying degrees of severity. Both the central management and the heads of our subsidiaries invite and encourage the employees to report any unacceptable circumstances. We are currently working on the feedback from the survey in summer 2018, where several people reported that they do not feel it is safe for them to report unacceptable
Distribution men, women & average age:
Country Nr. of employees Men % Average age Women % Average age
Norge 2.863 2.428 85% 38,7 453 15% 40,2
Sverige 661 570 86% 38 91 14% 37
Estland 207 169 81% 38 19% –
Litauen 222 187 84% 35 16% –
Latvia 307 235 77% – 72 23% –
CSR report 2018MMG AS Finances 2018Group Finances 2018 Annual report 2018
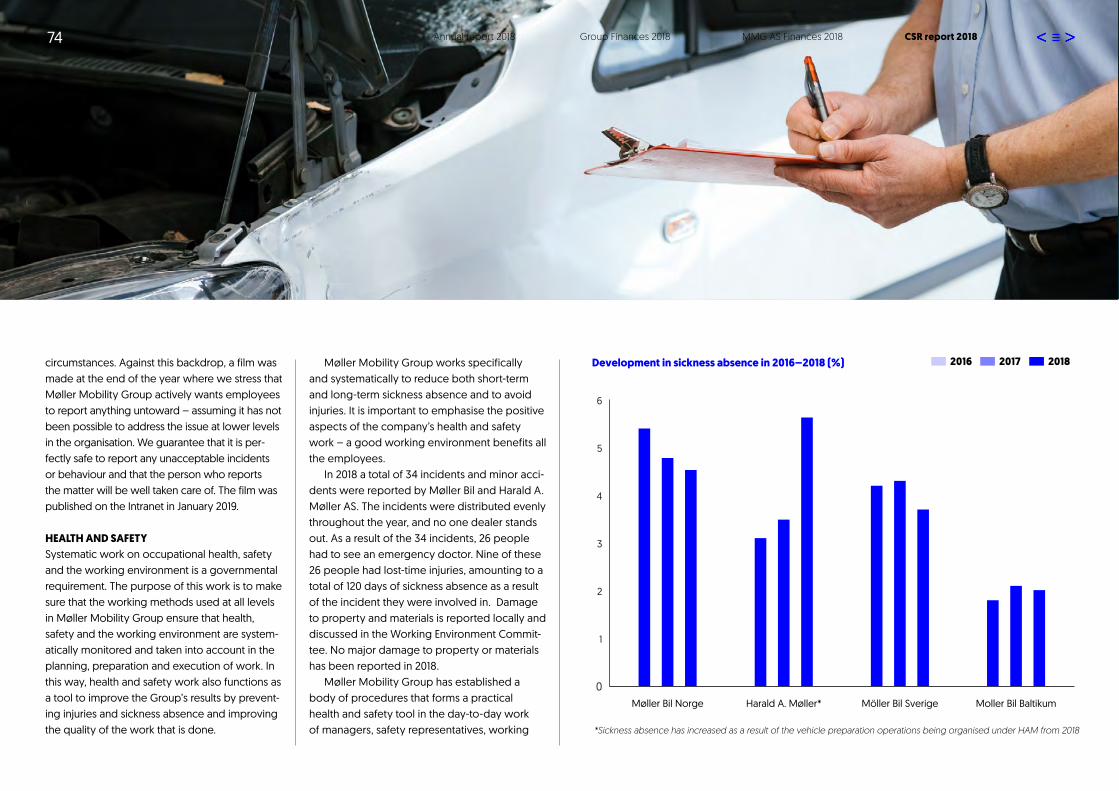
74
circumstances. Against this backdrop, a film was made at the end of the year where we stress that Møller Mobility Group actively wants employees to report anything untoward – assuming it has not been possible to address the issue at lower levels in the organisation. We guarantee that it is per-fectly safe to report any unacceptable incidents or behaviour and that the person who reports the matter will be well taken care of. The film was published on the Intranet in January 2019.
HEALTH AND SAFETYSystematic work on occupational health, safety and the working environment is a governmental requirement. The purpose of this work is to make sure that the working methods used at all levels in Møller Mobility Group ensure that health, safety and the working environment are system-atically monitored and taken into account in the planning, preparation and execution of work. In this way, health and safety work also functions as a tool to improve the Group’s results by prevent-ing injuries and sickness absence and improving the quality of the work that is done.
Møller Mobility Group works specifically and systematically to reduce both short-term and long-term sickness absence and to avoid injuries. It is important to emphasise the positive aspects of the company’s health and safety work – a good working environment benefits all the employees.
In 2018 a total of 34 incidents and minor acci-dents were reported by Møller Bil and Harald A. Møller AS. The incidents were distributed evenly throughout the year, and no one dealer stands out. As a result of the 34 incidents, 26 people had to see an emergency doctor. Nine of these 26 people had lost-time injuries, amounting to a total of 120 days of sickness absence as a result of the incident they were involved in. Damage to property and materials is reported locally and discussed in the Working Environment Commit-tee. No major damage to property or materials has been reported in 2018.
Møller Mobility Group has established a body of procedures that forms a practical health and safety tool in the day-to-day work of managers, safety representatives, working
Development in sickness absence in 2016–2018 (%) 2016 2017 2018
0
1
2
3
4
5
6
Moller Bil BaltikumMöller Bil SverigeHarald A. Møller*Møller Bil Norge
*Sickness absence has increased as a result of the vehicle preparation operations being organised under HAM from 2018
CSR report 2018MMG AS Finances 2018Group Finances 2018 Annual report 2018

75
environment committees and, of course, all the employees. The various procedures describe the responsibilities of each employee and how individuals with a managerial responsibility for health and safety should proceed.
Preventive health protectionAll our companies in Norway have an occupa-tional health service (OHS) agreement, and our high-risk groups – mechanics, technicians, paint-ers and panel beaters – are offered a targeted health check every third year. In Oslo, Arsana AS provides occupational health services for all the risk groups in the region. In addition to Arsana, Møller Mobility Group has a special in-house health and safety adviser in the Group’s HR Department who is available to all the compa-nies in Norway.
In 2018, 115 employees in high-risk posi-tions in Oslo and Akershus have undergone a targeted health check-up. People found to have physiological symptoms within a defined range are referred to a specialist. Four employees have been referred to a specialist as a result of hearing
loss. It is not possible to conclude that this hear-ing loss is work-related; it may also be hereditary, due to environmental exposure, or be linked to the circumstances in their private lives.
In addition, various preventive mappings have been conducted, related to ergonomics, noise, indoor climate and workplace lighting. The results are documented in separate reports.
The employees in greater Oslo have been offered a flu vaccine.
Follow-up of sickness absenceSickness absence is stable at a satisfactorily low level in our operations in Norway, and remains low in the Baltic States and Sweden (see table). The occupational health service has worked on an individual, departmental and organisa-tional level to help the companies with various challenges linked to sickness absence. The in-house health and safety adviser has attached importance to close collaboration with manag-ers, doctors, the Norwegian Labour and Welfare Administration (NAV) and treatment institutions, as well as taking part in dialogue meetings
arranged by the employer and NAV. The health and safety adviser receives monthly updates on sickness absence in the individual countries and prioritises assisting individual dealers on the basis of trends.
Health and safety courses • health and safety adviser held eight courses in
occupational health and safety for apprentices. • A training course for new safety
representatives.• An ergonomics course for employees in a
remodelled department. • Three departmental surveys on the psychoso-
cial work environment.
COMPANY DEMOCRACYMøller Bil Norge’s works council (SU), which is a forum for the managing director of Møller Bil, HR and trade union representatives from the Norwegian United Federation of Trade Unions (FF), met four times during the year. In addition, the annual group committee meeting was held, which, in addition to the works council, consists
“The health and safety adviser receives monthly updates on sickness absence in the individual countries and prioritises assisting individual dealers on the basis of trends.”
CSR report 2018MMG AS Finances 2018Group Finances 2018 Annual report 2018
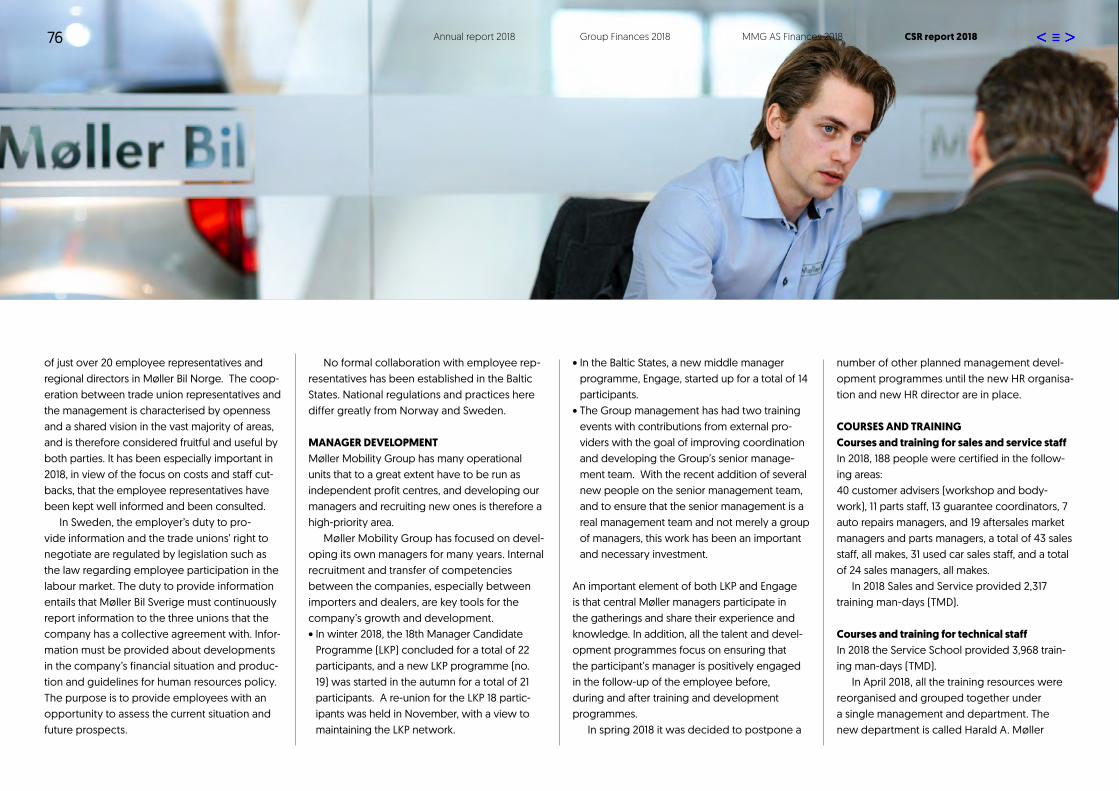
76
of just over 20 employee representatives and regional directors in Møller Bil Norge. The coop-eration between trade union representatives and the management is characterised by openness and a shared vision in the vast majority of areas, and is therefore considered fruitful and useful by both parties. It has been especially important in 2018, in view of the focus on costs and staff cut-backs, that the employee representatives have been kept well informed and been consulted.
In Sweden, the employer’s duty to pro-vide information and the trade unions’ right to negotiate are regulated by legislation such as the law regarding employee participation in the labour market. The duty to provide information entails that Møller Bil Sverige must continuously report information to the three unions that the company has a collective agreement with. Infor-mation must be provided about developments in the company’s financial situation and produc-tion and guidelines for human resources policy. The purpose is to provide employees with an opportunity to assess the current situation and future prospects.
No formal collaboration with employee rep-resentatives has been established in the Baltic States. National regulations and practices here differ greatly from Norway and Sweden.
MANAGER DEVELOPMENTMøller Mobility Group has many operational units that to a great extent have to be run as independent profit centres, and developing our managers and recruiting new ones is therefore a high-priority area.
Møller Mobility Group has focused on devel-oping its own managers for many years. Internal recruitment and transfer of competencies between the companies, especially between importers and dealers, are key tools for the company’s growth and development.• In winter 2018, the 18th Manager Candidate
Programme (LKP) concluded for a total of 22 participants, and a new LKP programme (no. 19) was started in the autumn for a total of 21 participants. A re-union for the LKP 18 partic-ipants was held in November, with a view to maintaining the LKP network.
• In the Baltic States, a new middle manager programme, Engage, started up for a total of 14 participants.
• The Group management has had two training events with contributions from external pro-viders with the goal of improving coordination and developing the Group’s senior manage-ment team. With the recent addition of several new people on the senior management team, and to ensure that the senior management is a real management team and not merely a group of managers, this work has been an important and necessary investment.
An important element of both LKP and Engage is that central Møller managers participate in the gatherings and share their experience and knowledge. In addition, all the talent and devel-opment programmes focus on ensuring that the participant’s manager is positively engaged in the follow-up of the employee before, during and after training and development programmes.
In spring 2018 it was decided to postpone a
number of other planned management devel-opment programmes until the new HR organisa-tion and new HR director are in place.
COURSES AND TRAINING Courses and training for sales and service staff In 2018, 188 people were certified in the follow-ing areas:40 customer advisers (workshop and body-work), 11 parts staff, 13 guarantee coordinators, 7 auto repairs managers, and 19 aftersales market managers and parts managers, a total of 43 sales staff, all makes, 31 used car sales staff, and a total of 24 sales managers, all makes.
In 2018 Sales and Service provided 2,317 training man-days (TMD).
Courses and training for technical staff In 2018 the Service School provided 3,968 train-ing man-days (TMD).
In April 2018, all the training resources were reorganised and grouped together under a single management and department. The new department is called Harald A. Møller
CSR report 2018MMG AS Finances 2018Group Finances 2018 Annual report 2018

77 MMG AS Finances 2018Group Finances 2018 Annual report 2018 CSR report 2018
Kompetansesenter and is co-located with Møller Logistikk in the premises in Leiraveien in Lillestrøm. The new training centre has seven training workshops with classroom areas and one dedicated classroom. The centre is respon-sible for all training in Norway required by the makes Audi, Škoda, Volkswagen passenger cars, Volkswagen utility vehicles and SEAT.
Courses and training courtesy of the importer Harald A. Møller asTotal: 6,285 TMDs (training man days)
Year TMD
2018 3 968
2017 4 725
2016 6 517
2015 5 652
2014 5 385
2013 5 122
2012 6 608
GREAT PLACE TO WORK Volkswagen Møller Bilfinans climbed an astonish-ing eight places in 2018, making it climber of the year across all categories, and was ranked the 6th best place to work in Norway in the category 50–199 employees. Through a comprehensive analysis of the corporate culture and a survey among the employees, focusing on credibility, respect, fairness, pride and camaraderie, Great Place to Work ranks the best businesses within four categories: more than 500 employees, 200–499 employees, 50–199 employees and 20–50 employees.
THE MØLLER BIL SCHOOLMøller Mobility Group companies invest in the talent of the future through the Møller Bil School. The Møller Bil School is an accredited training office where pupils from upper secondary schools sign an apprenticeship contract that normally lasts for 24 months. During this time, the apprentice has to combine the theory he or she has learned at school with the practical knowledge necessary to take their apprentice-
ship examination and thereby become a skilled craftsperson. The Møller Bil School follows an accredited curriculum for an automotive techni-cal education as a car mechanic, motor vehicle body repair technician, painter and spare parts adviser.
At the Møller Bil School, we guarantee that the pupils will work with the latest techniques and equipment used to service and diagnose cars that are technical leaders in areas such as safety, the environment, etc. The Møller Bil School had 156 apprentices at year-end 2018 (admitted in 2017 and 2018). The best students are offered a full-time job in Møller Bil once they have passed their apprentice examination.
UN SDG 8: “Promote sus-tained, inclusive and sustain-able economic growth, full and productive employment and decent work for all.”
“The Møller Bil School is an accredited training office where pupils from upper secondary schools sign an apprenticeship contract that normally lasts for 24 months.”

78
We will be a leader in terms of diversity, creating an inclusive work-place, developing our employees and giving them opportunities.
Møller Mobility Group will work to ensure diversity and inclusion in our workplaces and implement measures for people who fall outside the labour market. This is rooted in a stakeholder and materiality analysis, which forms the basis of our corporate social responsibility.
Historically, businesses’ corporate social responsibility has evolved from simply pro-viding financial support for chosen causes to actively developing projects and initiatives that are closely linked to the business – ideally as an integrated part of the company. This is also our ambition. We believe that the best way to help our fellow human beings is to give them work in our businesses. This has been done at many dealerships previously, but after the good experience from the vocational training at the vehicle preparation plant in Bekkelaget that started in autumn 2016, this is now being done systematically.
Møller Medvind was established in spring 2017 and opened its doors in Alnabru in April 2018. The company is helping resolve one of the greatest challenges in society today: young
people under the age of 30 who have fallen outside the labour market. Møller Medvind aims to create permanent, profitable workplaces for this target group – based on standard commer-cial principles. The goal is that Møller Medvind will run with a profit from 2020.
At the end of 2018, there were 19 young people in Møller Medvind, split between new car prepa-ration in Bekkelaget, Møller Logistics in Skedsmo, and cosmetic preparation of used cars in Alnabru. Since start-up in April, several candidates have already secured a permanent position.
Doubling in 2019Møller Medvind at Alnabru will continue to build up its capacity and competencies in the preparation of used cars in Oslo, with a potential for preparation of up to 6,000 cars a year. This will result in more than twice as many young people in jobs during 2019. Møller Medvind is also working to establish a trade certificate in the preparation of used cars for young people who want to take a “learning candidate” programme. In addition, our new employees will also receive
training in other subjects related to vehicle preparation. In this way, we will create attractive workers who can also be employed elsewhere in our business or at other companies.
The Møller methodWe call it the Møller method. The Møller method is about much more than work training. We pro-vide opportunities for people who have never been offered a permanent job. This requires employers who are willing to see the whole person, entailing considerably more follow-up than in an ordinary business model. This valuable investment forges stronger ties throughout the entire business, loyal employees and a fantastic working environment.
In Møller Medvind we do not forget about one another at the end of the working day. We care about each other as people, and will always be there to ensure a good transition from a passive life on the sidelines to active, meaningful employment. Møller Medvind is a learning arena, both for the participants and for us as a company. We learn from each other, and
through collaboration with good partners.The Møller method involves collabora-
tion with other parties in working life. Møller Medvind is an innovation project undertaken in partnership with the Norwegian Labour and Welfare Administration (NAV). This ensures the quality of the content and provides security for the participants, guaranteeing the best results.
Møller Medvind represents another step forward for Møller Mobility Group and the Møller family on the road towards our ambition of being a company that gives people new opportunities to move freely – not only in terms of physical transport, but also helping people move forward in their lives.
EXTERNAL PARTNERS Red Cross, MENTORThe Mentor project started in 2015 and was run by the Oslo Red Cross with funds from Møller Mobility Group (MøllerGruppen) and Ekstra-stiftelsen. In 2017 it was expanded to Hamar, where it was run by the Hedmark Red Cross. The project was a pilot project and ended in autumn
Society
CSR report 2018MMG AS Finances 2018Group Finances 2018 Annual report 2018

79
2018. The main objective of the Mentor project was to provide vulnerable young people with an opportunity to shape a meaningful life for themselves and use and develop their resources and skills on their own terms.
According to the project description, MEN-TOR will give young people a sense of control in a broader perspective by allowing them to influence and define their own destinies. The Mentor project was based on one-to-one rela-tionships between mentors and mentees aged 13–19 years.
Other goals for the project were to provide participants with:• Good role models• Motivation for school and education• Stronger links with their school, education and
organised recreational activities• A sense of recognition and social support• Ownership to influence their own lives• A sense of achievement• Better self-esteem
Goal achievement (excerpt)• The Mentor project has generally had high
scores on the various sub-goals• The one-to-one method contributes to the high
success rate. There have also been positive ripple effects in terms of low drop-out rates, as a result of this methodology
• The goals “being seen by the mentor”, “the mentor as a good role model” and “sense of achievement” got the highest overall scores.
• The Mentor project has resulted in major changes in the lives of many of the participants, according to the participants themselves, the mentors and the people who referred the young people to the scheme.
• Both the participants and the referrers report that their expectations were met, with some stating that the project surpassed their expectations
Møller Mobility Group is very pleased to have had the opportunity to participate in this important pilot project. We have learned a lot and are proud to have been able to help young people going through a difficult phase. The les-sons we have learned from MENTOR have also
inspired and formed the foundation of our own mentoring initiative under Møller Medvind. We have established the mentoring programme to help our young people succeed. We recruit the mentors from our own businesses.
SOS Children’s VillagesMøller Mobility Group is the main partner and sup-ports SOS Children’s Villages’ activities in the Baltic States. This collaboration is a natural extension of our core values and our desire to be a socially responsible and engaged company in Estonia, Lat-via and Lithuania. Now the partnership in the Baltic States is more locally anchored and is tied more closely to the core operations. This has generated greater enthusiasm for the scheme and higher use.
Christian RadichMøller Mobility Group has supported the ship and Norwegian maritime heritage since 2000. This full-rigged ship is used on 17 May for Con-stitution Day celebrations for Møller employees, and reduced rates are offered on selected cruises. The current agreement expires in 2019.
“It’s as if I’ve been born again. I look forward to a bright future with Møller Medvind.”Anas, Preparer, Møller Bil Logistikk
UN SDG 12: “Ensure sustai-nable consumption and production patterns”
CSR report 2018MMG AS Finances 2018Group Finances 2018 Annual report 2018

8080
Company Country Org. no.
Møller Mobility Group AS (parent company) NO 984 599 730
Møller Synergi AS NO 974 784 556
Møller Digital AS NO 918 320 547
Hyre AS NO 918719601
Harald A. Møller AS NO 943 733 988
Moller Baltic Import SE LV 40103176283
Møller Bil AS (holding company) NO 986 130 861
Møller Bil Øst AS NO 917 805 717
Møller Bil Vest AS NO 928 481 638
Møller Bil Molde AS NO 915 555 292
Møller Bil Jessheim AS NO 983 054 412
Møller Bil Bergen AS NO 834 083 922
Møller Bil Ensjø AS NO 980 173 569
Møller Bil Follo AS NO 912 174 786
Møller Bil Oppland AS NO 919 781 491
Møller Bil Haugesund AS NO 944 904 069
Møller Bil Hedmark AS NO 976 951 336
Møller Bil Romerike AS NO 964 995 923
Møller Bil Sør-Rogaland AS NO 933 625 583
Møller Bil Trøndelag AS NO 834 874 482
Møller Bil Vestfold AS NO 946 967 874
Møller Bil Ålesund AS NO 921 494 866
Møller BilPartner AS NO 968 222 678
AutoArena AS NO 974 480 581
Company Country Org. no.
SIA Moller Auto Latvia LV 40003055104
SIA Moller Auto Krasta LV 40003570184
SIA Moller Auto Ventspils LV 41203010445
SIA Moller Auto LV 40103847187
UAB Moller Auto LT 110430994
UAB Moller Auto Keturi Ziedai LT 224234070
UAB Moller Auto Alytus LT 149655665
Moller Auto Tallinn OÜ EE 10195513
Moller Auto Pärnu OÜ EE 10931969
Moller Auto Viru OÜ EE 11131478
Møller Bil Holding AB (holding company) SE 556719-8212
Møller Bil Sverige AB SE 556298-7510
Volkswagen Møller BilFinans AS NO 992 873 183
Companies in Møller Mobility Group as of 31.12.2018
CSR report 2018MMG AS Finances 2018Group Finances 2018 Annual report 2018