Annual Analyses of the EU Air Transport Market 2015 · Annual Analyses of the EU Air Transport...
28
Annual Analyses of the EU Air Transport Market 2015 Executive Summary February 2016 European Commission
Transcript of Annual Analyses of the EU Air Transport Market 2015 · Annual Analyses of the EU Air Transport...

Annual Analyses of the EU Air Transport Market 2015
Executive Summary
February 2016
European Commission


328131 ITD ITA 1 F
Annual Analyses of the EU Air Transport Market 2013
March 2015
Annual Analyses of the EU Air Transport Market 2013
Final Report
Annual Analyses of the EU Air Transport Market 2015
Executive Summary
February 2016
European Commission
Mott MacDonald, Mott MacDonald House, 8-10 Sydenham Road, Croydon CR0 2EE, United Kingdom
T +44 (0)20 8774 2000 F +44 (0)20 8681 5706 W www.mottmac.com
European Commission Disclaimer and copyright: This report has been carried out for the Directorate General for Mobility and Transport in the European Commission and expresses the opinion of the organisation undertaking the contract MOVE/E1/SER/2013-365/SI2.669187. These views have not been adopted or in any way approved by the European Commission and should not be relied upon as a statement of the European Commission's or the Mobility and Energy DG's views. The European Commission does not guarantee the accuracy of the information given in the report, nor does it accept responsibility for any use made thereof. Copyright in this report is held by the European Communities. Persons wishing to use the contents of this report (in whole or in part) for purposes other than their personal use are invited to submit a written request to the following address :European Commission - DG MOVE - Library (DM28, 0/36) - B-1049 Brussels e-mail (http://ec.europa.eu/transport/contact/index_en.htm)


3 328131/ITD/ITA/1/F February 2016 Annual Analysis of the EU Air Transport Market 2015
Revision Date Originator Checker Approver Description Standard
A 29.02.16 Various K. Tiligadis J. Cole Final Report
Issue and revision record
This document is issued for the party which commissioned it and for specific purposes connected with the above-captioned project only. It should not be relied upon by any other party or used for any other purpose.
We accept no responsibility for the consequences of this document being relied upon by any other party, or being used for any other purpose, or containing any error or omission which is due to an error or omission in data supplied to us by other parties.

5 328131/ITD/ITA/1/F February 2016 Annual Analysis of the EU Air Transport Market 2015
328131/ITD/ITA/1/F Annual Analyses of the EU Air Transport Market 2013
Foreword The European Commission has concluded annual reports since 1998 as part of its function as an observatory of the European Air Transport Industry. The reports have highlighted developments on legislative and regulatory measures and covered analysis of capacity, traffic and financial performance of airlines and airports, as well as topics such as air traffic control, environment, consumer issues and aircraft manufacturing. This 2015 report covers latest developments in the air transport industry during 2014 and the first half of 2015. It is structured in 9 chapters covering:
Air Traffic Trends
Airlines
Airports
Aircraft Manufacturing and MRO
Air Traffic Management
Market and Competition Issues
Environment and Sustainable Development
Aviation Safety and Security
Consumer Issues This Executive Summary provides highlights of the main report. The 2015 report is also accompanied by the Statistical Annex. The Annex provides in table format the key data-sets analysed to support each of the topics.
The key highlights are:
Global aviation demand continued to grow in 2014 for the fifth consecutive year since the
financial crisis of 2008/09, reaching another record performance of 3.3 billion passengers in
2014, a +5.5% increase on 2013.
Air traffic is projected to grow in the long-term, driven by global GDP growth. Annual
Revenue Passenger Kilometres (RPKs) are forecast to grow from 5.9 trillion in 2014 to
between 14.5 trillion (Airbus projection) and 15.4 trillion (Boeing projection) by 2034, with
average growth rates of between 4.6% and 4.9% per annum. The fastest growth rates are
anticipated in the developing Asian and Middle Eastern markets.
Technology advances over the last five years have changed the face of aviation, with the
introduction of more point-to-point flying using advanced aircraft such as the Airbus A350 and
the Boeing 787 families of efficient and environmentally-friendly twin-engine aircraft.
Airlines globally achieved record net profits of $16.4 billion in 2014 (up 55% on 2013) and are
expected to grow profitability further to $29 billion in 2015, buoyed by falling oil prices and
other cost control measures.
The airline industry has seen further consolidation, particularly amongst major airlines in US
market, while Low Cost Carriers continue to increase their market share. The rapid growth of
the hub airports in the Gulf and Istanbul has also continued during the past year.
Airport revenues grew by 5.5% in the most recent year reported (2013), and non-aeronautical
revenues now make up 44% of total income. Global investment in airport infrastructure is
estimated at over $59 billion during 2015.
Executive Summary

6 328131/ITD/ITA/1/F February 2016 Annual Analysis of the EU Air Transport Market 2015
328131/ITD/ITA/1/F Annual Analyses of the EU Air Transport Market 2013
Air Traffic Trends 2014 was the fifth consecutive year of air travel demand growth across the world regions. The International Civil Aviation Organisation (ICAO) reported that airlines carried 3.3 billion passengers in 2014, a +5.5% increase on 2013.
Global passenger airports handled 6.6 billion passengers in 2014, a 5.1% increase on 2013.
Meanwhile, more airplanes were in the sky as total movements grew by 1.0% to 83 million flights in
2014.
From a global aviation industry perspective, 2014 was a strong year in terms of traffic growth and
improved industry performance, indicating the recovery from a prolonged recession for a number of
advanced economies and confirming the sustained growth achieved by emerging economies around
the world. Overall industry performance was greatly assisted by lower fuel prices witnessed during
2014. From a regional perspective passenger growth accelerated in all regions in 2014 except in
Asia-Pacific where growth slowed from +8.7% in 2013 to +5.9% in 2014. The Middle East grew
fastest at +10.1. European traffic grew at +5.2% in 2014, far outpacing economic growth in the region,
while North America grew more slowly due to market maturity and airline consolidation in the
domestic market.
The global airline industry grew at or above the long-term growth rate for three consecutive years
based on sound fundamentals, while productivity continued to increase on historically high aircraft
utilisation and passenger load factors. Specifically, load factors in 2014 improved slightly to 80%,
showing that airlines are matching demand without oversupplying capacity. This performance,
continues the trend of growth seen since the global recession of 2008-09, and reflects the resumption
of global economic growth discussed in detail in the relevant section of this report.
Passenger Growth Rates & Traffic Shares by Region – 2014 v 2013 and 2013 v 2012
Source: ACI World Airport Traffic Database (2015)

7 328131/ITD/ITA/1/F February 2016 Annual Analysis of the EU Air Transport Market 2015
328131/ITD/ITA/1/F Annual Analyses of the EU Air Transport Market 2013
In terms of international passenger traffic, Dubai (DXB) overtook London Heathrow (LHR) to become
the world’s busiest airport. Istanbul remains one of the fastest-growing airports among the world’s top
30 airports for passenger traffic. The top 30 airport cities handled more than one-third of global
passenger traffic in 2014. According to ACI, London remains the world’s largest airport system with
147 million passengers handled at six airports.
One of the themes developing over the last five years in air transport is the strengthening of hub
airports around the world. This phenomenon is mostly due to the consolidation in the airline industry,
as witnessed lately in the US domestic market. As airlines merge to form more powerful groups, they
are able to consolidate their operations within their main airport hubs, and offer more services from
those hubs. The second theme is the continued growth of Low Cost Carriers (LCCs) offering more
direct services between both major city centres and secondary points, and directly between
secondary points.
Between 2009 and 2014, direct passengers grew at a rate of +6.6% per annum, while connecting
passengers grew at a rate of +3.0% pas. The global connecting share dropped from 14.4% in 2009 to
12.2% in 2014. This is due to both increased direct connectivity provided by LCCs and due to new
direct long-haul services on thinner routes made possible by aircraft such as the Boeing 787 and
Airbus A350.
Regarding European airports, four airports are within the top 30 in passengers carried: London
Heathrow, Paris Charles de Gaulle, Frankfurt Main and Madrid Barajas airport. Similar to US airports,
growth since 2005 has been low at European airports (with Madrid slightly negative overall, but with
+5.3% growth in 2014 v 2013). This is a reflection of the lasting effects of the 2008/09 recession and
relatively slow Euro Zone recovery, as well as the capacity constraints at Heathrow.
Europe’s air travel market remained strong in 2014 despite significant economic uncertainties.
Europe’s GDP grew by 1.4% in 2014 and is forecast to grow by 1.8% annually through 2034. The key
air passenger flows for 2014 are between EU and non-EU and they account for almost 40% of the
traffic. The strong evolution of this traffic flow (+44% since 2008) can be mostly attributed to the
beneficial impact on connectivity between the EU and non-EU Eastern European destinations (e.g.,
the Balkan states, Russia and Turkey) due to the expansion of low cost carrier services. North
America to Europe captured almost 20% of the total traffic from/to EU, albeit not showing any
significant passenger growth since 2008. Finally, passengers to North Africa have decreased since
the start of the events of Arab Spring, while Near, Middle and Far East flows maintained the growth
momentum built in the past six years.
The Association of European Airlines reports that member airlines carried 3% more passenger traffic
in 2014 than in 2013. Overall, European airlines experienced strong growth in passenger traffic for
2014, with the likes of WizzAir, Norwegian, Turkish Airlines, Aeroflot and Ryanair achieving double
digit growth rates. There were three European airlines that did not record growth in 2014: Air France,
Alitalia and Thomson Airways. Airline operations in Europe continue to evolve with the launch of new
ventures, routes, and business models.
Air Cargo
Referring to a report by World Development Indicators, 2014 showed that the air cargo market built on
the recovery that began in the second quarter of 2013. Global cargo traffic volume growth in 2014
was close to the long-term average, while cargo operators improved their profitability as the oil prices
fell. Capacity metrics also improved as utilisation of large freighters returned to recent highs.

8 328131/ITD/ITA/1/F February 2016 Annual Analysis of the EU Air Transport Market 2015
328131/ITD/ITA/1/F Annual Analyses of the EU Air Transport Market 2013
Despite the recent weak performance of dedicated air cargo services, many airlines rely on air freight
as an important part of their businesses due to the improved capabilities of passenger aircraft in
providing belly hold cargo capacity.
Business Aviation
The main indicators that measure the performance of Business Aviation are the business jet
transaction prices and sales activity, as well as the hours or segments flown by business jets. While
the global average growth in flight hours was +1.2% in 2014, regional performance was uneven, with
Europe and Middle East accounting for most of the growth.
JSSI Business Aviation Index of Business Aviation Flight Hours by region
Source: JSSI Index Outlook 2014
Air Transport Forecasts
Forecasts of air transport are affected by a number of different factors, all of which can play a key role
in projecting annual passenger volumes. Historically, Gross Domestic Product (GDP) and population
demographics have been the main drivers for aviation growth. However, in more recent times, due to
the volatility of the price of oil, jet fuel prices have become a significant driver.
Demanded Seat Miles vs. Air Travel Fuel Cost Forecast
Source: U.S. Energy Information Administration

9 328131/ITD/ITA/1/F February 2016 Annual Analysis of the EU Air Transport Market 2015
328131/ITD/ITA/1/F Annual Analyses of the EU Air Transport Market 2013
Boeing and Airbus have both produced a broad long term global market forecast for the period 2015
to 2034 using 2014 as the base year. Their growth rates are comparable given the similar
methodologies to form the forecast.
Boeing & Airbus Forecast Comparison
Boeing Airbus
RPK (trillion) 2014 5.9 5.9
RPK (trillion) 2034 15.4 14.5
Total Growth 2014 – 2034 161% 146%
Average Annual Growth Rate 4.9% 4.6%
Source: Boeing, Airbus
Eurocontrol’s latest forecast of European aircraft movements predicts growth rates of 2.5% per
annum through to 2021, when a total of 11.4 million aircraft are expected to operating in European
airspace, up 19% from 2014. Turkey is expected to see the fastest growth rates (+6% pa) and the
most additional flights (+2330 flights per day by 2021), and is the biggest contributor to air travel
growth in Europe.
Airlines
The global economy showed moderate growth during 2014 and the first half of 2015. Advanced
economies picked up in growth while emerging and developing markets slowed down relatively to
previous years. April 2015 IMF projections show a 3.3% global growth in 2015, marginally lower than
in 2014. Mid-2015 events in Europe (e.g., the Greek economic crisis) and China (stock market
uncertainty) created uncertainty in the economic outlook.
In general, the economic drivers have been favourable to the global airline industry since mid-2014.
While passenger demand grew during the period, falling fuel costs allowed airlines to reduce costs
and made 2014 one the most profitable years for the airline industry in recent times. The cost of jet
fuel continues to remain a key source of cost volatility for airlines. The recent decline in oil prices was
the most significant event impacting on the financial performance of the airline industry during 2014.
The price dropped from over $110 per barrel in June 2014 to below $50 by the end of 2014. Fuel
prices are highly volatile and unpredictable, but by mid-2015 jet fuel prices were still around $60 per
barrel, well below average of around $100 per barrel seen in previous years.
Labour is the second-largest operating expense for airlines after fuel and the availability of key labour
skills is seen by airline CEOs as a significant issue for sustained business growth. Airlines have
generally been effective in holding down labour costs and improving productivity in 2014, aided by the
underlying growth in traffic. This trend is continuing into 2015.
Globally, airline operational efficiencies are increasing. Traffic, in terms of Revenue Passenger
Kilometres (RPKs), are growing faster than capacity, in terms of Available Seat Kilometres (ASKs),
leading to an improvement in load factors to 79.8% in 2014, and expected to be over 80% in 2015.
Breakeven load factors are decreasing to 64.1% in 2014 and 62.7% in 2015, with consequent
improvements in operating margins. Industry wide net profits of $16.4 billion were $5.8 billion higher
(55%) than in 2013, and net profit per departing passenger increased 44% to $4.98. Revenues
increased by 2.2% while expenses, driven by the reduction in oil price, increased by only 1%.
Operating profit was up 34% to $33.9 billion, generating an operation margin of 4.6%.
The outlook for 2015 is positive. Although revenues are expected to decrease by 0.7% to $727 billion,
lower fuel costs are expected to improve net profits by 78%, to a record $29.9 billion. Ancillary

10 328131/ITD/ITA/1/F February 2016 Annual Analysis of the EU Air Transport Market 2015
328131/ITD/ITA/1/F Annual Analyses of the EU Air Transport Market 2013
revenues (revenues generated by activities and services other than air fares) generated a higher
income to airlines during 2014 as well as an increasing share of the total revenues. Ancillaries
represented 6.4% of total revenues, with an estimated value of $49.9 billion. With regards to cargo
revenues, air traffic freight in 2014 performed well due to an upturn in the economic cycle and growth
in demand for airfreight. Indeed, 2014 saw the strongest growth in airfreight volumes (+5.8%) since
the 2010 recovery in word trade. It should be noted that air cargo yields saw a decline in 2014 of
2.0%, with 2015 initial projections identifying a 7.0% drop over 2014 levels.
The global industry has been driven by consolidation in North America, and hybridisation of business
models between LCCs moving into business markets and legacy carriers offering more disaggregated
fare structures.
Driven by this strategy (as well as the economic drivers discussed above) the three big American
carrier groups, American Airlines Group, Delta Air Lines and United Continental Holdings were the top
3 airlines in terms of operating revenues during 2014. The European airline groupings Lufthansa
Group Air and Air France-KLM were ranked in fourth and fifth places respectively. The IAG Group
was ranked 8th after FedEx and Emirates, in 6
th and 7
th places respectively.
In relation to operating profit, four North American airlines (American Airlines Group, United
Continental Holdings, Southwest Airlines and Delta Air Lines) were in the top 5 ranking of most
profitable carriers during 2014. China Southern Airlines improved to second place as the airline with
most profitable operations. For further details, the World Airline Financial Results 2014 ranking
published by Air Transport World magazine is presented in the Statistical Annexes of this report.
The North America region achieved profits equivalent to 68% of the worldwide airline industry.
However, the structure of the airline industry in the majority of other regions remains fragmented.
European airlines experienced an increase in profitability in 2014, driven by the lower oil prices and
other cost controls, which allowed a decrease of the breakeven load factor. IATA’s expects a
continuation of this trend in 2015 with the net post-tax profit per passenger in Europe projected to
increase from $3.82 to $6.30. Margins remain slim, however, at only 1.6% in 2014. All big three
European groups (IAG, Air France-KLM and Lufthansa group) experienced negative growth in
operating revenue between 2013 and 2014. The carriers are still undergoing a process cost reduction
and maximising use of their low-cost vehicles, and with the recent acquisition of Aer Lingus by IAG,
2015 may see a marked improvement for European carriers.
LCCs continued to increase market share in Europe in 2014. The share of intra-European seat
capacity provided by LCCs grew to over 40% for the first time in 2014. A sign of the strength of these
airlines is that for 2014 five out of the top six highest operating margins in the European airline
industry were from LCCs, led by Ryanair. More information for all regions of the world is available in
the relevant chapter.
Airport
Airports recorded strong financial results in the more recent period reported (2013), showing
increased profitability. Expectations are for 2014 financial performance to continue the same trend, as
traffic growth was higher than historic averages. While there are differences in the financial
performance of airports by region, a trend towards reduced dependency on aeronautical revenue is
apparent. Non aeronautical revenue accounts for almost 50% of total airport revenue while, for
airports in each region, different sources of non-aeronautical revenue have increased in importance.
Aeronautical revenue deriving from the charges set at each airport can also vary significantly, not only

11 328131/ITD/ITA/1/F February 2016 Annual Analysis of the EU Air Transport Market 2015
328131/ITD/ITA/1/F Annual Analyses of the EU Air Transport Market 2013
by region but also by airport size. With the exception of Africa where over 70% of total airport revenue
derives from aeronautical revenue, all the other regions are close to the global average. This is a
result of the change in perception for airports being not merely a public-sector infrastructure provider,
but rather commercial entities that can provide value via their services to their end users and their
operators alike.
Airport Revenues
Airport charges worldwide differ based on the number of passengers served as well as the size of
aircraft serving the airport. Some airports choose to set rates and charges based on a goal to entice
certain aircraft to operate over others. Irrespective of region of the world, or aircraft size, airports
serving up to 30 million international passengers per annum, the charges are relatively consistent. As
a general rule, airports in Europe which are congested and have significant demand charge higher
rates than airports in the Middle East who are charging relatively low rates to promote growth. Many
of these airports are newer facilities, or in growing markets, where their goal is to receive the highest
satisfaction survey results, as well as increase their passenger volumes. The figure in the following
page displays airport charges for wide body aircraft at selected airports by world region.
Airport Charges [wide body aircraft only] at selected airports by region
Source: Airportcharges.com
Non-Aeronautical revenue continues to increase in significance as airports look for alternate revenue
sources to those provided through landing fees and terminal charges. The key sources of airport non-
aeronautical revenue include rents to various concessionaires, car parking, retail, advertising and car
rental facilities. For the last financial year that data is available, airports around the world have
managed to improve their non-aeronautical revenue streams by 4.9% year on year for 2013
The main airport costs comprise of personnel costs (such as staff salaries), operating expenses (such
as contracted services or utility bills) and capital costs (such as depreciation/amortisation of airport
infrastructure assets). As displayed in the table below, overall total airport costs for 2013 grew by
1.9%, compared to 5.5% growth in revenues in the same period. This however is not the case across
DXBDOHAUH
GRU
FRA
LHR
LGW
CDG
MADBCN AMS
MAN
IST
VIE
CPHPEK
PVG
HKG
DEL
BKK SINKUL
MNL
ICN
ATL
JFKLAX
ORD
SFO
MIAIAD
EWRLGA
JNB
ACC
CMN
TUN
ALG
ABJ
0
10,000
20,000
30,000
40,000
50,000
60,000
70,000
0 10 20 30 40 50 60 70 80
Total Charge (USD)
Passengers in 2014 (m)Middle East Latin America Europe Asia Pacific North America Africa
Parameters: Currency-USD, Aircraft-Turkish ArilinesB773ER, international route, turnaround
time-3h, MTO-340.2 tonnes, capacity-312, load factor-80%, passengers 250
12 328131/ITD/ITA/1/F February 2016 Annual Analysis of the EU Air Transport Market 2015
328131/ITD/ITA/1/F Annual Analyses of the EU Air Transport Market 2013
all the regions, with Latin American & Caribbean airport costs growing faster than revenues, mainly
due to increased capital costs.
Airport Costs by World Regions
Region Total Costs (Operating + Capital)
2013/12 % Change
Africa 2,100 -3.9%
Asia-Pacific 25,800 6.2%
Europe 42,100 -2.5%
Latin America & Caribbean 5,100 11.4%
Middle East 7,400 6.4%
North America 22,700 4.2%
World 106,500 1.9%
Source: ACI Airport Economics Survey 2014
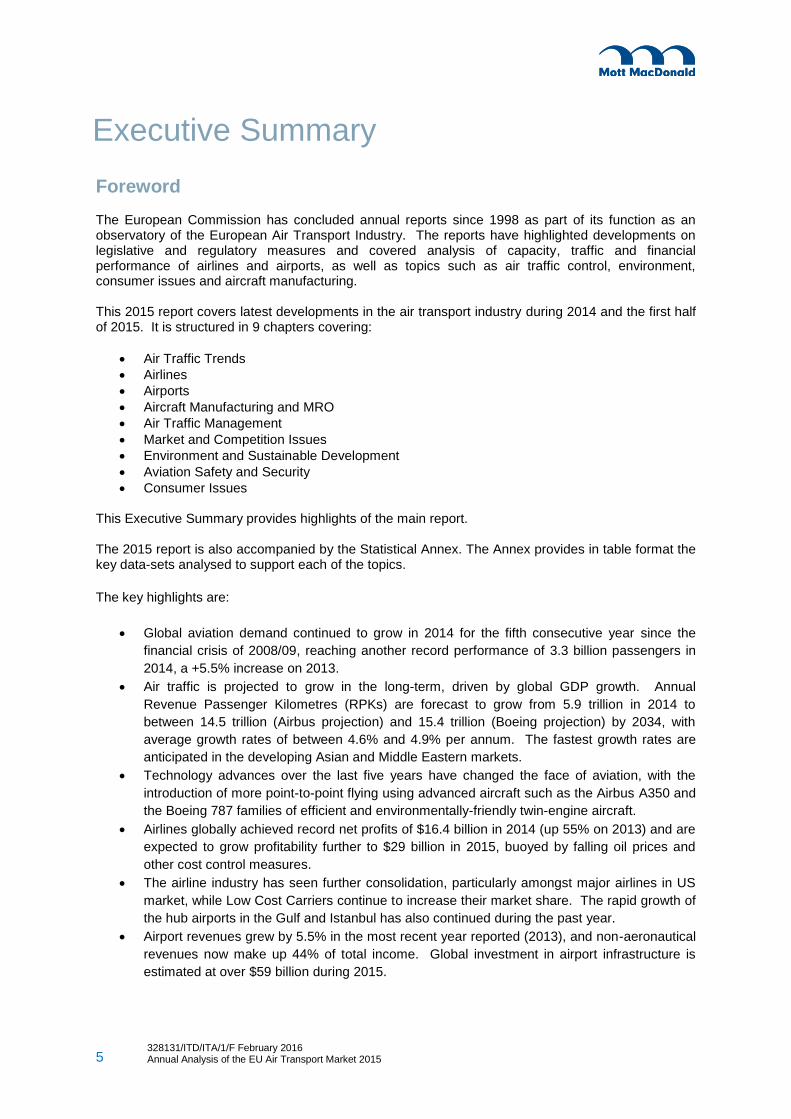
In accounting terms, the net profit of an airport is defined as the difference between its total revenues
and its total costs, often presented on a per passenger basis for comparison purposes. Total
revenues include both aero and non-aeronautical revenues, while total costs include operating
expenses, capital costs and taxes.
Net Profit Margin by airport size
Source: Adapted from 2014 ACI Economics Report
Airport Infrastructure Investment
The growing demand for air travel, both current and projected, drives investment in airport
infrastructure across the globe. There were 267 airport projects completed worldwide in 12 month
period to July 2015, with investments being highest in the Asia Pacific region. There are currently 346
new airport projects under construction, as countries plan to accommodate growing passenger
demand and also offer increased air connectivity in order to gain the economic benefits.

13 328131/ITD/ITA/1/F February 2016 Annual Analysis of the EU Air Transport Market 2015
328131/ITD/ITA/1/F Annual Analyses of the EU Air Transport Market 2013
Airport with Completed Infrastructure Investment Projects (12 months ending July 2015)
Source: CAPA Centre for Aviation
However, the drop of oil price might prove to be harmful for the future of the many large airport
investments by oil producing countries. This challenge may be another argument supporting the
already growing trend of airport privatisation and in particular airport PPP projects. This trend has
been evident in Europe, Latin America and Asia Pacific, where many airport concessions have been
confirmed or are in progress; Middle East, North America and Africa on the other hand, do not see
much privatisation activity for different reasons, although all three regions offer their own airport
privatisation opportunities in the near term.
Despite the overall profitability of the airport sector, it is clear that only a small minority of large
airports are actually profitable and able to offset the losses that the majority of the smallest airports
incur. The capital extensive structure of airport costs requires passenger numbers of over one million
per annum in order to allow for the airport owner to operate profitably.
Aircraft Manufacturing and MRO
The global civil MRO spent in 2014 was USD $62.1 billion, up 2.3% compared to the USD $60.7
billion spent in 2013. The strongest driver of this value is the Engine market, accounting for 40% of
total market. With the continuous growth of aircraft deliveries and the possibility of deferring older
aircraft retirements, the medium term prospects for this activity are also positive.
Thanks to improvements in aircraft technology, airlines around the world have been steadily retiring
aircraft as they receive new and more efficient airliners. However, as airlines waited to receive new
aircraft types – such as Airbus A320neo and A350, Boeing 737MAX and 787 - fuel prices started
declining. The situation is reflected in the number of aircraft retired during 2014, which fell from over
700 aircraft in 2013 to just over 500 in 2014.
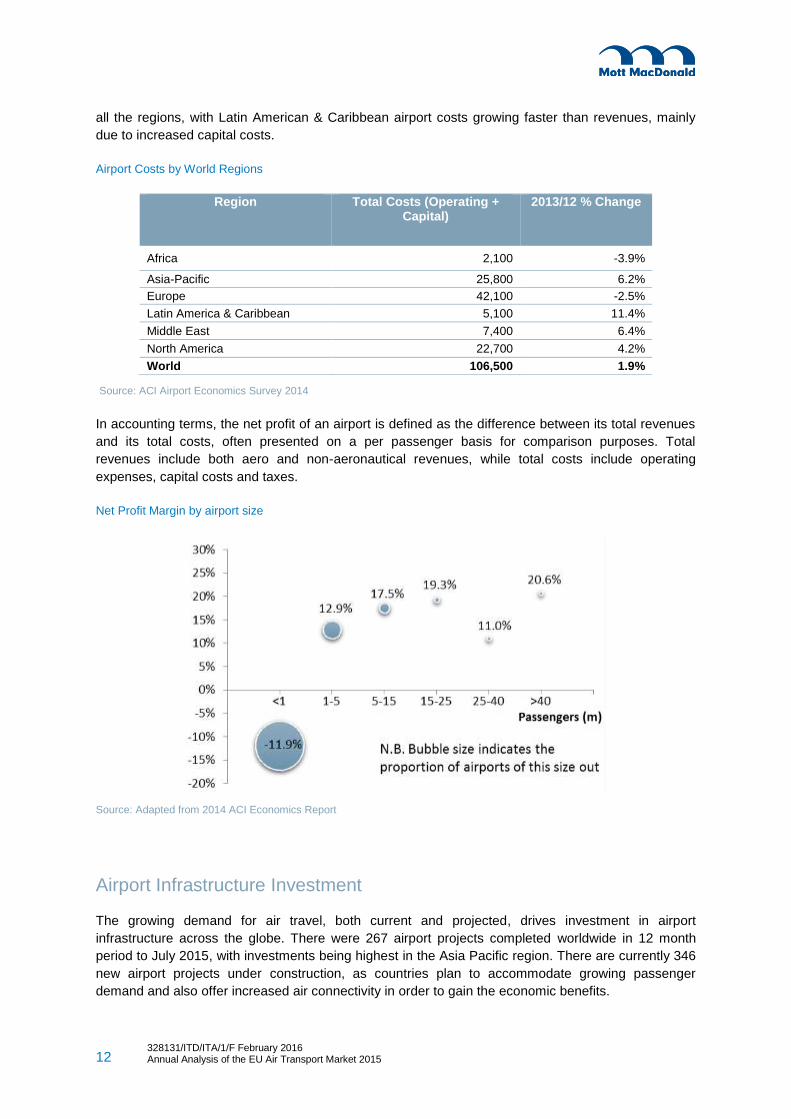
Forecasters still predict the Asia-Pacific region of the world to require more new planes in the future
than other regions, resulting in it becoming the largest global region for the MRO activity in the coming
years. The trend is reflected in the figure below.
14 328131/ITD/ITA/1/F February 2016 Annual Analysis of the EU Air Transport Market 2015
328131/ITD/ITA/1/F Annual Analyses of the EU Air Transport Market 2013
Global MRO Market Share 2014
Source: CAVOK
Aerospace Industry Mergers and Acquisitions
Revenues for the Top 20 aerospace companies grew by +2.7% during 2014, but within this there was
strong +7.7% growth in civil aerospace offsetting a -1.3% decline in the defence market in the nine
months ending in September 2014 .
The global commercial aerospace sector is expected to sustain its revenues and earnings growth in
2015, while continued declines are expected in the defence sector. The decrease has been partially
driven by U.S. defence budget cuts as a result of the cessation of a prolong period of armed conflict in
Iraq and Afghanistan. Also the number of megadeals (transactions above $1 billion or greater)
doubled from 2013. As an example, 2014 saw British defence specialist Cobham’s acquiring its US
competitor Aeroflex for $143 billion. As a matter of fact, the M&A activity in the sector showed a
supply chain consolidation trend that seems to be gaining momentum. This consolidation has allowed
profits to be maintained or improved despite falling revenues.
Air transport is a major global employer. The Air Transport Action Group (ATAG) reports that the air
transport industry sustains more than 58 million jobs globally. Direct aviation employment is 8.7
million, with over 49 million other jobs supported by aviation in the tourism and other related sectors.
The air transport industry impact (including direct, indirect, induced and catalytic) is estimated of over
$2.4 trillion, equivalent to 3.4% of world Gross Domestic Product (GDP).
Between 2014 and 2015 a small but significant change in the distribution of airliners in the major
world aviation regions occurred.
Asia emerged as the second biggest major aviation region, as its market share accounted for 27% of
total number of commercial units in service around the world. This represented a 2% point increase
compared to 2014.
Worldwide, narrow-bodies continue to be the most popular aircraft. This aircraft segment accounted
for 51% of total aircraft in operation in August 2015. These units are more popular in regions such as
Europe or Asia-Pacific, where they represented 57% and 58% of total units in service in each region,

15 328131/ITD/ITA/1/F February 2016 Annual Analysis of the EU Air Transport Market 2015
328131/ITD/ITA/1/F Annual Analyses of the EU Air Transport Market 2013
respectively. In 2014, the number of current-generation A320s and B737s in service rose,
respectively by 8% and 9%. For 2015, there were more than 6,000 Airbus A320s family jets in service
and more than 5,100 Boeing’s B737s in operation.
Widebodies represent 18% of the aircrafts in service around the world, but represent 49% of the fleets
of Middle-East airlines.
Airliners in service by world region (Jul 2015) vs Airliners in service by segment (Aug 2015)
Source: World Airline Census 2015, FlightGlobal Source: Mott MacDonald analysis of CAPA
Manufacturers
In 2014, Boeing delivered over $55 billion worth of airliners, some $14 billion more than Airbus.
Significant leads in Asia-Pacific drove the revenues. In all markets, besides Latin America, the
American manufacturer managed to generate more revenue than its European rival. In this region,
Airbus holds the advantage thanks largely to its strength in the narrow-body sector.
In terms of unit deliveries, the market share between Airbus and Boeing was fairly even in all other
markets with exception of North America. Here Boeing delivered almost twice as many aircraft as
Airbus. The successful launch of the new wide-body Boeing 777X undoubtedly gave Boeing the
boost it needed to overtake Airbus in the order books. Airbus, on the other hand, was forced to
endure a large order cancellation from UAE-based Emirates in 2013 following the airline’s decision to
review its fleet plans.
16 328131/ITD/ITA/1/F February 2016 Annual Analysis of the EU Air Transport Market 2015
328131/ITD/ITA/1/F Annual Analyses of the EU Air Transport Market 2013
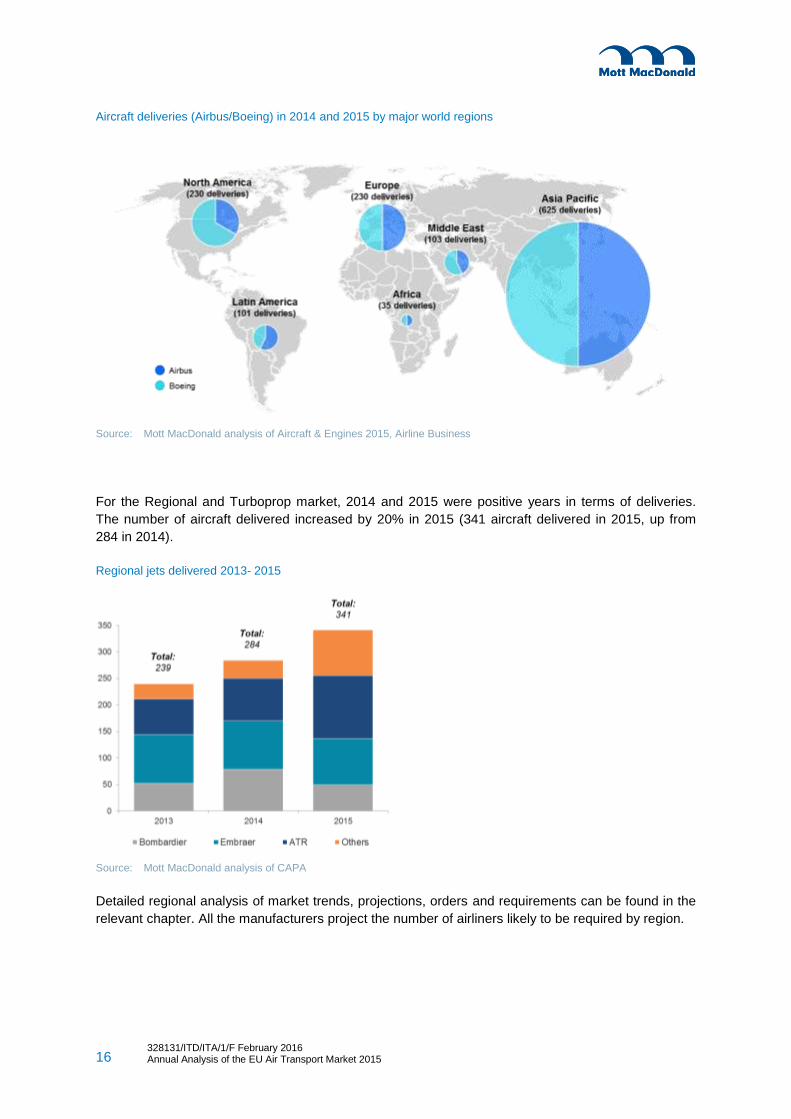
Aircraft deliveries (Airbus/Boeing) in 2014 and 2015 by major world regions
Source: Mott MacDonald analysis of Aircraft & Engines 2015, Airline Business
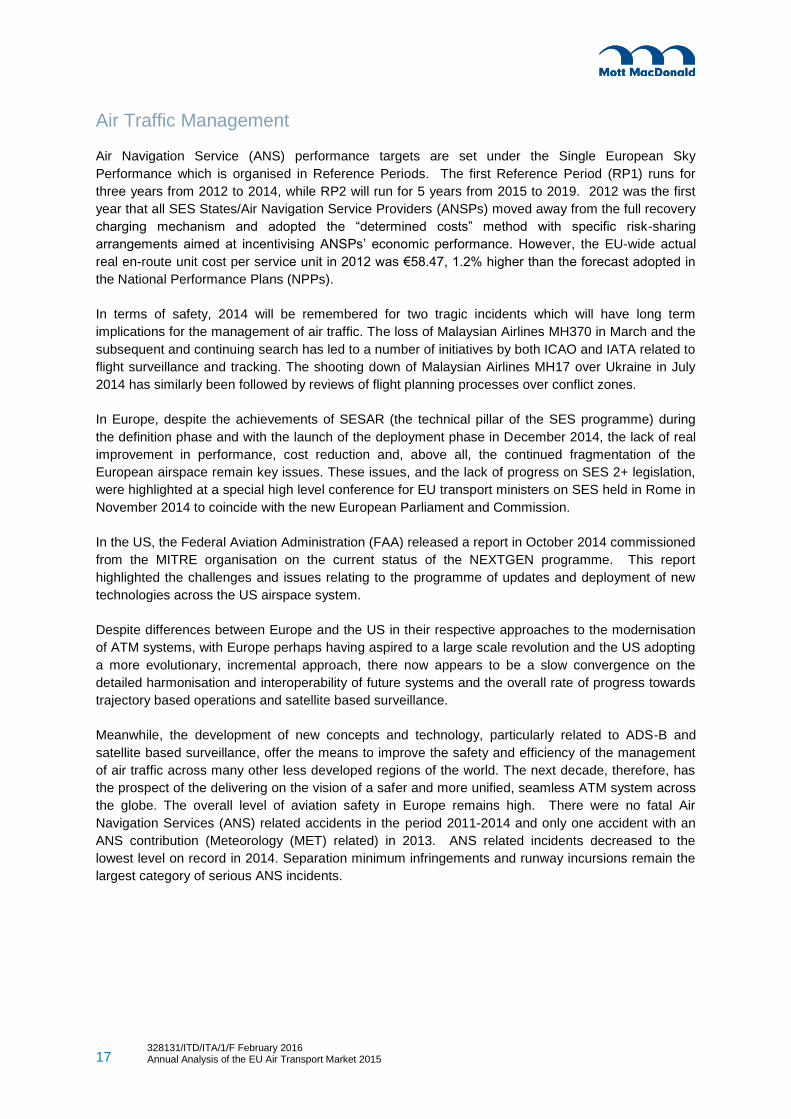
For the Regional and Turboprop market, 2014 and 2015 were positive years in terms of deliveries.
The number of aircraft delivered increased by 20% in 2015 (341 aircraft delivered in 2015, up from
284 in 2014).
Regional jets delivered 2013- 2015
Source: Mott MacDonald analysis of CAPA
Detailed regional analysis of market trends, projections, orders and requirements can be found in the
relevant chapter. All the manufacturers project the number of airliners likely to be required by region.
17 328131/ITD/ITA/1/F February 2016 Annual Analysis of the EU Air Transport Market 2015
328131/ITD/ITA/1/F Annual Analyses of the EU Air Transport Market 2013
Air Traffic Management
Air Navigation Service (ANS) performance targets are set under the Single European Sky
Performance which is organised in Reference Periods. The first Reference Period (RP1) runs for
three years from 2012 to 2014, while RP2 will run for 5 years from 2015 to 2019. 2012 was the first
year that all SES States/Air Navigation Service Providers (ANSPs) moved away from the full recovery
charging mechanism and adopted the “determined costs” method with specific risk-sharing
arrangements aimed at incentivising ANSPs’ economic performance. However, the EU-wide actual
real en-route unit cost per service unit in 2012 was €58.47, 1.2% higher than the forecast adopted in
the National Performance Plans (NPPs).
In terms of safety, 2014 will be remembered for two tragic incidents which will have long term
implications for the management of air traffic. The loss of Malaysian Airlines MH370 in March and the
subsequent and continuing search has led to a number of initiatives by both ICAO and IATA related to
flight surveillance and tracking. The shooting down of Malaysian Airlines MH17 over Ukraine in July
2014 has similarly been followed by reviews of flight planning processes over conflict zones.
In Europe, despite the achievements of SESAR (the technical pillar of the SES programme) during
the definition phase and with the launch of the deployment phase in December 2014, the lack of real
improvement in performance, cost reduction and, above all, the continued fragmentation of the
European airspace remain key issues. These issues, and the lack of progress on SES 2+ legislation,
were highlighted at a special high level conference for EU transport ministers on SES held in Rome in
November 2014 to coincide with the new European Parliament and Commission.
In the US, the Federal Aviation Administration (FAA) released a report in October 2014 commissioned
from the MITRE organisation on the current status of the NEXTGEN programme. This report
highlighted the challenges and issues relating to the programme of updates and deployment of new
technologies across the US airspace system.
Despite differences between Europe and the US in their respective approaches to the modernisation
of ATM systems, with Europe perhaps having aspired to a large scale revolution and the US adopting
a more evolutionary, incremental approach, there now appears to be a slow convergence on the
detailed harmonisation and interoperability of future systems and the overall rate of progress towards
trajectory based operations and satellite based surveillance.
Meanwhile, the development of new concepts and technology, particularly related to ADS-B and
satellite based surveillance, offer the means to improve the safety and efficiency of the management
of air traffic across many other less developed regions of the world. The next decade, therefore, has
the prospect of the delivering on the vision of a safer and more unified, seamless ATM system across
the globe. The overall level of aviation safety in Europe remains high. There were no fatal Air
Navigation Services (ANS) related accidents in the period 2011-2014 and only one accident with an
ANS contribution (Meteorology (MET) related) in 2013. ANS related incidents decreased to the
lowest level on record in 2014. Separation minimum infringements and runway incursions remain the
largest category of serious ANS incidents.

18 328131/ITD/ITA/1/F February 2016 Annual Analysis of the EU Air Transport Market 2015
328131/ITD/ITA/1/F Annual Analyses of the EU Air Transport Market 2013
Market and Competition Issues
Mergers – Acquisitions and State Aid Cases
In terms of regulatory and case-law development in terms of competition in the EU, the USA and third
world countries, the following are the developments that took place in 2014 and 2015.
On 8 August 2014, Alitalia CAI and Etihad Airways announced a transaction implementation
agreement under which Etihad will invest €560 million in Alitalia for a 49% stake. The transaction
consists of the creation of a new joint venture, New Alitalia, which will receive Alitalia CAI's aviation
business as a going concern. On 14 November 2014, the Commission approved the deal
On 14 July 2015, the European Commission approved the acquisition of Aer Lingus by International
Consolidated Airlines Group (IAG).
Recognizing that many regional airports are receiving at this time operating aid, the new Guidelines
contain an amnesty for operating aid granted before their entry into force, and organise a ten-year
transitional period to give airports enough time to adjust their business model, in order to ensure a
smooth transition to a fully competitive market.
After the transitional period running to March 2014, operating aid to an airport will no longer be
considered compatible (except aid for Services of General Economic Interests – SGEI).
Due to the precarious financial situation of many flag carriers, particularly in Central, Eastern and
South-Eastern Europe (CESE), several cases of approval of State aids were filed in 2013. The
underlying reason for this increase in State aid investigations against airlines is the difficulty for
carriers in the region to develop a sustainable business models due to limited investment possibilities,
strong competitors, divergent interests of the airlines and their governments. In the relevant chapter
an overview of the important investigation cases of Malév, CSA, LOT Polish, and airBaltic, Cyprus
Airways, Estonian Air and SAS is provided. Many of these cases were concluded in 2014 and 2015,
with the detailed summaries in the relevant chapter.
The new Guidelines for State aid to airports and airlines encourage Member States to set up airports
investment and operating schemes and start-up schemes. In order to reduce the administrative work
for both Member States and the Commission, the new Guidelines suggest that Member States notify
these aid schemes, rather than implementing individual decisions based on these schemes.
On the basis of the new Guidelines, the Commission analysed the financial relationships between
regional airports and the airlines in recent decisions, in order to verify if they received indirect benefits
that would constitute illegal State aid.
This is how in the cases of Aéroports de Pau, Nîmes and Angoulème, the Commission concluded that
Ryanair, and, in the case of Pau, Transavia, had received aid incompatible with EU rules.
On 23 January 2012, the Commission opened antitrust proceedings in relation to the establishment of
a profit/loss-sharing joint venture between Air France, KLM, Alitalia and Delta, which covers all
passenger air transport services operated by the parties on routes between Europe and North
America. On the basis of these commitments described in detail in the relevant chapter, the
Commission approved the joint venture on 15 May 2015.

19 328131/ITD/ITA/1/F February 2016 Annual Analysis of the EU Air Transport Market 2015
328131/ITD/ITA/1/F Annual Analyses of the EU Air Transport Market 2013
Partnership for Open and Fair Skies Agreement
On 28 January 2015, the three U.S. airlines (American Airlines, Delta Air Lines, and United Airlines)
and labour organizations announced the launch of a new coalition, the Partnership for Open & Fair
Skies, seeking to ensure a level playing field to international air travel. The Partnership presented a
white paper to the U.S. government, which details how alleged government subsidies to Qatar
Airways, Etihad Airways and Emirates Airline distort the competitive market in direct violation of U.S.
Open Skies policy. These claims have been refuted by the Gulf carriers involved, who deny subsidy.
Other air service agreements concluded by the middle east, Qatar, United Arab Emirates and Japan
are detailed in the relevant chapter as they relate to bilateral agreements and changes to competition.
Negotiation of an Open Sky Agreement with Asean
In a Joint Declaration adopted on 12 February 2014, at the end of an EU-ASEAN Aviation Summit,
the European Commission and the Association of Southeast Asian Nations (ASEAN) proposed to
take aviation cooperation to a new level by negotiating a comprehensive air transport agreement
between the EU and ASEAN.
At the meeting’s conclusion, Vice-President of the European Commission (EC) and Commissioner for
Transport Siim Kallas announced that he would propose to the European Commission to seek
authorisation from the Council of the European Union to start negotiations
An EU-ASEAN air transport agreement with unlimited capacity for both regions might be able to
recover or reduce the loss of traffic diverted towards the Gulf States and Turkey.
Impact of Growth on Air Services
Following the European Union and Israel signed a Euro-Mediterranean Aviation Agreement on 10
June 2013; the EU-Israel air transport market will be opened gradually so that by 2018, the market will
be fully open with no restrictions on the number of flights.
As can be seen in the figure below, the impact of the agreement is already taking shape, with more
carriers offering service to the Israeli market in 2015 compared with the last five years.
The Compound Annual Growth Rate (CAGR) from 2012 to 2015 was an increase of 9.54% for seating
capacity and 9.50% for departures.

20 328131/ITD/ITA/1/F February 2016 Annual Analysis of the EU Air Transport Market 2015
328131/ITD/ITA/1/F Annual Analyses of the EU Air Transport Market 2013
EU-Israel scheduled flights and seating capacity 2009-2015
Source: Mott MacDonald, Flight International based on Ascend/Flight Global
EU Competition Issues
On 20 February 2014, the Commission adopted the new Guidelines for State aid to airports and
airlines. These Guidelines, which entered into force on the 4th of April 2014, replace:
The Community Guidelines on financing airports and start-up aid to airlines departing from
regional airports ;
And the Communication on the application of Articles 92 and 93 of the EC Treaty and Article
61 of the EEA Agreement to State aids in the aviation sector.
These new Guidelines take into account the changing market, both for airports who, although still for
the most part in public hands, are faced with an ever more competitive environment, and for airlines
whose businesses have been profoundly disrupted over the past ten years by the widespread
introduction of the Low Cost model to the market.
Environment
Aircraft Noise
Aircraft noise remains the biggest issue affecting people living around airports. The need for airports
to be good neighbours is being used as leverage by regulators where airport expansion is an
ambition. Although technological and operational improvements continue, the rates of growth in air
traffic present ongoing challenges to maintaining environmental performance and safety.
On the 16th April 2014, the European Parliament formally adopted new roles on procedures for
imposing noise restrictions around airports in the EU. Regulation 598/2014 effectively implements the
ICAO principles known as the ‘Balanced Approach’ to managing noise. The ‘balanced approach’
concept of aircraft noise management comprises four main elements in assessing options to manage
noise:
0
1,500,000
3,000,000
4,500,000
6,000,000
0
10,000
20,000
30,000
40,000
2009 2010 2011 2012 2013 2014 2015 YTD
Seat
ing
Cap
acit
y
Nu
mb
er
of
Flig
hts
Year
Flights
Seating Capacity

21 328131/ITD/ITA/1/F February 2016 Annual Analysis of the EU Air Transport Market 2015
328131/ITD/ITA/1/F Annual Analyses of the EU Air Transport Market 2013
reduction of aircraft noise at source;
land-use planning and management measures;
noise abatement operational procedures; and,
operating restrictions.
In December 2014, the UK Government department with responsibility for noise management
published the results of the National Noise Attitude Survey 2012. The study was an update to a
survey carried out in 2000 and found that there had been a ‘strongly statistically significant increase’
in the proportion of respondents who were ‘bothered, annoyed or disturbed to some extent’ by the
most common types of noise, which includes aircraft, airport and airfield noise.
Emissions Trading - Aviation
Emissions from aviation generally fall into two categories, Climate Change and Air Quality. Climate
change is caused by CO2 and other greenhouse gas emissions, and has varied impacts globally. Air
quality deterioration is caused by a variety of emissions, in the case of aviation, primarily NOX and
particulate matter. These emissions are produced by aircraft, airport facilities and ground
transportation.
The efficiency and thus CO2 emissions of aircraft is an area where great improvements have been
made. Over time, older less efficient aircraft retire, and new, more efficient aircraft enter service,
driving the efficiency of the fleet upwards. During 2014 there have been a number of developments in
this area; four examples of these are as follows:
Airbus delivered its first A350 XWB to Qatar airlines on the 23 of December 2014. This
new design delivers an improvement in efficiency of approximately 25% over similar sized
aircraft.
Airbus’s E-Fan made its first public flight in April. The aircraft is a demonstration electric
aircraft, with the potential to run CO2 free. The program has the long term goal of
producing a hybrid regional airline.
Solar impulse 2 took its maiden flight. This aircraft is only powered by solar power and is
expected to circumnavigate the world in 2015.
Boeing delivered the first 787-9 to ANA on the 29th of July 2014. The 787-9 has a longer
range and can carry more passengers than the 787-8 which entered service in 2011; both
aircraft are 20% more efficient than aircraft of a similar size.
During 2014 air quality concerns have been raised in relation to airport expansion in the South East of
the UK. There are two airports looking for expansion, London Heathrow and London Gatwick.
Heathrow functions as the UK’s only hub airport. It is to the West of London near two major roads,
and a large number of residential receptors. Gatwick is located to the south, further from London, with
a quieter nearby road network and fewer residential receptors. The air quality around Heathrow is
worse than the air quality around Gatwick. As part of the debate around expansion, air quality has
been used to promote London Gatwick.
Fuel – Use of Alternative Sources
Aviation is predicted to increase in the future, and currently there are no technologies that could
replace the jet engine for long-haul journeys. As stated by the ICAO, during 2014 the largest
development in alternative aviation fuels has been the approval, by ASTM, of a process called
synthetic Iso-paraffin from Fermented Hydroprocessed Sugar (SIP), which was formerly known as
Direct-Sugar-to-Hydrocarbon. During 2014 there have also been a number of multi stakeholder

22 328131/ITD/ITA/1/F February 2016 Annual Analysis of the EU Air Transport Market 2015
328131/ITD/ITA/1/F Annual Analyses of the EU Air Transport Market 2013
initiatives. These include a group targeting alternative jet fuel for flights to the Tokyo Olympic Games
in 2020, an initiative setting up supply chains in the UAE, and an initiative at Oslo airport supplying
biofuel. Even with no routine production, there have been over 200 flights using alternative jet fuel
during 2014. The most important of these were a flight by Boeing’s 787 ecoDemonstrator, which flew
on a blend of 15% green diesel, which is widely used in ground transportation, and a 10 hour flight by
KLM using an airbus A330-200 using a 20% blend of alternative jet fuel produced from cooking oil.
Security and Safety
Safety
Overall, 2014 continued the worldwide trend of a reduction in accidents per million sectors at 1.92 per
million sectors, 14% lower than 2013 performance.
In 2014, commercial aviation safety and security issues were in the public spotlight more prominently
than previous years due to a number of high profile aviation accidents. As with previous years, the
majority of accidents resulting in aircraft damage are associated with runway incursions.
The disappearance of two commercial passenger flights has led to questions as to the industry’s
ability to track and communicate with aircraft across territories, land and sea. These aviation
accidents/incidents have highlighted challenges as to the regulation of airspace around the world. The
disappearance of Malaysian Airlines Flight MH370 over the Malacca Strait has raised the question
how, despite a modern aviation system and air traffic management capability, is it possible to ‘lose’ an
aircraft? In July 2014, Malaysian Airlines Flight MH17 was shot down over Ukraine, killing all on
board. At the time the Ukraine/Russia crisis was underway, with fighting from both sides in Eastern
Ukraine and it is widely accepted that the aircraft was mistaken for a military aircraft. Following the
Malaysian Airlines disappearance over the Malacca strait, the International Civil Aviation Organisation
(ICAO) has called for a global standard for the tracking of aircraft across airspace
The increase in air rage incidents and the safety risk this poses to passengers was evident in 2014, with
numerous high profile incidents being reported during the year. Causal factors have been highlighted as:
alcohol, tiredness, lack of legroom, and increased stress levels due to airport processing, particularly
security. Over recent years there has been a growing trend in the number of ‘air rage’ incidents and
‘disruptive’ passengers on board aircraft. Due to the confined space these occurrences can be a danger to
those on-board and generally result in disruption to flights.
In 2014, 19 fatal commercial accidents were reported worldwide causing the deaths of 671 passengers and
crew, including passenger and cargo scheduled and charter operations by jets and turboprop aircraft
greater than 5,700kg. In terms of the volume of fatalities, 2014 was an increase on 2013, with the number
of fatalities increasing 139%. In comparison, 2013 reported 26 fatal accidents and 281 passenger/crew
fatalities. The trend over the last 10 years in absolute terms is shown in the graph below.

23 328131/ITD/ITA/1/F February 2016 Annual Analysis of the EU Air Transport Market 2015
328131/ITD/ITA/1/F Annual Analyses of the EU Air Transport Market 2013
World Commercial Airline Fatal Accidents and Fatalities 2005-2014
Source: Mott MacDonald, Flight International based on Ascend/Flight Global.
It is noteworthy from above chart that there were 19 fatal commercial airline accidents in 2014 which
was the lowest total in the last ten years, though fatalities from these 19 accidents constituted 671
however it should be noted that these figures do not include the shooting down of the Malaysian
Airlines Boeing 777 over Ukraine as this is considered as ‘War’ Risk.
When considering the increase in aviation traffic across the globe and the accident rate per 10 million
flights an upward trend in flight safety is witnessed with +70 fatal accidents in 1994 to under 20 fatal
accidents in 2014 (Source: EASA Annual Safety Review) as a result of regulatory, technology,
process and training developments.
Congested Airspace
As the demand for air travel increases airspace is becoming congested with regions of large growth,
such as the Persian Gulf, facing capacity shortages from years of rapid growth in the sector.
Congestion in airspace impacts safety, can cause delays, and impedes growth plans that the
airlines/airports.
Overall, national and regional air space will become more congested as the demand for air travel
increases. Countries and regions are increasingly likely to be required to deliver integrated airspace
management systems so as to ensure continued airspace safety without the risk of pilot or controller
overload.

24 328131/ITD/ITA/1/F February 2016 Annual Analysis of the EU Air Transport Market 2015
328131/ITD/ITA/1/F Annual Analyses of the EU Air Transport Market 2013
Montreal Protocol
IATA launched the Montreal Protocol in 2014 which has set out to make important changes to the
original Tokyo Convention that came into force in 1969. The Tokyo Convention governs offences and
other acts that occur on board aircraft inflight. The Montreal Protocol extends the jurisdiction over the
offence to the destination country of the flight in addition to the country of aircraft registration. This
closes a loophole which allowed many serious offences to escape legal action.
A total of 22 states will be required to ratify the protocol before it can be implemented.
Consumer Rights – Air Passengers
The Impact of the Sturgeon / Nelson Rulings
The Sturgeon judgment suggests that although Regulation (EC) 261/2004 did not explicitly give any
right to fixed-rate compensation to passengers whose flights are delayed, the Regulation should be
interpreted consistently with the principle in EU law of equal treatment. The Nelson judgement on the
other hand reinforces that passengers with a delay of up to three hours or more would be entitled to
the same right to compensation as passengers whose flights had been cancelled, potentially leading to
many more claims against carriers.
In the UK the interpretation of Regulation (EC) 261/2004 was not able to be legally implemented until
September 2013, and was applied successfully for the first time a few weeks later when a couple was
awarded £680 jointly after a 22 hour delay to a Thomas Cook flight from Tenerife in 2009. The
European Court of Justice officially defined the arrival time of a flight as the minute one of the doors of
the aircraft is opened, given that previously, regulation 261/2004 did not define a specific “arrival
time”. During the first year of the rulings implementation, the volume of flight delay claims received by
the CAA exceeded 23,000, a significant increase from 6,028 claims in the same period the previous
year, and between October 2014 and January 2015, the CAA received 2,500 complaints. In other EU
member states however the adoption of the rulings has been due to the fact that individual member
states are free to regulate how far back a claim can be made by a consumer. Airlines are trying to
counteract this by referencing the Montreal and Warsaw conventions, which imply that there is a two
year limit on the claim date. Another area of confusion relates to the understanding of what
constitutes ‘extraordinary circumstances.’ A draft document prepared by the National Enforcement
Bodies and posted on the EC’s website attempts to clarify the meaning of these extraordinary
circumstances. The airlines have to prove beyond reasonable doubt that flight delays constituted an
extraordinary circumstance in order to rebuke any consumer claim.
Some groups have identified that the impact of the rulings and subsequent regulation has led to
safety concerns. Given airlines are now fully aware that they are liable for large pay-outs if
passengers experience extensive delays or cancellations due to a technical fault, there exists a
question mark over whether some carriers may choose to operate aircraft with seemingly minor faults
to avoid any claims being made against them. Moreover, IATA states that not allowing the majority of
technical problems to be considered an “extraordinary circumstance” does not sufficiently prioritise
safety above all other factors.
Airline Insolvency – Standalone Tickets
Passenger awareness on airline insolvency protection is generally poor, as revealed by a survey
conducted by the Commission, and although some financial products such as travel insurance, credit
cards and airline rescue fares are now available across some European member states, they all vary

25 328131/ITD/ITA/1/F February 2016 Annual Analysis of the EU Air Transport Market 2015
328131/ITD/ITA/1/F Annual Analyses of the EU Air Transport Market 2013
in length and level of financial protection. As a result of this the Commission issued a Communication
encouraging the adoption of a number of measures to strengthen the licensing oversight of EU air
carriers under Regulation (EC) 1008/2008.
The Commission addressed issues such as:
the monitoring of the financial position of air carriers;
best practice and information sharing between the regulatory authorities of member states;
the formalisation and promotion of existing voluntary agreements on rescue fares;
the wider and more systematic availability of SAFI or similar insurance products across the
EU;
the adoption of a service level agreement; and,
the availability of information about credit card refund schemes or similar products in a
member state to allow passengers to protect themselves against the risk of insolvency under
national law.