
Announcements - University of California, Irvinejutts/8/Lecture27.pdf · Announcements: •Final...
23
Announcements: • Final quiz begins after class today and ends on Monday at noon. • For Monday discussion, teams will discuss results from articles in medical journals. Article summaries are posted on course website (in daily calendar). Homework (due Mon, Nov 29): Chapter 15: #6, #26bd, #35
Transcript of Announcements - University of California, Irvinejutts/8/Lecture27.pdf · Announcements: •Final...

Announcements:• Final quiz begins after class today and ends on q g y
Monday at noon.• For Monday discussion, teams will discuss results y ,
from articles in medical journals. Article summaries are posted on course website (in daily calendar).
Homework (due Mon, Nov 29): Chapter 15: #6, #26bd, #35

Chi-Square Test for
G d f FiSection 15.3
Goodness-of-Fit

Research QuestionFor a categorical variable with k categories, are the population proportions (or p p p p (probabilities) falling into each of the k categories as specified? Examples:
•Are digits 0 to 9 equally likely to be drawn in lottery?
g p
•Are digits 0 to 9 equally likely to be drawn in lottery?
•In genetics, is offspring ratio 9:3:3:1, as expected by M d l’ l ?Mendel’s laws?
•Is death from sudden infant death syndrome equally
3
likely in all 4 seasons?
15.3 Testing Hypotheses about One Categorical Variable
Situation: Similar to binomial, but there can be more than two possible outcomes. Called multinomial.
•Measure a single categorical variable on each person or trial.
•Each person or trial falls into one of k mutually exclusive categories.
•Null hypothesis specifies the probabilities of falling into each of the k categories.
•Alternative hypothesis is that those are not all
4
correct.
Example 15.8 Pennsylvania Daily Number
State lottery game: Three-digit number made by drawing a digit between 0 and 9 from each of threedrawing a digit between 0 and 9 from each of three different containers.
’ d f h fLet’s examine draws from the first container.If numbers randomly selected, each value would be equally likely to occur So k = 10 and on each drawequally likely to occur. So, k = 10 and on each draw there is probability 1/10 of getting each digit (0, ..., 9)
H0: p = 1/10 for each of the 10 possible digitsH : Not all probabilities are 1/10
5
Ha: Not all probabilities are 1/10.

Use same 5 steps of hypothesis testing Called chi-square goodness-of-fit testStep 1: Determine the null and alternative hypotheses.
H0: The probabilities for k categories are p1, p2, . . . , pk.
H : Not all probabilities specified in H0 are correctHa: Not all probabilities specified in H0 are correct.
Note: Probabilities in the null hypothesis must sum to 1.yp
Pennsylvania Lottery Example:
H0: p1 = p2 = ...= p10 = 1/10
Ha: The 10 digits are not all equally likely.
6
Ha: The 10 digits are not all equally likely.

Goodness of Fit (GOF) Test (continued)Step 2: Verify necessary data conditions, and if met, summarize the data into an appropriate test statistic.
Data condition needed: At least 80% of the expected counts are greater than 5 and none are less than 1. Test
i istatistic:(Observed – Expected)2
Expected 2
where the expected count for the ith category is computed as npi.
7

Example 15.8 Pennsylvania Daily Number
Data: n = 500 days between 7/19/99 and 11/29/00
8
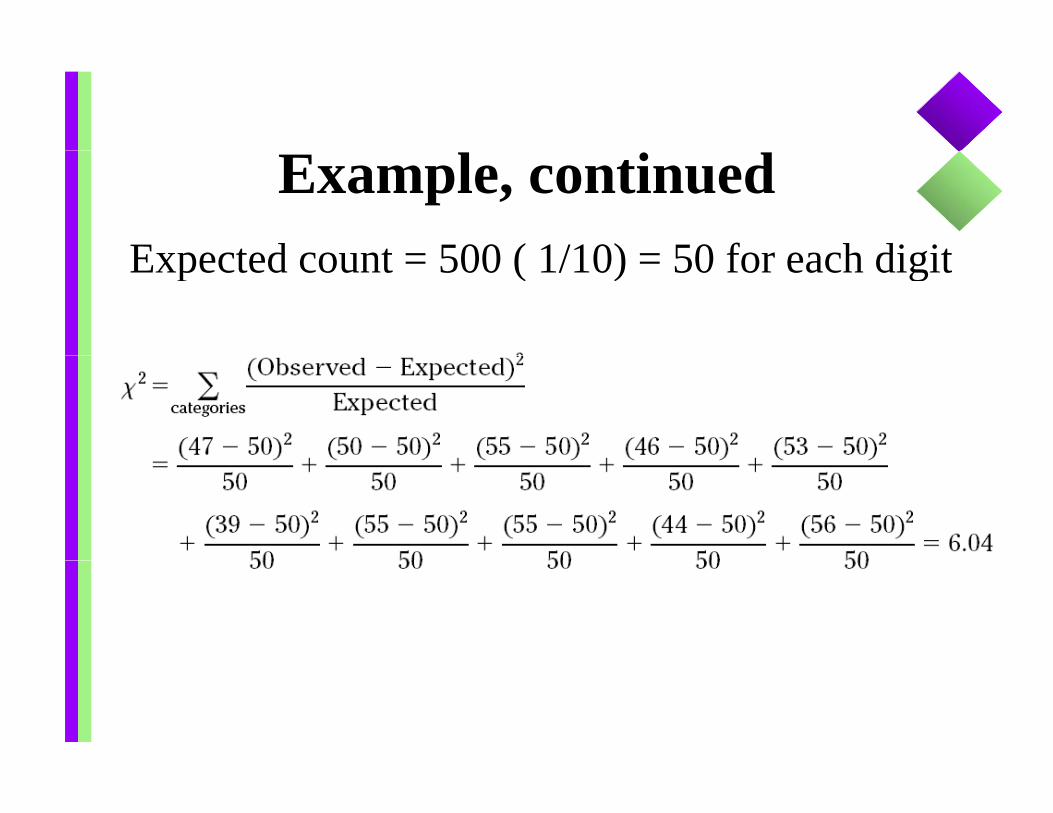
Example, continuedE pected co nt 500 ( 1/10) 50 for each digitExpected count = 500 ( 1/10) = 50 for each digit

Step 3: p-value of Chi-square TestLarge test statistic => evidence that values in null are not correct (observed counts don’t match (expected counts). p-value = probability the chi-square test statistic couldp value probability the chi square test statistic could have been as large or larger if the null hypothesis were true.
Chi-square probability distribution used to find p-value.
D f f d df k 1Degrees of freedom: df = k – 1
This is because we are free to specify k – 1 totals, then
10
the last one is determined.

Chi-square Distributions
• Skewed to the right distributions.• Minimum value is 0.• Indexed by the degrees of freedom.
Note: Mean of the distribution = degrees of freedom.g
11

Finding the p-value from Table A.5, p. 732:
Look in the corresponding “df” row of Table A.5. Scan across until you find where the statistic falls.
• If value of statistic falls between two table entries, p value is between values of p (column headings)
y
p-value is between values of p (column headings) for these two entries.
• If value of statistic is larger than entry ing yrightmost column (labeled p = 0.001), p-value is less than 0.001 (written as p < 0.001).
• If value of statistic is smaller than entry in leftmost column (labeled p = 0.50), p value is greater than 0 50 (written as p > 0 50)
12
p-value is greater than 0.50 (written as p > 0.50).

Step 4: Making a Decision
Large test statistic => small p-value => evidence that the proportions are not as specified
Two equivalent rules:
=> evidence that the proportions are not as specified.
Reject H0 when …• p-value 0.05 p va ue 0.05• Chi-square statistic is greater than the entry in
the 0.05 column of Table A.5 (the critical value).the 0.05 column of Table A.5 (the critical value). That defines the rejection region.
13
Example 15.8 Daily Number (cont)
Chi-square goodness of fit statistic:
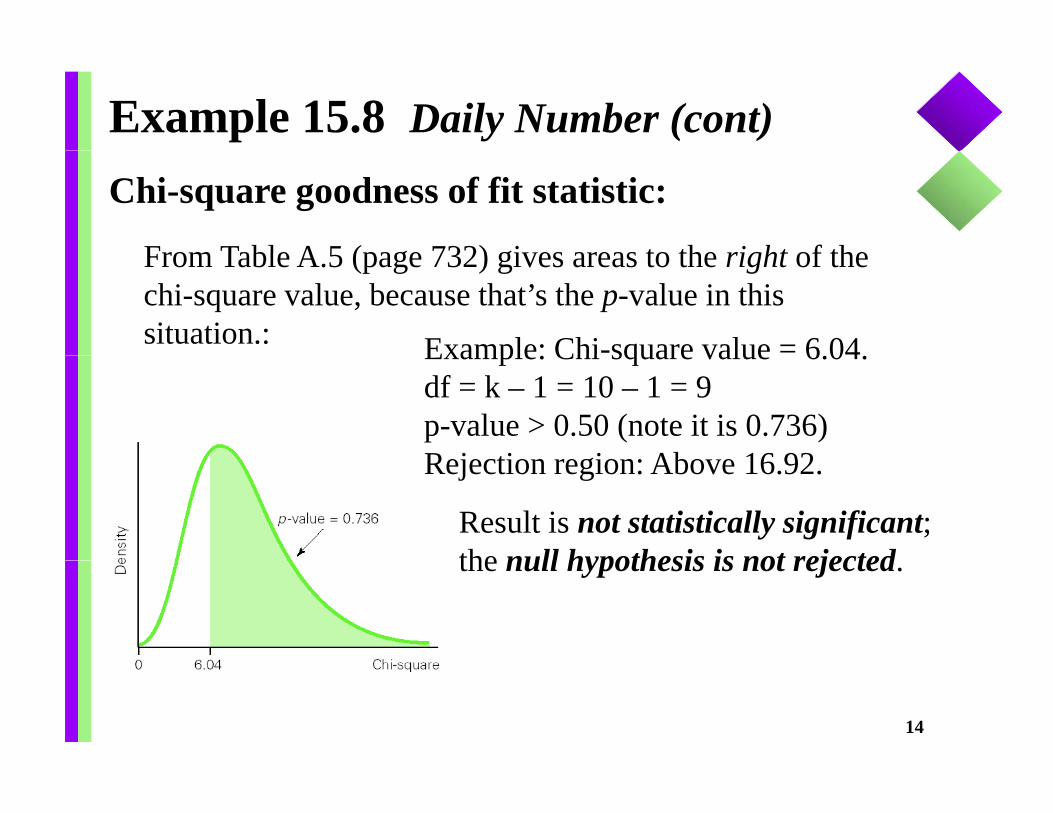
From Table A 5 (page 732) gives areas to the right of theFrom Table A.5 (page 732) gives areas to the right of the chi-square value, because that’s the p-value in this situation.: Example: Chi-square value = 6 04Example: Chi square value 6.04.
df = k – 1 = 10 – 1 = 9 p-value > 0.50 (note it is 0.736)R j ti i Ab 16 92
Result is not statistically significant; the null hypothesis is not rejected
Rejection region: Above 16.92.
the null hypothesis is not rejected.
14

Step 5: Report the Conclusion in Context
C l i P l i l tt di it d tConclusion: Pennsylvania lottery digits drawn are not statistically different from what’s expected by chance.
15

New Example: Is Sudden Infant Death Syndrome (SIDS) Seasonal?Syndrome (SIDS) Seasonal?
Data from King County WashingtonData from King County, WashingtonDefine p1, p2, p3, p4 to be the proportion of deaths from SIDS that happen in the winter, spring, summer and fall. pp , p g,They are defined so that the seasons have about equal days.
Step 1: Determine the null and alternative hypotheses.S ep : ete mine the null and alte native hypotheses.
H0: p1 = ¼, p2 = ¼, p3 = ¼, p4 = ¼
H N ll b bili i ifi d i HHa: Not all probabilities specified in H0 are correct.
Note: Probabilities in the null hypothesis must sum to 116
Note: Probabilities in the null hypothesis must sum to 1.

Step 2: Verify necessary data conditions, and if met, summarize the data into an appropriate test statistic.
Data condition needed: At least 80% of the expected counts are greater than 5 and none are less than 1. Test
i istatistic:(Observed – Expected)2
Expected 2
where the expected count for the ith category is computed as npi.Example: Counts for the 4 seasons were 78, 71, 87, 86Are these different enough to conclude a difference exists in
17
Are these different enough to conclude a difference exists in the population?

Example, continuedTotal 78 + 71 + 87 + 86 322Total n = 78 + 71 + 87 + 86 = 322Expected count = 322 ( 1/4) = 80.5 for each seasonseason.
2 2 2 22 (78 80.5) (71 80.5) (87 80.5) (86 80.5)
80.5 80.5 80.5 80.5
= 2.10

Step 3: Finding the p-valueDegrees of freedom 4 1 3Degrees of freedom = 4 – 1 = 3.
From Table A 5 smallest entr is 2 37 the al eFrom Table A.5, smallest entry is 2.37, the value with .50 below it. So, for our test statistic of 2 10 all we can say is p value > 502.10 all we can say is p-value > .50.
Rejection region approach:Rejection region approach:For df = 3, reject the null hypothesis if the test statistic is greater than 7 81 (Ours is not )statistic is greater than 7.81. (Ours is not.)

Step 4: Making a Decision
Large test statistic => small p-value => evidence that the proportions are not as specified
Two equivalent rules: => evidence that the proportions are not as specified.
Reject H0 when …• p-value 0.05; in our example it is.• Chi-square statistic is greater than the entry in
the 0.05 column of Table A.5 (the critical value). Th t d fi th j ti i I lThat defines the rejection region. In our example, the test statistic is not in the rejection region.
• So we do not reject the null hypothesis20
• So we do not reject the null hypothesis.
Step 5: Report the Conclusion in Context
C l i S dd i f t d th d tiConclusion: Sudden infant death syndrome proportions across seasons are not statistically different from what’s expected by chance (i e all seasons beingwhat s expected by chance (i.e. all seasons being equal).
21

Use of chi-square test in geneticsq gBased on Mendel’s laws, expect certain ratios of
phenotypes Can be tested using chi-squarephenotypes. Can be tested using chi square goodness-of-fit tests.
Example: In a dihybrid cross (AaBb x AaBb), theExample: In a dihybrid cross (AaBb x AaBb), the expected proportions of 4 phenotypes are 9:3:3:1.
Data from classic experiment with Starchy/sugary and p y g yGreen/white seedlings, progeny of 3839 self-fertilized heterozygotes (Starchy/green, Starchy/white, Sugary/green, Sugary/white):
1997, 906, 904, 32.Null hypothesis probabilities are 9/16, 3/16, 3/16, 1/16
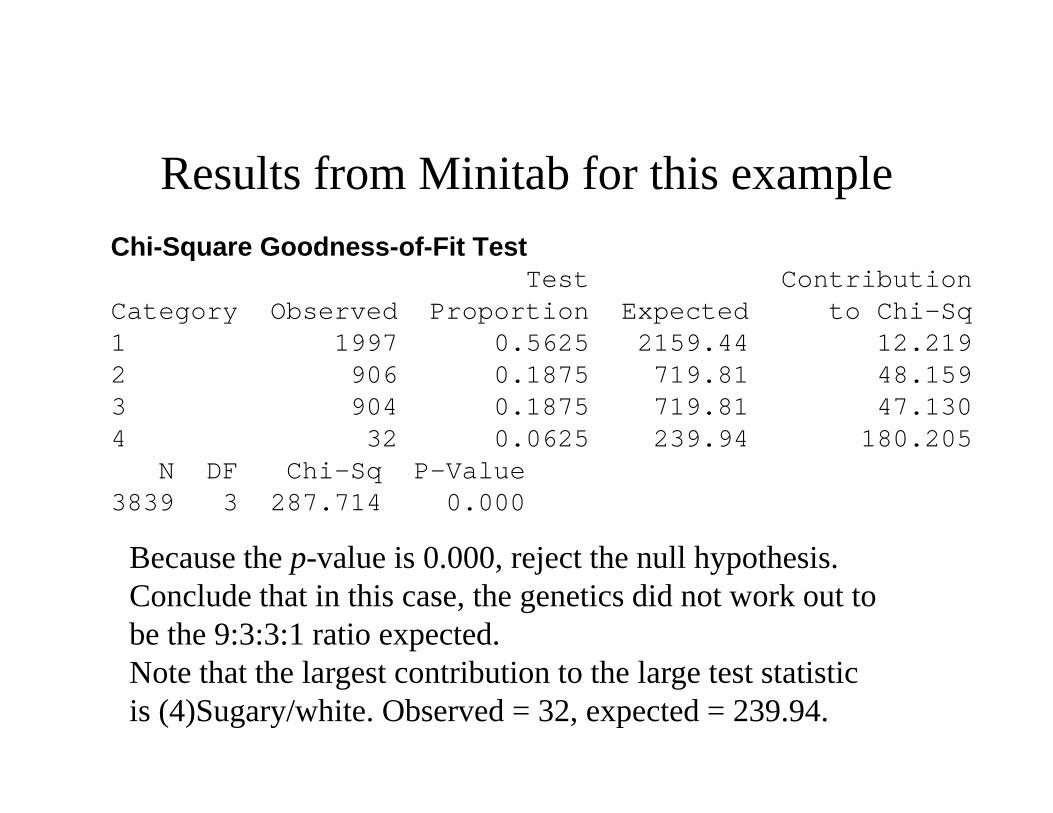
Results from Minitab for this exampleChi-Square Goodness-of-Fit TestChi Square Goodness of Fit Test
Test ContributionCategory Observed Proportion Expected to Chi-Sq1 1997 0.5625 2159.44 12.2192 906 0.1875 719.81 48.1593 904 0.1875 719.81 47.1304 32 0.0625 239.94 180.205
N DF Chi-Sq P-Value3839 3 287.714 0.000
Because the p-value is 0 000 reject the null hypothesisBecause the p-value is 0.000, reject the null hypothesis. Conclude that in this case, the genetics did not work out to be the 9:3:3:1 ratio expected.N h h l ib i h l i iNote that the largest contribution to the large test statistic is (4)Sugary/white. Observed = 32, expected = 239.94.


