Announcements Project 2 more signup slots questions Picture taking at end of class.
40
Announcements • Project 2 • more signup slots • questions • Picture taking at end of class
-
date post
20-Dec-2015 -
Category
Documents
-
view
213 -
download
0
Transcript of Announcements Project 2 more signup slots questions Picture taking at end of class.

Announcements• Project 2
• more signup slots
• questions
• Picture taking at end of class

Image Segmentation
Today’s Readings• Forsyth chapter 14, 16

From images to objects
What Defines an Object?• Subjective problem, but has been well-studied• Gestalt Laws seek to formalize this
– proximity, similarity, continuation, closure, common fate
– see notes by Steve Joordens, U. Toronto

Image SegmentationWe will consider different methods
Already covered:• Intelligent Scissors (contour-based)• Hough transform (model-based)
This week:• K-means clustering (color-based)• EM• Mean-shift• Normalized Cuts (region-based)
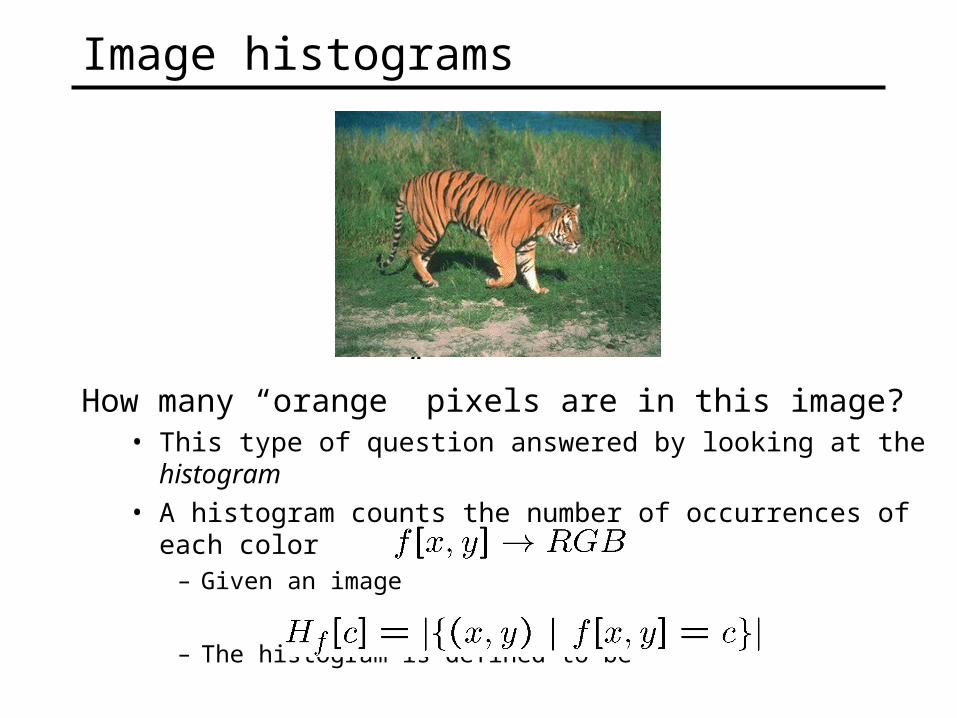
Image histograms
How many “orange” pixels are in this image?• This type of question answered by looking at the histogram• A histogram counts the number of occurrences of each color
– Given an image
– The histogram is defined to be

What do histograms look like?
How Many Modes Are There?• Easy to see, hard to compute
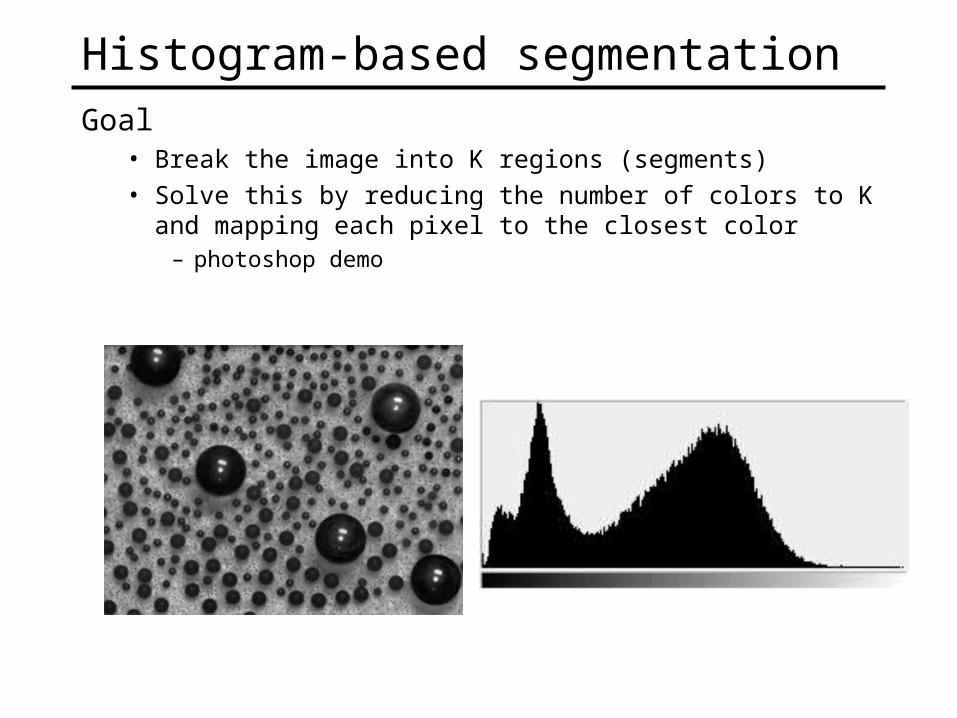
Histogram-based segmentationGoal
• Break the image into K regions (segments)• Solve this by reducing the number of colors to K and
mapping each pixel to the closest color – photoshop demo

Histogram-based segmentationGoal
• Break the image into K regions (segments)• Solve this by reducing the number of colors to K and
mapping each pixel to the closest color – photoshop demo
Here’s what it looks like if we use two colors

ClusteringHow to choose the representative colors?
• This is a clustering problem!
Objective• Each point should be as close as possible to a cluster center
– Minimize sum squared distance of each point to closest center
R
G
R
G

Break it down into subproblemsSuppose I tell you the cluster centers ci
• Q: how to determine which points to associate with each ci?
• A: for each point p, choose closest ci
Suppose I tell you the points in each cluster• Q: how to determine the cluster centers?• A: choose ci to be the mean of all points in the cluster
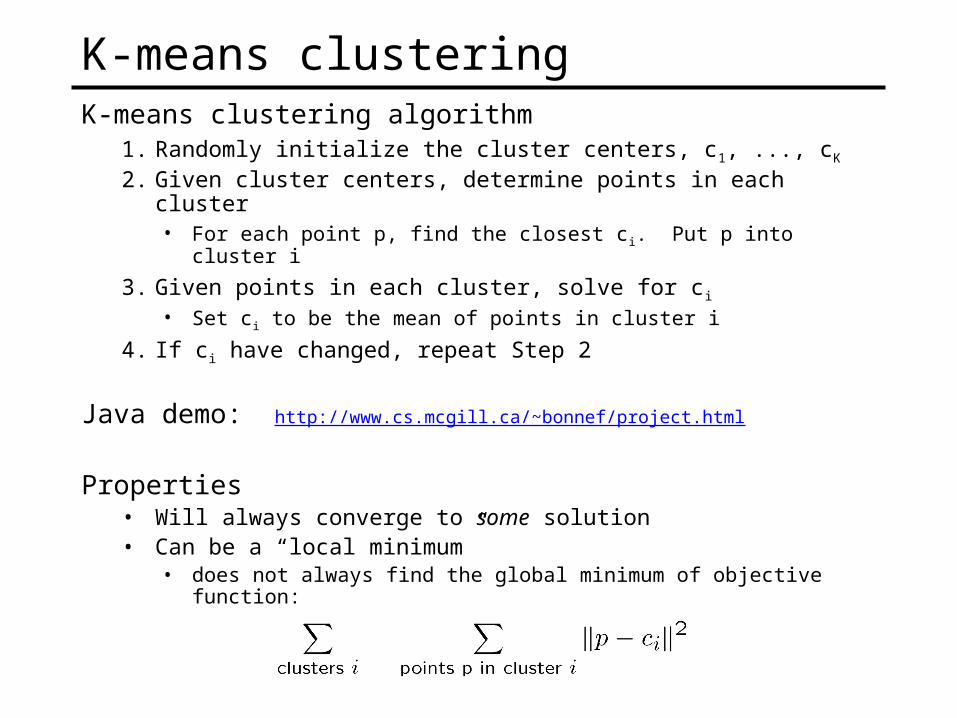
K-means clusteringK-means clustering algorithm
1. Randomly initialize the cluster centers, c1, ..., cK
2. Given cluster centers, determine points in each cluster• For each point p, find the closest ci. Put p into cluster i
3. Given points in each cluster, solve for ci
• Set ci to be the mean of points in cluster i
4. If ci have changed, repeat Step 2
Java demo: http://www.cs.mcgill.ca/~bonnef/project.html
Properties• Will always converge to some solution• Can be a “local minimum”
• does not always find the global minimum of objective function:

Probabilistic clusteringBasic questions
• what’s the probability that a point x is in cluster m?• what’s the shape of each cluster?
K-means doesn’t answer these questions
Basic idea• instead of treating the data as a bunch of points, assume
that they are all generated by sampling a continuous function
• This function is called a generative model – defined by a vector of parameters θ

Mixture of Gaussians
One generative model is a mixture of Gaussians (MOG)
• K Gaussian blobs with means μb covariance matrices Vb, dimension d
– blob b defined by:
• blob b is selected with probability • the likelihood of observing x is a weighted mixture of Gaussians
• where

Expectation maximization (EM)
Goal• find blob parameters θ that maximize the likelihood function:
Approach:1. E step: given current guess of blobs, compute ownership of each point
2. M step: given ownership probabilities, update blobs to maximize likelihood function
3. repeat until convergence

E-step• compute probability that point x is in blob i, given current guess of θ
M-step• compute probability that blob b is selected
• mean of blob b
• covariance of blob b
EM details
N data points

EM demos
http://www.cs.ucsd.edu/users/ibayrakt/java/em/
http://www.dreier.cc/index.php?topic=downloads&sub=em

Applications of EMTurns out this is useful for all sorts of problems
• any clustering problem• any model estimation problem• missing data problems• finding outliers• segmentation problems
– segmentation based on color
– segmentation based on motion
– foreground/background separation
• ...

Problems with EMLocal minima
Need to know number of segments
Need to choose generative model

Finding Modes in a Histogram
How Many Modes Are There?• Easy to see, hard to compute
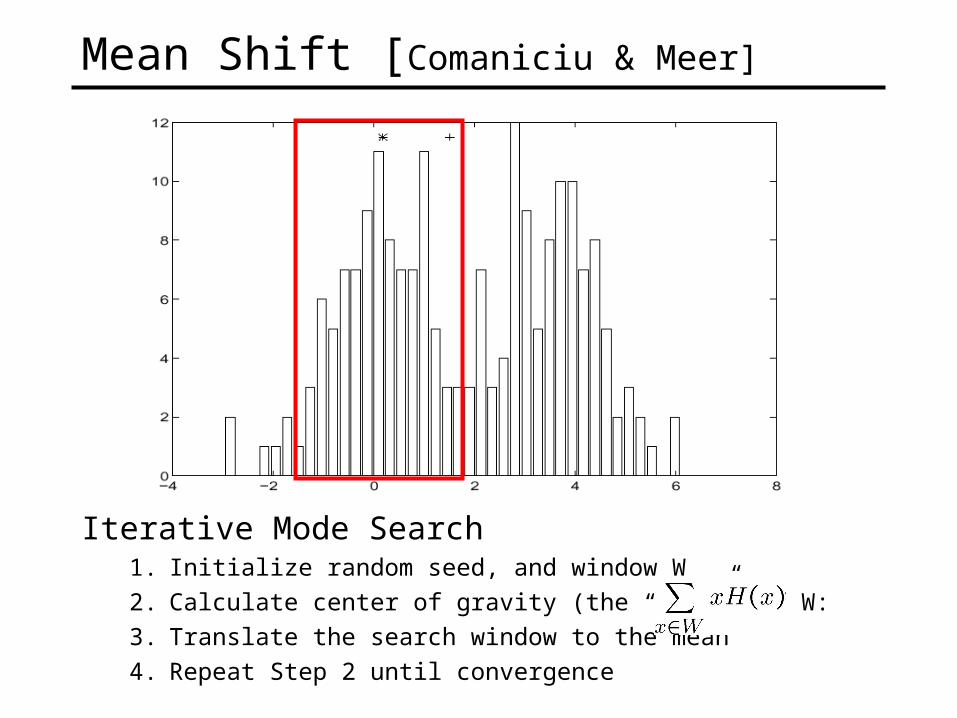
Mean Shift [Comaniciu & Meer]
Iterative Mode Search1. Initialize random seed, and window W
2. Calculate center of gravity (the “mean”) of W:
3. Translate the search window to the mean
4. Repeat Step 2 until convergence
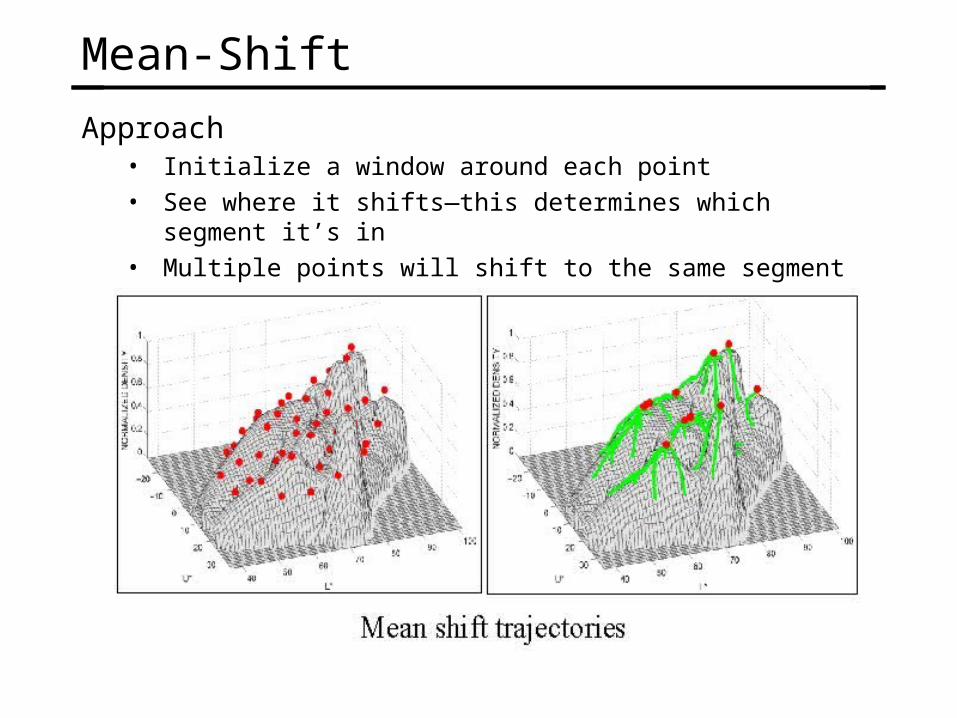
Mean-Shift
Approach• Initialize a window around each point• See where it shifts—this determines which segment it’s in• Multiple points will shift to the same segment

Mean-shift for image segmentationUseful to take into account spatial information
• instead of (R, G, B), run in (R, G, B, x, y) space• D. Comaniciu, P. Meer, Mean shift analysis and applications, 7th
International Conference on Computer Vision, Kerkyra, Greece, September 1999, 1197-1203.
– http://www.caip.rutgers.edu/riul/research/papers/pdf/spatmsft.pdf
More Examples: http://www.caip.rutgers.edu/~comanici/segm_images.html
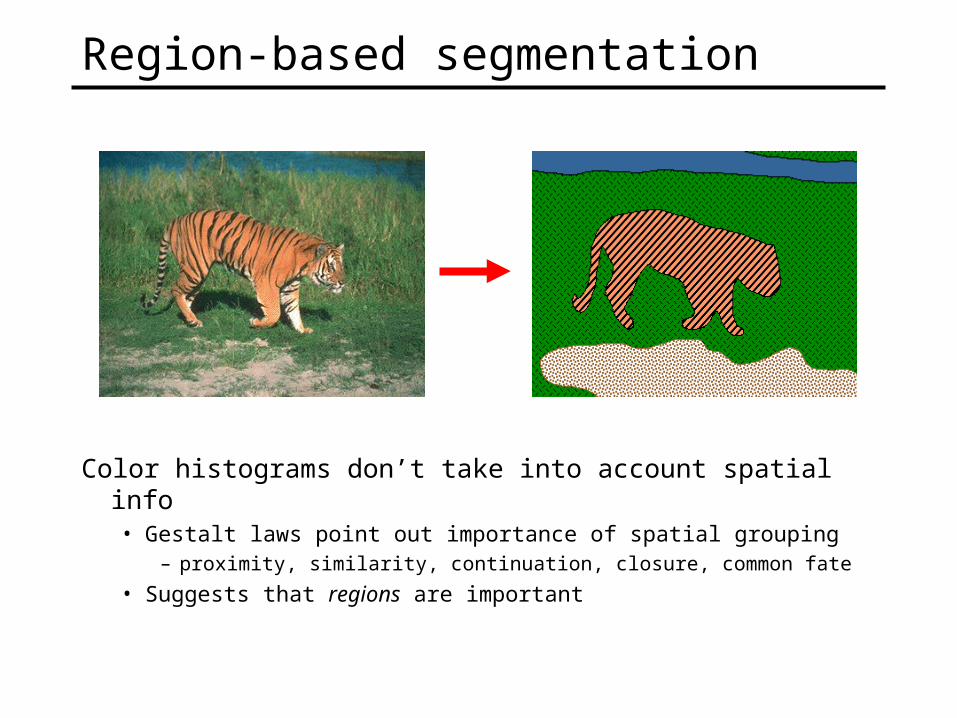
Region-based segmentation
Color histograms don’t take into account spatial info• Gestalt laws point out importance of spatial grouping
– proximity, similarity, continuation, closure, common fate
• Suggests that regions are important

q
Images as graphs
Fully-connected graph• node for every pixel• link between every pair of pixels, p,q
• cost cpq for each link
– cpq measures similarity
» similarity is inversely proportional to difference in color and position» this is different than the costs for intelligent scissors
p
Cpq
c

Segmentation by Graph Cuts
Break Graph into Segments• Delete links that cross between segments• Easiest to break links that have high cost
– similar pixels should be in the same segments
– dissimilar pixels should be in different segments
w
A B C

Cuts in a graph
Link Cut• set of links whose removal makes a graph disconnected• cost of a cut:
A B
Find minimum cut• gives you a segmentation• fast algorithms exist for doing this

But min cut is not always the best cut...

Cuts in a graph
A B
Normalized Cut• a cut penalizes large segments• fix by normalizing for size of segments
• volume(A) = sum of costs of all edges that touch A

Interpretation as a Dynamical System
Treat the links as springs and shake the system• elasticity proportional to cost• vibration “modes” correspond to segments

Interpretation as a Dynamical System
Treat the links as springs and shake the system• elasticity proportional to cost• vibration “modes” correspond to segments

Color Image Segmentation

Normalize Cut in Matrix Form
); D(i,j) = 0,(),( :i node from costsof sum theis
;),( :matrix cost theis ,
jiii
cji
j
ji
WDD
WW
Can write normalized cut as:
.01},,1{ with ,),(
DyyDyy
W)y(DyT
TT
i bBANcut
• Solution given by “generalized” eigenvalue problem:
• Solved by converting to standard eigenvalue problem:
• optimal solution corresponds to second smallest eigenvector• for more details, see
– J. Shi and J. Malik, Normalized Cuts and Image Segmentation, IEEE Conf. Computer Vision and Pattern Recognition(CVPR), 1997
– http://www.cs.washington.edu/education/courses/455/03wi/readings/Ncut.pdf
DyW)y(D λ
yDzzzW)D(DD 2
1
2
1
2
1
whereλ ,

Cleaning up the resultProblem:
• Histogram-based segmentation can produce messy regions– segments do not have to be connected
– may contain holes
How can these be fixed?
photoshop demo

Dilation operator:
0 0 0 0 0 0 0 0 0 0
0 0 0 0 0 0 0 0 0 0
0 0 0 1 1 1 1 1 0 0
0 0 0 1 1 1 1 1 0 0
0 0 0 1 1 1 1 1 0 0
0 0 0 1 0 1 1 1 0 0
0 0 0 1 1 1 1 1 0 0
0 0 0 0 0 0 0 0 0 0
0 0 1 0 0 0 0 0 0 0
0 0 0 0 0 0 0 0 0 0
1 1 1
1 1 1
1 1 1
Dilation: does H “overlap” F around [x,y]?• G[x,y] = 1 if H[u,v] and F[x+u-1,y+v-1] are both 1 somewhere
0 otherwise
• Written

Dilation operatorDemo
• http://www.cs.bris.ac.uk/~majid/mengine/morph.html

Erosion: is H “contained in” F around [x,y]• G[x,y] = 1 if F[x+u-1,y+v-1] is 1 everywhere that H[u,v] is 1
0 otherwise
• Written
Erosion operator:
0 0 0 0 0 0 0 0 0 0
0 0 0 0 0 0 0 0 0 0
0 0 0 1 1 1 1 1 0 0
0 0 0 1 1 1 1 1 0 0
0 0 0 1 1 1 1 1 0 0
0 0 0 1 0 1 1 1 0 0
0 0 0 1 1 1 1 1 0 0
0 0 0 0 0 0 0 0 0 0
0 0 1 0 0 0 0 0 0 0
0 0 0 0 0 0 0 0 0 0
1 1 1
1 1 1
1 1 1
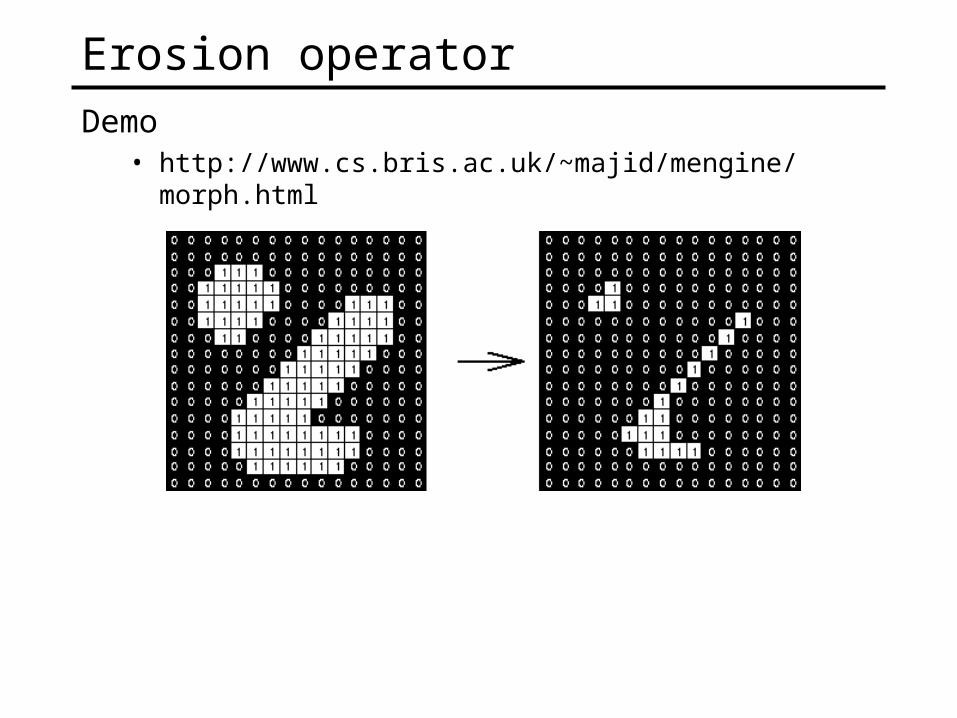
Erosion operatorDemo
• http://www.cs.bris.ac.uk/~majid/mengine/morph.html

Nested dilations and erosionsWhat does this operation do?
• this is called a closing operation
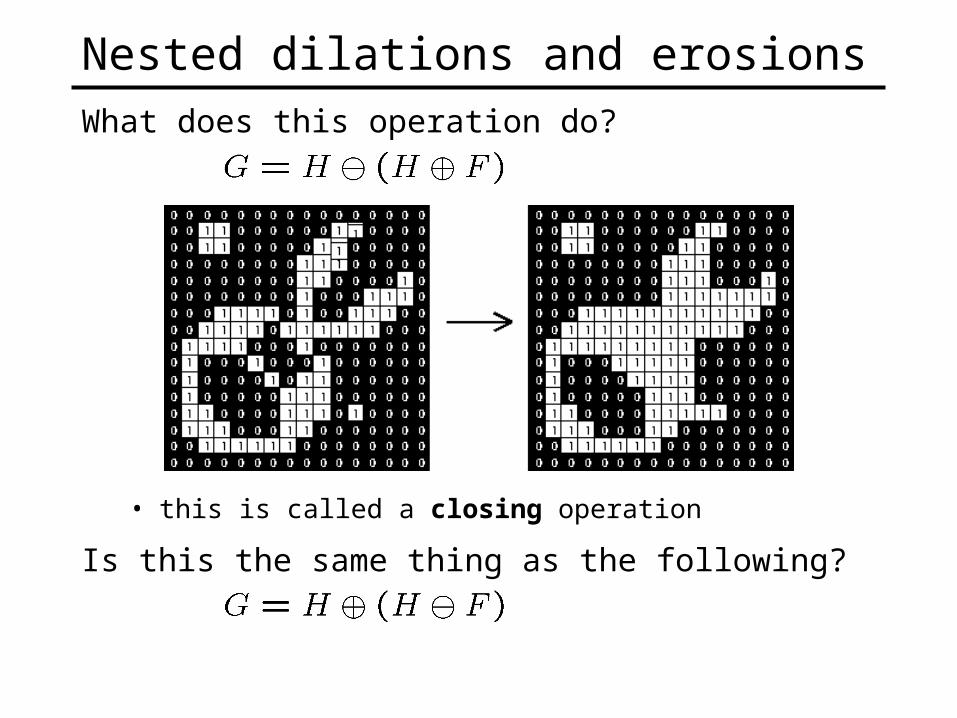
Nested dilations and erosionsWhat does this operation do?
• this is called a closing operation
Is this the same thing as the following?

Nested dilations and erosionsWhat does this operation do?
• this is called an opening operation• http://www.dai.ed.ac.uk/HIPR2/open.htm
You can clean up binary pictures by applying combinations of dilations and erosions
Dilations, erosions, opening, and closing operations are known as morphological operations• see http://www.dai.ed.ac.uk/HIPR2/morops.htm