Announcements 1. Answers to Ch. 3 problems 6, 7, 8, 12, 17, 22, 32, 35 posted - 230A. 2. Problem set...
28
Announcements 1. Answers to Ch. 3 problems 6, 7, 8, 12, 17, 22, 32, 35 posted - 230A. 2. Problem set 1 answers due in lab this week at the beginning of lab. Bring calculators to lab this week. 3. Getting to know Flylab and testcross (lab 2) - printout of assignments from “notebook”, due this week at the beginning of lab. 4. Confusion with X-linked crosses: 1 cross or 2?
-
Upload
mae-austin -
Category
Documents
-
view
212 -
download
0
Transcript of Announcements 1. Answers to Ch. 3 problems 6, 7, 8, 12, 17, 22, 32, 35 posted - 230A. 2. Problem set...
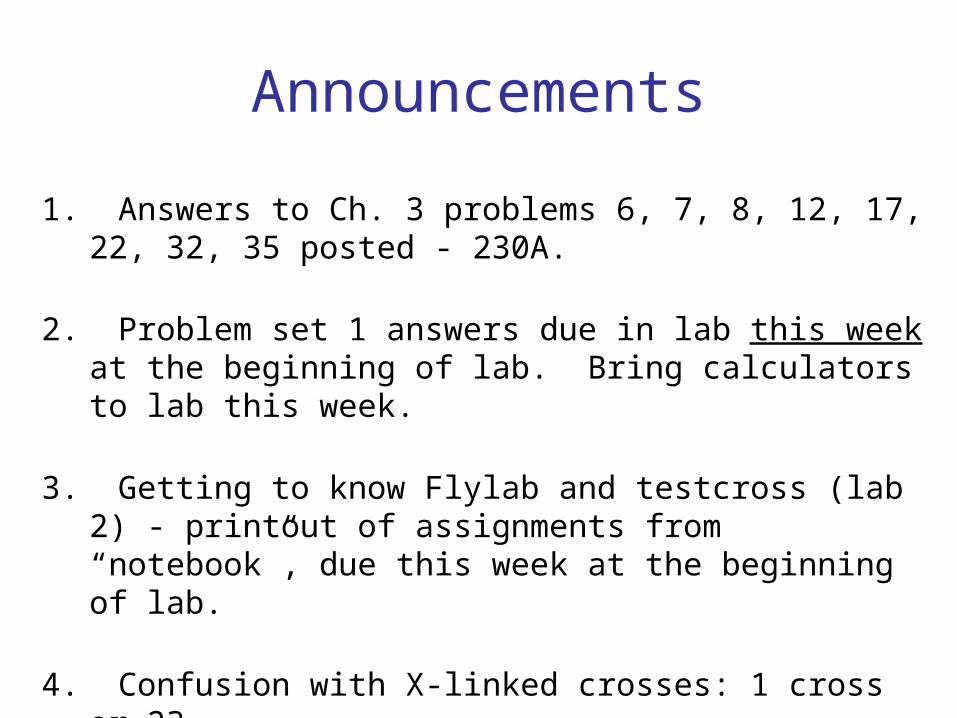
Announcements
1. Answers to Ch. 3 problems 6, 7, 8, 12, 17, 22, 32, 35 posted - 230A.
2. Problem set 1 answers due in lab this week at the beginning of lab. Bring calculators to lab this week.
3. Getting to know Flylab and testcross (lab 2) - printout of assignments from “notebook”, due this week at the beginning of lab.
4. Confusion with X-linked crosses: 1 cross or 2?
5. Seminar this Thursday - faculty research interests

Review of last lecture
1. Genetic ratios are expressed as probabilities. Thus, deriving outcomes of genetic crosses relies on an understanding of laws of probability, in particular: the sum law, product law, conditional probability (likelihood that one outcome will occur, given a particular condition), and the binomial theorum (used to determine particular combinations). Expand the binomial OR use factorial general formula to solve.
2. Statistical analyses (Chi square) - used to test the validity of experimental outcomes. In genetics, some variation is expected, due to chance deviation.

Outline of Lecture 6
I. Chi-square revisited
II. Pedigree analysis- recessive vs. dominant traits - solving pedigree problems

Chi-square formula
• Once X2 is determined, it is converted to a probability value (p) using the degrees of freedom (df) = n- 1 where n = the number of different categories for the outcome.
€
X2 =(o−e)2
e∑
where o = observed value for a given category,e = expected value for a given category, and sigma is the sum of the calculated values for each category of the ratio

Chi-square - Example 1
( ) ( ) ( )
53.0
250
250240
750
750760
2
2222
=
⎥⎦
⎤⎢⎣
⎡ −+
−=⎥
⎦
⎤⎢⎣
⎡ −Σ=
χ
χe
eo
Phenotype Expected Observed
A 750 760
a 250 240
1000 1000
Null Hypothesis: Data fit a 3:1 ratio.
degrees of freedom = (number of categories - 1) = 2 - 1 = 1
Use Fig. 3.12 to determine p - on next slide
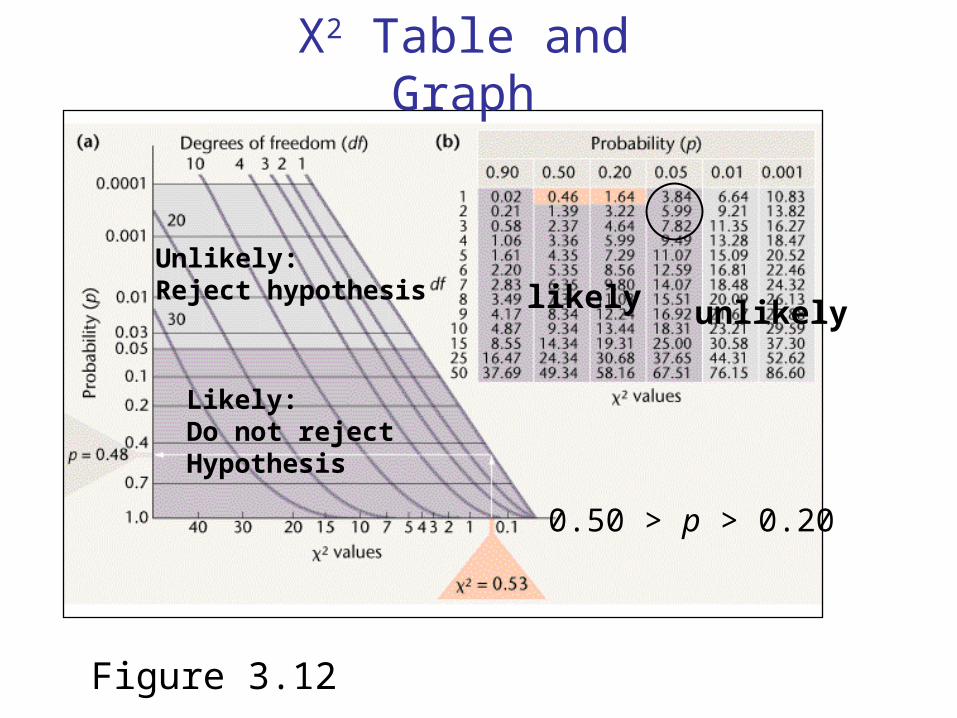
X2 Table and Graph
Unlikely:Reject hypothesis
Likely:Do not rejectHypothesis
likely unlikely
0.50 > p > 0.20
Figure 3.12
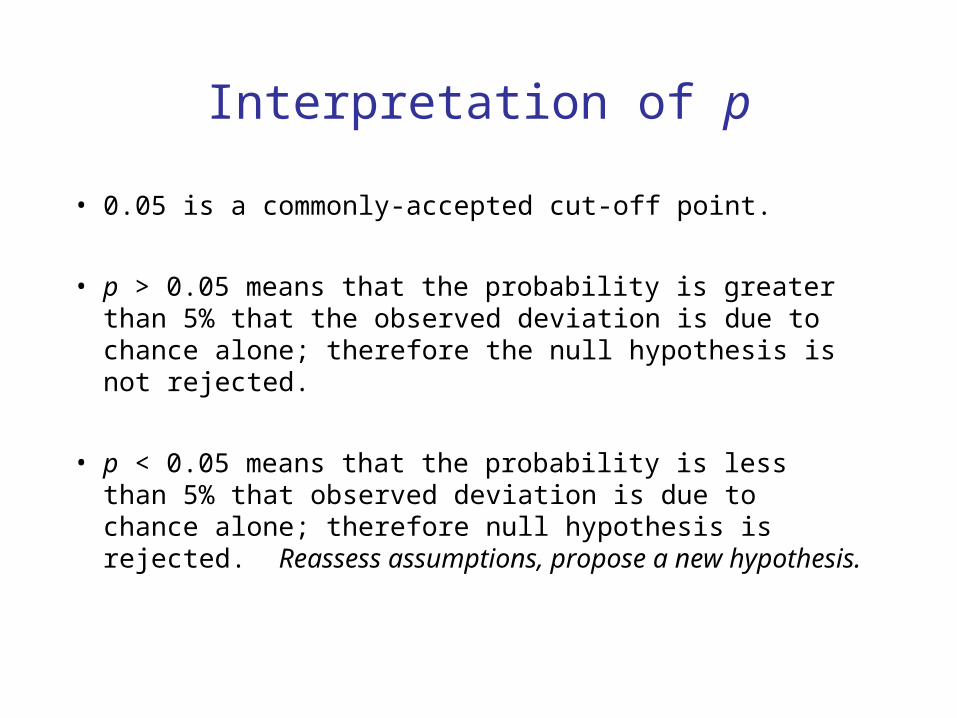
Interpretation of p
• 0.05 is a commonly-accepted cut-off point.
• p > 0.05 means that the probability is greater than 5% that the observed deviation is due to chance alone; therefore the null hypothesis is not rejected.
• p < 0.05 means that the probability is less than 5% that observed deviation is due to chance alone; therefore null hypothesis is rejected. Reassess assumptions, propose a new hypothesis.

Conclusions:
• X2 less than 3.84 means that we accept the Null Hypothesis (3:1 ratio).
• In our example, p = 0.48 (p > 0.05) means that we accept the Null Hypothesis (3:1 ratio).
• This means we expect the data to vary from expectations this much or more 48% of the time.
Conversely, 52% of the repeats would show less deviation as a result of chance than initially observed.

X2 Example 2: Coin Toss
I say that I have a non-trick coin (with both heads and tails).
Do you believe me?
1 tail out of 1 toss
10 tails out of 10 tosses
100 tails out of 100 tosses

Tossing Coin - Which of these outcomes seem likely to you?
Compare Chi-square with 3.84 (since there is 1 degree of freedom).
a) Tails 1 of 1
b) Tails 10 of 10
c) Tails 100 of 100
Chi-square
a)
b)
c)
χ 2 =1−
1
2 ⎛ ⎝ ⎜ ⎞
⎠ ⎟2
+ 0 −1
2 ⎛ ⎝ ⎜ ⎞
⎠ ⎟2
1
2
=
1
2
1
2+
1
2 ⎛ ⎝ ⎜ ⎞
⎠ ⎟
1
2
= 1
χ 2 =10 − 5( )2 + 0 − 5( )2
5= 10
χ 2 =100 − 50( )2 + 0 − 50( )2
50= 100
Don’t reject
Reject
Reject
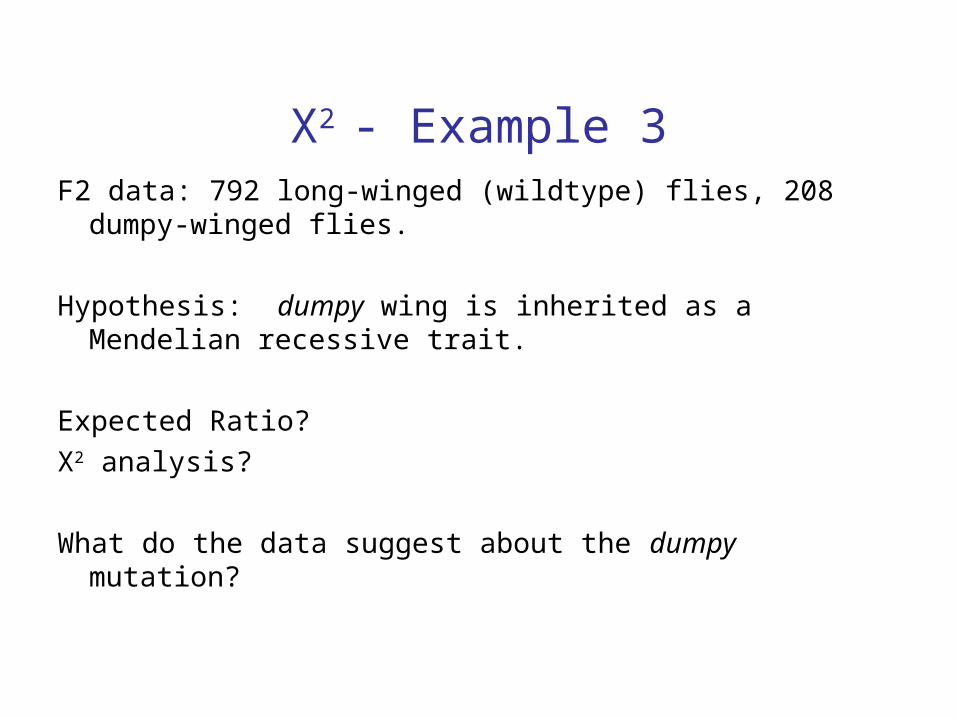
X2 - Example 3F2 data: 792 long-winged (wildtype) flies, 208 dumpy-
winged flies.
Hypothesis: dumpy wing is inherited as a Mendelian recessive trait.
Expected Ratio?
X2 analysis?
What do the data suggest about the dumpy mutation?
II. Pedigree analysis
The complex study of human genetics - we don’t control human matings! Instead, we study family trees (pedigrees) to identify how traits are inherited.
Importance of Pedigrees
• Genetic counselors use them to identify risk of inherited illness.
• Genetic researchers use them to identify genes responsible for genetic disorders.
• If you or a relative keep good family records, they may some day be useful in tracking down a genetic illness in your family.

Recessive vs. Dominant TraitsAutosomal Recessive Traits
• Example: The albino (aa) mutation inactivates the gene for tyrosinase enzyme, which normally converts tyrosine to melanin in the skin, hair and eyes.
• Non-albino is AA or Aa
• Autosomal recessive traits can skip generations (appear in progeny of unaffected persons) and affect both males and females equally.

Albinism Trait

Autosomal Dominant Traits
• Example: Hypotrichosis, hair loss begins in childhood for both males and females.
• Autosomal dominant traits do not skip generations and affect both males and females.– Some but not all children will be affected in every
generation.
• Affected individuals are usually heterozygous since mutant allele is rare.
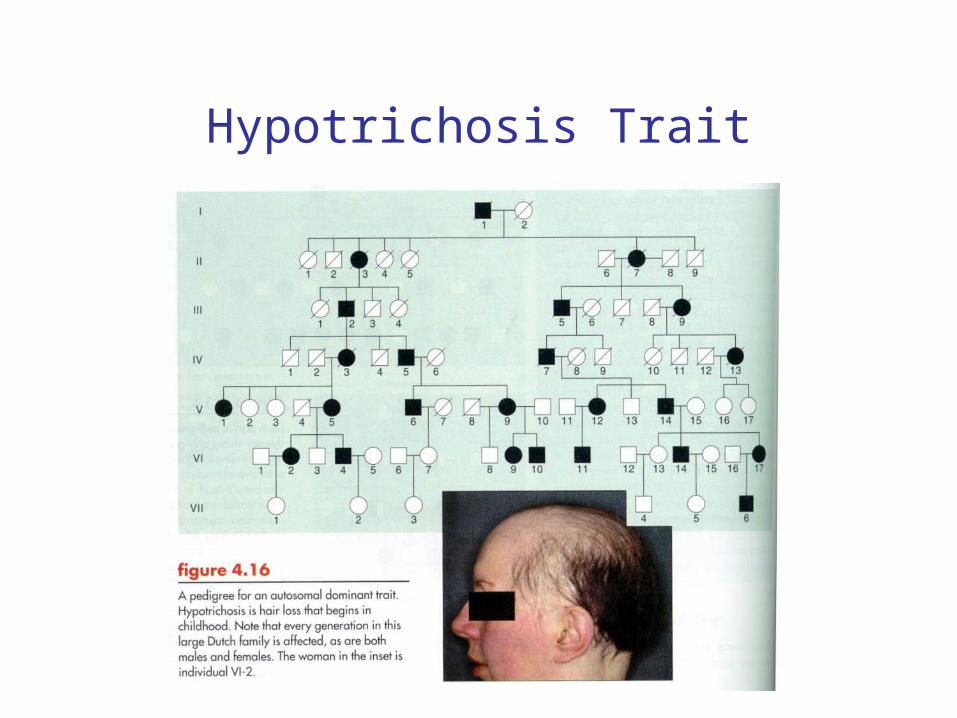
Hypotrichosis Trait

Achondroplasia Trait (DD or Dd)
D is a dominant allele interfering with bone growth.Most people are dd.

Human Recessive and Dominant Traits

OMIM: Online Mendelian Inheritance in Man (Humans)
• Compiled by team at Johns Hopkins University.
• Available at: www.ncbi.nlm.nih.gov/omim/
• Includes description of trait, mode of inheritance, molecular information.
• GREAT resource to find good reference for your presentation topic; database is easy to search and full of interesting information
• Another resource to find a topic from NPR programming: http://www.dnafiles.org/resources/index.html

Symbols used in human pedigree analysis
Male
Female
Mating
Parents and 1 boy, 1 girl (in order of birth)
Sex unspecified
Affected individuals
Heterozygotes for autosomal recessive
Death
Propositus
Consanguineous marriage
3 2 Number of children of sex indicated

Pedigree Problem 1 - albinism
How is this trait inherited? dominant or recessive?
What are most probable genotypes of each individual?

Solving Pedigree Problems
• Inspect the pedigree:– If trait is dominant, it will not skip generations nor be
passed on to offspring unless parents have it.– If trait is recessive, it will skip generations and will
exist in carriers.• Form a hypothesis, e.g. autosomal recessive.• Deduce the genotypes.• Check that genotypes are consistent with phenotypes.• Revise hypothesis if necessary, e.g. autosomal
dominant.

What is the Mode of Inheritance?
Unaffected 2nd generation = rare, recessive trait
Deduce genotypes

Pedigree Example 2: p. 71, #26

Pedigree Example 3: Huntington’s Disease
unaffected affected
Folksinger Woody Guthrie died of Huntington’s Disease.
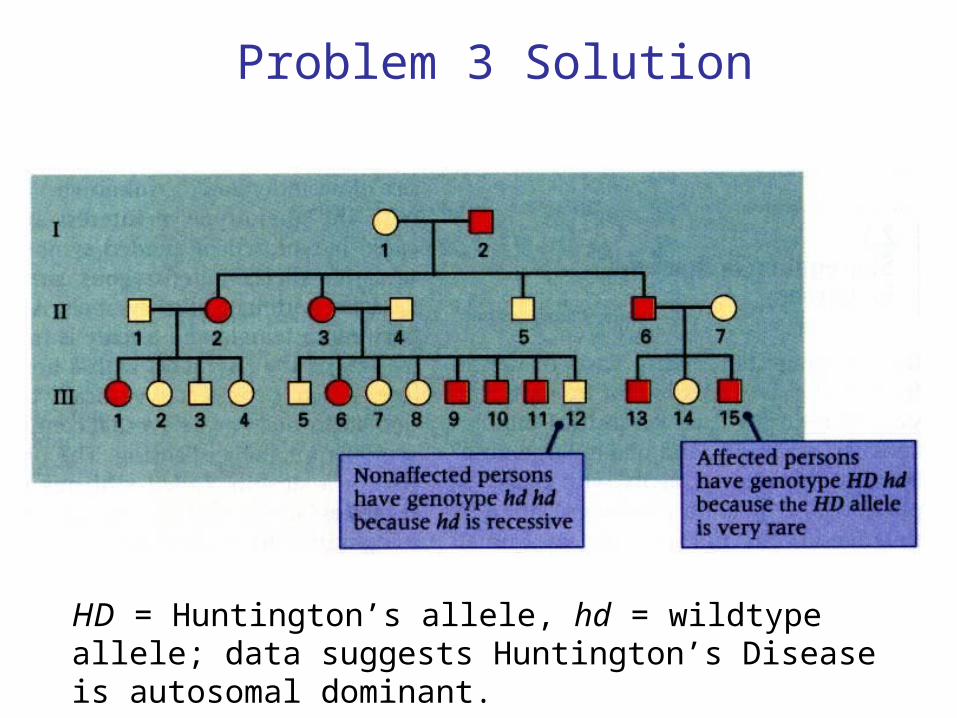
Problem 3 Solution
HD = Huntington’s allele, hd = wildtype allele; data suggests Huntington’s Disease is autosomal dominant.

Inconclusive Pedigree
• Try deducing the genotypes using either autosomal recessive or autosomal dominant hypothesis; either one should work.