
ANNOUNCEMENT OF ANNUAL RESULTS FOR THE · PDF filefinancial liabilities, borrowings (excluding...
21
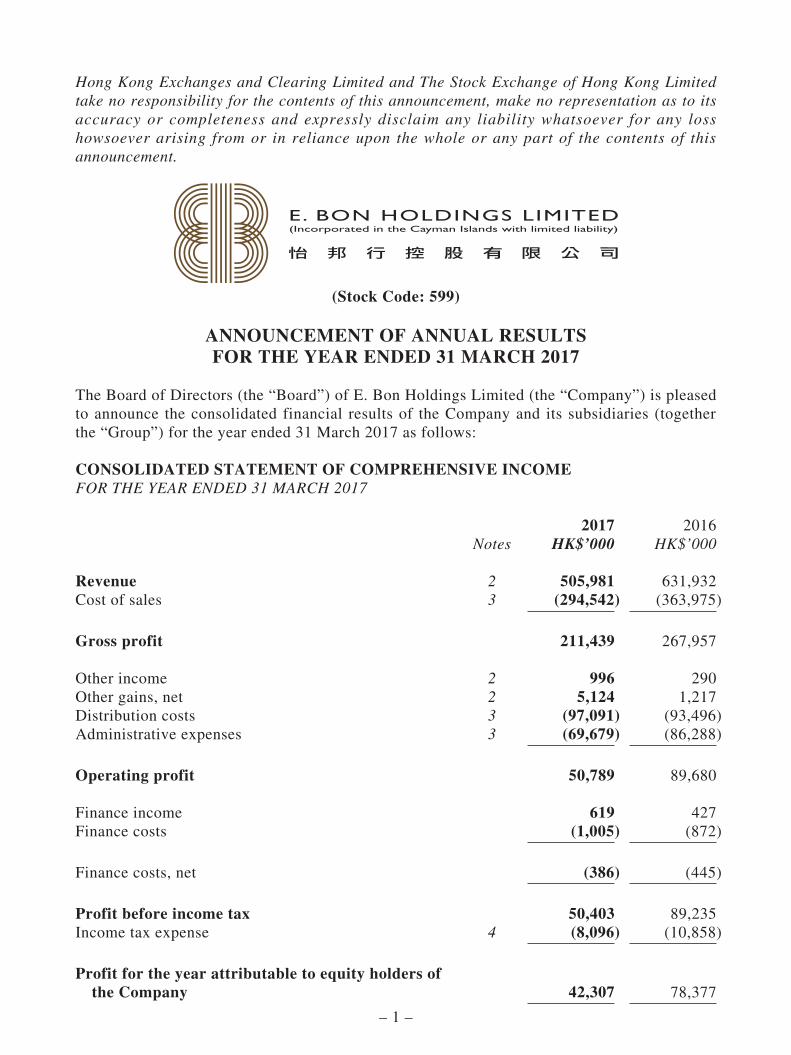
– 1 – Hong Kong Exchanges and Clearing Limited and The Stock Exchange of Hong Kong Limited take no responsibility for the contents of this announcement, make no representation as to its accuracy or completeness and expressly disclaim any liability whatsoever for any loss howsoever arising from or in reliance upon the whole or any part of the contents of this announcement. (Stock Code: 599) ANNOUNCEMENT OF ANNUAL RESULTS FOR THE YEAR ENDED 31 MARCH 2017 The Board of Directors (the “Board”) of E. Bon Holdings Limited (the “Company”) is pleased to announce the consolidated financial results of the Company and its subsidiaries (together the “Group”) for the year ended 31 March 2017 as follows: CONSOLIDATED STATEMENT OF COMPREHENSIVE INCOME FOR THE YEAR ENDED 31 MARCH 2017 2017 2016 Notes HK$’000 HK$’000 Revenue 2 505,981 631,932 Cost of sales 3 (294,542) (363,975) Gross profit 211,439 267,957 Other income 2 996 290 Other gains, net 2 5,124 1,217 Distribution costs 3 (97,091) (93,496) Administrative expenses 3 (69,679) (86,288) Operating profit 50,789 89,680 Finance income 619 427 Finance costs (1,005) (872) Finance costs, net (386) (445) Profit before income tax 50,403 89,235 Income tax expense 4 (8,096) (10,858) Profit for the year attributable to equity holders of the Company 42,307 78,377
Transcript of ANNOUNCEMENT OF ANNUAL RESULTS FOR THE · PDF filefinancial liabilities, borrowings (excluding...
– 1 –
Hong Kong Exchanges and Clearing Limited and The Stock Exchange of Hong Kong Limited take no responsibility for the contents of this announcement, make no representation as to its accuracy or completeness and expressly disclaim any liability whatsoever for any loss howsoever arising from or in reliance upon the whole or any part of the contents of this announcement.
(Stock Code: 599)
ANNOUNCEMENT OF ANNUAL RESULTS FOR THE YEAR ENDED 31 MARCH 2017
The Board of Directors (the “Board”) of E. Bon Holdings Limited (the “Company”) is pleased to announce the consolidated financial results of the Company and its subsidiaries (together the “Group”) for the year ended 31 March 2017 as follows:
CONSOLIDATED STATEMENT OF COMPREHENSIVE INCOMEFOR THE YEAR ENDED 31 MARCH 2017
2017 2016Notes HK$’000 HK$’000
Revenue 2 505,981 631,932Cost of sales 3 (294,542) (363,975)
Gross profit 211,439 267,957
Other income 2 996 290Other gains, net 2 5,124 1,217Distribution costs 3 (97,091) (93,496)Administrative expenses 3 (69,679) (86,288)
Operating profit 50,789 89,680
Finance income 619 427Finance costs (1,005) (872)
Finance costs, net (386) (445)
Profit before income tax 50,403 89,235Income tax expense 4 (8,096) (10,858)
Profit for the year attributable to equity holders of the Company 42,307 78,377

– 2 –
2017 2016Notes HK$’000 HK$’000
Other comprehensive income/(loss)Items that may be subsequently reclassified to profit or lossExchange loss on translation of financial statements of foreign operations (1,734) (737)
Release of exchange reserve of a deregistered subsidiary – (744)Items that will not be reclassified subsequently to profit or lossSurplus/(loss) on revaluation of properties held for own use 20,966 (9,470)Tax effect relating to revaluation of properties held for own use (3,459) 1,563
Other comprehensive income/(loss) for the year, net of tax 15,773 (9,388)
Total comprehensive income for the year attributable to equity holders of the Company 58,080 68,989
Earnings per share for profit attributable to the equity holders of the Company during the year (expressed in HK cents per share) – Basic and diluted 6 7.04 cents 13.05 cents1
1 Adjusted for the effect of the bonus shares issue on 8 June 2016

– 3 –
CONSOLIDATED STATEMENT OF FINANCIAL POSITIONAS AT 31 MARCH 2017
2017 2016Notes HK$’000 HK$’000
ASSETSNon-current assets Property, plant and equipment 165,666 148,584 Investment properties 32,700 28,400 Deferred income tax assets 2,618 3,158 Trade, retention and other receivables 7 10,418 19,083
211,402 199,225
Current assets Inventories 146,058 130,628 Current income tax recoverable 6,131 3,773 Trade, retention and other receivables 7 136,587 148,315 Derivative financial assets 8 – 1,310 Restricted cash 2,981 2,966 Cash and cash equivalents 79,706 127,781
371,463 414,773
Total assets 582,865 613,998
EQUITYEquity attributable to equity holders of the Company Share capital 60,060 30,030 Reserves 371,804 394,805
Total equity 431,864 424,835

– 4 –
2017 2016Notes HK$’000 HK$’000
LIABILITIESCurrent liabilities Trade and other payables 9 43,041 69,264 Receipts in advance 9 47,175 39,614 Derivative financial liabilities 8 – 377 Borrowings 38,115 58,851 Current income tax liabilities 3,252 4,515
131,583 172,621
Non-current liabilities Deferred income tax liabilities 19,418 16,542
Total liabilities 151,001 189,163
Total equity and liabilities 582,865 613,998

– 5 –
Notes:
1. BASIS OF PREPARATION
The consolidated financial statements of E. Bon Holdings Limited have been prepared in accordance with all applicable Hong Kong Financial Reporting Standards (“HKFRS”). The consolidated financial statements have been prepared under the historical cost convention, as modified by the revaluation of leasehold land and buildings held for own use, investment properties and derivative financial instruments, which are carried at fair values.
The preparation of financial statements in conformity with HKFRS requires the use of certain critical accounting estimates. It also requires management to exercise its judgment in the process of applying the Group’s accounting policies.
(a) The following new standards and amendments to standards are mandatory for the first time for the financial year beginning on or after 1 January 2016 but they have no significant impact to the Group’s results and financial position or are not currently relevant to the Group:
Amendment to HKAS 1 Disclosure initiativeAmendment to HKAS 16 and 38 Clarification of acceptable methods of depreciation
and amortisationAmendment to HKAS 27 Equity method in separate financial statementsAmendment to HKFRS 10, 12 and HKAS 28
Investment entities: Applying the consolidation exception
Amendment to HKFRS 11 Accounting for acquisitions of interests in joint operationsHKFRS 14 Regulatory deferral accountsAnnual Improvements Project Annual improvements 2012-2014 cycle
(b) New standards, amendments to standards and interpretations have been issued but are not effective for the financial year beginning on or after 1 January 2016 and have not been early adopted:
Effective forannual periods
beginning on or after
Amendment to HKFRS 10 and HKAS 28
Sale or contribution of assets between an investor and its associate or joint venture
To be determined
Amendment to HKAS 7 Disclosure initiative 1 January 2017Amendment to HKAS 12 Recognition of deferred tax assets for
unrealised losses1 January 2017
Amendment to HKFRS 2 Classification and measurement of share-based payment transactions
1 January 2018
Amendment to HKAS 40 Transfers of investment property 1 January 2018HK(IFRIC)-Int 22 Foreign currency transactions and advance
consideration1 January 2018
HKFRS 9 Financial instruments 1 January 2018HKFRS 15 Revenue from contracts with customers 1 January 2018HKFRS 16 Leases 1 January 2019
The Group is in the process of assessing the impact of adoption of these new standards, amendments to existing standards and interpretations, which the Group plans to adopt when they become effective. The Group is not yet in a position to state whether substantial changes to the Group’s accounting policies and the presentation of the financial statements will be resulted.

– 6 –
2. REVENUE, OTHER INCOME, OTHER GAINS, NET AND SEGMENT INFORMATION
2017 2016HK$’000 HK$’000
RevenueSale of goods 431,552 492,905Contract revenue 74,429 139,027
505,981 631,932
Other incomeRental income 827 166Others 169 124
996 290
Other gains, netNet foreign exchange (loss)/gain – Forward contracts (1,517) 1,251 – Other exchange gain, net 2,637 1,145Gain on deregistration of subsidiaries (Note) – 1,214Fair value gain/(loss) on investment properties 4,300 (2,193)Loss on disposal of fixed assets (296) (200)
5,124 1,217
Note: The amount primarily represents the reclassification of exchange gain from equity to the profit or loss account upon deregistration of subsidiaries.
The executive directors of the Company (the “Executive Directors”) are the Group’s chief operating decision-makers. Management has determined the operating segments based on the information reviewed by the Executive Directors for the purposes of allocating resources and assessing performance.
Following the business development of the Group in recent years, the Executive Directors have gradually put more focus on the performance of product lines, instead of the channel over which the products are sold. Accordingly, the Executive Directors have decided to align segment information as presented in the consolidated financial statements with the internal reporting used for evaluating operating segment performance. Prior year comparative segment information has been restated accordingly to conform with the presentation in the current year.
The Group’s reportable operating segments are as follows:
— Architectural builders’ hardware, bathroom collections and others segment- importing, wholesale and retail of architectural builders’ hardware and bathroom collections and others
— Kitchen collection and furniture segment- designing, importing, wholesale, retail and installation of kitchen collections and furniture
The measurement policies the Group used for reporting segment results under HKFRS 8 are the same as those used in its consolidated financial statements prepared under HKFRSs.
The Executive Directors assess the performance of the operating segments based on the measure of gross profit. Other operating income and expenses are not allocated to the operating segments as the information is not regularly reviewed by the Executive Directors.

– 7 –
Segment assets include all assets but exclude current income tax recoverable, deferred income tax assets, investment properties, derivative financial assets, restricted cash, cash and cash equivalents, property, plant and equipment related to the office premises of the Group and other corporate assets which are managed on central basis and are not directly attributable to the business activities of any operating segment.
Segment liabilities include all liabilities but exclude current and deferred income tax liabilities, derivative financial liabilities, borrowings (excluding trust receipt loans) and other corporate liabilities which are managed on central basis and are not directly attributable to the business activities of any operating segment.
2017Architectural
builders’ hardware, bathroom
collections and others
Kitchen collection
and furniture TotalHK$’000 HK$’000 HK$’000
Reportable segment revenue from external customers 359,071 146,910 505,981Reportable segment cost of sales (225,902) (68,640) (294,542)
Reportable segment gross profit 133,169 78,270 211,439
Depreciation of property, plant and equipment (4,186) (1,932) (6,118)Reversal of provision/(provision) for inventory obsolescence 2,312 (787) 1,525Write-back of provision/(provision) for impaired receivables 4,578 (48) 4,530
Reportable segment assets 278,631 81,460 360,091Additions to non-current segment assets during the year 5,315 1,765 7,080
Reportable segment liabilities 67,524 41,288 108,812

– 8 –
2016 (Restated)Architectural
builders’ hardware, bathroom
collections and others
Kitchen collection
and furniture TotalHK$’000 HK$’000 HK$’000
Reportable segment revenue from external customers 391,590 240,342 631,932Reportable segment cost of sales (247,497) (116,478) (363,975)
Reportable segment gross profit 144,093 123,864 267,957
Depreciation of property, plant and equipment (4,403) (2,525) (6,928)Provision for inventory obsolescence (5,305) (5,166) (10,471)Provision for impaired receivables (5,569) – (5,569)
Reportable segment assets 266,793 94,296 361,089Additions to non-current segment assets during the year 1,933 2,501 4,434
Reportable segment liabilities 72,986 65,913 138,899
The totals presented for the Group’s operating segments reconcile to the Group’s key financial figures as presented in the consolidated financial statements as follows:
2017 2016(Restated)
HK$’000 HK$’000
Reportable segment gross profit 211,439 267,957
Group gross profit 211,439 267,957
Reportable segment assets 360,091 361,089
Property, plant and equipment 98,366 85,238Investment properties 32,700 28,400Deferred income tax assets 2,618 3,158Current income tax recoverable 6,131 3,773Derivative financial assets – 1,310Restricted cash 2,981 2,966Cash and cash equivalents 79,706 127,781Other corporate assets 272 283
Group assets 582,865 613,998
Reportable segment liabilities 108,812 138,899
Derivative financial liabilities – 377Borrowings 19,023 28,336Current income tax liabilities 3,252 4,515Deferred income tax liabilities 19,418 16,542Other corporate liabilities 496 494
Group liabilities 151,001 189,163
– 9 –
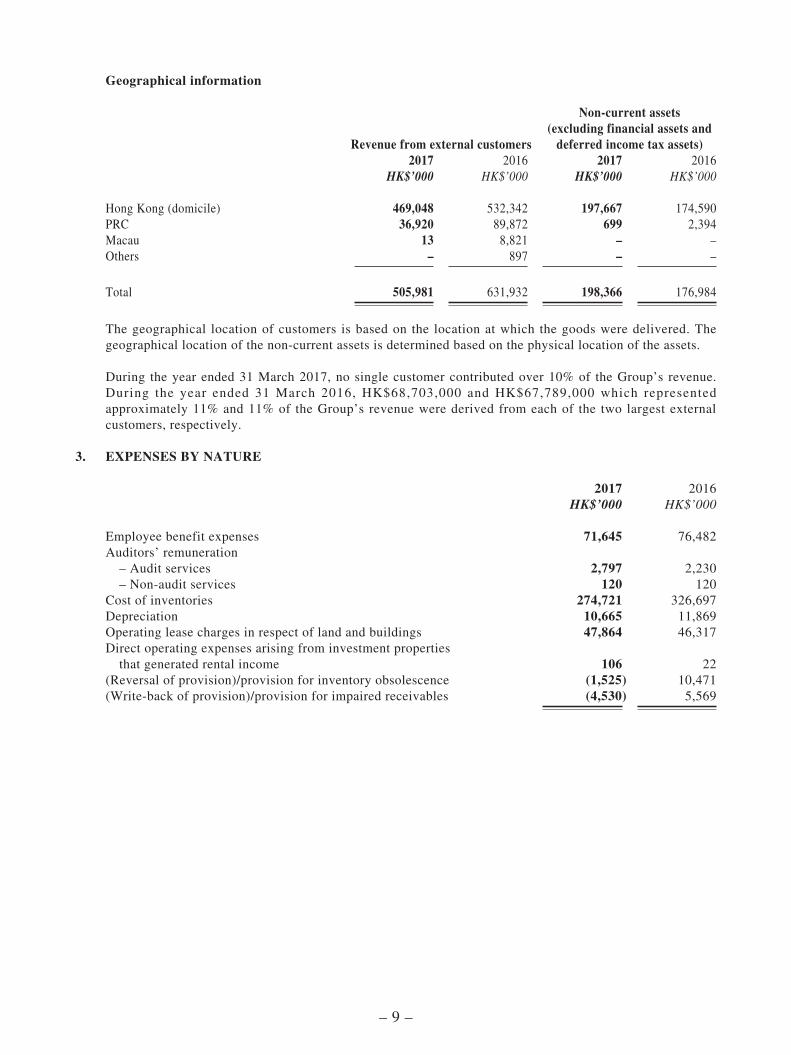
Geographical information
Revenue from external customers
Non-current assets(excluding financial assets and
deferred income tax assets)2017 2016 2017 2016
HK$’000 HK$’000 HK$’000 HK$’000
Hong Kong (domicile) 469,048 532,342 197,667 174,590PRC 36,920 89,872 699 2,394Macau 13 8,821 – –Others – 897 – –
Total 505,981 631,932 198,366 176,984
The geographical location of customers is based on the location at which the goods were delivered. The geographical location of the non-current assets is determined based on the physical location of the assets.
During the year ended 31 March 2017, no single customer contributed over 10% of the Group’s revenue. During the year ended 31 March 2016, HK$68,703,000 and HK$67,789,000 which represented approximately 11% and 11% of the Group’s revenue were derived from each of the two largest external customers, respectively.
3. EXPENSES BY NATURE
2017 2016HK$’000 HK$’000
Employee benefit expenses 71,645 76,482Auditors’ remuneration – Audit services 2,797 2,230 – Non-audit services 120 120Cost of inventories 274,721 326,697Depreciation 10,665 11,869Operating lease charges in respect of land and buildings 47,864 46,317Direct operating expenses arising from investment properties that generated rental income 106 22(Reversal of provision)/provision for inventory obsolescence (1,525) 10,471(Write-back of provision)/provision for impaired receivables (4,530) 5,569

– 10 –
4. INCOME TAX EXPENSE
Hong Kong profits tax has been provided at the rate of 16.5% (2016: 16.5%) on the estimated assessable profit for the year. Taxation on overseas profits has been calculated on the estimated assessable profit for the year at the rates of taxation prevailing in the countries in which the subsidiaries operate.
2017 2016HK$’000 HK$’000
Current taxHong Kong profits tax 8,126 11,920Overseas income tax 550 4,340Over provision in prior years (401) (3,079)
Total current tax 8,275 13,181Deferred taxation (179) (2,323)
Income tax expense 8,096 10,858
5. DIVIDENDS
(a) Dividends declared and paid during the year
2017 2016HK$’000 HK$’000
Final dividend in respect of 2016 of HK2 cents1
(2016: in respect of 2015 of HK4 cents1) per share 12,012 24,024Special dividend in respect of 2016 of HK5 cents1
(2016: nil) per share 30,030 –Interim dividend in respect of 2017 of HK1.5 cents (2016: in respect of 2016 of HK1.5 cents1) per share 9,009 9,009
51,051 33,033
(b) Dividends for the year
2017 2016HK$’000 HK$’000
Interim dividend of HK1.5 cents (2016: HK1.5 cents1) per share 9,009 9,009
Proposed final dividend of HK2.5 cents (2016: HK2 cents1) per share (Note) 15,015 12,012
Proposed special dividend of nil (2016: HK5 cents1) per share (Note) – 30,030
24,024 51,051
Note: These dividends have been proposed by the directors after the reporting date. The proposed dividend, subject to the shareholders’ approval at the forthcoming annual general meeting, are not reflected as dividend payables as at 31 March 2017.
1 All dividend per share data has been adjusted for the effect of the bonus shares issue on 8 June 2016.

– 11 –
6. EARNINGS PER SHARE
(a) Basic
Basic earnings per share is calculated by dividing the profit attributable to equity holders of the Company by the number of ordinary shares in issue during the year. During the year, the Company issued bonus shares and the number of ordinary shares increased to 600,600,000 from 300,300,000. The weighted average number of ordinary shares in the calculation of basic earnings per share were adjusted for the change as if the bonus issue occurred at the beginning of the year ended 31 March 2016.
2017 2016HK$’000 HK$’000
Profit attributable to equity owners of the Company 42,307 78,377
Number of ordinary shares in issue (thousands) 600,600 600,600
(b) Diluted
Diluted earnings per share for the year ended 31 March 2017 is the same as the basic earnings per share as there were no potentially dilutive ordinary shares issued (2016: same).
7. TRADE, RETENTION AND OTHER RECEIVABLES
Details of the trade, retention and other receivables as at 31 March 2017 are listed below:
2017 2016HK$’000 HK$’000
Trade receivables 115,226 128,589Less: provision for impairment of trade receivables (855) (5,118)
114,371 123,471Retention receivables 6,308 11,248Less: provision for impairment of retention receivables (260) (570)
120,419 134,149Amounts due from customers for contract work 2,596 10,122Other receivables, deposits and prepayments 23,990 23,127
147,005 167,398
Less: non-current portion Retention receivables (5,672) (8,975) Deposits and prepayments (4,746) (10,108)
Current portion 136,587 148,315

– 12 –
All non-current receivables are due within five years from the end of the respective reporting dates. The ageing analysis of trade receivables at the reporting date by invoice date is as follows:
2017 2016HK$’000 HK$’000
1–90 days 85,789 98,76391–365 days 21,886 19,625Over 365 days 7,551 10,201
115,226 128,589
The majority of the Group’s sales are with credit terms of 30 to 90 days, while some customers are granted an extended credit period of up to 120 days.
The ageing analysis of trade receivables that are not impaired is as follows:
2017 2016HK$’000 HK$’000
Not yet past due 57,348 59,2011–90 days past due 35,442 45,06091–365 days past due 14,885 16,558Over 365 days past due 6,696 2,652
114,371 123,471
Receivables that were past due but not impaired relate to a wide range of customers that have a good track record with the Group. Based on past experience, management believes that no impairment allowance is necessary in respect of these balances as there has not been a significant change in credit quality and the balances are expected to be fully recoverable. The Group does not hold any collateral over these balances.
The movement in the provision for impairment of trade and retention receivables is as follows:
2017 2016HK$’000 HK$’000
Balance at beginning of the year 5,688 130(Write-back of provision)/provision for impaired receivables (4,530) 5,569Exchange difference (43) (11)
Balance at end of the year 1,115 5,688
At each reporting date, the Group reviews receivables for evidence of impairment on both an individual and collective basis. As at 31 March 2017, the Group determined trade and retention receivables of HK$1,115,000 (2016: HK$5,688,000) as individually impaired. The impaired trade and retention receivables are due from customers that were in default or delinquency of payments.
As at 31 March 2017, the carrying values of trade and other receivables approximate their fair values (2016: same).
– 13 –
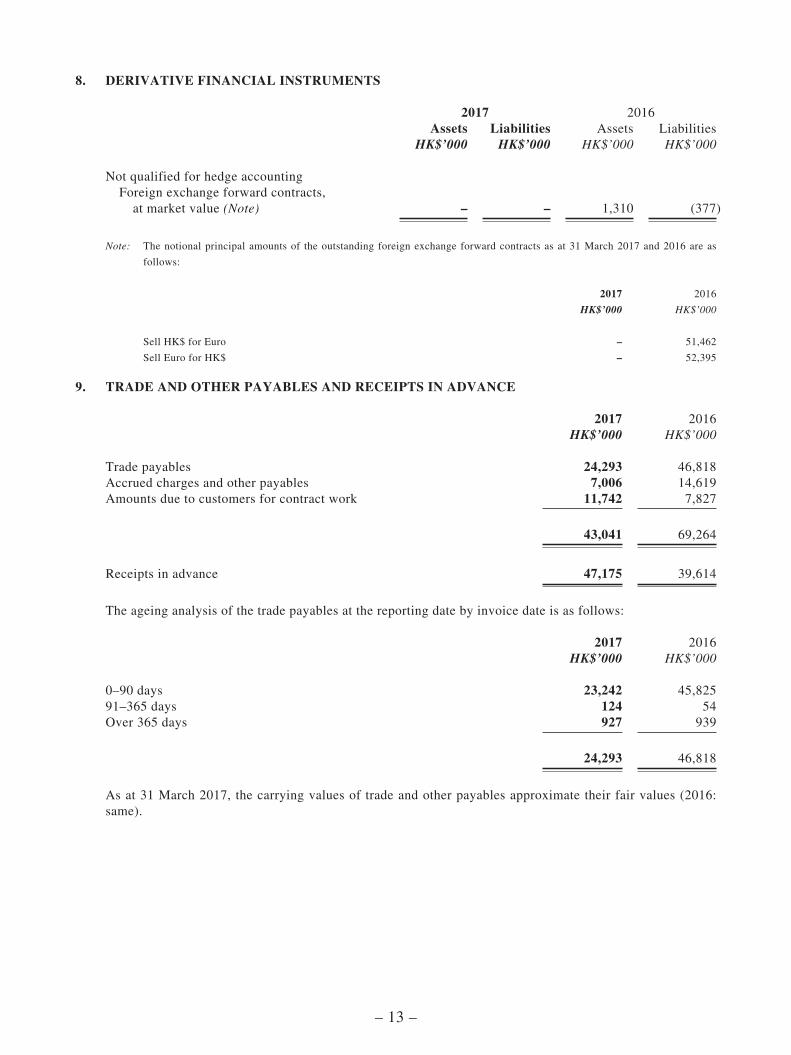
8. DERIVATIVE FINANCIAL INSTRUMENTS
2017 2016Assets Liabilities Assets Liabilities
HK$’000 HK$’000 HK$’000 HK$’000
Not qualified for hedge accounting Foreign exchange forward contracts, at market value (Note) – – 1,310 (377)
Note: The notional principal amounts of the outstanding foreign exchange forward contracts as at 31 March 2017 and 2016 are as
follows:
2017 2016
HK$’000 HK$’000
Sell HK$ for Euro – 51,462
Sell Euro for HK$ – 52,395
9. TRADE AND OTHER PAYABLES AND RECEIPTS IN ADVANCE
2017 2016HK$’000 HK$’000
Trade payables 24,293 46,818Accrued charges and other payables 7,006 14,619Amounts due to customers for contract work 11,742 7,827
43,041 69,264
Receipts in advance 47,175 39,614
The ageing analysis of the trade payables at the reporting date by invoice date is as follows:
2017 2016HK$’000 HK$’000
0–90 days 23,242 45,82591–365 days 124 54Over 365 days 927 939
24,293 46,818
As at 31 March 2017, the carrying values of trade and other payables approximate their fair values (2016: same).

– 14 –
MANAGEMENT DISCUSSION AND ANALYSIS
BUSINESS REVIEW
The principal activity of the Company is investment holding. Its subsidiaries are principally engaged in the importing, wholesale and installation of architectural builders’ hardware, bathroom, kitchen collections and furniture in Hong Kong and the People’s Republic of China (the “PRC”).
A business review of the Group and an analysis of the Group’s performance using financial key performance indicators during the year are provided in the Management Discussion and Analysis. Further details will be provided in the Company’s Annual Report 2017. In addition, discussions on the Group’s environmental policies and performance and an account of the Group’s key relationships with its employees, customers, suppliers and others that have a significant impact on the Group and on which the Group’s success depends will be provided in the Environmental, Social and Governance Report of the Annual Report 2017.
During the year ended 31 March 2017, the Company has complied with the requirements under the Rules Governing the Listing of Securities on the Stock Exchange of Hong Kong Limited (the “Listing Rules”), the Securities and Futures Ordinance (the “SFO”) and the Cayman Islands Companies Law. Details of the Company’s compliance with the code provisions set out in the Appendix 14 of the Listing Rules will be provided in the Corporate Governance Report of the Annual Report 2017.
During the year, the number of residential units completed in Hong Kong remained at high level, with a domination of small- and medium-sized flats in the market. The demand for home fittings increased but the market was inclined to products at competitive prices.
REVENUE REVIEW
For the year ended 31 March 2017, the Group’s total turnover was HK$506.0 million, a decrease by 19.9% as compared with the previous year.
Revenue by business segment
Revenue from external customersAs a percentage of sales
(%)31 March 31 March
2017 2016 Change 2017 2016HK$’000 HK$’000 (%)
Architectural builders’ hardware, bathroom collections and others 359,071 391,590 (8.3) 71.0 62.0Kitchen collection and furniture 146,910 240,342 (38.9) 29.0 38.0
505,981 631,932 (19.9) 100.0 100.0

– 15 –
Profitability by business segment
Reportable segment gross profit Gross profit margin (%)2017 2016 Change 2017 2016
HK$’000 HK$’000 (%)
Architectural builders’ hardware, bathroom collections and others 133,169 144,093 (7.6) 37.1 36.8Kitchen collection and furniture 78,270 123,864 (36.8) 53.3 51.5
211,439 267,957 (21.1) 41.8 42.4
Revenue from the architectural builders’ hardware, bathroom collections and others segment decreased by 8.3% to HK$359.1 million as compared to the previous year (2016: HK$391.6 million). The trend of building more small-sized residential units prevailed in the primary residential market in the current year. Products that cater for a compact living environment and having a lower unit price have become increasingly popular, while the sales of high-end products decreased during the year. The change in sales mix has caused a drop in turnover. During the year, we supplied products for projects such as Eden Manor, Harbour Glory, Mount Pavilia and Parc Inverness.
For the same reasons, revenue from the kitchen collection and furniture segment decreased by 38.9% to HK$146.9 million as compared to the previous year (2016: HK$240.3 million). In the previous year, we completed certain kitchen cabinet projects in the PRC which contributed to the major increment of revenue. No projects with similar scale took place in the PRC and the revenue from this segment was mainly contributed by sales in Hong Kong in the current year. During the year, we supplied products for projects like Castle One by V.
The overall gross profit of the Group amounted to HK$211.4 million (2016: HK$268.0 million), representing a decrease of 21.1% from the previous year. The gross profit margin remained stable as compared to the prior year.
The Group’s operating profit was HK$50.8 million (2016: HK$89.7 million), representing a decrease of 43.4% from the prior year. The decrease is mainly due to the drop of turnover which the impact was partially offset by the reduction in operating expenses and fair value gain on investment properties. The amount of administrative expenses and distribution expenses decreased by 7.2% to HK$166.8 million (2016: HK$179.8 million) mainly due to a write-back of provision for doubtful debts of HK$4.5 million and decrease in staff remuneration of HK$4.8 million during the year. Apart from that, we have strived hard to control costs and maintain effective use of resources.
– 16 –
FINANCIAL REVIEW
Liquidity and Financial Resources
The Group continues to expand its business in Hong Kong and the PRC while adopting a prudent financial management policy. The current ratio and quick ratio are 2.8 (2016: 2.4) and 1.7 (2016: 1.6), respectively. The increase in the current ratio and quick ratio was due to repayment of trade and other payables as well as borrowings, and in particular increased inventories led to an increase in the current ratio. Cash and cash equivalents approximated HK$79.7 million as at 31 March 2017 (2016: HK$127.8 million) and had been utilised in purchasing inventories pending for deliveries and repayment of borrowings.
Inventories increased to HK$146.1 million (2016: HK$130.6 million) mainly because bulk project orders were placed towards the end of the year which will be delivered to customers during the next financial year. The trade, retention and other receivables decreased slightly to HK$136.6 million (2016: HK$148.3 million), while the trade and other payables decreased to HK$43.0 million (2016: HK$69.3 million).
As at 31 March 2017, the Group has a net cash position. Gearing ratio is therefore not applicable (2016: same). The interest-bearing borrowings of the Group reduced to HK$38.1 million (2016: HK$58.9 million) as at 31 March 2017.
Treasury Policy
Borrowings and cash and cash equivalents are primarily denominated in Hong Kong Dollars (“HK$”) and Euro. The management will continue to monitor the foreign exchange risk exposure of the Group. During the year, we entered into certain simple forward contracts to buy Euro for settlement of purchases.
Contingent Liabilities
We seek to manage our cash flow and capital commitments effectively to ensure that we have sufficient funds to meet our existing and future cash requirements. We have not experienced any difficulties in meeting our obligations as they become due. Assets under charge include mortgaged property acquired and certain bank deposits. As at 31 March 2017, performance bonds of approximately HK$23,031,000 (2016: HK$16,465,000) have been issued by the Group to customers as security of contracts. In respect of which, restricted cash of HK$2,981,000 (2016: HK$2,966,000) was placed in bank as security for the performance bonds. Save for the rental commitment of our retail outlets and warehouses and performance bonds for projects, the Group has no other material financial commitments and contingent liabilities as at 31 March 2017.
– 17 –
FUTURE PROSPECTS
In the coming year, it is expected that Hong Kong will continue to be affected by political and economic uncertainties around the globe. The uncertainty of the final outcome of the negotiation of Brexit and of national elections in Europe might cause fluctuations in Euro and British pound rates. As the PRC economy has been moving in a slowdown phase after having achieved an average of an annual 9% growth in the past two decades and is now in the process of moving into a different model of growth and development, its economic performance for this coming year will have an impact on the economic development of Hong Kong. Locally, following the establishment of a new Government administration on 1 July 2017, it is expected that there may be a gradual change in property market strategies and fiscal policies in the next five years.
Measures to cope with the long-term housing demand will continue. The Government’s countercyclical measures may stay in place to stabilise the market. To meet with the general market affordability, the trends of building small units and bulk purchases of home-fittings at a lower cost will likely to continue. It is expected that the fierce market competition for architectural builders’ hardware and bathroom collections will be intensified; we shall continue to capitalise our expertise in bringing quality products and services to our customers.
We shall consolidate our current position as one of the leading suppliers of kitchen collection and furniture in order to cope with the ever-changing market environment. To fit with home-buyers’ budget, small-sized housing units will continue to dominate the primary residential market. We shall monitor and review this trend carefully from time to time, exploring new opportunities and sales channels in the market.
Our retail shop rental payments are expected to remain stable. We shall continue to improve operating efficiency and shop utilisation.
While enhancing our strength, we shall remain vigilant to external factors in order to stay competitive. The property market is affected by global, the PRC and local economic performance. Moreover, the Hong Kong Government’s fiscal and financial policies may create an adverse impact on Hong Kong real estate market. We will continue to monitor the market trends and refine our strategies from time to time accordingly.
Pursuant to the announcement on 2 November 2016, the Company is considering a proposed spin-off and separate listing of the Group’s kitchen and furniture business on the Main Board of The Stock Exchange of Hong Kong Limited. Details of the announcement are available on the websites of the Stock Exchange and the Company. As at the date of this announcement, the Company is still considering the proposed spin-off and separate listing.
– 18 –
SUSTAINABLE DEVELOPMENT
Sustainability is embedded in the Group’s business operations that creates sustainable value with its stakeholders in economic, environmental and social dimensions. The Group has developed a dedicated sustainability policy which directs its operations towards the best practice in areas such as business growth, environmental protection, employment and labour standards, operating practices and community involvement.
Full details of the Environmental, Social and Governance Report will be set out in the Annual Report 2017. The Group’s environmental and social policies are highlighted as below:
Environment
The Group endeavours to minimising pollution and protecting the environment by conserving natural resources, reducing the use of energy and waste. We first implement the business activities for which we bear responsibility and address the environmental issue by integrating environment considerations in our business. We create the environmental awareness amongst our staff members and whenever possible and practical to do so. Our aim is to contribute to the sustainable future and be in harmony with the global environment.
Customers
The Group’s objective is becoming one of the leading quality suppliers of architectural builders’ hardware, bathroom, kitchen collections and furniture. Our goal is to enhance the brand value of the Group by managing customers’ expectation of getting products that commensurate with their lifestyles. We strive to provide quality products and services to fulfil customers’ needs; establish the brand and reputation of our Group for customers’ recognition of our ability to serve them with two fundamental qualities, “sincerity” and “quality”, which would enable us to build customer loyalty, allowing us to establish strong customer relationships for future businesses.
Human Resources
As at 31 March 2017, our workforce was recorded at 164 employees (2016: 169).
The Group believes its success, long-term growth and development depend upon the quality, performance and commitment of its staff members. We are committed to providing equal opportunity to our staff, matching the right people with the right job, and offering them a suitable platform to develop and excel in their career. We are committed to the provision of a healthy and safe workplace and encourage work-life balance of staff members.
Suppliers
We pay attention to the operating practices of our suppliers (including but not limited to employment practices, product responsibility, anti-corruption). We regularly conduct factory visits. In view of the growing environmental awareness in Hong Kong, we requested for green features in our products, such as water flow control and Forest Stewardship Council-certified materials.

– 19 –
CORPORATE GOVERNANCE
The Company is committed to achieving high standards of corporate governance to properly protect and promote the interests of its shareholders.
Full details of the Corporate Governance Report will be set out in the 2017 Annual Report of the Company.
COMPLIANCE OF CODE ON CORPORATE GOVERNANCE PRACTICES
In the opinion of the directors, the Company has complied with all the code provisions listed in the Corporate Governance Code as set out in Appendix 14 of the Listing Rules throughout the year ended 31 March 2017, with the exception of the following deviations:
Under the code provision A.1.8, the Company should arrange appropriate insurance cover in respect of legal action against its directors. An insurance cover for directors has been arranged effective from 1 September 2016; and that prior to the said date no insurance cover had been arranged.
Under the code provision C.2.5, the Company should have an internal audit function. Given the current scale of operations, the Company does not have an internal audit department. The Board is directly responsible for risk management and internal control systems of the Group and for the review of its effectiveness. The Board will continue review this arrangement going forward in light of the evolving needs of the Group.
COMPLIANCE OF MODEL CODE FOR SECURITIES TRANSACTIONS
The Group has adopted the Model Code for Securities Transactions by Directors of Listed Issuers (the “Model Code”) as set out in Appendix 10 of the Listing Rules as its own code of conduct regarding securities transactions by directors. Having made specific enquiry of the directors, all directors confirmed they have complied with the required standards set out in the Model Code throughout the year ended 31 March 2017.
AUDIT COMMITTEE
The Audit Committee comprises three independent non-executive directors of the Company, namely, Mr. LEUNG Kwong Kin, J.P. (Chairman), Mr. WONG Wah, Dominic and Mr. WAN Sze Chung. The Audit Committee has reviewed, with the management, the accounting principles and practices adopted by the Group and discussed auditing, internal controls and financial reporting matters including a review of the consolidated financial statements for the year ended 31 March 2017.

– 20 –
DIVIDEND
The Board declared and paid an interim dividend of HK1.5 cents per share for the six months ended 30 September 2016 (six months ended 30 September 2015: interim dividend of HK1.5 cents1 per share).
The Board has resolved to recommend, at the forthcoming Annual General Meeting (the “AGM”) to be held on 12 September 2017, a final dividend of HK2.5 cents (2016: HK2 cents1) per share for the year ended 31 March 2017 (the “Final Dividend”). The Board does not recommend a special dividend for the year ended 31 March 2017 (2016: HK5 cents1 per share).
If it is duly approved by the members at the AGM, the Final Dividend will be distributed to members, whose names appear on the principal or branch register of members of the Company in the Cayman Islands or Hong Kong respectively (collectively the “Register of Members”) as at the close of business on 20 September 2017. The payment will be made on 11 October 2017.
1 Adjusted for the effect of the bonus shares issue on 8 June 2016.
SCOPE OF WORK OF PRICEWATERHOUSECOOPERS
The figures in respect of the Group’s consolidated statement of financial position, consolidated statement of comprehensive income and the related notes thereto for the year ended 31 March 2017 as set out in the preliminary announcement have been agreed by the Group’s auditor, PricewaterhouseCoopers, to the amounts set out in the Group’s audited consolidated financial statements for the year. The work performed by PricewaterhouseCoopers in this respect did not constitute an assurance engagement in accordance with Hong Kong Standards on Auditing, Hong Kong Standards on Review Engagements or Hong Kong Standards on Assurance Engagements issued by the Hong Kong Institute of Certified Public Accountants and consequently no assurance has been expressed by PricewaterhouseCoopers on the preliminary announcement.
CLOSURE OF REGISTER OF MEMBERS
The register of members of the Company will be closed as follows:
(a) For the purpose of determining shareholders who are entitled to attend and vote at the AGM, the register of members of the Company will be closed from 5 September 2017 to 12 September 2017, both days inclusive, during which period no transfer of shares will be registered. In order to qualify for the right to attend and vote at the AGM, all transfers accompanied by the relevant share certificates must be lodged with the Company’s branch share registrar in Hong Kong, Tricor Abacus Limited at Level 22, Hopewell Centre, 183 Queen’s Road East, Hong Kong no later than 4:30 p.m. on 4 September 2017.

– 21 –
(b) For the purpose of determining shareholders who qualify for the Final Dividend, the register of members of the Company will be closed from 19 September 2017 to 20 September 2017, both days inclusive, during which period no transfer of shares will be registered. In order to qualify for the Final Dividend, all transfers accompanied by the relevant share certificates must be lodged with Tricor Abacus Limited at Level 22, Hopewell Centre, 183 Queen’s Road East, Hong Kong no later than 4:30 p.m. on 18 September 2017.
PURCHASE, SALE OR REDEMPTION OF SHARES
The Company had not redeemed any of its shares during the year. Neither the Company nor any of its subsidiaries had purchased or sold any of the Company’s shares during the year.
PUBLICATION OF FINANCIAL INFORMATION
This result announcement is published on the websites of the Company (www.ebon.com.hk) and The Stock Exchange of Hong Kong Limited (http://www.hkexnews.hk). The Company’s Annual Report 2017 will be despatched to the shareholders and available on the same websites in due course.
By Order of the BoardTSE Sun Fat, Henry
Chairman
Hong Kong, 27 June 2017
Website: www.ebon.com.hk
As at the date hereof, the Board of Directors comprises eight Directors, of which five are Executive Directors, namely Messrs. TSE Sun Fat, Henry, TSE Sun Wai, Albert, TSE Sun Po, Tony, TSE Hon Kit, Kevin and LAU Shiu Sun and three are Independent Non-executive Directors, namely Messrs. LEUNG Kwong Kin, J.P., WONG Wah, Dominic and WAN Sze Chung.


![Earnings Report - content.vivaaerobus.com€¦ · Short-term liabilities [Loans and borrowings, accounts receivables, wages, taxes to be paid, etc.] Short-term loans and borrowings](https://static.fdocuments.in/doc/165x107/608249c544b4f74ff8667d11/earnings-report-short-term-liabilities-loans-and-borrowings-accounts-receivables.jpg)


