Annika Falkengren - SEB · * Excluding Bond Investment Portfolio. ... 0.5 1.0 1.5 2.0 Q2-08 Q3 Q4...
17
Annika Falkengren President & CEO Result presentation Q2 2011
Transcript of Annika Falkengren - SEB · * Excluding Bond Investment Portfolio. ... 0.5 1.0 1.5 2.0 Q2-08 Q3 Q4...
Annika Falkengren President & CEO
Result presentation
Q2 2011
22
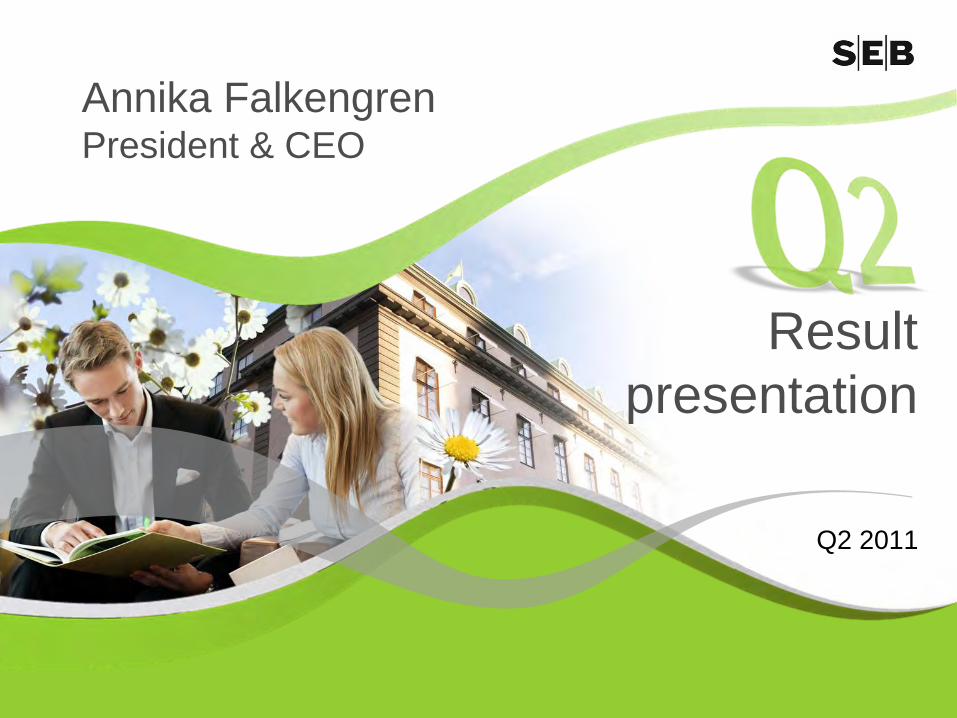
Balance sheet stronger than ever
Highlights
Core Tier 1
Operating profit SEK 4.3bn
Operating profit
Continued progress of corporate expansion plan
Credit volume
13.5%
+91bn
Q1-10 Q2-10 Q3-10 Q4-10 Q1-11 Q2-11

3
Operating profit (SEK bn)
Profit and loss trendProfit and loss development Q2-09 –
Q2-11 (SEK bn)
9.5
5.9
0.6
Operating income Operating expenses Net credit lossesQ2-11 Q2-11 Q2-11
3.6
4.3
Q2-09 Q3-09 Q4-09 Q1-10 Q2-10 Q3-10 Q4-10 Q1-11 Q2-11

4
0.80.8
3.64.2
0.81.2
3.54.3
Income statement Q2 2011
9%10%
Q1-11 Q2-11 Q1-11 Q2-11 Q1-11 Q2-11 Q1-11 Q2-11
Profit and loss (SEK m)
Net
interest
income
Net
fee
and commissions
Net
financial
income
Net
life insurance
income
37%
44%
8%
11%
Operating income by type, Q2 vs. Q1 (SEK bn)
Q2-11 Q1-11 % H1-11 H1-10 %Total operating income 9,529 9,672 -1 19,201 17,959 7Total operating expenses -5,888 -5,841 1 -11,729 -11,538 2
Profit before credit losses 3,641 3,831 -5 7,472 6,421 16Net credit losses etc 637 543 17 1,180 -2,459 nmOperating profit 4,278 4,374 -2 8,652 3,962 118

5
Funding & otherDeposits
NII Q2 2008 –
Q2 2011 (SEK bn)
NII by income type 2008 –
Q2 2011
(SEK bn)
5
Lending
0
1
2
3
4
5
6
Q2-08 Q3 Q4 Q1-09 Q2 Q3 Q4 Q1-10 Q2 Q3 Q4 Q1-11 Q2
Net interest income development
0.8
Q2-08
Q3 Q4 Q1-09
Q2 Q3 Q4 Q1-10
Q2 Q3 Q4 Q1-11
Q2
0.5
Q2-08
Q3 Q4 Q1-09
Q2 Q3 Q4 Q1-10
Q2 Q3 Q4 Q1-11
Q2
2.9
Q2-08
Q3 Q4 Q1-09
Q2 Q3 Q4 Q1-10
Q2 Q3 Q4 Q1-11
Q2

6
Fees & commissions Q2 2008 –
Q2 2011 (SEK bn)
6
0
1
2
3
4
5
Q2-08 Q3 Q4 Q1-09 Q2 Q3 Q4 Q1-10 Q2 Q3 Q4 Q1-11 Q2
Custody & mutual fundsSecondary markets & derivatives
New issues & advisory Payments, cards, lending, deposits & guarantees
0.5
Q2-08
Q4 Q2-09
Q4 Q2-10
Q4 Q2-11
1.8
Q2-08
Q4 Q2-09
Q4 Q2-10
Q4 Q2-11
2.3
Q2-08
Q4 Q2-09
Q4 Q2-10
Q4 Q2-11
Fees & commissions by income type Q2 2008 –
Q2 2011 (SEK bn, gross)
0.2
Q2-08
Q4 Q2-09
Q4 Q2-10
Q4 Q2-11
Commission income development

7
Net financial income development
7
Low risk trading orientation
Jan-08
Apr-08
Jul-08
Oct-08
Jan-09
Apr-09
Jul-09
Oct-09
Jan-10
Apr-10
Jul-10
Oct-10
Jan-11
Apr-11
Jul-11
* Excluding Bond Investment Portfolio
Daily trading income 2008 –Q2 2011. 41 negative out of 1,149 trading days. Average loss SEK 14m
Reported Group NFI Q2 2008 –
Q2 2011 (SEK bn)
0.0
0.5
1.0
1.5
2.0
Q2-08 Q3 Q4 Q1-09 Q2 Q3 Q4 Q1-10 Q2 Q3 Q4 Q1-11 Q2
Excluding
German
Retail
hedge

8
Asset quality
Credit losses Baltic region
(SEK bn)Credit losses* outside Baltic region (SEK bn)
-0.3 -0.4
-0.9
-1.7
-2.6 -2.6 -2.6
-1.4
-0.5
0.3
0.7 0.6 0.7
Q2 Q3 Q4 Q1-09
Q2 Q3 Q4 Q1-10
Q2 Q3 Q4 Q1-11
Q2
* Continuing operations
-0.1-0.3
-0.8-0.6
-0.8-0.6 -0.5 -0.4
-0.2-0.1
-0.30.00.0
Q2 Q3 Q4Q1-09 Q2 Q3 Q4
Q1-10 Q2 Q3 Q4
Q1-11 Q2
Group credit
loss level
Q2 2011 -20bps

9
Asset quality
Continued NPL reduction in Baltics
(SEK bn)Low credit loss levels outside Baltics
(bps)
* Continuing operations
Group credit
loss level
Q2 2011 -20bps
-0.5
-0.1
-0.9
-1.2
-0.9-1.0
Q1-10 Q2 Q3 Q4 Q1-11 Q2
~SEK 1bnreduction
per quarter
4 5
18 17
6 5
14
10 9
22
13
1
2006 2007 2008 2009 2010 H1 2011
Nordics Germany

-450 +572 +679(Credit
provisions)
2,001
648
309
507
997
Merchant Banking Retail Banking Wealth Management Life Baltic
Q2-10 Q1-11 Q2-11
Operating profit Q2-11 vs. previous quarters (SEK m)
1010
Divisional performance
11
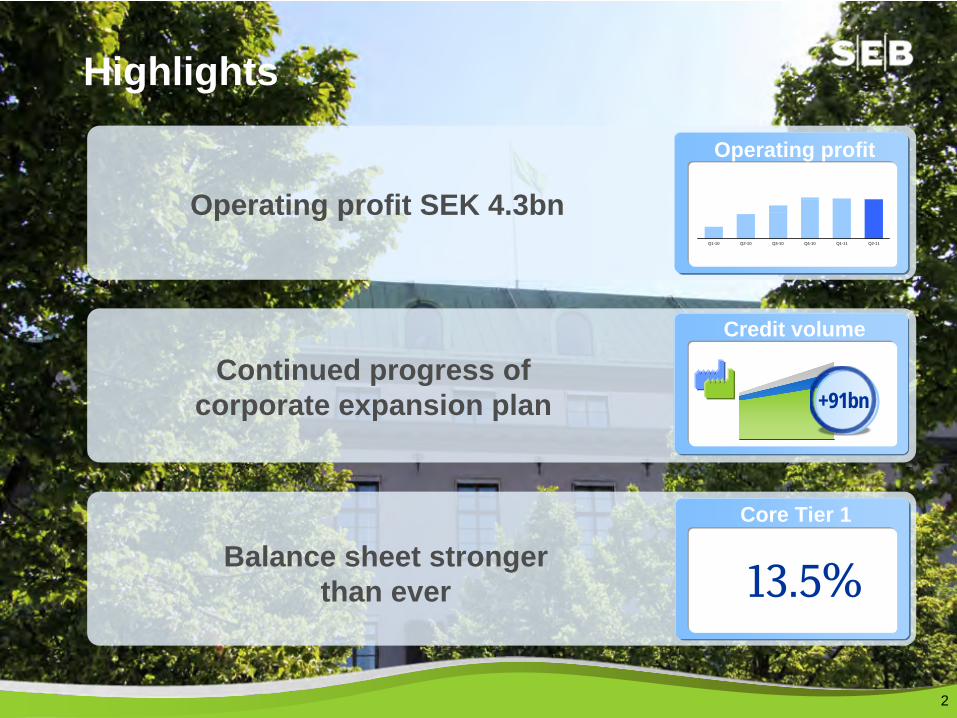
Geographic
performance Operating profit (SEK bn)
11
1.4
2.0
Q1-11 Q2-11
Sweden
Denmark, Finland, and
Norway
Baltic countries
Germany
0.9 0.9
Q1-11 Q2-11
1.01.1
Q1-11 Q2-11
0.3 0.4
Q1-11 Q2-11

12
Loans and commitments:
Large corporates Nordic and German expansion* continues
12
Large cap clients:
Client executives:
+91bn
Top FX-provider Best supplier of Trading and Capital Markets Operations
Mandated lead arranger EUR 1,300m
Mandated lead arranger EUR 2,000m
MLA/bookrunner
EUR 750m
MLA/bookrunner
EUR 2,000m
Best Sub-custodian Bank Best Supply Chain Finance Provider
+94
+136
Best Bank
Best M&A House
Best Cash Management House
* Statistics since launch of expansion 1 Jan 2010

SMEs
and private customers Meeting
customers’
advisory
needs*
Pri
vate
SMEs
** Cash management SME customers
+7bn private
deposits
48%fixed-rate
mortgages
+0.1%market share
gain
per month
5,000new SME
customers**
+17bn Private Banking
AuM
inflow
13
0
20,000
40,000
60,000
80,000
100,000
120,000
2005 2007 2009 Q2 2011
No. SME customers**
-30
-10
10
30
50
70
2005 2007 2009 2011
SEB
Mutual
fund
sales
Sweden***
*** Cumulative incl
PPM (Svensk
Fondstatistik)
+14bnnew lending
volume
* Statistics for H1 2011

14
Private customers Meeting customers wherever they are
Internet bank:33.2 million visits
Mobile banking:3.2 million visits
Telephone bank:1.2 million calls
Branch offices:965,000 visits
14
* Statistics
for H1 2011

Balance sheet strength
Tier 1 ratio 15.6%
>2 years matched funding
Liquidity
reserve
SEK 467bn
Leverage ratio 16x (FDIC)
Reserve ratio 65%
Core Tier 1 ratio 13.5%
12.2% 13.5%
Dec-10 Jun-11Core
Tier
1 ratio (Full Basel II)
Strong capital generation
Long-term funding raised (SEK bn)
Cap
ital
Fund
ing
0
10
20
30
40
50
15
78bnQ1-
10
Q2 Q3 Q4 Q1-
11
Q2
1616
Balance sheet strength ensures SEB can continue to support customers
Elevated short-term macroeconomic risks
SEB maintains its strategic direction and growth plans are on track
Outlook 2011

17
SEB –
The leading relationship bank
in our part of the world
17