Annexures for Chapter 2 -...
182
223 Annexures for Chapter 2 Annexure-2.1 List of Agricultural Universities in India State Universities Andhra Pradesh 1. Acharya N.G. Ranga Agricultural University, Rajendranagar, Hyderabad-500 030 2. Andhra Pradesh Horticulture University Tadepalligudem, Andhra Pradesh - 534 101 3. Sri Venkateswara Veterinary University Tirupati, Chitor 517 502 Assam 4. Assam Agricultural University Jorhat-785 012, Assam Bihar 5. Bihar Agricultural University Sabour -813 210, Bhagalpur District, Bihar 6. Rajendra Agricultural University Pusa, Samastipur 848 125 , Bihar Chhattisgarh 7. Indira Gandhi Krishi Vishwavidyalaya Raipur 492 012, Chhattisgarh Delhi 8. Indian Agricultural Research Institute, New Delhi 110012 (Deemed Univ) Gujarat 9. Anand Agricultural University Anand 388 110, Gujarat 10. Junagadh Agricultural University Junagadh 362 001, Gujarat 11. Navasari Agricultural University Navsari 396450, Gujarat 12. Sardarkrushinagar – Dantiwada Agricultural University Sardar Krushinagar, District Banaskantha 385 506, Gujarat 13. Kamdhenu University for Veterinary, Dairy Science and Fisheries, Himmatnagar, Sabarkantha-383001, Gujarat* Haryana 14. Ch Charan Singh Haryana Agricultural University Hisar, 125004 Haryana 15. Lala Lajpat Rai University of Veterinary & Animal Sciences, Hisar 125001 Haryana* 16. National Dairy Research Institute, Karnal 132 001 (Deemed Univ) Himachal Pradesh 17. CSK Himachal Pradesh Krishi Vishvavidyalaya Palampur 176 062, Himachal Pradesh 18. Dr Yashwant Singh Parmar University of Agriculture & Forestry Solan, Nauni 173 230, Himachal Pradesh Jammu & Kashmir 19. Sher-E-Kashmir University of Agricultural Sciences & Technology Jammu 180 012, Jammu & Kashmir 20. Sher-E-Kashmir of Agricultural Sciences & Technology of Kashmir Srinagar 191 121, Jammu & Kashmir Jharkhand 21. Birsa Agricultural University Kanke. Ranchi 834 006, Jharkhand Karnataka 22. University of Agricultural Sciences
Transcript of Annexures for Chapter 2 -...

223
Annexures for Chapter 2
Annexure-2.1
List of Agricultural Universities in India
State Universities
Andhra
Pradesh
1. Acharya N.G. Ranga Agricultural University,
Rajendranagar, Hyderabad-500 030
2. Andhra Pradesh Horticulture University
Tadepalligudem, Andhra Pradesh - 534 101
3. Sri Venkateswara Veterinary University
Tirupati, Chitor 517 502
Assam 4. Assam Agricultural University
Jorhat-785 012, Assam
Bihar 5. Bihar Agricultural University
Sabour -813 210, Bhagalpur District, Bihar
6. Rajendra Agricultural University
Pusa, Samastipur 848 125 , Bihar
Chhattisgarh 7. Indira Gandhi Krishi Vishwavidyalaya
Raipur 492 012, Chhattisgarh
Delhi 8. Indian Agricultural Research Institute, New Delhi 110012 (Deemed
Univ)
Gujarat 9. Anand Agricultural University
Anand 388 110, Gujarat
10. Junagadh Agricultural University
Junagadh 362 001, Gujarat
11. Navasari Agricultural University
Navsari 396450, Gujarat
12. Sardarkrushinagar – Dantiwada Agricultural University
Sardar Krushinagar, District Banaskantha 385 506, Gujarat
13. Kamdhenu University for Veterinary, Dairy Science and Fisheries,
Himmatnagar, Sabarkantha-383001, Gujarat*
Haryana 14. Ch Charan Singh Haryana Agricultural University
Hisar, 125004 Haryana
15. Lala Lajpat Rai University of Veterinary & Animal Sciences, Hisar
125001 Haryana*
16. National Dairy Research Institute, Karnal 132 001 (Deemed Univ)
Himachal
Pradesh
17. CSK Himachal Pradesh Krishi Vishvavidyalaya
Palampur 176 062, Himachal Pradesh
18. Dr Yashwant Singh Parmar University of Agriculture & Forestry
Solan, Nauni 173 230, Himachal Pradesh
Jammu &
Kashmir
19. Sher-E-Kashmir University of Agricultural Sciences & Technology
Jammu 180 012, Jammu & Kashmir
20. Sher-E-Kashmir of Agricultural Sciences & Technology of
Kashmir Srinagar 191 121, Jammu & Kashmir
Jharkhand 21. Birsa Agricultural University
Kanke. Ranchi 834 006, Jharkhand
Karnataka 22. University of Agricultural Sciences

224
GKVK, Bangalore 560 065 , Karnataka
23. University of Agricultural Sciences
Dharwad 580 005, Karnataka
24. University of Agricultural Sciences
Raichur-584 102, Karnataka
25. Karnataka Veternary, Animal and Fisheries Sciences University,
Nandinagar, Bidar-585 401, Karnataka
26. University of Horticultural Sciences
Bagalkot-587 102, Karnataka
Kerala 27. Kerala Agricultural University
Vellanikkara, Trichur 680 656, Kerala
28. Kerala Veterinary and Animal Sciences University
Thiruvananthapuram, 695004, Kerala
29. Kerala University of Fisheries and Ocean Studies
Panangad, Kochi 682506 Kerala*
Madhya
Pradesh
30. Jawaharlal Nehru Krishi Viswavidyalaya
Jabalpur 482 004, Madhya Pradesh
31. Rajmata Vijayraje Sciendia Krishi Vishwa Vidyalaya
Gwalior-474002, Madhya Pradesh
32. Madhya Pradesh Pashu-Chikitsa Vigyan Vishwavidyalaya
Jabalpur 48200, Madhya Pradesh*
Maharashtra 33. Dr Balasaheb Sawant Konkan Krishi Vidyapeeth,
Dapoli District , Ratnagiri 415 712, Maharashtra
34. Dr Panjabrao Deshmukh Krishi Vidyapeeth, Krishi nagar
Akola 444 104, Maharashtra
35. Mahatma Phule Krishi Vidyapeeth
Rahuri 413 722, Maharashtra
36. Marahtwada Agricultural University
Parnhani 431 402, Maharashtra
37. Maharashtra Animal Science & Fishery University, Nagpur
440 006, Maharashtra
38. Central Institute of Fisheries Education, Mumbai-61 (Deemed
Univ)
Manipur 39. Central Agricultural University
Imphal 795 004 Manipur
Orissa 40. Orissa University of Agriculture & Technology
Bhubaneshwar 751 003, Orissa
Punjab 41. Guru Angad Dev Veterinary and Animal Science University
Ludhiana- 141004, Punjab
42. Punjab Agricultural University
Ludhiana 141 004 , Punjab
Rajasthan 43. Maharana Pratap University of Agriculture & Technology
Udaipur, Rajasthan 313 001
44. Rajasthan Agricultural University
Bikaner 334 006 , Rajasthan
45. Rajasthan University of Veterinary and Animal Sciences
Bikaner-334 001, Rajasthan
Tamil Nadu 46. Tamil Nadu Agricultural University
Coimbatore 641 003, Tamil Nadu
47. Tamil Nadu Veterinary and Animal Sciences University

225
Chennai 600 051, Tamil Nadu
Uttaranchal 48. Govind Ballabh Pant University of Agriculture & Technology
Pantnagar 263 145, Uttaranchal
Uttar Pradesh 49. Chandra Shekar Azad University of Agriculture & Technology
Kanpur 208 002, Uttar Pradesh
50. Narendra Deva University of Agriculture & Technology
Kumarganj, Faizabad 224 229, Uttar Pradesh
51. Sardar Vallabh Bhai Patel University of Agriculture & Technology,
Modipuram, Meerut-250 110, Uttar Pradesh
52. UP Pandit Deen Dayal Upadhaya Pashu Chikitsa Vigyan Vishwa
Vidhyalaya, Mathura-281001, Uttar Pradesh
53. Sam Higginbotom Institute of Agriculture, Technology and
Services, Allahabad-211 007, Uttar Pradesh (Deemed University)
54. Indian Veterinary Research Institute
Izatnagar 243122, Uttar Pradesh (Deemed University)
West Bengal 55. Bidhan Chandra Krishi Viswavidyalaya
Mohanpur, Kalyani, Nadia-741 252, West Bengal
56. Uttar Banga Krishi Viswavidyalaya
District Cooch Bihar-736 165, West Bengal
57. West Bengal University of Animal and Fishery Sciences
Kolkata-700 037, West Bengal
Source: ICAR, New Delhi. taken from www.icar.org.in on July 30, 2011
* New universities established recently and are not listed on ICAR web site
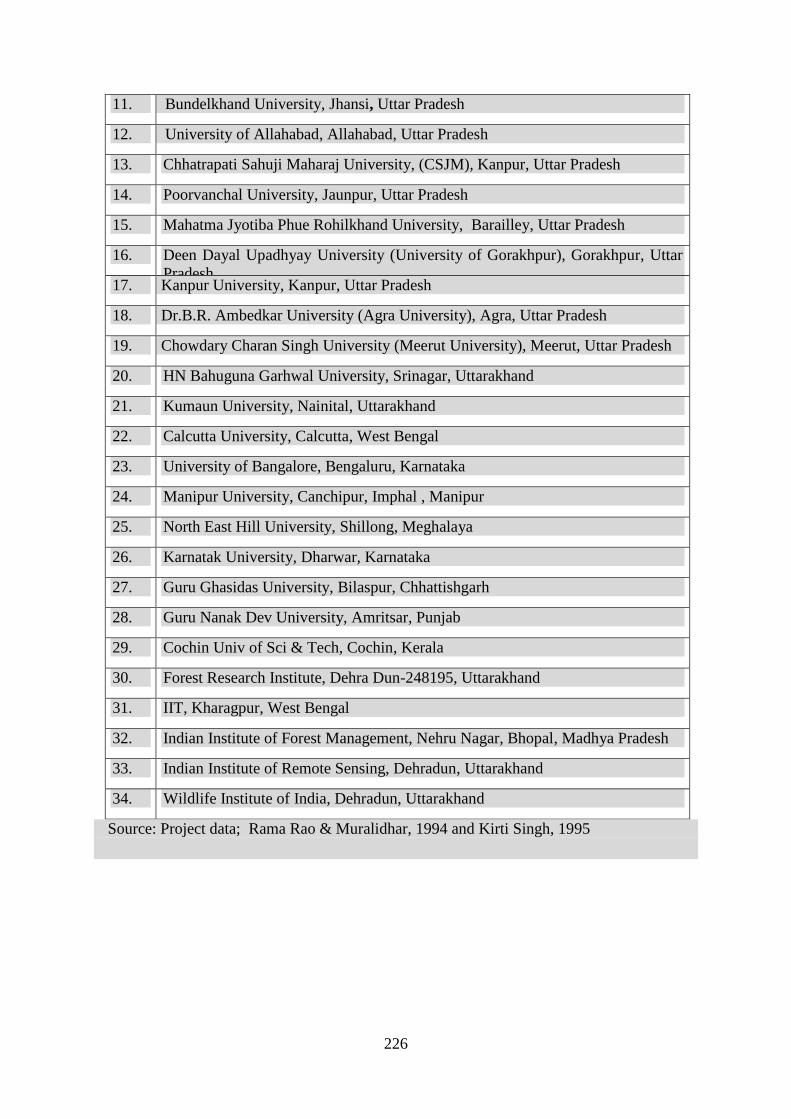
Others Universities and Institutions having Agriculture Faculty
S.No. Name of the University
Central Universities
1. Aligarh Muslim University (AMU), Aligarh-202002, Uttar Pradesh
2. Banaras Hindu University (BHU), Varanasi, 221005, Uttar Pradesh
3. Visva-Bharati University, Santiniketan – 731235, West Bengal
4. Nagaland University, Kohima- 797001, Nagaland
Others
5. Osmania University, Hyderabad-500007, Andhra Pradesh
6. Mahatma Gandhi Gramodyog Viswavidyalaya, Chitrakoot, Madhya Pradesh
7. MDS University, Ajmer, Rajasthan
8. Universityof Rajasthan, Jaipur, Rajasthan
9. Annamalai University, Annamalainagar, Tamil Nadu
10. Gandhi Gram Rural Institute, Gandhigram, Tamil Nadu
226
11. Bundelkhand University, Jhansi, Uttar Pradesh
12. University of Allahabad, Allahabad, Uttar Pradesh
13. Chhatrapati Sahuji Maharaj University, (CSJM), Kanpur, Uttar Pradesh
14. Poorvanchal University, Jaunpur, Uttar Pradesh
15. Mahatma Jyotiba Phue Rohilkhand University, Barailley, Uttar Pradesh
16. Deen Dayal Upadhyay University (University of Gorakhpur), Gorakhpur, Uttar
Pradesh 17. Kanpur University, Kanpur, Uttar Pradesh
18. Dr.B.R. Ambedkar University (Agra University), Agra, Uttar Pradesh
19. Chowdary Charan Singh University (Meerut University), Meerut, Uttar Pradesh
20. HN Bahuguna Garhwal University, Srinagar, Uttarakhand
21. Kumaun University, Nainital, Uttarakhand
22. Calcutta University, Calcutta, West Bengal
23. University of Bangalore, Bengaluru, Karnataka
24. Manipur University, Canchipur, Imphal , Manipur
25. North East Hill University, Shillong, Meghalaya
26. Karnatak University, Dharwar, Karnataka
27. Guru Ghasidas University, Bilaspur, Chhattishgarh
28. Guru Nanak Dev University, Amritsar, Punjab
29. Cochin Univ of Sci & Tech, Cochin, Kerala
30. Forest Research Institute, Dehra Dun-248195, Uttarakhand
31. IIT, Kharagpur, West Bengal
32. Indian Institute of Forest Management, Nehru Nagar, Bhopal, Madhya Pradesh
33. Indian Institute of Remote Sensing, Dehradun, Uttarakhand
34. Wildlife Institute of India, Dehradun, Uttarakhand
Source: Project data; Rama Rao & Muralidhar, 1994 and Kirti Singh, 1995
227
Annexure-2.2
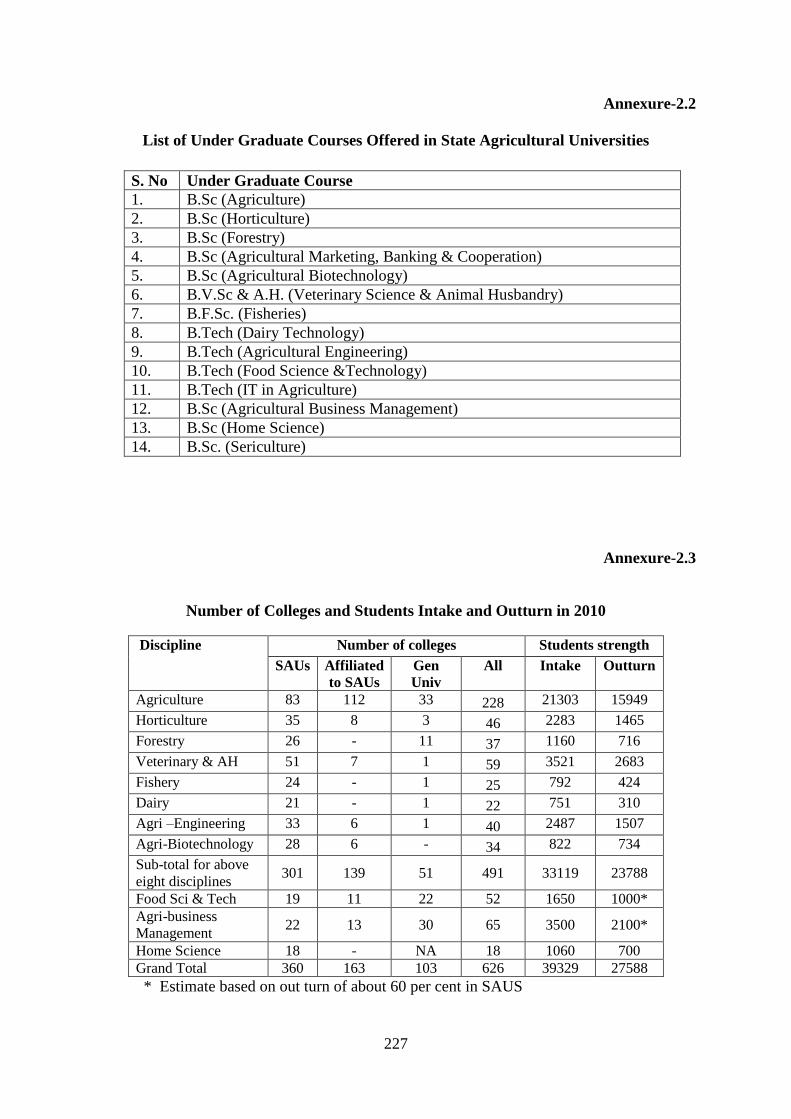
List of Under Graduate Courses Offered in State Agricultural Universities
S. No Under Graduate Course
1. B.Sc (Agriculture)
2. B.Sc (Horticulture)
3. B.Sc (Forestry)
4. B.Sc (Agricultural Marketing, Banking & Cooperation)
5. B.Sc (Agricultural Biotechnology)
6. B.V.Sc & A.H. (Veterinary Science & Animal Husbandry)
7. B.F.Sc. (Fisheries)
8. B.Tech (Dairy Technology)
9. B.Tech (Agricultural Engineering)
10. B.Tech (Food Science &Technology)
11. B.Tech (IT in Agriculture)
12. B.Sc (Agricultural Business Management)
13. B.Sc (Home Science)
14. B.Sc. (Sericulture)
Annexure-2.3
Number of Colleges and Students Intake and Outturn in 2010
Discipline Number of colleges Students strength
SAUs Affiliated
to SAUs
Gen
Univ
All Intake Outturn
Agriculture 83 112 33 228 21303 15949
Horticulture 35 8 3 46 2283 1465
Forestry 26 - 11 37 1160 716
Veterinary & AH 51 7 1 59 3521 2683
Fishery 24 - 1 25 792 424
Dairy 21 - 1 22 751 310
Agri –Engineering 33 6 1 40 2487 1507
Agri-Biotechnology 28 6 - 34 822 734
Sub-total for above
eight disciplines 301 139 51 491 33119 23788
Food Sci & Tech 19 11 22 52 1650 1000*
Agri-business
Management 22 13 30 65 3500 2100*
Home Science 18 - NA 18 1060 700
Grand Total 360 163 103 626 39329 27588
* Estimate based on out turn of about 60 per cent in SAUS

228
Annexures for Chapter 3
Annexure-3.1
Methodology Adopted for Forecasting
Step 1: Identify different subsectors of the sector that are important absorbers of
manpower of the discipline under consideration:
This is done on the basis of experience, judgment and consultation.
Step 2: Estimate the total employment in different subsectors in 2009-10
The methods used differ from subsector to subsector depending on the availability of
information. Generally the following methods are used;
a) In the case of some sub-sectors data on total employment is available from other
sources, for 2009-10 or e recent year. In such cases, the estimate for 2009-10 has been
obtained on the basis of trend analysis. Such subsectors are, for example,
Sub-sector Source Nature of data
Banks Banking Statistics of Reserve
Bank of India
No. of officers and others
each year latest being 2008-
09
Different Processing
industries (Dairy, agro-, fruit,
meat, fish, etc.
Annual Survey of Industries,
CSO
Total employment, number
of factories, each year, latest
being 2005-06
Input industries like
fertilizers, pesticides,
agricultural equipment,
animal feed, etc.
-do- -do-
Output absorbing industries
like, pharmaceuticals, paper,
wood processing,
-do- -do-
Government departments
dealing with the subsector
Websites of the respective
departments
Total employment, classified
by posts
ICAR institutions PERMISNET of ICAR Data obtained as in April
2010 from ICAR
Teaching staff in the SAUs Institutional schedules from
SAUs
Data on teachers by
qualification and field 2009-
10
b) For some sub-sectors, data for total employment is not available, but only on the number
of units in the sub-sector. Examples of such subsectors are :
Sub-sector Source Nature of data
Seeds Seed producers’ Association No. of plants of different
sizes, 2009-10
Nurseries 11th Plan Working group on
Horticulture, National
Horticultural Mission,
Number of nurseries in 2003-
04 and year-wise new
nurseries each year for
subsequent years

229
Dairy plants Animal Husbandry Statistics,
D/Animal Husbandry,
published in IASRI Data
Books for various years
Number of plants and
processing capacity in
cooperative, private and
publics sectors
Aqua-culture units Coastal Aqua Culture
Authority, data available
from web-site
No. of units of different sizes
in 2009-10
Fishing equipment IASRI Data book for various
years
Vessels of different types
In these cases, the total number of units in 2009-10 is first estimated. Employment per unit is
obtained from Establishment Survey and total employment in the subsector is obtained by
multiplying the number of units by the per-unit employment.
In some cases, per unit employment could not be estimated from Establishment Survey due to
data problems. In such cases, norms available from various sources have been used. For
example, in the fisheries sector, such norms as are available from CIFE were used to estimate
the employment in fish hatcheries, etc.
Step 3: Projection of total employment till 2019-20
This has been done using past trends, target growth rates, Plan targets, likely achievements
based on judgment and consultation with experts
Step 4: Breaking up the total employment by discipline and level of qualification
(diploma/UG/PG/PhD)
This is done on the basis of proportions obtained from Establishment Survey for each year,
assuming generally that the proportions of the base year hold good for the next ten years.
Where necessary some judgmental adjustments have been made.
The above 4 steps lead to estimates of stock of manpower (of specific discipline) expected to
be required each year up to 2019-20.
Step 5: Conversion of stock estimates to flow estimates.
The flows of manpower required in each year have been derived from the stock estimates
taking into account
i) annual increment, being the excess of stock demand in a year over the previous year;
ii) requirement due to attrition calculated as 3% of the previous year’s stock in all sectors
except in Biotechnology where it is taken as 1% due to youthful ness of the stock, and
iii) adjustment for the fact that in any year, a number of alumni would be pursuing higher
education at PG and PHD levels and therefore not available for economic activities.
These flow estimates give the likely outturns required from the educational system in the
future years. The corresponding intake levels would depend on the drop out ratios and
non-participation in economic activities after completing education.

230
Annexure-3.2
Estimation of Manpower Replacement Needs
The agricultural manpower attrition rates for the projection period 2010-11 to 2029-20 have
been estimated in the following manner. Total attrition factor comprises of depletion of
manpower stocks due to
a) Retirements
b) Deaths
c) Migration
d) Other factors like voluntary withdrawal from labour force
A. Retirements
The average retirement age in government and other public sector organizations may be taken
as 60 (It varies from 58 to 60 in State governments and may go up to 62 in central research
organizations). Assuming this average age of retirement, those who retire during the
projection period of 2010-11 to 2019-20 would be those who entered labour force 38 years
earlier in the case of graduates, 36 years earlier in the case of post-graduates and 33 years
earlier in the case of doctorates), that is, during the years 1972-81 for graduates, 1974-83 for
post-graduates and 1977-86 for doctorates. Year of entry into labour force may be roughly
taken as the year of passing, as any time lag would bring in those who passed in earlier and
leave out those who passed out in the later years, which are likely to cancel out each other,
when the whole period is considered.
Available data on out-turns of agricultural graduates, post-graduates and doctorates during
the years 1970 to 1990 is given below:
Out-turn of Agricultural Human Resources (1970-90)
Year Outturn during the year
Graduates Post-graduates Doctorates
1970 5909 1670 217
1974 4505 1419 287
1975 3966 1511 289
1978 6280 2384 422
1979 6280 2384 480
1984 8116 2785 678
1985 8257 3119 782
1986 7414 2767 684
1987 7810 2827 832
1988 7757 2752 832
1989 8301 2876 792 Source: Department of Science and Technology, Research and Development Statistics, 2007-08. Data for some
years 1971to1973,1976, 1977, and1980 to 1983 are not available.
The average annual outturns for the relevant periods were estimated at 5,843 for graduates,
2,267 for post-graduates and 609 for doctorates respectively on the basis of the above
available information. Thus, the total attrition due to retirements works out to 8,719 or, say,

231
9,000 during the projection period. The estimated stock requirement for the year 2009-10 in
various disciplines is given below:
Estimated Stock of Agricultural Manpower Required in 2009-10
Discipline Graduates Post-
graduates Doctorates All
Crop sciences 211929 59689 22041 293659
Horticulture 50240 9256 3069 62565
Veterinary & Animal Sciences 28772 8873 4521 42166
Dairy Science & Technology 14043 1833 1010 16886
Fisheries Sciences 10635 2332 986 13953
Bio-technology 1150 887 951 2988
Agricultural Engineering. 13111 4243 2160 19514
Forestry 6718 2678 1189 10585
Grand Total 336598 89791 35927 462316 Source: Projections from the respective sector chapters
Thus, the total required stock of agricultural graduates and above in 2009-10 is about 4.62
lakhs. The annual attritions of 9,000 due to retirements would, thus, be around 1.95% of the
stock.
B. Mortality
For estimating attrition due to mortality, it was assumed that the mortality pattern among the
urban population in the age group 20-60 would be relevant for the agricultural manpower
stock. The projected urban population in the working ages and the corresponding age-specific
mortality rates are given below:
Projected Urban Population by Age and Age-specific Mortality Rates (2005)
Age-group Projected Urban
Population (000)
Age-specific
Mortality Rate
(per 000)
Estimated
annual deaths
20-24 32,525 1.6 32,535
24-29 29,312 1.7 29,312
30-34 26,055 2.0 26.055
35-39 23,185 2.8 23,185
40-44 20,209 3.5 20,209
45-49 16,837 5.3 16,837
50-54 13,306 7.8 13,306
55-59 10,088 11.7 10,088
All aged 20-59 171,517 3.5 600,682 Source: 1. Planning Commission, Technical Note on Employment in Eleventh Plan for population projections,
2. Registrar General of India, Sample Registration system, Statistical Report, 2005, cited in IAMR,
Manpower Profile 2009
The annual losses due to mortality among urban population in the working age-groups are,
thus, about 3.5 per 1000 or 0.35%. Together with retirements, this raises the annual rate of
attrition to 2.3%.

232
C. Migration and Other Factors
No information is available on the migration of agricultural graduates to other countries,
though the phenomenon is there. Similarly, no information is available about the extent of
withdrawal of agricultural manpower from labour force due to other factors like disability,
shift to other fields of activity, and voluntary abstinence from economic activity. The
combined effect of all these factors has been assumed to be 0.7% on an ad hoc basis.
D. Overall Rate of Attrition
The overall attrition rate, thus, may be placed at about 3% of the manpower stock. This rate
has been used uniformly in determining the annual flows of manpower required in all
disciplines, with the sole exception of Bio-technology, where all the manpower was of recent
origin and would not be retiring during the next decade. In the case of Bio-technology,
therefore, the attrition rate has been assumed to be only 1% for mortality and other factors.
233
Annexure-3.3
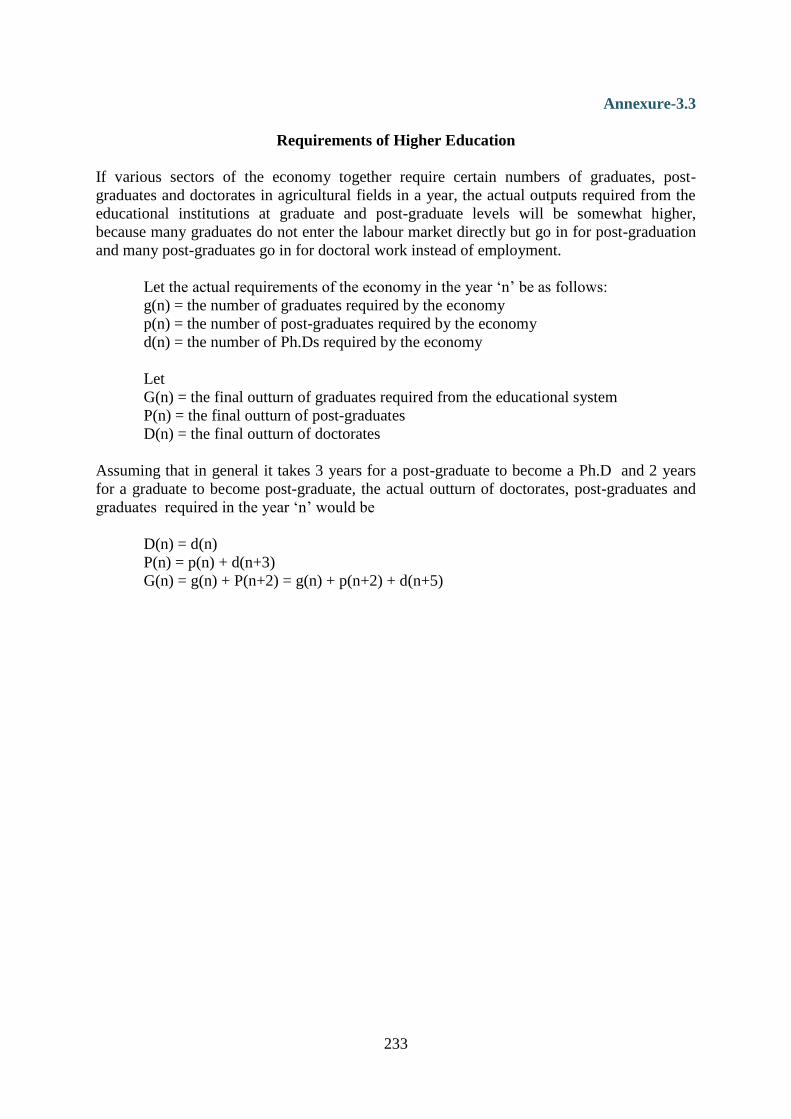
Requirements of Higher Education
If various sectors of the economy together require certain numbers of graduates, post-
graduates and doctorates in agricultural fields in a year, the actual outputs required from the
educational institutions at graduate and post-graduate levels will be somewhat higher,
because many graduates do not enter the labour market directly but go in for post-graduation
and many post-graduates go in for doctoral work instead of employment.
Let the actual requirements of the economy in the year ‘n’ be as follows:
g(n) = the number of graduates required by the economy
p(n) = the number of post-graduates required by the economy
d(n) = the number of Ph.Ds required by the economy
Let
G(n) = the final outturn of graduates required from the educational system
P(n) = the final outturn of post-graduates
D(n) = the final outturn of doctorates
Assuming that in general it takes 3 years for a post-graduate to become a Ph.D and 2 years
for a graduate to become post-graduate, the actual outturn of doctorates, post-graduates and
graduates required in the year ‘n’ would be
D(n) = d(n)
P(n) = p(n) + d(n+3)
G(n) = g(n) + P(n+2) = g(n) + p(n+2) + d(n+5)

234
Annexure-3.4
Sampling of Districts in the Country
All the States and Union Territories were covered. For allocating the 100 districts among all
the States, four criteria have been considered a) the proportion of districts in the State to the
total number of districts in the country b) the proportion of establishments in the organized
sector in the State to those in all States (as given by the Ministry of Labour’s EMI
programme for 2004-05) c) the State’s share of regular employment in agriculture related
activities (agriculture, food processing industries, textiles and wholesale and retail trade in
agriculture) as obtained from the unit level data from the 61st Round of NSS (2004-05)
1, and
d) the number of agricultural and veterinary graduates aged 15 or more) in the State (as given
in 2001 Census, Table C8). Allocating the sample on the basis of number of districts in the
State no doubt gives a self-weighting first stage sample, but it would not be the best, as there
are several States with a large number of districts but with very little presence of agricultural
manpower. In the case of number of establishments in the organized sector, it has to be
remembered that only a fraction of them are relevant for agricultural graduates. The
proportion of regular employees in certain sectors relevant to the subject under consideration
(criterion c) also includes all regular employees in the selected industries irrespective of
whether they are agricultural graduates or not. Allocation based on the number of agricultural
and veterinary graduates enumerated in the 2001 Census is considered most direct and useful
as the main purpose of the Establishment Survey is to obtain the occupational-educational
pattern of the employed agricultural manpower, and the number of graduates enumerated in
the Census in a district/State is a good proxy for the number of employed graduates. It has,
however, been observed that the allocations based on criteria b) and c) also give the same
broad pattern as allocation based on criterion d) with relatively higher shares for States like
Maharashtra, Uttar Pradesh, Tamil Nadu, Karnataka and Andhra Pradesh.
The principles followed in the allocation, therefore, are as follows:
The number of districts allocated to a State generally is its proportional share in the
number of agricultural and veterinary graduates and above as enumerated in the 2001
Census, subject to the adjustments given below.
In States/UTs, where there is only one district, that is automatically covered,
irrespective of the number of graduates enumerated.
In States where there are two districts, both the districts are similarly covered.
Covering only the capital district will introduce bias.
In States where there are three or more districts, but have a share of less than 1% in
the number of total number of agricultural and veterinary graduates in the country,
only two districts selected – the capital district and the second to be chosen from the
other districts through probability sampling.
In all other States, a minimum of three districts are covered.
The maximum number of districts allocated to a State is fixed at 20% of the total
number of districts in the State
The total number of district allocated came to 103.
In Bihar, the Census data give an excessively large number of over 19000 agricultural
graduates in the State, with half of them (9500) in Muzaffarpur district alone. In view
1 Courtesy Dr. Nilabja Ghosh, Institute of Economic Growth.

235
of the doubtful nature of the data, the State has been allocated 4 districts (10% of all
districts in the State).
List of selected districts is given below:
Establishment Surveys - Allocation of Districts Among States
Sl.
No State
Total
districts
2009
No. of
estt.
org.
sector
2004-05
No. of
Ag.
grads.
(2001)
Reg. emp. In Number of districts
allocated
Remark Ag.
related
NSS2004-
05
Others Capital Others total
1 Andaman and
Nicobar Islands
3 168 195 1 1 2
2 Andhra Pradesh 23 22770 10690 10.5 9.8 1 4 5 20 % of
total
districts
3 Arunachal
Pradesh**
16 455 1 1 2
4 Assam 27 7343 3080 1 2 3 Minimum
3
5 Bihar 38 5415 19204 1.6 1.4 1 3 4 10% of
total
districts
6 Chandigarh 1 1252 341 1 1
7 Chattisgarh 16 3177 1448 1.1 1.9 1 1 2
8 Dadra and
Nagar Haveli**
1 36 1 1
9 Daman and Diu 2 446 14 1 1 2
10 Delhi* 1 7820 1252 0.0 0.0 1 1
11 Goa 2 1013 368 0.1 0 1 1 2
12 Gujarat 25 30364 7386 5.0 6.1 1 4 5 20% of
total
districts
13 Haryana 21 9591 2251 3.7 2.2 3 3 Minimum
3
14 Himachal
Pradesh
12 4273 1061 1 1 2
15 Jammu &
Kashmir
15 2779 2631 0.5 0.5 1 1 2
16 Jharkand 24 3889 824 0.7 0.0 1 1 2
17 Karnataka 28 22079 6640 3.2 7.5 1 4 5
18 Kerala 14 21244 6447 5.7 8.8 1 2 3 20% of
total
districts
19 Lakshadweep** 1 32 1 1
20 Madhya
Pradesh
50 11193 6745 4.1 1.5 1 4 5
21 Maharashtra 35 25121 21521 12.1 18.0 1 6 7 20% of
total

236
districts
22 Manipur 9 972 737 2.4 2.3 1 1 2
23 Meghalaya 7 1148 403 1 1 2
24 Mizoram 8 498 237 1 1 2
25 Nagaland 11 1033 404 1 1 2
26 Orissa 30 9831 3791 2.4 2.3 1 2 3
27 Puducherry 4 459 578 1 1 2
28 Punjab 20 11644 3116 5.0 3.7 3 3 Minimum
3
29 Rajasthan 32 18623 1371 2.5 2.0 1 2 3 Minimum
3
30 Sikkim** 4 124 1 1 2
31 Tamilnadu 31 24422 7175 9.1 7.1 1 5 6
32 Tripura 4 291 478 1 1 2
33 Uttar Pradesh 70 25385 11254 9.1 15.3 1 8 9
34 Uttarakhand 13 3633 1353 0.5 0.4 1 1 2
35 West Bengal 19 15891 3126 13.0 8.7 1 2 3 Minimum
3
Others 0.3 0.2
617 293767 126768 92.6 99.7 33 70 103
* Actually nine districts, treated here as one
** No EMI Programme
a) In States, where there are only one or two districts, all are selected
b) In States, where more than two districts are there, but the share of Agriculture Graduates
as per 2001 census is less than one per cent, only two districts are allocated
c) In other States, the number of districts allocated follows the percentage of share of
agricultural graduates in the State, subject to:
d) The minimum number allocated to a State is three districts
e) The total number allocated to any State is limited to 20 per cent of the total number of
districts in the State
f) In Bihar, the number of Agriculture Graduates from Census appears doubtful with almost
9500 in just Muzaffarpur district. Hence, the allocation is limited to 10% of the total
number of districts
State-wise Selection of Districts
The total ultimate sample size for the establishment surveys is fixed at about 4500
establishments from about 100 districts. At the first stage, districts are selected as per the
sampling norms. The selection of the sample of districts in each State is done in the following
manner.
In each State, the district in which State capital is located is selected first. This is because,
several of the State Agricultural Universities, ICAR research institutes, head quarters of State
departments dealing with agriculture and allied subjects and major industrial head offices are
located in the capitals.
In small States and union territories with one or two districts, the selection of individual
districts is automatic.

237
In States with more than three districts, but with limited presence of agricultural manpower,
two districts are covered, one being the State capital and another district chosen randomly
from out of the remaining districts with probability proportion to size of agricultural and
veterinary graduates in the district. Twenty eight districts selected on this basis.
In States to which 3 or more districts have been allocated, all the districts other than the
capital district have been stratified on the basis of the number of agricultural and veterinary
graduates. In most States, two strata were formed, with districts having 250 or more
graduates forming one stratum and the remaining districts constituting the second stratum. In
a few States, the cut off point for forming strata was 500 and in the case of Rajasthan it was
only 100, as none of the districts other than Jaipur had over 250. In Maharashtra, the number
of graduates was high in many districts. As such, three strata were formed, those having 1000
or more, those having 500 to 999 and those having less than 500. In all cases, the number of
districts allotted to the State was split between the strata equally, and where that is not
possible, with a higher share for the bigger districts. The requisite number of districts has
been selected from each stratum according to simple random sampling without replacement.
The total number of districts selected from the entire country is, thus, 103.
Frames of Establishments in the Selected Districts for Second Stage Sampling
Before sampling establishments in the selected districts, frames (lists) of all establishments
from which sampling can be done was prepared. This being the list of establishments in the
organized sector2 available on the Employers’ Register maintained by each district
Employment Exchange under the Employment Market Information (EMI) programme. This
register classifies all establishments covered by the EMI programme in the district into those
in public sector (Central Government/State Government/Quasi-Government Organizations/
Local Bodies separately) and those in private sector (establishments with 10 to 24 employees
and those with 25 or more workers separately). Within each category, both in the public
sector and in private sector, the establishments are further classified by the industrial activity.
These lists are taken as a starting point for establishments in the organized sector. They are
further improved to ensure completeness by consulting the District Industries Centre,
associations of industries and other sources.
The lists of establishments prepared are divided in to three categories based on employment
potential/ demand for agricultural manpower. They are establishments with a) high potential
b) medium potential and c) others.
The first category of establishments comprises of:
Agricultural/ horticultural/ animal husbandry/ forestry/ fishery and such activities
(including plantations, floriculture, aqua-culture, etc.)
Extension work and support services in agriculture and allied fields
Research and developmental activities in agriculture and allied fields both in
government, autonomous or private sector.
Government services in agriculture and allied fields
2 Organized sector for the purpose of EMI programme comprises all establishments in the public sector and all
establishments in the private sector employing 10 or more workers.
238
Veterinary services and hospitals
The second category includes:
Agro-industries (including processing of sugar, tobacco, cotton etc)
Manufacturing industries linked to agriculture like fertilizers, pesticides, agricultural
equipment (like tractors, threshers, etc.)
Wholesale and retail trade in agriculture and allied fields
Financial institutions engaged in lending to agriculture and allied fields
All other establishments are included in the third category.
Apart from establishments, graduates are also needed for Non-Government Organizations
(NGOs) engaged in activities relating to agriculture (such as organic farming, consultancy in
agriculture, extension work, agricultural marketing, etc.). A list of such NGOs available from
Centre for Advancement of Rural Technologies (CAPART), Government of India and
subsequently improved through local consultations is prepared and used for sampling NGOs.
There may be other smaller establishments engaged in activities relating to agriculture and
allied fields. There may also be self-employed graduates in agriculture and allied sciences in
the district (e.g. Agri-clinics and agri-businesses). A list of these was obtained from the local
knowledgeable sources and financial institutions (who provide assistance to agri-clinics and
businesses). The lists, so prepared, are the basis for sampling of establishments, NGOs and
self-employment units.
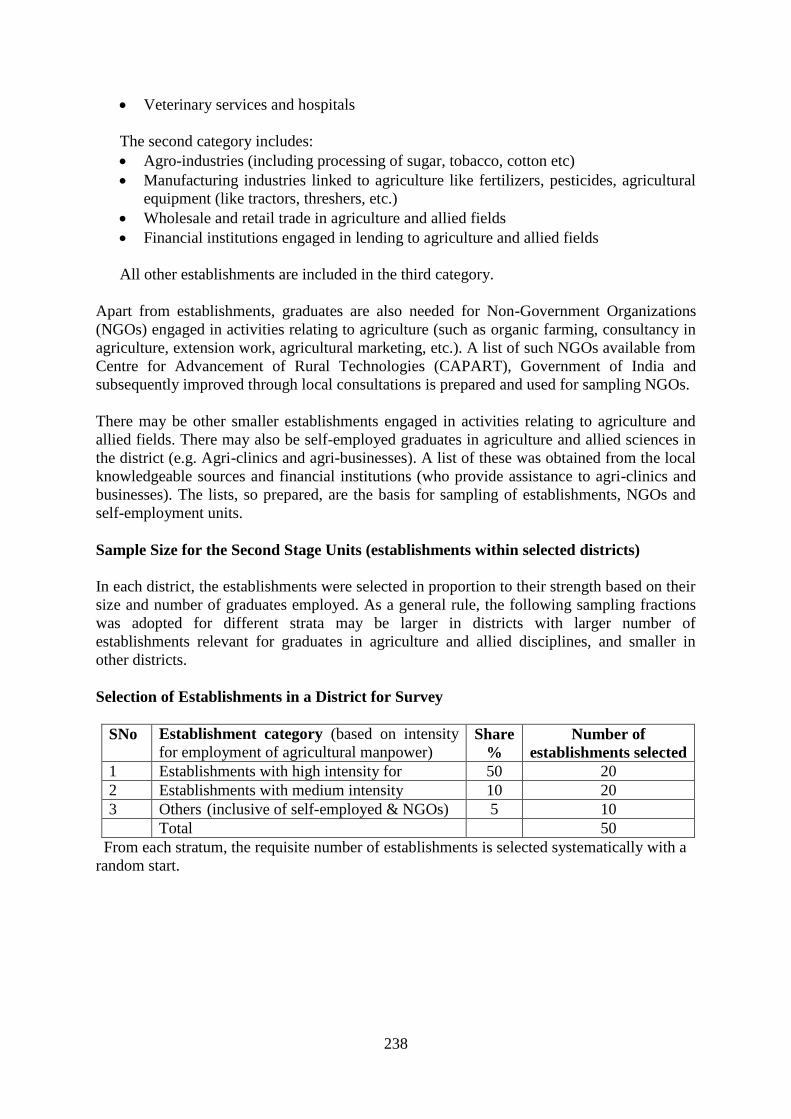
Sample Size for the Second Stage Units (establishments within selected districts)
In each district, the establishments were selected in proportion to their strength based on their
size and number of graduates employed. As a general rule, the following sampling fractions
was adopted for different strata may be larger in districts with larger number of
establishments relevant for graduates in agriculture and allied disciplines, and smaller in
other districts.
Selection of Establishments in a District for Survey
SNo Establishment category (based on intensity
for employment of agricultural manpower) Share
%
Number of
establishments selected
1 Establishments with high intensity for 50 20
2 Establishments with medium intensity 10 20
3 Others (inclusive of self-employed & NGOs) 5 10
Total 50
From each stratum, the requisite number of establishments is selected systematically with a
random start.

239
Annexure-3.5
S.No.
INSTITUTE OF APPLIED MANPOWER RESEARCH
(Planning Commission, Government of India)
A-7, Institutional Area, Narela, Delhi
NATIONAL ACADEMY OF AGRICULTURAL RESEARCH MANAGEMENT
Hyderabad
ASSESSMENT OF FUTURE HUMAN CAPITAL REQUIREMENTS IN
AGRICULTURE
(Sponsored by NAIP, ICAR)
(Questionnaire 1: Organizations /Departments /Establishments)
Note:
Dear Sir/Madam,
This questionnaire is self-explanatory and would take about 30 minutes to fill up.
The information given by you would be extremely helpful in forecasting the demand
of employment in the agricultural sectors and revising educational curriculum.
Wherever possible, please choose from the given codes.
You are free to give your opinions wherever asked.
Information given by you would be used for academic purposes and policy
modifications.
Please answer all the questions. If answer for any question is nil, put a dash (-). In
case space for any question is not adequate, please use vacant spaces.
State
District
Type of establishment*
* Crop production (including plantation) -01, Plantation -02, Fisheries -03, Dairying and
animal husbandry -04, Forestry -05, Manufacturing -06, Trading -07, Financial Institutions
-08, Government office-09, Non-governmental organizations-10, Research and other
educational institutions -11, Others (pleas specify) -12
240
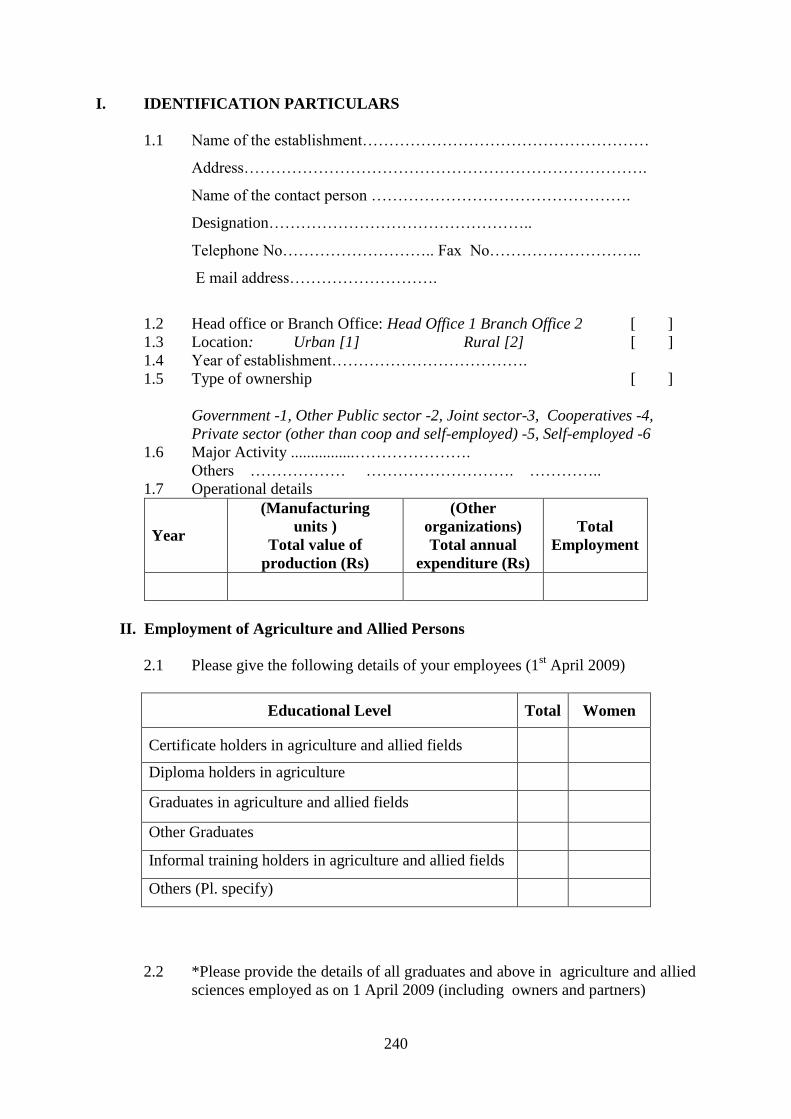
I. IDENTIFICATION PARTICULARS
1.1 Name of the establishment………………………………………………
Address………………………………………………………………….
Name of the contact person ………………………………………….
Designation…………………………………………..
Telephone No……………………….. Fax No………………………..
E mail address……………………….
1.2 Head office or Branch Office: Head Office 1 Branch Office 2 [ ]
1.3 Location: Urban [1] Rural [2] [ ]
1.4 Year of establishment……………………………….
1.5 Type of ownership [ ]
Government -1, Other Public sector -2, Joint sector-3, Cooperatives -4,
Private sector (other than coop and self-employed) -5, Self-employed -6
1.6 Major Activity ................………………….
Others ……………… ………………………. …………..
1.7 Operational details
Year
(Manufacturing
units )
Total value of
production (Rs)
(Other
organizations)
Total annual
expenditure (Rs)
Total
Employment
II. Employment of Agriculture and Allied Persons
2.1 Please give the following details of your employees (1st April 2009)
Educational Level Total Women
Certificate holders in agriculture and allied fields
Diploma holders in agriculture
Graduates in agriculture and allied fields
Other Graduates
Informal training holders in agriculture and allied fields
Others (Pl. specify)
2.2 *Please provide the details of all graduates and above in agriculture and allied
sciences employed as on 1 April 2009 (including owners and partners)

241
Designation
(by level of
Positions)
Qualifications Discipline No. of persons
Nature
of
work
Gross
Emoluments
Males Females
* Note
Designation: As per the designations in the organization
Qualifications: Graduate/Post-graduate/Doctorate/Diploma/Certificate
Discipline: Agriculture, Horticulture, Bio-technology, fishery, dairy etc.
Nature of work: Administrative and managerial, research and or teaching/extension,
other professional or technical work, clerical, sales or marketing, production process
work, others(Please specify)
2.3 Please provide details of all graduates and above in agriculture and allied
sciences in your organization during the last 5 years according to their
discipline
Discipline
No. of employees who are graduates or above in
the discipline as on 1 April
2005 2006 2007 2008 2009
2.4 No. of vacancies arising for graduates and above in agriculture and allied
fields
Year
Number of vacancies arising due to Number
of
vacancies
filled
Retirements Transfers/r
esignations Expansion
Other
reasons
Total
Vacancies
2.5 Do you find it difficult to fill the vacancies with the persons with agricultural
qualifications?
Yes /No
2.6 Please give the following details of vacancy positions
Discipline
Qualifications
level required
(graduate/post-
graduate/Docto
rate)
No. of vacancies which
could not
be filled
Reasons for
not being able
to fill 2006-
07
2007-
08
2008
-09

242
2.7 Do you employ persons with other qualifications in jobs where qualification in
Agriculture and allied fields are needed?
Yes/No
2.8 If yes, please give the reason
o Shortage of agricultural graduates
o Demand of high salary
o Agricultural graduates not needed
o High labour turnover
o Any other (Pl. specify)
2.9 Please indicate the important changes that have taken place in your
organization and the new skills required, if any, during the last 5 years.
Nature of change Whether the
change took
place
(Yes/No)
Whether the
change
required new
skills(Yes/No)
Nature
of skills
needed
How difficult
was it to
obtain these
skills*
Expansion of the organization
Diversification of product/service
Technology of production
Computerization
Others (specify)
* Very difficult -1 hard -2 Easy -3
III. DEVELOPMENT PERSPECTIVE OF ORGANIZATION
3.1 Kindly indicate the future plans of the organization
Nature of change By
2015
By
2020
Details of change and skill
requirement
Expansion of the organization
Diversification of product/service
Technological changes in
production process
Modernization of organization (e.g.
computerization)
Others (specify)
3.2 What would be the expected total employment in your organization.
a) By 2015…………………….. b) By 2020……………………….

243
3.3 Please indicate the total number of graduates and above likely to be in your organisation
Discipline
1st April 2009 In 2020
UG PG PhD All UG
. PG PhD All
IV. SKILL GAPS
4.1 In your opinion, do the university/ college graduates and post-graduates in agriculture and
allied fields meet the skill requirements of your organization?
Fully Partly Not at all
If not fully met, what type of skills needed? (You can tick more than one answer)
Particulars UG level PG Level
a) more advanced theoretical knowledge
b) more technical knowledge
c) more practical orientation
d) more interaction with industries
e) managerial skills
f) Information technology
g) agri- business economics
h) any other (pl. specify)
4.2 Do you conduct any training to raise the skills of fresh recruits to the required level?
Yes No
If yes give details of such programmes or attach the list of programmes organised
…………………………………………………………………………………….
4.3 Describe changes required in the present university education in agriculture and allied
fields
A) Changes required in theory/practical ratio Yes/No
If Yes what ratio is needed in UG curriculum
Discipline
Ratio required
Theory Practical

244
B) Changes needed in curriculum of UG
Discipline Course
Content
Changes required
Managerial
Skills
IT
Skills
Communication
Skills
Entrepre
neurial
Others
(Specify)
C) Changes needed in PG level curriculum
…………………………………………………………………………………
4.4 In your opinion, what new courses require to be introduced in agricultural
universities/colleges in the light of future trends :
a) UG Level……………………………………………………………………
b) PG Level…………………………………………………………………….
4.5 In your opinion which agricultural and allied sectors have potential for
employment in future and what types of skills would be needed.
…………………………………………………………………………………………...
Place …………………. Date ………………….
Name of the Investigator……………….. Signature of the Investigator…………………..
Name of the Supervisor………………… Signature of the Supervisor…………………….
Comments of the Investigator
Comments of the Supervisor

245
Annexure-3.6
Institutional Code
(Central university- 1, State agricultural universities – 2, Agricultural colleges- 3,
Other colleges-4, ICAR research institutions- 5, Other research institutions -6)
S. No
INSTITUTE OF APPLIED MANPOWER RESEARCH
(Planning Commission, Government of India)
A-7, Institutional Area, Narela, Delhi 110 040
&
NATIONAL ACADEMY OF AGRICULTURAL RESEARCH MANAGEMENT
Hyderabad
ASSESSMENT OF FUTURE HUMAN CAPITAL REQUIREMENTS IN
AGRICULTURE – sponsored by NAIP - ICAR
(Questionnaire 2: Agriculture and Allied Universalities/ Institutions/ Colleges)
Dear Sir/Madam,
This questionnaire is self-explanatory and would take about 40 minutes to fill up.
The information given by you would be extremely helpful in forecasting the demand
of employment in the agricultural sectors and revising educational curriculum.
Wherever possible, please choose from the given codes.
You are free to give your opinions wherever asked.
Information given by you would be used for academic purposes and policy
modifications only.
Please provide any printed documents available about your institution such as Vision
2020, Annual Reports for the past ten years etc.
State District
I. IDENTIFICATION PARTICULARS
1.2 Name of the Institute/University/College…………………………..
Address ………………………………………………………………….
1.3 Name of the head of the institution………………….
Designation……………………..
1.4 Name of the contact person……………………..Designation……….
Phone No……………… E-mail………………….Fax No……………

246
1.4 Type of institution: □
(Teaching 1, Research 2, Extension-3, All (teaching, research & extension) -
4, Others - 5)
1.5 Year of establishment: …………………………………….
1.6 Regular staff (University as a whole including all departments and
University colleges/Constituent colleges)
Year/Qualification
Teaching/Research
/Extension
Others
(Technical)
Non-
technical* Total
Total Female Total Female Total Female Total Female
1st
April
2005
Graduate &
above in
agriculture and
allied field
Others
Total
1st
April
2009
Graduate &
above in
agriculture and
allied field
Others
Total
* Non-technical includes administrative, ministerial and support staff.
1.7 Budget and Expenditure (2004 to 2009)
Year Budget (Rs.) Expenditure (Rs.)
1.8 Intake of Students
Please provide the following information on student intake for the academic year 2009-10.
Similar data may please be provided w.e.f. 2000-01 to 2008-09(year-wise). Attach separate
sheet.
Courses offered Level No. of seats
No. of
applications
received
Final intake by location and sex
wise
Rural Urban
Male Female Male Female

247
1.9 Teaching, Research and Extension Staff
Please provide the following details about the teaching and research staff as on 1st April 2009
Discipline
Sanctioned
strength as
on 1st April,
2009
Number in position as on 1st April 2009
by level of qualifications
UG PG PhD Total
1.10 Future Expansion
Please provide the information on future plans of the university/college (over the
next ten years (Please attach vision document)
Future plan
Details
Depart
ments
Nature of
expansion
By
2015
By
2020
Types of
skill
requirements
1. Expansion
2.Technological Upgradation
3. Modification of Curriculum
4. Closure
5. Others (specify)
1.11 Indicate the total number of graduates and above likely to be in your organization
Discipline
1st April 2009 In 2020
UG PG PhD All UG
. PG PhD All
II COURSE/CURRICULUM MODIFICATIONS
2.1 Provide the information on the new courses introduced and courses discontinued in the
university /college during the last 5 years at under graduate and post-graduate level.
Name of the course
introduced/discontinued Level
When the course
introduced/
Discontinued
Reasons for
introduction/discontinuati
on
I. New courses introduced
II. Courses discontinued
248
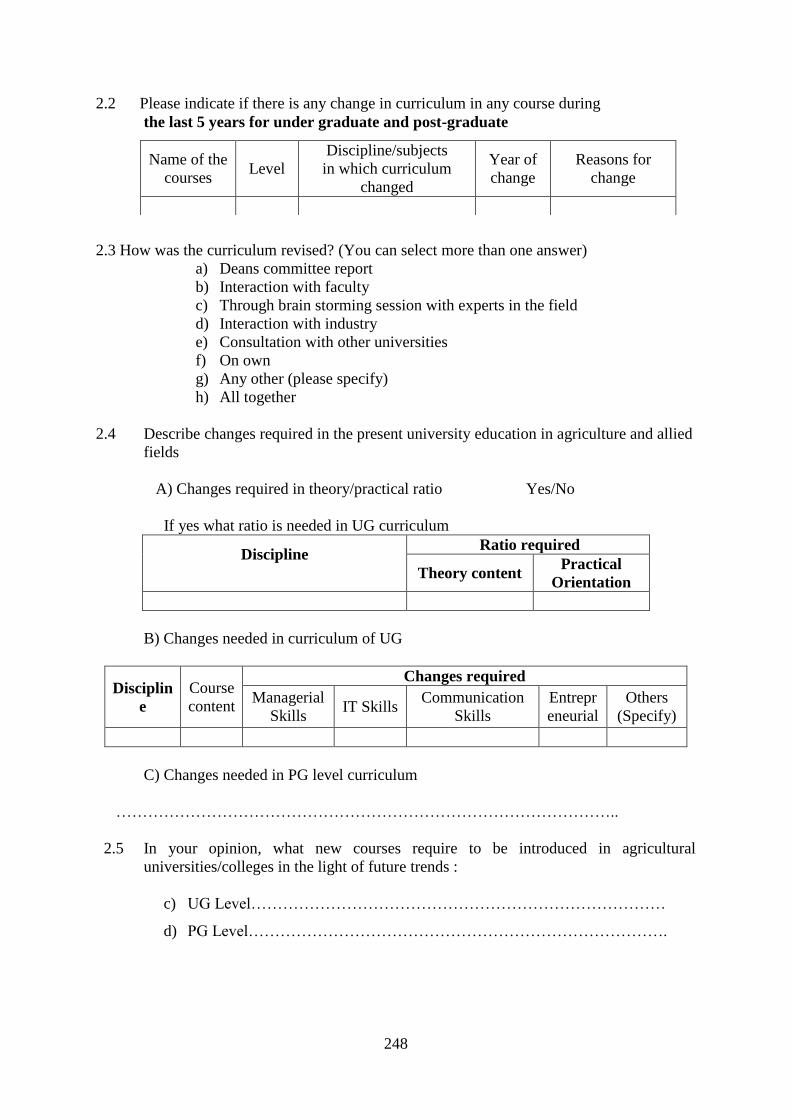
2.2 Please indicate if there is any change in curriculum in any course during
the last 5 years for under graduate and post-graduate
2.3 How was the curriculum revised? (You can select more than one answer)
a) Deans committee report
b) Interaction with faculty
c) Through brain storming session with experts in the field
d) Interaction with industry
e) Consultation with other universities
f) On own
g) Any other (please specify)
h) All together
2.4 Describe changes required in the present university education in agriculture and allied
fields
A) Changes required in theory/practical ratio Yes/No
If yes what ratio is needed in UG curriculum
Discipline
Ratio required
Theory content Practical
Orientation
B) Changes needed in curriculum of UG
Disciplin
e
Course
content
Changes required
Managerial
Skills IT Skills
Communication
Skills
Entrepr
eneurial
Others
(Specify)
C) Changes needed in PG level curriculum
…………………………………………………………………………………..
2.5 In your opinion, what new courses require to be introduced in agricultural
universities/colleges in the light of future trends :
c) UG Level……………………………………………………………………
d) PG Level…………………………………………………………………….
Name of the
courses Level
Discipline/subjects
in which curriculum
changed
Year of
change
Reasons for
change

249
III. PASSED OUT TRAINEES : Out-turn of graduates, post-graduates and Ph.Ds.
3.1 Pleases provide, the following information about the 2008-09 passed out students.
Please also provide similar data for the years beginning for 2000-01 to 2007-08.
Note: *Others may include who have taken up their own business/self –employment etc.
IV. SKILL GAPS
4.1 In your opinion, are there any gaps in skill levels between the outturn of your
Institution and requirements of the industry? Yes / No
4.2 If yes, in what disciplines and nature of gaps
Discipline Skill gaps
4.3 How do you propose to address these gaps……………………………………..
V. EMPLOYMENT
5.1 For those going in for employment
a) What are the main industries absorbing the alumni? (Pl. list the leading
industries)
……………………. …………………… ………………………
b) Nature of jobs in which absorbed
……………………. …………………… ………………………
5.2 Is there any campus recruitment? Yes / No
If Yes, which are the employers: (Please attach list leading industries)
Discip
line Level
Number of
students passed
out
Status of the passed out students
No. of students
joined higher
studies
No. of
students
joined
employme
nt
No. of
students
went
abroad
Others
* Total Females
Year No of employers visited for campus
recruitment
2005-06

250
5.3 Does the university have a placement cell? Yes / No
If Yes, please indicate the number of passed out students placed in the last
three years
Level Discipline
No. of passed out
students placed in Industries
in which
placed
Average time
taken to place
after completion
of course (months) 2006-
07
2007-
08
2008-
09
5.4 When the placement cell was set up? ……………………………..
5.5 Did you use mass media to publicize your placement cell? Yes/No
VI. POSTS:
6.1 Whether number of post increased/decreased in any discipline during the last three
years? Yes/No
If yes please provide the details
Discipline
Sanctioned Strength as on Reasons for the
change 1st April, 2006 1
st April, 2009
6.2 Vacancies of teaching and research/extension staff
Discipline
Total no.
of
vacancies
No. of vacancy could not be filled Reasons for
vacancy Qualification
needed 2006-07
2007-
08
2008-
09
6.3 Number of staff retiring/leaving each year.
Discipline No. of teachers/ scientists retiring/ leaving the institution
Reasons 2004-05 2005-06 2006-07 2007-08 2008-09
251
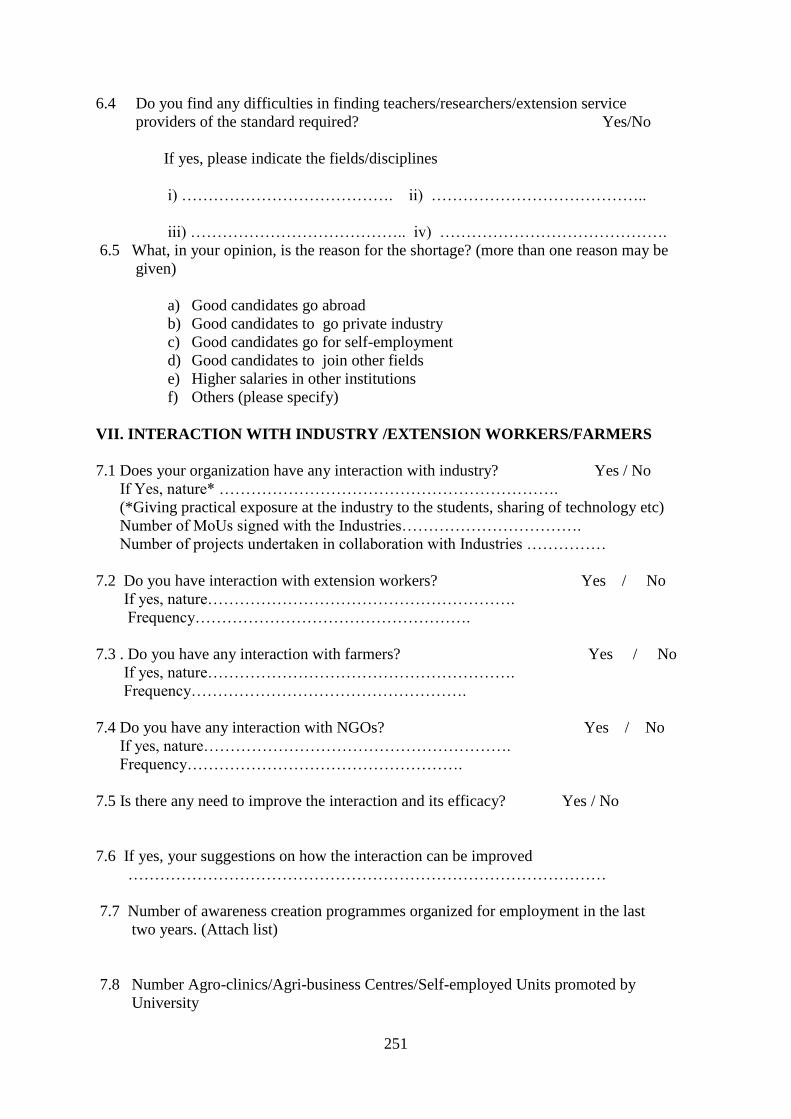
6.4 Do you find any difficulties in finding teachers/researchers/extension service
providers of the standard required? Yes/No
If yes, please indicate the fields/disciplines
i) …………………………………. ii) …………………………………..
iii) ………………………………….. iv) …………………………………….
6.5 What, in your opinion, is the reason for the shortage? (more than one reason may be
given)
a) Good candidates go abroad
b) Good candidates to go private industry
c) Good candidates go for self-employment
d) Good candidates to join other fields
e) Higher salaries in other institutions
f) Others (please specify)
VII. INTERACTION WITH INDUSTRY /EXTENSION WORKERS/FARMERS
7.1 Does your organization have any interaction with industry? Yes / No
If Yes, nature* ……………………………………………………….
(*Giving practical exposure at the industry to the students, sharing of technology etc)
Number of MoUs signed with the Industries…………………………….
Number of projects undertaken in collaboration with Industries ……………
7.2 Do you have interaction with extension workers? Yes / No
If yes, nature………………………………………………….
Frequency…………………………………………….
7.3 . Do you have any interaction with farmers? Yes / No
If yes, nature………………………………………………….
Frequency…………………………………………….
7.4 Do you have any interaction with NGOs? Yes / No
If yes, nature………………………………………………….
Frequency…………………………………………….
7.5 Is there any need to improve the interaction and its efficacy? Yes / No
7.6 If yes, your suggestions on how the interaction can be improved
………………………………………………………………………………
7.7 Number of awareness creation programmes organized for employment in the last
two years. (Attach list)
7.8 Number Agro-clinics/Agri-business Centres/Self-employed Units promoted by
University

252
7.9 What activities are being organized to help self-employed alumni?
7.10 In your opinion which agriculture and allied sectors have potential for
employment and what types skills would be needed
……………………………………………………………………………………….
Place: Signature of Investigator
Date Name of Investigator
Name of Supervisor Signature of Supervisor
Investigator’s comments
Supervisor’s comments

253
Annexure-3.7
Serial No. of Establishment -
Serial No. of Employee -
INSTITUTE OF APPLIED MANPOWER RESEARCH (Planning Commission, Government of India)
A-7, Institutional Area, Narela, Delhi 110 040.
NATIONAL ACADEMY OF AGRICULTURAL RESERCH MANAGEMENT
(HYDERABAD)
ASSESSMENT OF FUTURE HUMAN CAPITAL REQUIRMENTS IN
AGRICULTURE
(Project under NAIP-ICAR)
Questionnaire - 3 : Individual Employees – Only who has education in Agriculture
and allied sectors
Dear Sir/Madam,
This questionnaire is self-explanatory and would take you about 20 minutes to fill up.
The information given by you would be extremely helpful in forecasting the demand
of employment in the agricultural sectors and revising educational curriculum.
Wherever possible, please choose from the alternative answers/ codes given against
the item.
You are free to give your opinions wherever asked.
Information given by you would be used for academic purposes only.
I. IDENTIFICATION PARTICULARS OF ESTABLISHMENT
1.1. State ……………………………….
1.2 District ……………………………….
1.3 Name and address of establishment in which employed
a) Name of establishment……………………………………………………
b) Address……………………………………………………………………

254
II. GENERAL INFORMATION
2.1 Your Name……………………………………………………………………
2.2 Sex Male □ Female □
2.3 Age (in completed years)
2.4 Social Category (Please tick in the appropriate box)
SC □ ST □ BC □ General □ Others □
2.5 Do you belong to urban or rural areas? Urban □ Rural
2.6 Education :
Please give details of all qualifications in the following table. (If needed
please attach a separate sheet)
Course level Discipline Year
awarded
Name of the
Institution/University
Diploma
Graduation
Post-graduation
Ph.D
Graduation in any additional field
Any other(Please specify)
III. DETAILS OF EMPLOYMENT
3.1 Please provide the following details about your present and past employment.
Organization
with Address
(Start with
present
employment)
Main
activity of
organizatio
n
Duration of
employment Post
held
Nature
of
work*
Reason
for
leaving
Total
emoluments
per month
last drawn
(in Rs) From To
Note: * Nature of work: Administrative and managerial, research and or teaching/extension,
other professional or technical work, clerical, sales or marketing, production process
work, others(Please specify)
3.2 Details of job-related training received in the last three years
a) Have you been given any job training of 1 or more months? Yes □ No □
b) If yes, provide the following information.
Major subject
area of training
Duration (in
months)
Place of training (within
establishment -1, training
institution -2, others -3)
Year in which
received training
3.3 How much time did it take to get employment after completing your studies?
Immediately -1, Within six months-2, 6 months or more but less than 1 year -3,
1 year or more but less than 2 years – 4, More than 2 years- 5
255
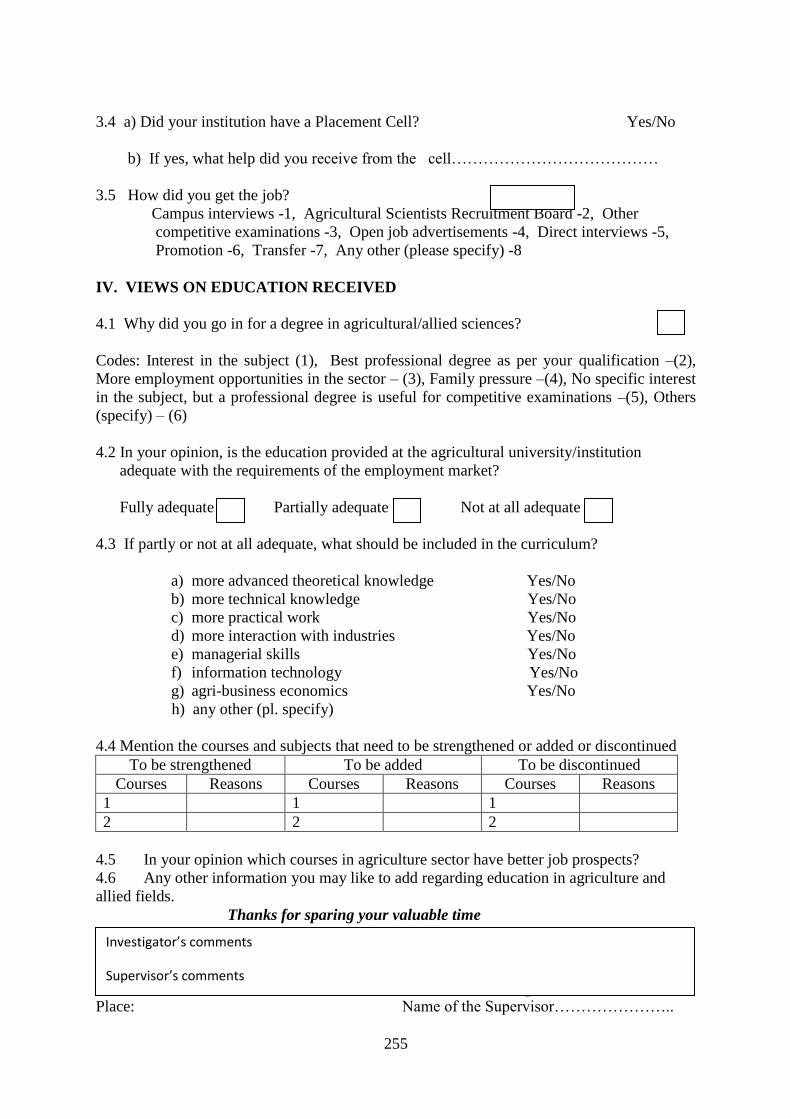
3.4 a) Did your institution have a Placement Cell? Yes/No
b) If yes, what help did you receive from the cell…………………………………
3.5 How did you get the job?
Campus interviews -1, Agricultural Scientists Recruitment Board -2, Other
competitive examinations -3, Open job advertisements -4, Direct interviews -5,
Promotion -6, Transfer -7, Any other (please specify) -8
IV. VIEWS ON EDUCATION RECEIVED
4.1 Why did you go in for a degree in agricultural/allied sciences?
Codes: Interest in the subject (1), Best professional degree as per your qualification –(2),
More employment opportunities in the sector – (3), Family pressure –(4), No specific interest
in the subject, but a professional degree is useful for competitive examinations –(5), Others
(specify) – (6)
4.2 In your opinion, is the education provided at the agricultural university/institution
adequate with the requirements of the employment market?
Fully adequate Partially adequate Not at all adequate
4.3 If partly or not at all adequate, what should be included in the curriculum?
a) more advanced theoretical knowledge Yes/No
b) more technical knowledge Yes/No
c) more practical work Yes/No
d) more interaction with industries Yes/No
e) managerial skills Yes/No
f) information technology Yes/No
g) agri-business economics Yes/No
h) any other (pl. specify)
4.4 Mention the courses and subjects that need to be strengthened or added or discontinued
To be strengthened To be added To be discontinued
Courses Reasons Courses Reasons Courses Reasons
1
1 1
2
2 2
4.5 In your opinion which courses in agriculture sector have better job prospects?
4.6 Any other information you may like to add regarding education in agriculture and
allied fields.
Thanks for sparing your valuable time
Date: Name of the Investigator…………………
Place: Name of the Supervisor…………………..
Investigator’s comments
Supervisor’s comments

256
Annexure-3.8
Sample Serial No. …………………………
INSTITUTE OF APPLIED MANPOWER RESEARCH (Planning Commission, Government of India)
A-7, Institutional Area, Narela, Delhi 110 040.
NATIONAL ACADEMY OF AGRICULTURAL RESERCH MANAGEMENT
(HYDERABAD)
ASSESSMENT OF FUTURE HUMAN CAPITAL REQUIRMENTS IN
AGRICULTURE
(Project under NAIP-ICAR)
Questionnaire : Tracer’ s Studies
Dear Sir/Madam,
This questionnaire is self-explanatory and would take you about 20 minutes to fill up.
The information given by you would be extremely helpful in forecasting the demand
of employment in the agricultural sectors and revising educational curriculum.
Wherever possible, please choose from the alternative answers/ codes given against
the item.
You are free to give your opinions wherever asked.
Information given by you would be used for academic purposes only.
I. SAMPLE IDENTIFICATION PARTICULARS (To be filled by the survey staff)
1.1. State ……………………………….
1.2. Name of university/college from which selected
a) University……………………………………….
b) College……………………………….
1.3. Year from which selected………………………………
1.4. Graduate – 1, Post-graduate - 2, Doctorate – 3 Diploma-4, Certificate-5.
1.5. Discipline/branch………………………………

257
II. GENERAL INFORMATION
2.1 Name……………………………………………………………………
2.2 Sex Male □ Female □
2.3 Age (in completed years)
2.4 Social Category SC□ ST □ BC □ General □ Others □
2.5 You belong to Urban Area □ Rural Area □
2.6 Education :
Please give details of all qualifications. If you are still studying or doing research, please
enter ‘continuing’ under col.3 against the relevant course
Course/level Discipline Year
Awarded
Name of the
Institution/
University
Diploma
Graduation
Post-graduation
Ph.D
Graduation in any additional fields
Any other(Please specify
III. PRESENT ACTIVITY
3.1 What is your present activity?
Employed on salary 1, Self-employed -2, Looking for Work- 3,
Student -4, Doing research – 5, None of these -6
3.2 If you are not employed now, have you ever been employed since graduation?
Yes/No
IV. DETAILS OF SALARIED EMPLOYMENT
4.1 Please provide the following details of your present and past salaried employment.
Organisation with
address (start
from present
employment)
Main
activity of
organisati
on
Duration of
Employment Post
held
Nature
of work
Reason
for
leaving
Total
emoluments
per month
(in Rs.) From To

258
4.2. Training courses attended in the last three years
Have you been given any job training of one month or more Yes □ No □
If yes, provide the following information.
Major Subject Area
of training
Duration in
months
Place of
training
Year in which
received training
4.3 Did your university/college have any placement cell? Yes / No
If Yes what help did you receive from the cell?
……………………………………………………………………………..
4.4 How did you get the present employment?
*Campus interviews -1, Agricultural Scientists Recruitment Board -2, Other
competitive examinations -3, Open job advertisements -4, Direct interviews -
5,Promotion -6, Transfer-7 ,Other means -8
4.5 How much time did it take to get employment after completing your studies?
Immediately-1, Less than six months-2, 6 months to 1 year -3, 1 year or more but
less than 2 years - 4, 2 years or more - 5
4.6 Do you think that what you have studied in the university was adequate in getting a
job?
Fully adequate □ Partly adequate □ Not at all □
V. DETAILS OF SELF-EMPLOYMENT
5.1 If you are self-employed, please provide the following details
i) Name of the unit ……………………………………….
ii) When did you start the unit (month and year)………………
iii) Type of activity………………………………………………………….
iv) Reasons for choosing self-employment
1) Own interest
2) family business
3) lack of salaried jobs
4) Better opportunities for growth
5) Others (specify)
v) Is the activity taken up under any specific government schemes? Yes/No

259
vi) If yes, name of the scheme
vii) Is there sufficient demand of your product/ work? Yes /No
viii) Any problems faced…………………………………………
No problems -1, Lack of demand for the product/service -2,
Raw materials -3, Power – 4, Other inputs -5, Technical know how -6,
Marketing-7, Others (specify) -8
ix) What is the total initial investment in the unit
a) Own funds Rs………..
b) Assistance/loan from financial institutions Rs………
x) What is the net annual income from the unit during
2007-08 Rs……………….. 2008-09 Rs………………………
VI. DETAILS OF UNEMPLOYMENT
6.1 If you are not employed or studying, are you looking for a job? Yes/No
6.2 If Yes,
a) Since when are you looking for a job? Year and month ---------------------------
b) Type of job looking for ------------------------------------------------------------
Job in the agricultural/allied fields in government -1, Other government jobs -2,
Research institutions -3, Financial institutions -4, Private industry -5, Teaching-6,
NGOs -7, Others -8, Any job -9
c) What do you think are the reasons for not getting a job?
Lack of job openings of the type preferred -1, Lack of opportunities in the locations
preferred -2, Gaps in technical skills taught in the university and what is demanded in
the market -3, Gaps in practical skills -4, Lack of communication skills 5, Others
(specify) – 7
6.3 In your opinion what else should be taught in the colleges/institutions to increase
employability or suitability towards job?
………………………………………………………………………………………………
6.4 Are you interested in self-employment? Yes/No
6.5 If yes, have you made any attempts? please specify---------------------------------------
6.6 If you are not employed and also not looking for a job, why?.......................................
260
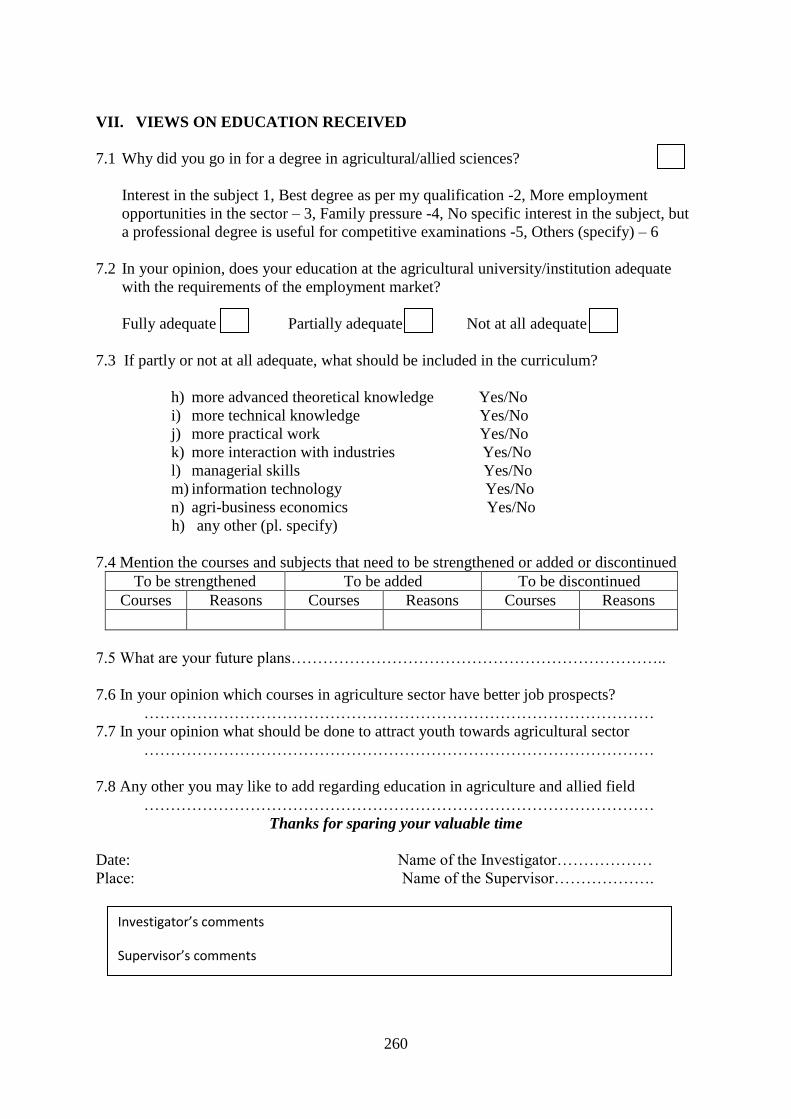
VII. VIEWS ON EDUCATION RECEIVED
7.1 Why did you go in for a degree in agricultural/allied sciences?
Interest in the subject 1, Best degree as per my qualification -2, More employment
opportunities in the sector – 3, Family pressure -4, No specific interest in the subject, but
a professional degree is useful for competitive examinations -5, Others (specify) – 6
7.2 In your opinion, does your education at the agricultural university/institution adequate
with the requirements of the employment market?
Fully adequate Partially adequate Not at all adequate
7.3 If partly or not at all adequate, what should be included in the curriculum?
h) more advanced theoretical knowledge Yes/No
i) more technical knowledge Yes/No
j) more practical work Yes/No
k) more interaction with industries Yes/No
l) managerial skills Yes/No
m) information technology Yes/No
n) agri-business economics Yes/No
h) any other (pl. specify)
7.4 Mention the courses and subjects that need to be strengthened or added or discontinued
To be strengthened To be added To be discontinued
Courses Reasons Courses Reasons Courses Reasons
7.5 What are your future plans……………………………………………………………..
7.6 In your opinion which courses in agriculture sector have better job prospects?
……………………………………………………………………………………
7.7 In your opinion what should be done to attract youth towards agricultural sector
……………………………………………………………………………………
7.8 Any other you may like to add regarding education in agriculture and allied field
……………………………………………………………………………………
Thanks for sparing your valuable time
Date: Name of the Investigator………………
Place: Name of the Supervisor……………….
Investigator’s comments
Supervisor’s comments

261
Annexures for Chapter-4
Annexure-4.1
Demand and Supply Projections for Food Grains and Other Crops 2011-12
Crops
Demand
Projection
s for
2011-12
Range of
Productio
n Supply
Projection
s for
2011-12
Actual levels of production(Million Tonnes)
2006-
07
2007-
08
2008-
09
2009-10
(4th
Advance
Estimate
)
2010-11
(Target)
2010-11
(1st
Advance
Estimate
)
1 2 3 4 5 6 7 8 9
Food
grains
2443
214 –
240
(from
alternate
methods)
217.2
8
230.7
8
234.4
7
218.20 244.50
(125.31
)
(114.63
)
Oilseeds 53 454
24.29 29.76 27.72 24.93 33.20
(20.70)
(17.27)
Sugarcan
e
3405 278 –
334
(from
alternate
methods)
355.5
2
348.1
9
285.0
3
277.75 315.00 32.49
Cotton1 29 16 -50
(from
alternate
methods)
22.63 25.88 22.28 23.94 26.0 33.5
Jute &
Mesta2
10 11 11.27 11.20 10.36 11.29 11.50 10.28
1 Million Bales of 170 kg each
2 Million Bales of 180 kg each
3 includes 2 million tones for augmenting buffer stock and average export of 8 million
tones 4
based on realization of potential yield. This supply assessment would improve self-
sufficiency level in edible oils from existing 55% to 80%. However, if the level
edible oil imports to meet the domestic demand is assumed to be retained at present
level (4.& million tones) then the supply would require to be of 36 million tones of
domestic production. 5
includes 12 lakh tonnes of sugar for augmenting buffer stock and average export of
5.4 lakh tonnes 6
Figures in brackets in col.8 are targets for Kharif only, and figures in col. 9 are first
advance estimates of achievement for Kharif season.
Source: (1) Report of the Working Group on Crop Husbandry, Agricultural Inputs, Demand and Supply
Projections and Agricultural Statistics for the Eleventh Plan,
(2) Directorate of Economics and Statistics, Ministry of Agriculture and Cooperation, Second Advance
Estimates.
262
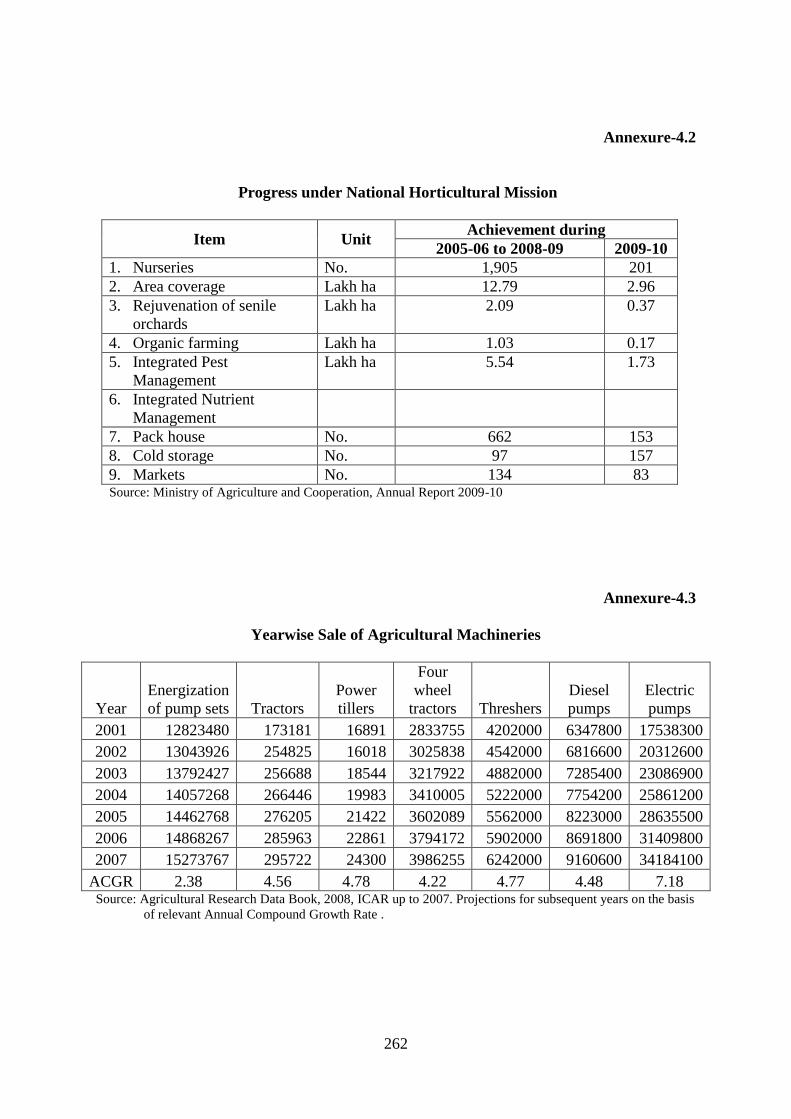
Annexure-4.2
Progress under National Horticultural Mission
Item Unit Achievement during
2005-06 to 2008-09 2009-10
1. Nurseries No. 1,905 201
2. Area coverage Lakh ha 12.79 2.96
3. Rejuvenation of senile
orchards
Lakh ha 2.09 0.37
4. Organic farming Lakh ha 1.03 0.17
5. Integrated Pest
Management
Lakh ha 5.54 1.73
6. Integrated Nutrient
Management
7. Pack house No. 662 153
8. Cold storage No. 97 157
9. Markets No. 134 83 Source: Ministry of Agriculture and Cooperation, Annual Report 2009-10
Annexure-4.3
Yearwise Sale of Agricultural Machineries
Year
Energization
of pump sets Tractors
Power
tillers
Four
wheel
tractors Threshers
Diesel
pumps
Electric
pumps
2001 12823480 173181 16891 2833755 4202000 6347800 17538300
2002 13043926 254825 16018 3025838 4542000 6816600 20312600
2003 13792427 256688 18544 3217922 4882000 7285400 23086900
2004 14057268 266446 19983 3410005 5222000 7754200 25861200
2005 14462768 276205 21422 3602089 5562000 8223000 28635500
2006 14868267 285963 22861 3794172 5902000 8691800 31409800
2007 15273767 295722 24300 3986255 6242000 9160600 34184100
ACGR 2.38 4.56 4.78 4.22 4.77 4.48 7.18 Source: Agricultural Research Data Book, 2008, ICAR up to 2007. Projections for subsequent years on the basis
of relevant Annual Compound Growth Rate .
263
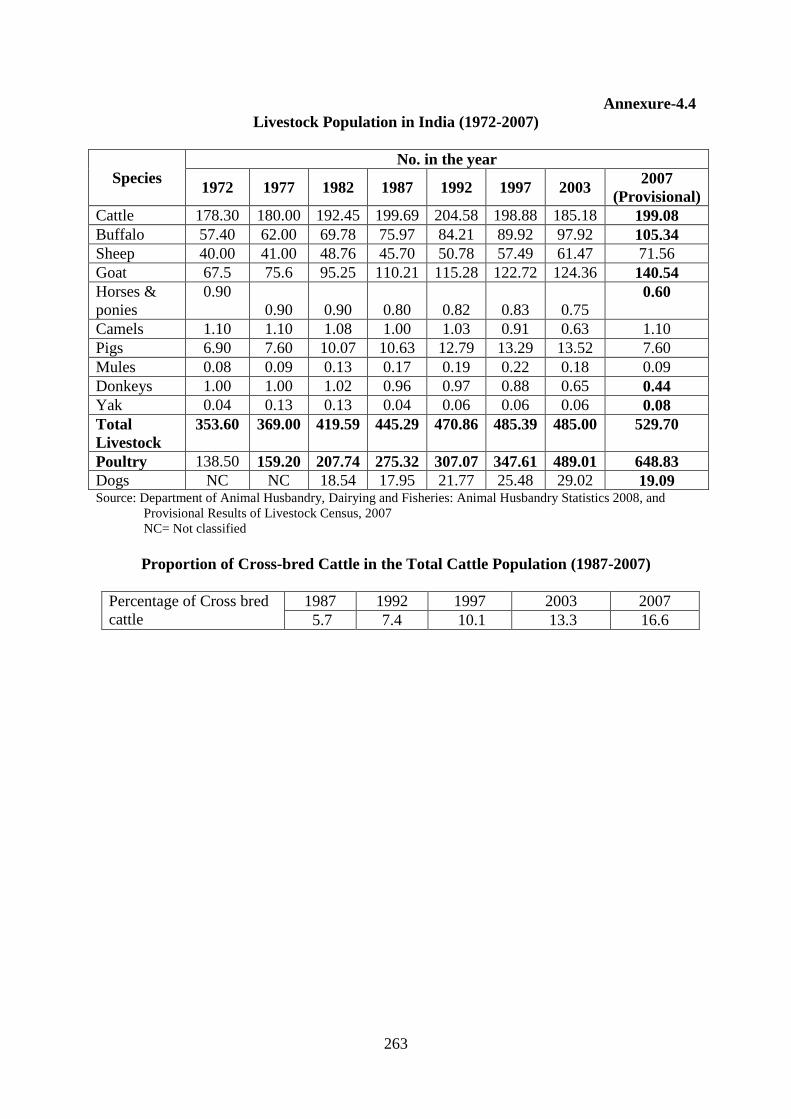
Annexure-4.4
Livestock Population in India (1972-2007)
Species
No. in the year
1972 1977 1982 1987 1992 1997 2003 2007
(Provisional)
Cattle 178.30 180.00 192.45 199.69 204.58 198.88 185.18 199.08
Buffalo 57.40 62.00 69.78 75.97 84.21 89.92 97.92 105.34
Sheep 40.00 41.00 48.76 45.70 50.78 57.49 61.47 71.56
Goat 67.5 75.6 95.25 110.21 115.28 122.72 124.36 140.54
Horses &
ponies
0.90
0.90 0.90 0.80 0.82 0.83 0.75 0.60
Camels 1.10 1.10 1.08 1.00 1.03 0.91 0.63 1.10
Pigs 6.90 7.60 10.07 10.63 12.79 13.29 13.52 7.60
Mules 0.08 0.09 0.13 0.17 0.19 0.22 0.18 0.09
Donkeys 1.00 1.00 1.02 0.96 0.97 0.88 0.65 0.44
Yak 0.04 0.13 0.13 0.04 0.06 0.06 0.06 0.08
Total
Livestock
353.60 369.00 419.59 445.29 470.86 485.39 485.00 529.70
Poultry 138.50 159.20 207.74 275.32 307.07 347.61 489.01 648.83
Dogs NC NC 18.54 17.95 21.77 25.48 29.02 19.09 Source: Department of Animal Husbandry, Dairying and Fisheries: Animal Husbandry Statistics 2008, and
Provisional Results of Livestock Census, 2007
NC= Not classified
Proportion of Cross-bred Cattle in the Total Cattle Population (1987-2007)
Percentage of Cross bred
cattle
1987 1992 1997 2003 2007
5.7 7.4 10.1 13.3 16.6

264
Annexure-4.5
Estimates of Production and Per Capita Availability of Milk (1950-51 to 2008-09)
Year Production of milk
(million tonnes)
Per capita Availability
(gms. Per day)
1950-51 17 124
1955-56 19 124
1960-61 20 124
1968-69 21.2 112
1973-74 23.2 112
1979-80 30.4 127
1980-81 31.6 128
1981-82 34.3 136
1982-83 35.8 139
1983-84 38.8 147
1984-85 41.5 154
1985-86 44.0 160
1986-87 46.1 164
1987-88 46.7 163
1988-89 48.4 166
1989-90 51.4 173
1990-91 53.9 176
1991-92 55.7 178
1992-93 58.0 182
1993-94 60.6 187
1994-95 63.8 194
1995-96 66.2 197
1996-97 69.1 202
1997-98 72.1 207
1998-99 75.4 213
1999-2000 78.3 217
2000-01 80.6 220
2001-02 84.4 225
2002-03 86.2 230
2003-04 88.1 231
2004-05 92.5 233
2005-06 97.1 241
2006-07 100.9 246
2007-08 104.8 252
2008-09* 110.0 261
* Anticipated achievements Source: Department of Animal Husbandry, Animal Husbandry Statistics, 2008

265
Annexures for Chapter-5
Annexure-5.1
List of Agricultural Colleges in India
State University College/faculty
Andhra
Pradesh
Acharya N. G. Ranga
Agricultural University
(ANGRAU),
Rajendranagar,
Hyderabad, 500030
1. College of Agriculture (ANGRAU), Rajendranagar,
Hyderabad 500030.
2. S.V. Agricultural College (ANGRAU), Tirupati 517502,
Chittoor District
3. Agricultural college (ANGRAU), Bapatla 522101, Guntur
District
4. Agricultural College (ANGRAU), Aswaraopet,
Khammam District
5. Agricultural College (ANGRAU), Nandyal (Mahanandi),
Kurnool District
6. Agricultural College (ANGRAU), Naira, Srikakulam
District
7. Agricultural college, Jagtial.
8. Agricultural college,Rajahmundry.
Assam Assam Agriculture
University (AAU)
Jorhat, 785013
9. Biswanath College of Agriculture (AAU), Biswanatha
Chariali, Dist Sonitpur
10. College of Agriculture (AAU), Jorhat 785013, Assam
Bihar Bihar agricultural
University
Sabour
11. College of Agriculture, Dumraon, Buxar
12. Bihar agriculture college, Sabour 13. Faculty of Agriculture , Pusa, Samastipur
Rajendra Agricultural
University, Pusa
Samastipura.
14. Mandan Bharti Agricultural College, Agwanpur, Saharsa
15. Tirhut College of Agriculture, Dholi, Muzaffarpur
16. BholaPaswanShashtri College of Agriculture, Purnea
Chhattis-
garh
Indira Gandhi Krishi
Viswavidyalay, Raipur
492012
17. College of Agriculture, Raipur
Delhi IARI, New Delhi 18. PG School, New Delhi
Gujarat
Anand Agricultural
University (AAU), Anand
19. B.A. College of Agriculture (AAU), Anand 388110,
Gujararat
Junagadh Agricultural
University (JAU),
Junagadh Gujarat
362001
20. College of Agriculture (JAU), Junagadh 362031
Navasari Agricultural
University (NAU), Navsari
396450
21. N.M. College of Agriculture (NAU), Navsari 396450

266
Sardar Krushinagar
Dantiwada Agricultural
University (SDAU),
Sardar Krushinagar,
22. C.P. College of Agriculture (SDAU), Sardar Krushinagar
385506, Banaskantha Dist
Haryana
Ch Charan Singh
Haryana Agricultural
University (HAU) Hisar, 125004
23. College of Agriculture , Hisar 125004, Haryana
24. College of Agriculture , Kaul, Kaithal Dist
Himachal
pradesh
Ch. Sarwan Kumar
Krishi Vishwa
Vidyalaya (CSKHPKV),
Palampur
25. College of Agriculture , Palampur 176062, Dist Kangra
Jammu&ka
shmir
Sher-e-Kashmir
University of
Agricultural Sciences
and Tech (SKUAST-
Jammu),
26. Faculty of Agriculture , R.S.Pura, Jammu
Sher-e-Kashmir University
of Agricultural Sciences &
Tech. (SKUAST-Kashmir),
27. Faculty of Agriculture , Wadura, Sapore, Kashmir
Jharkhand Birsa Agricultural
University (BAU)
Kanke, Ranchi,-834006
28. Ranchi Agricultural College (BAU), Kanke, Ranchi
Karnataka University of Agricultural
Sciences, (UAS), Bangalore
560065
29. College of Agriculture, GKVK Campus, Bangalore
30. College of Agriculture, Hassan - 560065, GKVK
31. College of Agriculture, VC Farm, Mandya Dist-571405,
32. College of Agriculture, Shimoga Dist, Naveli – 577201
University of
Agricultural Sciences,
(UAS), Dharwad
33. College of Agriculture, Bijapur Dist,
34. College of Agriculture , Krishinagar, Dharwad
University of Agricultural
Sciences, Raichur
35. College of agriculture, raichur-584 102
36. College of Agriculture, Bheemarayanagudi
Kerala Kerala Agricultural
University (KAU) 37. College of Agriculture, Vellayani P.O, Thiruvananthapuram-6
38. College of Agriculture , Padannakkad - Kasargode
Madhya
pradesh
Jawaharlal Nehru Krishi
Vishwa Vidyalaya
(JNKVV) Jabalpur
39. College of Agriculture , Krishinagar Adhartal, Jabalpur
40. College of Agriculture , Mandsaur, Madhya Pradesh
41. College of Agriculture , Rewa, Madhya Pradesh
Rajmata Vijayaraje
Scindia Krishi Vishwa
Vidyalaya
RVSKVV,Gwalior
42. College of Agriculture, Gwalior
43. College of Agriculture, Sehore
44. College of Agriculture, Indore
45. College of Agriculture, Khandwa
Maha-
rashtra
Dr. Balasaheb Sawant
Konkan Krishi
Vidyapeeth (BSKKV)
Dapoli, 415712
46. College of Agriculture , Dapoli, Dist Rathnagiri
Marathwada
Agricultural University,
(MAU), Parbhani
431402
47. College of Agriculture, Krishi Nagar, Parbhani
48. College of Agriculture, Lathur, Latur Dist
Mahatma Phule Krishi
Vidyapeeth, (MPKV),
Rahuri 413722,
Ahmednagar
49. College of Agriculture, Badnapur, Jalna Dist
50. College of Agriculture, Ambajogai, Beed Dist
51. College of Agriculture, Osmanabad, Maharashtra
52. College of Agriculture, Dhule
53. College of Agriculture, Kolhapur - 416212,

267
54. College of Agriculture, Shivajinagar, Pune
Dr Punjabrao Deshmukh
Krishi Vidyapeeth
(PDKV), Akola,
Maharashtra 444104
55. College of Agriculture, Akola - 444104,
56. College of Agriculture, Nagpur
57. College of Agriculture, At. Sonapur, Gadchiroli.
58. Shri Shivaji College of Agriculture, Amravati.
59. Anand Niketan College of Agriculture, Warora,Dist
Chandrapur.
Mizoram Central Agricultural
University, Imphal
60. College of Agriculture, Iroisemba, Imphal
Orissa Orissa University of
Agriculture &
Technology,
Bhubaneswar
61. College of Agriculture, Bhubaneswar, Khurda
62. College of Agriculture, Chiplima, Sambalpur
63. College of Agriculture, Bhawanipatna
Punjab Punjab Agricultural
University, (PAU),
Ludhiana, Punjab
141004
64. College of Agriculture, Ludhiana
Rajasthan
Rajasthan Agricultural
University, Bikaner
65. College of Agriculture, Beechwal, Bikaner
66. SKN College of Agriculture, Jobner, Rajasthan
67. College of Agriculture, Lalsot
Maharana Pratap
Agriculture and
Technology University,
Udaipur
68. Rajasthan College of Agriculture, Udaipur
Tamil
Nadu
Tamil Nadu Agricultural
University (TNAU),
Coimbatore, Tamil Nadu
641003
69. Agricultural College and Research Institute , Coimbatore
70. Agricultural College and Research Institute , Madurai
71. Agricultural College and Research Institute , Killikulam ,
Tuticorin Dist
72. Anbil Dharmalingam Agricultural College and Research
Institute, Navalur Kattupattu, Trichy
Uttaranchal Govind Ballabh Pant
University of Agriculture
and Technology
(GBPAUT), Pantnagar,
Uttaranchal 263145.
73. College of Agriculture (GBPUAT), Pantnagar 263145,
74. College of PG Studies (GBPUAT), Pantnagar 263145
Uttar
Pradesh
Chandra Shekhar Azad
University of Agriculture &
Technology (CSAUT)
Kanpur, Uttar Pradesh
208002
75. College of Agriculture , Kanpur , Uttar Pradesh
Narendra Dev University of
Agriculture and
Technology (NDUAT,
Faizabad 224229,UP
76. College of Agriculture, Kumarganj, Faizabad
Sardar Ballabh Bhai Patel
University of Agriculture
Technology, Meerut, UP
77. College of Agriculture, Modhipuram, Meerut
Allahabad Agricultural
university, Allahabad
78. Faculty of agriculture, Allahabad
Aligarh Muslim
University (AMU),
Aligarh,UP
79. Centre of agriculture, Aligarh
Banaras Hindu University
(BHU), Varanasi 80. Institute of Agriculture Sciences, Varanasi
West
Bengal
Bidhan Chandra Krishi
Vishva Vidyalaya,
Nadia, West Bengal.
81. Faculty of Agriculture, Mohanpur, Nadia
Uttar Banga Krishi
Vishwavidyalaya
(UBKVV), Cooch
82. College of Agriculture, Pundibari, Cooch Behar

268
Bihar– 736165,West
Bengal
Visva-Bharati,
Santiniketan
83. Institute of Agriculture, Sriniketan, Brigham, West Bengal
Colleges Affiliated to State Agricultural Universities
Chhattisgarh
Indira Gandhi Krishi
Vishwa Vidyalaya
(IGKVV) Raipur, 492012
1. Shri Ram College of Agriculture, Rajnandgaon
2. Bhartiya College of Agriculture, Durg
3. Bhoramdev College of Agriculture, Kawardha
4. Chhattisgarh College of Agriculture, Bhilai, Durg
5. College of Agriculture, Ambagarh Chwoki
6. College of Agriculture, Dantewada
7. College of Agriculture, Raigarh
8. Mahamaya College of Agriculture, Dhamtari
9. Mardarshan College of Agriculture, Ambikapur
10. S.K. College of Agriculture, Kawardha
Maharashtra
Dr. Balasaheb Sawant
Konkan Krishi
Vidyapeeth (BSKKV)
Dapoli, 415712
11. Govindraoji Nikam Agriculture College, District Ratnagiri
12. College of Agriculture , Saralgaon , Tal. Murbad, District Thane
13. Chatrapati Shivaji Agriculture College, Kirlos, Tal. Kudal, District
Sindhudurg
14. College of Agriculture, Sangulwadi, Tal.Vaibhavwadi ,District
Sindhudurg
15. Kai. Rajaram Marathe College of Agriculure
Phondaghat,District Sindhudurg.
16. Sharadchandrajee Pawar College of Agriculture,
Kharavate Dahivali, Tal.Chipalun District Ratnagiri.
Marathwada Agricultural
University, (MAU),
Parbhani 431402
17. Late Dadasaheb Patil College of Agriculture , Dahegaon, Tal
Vaijapur, Dist Aurangabad
18. College of Agriculture, , Naigaon Bazar, Tal Naigaon, Dist Nanded
19. Rajiv Gandhi College of Agriculture , , Jintur Raod, Parbhani
20. Shri Chhatrapati Sahu Phule Ambedkar College of Agriculture, ,
Ashti, Dist Beed
21. College of Agriculture, Hingoli
22. Aditya College of Agriculture, Beed, Maharashtra
23. College of Agriculture, Kanchanwadi
24. CSMSS College of Agriculture, Kanchanwadi, Paithan Road,
Tal. & District Aurangabad.
25. S.D.M.V.M’s College of Agriculture,Gevrai Tanda, Paithan
Road, Aurangabad.
26. College of Agriculture, Mahajan Complex, Nanded Naka,
Nanded Road, At.post &Tal.Udgir,
27. College of Agriculture,(Kharpudi), Post Box No.45, Jalna
Mahatma Phule Krishi
Vidyapeeth, (MPKV),
Rahuri 413722,
Ahmednagar
28. College of Agriculture Akluj, Tal Malshiras, Solapur District
29. College of Agriculture Kadegaon, Sangli Dist
30. College of Agriculture ,Tal Newasa, Ahmadnagar Dist
31. Padmashri Dr Appasaheb Pawar College of Agriculture Baramati,
32. College of Agriculture, Nasik
33. Krishna College of Agriculture, Tal Karad, Dist Satara
34. K.K. Wagh College of Agriculture Panchawati, Nasik.
35. College of Agriculture Banpuri, Tal Patan, Dist Satara
36. Loknete Mohanrao Kadam College of Agriculture, Sonsal
Hingangaon, Tal.Kadegaon, DistrictSangli
37. College of Agriculture, Udoji Maratha Boarding
Campus, Gangapur Road, Nasik.
38. College of Agriculture, Rajmachi, Tal. Karad District Satara

269
415 110.
39. Dr.Ulhas Patil College of Agriculture, Near Dr. Ulhas
Patil Medical College, Jalgaon-Bhusawal,
40. Padmabhushan Vasant Dada Patil College of Agriculture,
Ambi, Talegaon Dabhade, Tal. Maval District Pune
41. College of Agriculture, Pujya Saneguruji Vidya Prasarak ,
Shahada District Nandurbar 425 409.
42. Lokmangal College of Agriculture, At. Post. Wadala,
Tal. Uttar Solapur District Solapur 413 222
43. College of Agriculture, At Post. Talsande, Tal.
Hatkangale, Dist .Kolhapur 416 112.
44. College of Agriculture, At Post. Bahubali, Tal. Hatkangale,
Dist .Kolhapur 416 110.
45. Shramshakti College of Agriculture, At. Maldad, Tal.
District Ahmednagar-422 608
Dr Punjabrao Deshmukh
Krishi Vidyapeeth
(PDKV), Akola,
Maharashtra.
46. Dr. Rajendra Gode College of Agriculture, Buldana
47. Swatantrya Vir Ganpatrao Ingle College of Agriculture, Jalgaon –
Jomod, Buldhana Dist, Maharashtra
48. Vivekanand College of Agriculture, Vivekanand Nagar, Hiwara
Ashram, Tal Mehkar, Buldhana Dist
49. Marotrao Wadafale College of Agriculture , Kalamb, Yavatmal Dist
50. College of Agriculture , Dharwa, Yavatmal Dist
51. Ramakrishna Bajaj College of Agriculture , Wardha
52. Shri Sant Shankar Maharaj College of Agriculture,
Pimpalkhuta, DistrictAmravati.
53. Late R.G.Deshmukh College of Agriculture, Tiwsa,
DistrictAmravati
54. Shri Samarth College of Agriculture, Deoulgaon Raja,
District Buldana 443 204
55. Sau. Vasudhatai Deshmukh College of Agriculture,
Talegaon Dashasar Dhamangaon Railway, District Amravati
56. Manoharbhai Patel College of Agriculture, Hiratola,
Kalimati, Tal. Goregaon, District Gondia 441 801.
57. Shri Sevakbhau Wakhaye Patil College of Agriculture,
Kesalwada Wagh, Tal. Lakhani, DistrictBhandara
58. College of Agriculture, Umarkhed, Tal. Umarkhaed
DistrictYavatmal
Rajasthan Rajasthan Agricultural
University, Bikaner
59. Dayanand college of agriculture, Ajmeer.
60. Swamy keshawananda maha vidyalaya,Sangria
61. B.B.D.Govt.PG.College,chimanpura,(shahpura)
62. Govt. College, Sawai Madhopur
63. Parmanad Agriculture Colleges, Gajsinghpur,
Sriganganagar
64. Parmanad Agriculture Colleges,Bhodra, Hanumanghad
Dist
Tamil Nadu
Tamil Nadu Agricultural
University (TNAU),
Coimbatore, Tamil Nadu
641003
65. Adhiparasakthi Agricultural College, Kalavai, Vellore District.
66. Vanavarayar Institute of Agriculture, Pollachi - 642 103
67. Thanthai Rover Institute of Agriculture and Rural
Development, Perambalur - 621 212
68. College of Agricultural Technology, Kullapuram,Theni-
625562
69. Pandit Jawahar lal Nehru College of Agriculture, Bhajancoa,
Karakul
New Colleges Being Established During 2010-11
University College name
Maharastra MPKV 1. College of Agriculture, Jalod road, Railway crossing junction, Amalnir
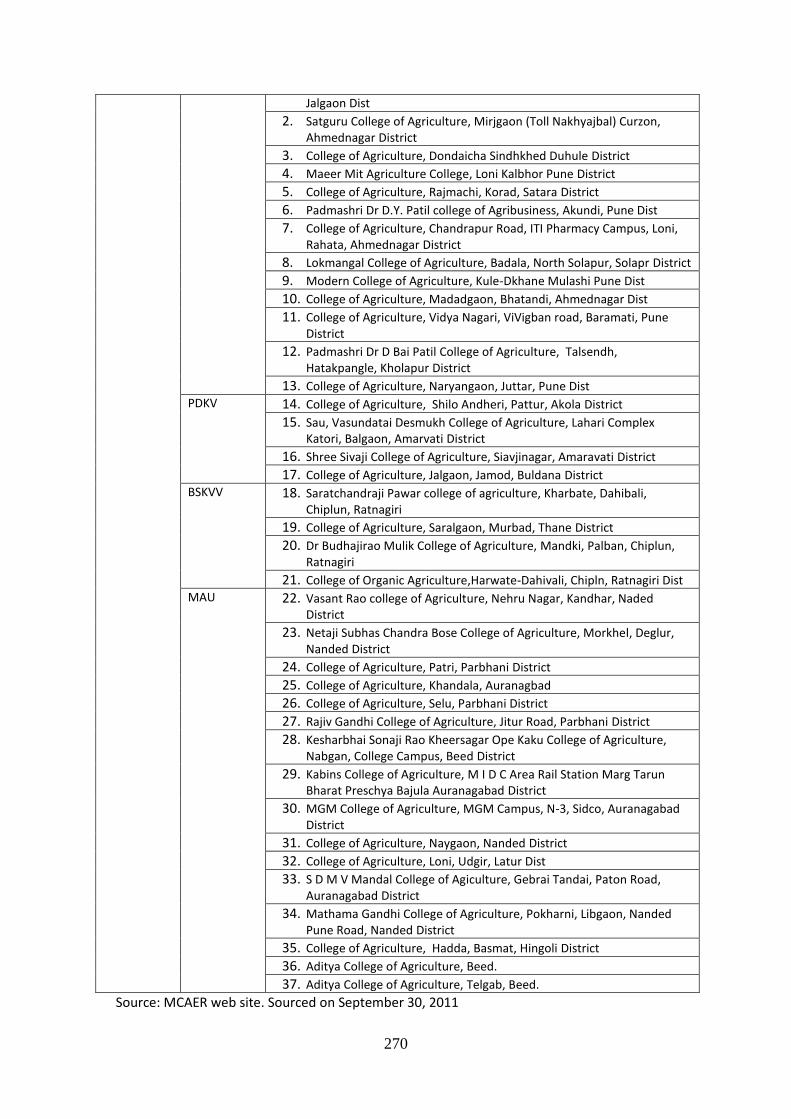
270
Jalgaon Dist
2. Satguru College of Agriculture, Mirjgaon (Toll Nakhyajbal) Curzon, Ahmednagar District
3. College of Agriculture, Dondaicha Sindhkhed Duhule District
4. Maeer Mit Agriculture College, Loni Kalbhor Pune District
5. College of Agriculture, Rajmachi, Korad, Satara District
6. Padmashri Dr D.Y. Patil college of Agribusiness, Akundi, Pune Dist
7. College of Agriculture, Chandrapur Road, ITI Pharmacy Campus, Loni, Rahata, Ahmednagar District
8. Lokmangal College of Agriculture, Badala, North Solapur, Solapr District
9. Modern College of Agriculture, Kule-Dkhane Mulashi Pune Dist
10. College of Agriculture, Madadgaon, Bhatandi, Ahmednagar Dist
11. College of Agriculture, Vidya Nagari, ViVigban road, Baramati, Pune District
12. Padmashri Dr D Bai Patil College of Agriculture, Talsendh, Hatakpangle, Kholapur District
13. College of Agriculture, Naryangaon, Juttar, Pune Dist
PDKV 14. College of Agriculture, Shilo Andheri, Pattur, Akola District
15. Sau, Vasundatai Desmukh College of Agriculture, Lahari Complex Katori, Balgaon, Amarvati District
16. Shree Sivaji College of Agriculture, Siavjinagar, Amaravati District
17. College of Agriculture, Jalgaon, Jamod, Buldana District
BSKVV 18. Saratchandraji Pawar college of agriculture, Kharbate, Dahibali, Chiplun, Ratnagiri
19. College of Agriculture, Saralgaon, Murbad, Thane District
20. Dr Budhajirao Mulik College of Agriculture, Mandki, Palban, Chiplun, Ratnagiri
21. College of Organic Agriculture,Harwate-Dahivali, Chipln, Ratnagiri Dist
MAU 22. Vasant Rao college of Agriculture, Nehru Nagar, Kandhar, Naded District
23. Netaji Subhas Chandra Bose College of Agriculture, Morkhel, Deglur, Nanded District
24. College of Agriculture, Patri, Parbhani District
25. College of Agriculture, Khandala, Auranagbad
26. College of Agriculture, Selu, Parbhani District
27. Rajiv Gandhi College of Agriculture, Jitur Road, Parbhani District
28. Kesharbhai Sonaji Rao Kheersagar Ope Kaku College of Agriculture, Nabgan, College Campus, Beed District
29. Kabins College of Agriculture, M I D C Area Rail Station Marg Tarun Bharat Preschya Bajula Auranagabad District
30. MGM College of Agriculture, MGM Campus, N-3, Sidco, Auranagabad District
31. College of Agriculture, Naygaon, Nanded District
32. College of Agriculture, Loni, Udgir, Latur Dist
33. S D M V Mandal College of Agiculture, Gebrai Tandai, Paton Road, Auranagabad District
34. Mathama Gandhi College of Agriculture, Pokharni, Libgaon, Nanded Pune Road, Nanded District
35. College of Agriculture, Hadda, Basmat, Hingoli District
36. Aditya College of Agriculture, Beed.
37. Aditya College of Agriculture, Telgab, Beed.
Source: MCAER web site. Sourced on September 30, 2011

271
General Universities & Others
Andhra
Pradesh
Osmania University,
Hyderabad-500007.
1. Loyala Academy (Autonomous) Degree College,Alwal,
Secunderabad . Madhya
Pradesh
Mahatma Gandhi
Gramodyog Viswavidyalaya,
2. College of Agriculture, Chittrakoot - 485 331, Satna,
Tamil
Nadu
Annamalai University,
Annamalainagar, 608 002,
3. Faculty of Agriculture, Annamalainagar
Gandhi Gram Rural Institute,
Gandhigram
4. Faculty of Agril. & Animal Husbandry, Gandhigram
Uttar
Pradesh
Bundelkhand University,
Jhansi
5. Baba Brahmanand Mahavidyalaya, Rath, Hamirpur
6. Zila Parishad Agricultural College, Banda, UP
Poorvanchal
UniversityJaunpur
7. PG College,Ghazipur
8. Udai Pratap College,Varanasi
9. Govt.Degree College,Jakhini,Varanasi
10. SMM Town PG College,Ballia
11. TD College, Jaunpur
12. Baba Raghava Das College, Deoria
Mahatma jyotiba phule
Rohilkhand University
Barailley
13. RSM PG College, Dhampur
Deen dayal upadhyay
university (Universityof
Gorakhpur), Gorakhpur
14. National post graduate college ,Barhalgani,Gorakhpur.
15. Sri Duragagi PG College, Azamgarh
Chhatrapati SahujiMaharaj
University, (CSJM),
(Kanpur university), Kanpur
16. KA Degree College, Allahabad
17. Janta Mahavidyalaya, Ajitmal
18. Janta College,Bakewar, Etawah dist
19. C.B.Gupta College of Agriculture, Bakshi-Ka-Talab,
Lucknow Dist
Dr.B.R.Ambedkar UNIV,
Agra
20. RBS College, Agra
21. Narian College,Shikohabad
22. Ch.Charan singh shivdan college,lglas,Aligarh
23. Sarvodaya Mahavidyalaya, Chaumuhan-mathura-281406
Chowdary charan singh
university (Meerut Univ).
Meerut
24. RMP PG Col.,Narsan,Haridwar
25. A.S.College, Lakhaoti,Bulandshahar
26. J.V.College, Baraut
27. R.K.College,Shamili
28. Kissan PG College,Simbhaoli
29. Gochar Mahavidyalaya,Rampur
30. K.V.PG College,Machhra
31. Ch.Chhotu Ram PG college,Muzaffarnagar
32. Inst of Advanced Studies
West
Bengal
Calcutta University, Calcutta
33. College of Agriculture, Calcutta

272
Annexure-5.2
Students Admitted and Passed in Agriculture Courses (Crop Science) during 2009-10
University
Diploma UG PG PhD
Admit Pass Admit Pass Admit Pass Admit Pass AAU, ALLAHABAD 1 0 120 137 287 188 29 14
AAU, ANAND 0 94 67 67 117 55 14 17
AAU,JORHAT 184 160 154 19 40 4
AMU, ALIGARAH 18 17 10 2
ANGRAU,HYDERABAD 465 318 623 428 162 103 43 39
BAU, RANCHI 50 20 21 11
BCKV,MOHANPUR 101 96 142 80 66 5
BHU, VARNASI 128 84 94 66 48 17
Bihar AU, Bhagalpur
BSKV, DAPOLI 417 353 57 28 6 0
CAU, IMPHAL 80 0 48 0
CBGKMV, Lucknow 170 100
CCSHAU, HARYANA 181 74 63 35 12 3
CSKHPKV, PALAMPUR 72 49 61 47 19 7
CSUAST, KANPUR 112 138 90 49 22 19
GBPUAT, PANTHNAGAR 160 146 159 106 118 119
IARI, New Delhi 74 51 86 51
IGKV, RAIPUR 280 150 93 32 7 8
JAU,JUNAGADH 25 0 90 73 63 54 2 17
JNKV, JABALPUR 279 212 165 115 7 0
KAU, TRISSUR 147 185 34 25 9 3
MAU, PARABHANI 3658 2661 419 659 323 184 23 8
MPKV, RAHURI* 1276 1136 276 258 84 29
MPUAT, UDAIPUR 105 75 59 33 13 2
NAU, NAVSARI 77 53 80 71 22 13
NDUAT, Faziabad 100
OUAT, BHUBANESWAR 100 97 124 60 7 7
PAU, LUDHIANA 110 90 113 63 38 21
PDKV, AKOLA* 1166 783 394 204 51 4
PSB VB, Sriniketan 60
RAU, PUSA 150 100 101 80 29 10
RSKVV, GWALIOR 240 167 160 147 6
SKDAU,DANTIWADA 106 76 80 59 68 46 14 9
SKRAU, BIKANIR 435 407 102 86 28 14
SKUAST, JAMMU 53 12 17 13 7 7
SKUAST, Kashmir 57 23 16 12 34 10
SVPUAT, MEERUT 75 46 18
TNAU, COIMBATORE 363 448 231 147 71 33
UAS, DHARWAD 40 33 222 277 114 96 43 24
UAS,BANGLORE 53 53 433 287 156 179 61 62
UAS,RAICHUR 127 77 60 29
UBKVV, COOCHBIHAR 50 0 14 16 27 4
YSPUHF, SOLAN 17 15 0 1
Colleges Affiliated to
MAU, Parbhani 900 494
SKRAU, BIKANIR 300 292

273
TNAU, COIMBATORE 270 128
Sub Total 4348 3235 10429 8136 4373 2809 1125 583
* Include data of affiliated colleges
Others
Amar Singh College, Ch Charan Singh University, Lakahoti 185 170
Annamalai University, Annamalainagar 53 0
Baba Raghva Das PG College,Deoria, Deen Dayal Upadhyay University 120 110 58 58
Calcutta University, Calcutta 60 0
Ch Charan Singh University 120 109 74 54
Ch Chhotu Ram (PG) College, Ch Charan Singh University, Muzaffernagar 235 151 26 23
Chandra Bhanu Gupt Krishi Mahavidyalaya, Chhatrapati Sahuji Maharaj University, Lucknow 120 118
Gochar Mahavidyalaya, Ch Charan Singh University, Rampur 118 110
Govt Degree college, Veer Bahadur Singh Poorvanchal University, Varanasi 60 59
Janata Degree College,Bakewar, Etawah, Chhatrapati Sahuji Maharaj University 120 100 15 15
Janta Vedic College, Ch Charan Singh University, Baraut 156 135
Kulbhaskar Ashram PG College,Allahabad, Chhatrapati Sahuji Maharaj University 78 61 44 24
National PG College,Gorakhpur, Deen Dayal Upadhyay University 120 119 30 29
Raja Balwant Singh College,Bichpuri, Agra, Dr B R Ambedkar University 54 50
Raja Mahendra Pratap(PG) College, Gurukul Narsan, Haridwar, Hemwati Nandan Bahuguna Garhwal University 30 22
Ranjit Singh Memorial PG College,Bijnor, Mahatma Jyotiba Phule Rohilkhand University 177 170 30 29
Rashtriya Kisan P G Degree College, Ch Charan Singh University, Shamili 155 130 53 49
SASARD, MEZDIPHEMA 600 400 0 0
Shri Durga Ji PG College, Deen Dayal Upadhyay University 264 240 96 88
Shri Ganesh Rai PG College,Jaunpur, Veer Bahadur Singh Poorvanchal 188 180 30 30

274
University
Shri Murali Monohar Town PG college,Ballia, Veer Bahadur Singh Poorvanchal University 240 168 110 106
Tilak Dhari PG College,Jaunpur, Veer Bahadur Singh Poorvanchal University 220 210 90 85
Udai Pratap College,Varanasi, Veer Bahadur Singh Poorvanchal University 100 96 45 43 Other 11 pvt colleges 1100 880
Sub-total others 4476 3716 898 705
All Colleges
Diploma UG PG PhD
Admit Pass Admit Pass Admit Pass Admit Pass
Grand Total 4348 3235 14905 11852 5271 3514 1125 583

275
Annexure-5.3
Posts of Agricultural Human Resources in Some States
State No. of
districts
Posts for agricultural
graduates
Andhra Pradesh 23 7159
Uttar Pradesh 70 888
Rajasthan 32 5336
Maharashtra 35 11000
Goa 2 21
Himachal Pradesh 12 880
Tamilnadu 31 2880
Bihar 38 1,627
Kerala 14 4,776
Karnataka 28 8,500
Madhya Pradesh 50 9,388
Jammu & Kashmir 12 500
Punjab 20 850
Andaman &Nicobar 3 50
Lakshadweep 1 10
Total 371 53015
Estimate for other states/Union
Territories*
251 35,900
Total of all State Governments 88,915
Central Government (Deptt. Of
Agriculture and its offices)
500
Grand total 89,408 Source: Official web-sites of the respective State governments and data collected directly from the States.
Numbers are approximate and estimated in some cases on the basis of available data from the
websites and also the data collected through the Establishment Survey.
* Estimates for the remaining 251 districts have been made pro rata.

276
Annexure-5.4
Agricultural Human Resources Stock Requirement Projections for State Governments
and Central Promotional Organizations
Year Diploma UG PG PhD
2009-10 27600 56160 13200 8640
2010-11 27968 56909 13376 8755
2011-12 28336 57658 13552 8870
2012-13 28704 58406 13728 8986
2013-14 29072 59155 13904 9101
2014-15 29440 59904 14080 9216
2015-16 29808 60653 14256 9331
2016-17 30176 61402 14432 9446
2017-18 30544 62150 14608 9562
2018-19 30912 62899 14784 9677
2019-20 31280 63648 14960 9792
Annexure-5.5
Agricultural Human Resources Stock Requirement Projections for Extension Work
Year Diploma UG PG PhD
2009-10 4580 22400 6008 4013
2010-11 4649 23108 6116 4053
2011-12 4715 23814 6223 4093
2012-13 4772 24509 6326 4131
2013-14 4830 25205 6429 4170
2014-15 4888 25903 6533 4210
2015-16 4946 26603 6637 4249
2016-17 5004 27304 6742 4290
2017-18 5063 28007 6847 4330
2018-19 5122 28712 6953 4371
2019-20 5182 29419 7059 4413

277
Annexure-5.6
a. Trends in Staff Strength in ICAR Institutions
Year Scientific Technical Administrative Others All
S F S F S F S F S F
2001 6965 5054 9407 8223 5783 5050 12540 11967 34695 30294
2002 6100 4589 8897 7702 5626 5102 12453 11177 33076 28570
2003 6100 4796 8897 7759 5626 5161 12453 11181 33076 28897
2004 6100 4796 8897 7759 5626 5161 12453 11181 33076 28897
2005 6428 4458 7765 7100 5198 4787 10708 9724 30099 26069
2006 6428 4609 7952 7355 5103 4705 10145 9174 29628 25843
2007 6428 4184 7893 7119 4814 4355 9980 8964 29115 24622
2008 6428 4184 7893 7119 4814 4355 9980 8964 29115 24622
2009 6428 4165 8460 6478 5025 4440 10346 8441 30259 23524
2010 6428 4470 9407 8223 5783 5050 S= Sanctioned F=Filled
Source: Department of Agricultural Research and Education, Annual Reports for the respective years
b. ICAR’s scientists in crop science division as on March 2010
S. No. Name of the Institute
Overall Scientists in position
Sanction
ed In position % Filled
1. IARI, New Delhi 594 380 63.97
2. VPKAS, Almora 60 33 55.00
3. NBPGR, New Delhi 159 108 67.92
4. DWR, Karnal 56 44 78.57
5. NCIPM 24 19 79.16
6. CICR 80 61 76.25
7. DRR 71 53 74.64
8. CRRI, Cuttack 119 85 71.42
9. DSR, Mau 30 16 53.33
10. DSR, Hyderabad 48 38 79.16
11. CRIJAFT 74 43 58.10
12. DMR, New Delhi 34 21 61.76
13. SBI, Coimbatore 79 56 70.88
14. IGFRI, Jhansi 144 78 54.16
15. IISR, Lucknow 83 61 73.49
16. IIPR, Kanpur 86 53 61.62
17. DOR, Hyd. 42 37 88.09
18. NBAII, Bangalore 30 21 70.00
19. CTRI, Rajahmundry 70 37 52.85
20. NBAIM, Mau 24 08 33.33
21. NRCG, Junagadh 39 19 48.71
22. NRCPB, New Delhi 33 20 60.60
23. DRM, Bharatpur 34 26 76.47
24. NRC Soyabean, Indore 35 23 65.71
TOTAL 2055 1340 65.20

278
Annexure-5.7
Agricultural Human Resources Stock Requirement
Projections for Research
Year UG PG PhD
2009-10 85 425 1190
2010-11 88 438 1225
2011-12 90 450 1260
2012-13 93 463 1295
2013-14 95 475 1330
2014-15 98 488 1365
2015-16 100 500 1400
2016-17 103 513 1435
2017-18 105 525 1470
2018-19 108 538 1505
2019-20 110 550 1540

279
Annexure-5.8
SAU’s Scientists and Faculty in Crop Science Education as on March 2010
Sl No University Sanctioned In position Vacant
1 UAS,Banglore 553 365 188
2 AAU,Anand 361 283 78
3 JAU,Junagadh 350 257 93
4 UAS,Raichur 323 146 177
5 SKDAU,Dantiwada 282 251 31
6 ANGRAU,HYDERABAD 393 281 112
7 BCKV,MOHANPUR 230 197 33
8 UBKV,COOCH BEHAR,WB 65 25 40
9 TNAU,COIAMBATORE 1032 994 38
10 UAS, Dharwad 295 247 48
11 UHS, Bagalkot 114 52 62
12 YSPUHF,SOLAN 7 4 3
13 BSKKV,Dapoli 193 170 23
14 RSKVV,GWALIOR,UP 207 71 136
15 CSUAST,Kanpur 106 73 33
16 OUAT,bhubaneshwar 101 87 14
17 KAU,KERALA 318 172 146
18 JNKVV,JABALPUR 190 79 111
19 MPUAT,UDAIPUR 80 46 34
20 UPPDDU,MATHURA 13 7 6
21 UAS,BANGLORE 607 194 413
22 JAU,JUNAGADH 327 88 239
23 MAFSU,NAGPUR 2 0 2
24 BAU,RANCHI 141 28 113
25 SKDAU,DANTIWADA 283 44 239
26 WBAFS,WB 3 0 3
27 AAU,JORHAT 768 413 355
28 SKRAU,BIKANER 610 331 279
29 PDKV,AKOLA 350 146 204
30 CCSHAU,HISSAR,HARYANA 360 155 205
31 IGKVV,RAIPUR 240 155 85
32 RAU,PUSA 291 170 121
33 NAU,NAVSARI 72 9 63
34 CBGKMV, Luchnow 14 0 14
Sub-total for available unvi. (34) 9281 5540 3741
No of total unvi (40)
Estimate for all universities 10919 6518 4401

280
Annexure-5.9
Private Sector Seed Industry in India
Year Indian Private Multinationals All
1990-91 107 23 130
1995-96 142 44 186
2000-01 203 68 271
2005-06 253 90 343
2006-07 267 93 360
2009-10 NA NA 450 Source: wwwtradeindia.com; http:/seednet.in. Data for 2009-10 from Seed Association
Annexure-5.10
Production/Distribution of Seeds
Year
Production
of Breeder
Seed
(thousand
quintals)
Production of
Foundation Seed
(lakh quintals)
Distribution of
Certified/quality
seed (lakh
quintals)
2000-01 42.69 5.91 86.27
2001-02 45.54 5.44 91.80
2002-03 48.42 6.14 98.03
2003-04 61.82 6.50 108.59
2004-05 66.46 6.90 120.26
2005-06 68.64 7.40 126.75
2006-07 73.83 7.96 155.01
2007-08 91.96 8.22 179.05
2008-09 94.41 9.69 215.81
2009-10 105.00 10.50 240.00
Annual Growth Rate (%) 10.8 7.1 12.4 Source: Directorate of Economics and Statistics, Ministry of Agriculture and /Cooperation, Agricultural
Statistics at a Glance, 2010

281
Annexure-5.11
Agricultural Human Resources Stock Requirement Projections for Seeds
(Low Growth)
Year Diploma UG PG PhD
2009-10 327 3972 1323 515
2010-11 343 4171 1389 541
2011-12 360 4379 1458 568
2012-13 378 4598 1531 596
2013-14 397 4828 1608 626
2014-15 417 5070 1688 658
2015-16 438 5323 1772 690
2016-17 460 5589 1861 725
2017-18 483 5869 1954 761
2018-19 507 6162 2052 799
2019-20 532 6470 2154 839
Agricultural Human Resources Stock Requirement Projections for Seeds
(High Growth)
Year Diploma UG PG PhD
2009-10 327 3972 1323 515
2010-11 359 4369 1455 567
2011-12 395 4806 1600 623
2012-13 435 5287 1760 686
2013-14 478 5816 1936 754
2014-15 526 6397 2130 830
2015-16 579 7037 2343 913
2016-17 636 7740 2577 1004
2017-18 700 8515 2835 1104
2018-19 770 9366 3118 1215
2019-20 847 10303 3430 1336
Note: LOW GROWTH means growth of 5% per annum
HIGH means growth of 10% per annum

282
Annexure-5.12
Consumption, Production and Imports of Fertilizers: 2000-01 to 2008-09
(in lakh tonnes)
Year Production Imports Consumption Imports as % of
consumption
2000-01 147.52 20.90 197.02 10.6
2001-02 146.32 23.99 173.60 13.8
2002-03 144.68 17.57 160.94 10.9
2003-04 142.65 20.18 167.98 12.0
2004-05 154.05 27.52 183.98 15.0
2005-06 155.75 52.54 203.40 25.8
2006-07 160.95 60.80 216.52 28.1
2007-08 147.07 77.21 225.70 34.2
2008-09 143.34 101.51 249.09 40.8
2009-10 163.20 81.23 132.252
1.
Estimated 2.
Relates to Kharif season only Source: Economic Surveys 2007-08, 2008-09 and 2009-10

283
Annexure-5.13
Agricultural Human Resources Stock Requirement Projections
for Fertilizers (Low Growth)
Year Diploma UG PG PhD
2009-10 508 4558 2160 157
2010-11 513 4604 2182 158
2011-12 518 4650 2204 160
2012-13 523 4696 2226 161
2013-14 528 4743 2248 163
2014-15 534 4791 2270 165
2015-16 539 4838 2293 166
2016-17 544 4887 2316 168
2017-18 550 4936 2339 170
2018-19 555 4985 2363 171
2019-20 561 5035 2386 173
Agricultural Human Resources Stock Requirement Projections
for Fertilizers (High Growth)
Year Diploma UG PG PhD
2009-10 508 4558 2160 157
2010-11 518 4649 2203 160
2011-12 528 4742 2247 163
2012-13 539 4837 2292 166
2013-14 549 4934 2338 170
2014-15 560 5032 2385 173
2015-16 572 5133 2433 176
2016-17 583 5236 2481 180
2017-18 595 5340 2531 183
2018-19 607 5447 2582 187
2019-20 619 5556 2633 191

284
Annexure-5.14
Agricultural Human Resources Stock Requirement Projections
for Pesticides (Low Gowth)
Year Diploma UG PG PhD
2009-10 217 1570 315 58
2010-11 219 1586 318 58
2011-12 221 1602 321 59
2012-13 224 1618 324 60
2013-14 226 1634 327 60
2014-15 228 1650 331 61
2015-16 230 1667 334 61
2016-17 233 1683 337 62
2017-18 235 1700 341 63
2018-19 237 1717 344 63
2019-20 240 1734 348 64
Agricultural Human Resources Stock Requirement Projections
for Pesticides (High Growth)
Year Diploma UG PG PhD
2009-10 217 1570 315 58
2010-11 221 1601 321 59
2011-12 226 1633 327 60
2012-13 230 1666 334 61
2013-14 235 1699 341 63
2014-15 240 1733 347 64
2015-16 244 1768 354 65
2016-17 249 1803 362 66
2017-18 254 1839 369 68
2018-19 259 1876 376 69
2019-20 265 1914 384 71

285
Annexure-5.15
Agricultural Human Resources Stock Requirement Projections
for Financial Institutions (Low Growth)
Year Diploma UG PG PhD
2009-10 2454 27429 9799 700
2010-11 2491 27840 9946 710
2011-12 2528 28258 10095 721
2012-13 2566 28682 10247 732
2013-14 2605 29112 10401 743
2014-15 2644 29549 10557 754
2015-16 2684 29992 10715 765
2016-17 2724 30442 10876 777
2017-18 2765 30899 11039 788
2018-19 2806 31362 11204 800
2019-20 2848 31833 11372 812
Agricultural Human Resources Stock Requirement Projections
for Financial Institutions (High Growth)
Year Diploma UG PG PhD
2009-10 2454 27429 9799 700
2010-11 2600 29060 10382 742
2011-12 2696 30136 10766 769
2012-13 2796 31251 11165 797
2013-14 2900 32407 11578 827
2014-15 3007 33606 12006 858
2015-16 3118 34849 12450 889
2016-17 3233 36139 12911 922
2017-18 3353 37476 13389 956
2018-19 3477 38863 13884 992
2019-20 3606 40301 14398 1028

286
Annexure -5.16
Agricultural Human Resources Stock Requirement
Projections for Insurance
Year UG PG
2009-10 1417 708
2010-11 1425 713
2011-12 1433 717
2012-13 1442 721
2013-14 1450 725
2014-15 1458 729
2015-16 1467 733
2016-17 1475 738
2017-18 1483 742
2018-19 1492 746
2019-20 1500 750
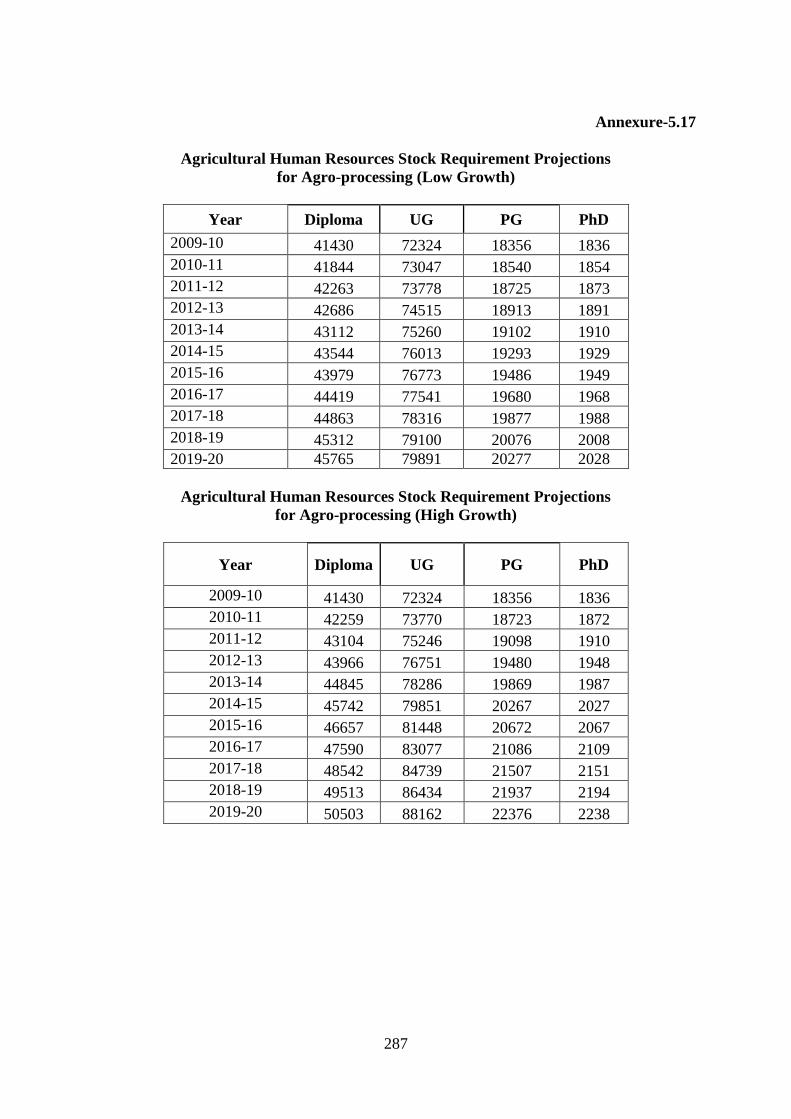
287
Annexure-5.17
Agricultural Human Resources Stock Requirement Projections
for Agro-processing (Low Growth)
Year Diploma UG PG PhD
2009-10 41430 72324 18356 1836
2010-11 41844 73047 18540 1854
2011-12 42263 73778 18725 1873
2012-13 42686 74515 18913 1891
2013-14 43112 75260 19102 1910
2014-15 43544 76013 19293 1929
2015-16 43979 76773 19486 1949
2016-17 44419 77541 19680 1968
2017-18 44863 78316 19877 1988
2018-19 45312 79100 20076 2008
2019-20 45765 79891 20277 2028
Agricultural Human Resources Stock Requirement Projections
for Agro-processing (High Growth)
Year Diploma UG PG PhD
2009-10 41430 72324 18356 1836
2010-11 42259 73770 18723 1872
2011-12 43104 75246 19098 1910
2012-13 43966 76751 19480 1948
2013-14 44845 78286 19869 1987
2014-15 45742 79851 20267 2027
2015-16 46657 81448 20672 2067
2016-17 47590 83077 21086 2109
2017-18 48542 84739 21507 2151
2018-19 49513 86434 21937 2194
2019-20 50503 88162 22376 2238

288
Annexure-5.18
Agricultural Human Resources Stock Requirement Projections
for Organized Retailing
Year Diploma UG PG.
2009-10 2000 2000 1000
2010-11 3000 2500 1500
2011-12 4000 3000 2000
2012-13 5000 3500 2500
2013-14 6000 4000 3000
2014-15 7000 4500 3500
2015-16 8000 5000 4000
2016-17 9000 5500 4500
2017-18 10000 6000 5000
2018-19 11000 6500 5500
2019-20 12000 7000 6000

289
Annexure-5.19
a) Overall Projections of Requirements Stocks of Agricultural Human Resources
(Low Growth)
Year Diploma UG PG PhD All UG & above
2009-10 87028 211107 59424 22019 292549
2010-11 89130 214805 60776 22322 297903
2011-12 91236 218527 62136 22628 303291
2012-13 93338 222264 63499 22935 308698
2013-14 95447 226031 64872 23244 314147
2014-15 97563 229828 66255 23556 319639
2015-16 99685 233657 67648 23871 325175
2016-17 101815 237518 69051 24189 330757
2017-18 103952 241412 70465 24510 336386
2018-19 106096 245340 71889 24834 342064
2019-20 108248 249304 73325 25162 347791
c. Overall Projections of Requirements Stocks of Agricultural Human resources
(High Growth)
Year Diploma UG PG PhD All UG &
above 2009-10 87028 211107 59424 22019 292549
2010-11 89731 217228 61570 22459 301257
2011-12 92400 222814 63521 22892 309227
2012-13 95086 228515 65509 23334 317357
2013-14 97800 234351 67541 23788 325680
2014-15 100543 240331 69620 24254 334206
2015-16 103316 246464 71750 24733 342947
2016-17 106120 252757 73932 25227 351916
2017-18 108956 259221 76170 25736 361127
2018-19 111826 265866 78467 26262 370596
2019-20 114731 272704 80828 26806 380338
c) Overall Projections of Requirements Stocks of Agricultural Human Resources
(Average Growth)
Year Diploma UG PG PhD All UG &
above 2009-10 87028 211107 59424 22019 292549
2010-11 89431 216016 61173 22391 299580
2011-12 91818 220671 62828 22760 306259
2012-13 94212 225390 64504 23134 313028
2013-14 96624 230191 66207 23516 319913
2014-15 99053 235080 67938 23905 326922
2015-16 101501 240060 69699 24302 334061
2016-17 103968 245137 71491 24708 341337
2017-18 106454 250316 73317 25123 348757
2018-19 108961 255603 75178 25548 356330
2019-20 111489 261004 77077 25984 364064
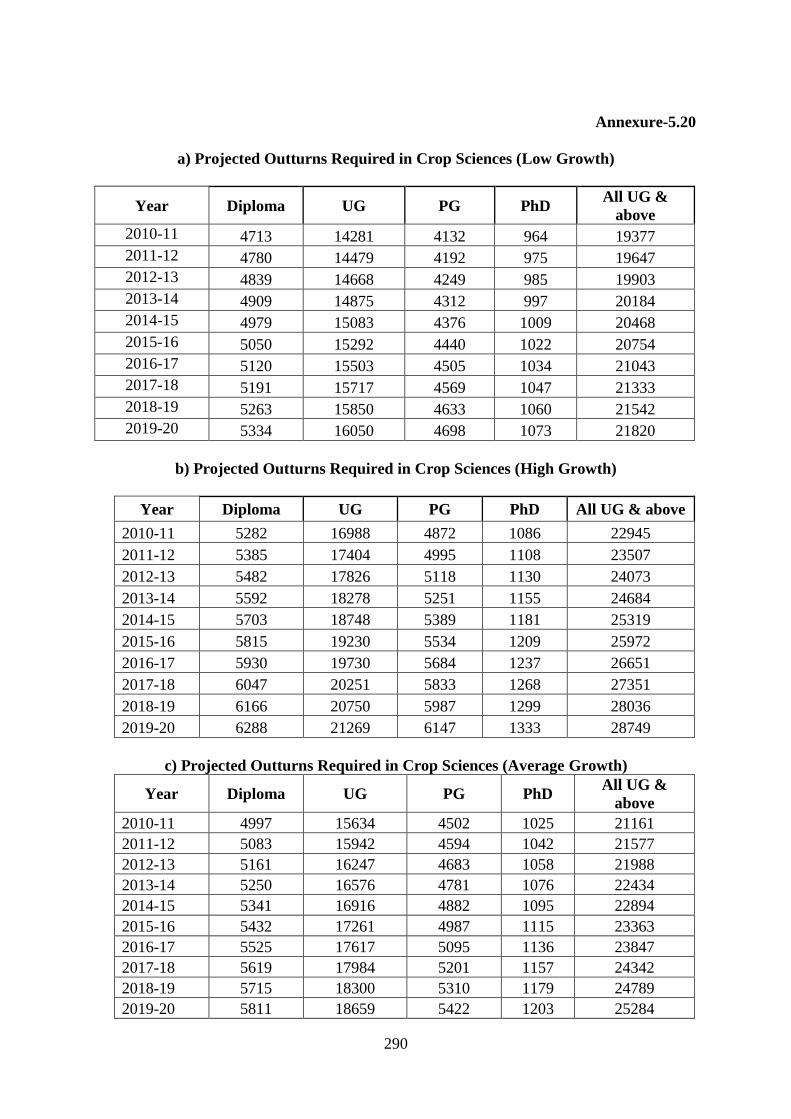
290
Annexure-5.20
a) Projected Outturns Required in Crop Sciences (Low Growth)
Year Diploma UG PG PhD All UG &
above
2010-11 4713 14281 4132 964 19377
2011-12 4780 14479 4192 975 19647
2012-13 4839 14668 4249 985 19903
2013-14 4909 14875 4312 997 20184
2014-15 4979 15083 4376 1009 20468
2015-16 5050 15292 4440 1022 20754
2016-17 5120 15503 4505 1034 21043
2017-18 5191 15717 4569 1047 21333
2018-19 5263 15850 4633 1060 21542
2019-20 5334 16050 4698 1073 21820
b) Projected Outturns Required in Crop Sciences (High Growth)
Year Diploma UG PG PhD All UG & above
2010-11 5282 16988 4872 1086 22945
2011-12 5385 17404 4995 1108 23507
2012-13 5482 17826 5118 1130 24073
2013-14 5592 18278 5251 1155 24684
2014-15 5703 18748 5389 1181 25319
2015-16 5815 19230 5534 1209 25972
2016-17 5930 19730 5684 1237 26651
2017-18 6047 20251 5833 1268 27351
2018-19 6166 20750 5987 1299 28036
2019-20 6288 21269 6147 1333 28749
c) Projected Outturns Required in Crop Sciences (Average Growth)
Year Diploma UG PG PhD All UG &
above
2010-11 4997 15634 4502 1025 21161
2011-12 5083 15942 4594 1042 21577
2012-13 5161 16247 4683 1058 21988
2013-14 5250 16576 4781 1076 22434
2014-15 5341 16916 4882 1095 22894
2015-16 5432 17261 4987 1115 23363
2016-17 5525 17617 5095 1136 23847
2017-18 5619 17984 5201 1157 24342
2018-19 5715 18300 5310 1179 24789
2019-20 5811 18659 5422 1203 25284

291
Annexures for Chapter-6
Annexure-6.1
List of Horticultural Colleges in India
Horticultural Colleges in SAUS
State University College/faculty
Andhra
Pradesh
Andhra Pradesh
Horicultural university,
(APHU)
Venkatrammanagudem,
West godavari, 534101
1. College of Horticulture, Anantharajupet, Kadapa
District
2. College of Horticulture, Mojerla, Mahaboobnagar
District
3. College of Horticulture, Rajendranagar, Hyderabad
Distrcit
4. College of Horticulture, Venkataramannagudem, West
Godavari District.
Bihar Rajendra Agricultural
University, Pusa
Samastipura,848125
5. College of Horticulture, Noorsarai, (Nalanda)
Delhi IARI, New Delhi 6. PG School
Gujarat Navasari Agricultural University (NAU), Navsari 396450
7. ASPEE College of Horticulture and Forestry , Navsari
Sardar Krushinagar Dantiwada Agricultural University (SDAU), Sardar Krushinagar,
8. Faculty of Horticulture,Dantiwada
Himachal
pradesh
Dr. Yashwant Singh Parmar University of Horticulture & Forestry (YSPUHF) Solan, Himachal Pradesh 173230
9. College of Horticulture , Via Ochighat, Nauni, Solan
Karnataka University of Horticulture Sciences, (UHS), Bagalkot
10. KRC College of Horticulture Arabhavi, Belgaum
11. College of Horticulture, Mudigere, Chikkamagalur
12. College of Horticulture, Bagalkot
13. College of Horticulture, Bidar
14. College of Horticulture, Kolar
15. College of Horticulture, Sirsi
16. College of Horticulture, Koppal
17. College of Horticulture, Hiriyur (Chitradurga)
18. College of Horticulture, Mysore
19. Centre for Post Graduate studies, Bangalore
Kashmir Sher-E-Kashmir University of Agricultural Sciences and Technology,Sri nagar,Kashmir
20. Faculty of Agriculture, Wadura Sopore
Kerala Kerala Agricultural University (KAU)
21. College of Horticulture, P. O. Vellanikkara, Thrissur

292
Madhya
pradesh
Rajmata Vijayaraje
Scindia Krishi Vishwa
Vidyalaya,Gwalior
22. College of Horticulture, Mandsaur
Maha-
rashtra
Dr. Balasaheb Sawant
Konkan Krishi
Vidyapeeth (BSKKV)
Dapoli, 415712
23. College of Horticulture (KKV), Dapoli, Dist
Rathnagiri.
Marathwada Agricultural
University, (MAU),
Parbhani 431402
24. College of Horticulture (MAU), Krishi Nagar,
Parbhani
Mahatma Phule Krishi
Vidyapeeth, (MPKV),
Rahuri 413722,
Ahmednagar
25. College of Horticulture (MPKV), Pune-, Maharashtra
Dr Punjabrao Deshmukh
Krishi Vidyapeeth
(PDKV), Akola,
Maharashtra 444104
26. College of Horticulture (PDKV), Akola –Maharashtra
Mizoram Central Agricultural
University, Imphal
27. College of Horticulture and Forestry (CAU), Pasighat ,
Orissa Orissa University of
Agriculture &
Technology,
Bhubaneswar
28. College of horticulture, Chiplima
Rajasthan Maharana Pratap
Agriculture and
Technology University,
Udaipur
29. College of Horticulture and Forestry, Udaipur
Tamil
Nadu
Tamil Nadu Agricultural University (TNAU), Coimbatore, Tamil Nadu 641003
30. Horticultural College and Research Institute, Theni
Dist, Priyakulam East.
31. Horticultural College and Research Institute,
Coimbatore.
Uttar
Pradesh
Chandra Shekhar Azad University of Agriculture & Technology (CSAUT) Kanpur, Uttar Pradesh 208002
31.Faculty of Horticulture, Kanpur, Uttar Pradesh
Narendra Deva University of Agriculture & Technology ,Faizabad,U.P
32.College of horticulture,Faizabad
Uttarakand G.B.pant University of Agriculture and technology,Pant Nagar, Uttarakand
33.V.C.S.G.College of Horticulture,Bharsar
West
Bengal
Bidhan Chandra Krishi Vishva Vidyalaya (BCKVV) Nadia,West Bengal 741246
34.Faculty of Horticulture, Mohanpur, Nadia
Uttar Banga Krishi Vishwavidyalaya (UBKVV), Cooch Bihar– 736165,west bengal
35.College of Horticulture , Pundibari, Cooch Behar

293
Horticultural Colleges Affiliated to Agricultural Universities
Maharashtra Dr. Balasaheb Sawant Konkan Krishi Vidyapeeth (BSKKV) Dapoli, 415712 Mahatma Phule
Krishi Vidyapeeth,
(MPKV), Rahuri
1. Sharadchandrajee Pawar College of
Horticulture (Private- afiliated to BSKKV),
Tal. Chiplun, District Ratnagiri
2. Shrimant Shivajiraje College of Horticulture
(Private – afiliated to MPKV), Phaltan,
Satara Dist – 415523
Dr Punjabrao
Deshmukh Krishi
Vidyapeeth
(PDKV), Akola,
Maharashtra 444104
3. Shivaji College of Horticulture (Private
college-afiliated to PDKV), Amravati.
4. Swatantrya Veer G.I. College of Horticulture,
(Private college-afiliated to PDKV) Jalgaon
Jamod, District Buldhana 443 402.
Chhattis-garh Indira Gandhi Krishi
Viswavidyalay,
Raipur
492012
5. Gayatri college of horticulture,Dhamtari
6. K.L.college of horticulture, Dhamtari.
7. Rani Durgwati college of horticulture,pendra,
Bilaspur
8. Danteshwari college of horticulture, RAIPUR
* New colleges being established during 2010-11. Source: MCAER web site on Sept 30, 2011
Horticultural Colleges in General Universities
West
Bengal
Calcutta University,
Calcutta
1. Rev. William Carey Institute of Horticulture,
Calcutta, University of Calcutta
Tamil Nadu Annamalai University 2. Faculty of Horticulture, Chidambaram,
Tamil Nadu
Uttarakhand HNB Garhwal
University, Srinagar
3. School of horticulture, Srinagar, Pauri District,
Uttarakhand

294
Annexure-6.2
Students Admitted and Passed in Horticultural Colleges during 2009-10
University
Diploma UG PG PhD
Adm Pass Adm Pass Adm Pass Adm Pass
AAU, Allahabad
0 0 60 27 2 0
AAU, Anand
0 0 15 12 0 0
APHU, Vgudem 133 0 261 100 47 20 8 NA
BCKV,Mohanpur
30 20 27 15 17 NA
BHU, Varnasi
0 0 18 12 5 1
BSKV, Dapoli
55 51 7 7 0 0
CAU, Imphal
38 0 27 0 0 0
CCSHAU, Haryana
0 0 15 10 3 2
CSKHPKV, Palampur
0 0 2 0 2 2
CSUAST, Kanpur
NA NA 19 12 2 1
GBPUAT, Panthnagar
32 12 16 12 10 4
IARI, New Delhi
0 0 8 6 11 6
IGKV, Raipur
103 43 13 5 2 4
JAU, Junagadh 25 0 0 0 20 16 4 0
JNKV, Jabalpur
0 0 74 71 0 0
KAU, Trissur
NA NA 21 8 2 5
MAU, Parabhani
33 31 0 0 0 0
MPKV, Rahuri
328 257 0 0 0 0
MPUAT, Udaipur 0 0 37 24 4 4 8 8
NAU, Navsari
32 29 20 24 12 2
OUAT, Bhubaneswar
24 NA 0 0 0 0
PDKV, Akola
108 73 0 0 0 0
RAU, Pusa
25 20 33 7 0 0
RSKVV, Gwalior
50 54 23 20 4 NA
SKDAU, Dantiwada 7 4 36 NA 0 0 0 0
SKRAU, Bikanir
0 0 13 11 3 1
SKUAST, Jammu
0 0 18 10 1 1
SKUAST, Kashmir
28 NA 0 0 0 0
TNAU, Coimbatore
79 79 36 24 10 7
UAS, Dharwad
0 45 0 2 4 1
UAS, Bengaluru 7 6 0 44 30 24 0 0
UBKVV, Coochbihar
15 0 15 NA 0 0
UHS, Bagalkot
220 63 36 18 0 0
YSPUHF, Solan
68 56 36 32 18 10
NDUAT, faizabad
NA NA 0 0 0 0
Others
Calcutta University, Calcutta NA NA 0 NA 10 0 0 0

295
Annamalai University,
Annamalainagar
NA NA
6 NA 0 0 0 0
HNB Garhwal University,
Srinagar
NA NA
25 NA 10 NA 8 NA
Grand Total 172 10 1602 1001 653 409 128 55

296
Annexure-6.3
Rates of Productivity Change for Different Horticultural Crops
Crop group
Productivity growth rate (% per year)
During 2000-
01 to 2008-09
During 2004-05
to 2008-09
Assumed growth
rate for 2009-10 to
2019-20
Fruits 0.0 2.9 2.5*
Vegetables 1.5 2.1 2.5
Flowers (-)1.6 1.5 2.0
Nuts 3.4 3.8 4.0
Aromatic and
medicinal crops
NA (-)1.3 1.0
Plantations 1.0 2.8 3.0
Spices 5.5 5.1 6.0
All horticultural
crops
2.1 3.5 4.0
* considering that the rise in productivity has been steep in recent years
Annexure-6.4
Year-wise Projected Employment in Nurseries
Year
Total
Emp.(in
Lakhs)
All Agri.
Trained
Personnel
Certificate
/training Diploma UG PG PhD
2009-10 1.35 13312 1809 1688 7560 1580 675
2010-11 1.38 13607 1849 1725 7728 1615 690
2011-12 1.41 13903 1889 1763 7896 1650 705
2012-13 1.44 14199 1930 1800 8064 1685 720
2013-14 1.47 14495 1970 1838 8232 1720 735
2014-15 1.50 14790 2010 1875 8400 1755 750
2015-16 1.53 15086 2050 1913 8568 1790 765
2016-17 1.56 15381 2090 1950 8736 1825 780
2017-18 1.59 15678 2131 1988 8904 1860 795
2018-19 1.62 15973 2171 2025 9072 1895 810
2019-20 1.65 16270 2211 2063 9240 1931 825

297
Annexure-6.5
Projected Area under Fruits and Vegetables and
Skilled Human Resources Requirements
Year
Projected Area
(million hectares)
under crop group
Employment of skilled human resources
Fruits Vegetables
Fruits
(25,000 per
million
hectares)
Vegetables
(1,00,000
per million
hectares)
Total of
fruits and
vegetables
Total for
horticulture
@
2009-10 6.13 8.14 153250 814000 967250 1381786
2010-11 6.16 8.30 154000 830000 984000 1405714
2011-12 6.19 8.46 154750 846000 1000750 1429643
2012-13 6.22 8.62 155500 862000 1017500 1453571
2013-14 6.25 8.79 156250 879000 1035250 1478929
2014-15 6.28 8.96 157000 896000 1053000 1504286
2015-16 6.31 9.14 157750 914000 1071750 1531071
2016-17 6.34 9.32 158500 932000 1090500 1557857
2017-18 6.38 9.50 159500 950000 1109500 1585000
2018-19 6.41 9.68 160250 968000 1128250 1611786
2019-20 6.44 9.87 161000 987000 1148000 1640000 @Fruits and vegetables crops accounted for 65% of all area under horticulture in 2000-01 and 68% in 2008-09.
Accordingly, overall skilled human resources requirement for horticulture as a whole has been estimated pro
rata.
Annexure-6.6
Projected Skilled Human Resources Requirements for Horticultural Production
Year All skilled
personnel
Certificate/i
nformal
trg.
Diploma UG PG PhD
2009-10 1381786 1243607 124373 12437 1244 124
2010-11 1405715 1265144 126527 12653 1265 127
2011-12 1429643 1286679 128681 12868 1287 129
2012-13 1453571 1308214 130834 13083 1308 131
2013-14 1478930 1331037 133117 13312 1331 133
2014-15 1504287 1353858 135399 13540 1354 135
2015-16 1531071 1377964 137810 13781 1378 138
2016-17 1557856 1402070 140221 14022 1402 140
2017-18 1585000 1426500 142664 14266 1427 143
2018-19 1611786 1450607 145075 14508 1451 145
2019-20 1640001 1476001 147615 14761 1476 148

298
Annexure-6.7
a. Projected Skilled Human Resources Requirements for
Horticultural Cold Stores by Level of Education (Low growth scenario)
Year
No.
of
cold
stores
Total
employment
Employment
of persons
with agri.
skills
Cert./
Trg
Dipl
oma UG
PG/
PhD
2009-10 5480 71234 10464 4986 0 5478 0
2010-11 6241 81129 11918 5679 0 6239 0
2011-12 7058 91757 13479 6423 0 7056 0
2012-13 7936 103163 15155 7221 0 7933 0
2013-14 8877 115396 16952 8078 0 8874 0
2014-15 9885 128504 18877 8995 0 9882 0
2015-16 10965 142544 20940 9978 0 10962 0
2016-17 12121 157569 23147 11030 0 12117 0
2017-18 13357 173641 25508 12155 0 13353 0
2018-19 14679 190823 28032 13358 0 14674 0
2019-20 16091 209180 30729 14643 0 16086 0
b. Projected Skilled Human Resources Requirements for
Horticultural Cold Stores by Level of Education (High growth scenario)
Year
No. of
cold
stores
Total
employm
ent
Employment
of persons
with agri.
skills
Cert./trg Diplo
ma UG
PG/
PhD
2009-10 5480 71240 10465 4987 0 5478 0
2010-11 6385 83005 12193 5810 0 6383 0
2011-12 7304 94958 13949 6647 0 7302 0
2012-13 8307 107989 15864 7559 0 8304 0
2013-14 9399 122182 17948 8553 0 9396 0
2014-15 10587 137625 20217 9634 0 10583 0
2015-16 11878 154416 22684 10809 0 11875 0
2016-17 13281 172655 25363 12086 0 13277 0
2017-18 14804 192453 28271 13472 0 14800 0
2018-19 16456 213926 31426 14975 0 16451 0
2019-20 18246 237202 34845 16604 0 18241 0

299
Annexure-6.8
Projections of Volumes of Fruits and Vegetables to be Processed
Year
Per cent to
be
processed
Volume to be processed
High Growth scenario
Volume to be processed
Low Growth scenario
Production To be
Processed Production
To be
Processed
2009-10 10 224164 22416 226740 22674
2010-11 11 234027 25743 239438 26338
2011-12 12 244324 29319 252846 30342
2012-13 13 255074 33160 267005 34711
2013-14 14 266297 37282 281958 39474
2014-15 15 278014 41702 297747 44662
2015-16 16 290247 46440 314421 50307
2016-17 17 303018 51513 332029 56445
2017-18 18 316351 56943 350622 63112
2018-19 19 330270 62751 370257 70349
2019-20 20 344802 68960 390992 78198
CAGR 4.4 11.8 5.6 13.1
Annexure-6.9
Fruit and Vegetable Processing Units in India
Approved Under Fruit Product Order 1955
Year No. of Units Installed capacity
(lakh tonnes/year)
Production
(lakh tonnes/year)
1990 3,629 7.08 2.60
1995 4,270 14.02 6.76
1996 4,400 17.60 8.50
1997 4,700 19.10 9.10
1998 5,112 20.80 9.40
1999 5,198 21.00 9.80
2000 5,293 21.10 9.90
2007 6,736 NA NA Source: Ministry of Food Processing Industries, cited in Agricultural Research Data Book, 2009, IASRI

300
Annexure-6.10
Number of Factories in Operation Engaged in Processing and Preserving of a) Fruits
and Vegetables and b) Alcoholic Beverages and the Number of Persons Engaged in
them
Year
No. of Factories in
Operation Total No. of Persons Engaged
Vegetables
and fruit
Alcoholic
beverages
Vegetables and
fruit
Alcoholic
beverages
1998-99 307 381 21,039 45,128
1999-2000 395 382 26,725 47,540
2000-01 499 408 27,030 55,332
2001-02 449 401 24,514 54,561
2002-03 440 387 29,714 53,933
2003-04 473 398 29,323 56,587
2004-05 565 433 40,506 58,349
2005-06 576 439 42,743 62,773
CAGR (%) 7.4 1.8 9.3 4.1
Projections
High Low
2006-07 619 447 48011 46,718 65,347
2007-08 664 455 54013 51,063 68,026
2008-09 714 463 60764 55,812 70,815
2009-10 766 471 68360 61,002 73,718
2010-11 823 480 76905 66,675 76,741
2011-12 884 489 86518 72,876 79,887
2012-13 949 497 97333 79,654 83,163
2013-14 1020 506 109499 87,062 86,572
2014-15 1095 515 123187 95,158 90,122
2015-16 1176 525 138585 104,008 93,817
2016-17 1263 534 155908 113,681 97,663
2017-18 1357 544 175396 124,253 101,667
2018-19 1457 554 197321 135,809 105,836
2019-20 1565 564 221986 148,439 110,175
CAGR(%) 12.5 9.3 4.1 Source: Estimates from Annual Survey of Industries Reports for the respective years up to 2005-06, and
projections based on the annual growth rates (CAGRs) for the period 1998-99 to 2005-06 for
subsequent years

301
Annexure-6.11
Projected Skilled Human Resources Requirements
for Horticultural Processing by Level of Education (Low Growth)
Year
Total
employ-
ment
All Agri-
skilled
personnel
Cert./
training Diploma UG PG PhD
2009-10 134721 36557 26120 2064 7671 476 226
2010-11 143416 38434 27262 2235 8170 520 247
2011-12 152763 40389 28458 2386 8707 568 270
2012-13 162816 42461 29710 2550 9285 621 295
2013-14 173634 44656 31021 2727 9906 679 322
2014-15 185280 46983 32395 2917 10576 742 352
2015-16 197825 49451 33834 3123 11298 811 385
2016-17 211344 52072 35343 3345 12076 887 421
2017-18 225920 54854 36925 3585 12915 969 460
2018-19 241644 57812 38585 3845 13820 1059 502
2019-20 258614 60956 40326 4125 14798 1158 549
Projected Skilled Human Resources Requirements
for Horticultural Processing by Level of Education (High Growth)
Year
Total
employ-
ment
All Agri-
skilled
personnel
Cert./
training Diploma UG PG PhD
2009-10 142078 37392 26285 2222 8099 533 253
2010-11 153646 39555 27492 2413 8766 600 285
2011-12 166405 41885 28765 2624 9501 675 320
2012-13 180495 44398 30108 2858 10314 759 360
2013-14 196071 47115 31526 3117 11212 854 405
2014-15 213308 50055 33026 3405 12207 961 456
2015-16 232402 53241 34612 3725 13310 1081 513
2016-17 253571 56700 36293 4080 14533 1216 577
2017-18 277064 60460 38076 4475 15891 1368 649
2018-19 303157 64553 39969 4915 17400 1539 730
2019-20 332161 69017 41980 5405 19078 1731 821

302
Annexure-6.12
Posts of Horticultural Officers and Staff in Some States
State No. of
districts
Horticultural human resources
Officers Staff Grade IV
(Malis, etc)
1. Andhra Pradesh 23 390 400 NA
2. Karnataka 30 1664 856 1953
3. Madhya Pradesh 50 475 1112 54
4. Punjab 20 202 49 553
5. Gujarat 26 196 78 NA
6. Himachal Pradesh 12 408 329 887
7. Orissa 30 106 NA NA
8. Chhattisgarh 18 197 NA NA
Total 209 3638 2824 3447 Source: Official web-sites of the respective State governments and data collected directly from the States.
Numbers are approximate and estimated in some cases on the basis of available data from the websites and also
the data collected through the establishment Survey

303
Annexure-6.13
ICAR’s Scientists in Horticulture Division as on March 2010
Sl.
No
University Sanctioned In
position
Vacant
(%)
1. CPRI, Shimla 109 77 70.64
2. IISR, Calicut 42 36 85.71
3. CARI, Port Blair 55 33 60.00
4. CPCRI, Kasargod 84 60 71.42
5. CISH, Lucknow 46 40 86.95
6. IIVR, Varanasi 63 40 63.49
7. CITH, Srinagar 21 16 76.19
8. CTCRI, Thiruvananthapuram 50 43 86.00
9. IIHR, Bangalore 149 135 90.60
10. CIAH, Bikaner 31 23 74.19
11. DMAP, Anand 25 15 60.00
12. NRC Cashew, Puttur 18 12 66.66
13. NRC Citrus, Nagpur 20 17 85.00
14. NRC Mushroom, Solan 16 08 50.00
15. NRC Grapes, Pune 17 14 82.35
16. NRC Oilpalm, Pedavegi 22 16 72.72
17. NRC Banana, Trichy 15 15 100
18. NRC Pomegranate 09 08 88.88
19. NRC Orchid 15 09 60.00
20. NRC Seed Spices, Ajmer 20 11 55.00
21. Directorate on Onion and
Garlic Research, Pune
15 10 66.66
22. NRC on Litchi 15 06 40.00
23. Directorate of Floriculture
Research, New Delhi
14 3 21.42
TOTAL 871 647 74.2
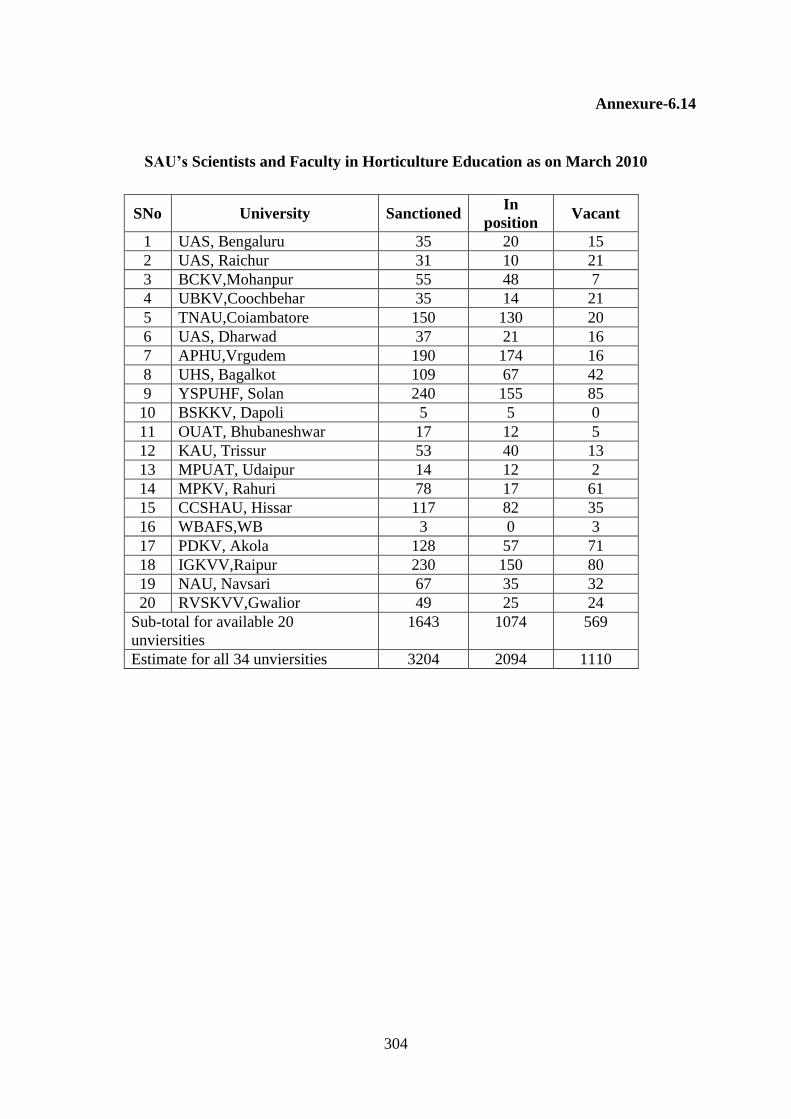
304
Annexure-6.14
SAU’s Scientists and Faculty in Horticulture Education as on March 2010
SNo University Sanctioned In
position Vacant
1 UAS, Bengaluru 35 20 15
2 UAS, Raichur 31 10 21
3 BCKV,Mohanpur 55 48 7
4 UBKV,Coochbehar 35 14 21
5 TNAU,Coiambatore 150 130 20
6 UAS, Dharwad 37 21 16
7 APHU,Vrgudem 190 174 16
8 UHS, Bagalkot 109 67 42
9 YSPUHF, Solan 240 155 85
10 BSKKV, Dapoli 5 5 0
11 OUAT, Bhubaneshwar 17 12 5
12 KAU, Trissur 53 40 13
13 MPUAT, Udaipur 14 12 2
14 MPKV, Rahuri 78 17 61
15 CCSHAU, Hissar 117 82 35
16 WBAFS,WB 3 0 3
17 PDKV, Akola 128 57 71
18 IGKVV,Raipur 230 150 80
19 NAU, Navsari 67 35 32
20 RVSKVV,Gwalior 49 25 24
Sub-total for available 20
unviersities
1643 1074 569
Estimate for all 34 unviersities 3204 2094 1110

305
Annexure-6.15
Overall Projections of Requirements Stocks of Horticultural Personnel
a. High growth
Year Diploma UG PG PhD UG & above
2009-10 146320 50005 9325 3254 62583
2010-11 148977 52345 9489 3360 65193
2011-12 151625 54780 9663 3471 67914
2012-13 154294 57394 9849 3587 70829
2013-14 157133 60219 10045 3708 73972
2014-15 159998 63258 10269 3876 77403
2015-16 163040 66544 10508 4053 81104
2016-17 166117 70084 10762 4235 85081
2017-18 169271 73907 11035 4426 89368
2018-19 172434 78032 11328 4627 93987
2019-20 175790 82506 11645 4840 98990
b) Low growth
Year Diploma UG PG PhD UG & above
2009-10 146320 50004 9325 3254 62583
2010-11 148940 52061 9472 3352 64885
2011-12 151541 54232 9626 3454 67311
2012-13 154156 56525 9786 3558 69869
2013-14 156929 58963 9953 3665 72581
2014-15 159715 61541 10142 3816 75499
2015-16 162664 64281 10339 3973 78593
2016-17 165630 67179 10544 4132 81855
2017-18 168653 70250 10758 4295 85304
2018-19 171664 73499 10982 4463 88944
2019-20 174840 76957 11219 4637 92813
c) Average growth
Year Diploma UG PG PhD UG & above
2009-10 146320 50005 9325 3254 62583
2010-11 148959 52203 9481 3356 65039
2011-12 151583 54506 9645 3462 67613
2012-13 154225 56960 9817 3572 70349
2013-14 157031 59591 9999 3686 73276
2014-15 159857 62399 10205 3846 76451
2015-16 162852 65412 10423 4013 79848
2016-17 165873 68632 10653 4183 83468
2017-18 168962 72079 10897 4361 87336
2018-19 172049 75765 11155 4545 91465
2019-20 175315 79731 11432 4738 95902

306
Annexure-6.16
a) Projected Outturns Required in Horticulture (High Growth)
Year Diploma UG PG PhD UG & above
2010-11 7015 4607 673 204 5484
2011-12 7117 4801 739 212 5752
2012-13 7218 5102 767 220 6089
2013-14 7468 5428 795 229 6452
2014-15 7580 5766 844 280 6890
2015-16 7842 6151 881 292 7324
2016-17 7968 6550 921 304 7774
2017-18 8138 6988 967 319 8274
2018-19 8241 7436 1013 334 8782
2019-20 8529 7950 1063 351 9365
b) Projected Outturns Required in Horticulture (Low Growth)
Year Diploma UG PG PhD UG & above
2010-11 7010 4277 641 196 5113
2011-12 7069 4471 699 202 5373
2012-13 7160 4695 720 208 5623
2013-14 7398 4931 739 214 5883
2014-15 7494 5170 775 262 6207
2015-16 7740 5445 798 271 6513
2016-17 7846 5715 824 278 6817
2017-18 7993 6008 858 288 7154
2018-19 8070 6304 888 296 7489
2019-20 8326 6641 922 308 7871
c) Projected Outturns Required in Horticulture (Average Growth)
Year Diploma UG PG PhD UG & above
2010-11 7012 4442 657 200 5299
2011-12 7093 4636 719 207 5562
2012-13 7189 4899 744 214 5856
2013-14 7433 5179 767 221 6168
2014-15 7537 5468 810 271 6548
2015-16 7791 5798 839 282 6919
2016-17 7907 6132 872 291 7296
2017-18 8065 6498 913 303 7714
2018-19 8155 6870 951 315 8136
2019-20 8428 7295 993 330 8618

307
Annexures for Chapter-7
Annexure-7.1
List of Institutions Offering Forestry Courses in India
State University College/faculty
Assam Assam Agricultural
University,Jorhat
1. College of agriculture(Dept. of forestry),Jorhat
Arunachal
Pradesh
CentralAgricultural
University
2. College of Horticulture and Forestry (CAU),
Pasighat , Arunachal Pradesh
Delhi IARI, New Delhi 3. PG School
Gujarat Navsari Agricultural
University, Navsari.
4. ASPEE College of Horticulture and Forestry,
Navsari.
Haryana CCS HAU, Hisar 5. Dept of Forestry
Himachal
Pradesh
Dr. Yashwant Singh
Parmar University of
Horticulture & Forestry
(YSPUHF) Solan,
Himachal Pradesh, 173230
6. College of Forestry (YSPUHF), Via Ochighat,
Nauni, Solan
CSHPKV, Palampur 7. Department
Jammu &
Kashmir
Sher-e- Kashmir
University of Agricultural
Science & Technology
University, Srinagar
8. College of forestry, Srinagar
SKUAST, Jammu 9. Department
Jharkhand Birsa Agricultural
University, Ranchi
10. Ranchi Forestry College (BAU), Kanke, Ranchi
834006
Karnataka University of Agricultural
Sciences, (UAS-B),
Bangalore
11. College of Forestry, Ponnampet, kodagu dist
University of Agricultural
Sciences, (UAS-D),
Dharwad
12. College of Forestry, Sirsi
Kerala Kerala Agricultural
University, Thrissur
13. College of Forestry (KAU), P.O. Vellanikkara,
Thrissur,
Madhya
Pradesh
Jawaharlal Nehru Krisghi
Viswavidyalay, Jabalpur
14. College of Agriculture, Jabalpur(for Agro-forestry)
IGKVV, Raipur 15. Department
Maha-
rashtra
Dr. Balasaheb Sawant
Konkan Krishi Vidyapeeth
(BSKKV) Dapoli, 415712
16. College of Forestry, Ratnagiri
Dr Punjabrao Deshmukh
Krishi Vidyapeeth
(PDKV), Akola,
Maharashtra 444104.
17. College of Forestry (PDKV), Akola - 444104,
Maharashtra
Orissa Orissa University of
Agriculture & Technology,
Bhubaneswar
18. College of agriculture (Dept. of forestry)

308
Punjab PAU, Ludhiana 19. Forestry Department
Rajasthan Maharana Pratap
University of Agriculture
and Technology, Udaipur
20. Department College of Horticulture and
Forestry,Udaipur
Tamil
Nadu
Tamil Nadu Veterinary
and Animal Sciences
University, Chennai
21. Foresty College and Research Institute (TNAU),
Mettupalayam, Coimbatore - 641301
Uttar
Pradesh
Chandra Shekhar Azad
University of Agriculture
& Technology (CSAUT)
Kanpur, Uttar Pradesh
208002
22. Faculty of Agriculture( Dept. of forestry),Kanpur
Uttara-
khand
Govind Ballbh Pant
University of Agriculture
& Technology, Pantnagar
23. College of Forestry & Hill Agriculture (GBPUAT),
Ranichauri (Uttarakhand)
Uttar
Pradesh
Allahabad Agricultural
University,
24. College of Silviculture & Agro Forestry (AAI),
Naini, Allahabad
West
Bengal
UBKVV, Coochbehar 25. Forestry Department
Forestry Colleges in General Universities & Others
1. Forestry Research Institute, Dehra Dun
2. Osmania University, Hyderabad
3. HN Bahuguna Garhwal University, Srinagar, Uttar Pradesh.
4. Indian Institute of Forest Management, Nehru Nagar, Bhopal
5. Karnatak University, Dharwar
6. Kumaun University, Nainital.
7. Manipur University, Canchipur, Imphal
8. North - Eastern Hill University, Shillong
9. Indian Institute of Remote Sensing, Dehradun
10. Wildlife Institute of India, Dehra Dun (affiliated to Saurashtra Univ, Rajkot)
11. Guru Ghasidas University, Bilaspur
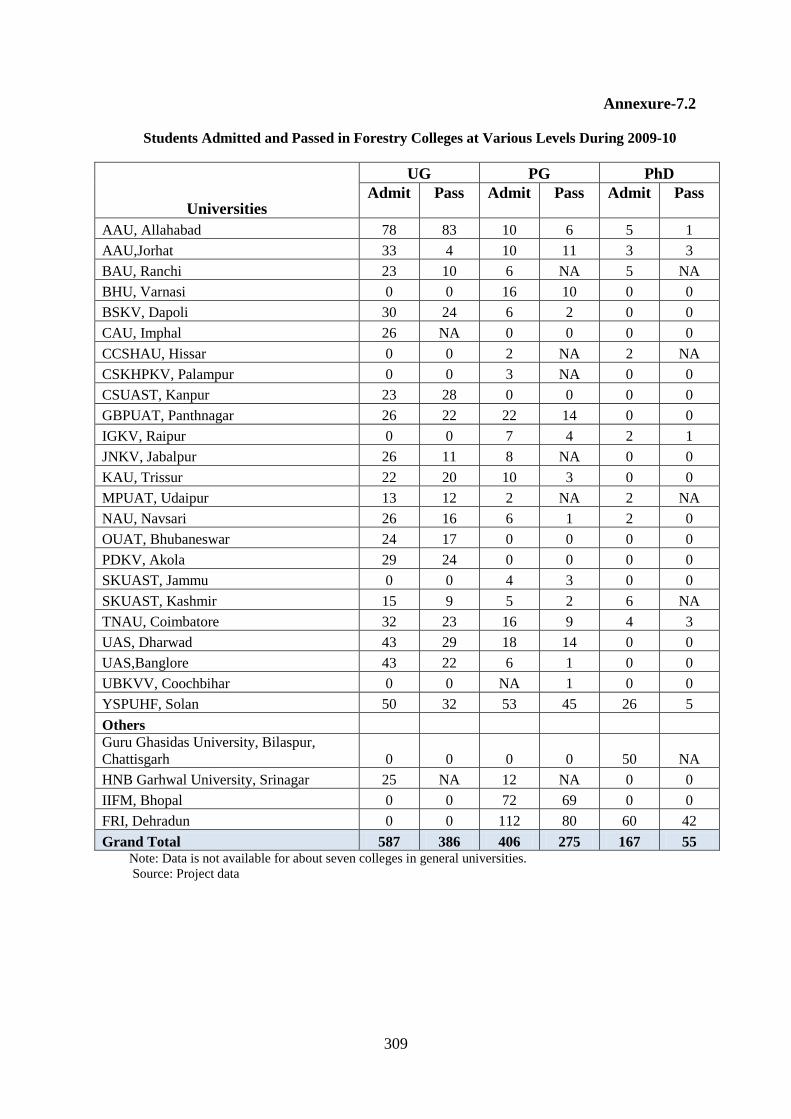
309
Annexure-7.2
Students Admitted and Passed in Forestry Colleges at Various Levels During 2009-10
Universities
UG PG PhD
Admit Pass Admit Pass Admit Pass
AAU, Allahabad 78 83 10 6 5 1
AAU,Jorhat 33 4 10 11 3 3
BAU, Ranchi 23 10 6 NA 5 NA
BHU, Varnasi 0 0 16 10 0 0
BSKV, Dapoli 30 24 6 2 0 0
CAU, Imphal 26 NA 0 0 0 0
CCSHAU, Hissar 0 0 2 NA 2 NA
CSKHPKV, Palampur 0 0 3 NA 0 0
CSUAST, Kanpur 23 28 0 0 0 0
GBPUAT, Panthnagar 26 22 22 14 0 0
IGKV, Raipur 0 0 7 4 2 1
JNKV, Jabalpur 26 11 8 NA 0 0
KAU, Trissur 22 20 10 3 0 0
MPUAT, Udaipur 13 12 2 NA 2 NA
NAU, Navsari 26 16 6 1 2 0
OUAT, Bhubaneswar 24 17 0 0 0 0
PDKV, Akola 29 24 0 0 0 0
SKUAST, Jammu 0 0 4 3 0 0
SKUAST, Kashmir 15 9 5 2 6 NA
TNAU, Coimbatore 32 23 16 9 4 3
UAS, Dharwad 43 29 18 14 0 0
UAS,Banglore 43 22 6 1 0 0
UBKVV, Coochbihar 0 0 NA 1 0 0
YSPUHF, Solan 50 32 53 45 26 5
Others
Guru Ghasidas University, Bilaspur,
Chattisgarh 0 0 0 0 50 NA
HNB Garhwal University, Srinagar 25 NA 12 NA 0 0
IIFM, Bhopal 0 0 72 69 0 0
FRI, Dehradun 0 0 112 80 60 42
Grand Total 587 386 406 275 167 55 Note: Data is not available for about seven colleges in general universities.
Source: Project data

310
Annexure-7.3

311
Annexure-7.4
Posts in Forest Departments of States
State IFS/
SFS
RangeOfficers
/ Rangers
Dy.Rangers/
Range Assts Others
Total
Andhra Pradesh 336 426 391 2880 4033
Assam 106 378 228 5969 6681
Tamilnadu 147 562 0 6104 6813
Karnataka 332 630 0 6199 7161
Kerala 175 204 138 3264 3781
Goa 19 31 6 328 384
Madhya Pradesh 588 473 0 9640 10701
Uttar Pradesh 359 710 0 0 1069
Uttarakhand 233 753 0 2056 3042
Bihar 82 116 340 967 1505
Chhattisgarh 250 293 545 3810 4898
Jharkhand 275 383 4145 4803 Meghalaya 54 80 0 691 839
Nagaland 42 52 41 611 746
Manipur 37 0 0 37
Tripura 84 133 0 1497 1714
Sikkim 108 0 0 0 108
Rajasthan 258 342 159 5421 6180
Punjab 81 51 212 0 344
Himachal Pradesh 219 212 792 2586 3809
Jammu & Kashmir 238 212 45 5134 5629
Gujarat 180 0 0 0 180
Haryana 0 0 0 0 0
Maharashtra 371 789 11424 12584
Delhi 8 0 9 0 17
West Bengal 241 580 1277 2898 4996
Chandigarh 6 2 1 27 36
Dadra,Daman & Diu 6 8 3 113 130
Andaman 30 0 0 0 30
Lakshadweep 6 0 0 0 6
Arunachal Pradesh 60 0 0 0 60
Pondicherry 5 0 0 0 5
Total 4936 7420 4201 75764 92321
Source: Calculated from the currently available data from the websites of State Forest Departments.

312
Annexure-7.5
a) Projected Forestry Human Resources Requirements for
Government Forestry Departments (High Growth)
Year Diploma UG PG PhD UG & above
2009-10 12508 5964 2262 688 8914
2010-11 12675 6245 2369 720 9334
2011-12 12842 6531 2477 753 9761
2012-13 13008 6822 2588 787 10197
2013-14 13175 7119 2700 821 10640
2014-15 13342 7422 2815 856 11093
2015-16 13509 7729 2932 891 11552
2016-17 13675 8042 3050 927 12019
2017-18 13842 8360 3171 964 12495
2018-19 14009 8683 3294 1001 12978
2019-20 14176 9012 3418 1039 13469
b) Projected Forestry Human Resources Requirements for
Government Forestry Departments (Low Growth)
Year Diploma UG PG PhD UG & above
2009-10 12508 5964 2262 688 8914
2010-11 12508 6063 2299 698 9060
2011-12 12508 6162 2337 710 9209
2012-13 12508 6262 2374 721 9357
2013-14 12508 6361 2412 733 9506
2014-15 12508 6461 2450 744 9655
2015-16 12508 6560 2488 755 9803
2016-17 12508 6659 2525 767 9951
2017-18 12508 6759 2563 778 10100
2018-19 12508 6858 2601 790 10249
2019-20 12508 6958 2638 801 10397

313
Annexure-7.6
a) Projected Forestry Human Resources Requirements for
Forest Development Corporations (High Growth)
Year Diploma UG PG PhD UG & above
2009-10 910 434 165 50 649
2010-11 922 454 172 52 678
2011-12 934 475 180 55 710
2012-13 946 496 188 57 741
2013-14 959 518 196 60 774
2014-15 971 540 205 62 807
2015-16 983 562 213 65 840
2016-17 995 585 222 67 874
2017-18 1007 608 231 70 909
2018-19 1019 632 240 73 945
2019-20 1031 656 249 76 981
b) Projected Forestry Human Resources Requirements for
Forest Development Corporations (Low Growth)
Year Diploma UG PG PhD UG & above
2009-10 910 434 165 50 649
2010-11 910 441 167 51 659
2011-12 910 448 170 52 670
2012-13 910 456 173 52 681
2013-14 910 463 175 53 691
2014-15 910 470 178 54 702
2015-16 910 477 181 55 713
2016-17 910 485 184 56 725
2017-18 910 492 186 57 735
2018-19 910 499 189 57 745
2019-20 910 506 192 58 756
Annexure-7.7
Projected Forestry Human Resources Requirements for Forestry Research
Year PG PhD PG & above
2009-10 75 200 275
2010-11 76 202 278
2011-12 77 204 281
2012-13 77 206 283
2013-14 78 208 286
2014-15 79 210 289
2015-16 80 212 292
2016-17 80 214 294
2017-18 81 217 298
2018-19 82 219 301
2019-20 83 221 304

314
Annexure-7.8
Position of Forestry Faculty in State Agricultural Universities (2009-10)
SNo University Sanctioned In position Vacant
1 UAS,Banglore 30 18 12
2 UAS,Raichur 7 2 5
3 TNAU,Coiambatore 27 21 6
4 UAS, Dharwad 28 8 20
5 UHS, Bagalkot 2 1 1
6 YSPUHF,Solan 77 50 27
7 BSKKV,Dapoli 11 9 2
8 OUAT,Bhubaneshwar 17 5 12
9 JNKVV,Jabalpur 10 5 5
10 MPUAT,Udaipur 6 5 1
11 CCSHAU,Haryana 15 12 3
12 IGKVV,Raipur 63 22 41
13 GBPUAT,pantnagar 22 16 6
14 PAU,Ludiana 17 11 6
15 AAU, Allahabad 8 8 0
Sub-total for available universities 340 193 147
No of universities data available 15
No of total universities 19
Estimate for all universities 431 244 186
Source: Project data
Annexure-7.9
Projected Forestry Human Resources Requirements for Forestry Education
Year PG PhD UG & above
2009-10 49 195 244
2010-11 52 206 258
2011-12 54 218 272
2012-13 57 230 287
2013-14 60 242 302
2014-15 63 253 316
2015-16 66 264 330
2016-17 69 276 345
2017-18 72 288 360
2018-19 75 300 375
2019-20 78 312 390

315
Annexure 7.10
Projected Forestry Human Resources Requirements for
Forest Based industries (Paper, wood)
Year Diploma UG PG PhD UG & above
2009-10 2752 10280 1781 2105 14165
2010-11 2752 10280 1781 2105 14165
2011-12 2752 10280 1781 2105 14165
2012-13 2752 10280 1781 2105 14165
2013-14 2752 10280 1781 2105 14165
2014-15 2752 10280 1781 2105 14165
2015-16 2752 10280 1781 2105 14165
2016-17 2752 10280 1781 2105 14165
2017-18 2752 10280 1781 2105 14165
2018-19 2752 10280 1781 2105 14165
2019-20 2752 10280 1781 2105 14165

316
Annexure-7.11
Stock Projections
a): Projected Stock Requirement (High Growth) of Forestry-educated Persons
Year Diploma UG PG PhD UG & above
2009-10 16979 17512 4548 3400 25459
2010-11 17166 17828 4672 3450 25949
2011-12 17354 18150 4798 3501 26449
2012-13 17542 18479 4926 3554 26958
2013-14 17730 18813 5057 3607 27477
2014-15 17918 19154 5190 3660 28003
2015-16 18106 19500 5325 3714 28538
2016-17 18293 19852 5463 3770 29084
2017-18 18481 20210 5603 3826 29638
2018-19 18669 20575 5745 3883 30201
2019-20 18857 20945 5889 3940 30774
b): Projected Stock Requirement (Low Growth) of Forestry-educated Persons
Year Diploma UG PG PhD UG & above
2009-10 16978 17512 4548 3399 25458
2010-11 16978 17623 4593 3425 25641
2011-12 16978 17735 4639 3452 25826
2012-13 16978 17847 4686 3479 26012
2013-14 16978 17959 4732 3507 26198
2014-15 16978 18071 4778 3534 26383
2015-16 16978 18183 4825 3561 26569
2016-17 16978 18295 4871 3589 26755
2017-18 16978 18407 4917 3616 26941
2018-19 16978 18519 4964 3644 27127
2019-20 16978 18631 5010 3672 27313
c): Projected Stock Requirement (Average Growth) of Forestry-educated Persons
Year Diploma UG PG PhD UG & above
2009-10 16979 17512 4548 3399 25458
2010-11 17072 17726 4632 3437 25795
2011-12 17166 17943 4718 3476 26138
2012-13 17260 18163 4806 3516 26485
2013-14 17354 18386 4895 3557 26838
2014-15 17448 18612 4984 3597 27193
2015-16 17542 18842 5075 3637 27553
2016-17 17636 19074 5167 3679 27919
2017-18 17730 19309 5260 3721 28289
2018-19 17824 19547 5354 3763 28664
2019-20 17918 19788 5450 3806 29043

317
Annexure-7.12
Flow Projections
a: Projected Flow Requirement (High Growth) of Forestry-educated Persons
Year Diploma UG PG PhD UG & above
2010-11 697 1278 420 152 1850
2011-12 703 1303 428 155 1885
2012-13 708 1327 436 158 1920
2013-14 714 1351 445 160 1957
2014-15 720 1376 454 161 1991
2015-16 725 1401 462 164 2027
2016-17 731 1426 471 167 2064
2017-18 737 1451 480 169 2100
2018-19 742 1488 488 172 2147
2019-20 748 1514 497 174 2185
b: Projected Flow Requirement (Low Growth) of Forestry-educated Persons
Year Diploma UG PG PhD UG & above
2010-11 509 956 313 128 1397
2011-12 509 962 316 130 1408
2012-13 509 968 318 131 1417
2013-14 509 973 322 132 1427
2014-15 509 979 324 132 1435
2015-16 509 985 326 133 1443
2016-17 509 990 328 135 1453
2017-18 509 996 331 135 1462
2018-19 509 1001 333 136 1470
2019-20 509 1007 335 137 1479
c: Projected Flow Requirement (Average Growth) of Forestry-educated Persons
Year Diploma UG PG PhD UG & above
2010-11 603 1117 367 140 1624
2011-12 606 1133 372 142 1646
2012-13 609 1147 377 144 1669
2013-14 612 1162 383 146 1692
2014-15 615 1178 389 147 1713
2015-16 617 1193 394 148 1735
2016-17 620 1208 400 151 1759
2017-18 623 1223 405 152 1781
2018-19 626 1244 411 154 1809
2019-20 629 1260 416 156 1832
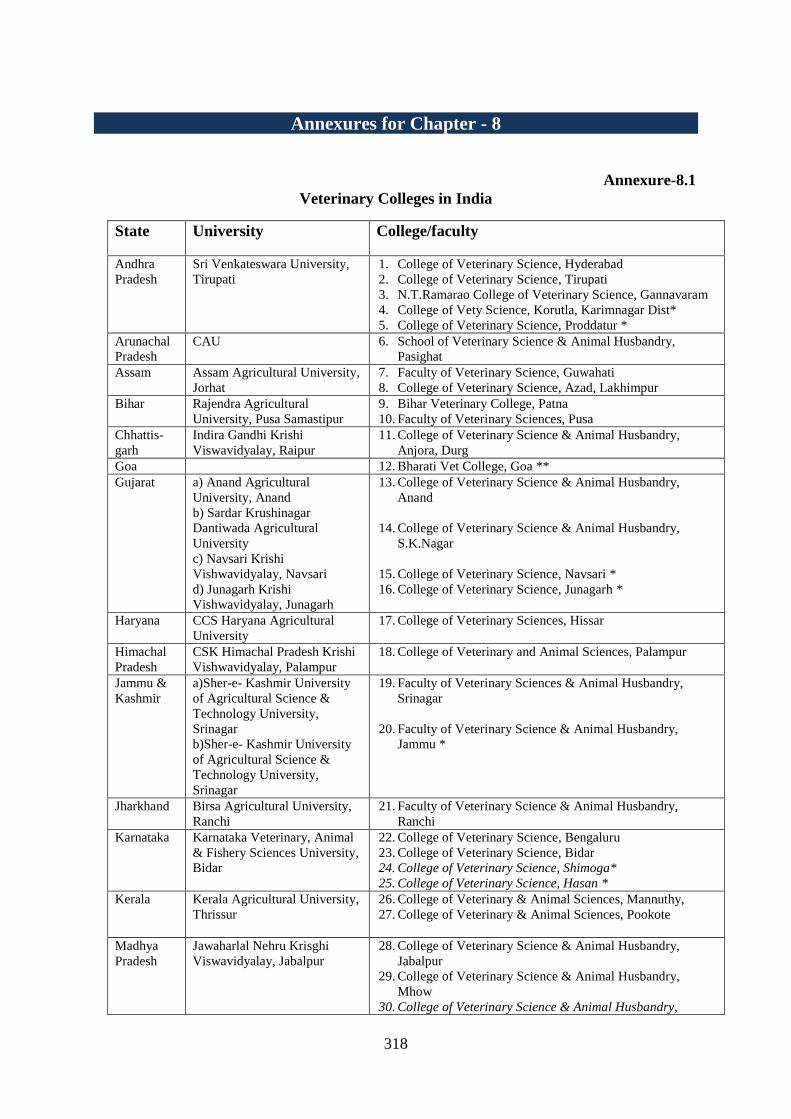
318
Annexures for Chapter - 8
Annexure-8.1
Veterinary Colleges in India
State University College/faculty
Andhra
Pradesh
Sri Venkateswara University,
Tirupati
1. College of Veterinary Science, Hyderabad
2. College of Veterinary Science, Tirupati
3. N.T.Ramarao College of Veterinary Science, Gannavaram
4. College of Vety Science, Korutla, Karimnagar Dist*
5. College of Veterinary Science, Proddatur *
Arunachal
Pradesh
CAU 6. School of Veterinary Science & Animal Husbandry,
Pasighat
Assam Assam Agricultural University,
Jorhat
7. Faculty of Veterinary Science, Guwahati
8. College of Veterinary Science, Azad, Lakhimpur
Bihar Rajendra Agricultural
University, Pusa Samastipur
9. Bihar Veterinary College, Patna
10. Faculty of Veterinary Sciences, Pusa
Chhattis-
garh
Indira Gandhi Krishi
Viswavidyalay, Raipur
11. College of Veterinary Science & Animal Husbandry,
Anjora, Durg
Goa 12. Bharati Vet College, Goa **
Gujarat a) Anand Agricultural
University, Anand
b) Sardar Krushinagar
Dantiwada Agricultural
University
c) Navsari Krishi
Vishwavidyalay, Navsari
d) Junagarh Krishi
Vishwavidyalay, Junagarh
13. College of Veterinary Science & Animal Husbandry,
Anand
14. College of Veterinary Science & Animal Husbandry,
S.K.Nagar
15. College of Veterinary Science, Navsari *
16. College of Veterinary Science, Junagarh *
Haryana CCS Haryana Agricultural
University
17. College of Veterinary Sciences, Hissar
Himachal
Pradesh
CSK Himachal Pradesh Krishi
Vishwavidyalay, Palampur
18. College of Veterinary and Animal Sciences, Palampur
Jammu &
Kashmir
a)Sher-e- Kashmir University
of Agricultural Science &
Technology University,
Srinagar
b)Sher-e- Kashmir University
of Agricultural Science &
Technology University,
Srinagar
19. Faculty of Veterinary Sciences & Animal Husbandry,
Srinagar
20. Faculty of Veterinary Science & Animal Husbandry,
Jammu *
Jharkhand Birsa Agricultural University,
Ranchi
21. Faculty of Veterinary Science & Animal Husbandry,
Ranchi
Karnataka Karnataka Veterinary, Animal
& Fishery Sciences University,
Bidar
22. College of Veterinary Science, Bengaluru
23. College of Veterinary Science, Bidar
24. College of Veterinary Science, Shimoga*
25. College of Veterinary Science, Hasan *
Kerala Kerala Agricultural University,
Thrissur
26. College of Veterinary & Animal Sciences, Mannuthy,
27. College of Veterinary & Animal Sciences, Pookote
Madhya
Pradesh
Jawaharlal Nehru Krisghi
Viswavidyalay, Jabalpur
28. College of Veterinary Science & Animal Husbandry,
Jabalpur
29. College of Veterinary Science & Animal Husbandry,
Mhow
30. College of Veterinary Science & Animal Husbandry,

319
Rewa*
Maha-
rashtra
Maharashtra Animal & Fishery
Sciences University, Nagpur
31. College of Veterinary and Animal Sciences, Udgir
32. College of Veterinary and Animal Sciences, Parbhani
33. K.N.P. College of Veterinary Sciences, Shirwal
34. Nagpur Veterinary College, Nagpur
35. Bombay Veterinary College, Parel, Mumbai
PKV, Akola 36. Veterinary College, PKV, Akola 444 104
Mizoram Central Agricultural
University, Imphal
37. College of Veterinary Science & Animal Husbandry,
Aizawl
Orissa Orissa University of
Agriculture & Technology,
Bhubaneswar
38. College of Veterinary Science & Animal Husbandry,
Bhubaneswar
Pudu-
cherry
Pondicherry University,
Pondicherry
39. Rajiv Gandhi College of Veterinary and Animal Sciences,
Puducherry
Punjab Guru Angad Dev Veterinary
and Animal Sciences
University, Ludhiana
40. College of Veterinary Science, Ludhiana
Rajasthan Rajasthan University of
Veterinary and Animal
Sciences, Bikaner***
41. College of Veterinary and Animal Science, Bikaner
42. College of Veterinary and Animal Science, Navania ,
Vallabhnagar, Udaipur
43. College of Veterinary and Animal Science, Jodhpur
44. Apollo College of Veterinary Medicine, Jaipur
45. Mahatma Gandhi Veterinary College, Bharatpur **
46. Mahata Jyotiba Fule College of Veterinary &Animal
Sciences, Chomu**.
47. Arawali Veterinary College, Sikar**
48. Sri Gganganagar Veterinary College , Sriganaganagar.**
49. B.S.College of Veterinary Medicine & Research Centre,
Jhunjhunu.**
50. M.B. Veterinary College, Dungarpur**
Tamil
Nadu
Tamil Nadu Veterinary and
Animal Sciences University,
Chennai
51. Madras Veterinary College, Chennai
52. Veterinary College and Research Institute, Namakkal
53. Veterinary College and Research Institute, Thirunalveli*
54. Veterinary College and Research Institute, Tanjavur*
Uttar
Pradesh
a) Uttar Pradesh Pandit Deen
Dayal Upadhyay Pashu
Chikitsa Vigyan Evam Go-
Anusandhan Sansthan,
Mathura
b) Narendra Dev University of
Agriculture & Technology,
Faizabad
c) Sardar Vallabhbhai Patel
Agriculture and technology
University, Meerut
55. College of Veterinary Science & Animal Husbandry,
Mathura
56. College of Veterinary Science, Faizabad *
57. College of Veterinary and Animal Science, Meerut *
Uttara-
khand
Govind Ballbh Pant University
of Agriculture & Technology,
Pantnagar
58. College of Veterinary Science, Pantnagar
West
Bengal
West Bengal University of
Animal & Fishery Sciences,
Kolkata
59. Faculty of Veterinary and Animal Sciences, Kolkata
Source: Vet colleges data obtained for the project from SAUs; VCI Web Site had 39 colleges as on 23-6-2010.
* These 12 constituent colleges of respective universities are also not on the VCI recognized list.
** These eight private colleges are not on the VCI recognized list.
*** All Veterinary colleges in Rajasthan came under the new university RUVAS, Bikaner.

320
Annexure-8.2
Students Admitted and Passed in Veterinary & Animal Husbandry Courses during
2009-10
University
Diploma UG PG PhD
Admit Pass Admit Pass Admit Pass Admit Pass
AAU, Allahabad
0 0 2 2 1 3
AAU, Anand
55 55 53 52 17 5
AAU,Jorhat
100 87 15 28 4 3
BAU, Ranchi
37 NA 4 NA 11 NA
BCKV,Mohanpur
0 0 0 0 2 0
BHU, Varnasi
0 0 8 4 4 0
CAU, Imphal
58 NA 16 NA 0 0
CCSHAU, Haryana
76 50 35 24 10 1
CSKHPKV, Palampur
47 31 39 7 0 4
CSUAST, Kanpur
0 0 2 3 1 0
GADVASU, Ludhiana
73 60 45 32 13 8
GBPUAT, Panthnagar
50 56 37 37 6 5
IGKV, Raipur
43 45 21 NA 2 0
IVRI, Izathnagar
0 0 124 85 82 33
JAU,Junagadh
29 NA 1 0 3 0
JNKV, Jabalpur
95 87 18 15 0 0
KAU, Trissur
120 113 49 36 5 2
KVAFSU,Bidar
213 102 45 61 7 9
MAFSU, Nagpur 4693 2917 253 240 NA 127 NA 6
NAU, Navsari
30 NA 4 NA 0 0
NDUAT,Faizabad
NA NA 0 0 0 0
NDRI, Karnal
0 0 47 0 NA 14
OUAT, Bhubaneswar
75 80 40 22 0 0
RAU, Pusa
60 49 17 49 0 0
SKDAU,Dantiwada 53 49 62 42 24 28 5 1
SKRAU, Bikanir
80 70 0 0 0 0
SKUAST, Jammu
57 67 59 17 6 0
SKUAST, Kashmir
64 63 15 13 5 1
SVVU, Tirupathi 177 170 244 200 45 0 4 0
TANVASU, Chennai 2 0 225 186 68 69 18 19
UPPDDU, Mathura
57 49 38 49 0 0
WBUAFS, Belgachia
65 29 47 37 24 11
Bharati Vet College,
Goa*
45 NA 0 0 0 0
Vet College, PU,
Pondicherry*
45 NA 15 0 0 0
Grand Total 4925 3136 2358 1761 933 797 230 125
*PU and Bharati Veterinary Colleges are not under SAUs
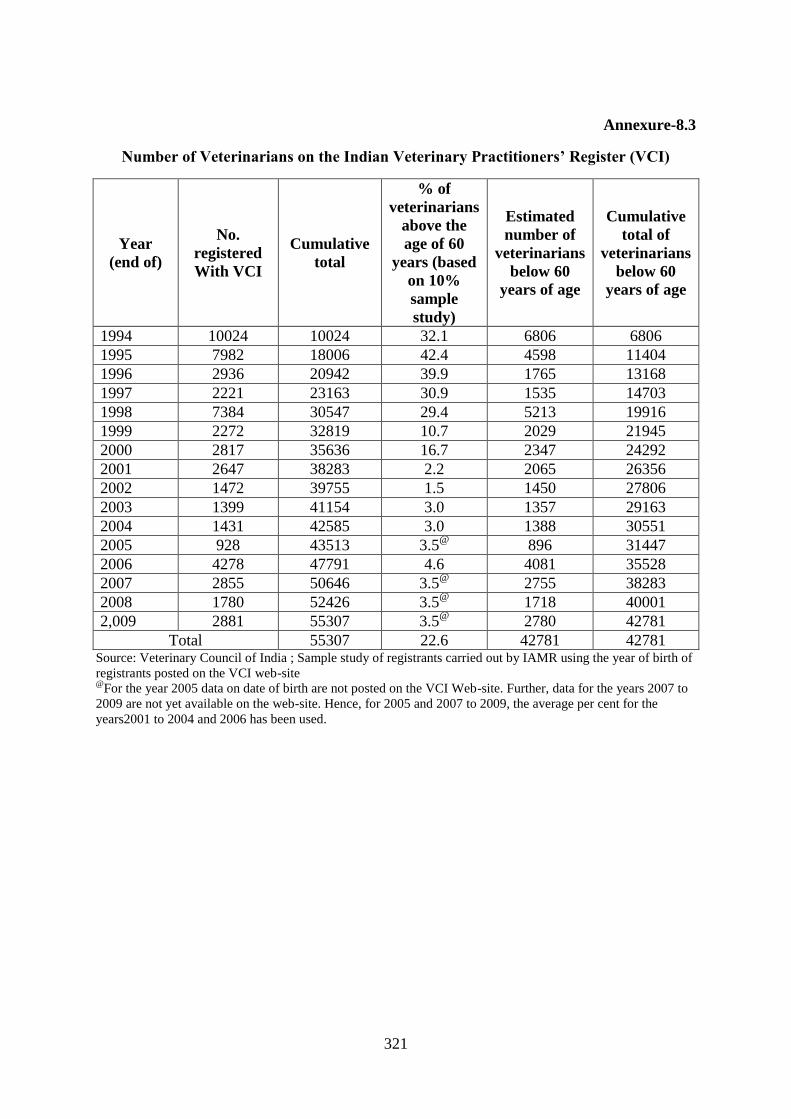
321
Annexure-8.3
Number of Veterinarians on the Indian Veterinary Practitioners’ Register (VCI)
Year
(end of)
No.
registered
With VCI
Cumulative
total
% of
veterinarians
above the
age of 60
years (based
on 10%
sample
study)
Estimated
number of
veterinarians
below 60
years of age
Cumulative
total of
veterinarians
below 60
years of age
1994 10024 10024 32.1 6806 6806
1995 7982 18006 42.4 4598 11404
1996 2936 20942 39.9 1765 13168
1997 2221 23163 30.9 1535 14703
1998 7384 30547 29.4 5213 19916
1999 2272 32819 10.7 2029 21945
2000 2817 35636 16.7 2347 24292
2001 2647 38283 2.2 2065 26356
2002 1472 39755 1.5 1450 27806
2003 1399 41154 3.0 1357 29163
2004 1431 42585 3.0 1388 30551
2005 928 43513 3.5@
896 31447
2006 4278 47791 4.6 4081 35528
2007 2855 50646 3.5@
2755 38283
2008 1780 52426 3.5@
1718 40001
2,009 2881 55307 3.5@
2780 42781
Total 55307 22.6 42781 42781 Source: Veterinary Council of India ; Sample study of registrants carried out by IAMR using the year of birth of
registrants posted on the VCI web-site @
For the year 2005 data on date of birth are not posted on the VCI Web-site. Further, data for the years 2007 to
2009 are not yet available on the web-site. Hence, for 2005 and 2007 to 2009, the average per cent for the
years2001 to 2004 and 2006 has been used.

322
Annexure-8.4
The World Organization for Animal Health (OIE) Estimation of Veterinary Personnel
in India (1997-2007)
Year
Veterinarians
Animal
Health
(Public)
Animal
Health
(Private)
Labs
(Govt.)
Labs
(Private)
Academic
/Training
Institutes
Private
Pharma
Industry
Indepe
ndent
Private
vets.
Others Total
1997 31150 1725 3000 NA NA NA NA 1325 37200
1998 31200 1750 3000 NA NA NA NA 1350 37300
1999 31250 1775 3000 NA NA NA NA 1375 37400
2000 31300 1800 3025 NA NA NA NA 1400 37525
2001 31350 1825 3050 NA NA NA NA 1425 37650
2002 31425 1900 3075 NA NA NA NA 1475 37875
2003 31495 1975 3105 NA NA NA NA 1525 38100
2004 31555 2060 3135 NA NA NA NA 1575 38325
2005 38271 2150 3170 NA NA NA NA 1620 45211
2006 38271 2150 3170 NA NA NA NA 1620 45211
2007 38271 2150 3170 NA NA NA NA 1620 45211
2008 38271 2150 3170 NA NA NA NA 1620 45211
Source: OIE, OIE-WAHID Interface, www.oie.int/eng/info/en_infold.htm

323
Annexure-8.5
Projected Stocks of Veterinarians Required on the Basis of Constant Overall Growth
Rates
Year
Projections based on rate of
growth in veterinarians
Projected
Number of
Livestock
Units
(bovine
equivalents)
(millions)
Projections based on the norm
of
4% 6% Average
10000
LSU per
vet
5000
LSU
per vet
Average
2009-10 43000 43000 43000 446.64 44664 89329 66997
2010-11 4720 45580 45150 450.39 45039 90079 67559
2011-12 46509 48315 47412 454.16 45416 90832 68124
2012-13 48369 51214 49791 457.94 45794 91587 68690
2013-14 50304 54287 52295 461.73 46173 92346 69259
2014-15 52316 57544 54930 465.54 46554 93108 69831
2015-16 54409 60996 57703 469.36 46936 93873 70405
2016-17 56585 64656 60621 473.21 47321 94641 70981
2017-18 58848 68535 63692 477.07 47707 95414 71560
2018-19 61202 72648 66925 480.95 48095 96189 72142
2019-20 63651 77006 70328 484.85 48485 96969 72727
LSU = Livestock unit

324
Annexure-8.6
Projections of Required Stocks of Veterinarians
for Public Animal Health Services (High Growth)
Year Diploma UG PG PhD All UG &
above
2009-10 13068 16500 4400 1100 22000
2010-11 13460 16995 4532 1133 22660
2011-12 13864 17505 4668 1167 23340
2012-13 14280 18030 4808 1202 24040
2013-14 14708 18571 4952 1238 24761
2014-15 15149 19128 5101 1275 25504
2015-16 15604 19702 5254 1313 26269
2016-17 16072 20293 5411 1353 27057
2017-18 16554 20902 5574 1393 27869
2018-19 17051 21529 5741 1435 28705
2019-20 17562 22175 5913 1478 29566
Projections of Required Stocks of Veterinarians
for Public Animal Health Services (Low Growth)
Year
No. of Veterinary personnel required with the norm of 5000
LSUs per veterinarian
Diploma UG PG PhD All UG &
above
2009-10 13068 16500 4400 1100 22000
2010-11 13307 16830 4488 1122 22440
2011-12 13573 17167 4578 1144 22889
2012-13 13845 17510 4669 1167 23347
2013-14 14121 17860 4763 1191 23814
2014-15 14404 18217 4858 1214 24290
2015-16 14692 18582 4955 1239 24776
2016-17 14986 18953 5054 1264 25271
2017-18 15285 19332 5155 1289 25777
2018-19 15591 19719 5258 1315 26292
2019-20 15903 20113 5364 1341 26818

325
Annexure-8.7
Projections of Required Stocks of Veterinarians
for Private Animal Healthcare Services
Year No. of Veterinary personnel required
Diploma UG PG PhD
All UG &
above
2009-10 6000 3000 800 200 4000
2010-11 6600 3450 920 230 4600
2011-12 7200 3900 1040 260 5200
2012-13 7800 4350 1160 290 5800
2013-14 8400 4800 1280 320 6400
2014-15 9000 5250 1400 350 7000
2015-16 9600 5700 1520 380 7600
2016-17 10200 6150 1640 410 8200
2017-18 10800 6600 1760 440 8800
2018-19 11400 7050 1880 470 9400
2019-20 12000 7500 2000 500 10000

326
Annexure-8.8
ICAR’s Scientists in Veterinary Science Division as on March 2010
SNo. Name of the Institute Scientists
Per Cent Filled Sanctioned In position
1. CARI, Izatnagar 50 40 80
2. CIRG, Makhdoom 50 31 62
3. NBAGR, Karnal 35 28 80
4. NIANP, Bangalore 40 35 87.5
5. CSWRI, Avikanagar 90 56 62.2
6. IVRI, Izatnagar 334 231 69.1
7. PDC, Meerut 20 15 75
8. PDP, Hyderabad 15 15 100
9. CIRB, Hisar 40 31 77.5
10. NCAP, New Delhi 25 17 68
11. NRC on Camel, Bikaner 20 16 80
12. NRC Equines, Hisar 35 30 85.7
13. NRC on Pig, Assam 15 10 66.7
14. NRC Yak, Dirang 15 09 60
15. NRC Meat, Hyd. 15 12 80
16. NRC Mithun 15 11 73.33
17. PD-ADMAS 15 12 80
18. PDFMD, Mukteswar 15 10 66.7
TOTAL 844 609 72.1
Annexure-8.9
Projections of Required Stocks of Veterinarians for Research
Year UG PG PhD All UG & above
2009-10 - 240 960 1200
2010-11 - 250 1000 1250
2011-12 - 260 1040 1300
2012-13 - 270 1080 1350
2013-14 - 280 1120 1400
2014-15 - 300 1200 1500
2015-16 - 320 1280 1600
2016-17 - 340 1360 1700
2017-18 - 360 1440 1800
2018-19 - 380 1520 1900
2019-20 - 400 1600 2000
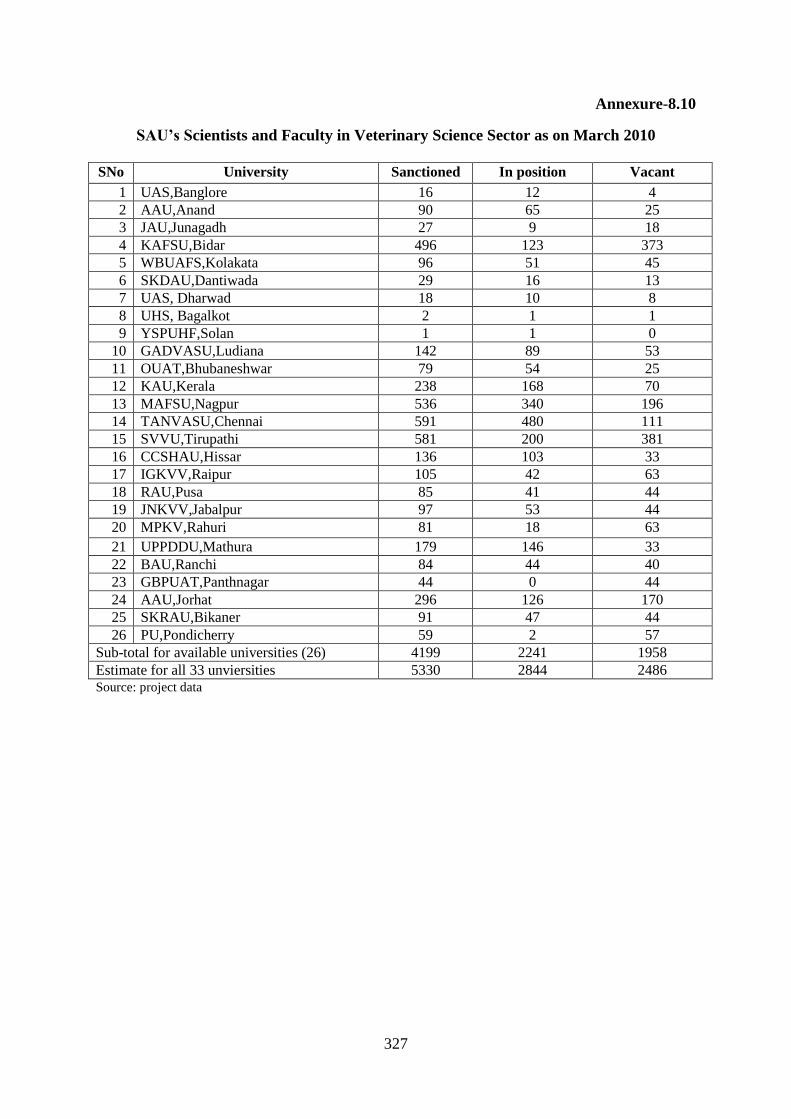
327
Annexure-8.10
SAU’s Scientists and Faculty in Veterinary Science Sector as on March 2010
SNo University Sanctioned In position Vacant
1 UAS,Banglore 16 12 4
2 AAU,Anand 90 65 25
3 JAU,Junagadh 27 9 18
4 KAFSU,Bidar 496 123 373
5 WBUAFS,Kolakata 96 51 45
6 SKDAU,Dantiwada 29 16 13
7 UAS, Dharwad 18 10 8
8 UHS, Bagalkot 2 1 1
9 YSPUHF,Solan 1 1 0
10 GADVASU,Ludiana 142 89 53
11 OUAT,Bhubaneshwar 79 54 25
12 KAU,Kerala 238 168 70
13 MAFSU,Nagpur 536 340 196
14 TANVASU,Chennai 591 480 111
15 SVVU,Tirupathi 581 200 381
16 CCSHAU,Hissar 136 103 33
17 IGKVV,Raipur 105 42 63
18 RAU,Pusa 85 41 44
19 JNKVV,Jabalpur 97 53 44
20 MPKV,Rahuri 81 18 63
21 UPPDDU,Mathura 179 146 33
22 BAU,Ranchi 84 44 40
23 GBPUAT,Panthnagar 44 0 44
24 AAU,Jorhat 296 126 170
25 SKRAU,Bikaner 91 47 44
26 PU,Pondicherry 59 2 57
Sub-total for available universities (26) 4199 2241 1958
Estimate for all 33 unviersities 5330 2844 2486 Source: project data

328
Annexure-8.11
Projections of Required Stocks of Veterinarians for Veterinary Science Education
Year PG PhD All UG & above
graduates &
above 2009-10 440 1760 2200
2010-11 459 1837 2297
2011-12 480 1918 2398
2012-13 501 2003 2503
2013-14 523 2091 2614
2014-15 546 2183 2729
2015-16 570 2279 2849
2016-17 595 2379 2974
2017-18 621 2484 3105
2018-19 648 2593 3241
2019-20 677 2707 3384
Annexure-8.12
Projections of Required Stocks of Veterinarians for Dairy Industry
Year Diploma UG PG PhD All UG &
above
graduates &
above
2009-10 500 250 167 83 500
2010-11 530 265 177 88 530
2011-12 562 281 187 94 562
2012-13 596 298 199 99 596
2013-14 631 316 210 105 631
2014-15 669 335 223 112 669
2015-16 709 355 236 118 709
2016-17 752 376 251 125 752
2017-18 797 398 266 133 797
2018-19 845 422 282 141 845
2019-20 895 448 298 149 895

329
Annexure-8.13
Projections of Required Stocks of Veterinarians for Veterinary Pharmaceutical
Industry
Year Diploma UG PG PhD All UG & above
2009-10 24 732 300 144 1176
2010-11 26 805 330 158 1294
2011-12 29 886 363 174 1423
2012-13 32 974 399 192 1565
2013-14 35 1072 439 211 1722
2014-15 39 1179 483 232 1894
2015-16 43 1297 531 255 2083
2016-17 47 1426 585 281 2292
2017-18 51 1569 643 309 2521
2018-19 57 1726 707 340 2773
2019-20 62 1899 778 373 3050
Annexure-8.14
Projections of Required Stocks of Veterinarians for Animal Feed Industry
Year Diploma UG PG Ph
D.D
All UG & above
2009-10 1953 1424 781 42 2247
2010-11 2148 1566 859 46 2472
2011-12 2363 1723 945 51 2719
2012-13 2599 1895 1040 56 2991
2013-14 2859 2085 1144 61 3290
2014-15 3145 2293 1258 68 3619
2015-16 3460 2522 1384 74 3981
2016-17 3806 2775 1522 82 4379
2017-18 4186 3052 1675 90 4817
2018-19 4605 3357 1842 99 5298
2019-20 5066 3693 2026 109 5828

330
Annexure-8.15
Projections of Required Stocks of Veterinarians
for Animal Breeding farms
Year Diploma UG PG PhD All UG &above
2009-10 78 510 353 59 922
2010-11 86 561 388 59 1008
2011-12 94 612 424 59 1095
2012-13 101 663 459 59 1181
2013-14 109 714 494 59 1267
2014-15 117 765 530 59 1354
2015-16 125 816 565 59 1440
2016-17 133 867 600 59 1526
2017-18 140 918 635 59 1612
2018-19 148 969 671 59 1699
2019-20 156 1020 706 59 1785
Annexure-8.16
Projections of Required Stocks of Veterinarians
for Meat Products industry
Year Diploma UG PG PhD All UG &
above
2009-10 161 591 322 107 1020
2010-11 177 650 354 118 1122
2011-12 195 715 390 130 1235
2012-13 214 786 429 143 1358
2013-14 236 865 472 157 1494
2014-15 259 951 519 173 1643
2015-16 285 1047 571 190 1808
2016-17 314 1151 628 209 1988
2017-18 345 1266 691 230 2187
2018-19 380 1393 760 253 2406
2019-20 418 1532 836 279 2647

331
Annexure-8.17
Projections of Required Stocks of Veterinarians for Financial Services
Year UG PG PhD All UG & above
2009-10 3150 350 - 3500
2010-11 3229 359 - 3588
2011-12 3309 368 - 3677
2012-13 3392 377 - 3769
2013-14 3477 386 - 3863
2014-15 3564 396 - 3960
2015-16 3653 406 - 4059
2016-17 3744 416 - 4160
2017-18 3838 426 - 4264
2018-19 3934 437 - 4371
2019-20 4032 448 - 4480

332
Annexure-8.18
a) Overall Projections of Requirements Stocks of Veterinary Human Resources
(High Growth)
Year Diploma UG PG PhD UG and above
2009-10 23963 28772 8873 4521 42166
2010-11 25331 30273 9392 4740 44405
2011-12 26737 31824 9933 4967 46724
2012-13 28185 33427 10497 5203 49127
2013-14 29677 35089 11086 5447 51621
2014-15 31217 36811 11713 5744 54268
2015-16 32808 38600 12369 6051 57021
2016-17 34455 40461 13058 6369 59888
2017-18 36162 42398 13781 6699 62878
2018-19 37934 44418 14542 7040 66001
2019-20 39775 46528 15344 7395 69267
b) Overall Projections of Requirements Stocks of Veterinary Human Resources
(Low Growth)
Year Diploma UG PG PhD UG and above
2009-10 23963 28772 8873 4521 42166
2010-11 25162 30092 9344 4728 44163
2011-12 26417 31452 9834 4942 46228
2012-13 27706 32855 10344 5164 48364
2013-14 29031 34307 10877 5394 50578
2014-15 30397 35810 11446 5677 52932
2015-16 31805 37368 12041 5969 55378
2016-17 33260 38987 12665 6271 57923
2017-18 34767 40672 13321 6583 60576
2018-19 36328 42428 14011 6907 63346
2019-20 37950 44261 14740 7243 66244
c) Overall Projections of Requirements Stocks of Veterinary Human Resources
(Average Growth)
Year Diploma UG PG PhD UG and above
2009-10 23963 28772 8873 4521 42166
2010-11 25234 30182 9368 4734 44284
2011-12 26564 31638 9883 4955 46476
2012-13 27932 33141 10420 5184 48745
2013-14 29341 34698 10981 5421 51100
2014-15 30793 36310 11579 5711 53600
2015-16 32292 37984 12205 6010 56199
2016-17 33843 39724 12861 6320 58905
2017-18 35449 41535 13551 6641 61727
2018-19 37115 43423 14277 6974 64674
2019-20 38846 45395 15042 7319 67756
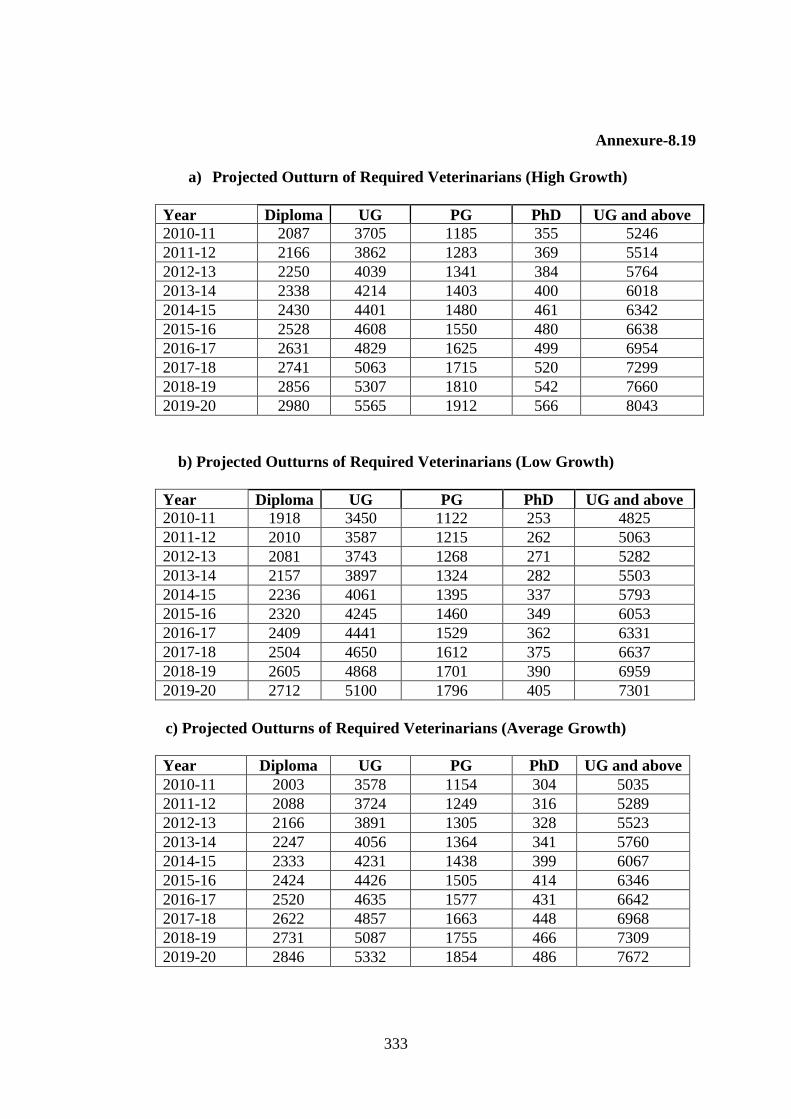
333
Annexure-8.19
a) Projected Outturn of Required Veterinarians (High Growth)
Year Diploma UG PG PhD UG and above
2010-11 2087 3705 1185 355 5246
2011-12 2166 3862 1283 369 5514
2012-13 2250 4039 1341 384 5764
2013-14 2338 4214 1403 400 6018
2014-15 2430 4401 1480 461 6342
2015-16 2528 4608 1550 480 6638
2016-17 2631 4829 1625 499 6954
2017-18 2741 5063 1715 520 7299
2018-19 2856 5307 1810 542 7660
2019-20 2980 5565 1912 566 8043
b) Projected Outturns of Required Veterinarians (Low Growth)
Year Diploma UG PG PhD UG and above
2010-11 1918 3450 1122 253 4825
2011-12 2010 3587 1215 262 5063
2012-13 2081 3743 1268 271 5282
2013-14 2157 3897 1324 282 5503
2014-15 2236 4061 1395 337 5793
2015-16 2320 4245 1460 349 6053
2016-17 2409 4441 1529 362 6331
2017-18 2504 4650 1612 375 6637
2018-19 2605 4868 1701 390 6959
2019-20 2712 5100 1796 405 7301
c) Projected Outturns of Required Veterinarians (Average Growth)
Year Diploma UG PG PhD UG and above
2010-11 2003 3578 1154 304 5035
2011-12 2088 3724 1249 316 5289
2012-13 2166 3891 1305 328 5523
2013-14 2247 4056 1364 341 5760
2014-15 2333 4231 1438 399 6067
2015-16 2424 4426 1505 414 6346
2016-17 2520 4635 1577 431 6642
2017-18 2622 4857 1663 448 6968
2018-19 2731 5087 1755 466 7309
2019-20 2846 5332 1854 486 7672

334
Annexures for Chapter - 9
Annexure-9.1
List of Institutions Offering Education in Fishery Sciences
State University College/faculty
Andhra
Pradesh
Sri Venkateshwara Veterinary
University, Tirupati.
1. College of Fishery Science, Muthukur,
Dist: Nellore
Assam Assam Agriculture University
(AAU) Jorhat,
2. College of Fisheries, Raha, Nagaon
Bihar Rajendra Agricultural
University, Pusa Samastipura -
848125
3.College of Fisheries, Dholi, Muzaffarpur
Chhatisg
arh
Indira Gandhi Krishi
Vishwavidyalaya (IGKVV),
Raipur
4.PG College
Gujarat Junagadh Agricultural
University (JAU), Junagadh
Gujarat 362001
5. College of Fisheries, Junagadh
Haryana CCSHAU, Hisar 6. PG College
Himachal
Pradesh
CSKHPKVV,Palampur 7. College of veterinary and Animal
Sciences(Dept. of Fisheries)
Jammu&
kashmir
Sher-e-Kashmir University of
Agricultural Sciences & Tech.
(SKUAST-K),
8. Faculty of Fisheries, Rangil, Ganderbal.
Karnataka Karnataka Veterinary, Animal
& Fisheries Sciences
University,Bidar
9. College of Fisheries, Mangalore,
Dakshina Kannada Dist
Kerala Kerala Agricultural University
(KAU), Kerala.
10. College of Fisheries, Panangad P.O,
Ernakulam District
Cochin University of Science
& Technology
11. St.Albert’s College, Kochi.
Maha-
rashtra
BSKKV, Dapoli
12. College of Fisheries, Udgir, Dist:
Rathnagiri
Maharashtra Animal &Fishery
Science University, Nagpur
13. College of Fisheries,Nagpur
14. College of Fisheries,Udgir
Central Institute of Fisheries
Education (CIFE), Mumbai
15. Central institute of Fisheries Education,
Mumbai
Mizoram Central Agricultural
University, Imphal
16. College of Fisheries, Lembuchera,
Agartala
Orissa
Orissa University of
Agriculture & Technology,
Bhubaneswar
17. College of Fishery Science,
Rangeilunda
18. College of Engineering & Technology,
Fisheries, Bhubaneswar
Punjab Guru Angad Dev Veterinary 19. College of Fisheries Science, Ludhiana

335
and Animal Sciences
University, Ludhiana
Rajasthan Maharana Pratap Agriculture
and Technology University,
Udaipur
20. College of fisheries, Udaipur
Tamil
Nadu
Tamil Nadu Veterinary and
Animal Sciences University,
Chennai, 641003
21. Fisheries College and Research
Institute, Thoothukudi
Uttar
Pradesh
Narendra Deva University of
Agriculture and Technology
Kumarganj – Faizabad
22. College of Fisheries, Faizabad
Uttaranch
al
Govind Ballabh Pant University of
Agriculture and Technology
(GBPAUT), Pantnagar,
Uttaranchal
23. College of Fisheries, Pantnagar,
Uttaranchal
West
Bengal
West Bengal University of
Animal and Fishery Sciences.
24. Faculty of Fishery Sciences,
Kshundiram Bose Sarani, Kolkata
IIT, Kharagpur* 25. Dept of Agriculture & Food
Engineering
* Central Institution

336
Annexure-9.2
Students Admitted and Passed in Fishery Science Courses during 2009-10
Universities
Diploma UG PG PhD
Admit Pass Admit Pass Admit Pass Admit Pass
AAU,Jorhat NA NA 20 17 0 0 0 0
BSKV, Dapoli NA NA 33 30 9 10 1 1
CAU, Imphal NA NA 23 18 5 2 0 0
CCSHAU, Hissar NA NA 0 0 2 1 1 1
CIFE, Mumbai NA NA 0 0 40 30 20 10
CSKHPKV, Palampur NA NA 46 38 0 0 0 0
GADVASU, Ludhiana NA NA 15 NA 7 0 0 0
GBPUAT, Panthnagar NA NA 26 13 10 8 2 8
IGKV, Raipur NA NA 0 0 10 5 0 0
JAU,Junagadh NA NA 36 7
0 0
KAU, Trissur NA NA 43 44 3 5 0 0
KVAFSU,Bidar NA NA 45 16 30 12 4 9
MAFSU, Nagpur NA NA 54 27 0 0 0 0
MPUAT, Udaipur NA NA 25 NA 0 0 0 0
OUAT, Bhubaneswar NA NA 30 18 3 2 0 0
RAU, Pusa NA NA 25 10 0 0 0 0
SKUAST, Kashmir NA NA 14 NA 2 2 0 0
SVVU, Tirupathi 26 NA 21 NA 6 0 0 0
TANVASU, Chennai NA NA 35 25 22 10 NA 1
WBUAFS, Belgachia NA NA 39 22 19 22 0 0
NDUAT,Faizabad NA NA NA NA 0 0 0 0
CUST, Cochin* NA NA 22 NA 38 0 6 NA
Grand Total 26 NA 552 285 206 109 34 30 *CUST, Cochin is not under SAUs
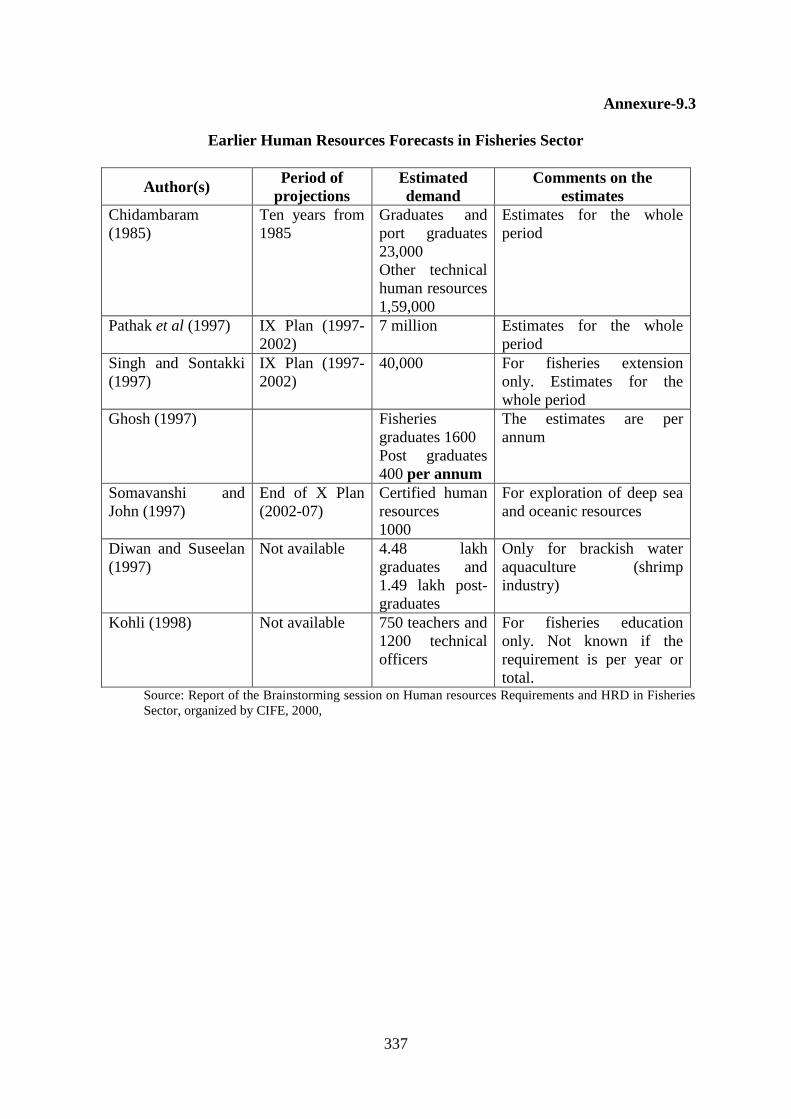
337
Annexure-9.3
Earlier Human Resources Forecasts in Fisheries Sector
Author(s) Period of
projections
Estimated
demand
Comments on the
estimates
Chidambaram
(1985)
Ten years from
1985
Graduates and
port graduates
23,000
Other technical
human resources
1,59,000
Estimates for the whole
period
Pathak et al (1997) IX Plan (1997-
2002)
7 million Estimates for the whole
period
Singh and Sontakki
(1997)
IX Plan (1997-
2002)
40,000 For fisheries extension
only. Estimates for the
whole period
Ghosh (1997) Fisheries
graduates 1600
Post graduates
400 per annum
The estimates are per
annum
Somavanshi and
John (1997)
End of X Plan
(2002-07)
Certified human
resources
1000
For exploration of deep sea
and oceanic resources
Diwan and Suseelan
(1997)
Not available 4.48 lakh
graduates and
1.49 lakh post-
graduates
Only for brackish water
aquaculture (shrimp
industry)
Kohli (1998) Not available 750 teachers and
1200 technical
officers
For fisheries education
only. Not known if the
requirement is per year or
total. Source: Report of the Brainstorming session on Human resources Requirements and HRD in Fisheries
Sector, organized by CIFE, 2000,

338
Annexure-9.4
Projections of Fish Production and Fish Processed
Year
Projected Fish production
(‘000 Tonnes) % processed
Quantity Processed
(‘000 tonnes)
High (6%
growth)
Low (4%
growth)
High (6%
growth)
Low (4%
growth)
2008-09 7555 7412 14 1058 1038
2009-10 8008 7709 15 1201 1156
2010-11 8488 8017 16 1358 1283
2011-12 8998 8338 17 1530 1417
2012-13 9538 8671 18 1717 1561
2013-14 10110 9018 19 1921 1713
2014-15 10716 9379 20 2143 1876
2015-16 11359 9754 21 2385 2048
2016-17 12041 10144 22 2649 2232
2017-18 12763 10550 23 2936 2426
2018-19 13529 10972 24 3247 2633
2019-20 14341 11411 25 3585 2853
Annexure-9.5
Projections of Fish Processing Industries Using Annual Survey of Industries Data
Year No. of working
factories
Total number of persons
engaged
Average number of
persons per unit
2000-01 260 27,065 104
2001-02 256 23,649 92
2002-03 264 31,844 121
2003-04 281 32,426 115
2004-05 283 32,240 114
2005-06 318 34,496 108
Projections
2006-07 316 36,638 116
2007-08 327 38,452 118
2008-09 338 40,267 119
2009-10 349 42,081 121
2010-11 360 43,896 122
2011-12 371 45,711 123
2012-13 382 47,525 124
2013-14 393 49,340 125
2014-15 404 51,154 126
2015-16 416 52,969 127
2016-17 427 54,783 128
2017-18 438 56,598 129
2018-19 449 58,413 130
2019-20 460 60,227 131
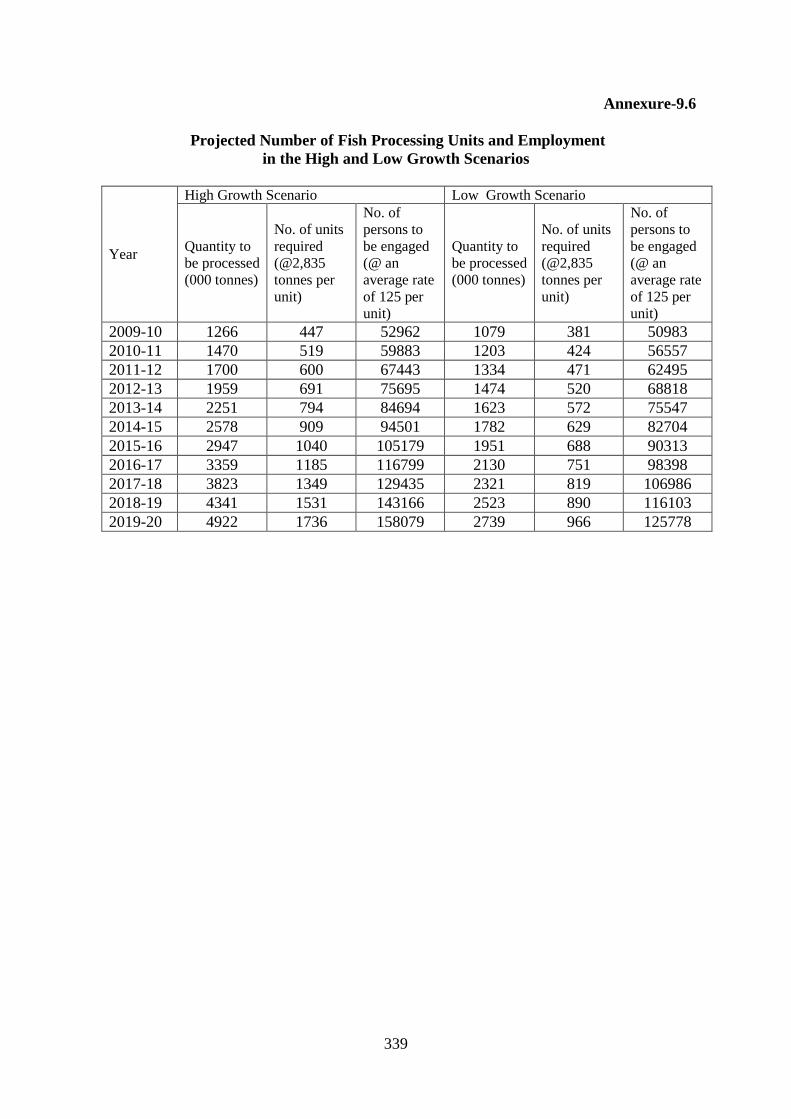
339
Annexure-9.6
Projected Number of Fish Processing Units and Employment
in the High and Low Growth Scenarios
Year
High Growth Scenario Low Growth Scenario
Quantity to
be processed
(000 tonnes)
No. of units
required
(@2,835
tonnes per
unit)
No. of
persons to
be engaged
(@ an
average rate
of 125 per
unit)
Quantity to
be processed
(000 tonnes)
No. of units
required
(@2,835
tonnes per
unit)
No. of
persons to
be engaged
(@ an
average rate
of 125 per
unit)
2009-10 1266 447 52962 1079 381 50983
2010-11 1470 519 59883 1203 424 56557
2011-12 1700 600 67443 1334 471 62495
2012-13 1959 691 75695 1474 520 68818
2013-14 2251 794 84694 1623 572 75547
2014-15 2578 909 94501 1782 629 82704
2015-16 2947 1040 105179 1951 688 90313
2016-17 3359 1185 116799 2130 751 98398
2017-18 3823 1349 129435 2321 819 106986
2018-19 4341 1531 143166 2523 890 116103
2019-20 4922 1736 158079 2739 966 125778

340
Annexure-9.7
(a) Requirement of Fishery Educated Persons in Fish-processing (Low Growth)
Year
Certificate/
Informally
trained
Diploma UG PG PhD
2009-10 2427 1066 3350 597 92
2010-11 2692 1182 3716 662 102
2011-12 2975 1306 4106 731 112
2012-13 3276 1438 4521 805 124
2013-14 3596 1579 4963 884 136
2014-15 3937 1729 5434 968 149
2015-16 4299 1888 5934 1057 163
2016-17 4684 2057 6465 1151 177
2017-18 5093 2236 7029 1252 193
2018-19 5526 2427 7628 1358 209
2019-20 5987 2629 8264 1472 226
(b) Requirement of Fishery Educated Persons in Fish-processing (High Growth)
Year
Certificate/
Informally
trained
Diploma UG PG PhD
2009-10 2427 1066 3350 597 92
2010-11 2850 1252 3934 701 108
2011-12 3210 1410 4431 789 121
2012-13 3603 1582 4973 886 136
2013-14 4031 1770 5564 991 152
2014-15 4498 1975 6209 1106 170
2015-16 5007 2198 6910 1231 189
2016-17 5560 2441 7674 1367 210
2017-18 6161 2705 8504 1514 233
2018-19 6815 2992 9406 1675 258
2019-20 7525 3304 10386 1850 285
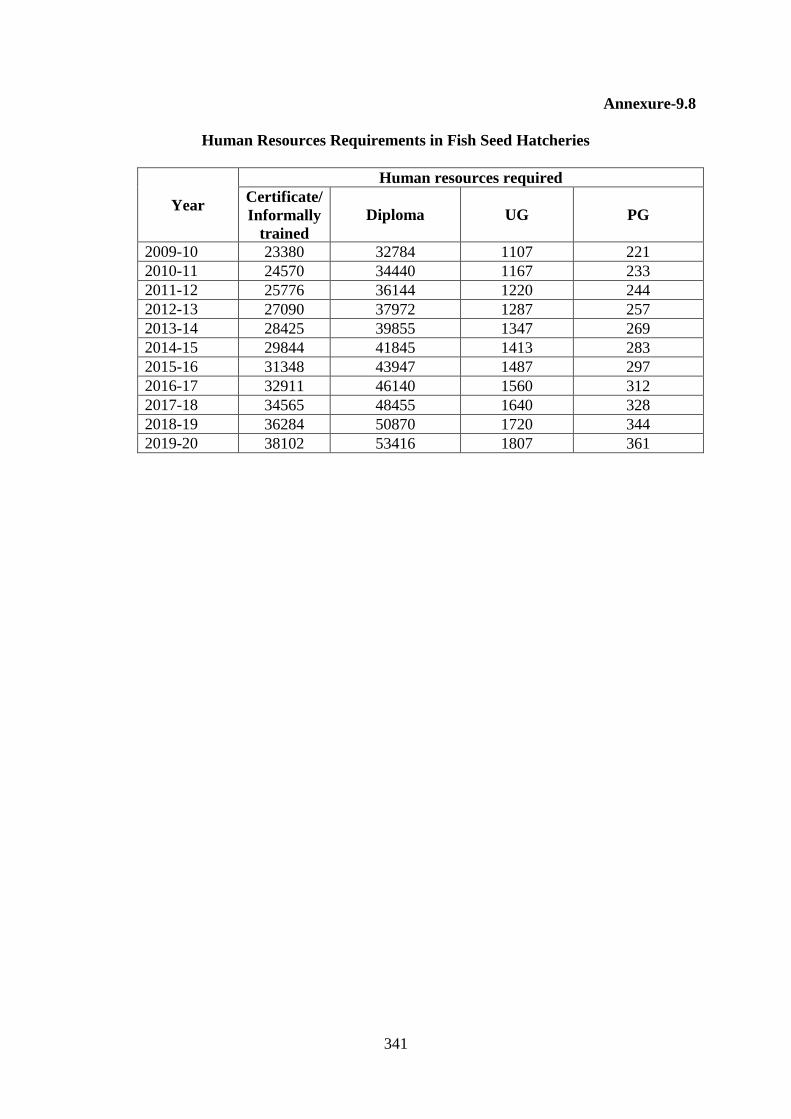
341
Annexure-9.8
Human Resources Requirements in Fish Seed Hatcheries
Year
Human resources required
Certificate/
Informally
trained
Diploma UG PG
2009-10 23380 32784 1107 221
2010-11 24570 34440 1167 233
2011-12 25776 36144 1220 244
2012-13 27090 37972 1287 257
2013-14 28425 39855 1347 269
2014-15 29844 41845 1413 283
2015-16 31348 43947 1487 297
2016-17 32911 46140 1560 312
2017-18 34565 48455 1640 328
2018-19 36284 50870 1720 344
2019-20 38102 53416 1807 361

342
Annexure-9.9
Number of Aquaculture Units Registered with CAA by March 2010
State Number of Aquaculture units registered with CAA
Andhra Pradesh 12,099
Daman and Diu 12
Goa 27
Gujarat 442
Karnataka 268
Orissa 2,277
Maharashtra 215
Puducherry 02
Tamil Nadu 1,353
West Bengal 1,089
Total 18,630 Source: Coastal Aquaculture Authority, Annual Reports
Annexure-9.10
Structure of Coastal Aquaculture Fish Farms in India
Size (ha) No. of Farms % distribution by size
0-2 9,888 83.5
2-5 1,746 14.8
5-10 166 1.4
10-40 30 0.25
>40 7 0.06
Total 11,837 100.0 Source: Annual Report 2008-09 of Coastal Aquaculture Authority
Annexure-9.11
Projections of Human Resource Needs of Aquaculture
Year LOW projection HIGH projection
Certificate Diploma UG PG Certificate Diploma UG PG
2009-10 96826 90595 1793 299 96826 90595 1793 299
2010-11 102636 96031 1901 317 104572 97843 1937 323
2011-12 108794 101793 2015 336 112938 105670 2092 349
2012-13 115321 107900 2136 356 121973 114124 2259 377
2013-14 122241 114374 2264 377 131731 123253 2440 407
2014-15 129575 121237 2400 400 142269 133114 2635 439
2015-16 137350 128511 2544 424 153651 143763 2846 474
2016-17 145591 136221 2697 449 165943 155264 3073 512
2017-18 154326 144395 2858 476 179218 167685 3319 553
2018-19 163585 153058 3030 505 193556 181100 3585 598
2019-20 173401 162242 3212 535 209040 195588 3872 645

343
Annexure-9.12
Projections of Human Resources Needs of Deep Sea Fishing
Year Deep sea vessels Certificate Diploma UG PG
2009-10 60 900 900 150 30
2010-11 74 1110 1110 185 37
2011-12 88 1320 1320 220 44
2012-13 102 1530 1530 255 51
2013-14 116 1740 1740 290 58
2014-15 130 1950 1950 325 65
2015-16 144 2160 2160 360 72
2016-17 158 2370 2370 395 79
2017-18 172 2580 2580 430 86
2018-19 186 2790 2790 465 93
2019-20 200 3000 3000 500 100

344
Annexure-9.13
a) Projections for Fisheries Development and Extension Agencies (High Growth)
Year
Certificate/
Diploma UG PG PhD Informally
trained
2009-10 3644 547 3079 702 34
2010-11 4008 602 3387 773 37
2011-12 4373 657 3695 843 41
2012-13 4737 711 4003 913 44
2013-14 5102 766 4311 983 48
2014-15 5466 821 4619 1054 51
2015-16 5830 876 4927 1124 54
2016-17 6195 930 5235 1194 58
2017-18 6559 985 5543 1264 61
2018-19 6924 1040 5850 1335 65
2019-20 7288 1094 6158 1405 68
b) Projections for Fisheries Development and Extension Agencies (Low Growth)
Year
Certificate/
Diploma UG PG PhD Informally
trained
2009-10 3645 547 3079 702 34
2010-11 3736 561 3156 720 27
2011-12 3827 575 3233 738 28
2012-13 3918 588 3310 755 28
2013-14 4009 602 3387 773 29
2014-15 4100 616 3464 790 30
2015-16 4192 629 3541 808 30
2016-17 4283 643 3618 825 31
2017-18 4374 657 3695 843 32
2018-19 4465 670 3772 860 32
2019-20 4556 684 3849 878 33

345
Annexure-9.14
SAU’s Scientists and Faculty in Fisheries Science Education as on March 2010
Sl.
No University Sanctioned
In
Position Vacant
1 UAS,Banglore 13 9 4
2 JAU,Junagadh 28 16 12
3 UAS,Raichur 5 3 2
4 KAFSU,Bidar 100 38 62
5 WBUAFS, Kolkata 32 18 14
6 SKDAU,Dantiwada 11 5 6
7 CAU, Imphal 33 21 12
8 UAS, Dharwad 6 2 4
9 GADVASU,Ludiana 9 4 5
10 BSKKV,Dapoli 57 54 3
11 OUAT,Bhubaneshwar 16 13 3
12 KAU, Trissur 33 22 11
13 MAFSU,Nagpur 54 18 36
14 TANVASU,Chennai 63 54 9
15 MPUAT,Udaipur 7 5 2
16 SVVU,Tirupathi 29 17 12
17 RAU,Pusa 15 10 5
19 SEKUAS&T, Srinagar 52 32 20
Sub-total for available 19 universities 563 341 222
Estimate for all 23 universities 682 413 269
ICAR’s Scientists in Fisheries Science Institutes as on March 2010
SNo Name of the Institute
Overall
Scientists in position Per Cent
Filled Sanctioned In position
1. CIFRI, Barrackpore 95 51 53.68
2. CIFE, Mumbai 104 71 68.26
3. CIFA, Bhubneswar 78 57 73.07
4. CMFRI, Cochin 173 107 61.84
5. CIBA, Chennai 65 48 73.84
6. NBFGR, Lucknow 40 29 72.5
7. CIFT, Cochin 95 53 55.78
8. Directorate of
Coldwater Fisheries,
Bhimtal
30 15 50
TOTAL 679 431 Source : Project data

346
Annexure-9.15
a. Projections of Stock of Fisheries Human Resources up to 2020 (High Growth)
Year Certificate/ Diploma UG PG PhD
2009-10 133536 132186 10567 2320 984
2010-11 143966 142009 11803 2571 1032
2011-12 154998 152460 12952 2805 1080
2012-13 166880 163715 14177 3053 1127
2013-14 179581 175753 15459 3312 1177
2014-15 193228 188690 16819 3584 1228
2015-16 207895 202591 18263 3871 1281
2016-17 223627 217503 19790 4172 1336
2017-18 240538 233530 21308 4491 1393
2018-19 258687 250732 23133 4827 1454
2019-20 278202 269223 24961 5183 1517
b. Projections of Stock of Fisheries Human Resources up to 2020 (Low Growth)
c. Projections of Stock of Fisheries Human Resources up to 2020 (Average Growth)
Year Certificate/ Diploma UG PG PhD
2009-10 133536 132186 10567 2320 984
2010-11 141481 139990 11294 2468 1015
2011-12 149826 148195 12046 2620 1056
2012-13 158692 156900 12845 2781 1097
2013-14 168012 166057 13674 2947 1140
2014-15 177876 175745 14546 3121 1183
2015-16 188316 185991 15466 3304 1228
2016-17 199330 196803 16427 3493 1273
2017-18 210984 208238 17336 3692 1320
2018-19 223283 220306 18500 3900 1368
2019-20 236298 233069 19615 4118 1419
Year Certificate/ Diploma UG PG PhD
2009-10 133536 132186 10567 2320 984
2010-11 142724 140999 11549 2519 1024
2011-12 152412 150327 12499 2713 1068
2012-13 162786 160307 13511 2917 1112
2013-14 173797 170905 14566 3130 1159
2014-15 185552 182217 15683 3352 1205
2015-16 198106 194291 16865 3587 1254
2016-17 211478 207153 18108 3833 1305
2017-18 225761 220884 19322 4092 1357
2018-19 240985 235519 20816 4363 1411
2019-20 257250 251146 22288 4651 1468
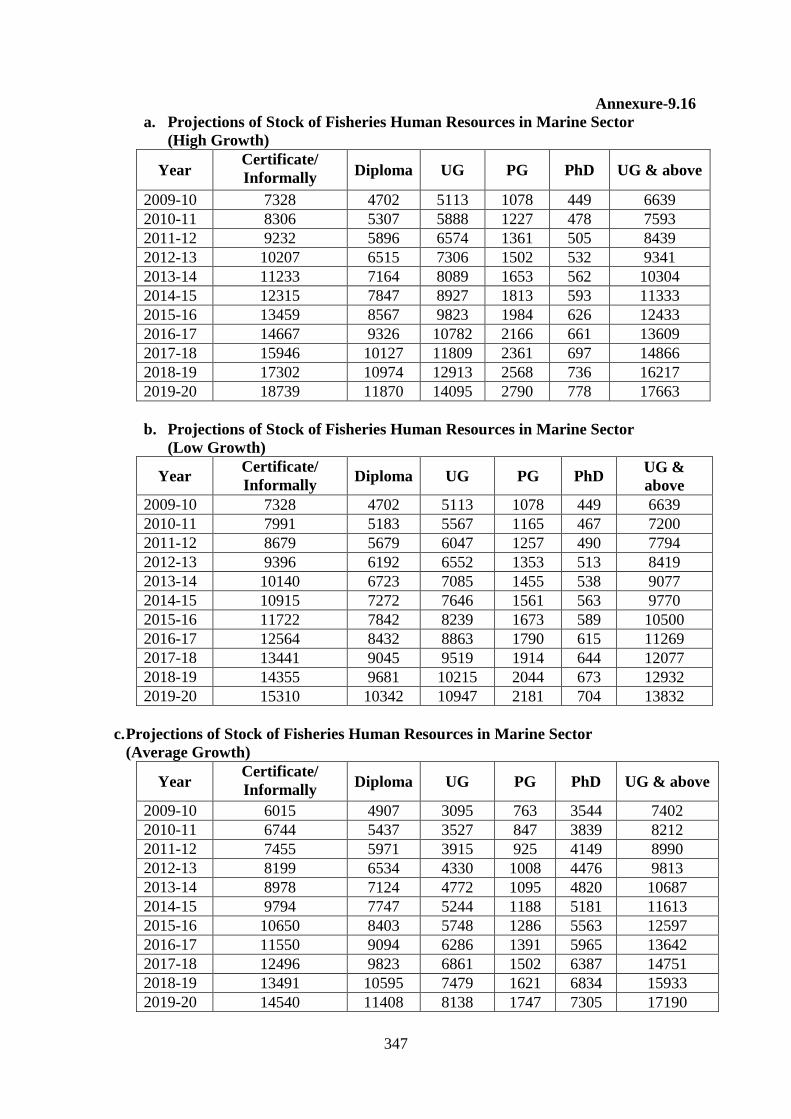
347
Annexure-9.16
a. Projections of Stock of Fisheries Human Resources in Marine Sector
(High Growth)
Year Certificate/
Informally
trained
Diploma UG PG PhD UG & above
2009-10 7328 4702 5113 1078 449 6639
2010-11 8306 5307 5888 1227 478 7593
2011-12 9232 5896 6574 1361 505 8439
2012-13 10207 6515 7306 1502 532 9341
2013-14 11233 7164 8089 1653 562 10304
2014-15 12315 7847 8927 1813 593 11333
2015-16 13459 8567 9823 1984 626 12433
2016-17 14667 9326 10782 2166 661 13609
2017-18 15946 10127 11809 2361 697 14866
2018-19 17302 10974 12913 2568 736 16217
2019-20 18739 11870 14095 2790 778 17663
b. Projections of Stock of Fisheries Human Resources in Marine Sector
(Low Growth)
Year Certificate/
Informally
trained
Diploma UG PG PhD UG &
above
2009-10 7328 4702 5113 1078 449 6639
2010-11 7991 5183 5567 1165 467 7200
2011-12 8679 5679 6047 1257 490 7794
2012-13 9396 6192 6552 1353 513 8419
2013-14 10140 6723 7085 1455 538 9077
2014-15 10915 7272 7646 1561 563 9770
2015-16 11722 7842 8239 1673 589 10500
2016-17 12564 8432 8863 1790 615 11269
2017-18 13441 9045 9519 1914 644 12077
2018-19 14355 9681 10215 2044 673 12932
2019-20 15310 10342 10947 2181 704 13832
c. Projections of Stock of Fisheries Human Resources in Marine Sector
(Average Growth)
Year Certificate/
Informally
trained
Diploma UG PG PhD UG & above
2009-10 6015 4907 3095 763 3544 7402
2010-11 6744 5437 3527 847 3839 8212
2011-12 7455 5971 3915 925 4149 8990
2012-13 8199 6534 4330 1008 4476 9813
2013-14 8978 7124 4772 1095 4820 10687
2014-15 9794 7747 5244 1188 5181 11613
2015-16 10650 8403 5748 1286 5563 12597
2016-17 11550 9094 6286 1391 5965 13642
2017-18 12496 9823 6861 1502 6387 14751
2018-19 13491 10595 7479 1621 6834 15933
2019-20 14540 11408 8138 1747 7305 17190

348
Annexure-9.17
a. Projections of Stock of Fisheries Human Resources in Aqua Sector
(High Growth)
Year
Certificate Diploma
UG PG
PhD
UG & above
2009-10 126208 127484 5454 1242 535 7232
2010-11 135660 136702 5915 1343 555 7813
2011-12 145766 146564 6379 1445 575 8398
2012-13 156674 157200 6870 1551 594 9016
2013-14 168348 168589 7370 1659 615 9644
2014-15 180913 180843 7893 1771 635 10298
2015-16 194437 194023 8440 1887 655 10982
2016-17 208960 208177 9007 2006 676 11689
2017-18 224591 223403 9500 2131 696 12326
2018-19 241386 239758 10220 2259 718 13196
2019-20 259463 257353 10867 2393 740 13999
b. Projections of Stock of Fisheries Human Resources in Aqua Sector
(Low Growth)
Year
Certificate Diploma
UG PG
PhD
UG & above
2009-10 126208 127484 5454 1242 535 7232
2010-11 133490 134807 5726 1303 548 7577
2011-12 141147 142516 5999 1364 566 7929
2012-13 149296 150707 6293 1428 584 8305
2013-14 157872 159334 6589 1493 602 8684
2014-15 166961 168473 6900 1560 620 9081
2015-16 176593 178149 7227 1631 639 9497
2016-17 186766 188370 7564 1703 658 9925
2017-18 197544 199193 7817 1778 677 10271
2018-19 208928 210625 8285 1855 696 10836
2019-20 220988 222728 8668 1936 716 11320
c. Projections of Stock of Fisheries Human Resources in Aqua Sector
(Average Growth)
Year
Certificate Diploma
UG PG
PhD
UG & above
2009-10 126846 66469 3348 889 3884 8121
2010-11 135234 71214 3609 946 4066 8621
2011-12 144141 76282 3871 1006 4252 9128
2012-13 153691 81747 4149 1068 4450 9666
2013-14 163841 87589 4431 1131 4649 10211
2014-15 174693 93871 4726 1196 4858 10779
2015-16 186293 100625 5036 1263 5076 11375
2016-17 198665 107871 5355 1332 5300 11987
2017-18 211892 115610 5639 1404 5484 12526
2018-19 226005 124022 6038 1477 5777 13292
2019-20 241095 133011 6401 1554 6030 13986

349
Annexure-9.18
a. Annual Requirement of Fisheries Human Resources in Marine Sector
(High Growth)
Year Certificate/
Informally
trained
Diploma UG PG PhD UG &
above
2010-11 1198 746 929 182 42 1153
2011-12 1175 748 862 170 41 1074
2012-13 1252 796 930 182 43 1155
2013-14 1332 845 1002 196 46 1244
2014-15 1419 898 1080 210 48 1338
2015-16 1513 955 1164 225 51 1440
2016-17 1612 1016 1254 242 53 1549
2017-18 1719 1081 1350 259 56 1666
2018-19 1833 1150 1458 278 60 1797
2019-20 1956 1225 1569 299 64 1932
b. Annual Requirement of Fisheries Human Resources in Marine Sector
(Low Growth)
Year Certificate/
Informally
trained
Diploma UG PG PhD UG &
above
2010-11 883 622 608 120 32 760
2011-12 928 651 646 127 37 810
2012-13 977 684 687 134 38 859
2013-14 1026 716 729 142 40 911
2014-15 1079 751 774 150 41 965
2015-16 1135 788 822 159 43 1023
2016-17 1193 826 871 168 44 1084
2017-18 1254 866 922 177 47 1146
2018-19 1318 907 982 188 48 1218
2019-20 1386 951 1038 198 51 1288
c. Annual Requirement of Fisheries Human Resources in Marine Sector
(Average Growth)
Year Certificate/
Informally
trained
Diploma UG PG PhD UG &
above
2010-11 1040 684 769 151 37 956
2011-12 1051 700 754 148 39 942
2012-13 1114 740 808 158 40 1007
2013-14 1179 781 866 169 43 1077
2014-15 1249 825 927 180 44 1151
2015-16 1324 872 993 192 47 1232
2016-17 1403 921 1063 205 49 1317
2017-18 1487 973 1136 218 51 1406
2018-19 1576 1029 1220 233 54 1507
2019-20 1671 1088 1304 249 57 1610

350
Annexure-9.19
a. Annual Requirement of Fisheries Human Resources in Aqua Sector
(High Growth)
Year Certificate/
Informally trained Diploma UG PG PhD
UG &
above
2010-11 13239 13042 625 138 35 798
2011-12 14176 13963 641 142 37 819
2012-13 15280 15033 683 150 37 869
2013-14 16375 16105 706 154 38 899
2014-15 17615 17311 744 161 38 943
2015-16 18951 18606 784 169 39 993
2016-17 20356 19974 820 176 40 1036
2017-18 21900 21471 763 185 41 988
2018-19 23532 23057 1005 192 42 1240
2019-20 25319 24788 953 202 43 1199
b. Annual Requirement of Fisheries Human Resources in Aqua Sector
(Low Growth)
Year Certificate/
Informally
trained
Diploma UG PG PhD UG &
above
2010-11 11068 11148 436 98 29 562
2011-12 11662 11753 444 100 35 579
2012-13 12384 12467 474 105 35 614
2013-14 13055 13148 484 108 36 628
2014-15 13825 13918 509 112 36 657
2015-16 14641 14731 534 117 37 689
2016-17 15471 15565 554 121 38 712
2017-18 16380 16474 479 126 39 644
2018-19 17311 17407 703 131 39 873
2019-20 18328 18422 631 137 41 809
c. Annual Requirement of Fisheries Human Resources in Aqua Sector
(Average Growth)
Year
Certificate/
Informally
trained
Diploma UG PG PhD UG &
above
2010-11 12153 12095 530 118 32 680
2011-12 12919 12858 543 121 36 699
2012-13 13832 13750 578 128 36 742
2013-14 14715 14626 595 131 37 763
2014-15 15720 15615 626 137 37 800
2015-16 16796 16669 659 143 38 841
2016-17 17914 17770 687 148 39 874
2017-18 19140 18973 621 156 40 816
2018-19 20421 20232 854 161 41 1056
2019-20 21823 21605 792 169 42 1004

351
Annexure-9.20
Average Annual Requirement of Fisheries Human Resources in Both Marine
and Aqua Sectors
Year
Certificate/
Informally
trained Diploma UG PG PhD
UG &
above
2010-11 13194 12779 1299 269 69 1637
2011-12 13970 13558 1297 269 75 1641
2012-13 14946 14490 1387 286 76 1749
2013-14 15894 15407 1461 300 80 1841
2014-15 16969 16440 1553 317 82 1952
2015-16 18120 17540 1652 335 85 2073
2016-17 19316 18691 1750 353 88 2191
2017-18 20627 19946 1757 374 91 2222
2018-19 21997 21261 2074 394 95 2564
2019-20 23494 22693 2096 418 100 2614
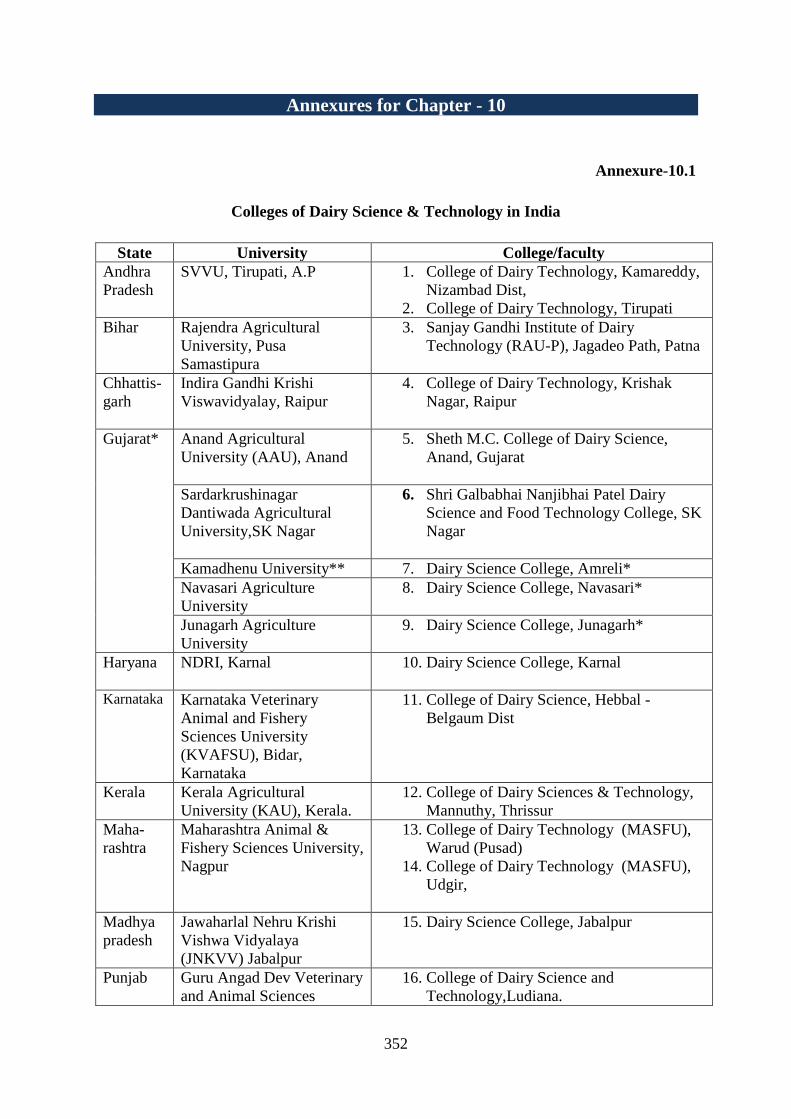
352
Annexures for Chapter - 10
Annexure-10.1
Colleges of Dairy Science & Technology in India
State University College/faculty
Andhra
Pradesh
SVVU, Tirupati, A.P 1. College of Dairy Technology, Kamareddy,
Nizambad Dist,
2. College of Dairy Technology, Tirupati
Bihar Rajendra Agricultural
University, Pusa
Samastipura
3. Sanjay Gandhi Institute of Dairy
Technology (RAU-P), Jagadeo Path, Patna
Chhattis-
garh
Indira Gandhi Krishi
Viswavidyalay, Raipur
4. College of Dairy Technology, Krishak
Nagar, Raipur
Gujarat* Anand Agricultural
University (AAU), Anand
5. Sheth M.C. College of Dairy Science,
Anand, Gujarat
Sardarkrushinagar
Dantiwada Agricultural
University,SK Nagar
6. Shri Galbabhai Nanjibhai Patel Dairy
Science and Food Technology College, SK
Nagar
Kamadhenu University** 7. Dairy Science College, Amreli*
Navasari Agriculture
University
8. Dairy Science College, Navasari*
Junagarh Agriculture
University
9. Dairy Science College, Junagarh*
Haryana
NDRI, Karnal 10. Dairy Science College, Karnal
Karnataka Karnataka Veterinary
Animal and Fishery
Sciences University
(KVAFSU), Bidar,
Karnataka
11. College of Dairy Science, Hebbal -
Belgaum Dist
Kerala Kerala Agricultural
University (KAU), Kerala.
12. College of Dairy Sciences & Technology,
Mannuthy, Thrissur
Maha-
rashtra
Maharashtra Animal &
Fishery Sciences University,
Nagpur
13. College of Dairy Technology (MASFU),
Warud (Pusad)
14. College of Dairy Technology (MASFU),
Udgir,
Madhya
pradesh
Jawaharlal Nehru Krishi
Vishwa Vidyalaya
(JNKVV) Jabalpur
15. Dairy Science College, Jabalpur
Punjab Guru Angad Dev Veterinary
and Animal Sciences
16. College of Dairy Science and
Technology,Ludiana.

353
University, Ludhiana
Rajasthan
Maharana Pratap
Agriculture and Technology
University, Udaipur
17. College of Dairy & Food Science
Technology , Udaipur
Tamil
Nadu
Tamil Nadu Veterinary and
Animal Sciences University,
Chennai
18. PG Department, Chennai
Uttar
Pradesh
Allahabad Agricultural
university(AAU) Allahabad
19. College and Food and Dairy Technology
(AAI), Naini, Allahabad
Uttaranch
al
Govind Ballabh Pant University
of Agriculture and Technology
(GBPAUT), Pantnagar,
Uttaranchal
20. PG Department, Pantnagar
West
Bengal
West Bengal University of
Animal & Fishery Sciences,
Kolkata.
21. Faculty of Dairy Technology (WBUAFS),
Mohanpur, Kolkata.
IIT, Kharagpur 22. Dept of Agriculture & Food Engineering
* Gujarat government approved establishment of three more dairy science colleges in 2011–
one each under Kamadhenu University; Navasari Agriculture University and Junagarh
Agriculture University.
** Kamadhenu University is new university being established by Gujarat government in 2011
for veterinary, animal and dairy sciences.

354
Annexure-10.2
Students Admitted and Passed in Dairy Science Courses during 2009-10
Universities
Diploma UG PG PhD
Admit Pass Admit Pass Admit Pass Admit Pass
AAU, Allahabad 84 49
18 3 0 0
AAU, Anand
49 49 5 8 3 2
CSUAST, Kanpur
0 0 4 3 0 0
GADVASU, Ludhiana
26 NA 0 0 0 0
GBPUAT, Panthnagar
0 0 1 NA 0 0
IGKV, Raipur
42 25 1 3 0 0
KAU, Trissur
23 18 0 0 0 0
KVAFSU,Bidar
37 20 7 7 3 NA
MAFSU, Nagpur 31 12 64 39 0 0 0 0
MPUAT, Udaipur
53 53 0 0 0 0
NDRI, Karnal
47 NA 128 NA 83 21
RAU, Pusa
25 10 0 0 0 0
SKDAU,Dantiwada
45 NA 0 0 0 0
SVVU, Tirupathi
46 20 0 0 0 0
TANVASU, Chennai
0 0 4 2 1 2
UAS, Dharwad 6 6
WBUAFS, Belgachia 10 0 30 21 6 4 0 0
Grand Total 131 67 487 255 174 30 90 25
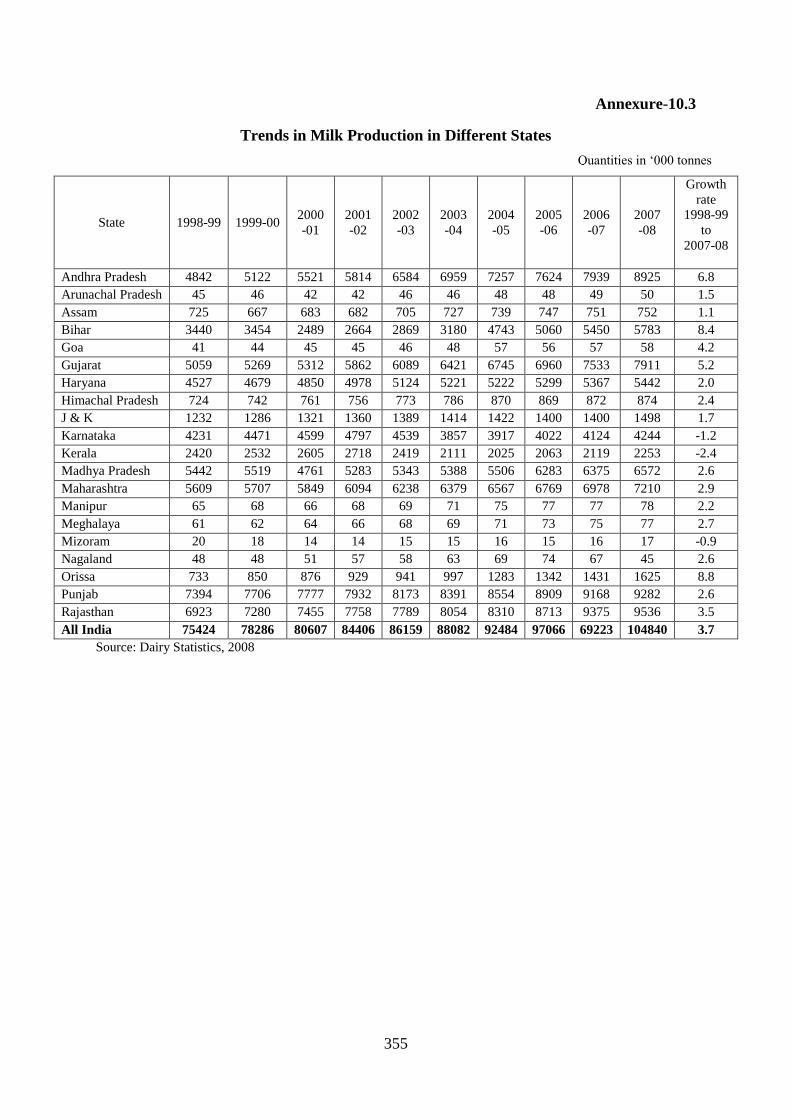
355
Annexure-10.3
Trends in Milk Production in Different States
State 1998-99 1999-00 2000
-01
2001
-02
2002
-03
2003
-04
2004
-05
2005
-06
2006
-07
2007
-08
Growth
rate
1998-99
to
2007-08
Andhra Pradesh 4842 5122 5521 5814 6584 6959 7257 7624 7939 8925 6.8
Arunachal Pradesh 45 46 42 42 46 46 48 48 49 50 1.5
Assam 725 667 683 682 705 727 739 747 751 752 1.1
Bihar 3440 3454 2489 2664 2869 3180 4743 5060 5450 5783 8.4
Goa 41 44 45 45 46 48 57 56 57 58 4.2
Gujarat 5059 5269 5312 5862 6089 6421 6745 6960 7533 7911 5.2
Haryana 4527 4679 4850 4978 5124 5221 5222 5299 5367 5442 2.0
Himachal Pradesh 724 742 761 756 773 786 870 869 872 874 2.4
J & K 1232 1286 1321 1360 1389 1414 1422 1400 1400 1498 1.7
Karnataka 4231 4471 4599 4797 4539 3857 3917 4022 4124 4244 -1.2
Kerala 2420 2532 2605 2718 2419 2111 2025 2063 2119 2253 -2.4
Madhya Pradesh 5442 5519 4761 5283 5343 5388 5506 6283 6375 6572 2.6
Maharashtra 5609 5707 5849 6094 6238 6379 6567 6769 6978 7210 2.9
Manipur 65 68 66 68 69 71 75 77 77 78 2.2
Meghalaya 61 62 64 66 68 69 71 73 75 77 2.7
Mizoram 20 18 14 14 15 15 16 15 16 17 -0.9
Nagaland 48 48 51 57 58 63 69 74 67 45 2.6
Orissa 733 850 876 929 941 997 1283 1342 1431 1625 8.8
Punjab 7394 7706 7777 7932 8173 8391 8554 8909 9168 9282 2.6
Rajasthan 6923 7280 7455 7758 7789 8054 8310 8713 9375 9536 3.5
All India 75424 78286 80607 84406 86159 88082 92484 97066 69223 104840 3.7
Source: Dairy Statistics, 2008
Quantities in ‘000 tonnes

356
Annexure-10.4
Number of Diary Plants Registered Under Mission Mode Projects (MMPO) Act, 1992
Year
No. of dairy plants Installed capacity (`000 litres per day)
Coopera
tive
sector
Private
sector Others Total
Cooperative
sector
Private
sector Others Total
1996 180 213 35 428 23392
(130)
19116
(90)
5575
(159)
48083
(112)
2004 232 468 48 748
32898
(142)
36774
(79)
11706
(244)
81378
(109)
2005 232 472 47 751
32898
(142)
39544
(84)
11706
(249)
84148
(112)
2006 246 493 50 789
36569.5
(149)
46085.3
(93)
15396
(308)
98051
(124)
2007 254 532 46 832
37335
(147)
49446
(93)
10221
(222)
97003
(117)
Source: Dairy Statistics for various years
Figures in brackets are the average processing capacities of the plants

357
Annexure-10.5
Projections of Milk Processed, No. of Dairy Plants up to 2020
Under 5% Growth alternative
Year
Milk
Production
In Million
Tonnes
(Annual)
with 5%
growth
%
Proce
ssed
Quantity
of milk
processe
d
Mill.
Ton.
(Annual)
Quantity
in
thousand
Litres per
day
Ave.Proce
ss
ing
Capacity
Thousand
Litres per
day
Capacity
Utilisati
on
%
No. of
Plants
2009-10 116 23.19 26.79 73399 124.62 0.64 926
2010-11 121 24.75 30.02 82255 127.15 0.67 963
2011-12 127 26.31 33.51 91814 129.69 0.71 1000
2012-13 134 27.87 37.27 102123 132.23 0.74 1038
2013-14 140 29.43 41.33 113233 134.77 0.78 1077
2014-15 147 30.99 45.70 125199 137.31 0.82 1117
2015-16 155 32.55 50.40 138079 139.85 0.85 1158
2016-17 163 34.11 55.46 151933 142.38 0.89 1200
2017-18 171 35.67 60.89 166828 144.92 0.90 1279
2018-19 179 37.23 66.73 182832 147.46 0.90 1378
2019-20 188 38.79 73.01 200020 150.00 0.90 1482
Annexure-10.6
Projections of Number of Dairy Plants and till 2020 under Alternative
Milk Production Scenarios
Year Projected No. of Dairy Plants in Organized
Sector under Milk Production Annual
Growth Rates of 4% 5% 6%
2009-10 917 926 935
2010-11 944 963 981
2011-12 971 1000 1028
2012-13 998 1038 1077
2013-14 1026 1077 1128
2014-15 1054 1117 1181
2015-16 1082 1158 1237
2016-17 1112 1200 1294
2017-18 1173 1279 1392
2018-19 1251 1378 1514
2019-20 1333 1482 1644

358
Annexure-10.7
Projected Stock of Dairy Science Personnel Required for Processing Sector up to 2020
Year Required Stock of Dairy Science Personnel at
4% growth 5% growth 6% growth Average of
the first two
scenarios 2009-10 23515 23750 23968 23633
2010-11 24400 24881 25348 24640
2011-12 25281 26027 26768 25654
2012-13 26163 27194 28235 26679
2013-14 27049 28385 29752 27717
2014-15 27942 29604 31325 28773
2015-16 28845 30855 32960 29850
2016-17 29761 32140 34660 30951
2017-18 30691 33464 36430 32077
2018-19 31997 35223 38711 33610
2019-20 33328 37041 41096 35184

359
Annexure-10.8
a. Required Stock of Dairy Personnel for Processing Plants (@5% growth)
Year Certificate Diploma UG PG PhD UG
&above
2009-10 4233 4708 13253 963 593 14809
2010-11 4435 4932 13884 1008 622 15514
2011-12 4639 5159 14524 1055 650 16229
2012-13 4847 5390 15175 1102 679 16957
2013-14 5059 5627 15840 1151 709 17699
2014-15 5277 5868 16520 1200 740 18460
2015-16 5499 6116 17218 1251 771 19239
2016-17 5729 6371 17935 1303 803 20041
2017-18 5964 6633 18673 1356 836 20866
2018-19 6278 6982 19655 1428 880 21963
2019-20 6602 7342 20670 1501 926 23096
b.Required Stock of Dairy Personnel for Processing Plants (@6% growth)
Year Certificate Diploma UG PG PhD UG
&above
2009-10 4233 4708 13253 963 593 14809
2010-11 4495 4999 14072 1022 630 15724
2011-12 4746 5279 14860 1079 665 16605
2012-13 5006 5568 15674 1139 702 17515
2013-14 5276 5867 16517 1200 740 18456
2014-15 5555 6177 17390 1263 779 19432
2015-16 5844 6500 18298 1329 819 20446
2016-17 6146 6835 19241 1398 862 21501
2017-18 6460 7184 20224 1469 906 22599
2018-19 6864 7634 21491 1561 962 24014
2019-20 7287 8104 22815 1657 1022 25493

360
Annexure-10.9
Required Stock of Dairy Personnel for Milk Procurement
by Level of Education
Year
No. of
villages
with bulk
chilling
plants and
testing
equipment
No. of
diploma/
certificate
holders
needed of
chilling/
testing
No. of
quality
testing
labs.
Personnel required in
the labs. Overall requirements
Degree Diploma/
certificate Degree
Diploma/
Certificate Total
2010-11 10,000 20,000 10 20 40 20 20,040 20,060
2011-12 50,000 1,00,000 20 40 80 40 1,00,080 1,00,120
2012-13 1,00,000 2,00,000 30 60 120 60 2,00,120 2,00,180
2013-14 1,25,000 2,50,000 40 80 160 80 2,50,160 2,50,240
2014-15 1,50,000 3,00,000 50 100 200 100 3,00,200 3,00,300
2015-16 1,75,000 3,50,000 60 120 240 120 3,50,240 3,50,360
2016-17 2,00,000 4,00,000 70 140 280 140 4,00,280 4,00,420
2017-18 2,50,000 5,00,000 80 160 320 160 5,00,320 5,00,480
2018-19 3,00,000 6,00,000 90 180 360 180 6,00,360 6,00,540
2019-20 3,00,000 6,00,000 100 200 400 200 6,00,400 6,00,600

361
Annexure-10.10
SAU’s Scientists and Faculty in Dairy Science Sector as on March 2010
SNo University Sanctioned In position Vacant
1 UAS,Bengaluru 7 1 6
2 AAU,Anand 71 34 37
3 UAS,Raichur 17 5 12
4 KAFSU,Bidar 74 22 52
5 WBUAFS,Kolkata 20 14 6
6 SKDAU,Dantiwada 82 49 33
7 UAS, Dharwad 3 2 1
8 GADVASU,Ludiana 15 9 6
9 KAU,Trissur 30 6 24
10 MPUAT,Udaipur 19 8 11
11 SVVU,Thirupathi 25 10 15
12 CCSHAU, Hissar 108 62 46
13 IGKVV,Raipur 60 41 19
14 MAFSU,Nagpur 34 18 16
Sub-total for 14 universities 565 281 284 Estimate for all 18 universities 726 361 365
Source : Project data
b. Projected Stock of Dairy Science Personnel Required for Research and Academic
Year PG PhD PG+PhD
2009-10 280 420 700
2010-11 328 492 820
2011-12 380 570 950
2012-13 432 648 1080
2013-14 484 726 1210
2014-15 536 804 1340
2015-16 588 882 1470
2016-17 640 960 1600
2017-18 692 1038 1730
2018-19 744 1116 1860
2019-20 800 1200 2000

362
Annexure-10.11
Stock of Dairy Science personnel
A. Projected Stock at Low growth
Year Diploma UG PG PhD UG & above
2009-10 4943 14813 1930 1064 17807
2010-11 26221 15544 2033 1169 18747
2011-12 110501 16284 2142 1281 19707
2012-13 215786 17036 2251 1394 20681
2013-14 268576 17802 2362 1507 21671
2014-15 321372 18585 2474 1621 22680
2015-16 374174 19386 2587 1736 23708
2016-17 426984 20207 2701 1851 24760
2017-18 532301 21051 2818 1968 25836
2018-19 637709 22150 2952 2096 27198
2019-20 638129 23331 3099 2232 28661
B. Projected Stock at High Growth
Year Diploma UG PG PhD UG &above
2009-10 4943 14813 1930 1064 17807
2010-11 26291 15741 2048 1178 18967
2011-12 110627 16638 2168 1297 20102
2012-13 215972 17561 2290 1417 21268
2013-14 268829 18513 2414 1539 22466
2014-15 321696 19499 2540 1662 23701
2015-16 374577 20520 2669 1786 24975
2016-17 427471 21579 2801 1913 26293
2017-18 532879 22679 2936 2041 27656
2018-19 638394 24077 3092 2182 29352
2019-20 638930 25583 3263 2333 31178
C. Projected Stock of Dairy Science Personnel (Average)
Year Diploma UG PG PhD UG &above
2009-10 4943 14813 1930 1064 17807
2010-11 26256 15643 2040 1174 18857
2011-12 110564 16461 2155 1289 19905
2012-13 215879 17298 2271 1406 20974
2013-14 268702 18158 2388 1523 22069
2014-15 321534 19042 2507 1641 23190
2015-16 374375 19953 2628 1761 24342
2016-17 427227 20893 2751 1882 25526
2017-18 532590 21865 2877 2004 26746
2018-19 638051 23114 3022 2139 28275
2019-20 638530 24457 3181 2282 29920
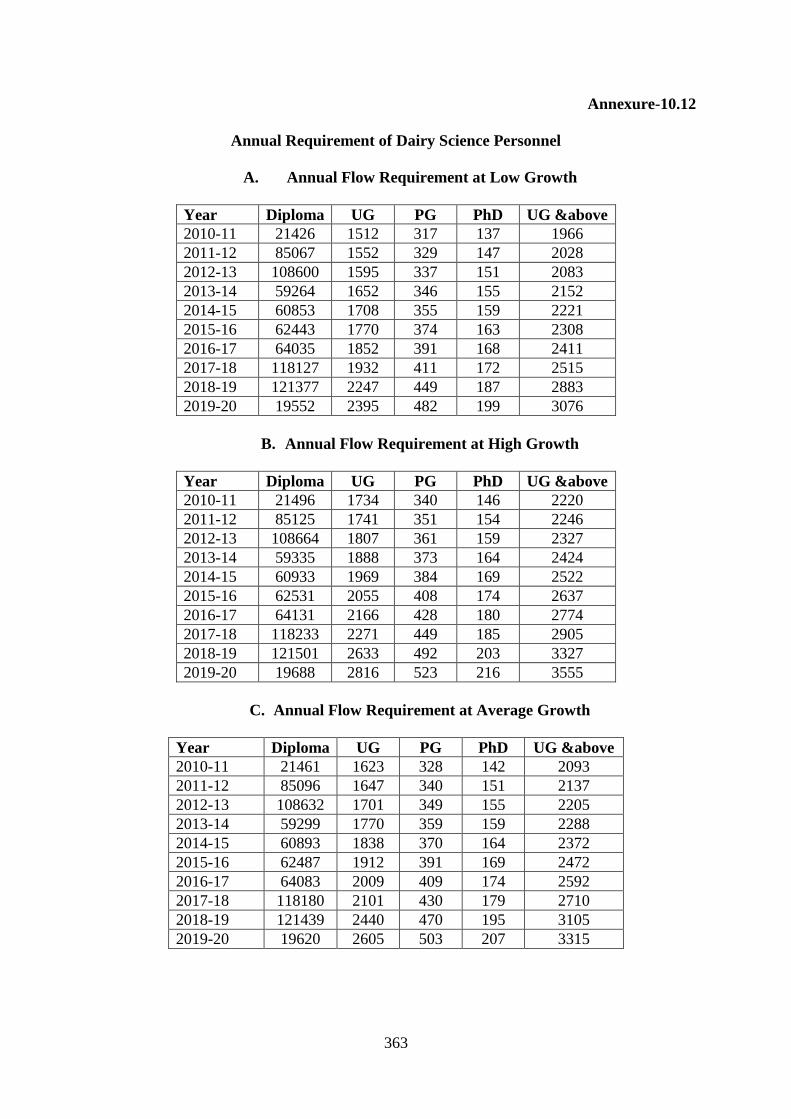
363
Annexure-10.12
Annual Requirement of Dairy Science Personnel
A. Annual Flow Requirement at Low Growth
Year Diploma UG PG PhD UG &above
2010-11 21426 1512 317 137 1966
2011-12 85067 1552 329 147 2028
2012-13 108600 1595 337 151 2083
2013-14 59264 1652 346 155 2152
2014-15 60853 1708 355 159 2221
2015-16 62443 1770 374 163 2308
2016-17 64035 1852 391 168 2411
2017-18 118127 1932 411 172 2515
2018-19 121377 2247 449 187 2883
2019-20 19552 2395 482 199 3076
B. Annual Flow Requirement at High Growth
Year Diploma UG PG PhD UG &above
2010-11 21496 1734 340 146 2220
2011-12 85125 1741 351 154 2246
2012-13 108664 1807 361 159 2327
2013-14 59335 1888 373 164 2424
2014-15 60933 1969 384 169 2522
2015-16 62531 2055 408 174 2637
2016-17 64131 2166 428 180 2774
2017-18 118233 2271 449 185 2905
2018-19 121501 2633 492 203 3327
2019-20 19688 2816 523 216 3555
C. Annual Flow Requirement at Average Growth
Year Diploma UG PG PhD UG &above
2010-11 21461 1623 328 142 2093
2011-12 85096 1647 340 151 2137
2012-13 108632 1701 349 155 2205
2013-14 59299 1770 359 159 2288
2014-15 60893 1838 370 164 2372
2015-16 62487 1912 391 169 2472
2016-17 64083 2009 409 174 2592
2017-18 118180 2101 430 179 2710
2018-19 121439 2440 470 195 3105
2019-20 19620 2605 503 207 3315

364
Annexures for Chapter - 11
Annexure-11.1
Agricultural Engineering Collegs In India
State University College/faculty
Andhra
Pradesh
Acharya N. G. Ranga
Agricultural University
(ANGRAU), Hyderabad
1. College of Agricultural Engineering
Bapatla, Guntur District
2. College of Agricultural Engineering,
Madkasira, Anantapur.
Bihar Rajendra Agricultural
University, Pusa Samastipura
3. College of Agricultural Engineering ,
Pusa, Samastipur
Chhattis-
garh
Indira Gandhi Krishi
Viswavidyalay, Raipur
4. College of Agricultural Engineering ,
Krishak Nagar, Raipur
Delhi IARI,New Delhi 5. PG School
Gujarat Anand Agricultural
University (AAU), Anand
6. College of Agricultural Engineering and
Technology, Godhra, Anand.
Junagadh Agricultural
University (JAU), Junagadh
Gujarat 362001.
7. College of Agricultural Engineering and
Technology Junagadh
Haryana
Ch Charan Singh Haryana
Agricultural University
(HAU) Hisar, 125004
8. Agricultural Engineering and
Technology, Hisar, Haryana
Jammu&k
ashmir
Sher-e-Kashmir University
of Agricultural Sciences &
Tech. (SKUAST-K),
9. Division of Agriculture Engineering,
Main Campus, Shalimar (SKUAST-K)
Jarkhand BAU, Ranchi 10. Faculty of Agricultural Engineering
Karnataka University of Agricultural
Sciences, (UAS-R), Raichur
11. College of Agricultural Engineering
(UAS-R), Raichur Dist, Raichur
University of Agricultural
Sciences, (UAS-B), Banglore
12. College of Agricultural
Engineering,GKVK
University of Agricultural
Sciences, (UAS-D),
Dharwad
13. College of Agricultural engineering,
Dharwad
Kerala Kerala Agricultural
University (KAU), Kerala.
14. Kelappaji College of Agricultural
Engineering and Technology (KAU),
Tavanur .
Madhya
pradesh
Jawaharlal Nehru Krishi
Vishwa Vidyalaya (JNKVV)
Jabalpur
15. College of Agricultural Engineering ,
Krishinagar, Jabalpur
Maha-
rashtra
Dr. Balasaheb Sawant
Konkan Krishi Vidyapeeth
,(BSKKV) Dapoli, 415712
16. College of Agricultural Engineering and
Technology, Dapoli,Rarnagiri.
17. Dr. Budhajirao Mulik College of
Engineering and Technology ( KKV),
Mandki-Palvan. Tal-Chiplun, Dist-
Ratnagiri.**

365
Marathwada Agricultural
University, (MAU), Parbhani
18. College of Agri. Engineering &
Technology, Parbhani
19. Aditya College of Agricultural
Engineering, ( MAU), Beed **
Mahatma Phule Krishi
Vidyapeeth, (MPKV),
Rahuri 413722, Ahmednagar
20. Dr. Annasaheb Shinde College of Agri.
Engineering, District Ahmednagar*
21. Dr Ulhas Patil College of Agricultural
Engineering, Jalgaon.**
22. Padmashri Dr D.Y. Pawar College of
Agricultural Engineering, (MPKV),
Talsande, Tal Hatkanangale, Dist
Kolhapur **
23. Karmveer Kakasaheb Wagh College of
Agricultural Engineering, ( MPKV),
Panchavati, Nasik.**
Dr Punjabrao Deshmukh
Krishi Vidyapeeth (PDKV),
Akola, Maharashtra.
24. College of Agricultural Engineering and
Technology, Akola.
25. College of Agri. Engineering, Jalgaon
Jamod, District Buldhana 443 402*
Mizoram Central Agricultural
University, Imphal
26. College of Agricultural Engineering
(CAU), Gangtok, Sikkim
Orissa Orissa University of
Agriculture & Technology,
Bhubaneswar
27. College of Agricultural Engineering and
Technology, Bhubaneswar
28. College of Engineering & Technology,
Fisheries, (OUAT), Bhubaneswar–
751003
Punjab Punjab Agricultural
University, (PAU),
Ludhiana, Punjab 141004
29. College of Agricultural Engineering ,
Ferozepur Road, Ludhiana
Rajasthan Maharana Pratap Agriculture
and Technology University,
Udaipur
30. College of Agricultural Technology &
Engineering , Udaipur
Tamil
Nadu
Tamil Nadu Agricultural
University (TNAU),
Coimbatore, Tamil Nadu
641003
31. College of Agricultural Engineering ,
Coimbatore,.
32. Agricultural Engineering College and
Research Institute (TNAU), Kumulur,
Pallapuram , Trichy Dist
Uttar
Pradesh
Chandra Shekhar Azad
University of Agriculture &
Technology (CSAUT)
Kanpur, Uttar Pradesh
208002
33. College of Engineering (CSAUAT),
Etawah, Uttar Pradesh
Allahabad Agricultural
university(AAU) Allahabad
34. College of Agricultural Engineering &
Technology (AAI), Naini, Allahabad
Narendra Deva University of
Agriculture and Technology
Kumarganj – Faizabad
35. College of Agricultural Engineering,
Faizabad
SVBPUAT,MEERUT 36. Faculty of Agricultural Engineering

366
Uttaranchal Govind Ballabh Pant
University of Agriculture
and Technology (GBPAUT),
Pantnagar, Uttaranchal
37. College of Technology, Pantnagar,
Uttaranchal
West
Bengal
Bidhan Chandra Krishi
Vishva Vidyalaya (BCKVV)
Nadia,West Bengal 741246
38. Faculty of Agriculture Engineering,
Mohanpur
UBKVV, Coochbehar 39. Faculty of Agricultural Engineering
IIT, Kharragpur*** 40. Dept of Agriculture & Food Engineering
* Private colleges affiliated to respective SAUs
** New private affiliated colleges being established in 2011
*** Central Institution
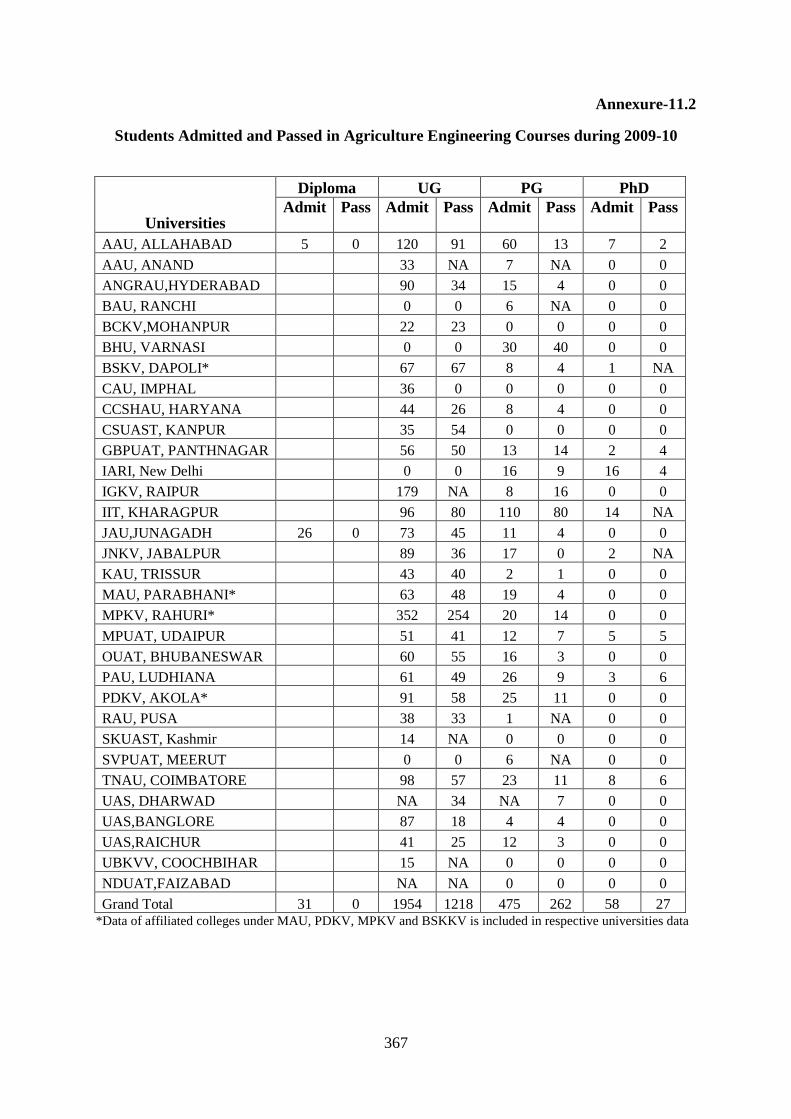
367
Annexure-11.2
Students Admitted and Passed in Agriculture Engineering Courses during 2009-10
Universities
Diploma UG PG PhD
Admit Pass Admit Pass Admit Pass Admit Pass
AAU, ALLAHABAD 5 0 120 91 60 13 7 2
AAU, ANAND
33 NA 7 NA 0 0
ANGRAU,HYDERABAD
90 34 15 4 0 0
BAU, RANCHI
0 0 6 NA 0 0
BCKV,MOHANPUR
22 23 0 0 0 0
BHU, VARNASI
0 0 30 40 0 0
BSKV, DAPOLI*
67 67 8 4 1 NA
CAU, IMPHAL
36 0 0 0 0 0
CCSHAU, HARYANA
44 26 8 4 0 0
CSUAST, KANPUR
35 54 0 0 0 0
GBPUAT, PANTHNAGAR
56 50 13 14 2 4
IARI, New Delhi
0 0 16 9 16 4
IGKV, RAIPUR
179 NA 8 16 0 0
IIT, KHARAGPUR
96 80 110 80 14 NA
JAU,JUNAGADH 26 0 73 45 11 4 0 0
JNKV, JABALPUR
89 36 17 0 2 NA
KAU, TRISSUR
43 40 2 1 0 0
MAU, PARABHANI*
63 48 19 4 0 0
MPKV, RAHURI*
352 254 20 14 0 0
MPUAT, UDAIPUR
51 41 12 7 5 5
OUAT, BHUBANESWAR
60 55 16 3 0 0
PAU, LUDHIANA
61 49 26 9 3 6
PDKV, AKOLA*
91 58 25 11 0 0
RAU, PUSA
38 33 1 NA 0 0
SKUAST, Kashmir
14 NA 0 0 0 0
SVPUAT, MEERUT
0 0 6 NA 0 0
TNAU, COIMBATORE
98 57 23 11 8 6
UAS, DHARWAD
NA 34 NA 7 0 0
UAS,BANGLORE
87 18 4 4 0 0
UAS,RAICHUR
41 25 12 3 0 0
UBKVV, COOCHBIHAR
15 NA 0 0 0 0
NDUAT,FAIZABAD
NA NA 0 0 0 0
Grand Total 31 0 1954 1218 475 262 58 27 *Data of affiliated colleges under MAU, PDKV, MPKV and BSKKV is included in respective universities data

368
Annexure-11.3
Agricultural Engineering Manpower in Some State Governments 2009-10
Sl.No. State Total number in
position
Total
districts
Average number
in position per
district
1. Tamil Nadu
(Agricultural
Engineering
Department,
Government of Tamil
Nadu)
184 32 6.1
2. Madhya Pradesh (Soil
Conservation in
Department of Farmer
Welfare &Agriculture
Development,
Government of
Madhya Pradesh)
171 50 3.4
3. Jammu (Soil
Conservation in
Department of
Agriculture, Jammu)
56 10 5.6

369
Annexure-11.4
a) Requirements of Agriculture Engineering Manpower in
State Government (Low Growth)
Year Certificate Diploma UG PG PhD
2009-10 154 305 1755 534 154
2010-11 156 309 1781 542 156
2011-12 158 314 1807 550 158
2012-13 161 318 1833 558 161
2013-14 163 323 1859 565 163
2014-15 165 327 1885 573 165
2015-16 167 332 1911 581 167
2016-17 170 336 1937 589 170
2017-18 172 341 1963 597 172
2018-19 174 345 1989 605 174
2019-20 177 350 2015 613 177
b) Requirements of Agriculture Engineering Manpower in
State Government (High Growth)
Year Certificate Diploma UG PG PhD
2009-10 154 305 1755 534 154
2010-11 161 318 1833 558 161
2011-12 165 327 1885 573 165
2012-13 170 336 1937 589 170
2013-14 174 345 1989 605 174
2014-15 179 354 2041 621 179
2015-16 183 363 2093 637 183
2016-17 188 372 2145 652 188
2017-18 192 381 2197 668 192
2018-19 197 390 2249 684 197
2019-20 202 399 2301 700 202
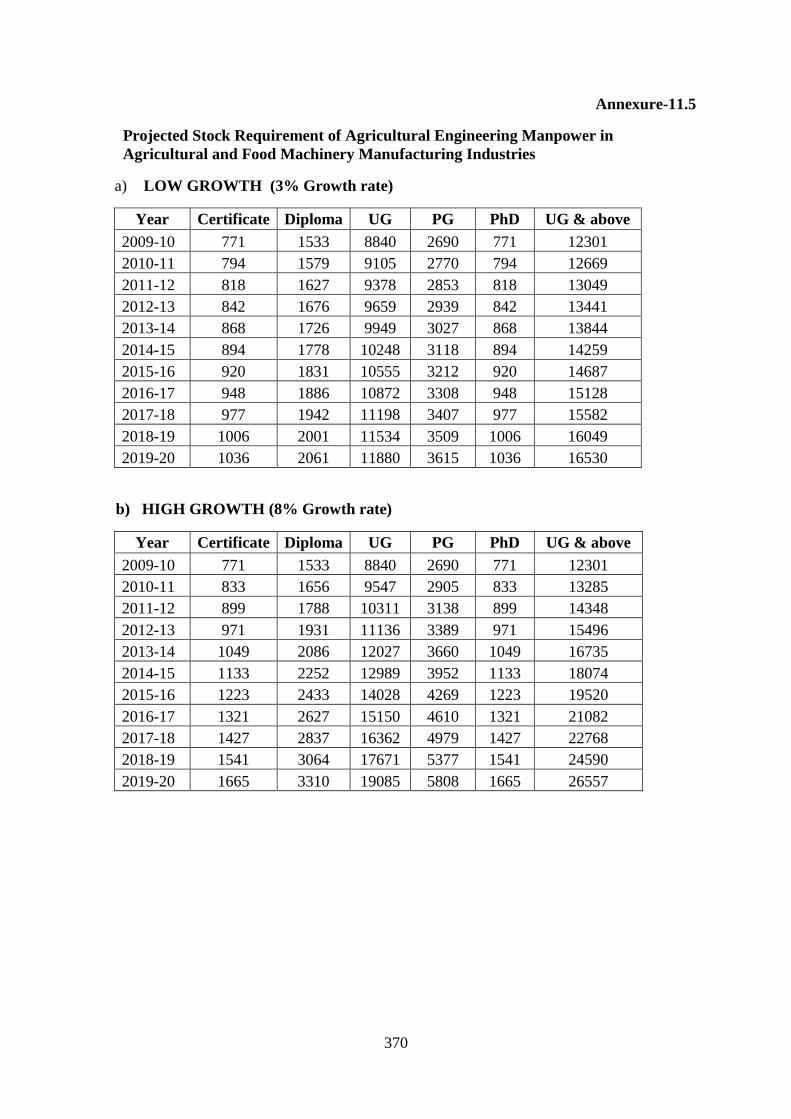
370
Annexure-11.5
Projected Stock Requirement of Agricultural Engineering Manpower in
Agricultural and Food Machinery Manufacturing Industries
a) LOW GROWTH (3% Growth rate)
Year Certificate Diploma UG PG PhD UG & above
2009-10 771 1533 8840 2690 771 12301
2010-11 794 1579 9105 2770 794 12669
2011-12 818 1627 9378 2853 818 13049
2012-13 842 1676 9659 2939 842 13441
2013-14 868 1726 9949 3027 868 13844
2014-15 894 1778 10248 3118 894 14259
2015-16 920 1831 10555 3212 920 14687
2016-17 948 1886 10872 3308 948 15128
2017-18 977 1942 11198 3407 977 15582
2018-19 1006 2001 11534 3509 1006 16049
2019-20 1036 2061 11880 3615 1036 16530
b) HIGH GROWTH (8% Growth rate)
Year Certificate Diploma UG PG PhD UG & above
2009-10 771 1533 8840 2690 771 12301
2010-11 833 1656 9547 2905 833 13285
2011-12 899 1788 10311 3138 899 14348
2012-13 971 1931 11136 3389 971 15496
2013-14 1049 2086 12027 3660 1049 16735
2014-15 1133 2252 12989 3952 1133 18074
2015-16 1223 2433 14028 4269 1223 19520
2016-17 1321 2627 15150 4610 1321 21082
2017-18 1427 2837 16362 4979 1427 22768
2018-19 1541 3064 17671 5377 1541 24590
2019-20 1665 3310 19085 5808 1665 26557

371
Annexure-11.6
Faculty in Agricultural Engineering Education, 2009-10
Sl No University Sanctioned In
position Vacant
1 UAS,Banglore 39 14 25
2 JAU,Junagadh 51 33 18
3 UAS,Raichur 62 23 39
4 ANGRAU,Hyderabad 19 8 11
5 BCKV,Mohanpur 16 13 3
6 UBKV,Coochbehar 23 3 20
7 TNAU,Coiambatore 82 69 13
8 UAS, Dharwad 26 13 13
9 BSKKV,Dapoli 36 32 4
10 CSUAST,Kanpur 24 14 10
11 OUAT,Bhubaneshwar 17 15 2
12 KAU,Kerala 51 34 17
13 JNKVV,Jabalpur 52 26 26
14 MPUAT,Udaipur 34 13 21
15 CCSHAU, Hissar 37 18 19
16 IGKVV,Raipur 15 8 7
17 GBPUAT, Panthnagar 149 80 69
18 PAU, Ludhiana 147 75 72
19 AAU, Allahabad 39 35 4
20 RAU, Pusa 21 10 11
21 AAU, Anand 39 18 21
22 IIT, Kharahgpur NA 38 NA
23 Affiliated colleges of MAU NA 20
24 Affiliated colleges of MPKV NA 19
Estimate for all colleges 1200 700 500

372
Annexure -11.7
Requirements of Agriculture Engineering Manpower in Teaching
Year PG PhD Total
2009-10* 131 523 654
2010-11 134 535 668
2011-12 136 546 682
2012-13 139 557 697
2013-14 142 569 711
2014-15 145 580 725
2015-16 148 591 739
2016-17 151 603 753
2017-18 154 614 768
2018-19 156 625 782
2019-20 159 637 796
PG/PhD Ratio 0.2 0.8
Annexure-11.8
Requirements of Agriculture Engineering Manpower in Research*
Year PG PhD Total
2009-10 100 400 500
2010-11 101 404 505
2011-12 102 408 510
2012-13 103 412 515
2013-14 104 416 520
2014-15 105 420 526
2015-16 106 425 531
2016-17 107 429 536
2017-18 108 433 541
2018-19 109 437 547
2019-20 110 442 552
PG/PhD Ratio 0.2 0.8 * Includes 365 in ICAR and 135 in other institutions

373
Annexure-11.9
a: Overall Stock Projections for Agri-engineering Human Resources (Low Growth)
Year Certificate Diploma UG PG PhD UG & above
2009-10 1017 2022 11654 3801 2033 17488
2010-11 1045 2077 11975 3901 2077 17953
2011-12 1074 2134 12304 4006 2123 18432
2012-13 1103 2193 12642 4113 2170 18924
2013-14 1134 2253 12989 4223 2217 19429
2014-15 1165 2315 13346 4336 2265 19947
2015-16 1197 2379 13713 4451 2314 20479
2016-17 1230 2444 14090 4570 2364 21025
2017-18 1263 2511 14477 4693 2415 21585
2018-19 1298 2580 14875 4818 2467 22161
2019-20 1334 2651 15285 4947 2520 22752
b: Overall Stock Projections for Agri-engineering Human Resources (High Growth)
Year Certificate Diploma UG PG PhD UG & above
2009-10 1018 2022 11655 3800 2033 18685
2010-11 1093 2171 12518 4067 2125 18710
2011-12 1171 2327 13416 4344 2220 19980
2012-13 1255 2494 14380 4642 2321 21344
2013-14 1346 2674 15418 4962 2429 22808
2014-15 1443 2867 16533 5306 2543 24382
2015-16 1548 3076 17733 5675 2665 26074
2016-17 1660 3300 19025 6073 2795 27893
2017-18 1782 3541 20416 6500 2933 29849
2018-19 1912 3800 21913 6960 3081 31954
2019-20 2053 4080 23525 7455 3239 34219
c: Overall Stock Projections for Agri-engineering Human Resources
(Average Growth)
Year Certificate Diploma UG PG PhD UG & above
2009-10 1017 2022 11654 3800 2033 18086
2010-11 1069 2124 12247 3984 2101 18332
2011-12 1122 2231 12860 4175 2172 19206
2012-13 1179 2344 13511 4377 2245 20134
2013-14 1240 2464 14203 4592 2323 21119
2014-15 1304 2591 14940 4821 2404 22165
2015-16 1372 2727 15723 5063 2490 23276
2016-17 1445 2872 16557 5322 2580 24459
2017-18 1522 3026 17446 5596 2674 25717
2018-19 1605 3190 18394 5889 2774 27057
2019-20 1693 3366 19405 6201 2880 28485

374
Annexure-11.10
a: Flow Projections for Agri-engineering Human Resources (Low Growth)
Year Diploma UG PG PhD UG & above
2010-11 116 1020 332 106 1458
2011-12 119 1047 341 108 1496
2012-13 123 1074 350 110 1534
2013-14 126 1103 358 112 1573
2014-15 130 1132 367 115 1614
2015-16 133 1162 376 117 1656
2016-17 137 1194 385 119 1698
2017-18 141 1225 395 122 1743
2018-19 144 1257 405 124 1787
2019-20 148 1290 415 127 1833
b:Flow Projections for Agri-engineering Human Resources (High Growth)
Year Diploma UG PG PhD UG & above
2010-11 210 1840 558 153 2551
2011-12 221 1942 587 159 2687
2012-13 237 2082 626 168 2876
2013-14 255 2233 669 177 3079
2014-15 274 2396 715 187 3298
2015-16 294 2572 765 198 3534
2016-17 316 2761 818 210 3788
2017-18 340 2963 876 222 4061
2018-19 366 3183 937 236 4355
2019-20 394 3428 1002 250 4680
c: Flow Projections for Agri-engineering Human Resources (Average Growth)
Year Diploma UG PG PhD UG & above
2010-11 163 1430 445 129 2004
2011-12 170 1494 464 133 2092
2012-13 180 1578 488 139 2205
2013-14 190 1668 514 145 2326
2014-15 202 1764 541 151 2456
2015-16 214 1867 570 158 2595
2016-17 227 1977 602 165 2743
2017-18 240 2094 635 172 2902
2018-19 255 2220 671 180 3071
2019-20 271 2359 709 189 3256

375
Annexures for Chapter - 12
Annexure-12.1
Details of Various PG Courses in Biotechnology
Post Graduate Courses
Number of
Universities
Imparting Courses
Intake
(2009-10)
M.Sc Agricultural Biotechnology,
M.Tech Biotechnology,
M.Sc. Marine Biotechnology,
M.Sc. Neuro Sciences,
M.V.Sc. Animal Biotechnology,
M.Sc. Molecular and Human Genetics,
M.Sc. Medical Biotechnology,
M.Sc. Environmental Biotechnology,
M.Sc. Industrial Biotechnology,
M.Tech. Pharma Biotechnology,
M.Sc. Plant Biotechnology,
M.Tech. Marine Biotechnology,
M.Sc. General Biotechnology
34 457
Source: Department of Biotechnology, Annual Report, 2006 and ICAR, 2009-10

376
Annexure-12.2
Students Admitted and Passed in Agri-Biotechnology Courses during 2009-10
Universities
Diploma UG PG PhD
Admit Pass Admit Pass Admit Pass Admit Pass
AAU, Allahabad NA NA 250 359 0 0 11 4
AAU, Anand NA NA 0 0 7 3 0 0
ANGRAU,Hyderabad NA NA 0 0 25 22 0 0
BAU, Ranchi NA NA 0 0 12 10 0 0
BCKV,Mohanpur NA NA 0 0 0 0 2 NA
BHU, Varnasi NA NA 0 0 8 6 0 0
CCSHAU, Hissar NA NA 0 0 0 12 NA 1
CSKHPKV, Palampur NA NA 0 0 6 3 0 0
CSUAST, Kanpur NA NA 0 0 5 5 0 0
IARI, New Delhi NA NA 0 0 5 3 12 6
IGKV, Raipur NA NA 0 0 11 1 2 1
JAU,Junagadh NA NA 0 0 10 6 2 NA
JNKV, Jabalpur NA NA 0 0 8 3 0 0
MAU, Parabhani NA NA 33 20 0 0 0 0
MPKV, Rahuri NA NA 96 83 26 22 0 0
MPUAT, Udaipur NA NA 0 0 NA NA 0 0
NDRI, Karnal NA NA 0 0 0 0 NA 5
PDKV, Akola NA NA 34 62 0 0 0 0
PDKV, Akola (affiliated) NA NA
0 0 0 0
RAU, Pusa NA NA 25 NA 0 0 0 0
SKDAU,Dantiwada NA NA 0 0 NA NA 0 0
SKRAU, Bikanir NA NA 0 0 7 4 0 0
SVPUAT, Meerut NA NA 64 NA 21
0 0
TANVASU, Chennai NA NA 0 0 8 3 0 0
TNAU, Coimbatore NA NA 58 34 21 23 0 0
UAS, Dharwad NA NA 0 0 NA 15 1 1
UAS,Bengaluru NA NA 32 0 NA NA 0 0
YSPUHF, Solan NA NA 0 0 15 15 5 2
Grand Total
592 558 195 156 35 20
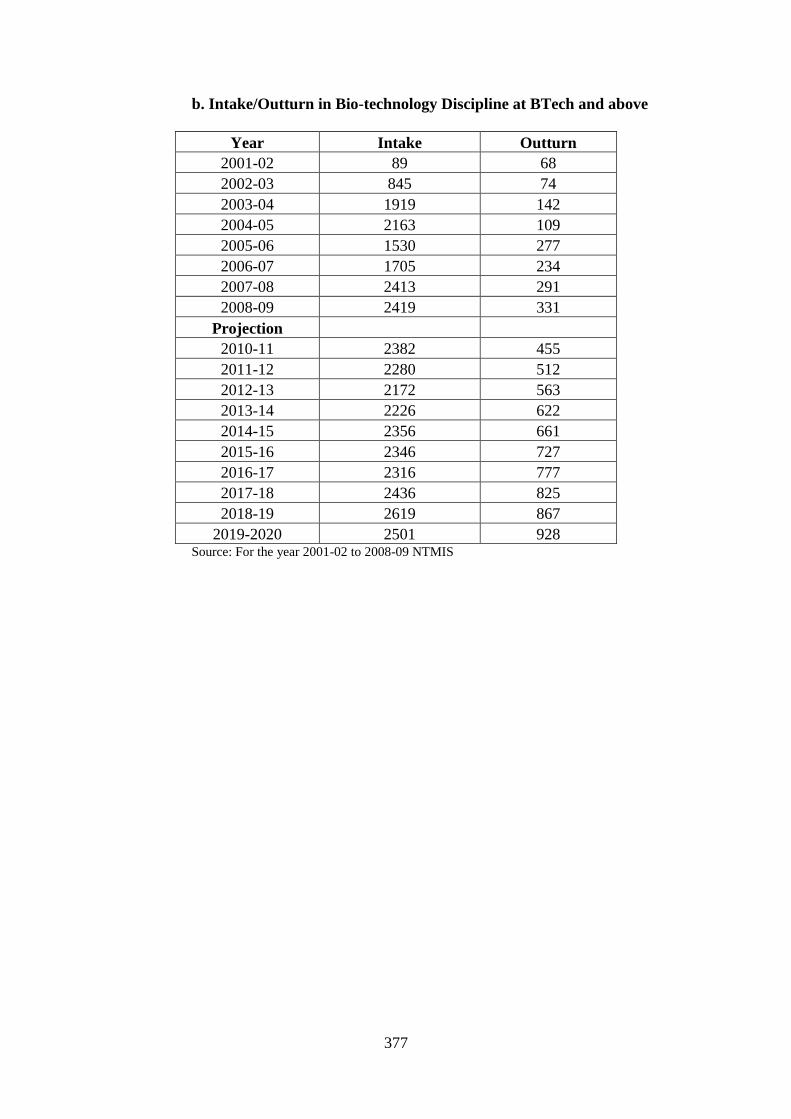
377
b. Intake/Outturn in Bio-technology Discipline at BTech and above
Year Intake Outturn
2001-02 89 68
2002-03 845 74
2003-04 1919 142
2004-05 2163 109
2005-06 1530 277
2006-07 1705 234
2007-08 2413 291
2008-09 2419 331
Projection
2010-11 2382 455
2011-12 2280 512
2012-13 2172 563
2013-14 2226 622
2014-15 2356 661
2015-16 2346 727
2016-17 2316 777
2017-18 2436 825
2018-19 2619 867
2019-2020 2501 928 Source: For the year 2001-02 to 2008-09 NTMIS

378
Annexure-12.3
Institutions Employing Bio-tech Researchers
Sl.No Institute(s) No of bio-tech. Professionals Deployed
1 DBT Institute 52
2 CSIR 54
3 National Institutes 119
4 General Universities 30
5 Agriculture Universities 19
6 Medical Colleges 16
7 ICMR Institute 10
8 IITs 10
9 DST Institutes 9
10 Others 5
Total 324 Source: DBT Annual Report 2008
Annexure-12.4
Projected Growth of Demand for Bio-technologists in Industry
Year
Demand for bio-technologists
All bio-technologists @growth of Agri-biotechnologists @growth of
20% 10% 15% 20% 10% 15%
2006-07 6892 6892 6892 1034 1034 1034
2007-08 8270 7581 7926 1241 1137 1189
2008-09 9924 8339 9115 1489 1251 1367
2009-10 11909 9173 10482 1787 1376 1573
2010-11 14291 10091 12054 2144 1514 1808
2011-12 17150 11100 13862 2573 1665 2080
2012-13 20579 12210 15942 3088 1832 2392
2013-14 24695 13431 18333 3705 2015 2750
2014-15 29634 14774 21083 4446 2216 3163
2015-16 35561 16251 24245 5335 2438 3637
2016-17 42673 17876 27882 6402 2682 4183
2017-18 51208 19664 32064 7683 2950 4811
2018-19 61450 21630 36874 9219 3245 5532
2019-20 73740 23793 42405 11063 3570 6362 Source: Base year (2006-07) data taken from survey conducted by Bio-spectrum in 2007

379
Annexure-12.5
Projected Demand of Biotechnologists for Developmental Programmes
Year UG
PG PhD Total
2009-10 - 10 90 100
2010-11 - 11 99 110
2011-12 - 12 108 120
2012-13 - 13 117 130
2013-14 - 14 126 140
2014-15 - 15 135 150
2015-16 - 16 144 160
2016-17 - 17 153 170
2017-18 - 18 162 180
2018-19 - 19 171 190
2019-20 - 20 180 200
Annexure-12.6
Projected Demand for Biotechnologists for Agri- Biotech Research
Year UG
PG PhD Total
2009-10 - 30 270 300
2010-11 - 32 288 320
2011-12 - 34 306 340
2012-13 - 36 324 360
2013-14 - 38 342 380
2014-15 - 40 360 400
2015-16 - 42 378 420
2016-17 - 44 396 440
2017-18 - 46 414 460
2018-19 - 48 432 480
2019-20 - 50 450 500

380
Annexure-12.7
DBT Initiatives on Tissue Culture
The DBT, Ministry of Science & Technology, Govt. of India has announced various targets
for the tissue culture industry and some of them are:
Developing complete packages for improvement of priority crops - coffee, tea,
apple, spices,
Continued large scale production of forest tree species,
Development and use of micro propagation for multiplication of root stocks and
scions in selected varieties of fruit crops like mango and hairy root culture for
production of secondary metabolites in general and those relevant to food industry,
Promoting application of tissue culture technology at grass root level and its
adoption by the end user,
Utilization of tissue culture for enrichment of genetic diversity, and
Genetic manipulation of cell culture in forestry for disease resistance and reduction
of regeneration time.
The plants in each category which are commercially propagated are as follows:
SNo Plant category Plants
1 Fruits Banana, Pineapple, Strawberry,
2 Cash crops Sugarcane, Potato
3 Spices Turmeric, Ginger, Vanilla, Large cardamom,
Small Cardamom
4 Medicinal plants Aloevera, Geranium, Stevia, Patchouli, Neem
5 Ornamentals Gerbera, Carnation, Anthurium, Lily,
Syngonium, Cymbidium
6 Woody plants Teak, Bamboo, Eucalyptus, Populus
7 Bio fuel Jatropha, Pongamia Source: BCIL & DBT, Govt. Of India, 2008
Plan Expenditure under the DBT in Crop Biotechnology (Rs. in Lakhs)
Scheme 8th
Plan
1992-1997
9th
Plan
1997-2002
10th
plan
2002-2007
11th
Plan
2007-2012
Crop Biotechnology 1916 2897 7500 25000
Approximate Share of
Horticulture biotechnology
575 870 2250 5500
Source: Working Group on Horticulture, Plantation Crop and Organic Farming, planning Commission, GOI.

381
Annexure-12.8
Number of Registered TCP units in the Country
1. A.G. Bioteck Laboratories
(India) Ltd., Hyderabad
2. Anantha Biotechnologies,
Ananthapur
3. ACE Agro Technologies,
Secunderabad
4. Agri Vitro Tech
Laboratories, Secunderabad
5. BrookFileds Biotech Pvt.
Ltd., Kadapa
6. S & S Agro Biotech Pvt.
Ltd., Secunderabad
7. Godrej Agrovet Ltd.(Plant
Biotech Division), R.R.
District
8. Sai Lara Biotechnologies,
Hyderabad
9. Phytica Biotech Pvt. Ltd.,
Medak District
10. Devleela Biotechs,
Raipur
11. Aditya Biotech Lab &
Research Pvt Ltd., Raipur
12. Shaili Biotech (P) Ltd.,
Ahmedabad
13. Cadila Pharmaceuticals
Ltd.(Agro Division),
Ahmedabad
14. Arcadia Agro, Mogar
Anand
15. Sarjan Biotech Pvt. Ltd.,
Bhuj-Kutch
16. Technico Agri Sciences
Ltd., Chandigarh
17. Micropropagation
Technology Park (TERI)
New Delhi
18. Sheel Biotech Ltd.,
Gurgaon
19. Shri Ramco Biotech,
Bangalore
20. Greenearth
Biotechnologies Ltd.,
Bangalore
21. MSR Biotech Pvt. Ltd.,
Bangalore
22. K.F. Biotech Pvt Ltd.,
Bangalore
23. Lakshmi Biotech,
Bangalore
24. Labland Biotech Pvt Ltd.,
Mysore
25. L.J. International Ltd.
(AVT), Kochi
26. K.F. Bioplants Pvt. Ltd.,
Pune
27. Reliance Life Sciences
Pvt. Ltd., Mumbai
28. Ajeet Seeds Ltd.
Aurangabad
29. Rise N Shine Biotech
Pvt. Ltd., Pune
30. Gargi Bioteck Pvt. Ltd.,
Pune
31. Seema Biotech, Kolhapur
32. H.U Gugle Agro Biotech
Co., Ahmadnagar
33. Nirmeeet Biotech, Pune
34. Jain Irrigation Systems
Ltd. Jalgaon
35. Growmore Bioteh Ltd.,
Hosur
36. SPIC Agro Biotech
Centre, Coimbatore
37. Tissue Culture Facility,
Biotech Park, Lucknow
38. Aryave Biotech Pvt. Ltd.,
Haridwar
39. Vedic Synergy
Biotechnologies Ltd.,
Durgapur
40. Elegant Flower Company
Pvt. Ltd., Kolkata
41. Boinchi Bioplants Pvt.
Ltd., Boinchi
42. Vasantdada Sugar
Institue, Pune
43. Futura Bioplants Pvt.
Ltd., Pune
44. Neesa Agritech Pvt. Ltd.
Ahmedabad
45. PepsiCo India Holdings
Pvt. Ltd. Hoshiarpur
Source: DBT, Ministry of S & T, Govt. of India
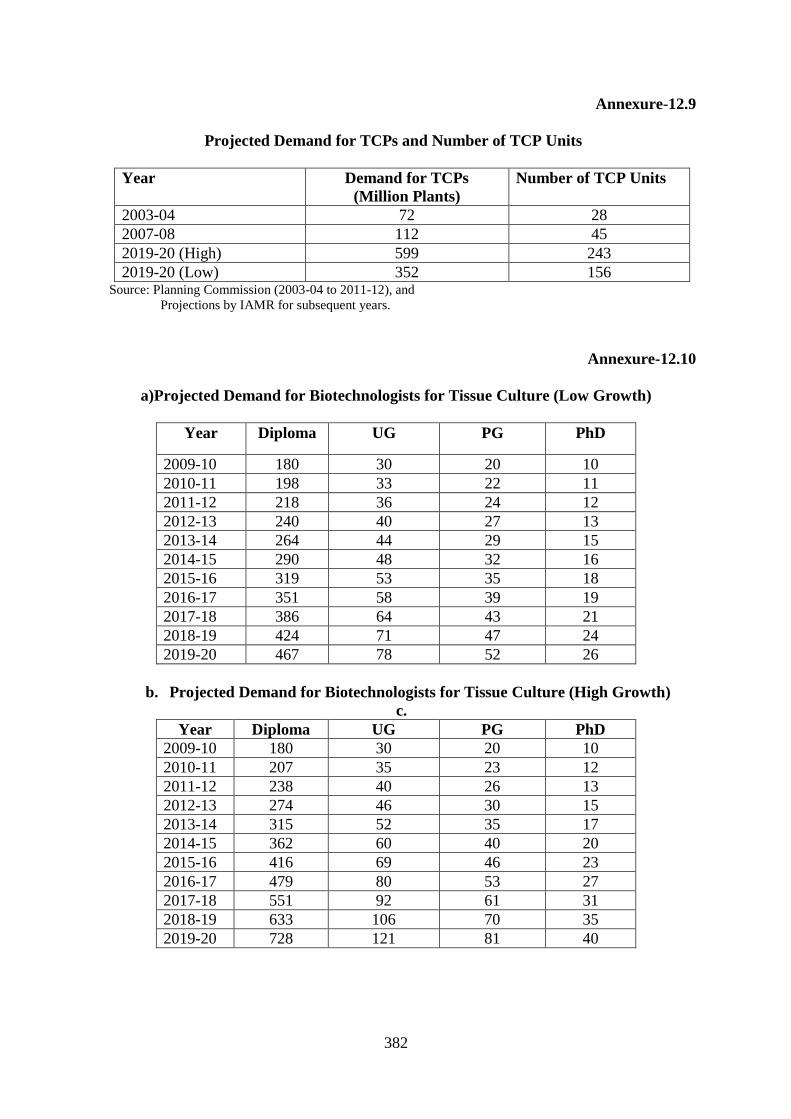
382
Annexure-12.9
Projected Demand for TCPs and Number of TCP Units
Year Demand for TCPs
(Million Plants)
Number of TCP Units
2003-04 72 28
2007-08 112 45
2019-20 (High) 599 243
2019-20 (Low) 352 156 Source: Planning Commission (2003-04 to 2011-12), and
Projections by IAMR for subsequent years.
Annexure-12.10
a)Projected Demand for Biotechnologists for Tissue Culture (Low Growth)
Year Diploma UG PG PhD
2009-10 180 30 20 10
2010-11 198 33 22 11
2011-12 218 36 24 12
2012-13 240 40 27 13
2013-14 264 44 29 15
2014-15 290 48 32 16
2015-16 319 53 35 18
2016-17 351 58 39 19
2017-18 386 64 43 21
2018-19 424 71 47 24
2019-20 467 78 52 26
b. Projected Demand for Biotechnologists for Tissue Culture (High Growth)
c.
Year Diploma UG PG PhD
2009-10 180 30 20 10
2010-11 207 35 23 12
2011-12 238 40 26 13
2012-13 274 46 30 15
2013-14 315 52 35 17
2014-15 362 60 40 20
2015-16 416 69 46 23
2016-17 479 80 53 27
2017-18 551 92 61 31
2018-19 633 106 70 35
2019-20 728 121 81 40

383
Annexure-12.11
Projected Demand for Biotechnologists for Seed Sector (Low Growth)
Year Diploma UG PG PhD
2009-10 175 790 560 275
2010-11 184 830 588 288
2011-12 193 871 617 303
2012-13 203 915 648 318
2013-14 213 960 681 334
2014-15 223 1008 715 350
2015-16 235 1059 750 368
2016-17 246 1112 788 386
2017-18 259 1167 827 406
2018-19 271 1226 869 426
2019-20 285 1287 912 447
Projected Demand for Biotechnologists for Seed Sector (High Growth)
Year Diploma UG PG PhD
2009-10 175 790 560 275
2010-11 193 869 616 302
2011-12 212 956 678 332
2012-13 233 1051 745 365
2013-14 256 1157 820 402
2014-15 282 1272 902 442
2015-16 310 1400 992 486
2016-17 341 1539 1091 535
2017-18 375 1693 1200 588
2018-19 413 1863 1320 647
2019-20 454 2049 1452 712

384
Annexure-12.12
a.Projected Demand for Biotechnologists for Veterinary Pharma Sector (Low Growth)
Year Diploma UG PG PhD Total
2009-10 - 225 150 75 450
2010-11 - 236 158 79 473
2011-12 - 248 165 83 496
2012-13 - 260 174 87 521
2013-14 - 273 182 91 547
2014-15 - 287 191 96 574
2015-16 - 302 201 101 603
2016-17 - 317 211 106 633
2017-18 - 332 222 111 665
2018-19 - 349 233 116 698
2019-20 - 367 244 122 733
b.Projected Demand for Biotechnologists for Veterinary Pharma Sector (High Growth)
Year Diploma UG PG PhD Total
2009-10 - 225 150 75 450
2010-11 - 248 165 83 495
2011-12 - 272 182 91 545
2012-13 - 299 200 100 599
2013-14 - 329 220 110 659
2014-15 - 362 242 121 725
2015-16 - 399 266 133 797
2016-17 - 438 292 146 877
2017-18 - 482 322 161 965
2018-19 - 531 354 177 1061
2019-20 - 584 389 195 1167

385
Annexure-12.13
a) Overall Projections of Requirements Stocks of Biotechnologists (High Growth)
Year Diploma UG PG PhD UG & above
2009-10 391 1150 887 951 2988
2010-11 439 1266 975 1036 3278
2011-12 495 1395 1073 1127 3594
2012-13 557 1536 1179 1223 3939
2013-14 628 1692 1296 1326 4315
2014-15 708 1865 1425 1437 4726
2015-16 799 2054 1567 1555 5176
2016-17 902 2264 1723 1682 5669
2017-18 1018 2494 1894 1820 6208
2018-19 1150 2749 2082 1968 6799
2019-20 1300 3029 2290 2128 7447
b) Overall Projections of Requirements Stocks of Biotechnologists (Low Growth)
Year Diploma UG PG PhD UG & above
2009-10 391 1150 887 951 2988
2010-11 420 1209 933 1009 3151
2011-12 452 1271 982 1067 3320
2012-13 486 1336 1033 1127 3497
2013-14 524 1405 1086 1189 3681
2014-15 565 1478 1143 1252 3873
2015-16 609 1555 1201 1317 4073
2016-17 657 1635 1263 1384 4283
2017-18 709 1720 1328 1453 4501
2018-19 766 1810 1397 1523 4730
2019-20 827 1904 1468 1596 4969
c) Overall Projections of Requirements Stocks of Biotechnologists (Average Growth)
Year Diploma UG PG PhD UG & above
2009-10 391 1150 887 951 2988
2010-11 430 1237 954 1022 3214
2011-12 473 1333 1027 1097 3457
2012-13 522 1436 1106 1175 3718
2013-14 576 1549 1191 1258 3998
2014-15 636 1671 1284 1344 4300
2015-16 704 1804 1384 1436 4625
2016-17 779 1949 1493 1533 4976
2017-18 864 2107 1611 1636 5355
2018-19 958 2279 1740 1746 5764
2019-20 1064 2467 1879 1862 6208

386
Annexure-12.14
a) Projected Outturns of Required Biotechnologists (High Growth)
Year Diploma UG PG PhD UG & above
2010-11 53 378 213 94 685
2011-12 60 413 231 101 744
2012-13 68 451 250 108 809
2013-14 76 494 272 115 881
2014-15 86 540 296 124 960
2015-16 98 604 322 133 1059
2016-17 111 660 351 143 1154
2017-18 126 721 396 154 1270
2018-19 142 790 430 166 1386
2019-20 161 865 467 180 1512
b) Projected Outturns of Required Biotechnologists (Low Growth)
Year Diploma UG PG PhD UG & above
2010-11 33 209 128 67 404
2011-12 36 218 133 69 420
2012-13 39 228 138 71 437
2013-14 42 238 144 73 455
2014-15 46 249 150 75 473
2015-16 50 257 156 78 490
2016-17 54 268 162 80 510
2017-18 59 280 165 83 528
2018-19 64 293 172 85 550
2019-20 69 299 179 88 566
b) Projected Outturns of Required Biotechnologists (Average Growth)
Year Diploma UG PG PhD UG & above
2010-11 43 294 170 81 545
2011-12 48 316 182 85 582
2012-13 53 340 194 89 623
2013-14 59 366 208 94 668
2014-15 66 394 223 99 716
2015-16 74 430 239 105 774
2016-17 82 464 256 111 832
2017-18 92 501 281 118 899
2018-19 103 541 301 126 968
2019-20 115 582 323 134 1039

387
Annexures for Chapter - 13
A. Individual Survey
A1.Coverage of Individual Experts by Type of Organization and Major Disciplines
Discipline
Respondents from
University
/Colleges
ICAR
Institutions
Government
Departments
Other
Organizati
ons
Total
1. Agriculture 1009(39.2) 177 (6.9) 758 (29.5) 627 (24.4) 2571 (52.7)
2. Agriculture
Engineering
111 (72.1) 11 (7.1) 11 (7.1) 21(13.6) 154 (3.2)
3. Bio-Chemistry 63 (29.9) 26 (12.3) 27 (12.8) 95 (45.0) 211 (4.3)
4. Home Science 128 (95.5) 3 (2.2) 2 (1.5) 1 (0.7) 134 (2.7)
5. Dairy Technology 21 (45.6) (0.0) 8 (17.4) 17 (36.9) 46 (0.9)
6. Fishery 48 (64.0) 1 (1.3) 13 (17.3) 13 (17.3) 75 (1.5)
7. Forestry 17 (51.5) 4 (12.1) 4 (12.1) 8 (24.2) 33 (0.7)
8. Food Technology 11 (61.1) (0.0) 2 (11.1) 5 (27.8) 18 (0.4)
9. Veterinary & AH 506 (67.5) 36 (4.8) 124 (16.5) 84 (11.2) 750 (15.4)
10. Horticulture 34 (31.8) 8 (7.5) 38 (35.5) 27 (25.2) 107 (2.2)
11. Others 202 (25.8) 77 (9.8) 148 (18.9) 355 (45.4) 782 (16)
Total 2150 (44.0) 343 (7.0) 1135 (23.3) 1253 (25.7) 4881 (100.0)
A2: Discipline-wise and Education-wise Distribution of Respondents
Discipline Educational Level of the Respondents
UG PG PhD Others Total
1. Agriculture 768 (29.9) 579 (22.5) 1121 (43.6) 103 (4.0) 2571 (100.0)
2. Agriculture
Engineering
20 (13.0) 16 (10.4) 94 (61.0) 24 (15.6) 154 (100.0)
3. Bio Chemistry 27 (12.8) 39 (18.5) 123 (58.3) 22 (10.4) 211 (100.0)
4. Home Science 3 (2.2) 21 (15.7) 110 (82.1) 0 (0.0) 134 (100.0)
5. Dairy Tech 11 (23.9) 10 (21.7) 18 (39.1) 7 (15.2) 46 (100.0)
6. Fishery 6 (8.0) 35 (46.7) 32 (42.7) 2 (2.7) 75 (100.0)
7. Forestry 1 (3.0) 13 (39.4) 17 (51.5) 2 (6.1) 33 (100.0)
8. Food Tech 9 (50.0) 1 (5.6) 5 (27.8) 3 (16.7) 18 (100.0)
9. Veterinary & AH 57 (7.6) 254 (33.9) 432 (57.6) 7 (0.9) 750 (100.0)
10. Horticulture 40 (37.4) 26 (24.3) 33 (30.8) 8 (7.5) 107 (100.0)
11. Others 167 (21.4) 209 (26.7) 222 (28.4) 184 (23.5) 782 (100.0)
Total 1109 (22.7) 1203 (24.6) 2207 (45.2) 362 (7.4) 4881 (100.0)

388
A3: Respondents by Gender & Social Category
Discipline SC (%) ST (%) BC (%) General
(%)
Total
All F All F All F All F N F
(%) 1. Agriculture 8.8 2.1 3.2 0.7 21.9 4.5 66.1 7.5 2571 14.7
2. Agri.
Engineering
7.1 1.3 1.9 0.0 11.0 0.6 79.9 3.9 154 5.8
3. Bio Tech 3.3 0.0 4.7 1.9 14.2 4.7 77.7 24.2 211 30.8
4. Home Science 5.2 5.2 0.0 0.0 11.2 9.7 83.6 79.1 134 94.0
5. Dairy
Technology
10.
9
0.0 8.7 0.0 13.0 4.3 67.4 13.0 46 17.4
6. Fishery Science 12.
0
1.3 4.0 0.0 21.3 2.7 62.7 5.3 75 9.3
7. Forestry 12.
1
0.0 12.1 0.0 12.1 0.0 63.6 0.0 33 0.0
8. Food Tech 11.
1
0.0 0.0 0.0 5.6 0.0 83.3 11.1 18 11.1
9. Veterinary
&AH
8.7 1.1 1.3 0.3 23.2 3.3 66.8 8.3 750 12.9
10. Horticulture 13.
1
0.9 2.8 0.9 41.1 8.4 43.0 9.3 107 19.6
11.Others 8.4 2.2 3.3 1.0 26.6 5.0 61.6 11.4 782 19.6
Total 8.5 1.8 3.0 0.7 22.1 4.4 66.4 10.8 4881 17.7
A5: Time Taken to Get First Employment of Agricultural Students
Discipline Less than six
months
6 to 12
months
More than 1
year* Total
1.Agriculture 2449
(95.3)
9
(0.4)
113
(4.4)
2571
(52.7)
2. Agriculture Engineering. 152
(98.7)
0 2
(1.3)
154
(3.2)
3. Bio Technology 206
(97.6)
0 5(2.4) 211
(4.3)
4. Home Science 127
(94.8)
0 7
(5.2)
134
(2.7)
5. Dairy Tech/Science 45
(97.8)
0 1
(2.2)
46
(0.9)
6. Fishery 74
(98.7)
0 1
(1.3)
75
(1.5)
7. Forestry 33
(100.0)
0 0 33
(0.7)
8. Food Technology 18
(100.0)
0 0 18
(0.4)
9. Veterinary & AH 735
(98.0)
1
(0.1)
14
(1/9)
750
(15.4)
10. Horticulture 106
(99.1)
0 1
(0.9)
107
(2/2)
11. Others 744
(95.1)
2
(0.3)
36
(4.6)
782
(16/0)
Total 4689 (96.1) 12 (0.2) 180 (3.7) 4881 (100)
* includes better job seekers

389
A6: Reasons for Opting Agriculture as Area of Study
Discipline
Reasons for Opting the Agriculture Course
Interest
in the
Subject
Best
Professional
Degree as per
your
Qualification
More
Employment
opportunities
in the Sector
Family
Pressure
No
specific
reasons*
Total
1. Agriculture 999
(38.9)
551
(21.4)
438
(17.0)
220
(8.6)
363
(14.1)
2571
(52.7)
2. Agri.
Engineering
67
(43.5)
29
(18.8)
26
(16.9)
13
(8.4)
19
(12.3)
154
(3.2)
3. Bio
Technology
150
(71.1)
19
(9.0)
19
(9.0)
3
(1.4)
20
(9.5)
211
(4.3)
4. Home
Science
65
(48.5)
25
(18.7)
22
(16.4)
5
(3.7)
17
(12.7)
134
(2.7)
5. Dairy Tech 12
(26.1)
6
(13.0)
18
39.1)
1
(2.2)
9
(19.6)
46
(0.9)
6. Fishery 38
(50.7)
19
(25.3)
11
(14.7)
0 7
(9.3)
75
(1.5)
7. Forestry 20
(60.6)
6
(18.2)
0 3
(9.1)
4
(12.1)
33
(0.7)
8. Food Tech 10
(55.6)
5
(27.8)
1
(5.6)
0 2
(11.1)
18
(0.4)
9. Veterinary
& AH
290
(38.7)
172
(22.9)
171
(22.8)
45
(6.0)
72
(9.6)
750
(15.4)
10.
Horticulture
47
(43.9)
10
(9.3)
23
(21.5)
11
(10.3)
16
(15.0)
107
(2.2)
11. Other 300
(38.4)
110
(14.1)
130
(16.6)
100
(12.8)
142
(18.2)
782
(16.0)
Total 1998
(40.9)
952
(19.5)
859
(17.6)
401
(8.2)
671
(13.7)
4881
(100.0)
* includes; no interest need a professional degree, unemployed need a course

390
A7: Perceptions on Adequacy of Agriculture Education
Discipline
Total
respondents
Per cent respondents
Fully
adequate
Partially
adequate
Not
adequate
Agriculture 2571
44.0 50.1 6.0
Agri. Engg. 154
39.6 59.1 1.3
Biotechnology. 211
21.3 68.7 10.0
Ani.Vet. Sci. 134
39.6 56.0 4.5
Dairy 46
45.7 50.0 4.3
Fishery 75
49.3 45.3 5.3
Food Sci 33
24.2 69.7 6.1
Forestry 18
44.4 55.6 0.0
Home Sci. 750
36.3 57.3 6.4
Horti. 107
43.9 53.3 2.8
Others 782
42.7 48.0 9.3
Total 4881
41.3 52.2 6.5
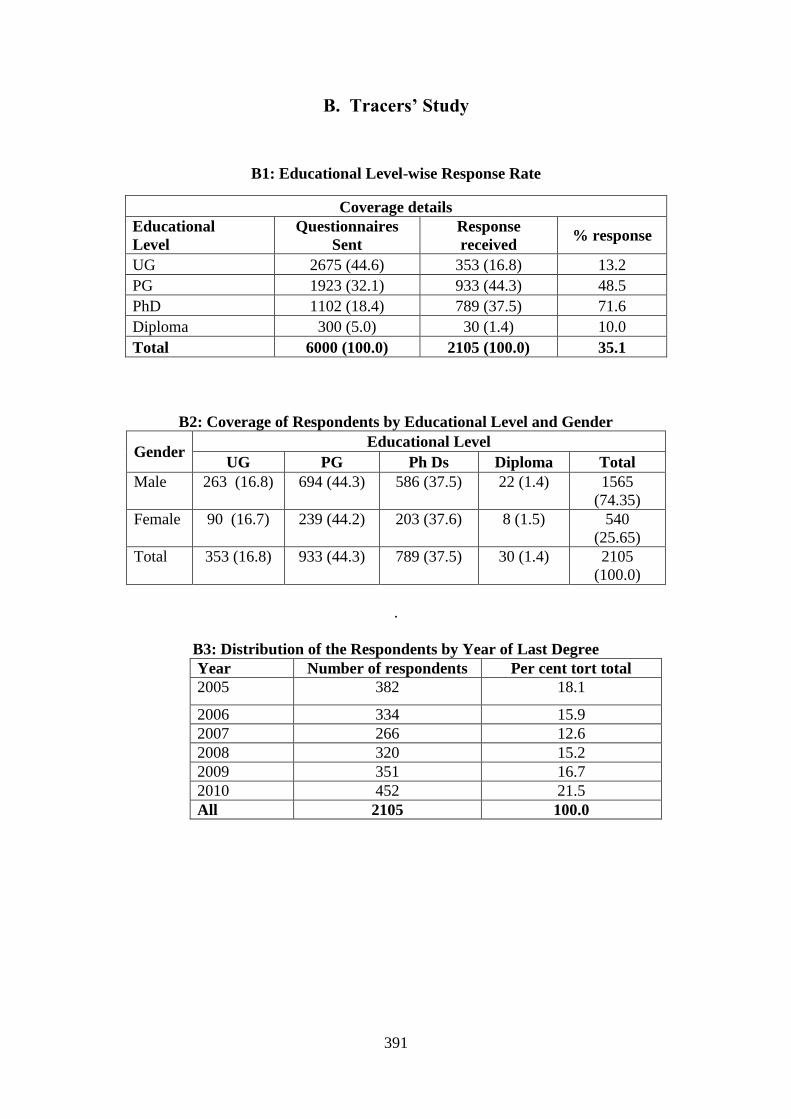
391
B. Tracers’ Study
B1: Educational Level-wise Response Rate
Coverage details
Educational
Level
Questionnaires
Sent
Response
received % response
UG 2675 (44.6) 353 (16.8) 13.2
PG 1923 (32.1) 933 (44.3) 48.5
PhD 1102 (18.4) 789 (37.5) 71.6
Diploma 300 (5.0) 30 (1.4) 10.0
Total 6000 (100.0) 2105 (100.0) 35.1
B2: Coverage of Respondents by Educational Level and Gender
Gender Educational Level
UG PG Ph Ds Diploma Total
Male 263 (16.8) 694 (44.3) 586 (37.5) 22 (1.4) 1565
(74.35)
Female 90 (16.7) 239 (44.2) 203 (37.6) 8 (1.5) 540
(25.65)
Total 353 (16.8) 933 (44.3) 789 (37.5) 30 (1.4) 2105
(100.0)
.
B3: Distribution of the Respondents by Year of Last Degree
Year Number of respondents Per cent tort total
2005 382 18.1
2006 334 15.9
2007 266 12.6
2008 320 15.2
2009 351 16.7
2010 452 21.5
All 2105 100.0
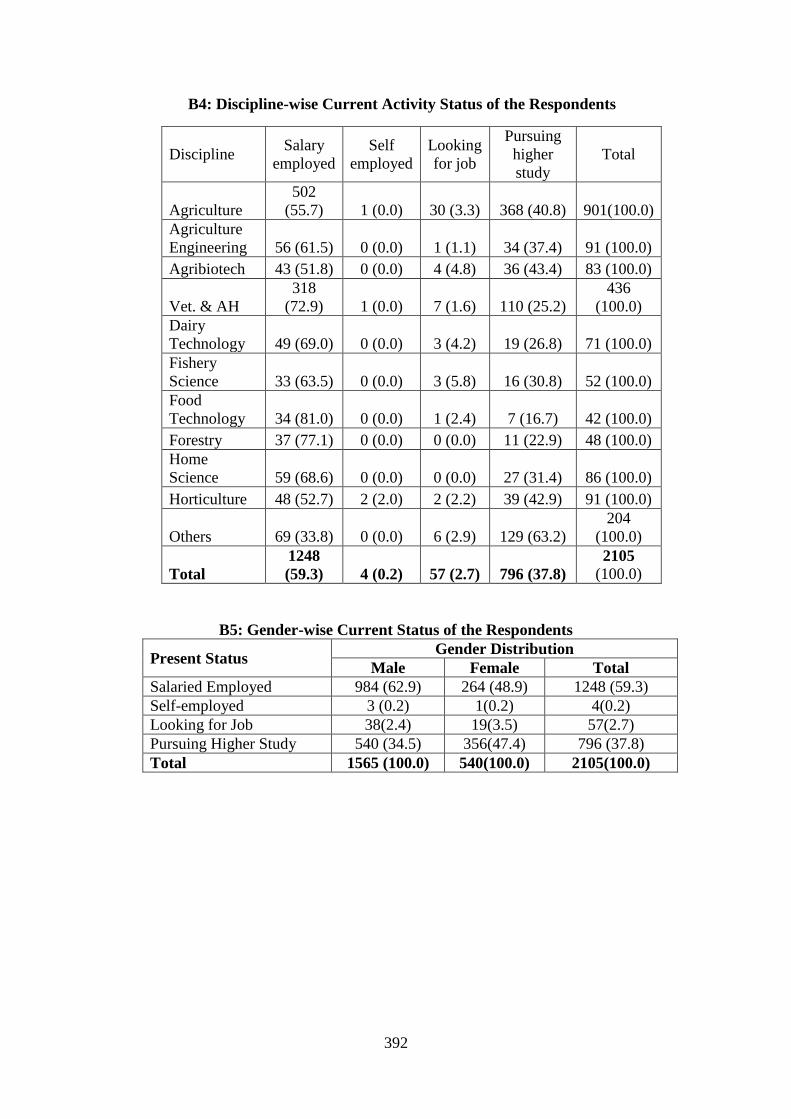
392
B4: Discipline-wise Current Activity Status of the Respondents
Discipline Salary
employed
Self
employed
Looking
for job
Pursuing
higher
study
Total
Agriculture
502
(55.7) 1 (0.0) 30 (3.3) 368 (40.8) 901(100.0)
Agriculture
Engineering 56 (61.5) 0 (0.0) 1 (1.1) 34 (37.4) 91 (100.0)
Agribiotech 43 (51.8) 0 (0.0) 4 (4.8) 36 (43.4) 83 (100.0)
Vet. & AH
318
(72.9) 1 (0.0) 7 (1.6) 110 (25.2)
436
(100.0)
Dairy
Technology 49 (69.0) 0 (0.0) 3 (4.2) 19 (26.8) 71 (100.0)
Fishery
Science 33 (63.5) 0 (0.0) 3 (5.8) 16 (30.8) 52 (100.0)
Food
Technology 34 (81.0) 0 (0.0) 1 (2.4) 7 (16.7) 42 (100.0)
Forestry 37 (77.1) 0 (0.0) 0 (0.0) 11 (22.9) 48 (100.0)
Home
Science 59 (68.6) 0 (0.0) 0 (0.0) 27 (31.4) 86 (100.0)
Horticulture 48 (52.7) 2 (2.0) 2 (2.2) 39 (42.9) 91 (100.0)
Others 69 (33.8) 0 (0.0) 6 (2.9) 129 (63.2)
204
(100.0)
Total
1248
(59.3) 4 (0.2) 57 (2.7) 796 (37.8)
2105
(100.0)
B5: Gender-wise Current Status of the Respondents
Present Status Gender Distribution
Male Female Total
Salaried Employed 984 (62.9) 264 (48.9) 1248 (59.3)
Self-employed 3 (0.2) 1(0.2) 4(0.2)
Looking for Job 38(2.4) 19(3.5) 57(2.7)
Pursuing Higher Study 540 (34.5) 356(47.4) 796 (37.8)
Total 1565 (100.0) 540(100.0) 2105(100.0)

393
B6: Discipline-wise Areas of Employment of the Employed Respondents
Discipline
Areas of employment of salaried agriculture educated
Research Govt.
Office
Production
and
Processing
Units
Not
Reporting Total
Agriculture 76 89 37 300 502
Agriculture
Engineering 21 15 7 13 56
Agribiotech 3 8 12 20 43
Vet. Science &AH 23 59 - 236 318
Dairy Technology 3 2 12 32 49
Fishery Science 7 9 2 15 33
Food Technology 1 2 11 20 34
Forestry 9 5 - 23 37
Home Science 3 9 1 46 59
Horticulture 6 19 7 16 48
Others 7 9 9 44 69
Total 159 226 98 765 1248
B7: Perception about Adequacy of the Agriculture Education
Discipline Fully
Adequate
Partly
Adequate
Not at all No
Response
Total
Agriculture 221 (24.5) 41 (4.6) 320 (35.5) 319 (35.4) 901
(100.0)
Agri. Engg 35 (38.5) 8 (8.8) 42 (46.2) 6 (6.6) 91 (100.0)
Agribiotech 13 (15.7) 3 (3.6) 35 (42.2) 32 (38.6) 83 (100.0)
Vet. Sci &AH 84 (19.3) 21 (4.8) 200 (45.9) 131 (45.9) 436
(100.0)
Dairy Technology 18 (25.4) 2 (2.8) 17 (23.9) 34 (47.9) 71 (100.0)
Fishery Science 17 (32.7) 3 (5.8) 12 (23.1) 20 (38.5) 52 (100.0)
Food Technology 7 (16.7) 0 (0.0) 8 (19.0) 27 (64.3) 42 (100.0)
Forestry 11 (22.9) 4 (8.3) 23 (47.9) 10 (20.8) 48 (100.0)
Home Science 20 (23.3) 0 (0.0) 21 (24.4) 45 (52.3) 86 (100.0)
Horticulture 38 (41.8) 9 (9.9) 42 (46.2) 2 (2.2) 91 (100.0)
Others 41 (20.1) 10 (4.9) 57 (27.9) 96 (47.1) 204
(100.0)
Total 505 (24.0) 101 (4.8) 777 (36.9) 722 (34.3) 2105
(100.0)
.

394
B8: Graduates Future Plans
Discipline
Total
Respondents
Per cent respondents
Academic
& Research
Govt/
civil jobs Business Others
Agriculture 901 56.3 23.3 18.3 2.1
Agriculture
Engineering. 91 56.0 24.2 18.7 1.1
Agriculture
biotechnology. 83 56.6 24.1 18.1 1.2
Veterinary.&
AH. 436 56.4 23.2 18.3 2.1
Dairy 71 56.3 22.5 18.3 2.8
Fishery 52 55.8 25.0 17.3 1.9
Food Science 42 54.8 23.8 19.0 2.4
Forestry 48 54.2 25.0 18.8 2.1
Home
Science. 86 58.1 23.3 17.4 1.2
Horticulture 91 56.0 24.2 19.8 0.0
Others 204 56.4 22.1 18.1 3.4
Total 2105 56.3 23.3 18.3 2.0

395
C. Establishment Survey
C1: Distribution of Establishments Covered by Major Activity and Ownership Type
Major Activity Type of Ownership
Gover
nment
Public Private
sector
Co-
operatives
Self Total
sector Employed
Agriculture 757
(50.7)
232
(49.9)
686
(59.2)
15 (20.5) 146 (58.4) 1836
(53.4)
Animal Science 170
(11.4)
40 (8.6) 71 (6.1) 13 (17.8) 24 (9.6) 318
(9.2)
Horticulture 301
(20.2)
35 (7.5) 139
(12.0)
26 (35.6) 45 (18.0) 546
(15.9)
Food Science 5 (0.3) 10 (2.2) 13 (1.1) 1 (1.4) 6 (2.4) 35 (1.0)
Dairy Science 35 (2.3) 15 (3.2) 145
(12.5)
4 (5.5) 8 (3.2) 207
(6.0)
Fisheries 72 (4.8) 25 (5.4) 13 (1.0) 1 (1.4) 0 (0.0) 111
(3.2)
Biotechnology 12 (0.8) 21 (4.5) 16 (1.4) 9 (12.3) 0 (0.0) 58 (1.7)
Forestry 67 (4.5) 9 (1.9) 29 (2.5) 0 (0.0) 10 (4.0) 115
(3.3)
Financial
Institutions
40 (2.7) 52
(11.2)
23 (2.0) 3 (4.1) 0 (0.0) 118
(3.4)
Others 33 (2.2) 26 (5.6) 24 (2.1) 1 (1.4) 11 (4.4) 95 (2.8)
Total 1492
(100.0)
465
(100.0)
1159
(100.0)
73 (100.0) 250
(100.0)
3439
(100.0)
% 43.4 13.5 33.7 2.1 7.3 100
C2: Distribution of Establishment by Location and Major Activities
Type of Activity of the
Establishment
Rural Urban
Agriculture 60.78 39.22
Animal Science 55.34 44.66
Horticulture 40.10 59.90
Food Science 54.14 42.86
Dairy Sc./Tech 61.83 38.17
Fisheries 69.36 30.64
Bio- Tech 43.10 56.90
Forestry 66.08 33.92
Financial Institutions 52.54 47.46
Others 36.84 63.16

396
C3:Establishments by Major and Sub-Category of Activity
Major
Activity
No. of
Estab
lishments
Res,
Edu,
Extn
Input
Industries
Production/
processing
Units
Govt.
Sector
Trade Others
Agriculture 1836 197 523 627 139 174 176
Horticulture 546 63 7 336 73 33 34
Dairy 207 4 0 195 4 3 1
Fisheries 111 1 1 54 45 6 4
Bio- Tech 58 9 24 15
0 10
Financial 118 1 0 0 2 0 115
Forestry 115 9 3 51 41 1 10
Veterinary 318 52 58 84 49 2 73
Food Sci 35 6 3 22 1 0 3
Others 95 9 5 19 5 2 55
Total 3439 351 624 1403 359 221 481
Per Cent 100.0 10.2 18.1 40.9 10.4 6.4 14.0
C4: Distribution of Employees by Major Activities and Gender
Major Activity Number of
Establishments
Covered
Percentage of gender-
wise employment in
total
Average
employment
per
establishment Male Female Total
1. Agriculture 1836 94.9 5.1 100.0 43.6
2. Animal Science 318 95.1 4.9 100.0 60.2
3. Horticulture 546 95.0 5.0 100.0 44.6
4. Food Science 35 64.5 35.5 100.0 37.8
5. Dairy 207 97.3 2.7 100.0 117.7
6. Fisheries 111 87.3 12.7 100.0 90.3
7.Bio-Technology 58 94.7 5.3 100.0 69.3
8. Forestry 115 91.3 8.7 100.0 62.2
9. Financial
Institutions
118 94.9 5.1 100.0 418.5
10. Others 95 92.9 7.1 100.0 29.1
Total 3439 94.5 5.5 100.0 64.7

397
C5: Growth of Employment from 2004-05 to 2008-09
Year Annual Growth over previous year (%)
2004-05 -
2005-06 12.1
2006-07 16.5
2007-08 20.1
2008-09 2.6
CAGR 13.8
C6: Distribution of Employees by Qualification and Gender
Educational Level All Women
A. Agricultural Qualification
Informal Training Certificate 3.6 5.9
Diplomas 5.3 8.1
Graduates 12.6 24.2
Post-Graduates 3.2 6.7
Ph.Ds. 1.4 1.6
Sub-total 26.1 46.5
B. General Qualification 73.9 53.5
Total 100.0 100.0
C7: Distribution of Employees by Major Activity of the Establishment
Major field of
establishment
Per cent employees in
Same area Next important area
Agriculture 53.8 Ag engg 7.8
Agri. Engg. 71.0 Agri 29.0
Veterinary &AH 83.8 Agri 9.4
Horticulture 27.0 Agri 37.0
Food Science 45.0 Agri 29.8
Dairy Tech 47.8 Vet 15.6
Agri 14.3
Fisheries 59.3 Agri 19.0
Bio- Tech. 60.1 Ag engg 18.2
Forestry 56.2 Agri 25.8

398
C8: Establishments Reporting Future Manpower Requirements
Major Activity No. of
Estt.
Requirement in 2020
UG PG PhD Total
Agriculture 832 14192 4659 1769 20620
Vet & AH 180 2782 667 440 3889
Horticulture 272 4042 1224 637 5903
Food Science 18 105 120 60 285
Dairy Sc./Tech 128 2209 290 131 2630
Fisheries 61 899 272 80 1251
Bio- Tech 44 789 489 135 1413
Forestry 67 579 237 162 978
Financial Institutions 64 7191 222 36 7449
Others 33 208 170 132 510
Total 1699 32996 8350 3572 44928
C9: Vacancies Arising & Filled in Reporting Establishments
Year
No. of vacancies arising for graduates and above in agriculture and allied
fields
Number of vacancies arising due to
Retire
-ment
Transfers
/
Resignati
on
Expan
sion
Other
Reaso
ns
Total
Vacanci
es
Numbe
r of
Vacanc
ies
Filled
No. of
organiz
ations
reportin
g
Total
Emplo
yment
of the
above
organi
sations
2006-07 298 264 145 163 1281
(13.0)
628
(49.0)
374 9879
2007-08 326 297 446 124 1316
(12.9)
687
(52.2)
403 10211
2008-09 645 947 446 160 3016
(21.5)
1723
(57.1)
523 14059

399
C10: Establishments Reporting Change
Major
Activity
No.
of
Estt.
Nature of Change proposed for 2020
Expansion
of the
organisatio
ns
Diversificati
on of
Product
Service
Technologic
al Change
in Process
Modernizati
on of
Organisation
Others
Agriculture 1836 1794
(97.71)
1809
(98.53)
1826
(99.46)
1502
(81.81)
1467
(79.90)
Vet / Animal
Science
318 249
(78.30)
207
(65.09)
210
(66.04)
248
(77.99)
161
(50.63)
Horticulture 546 383
(70.15)
410
(75.09)
355
(65.02)
466
(85.35)
302
(55.31)
Food Science 35 20
(57.14)
27
(77.14)
34
(97.14)
32
(91.43)
31
(88.57)
Dairy Tech 207 159
(76.81)
148
(71.50)
148
(71.50)
152
(73.43)
179
(86.47)
Fisheries 111 85
(76.58)
75
(67.57)
93
(83.78)
110
(99.10)
71
(63.96)
Bio- Tech 115 47
(40.87)
78
(67.83)
85
(73.91)
74
(64.35)
89
(77.39)
Forestry 58 35
(60.34)
45
(77.59)
45
(77.59)
45
(77.59)
45
(77.59)
Financial
Institutions
118 86
(72.88)
55
(46.61)
85
(72.03)
109
(92.37)
78
(66.10)
Others 95 79
(83.16)
71
(74.74)
71
(74.74)
81
(85.26)
75
(78.95)
Total 3439 2937
(85.40)
2925
(85.05)
2952
(85.84)
2819
(81.97)
2498
(72.64)
C11:Establishments Suggesting Changes in the Skill Set in Education
Number of establishments suggesting
Percentage of establishments
suggesting change at
UG PG
More advanced theoretical knowledge 74.8 70.7
More Technical Knowledge 71.7 65.9
More Practical Orientation 63.7 53.0
More Interaction with Industries 63.7 60.5
Managerial Skills 64.0 64.0
Information Technology 57.6 47.8
Agri-Business Economics 52.1 51.4
Any Other (Please specify) 67.3 38.2

400
C12: Distribution of Employees with Graduate and Above Qualifications by Discipline
and Major Activity of Establishment
Major
Activity
of
Establish
ment
Percentage distribution of employees (graduates and above) by discipline
Agri
-
Agri.
Eng
g.
Vet
Sci.
Hort. Fishe
r-
ies
Sc.
Dair
y Sc.
Fores
t
Bio
-
tech
Home
Sc.
Foo
d
Tec
h
Other
Agri-
Disc.
Other
disc.
Total
Agricultu
re
33.9 7.8 8.1 6.3 1.1 0.9 3.1 5.0 0.7 5.4 19.9 7.7 100
Agri.
Engg.
29.0 71.0 - - - - - - - - - - 100
Animal
Science
9.4 0.5 83.8 - - 1.5 - - - - 1.1 3.8 100
Horti-
culture
37.0 2.5 - 27.0 2.8 - 6.6 1.6 - 4.2 7.7 10.6 100
Food
Science
29.8 - - - - - 5.8 3.7 9.9 45.
0
- 5.8 100
Dairy 7.4 - 15.6 - - 47.8 - - - 0.7 14.3 14.1 100
Fisheries 19.0 - - - 59.3 - - - - - 10.1 11.6 100
Bio- tech. 14.0 18.2 - 2.3 - - - 60.
1
- - 4.0 1.4 100
Forestry 25.8 6.8 - 2.6 - - 56.2 1.3 - 0.4 2.5 4.6 100
Financial 29.4 - 4.9 5.2 - - - - - - 13.8 46.7 100
Others 24.9 23.4 12.9 - - - - 6.9 - - 8.0 23.9 100
Total 28.7 5.0 12.1 7.7 2.5 3.4 3.6 4.6 0.4 3.4 14.0 14.5 100

401
Annexures for Chapter - 15
Annexure-15.1
Outturn of Graduates and above in Agriculture and Allied Sciences (1970 – 1989)
Year BVSc/
BSc(Dairy)
BSc(Agri) Msc (Agri) MVSc /
MSc (Dairy)
PhD All
1950 100 1000 154 0 4 1258
1951 189 1041 192 0 5 1427
1952 172 870 223 0 8 1273
1953 209 879 222 0 4 1314
1954 256 910 203 0 7 1376
1955 289 905 197 0 9 1400
1956 368 893 209 0 13 1483
1957 492 1128 303 0 7 1930
1958 643 1520 306 0 9 2478
1959 821 1950 383 0 16 3170
1960 844 1990 482 0 26 3342
1961 857 2608 610 0 28 4103
1962 774 2609 690 0 42 4115
1963 802 4112 708 0 41 5663
1964 999 4718 814 0 48 6579
1965 1030 5569 1176 0 95 7870
1966 855 5040 939 132 72 7038
1967 1120 6180 920 135 9 8364
1968 1003 5902 1238 139 104 8386
1969 1145 5909 1288 122 106 8570
1970 1171 7205 1432 149 217 10174
1971 1031 5280 1159 226 80 7776
1972 1012 5600 1454 194 283 8543
1973 904 4649 1281 208 145 7187
1974 1018 4550 1394 244 259 7465
1975 892 3851 1365 253 251 6612
1976 1143 4700 1462 271 289 7865
1977 1183 4306 1347 286 295 7417
1978 1060 5075 1337 307 344 8123
1979 925 5166 1585 237 364 8277
1980 1347 5959 1674 246 402 9628
1981 1349 5986 1620 360 501 9816
1982 1336 6061 1725 371 490 9983

402
1983 13357 6019 1592 294 547 21809
1984 1062 5578 2242 392 576 9850
1985 1104 5633 2274 412 588 10011
1986 1249 5381 2543 417 698 10288
1987 1360 5532 2567 535 571 10565
1988 1415 6043 2334 415 479 10686
1989 1219 6557 2762 508 729 11775
Source: Technical Manpower Bulletin, Vol-4, Agricultural Sciences, CSIR, 1993
Annexure-15.2
Outturn of Graduates and Above in Agriculture and Allied Sciences (1990-1992)
Year Agri+
Hort+
Forestry
Veterinary
+ Dairy
Agri-
engg
Fishery Home
science
Diploma All
1989-90 10668 2331 1245 313 717 110 15384
1990-91 10463 2186 1215 265 644 1015 15788
1991-92 10545 2279 1008 206 587 1093 15718
Total 84691 18431 7622 1667 4479 2778 119668
Source: Rama Rao & Muralidhar, AGRIUNIS, 1994.
Annexure-15.3
Outturn of Graduates in Agriculture and Veterinary Sciences for Various Years
Year Agriculture & Veterinary Sciences
UG PG PhD
1989 8301 2876 792
1995 5752 2284 827
2003 9109 4416 1195
2004 - - 1026+116
2005 - - 888+132
2006 - - 1119+180
Source: DST R&D Statistics, 2007-08
For 2004-06, PhD outturn data is available for agriculture and veterinary separately

403
Annexure-15.4
A: Supply Projections (Assuming Average Outturns of 2006-10
Will be Maintained Till 2020)
Year Agricul-
ture
Horti-
culture
Forest-
ry
Dairy
Tech.
Veteri-
nary
Agri.-
Engg.
Fisher-
ies Sci.
Agri-
Biotech
All
2009-10 188708 14179 5005 6062 40232 23207 5144 1697 284234
2010-11 193715 14491 5167 6187 41137 23635 5277 1978 291587
2011-12 198907 14820 5333 6317 42073 24092 5415 2257 299214
2012-13 203707 15118 5489 6429 42898 24497 5543 2532 306213
2013-14 208615 15426 5648 6536 43693 24921 5674 2804 313317
2014-15 213194 15708 5798 6648 44512 25301 5796 3074 320029
2015-16 217595 15976 5942 6770 45393 25659 5914 3340 326589
2016-17 221635 16215 6077 6858 46069 25970 6023 3603 332449
2017-18 225600 16448 6210 6944 46725 26273 6129 3864 338193
2018-19 229458 16675 6339 7029 47373 26564 6233 4121 343793
2019-20 233307 16901 6468 7115 48031 26858 6337 4376 349393 Average
outturns
2006-
10) 13662 1148 573 410 2763 1259 394 515 20207
B: Supply Projections (Assuming Average Outturns of 2006-10 Will Grow at the Same
Rate as Observed in 2006-10)
Year Agricul-
ture
Horti-
culture
Forest-
ry
Dairy
Tech.
Veteri-
nary
Agri.-
Engg.
Fisher-
ies Sc.
Bio-
tech
All
2009-10 188708 14179 5005 6062 40232 23207 5144 1697 284234
2010-11 194207 14594 5191 6190 41145 23732 5284 2052 292394
2011-12 200405 15144 5407 6326 42096 24390 5435 2495 301698
2012-13 206747 15798 5641 6446 42943 25111 5582 3049 311316
2013-14 213757 16618 5907 6565 43767 25974 5739 3740 322065
2014-15 221020 17590 6196 6690 44623 26929 5894 4602 333544
2015-16 228716 18754 6515 6829 45549 28010 6052 5677 346102
2016-17 236688 20127 6862 6937 46276 29204 6207 7018 359320
2017-18 245252 21768 7248 7045 46989 30566 6368 8692 373928
2018-19 254407 23717 7675 7155 47704 32107 6533 10779 390076
2019-20 264280 26030 8148 7269 48433 33859 6705 13383 408108 Average
rate of
growth
in
outturn
2006-
10) 5.30 15.66 8.70
(-)4
taken
as 1.00
0.40
taken
as 1.00 9.70 2.60 24.75

404
C: Supply Projections (Assuming Average Outturns of 2006-10 Will Grow at 10 Per
Cent Per Year)
Year Agricul-
Ture
Horti-
Culture
Forest-
Ry
Dairy
Tech.
Veteri-
Nary
Agri.-
Engg.
Fisher-
Ies Sc.
Bio-
Tech
All
2009-10 188708 14179 5005 6062 40232 23207 5144 1697 284234
2010-11 194644 14557 5194 6215 41322 23735 5302 2008 292976
2011-12 201777 15023 5418 6402 42646 24400 5491 2349 303506
2012-13 209623 15536 5665 6605 44078 25131 5699 2722 315059
2013-14 218784 16143 5949 6838 45720 26010 5942 3131 328517
2014-15 228931 16817 6264 7114 47649 26986 6211 3580 343552
2015-16 240341 17579 6616 7444 49927 28095 6513 4071 360587
2016-17 252963 18423 7005 7787 52314 29325 6847 4611 379273
2017-18 267233 19383 7442 8177 55023 30731 7225 5203 400417
2018-19 283281 20468 7933 8622 58101 32328 7650 5852 424235
2019-20 301384 21699 8484 9131 61599 34148 8128 6565 451137