Annexure -...
130
Annexure
Transcript of Annexure -...

Annexure

Annexure I
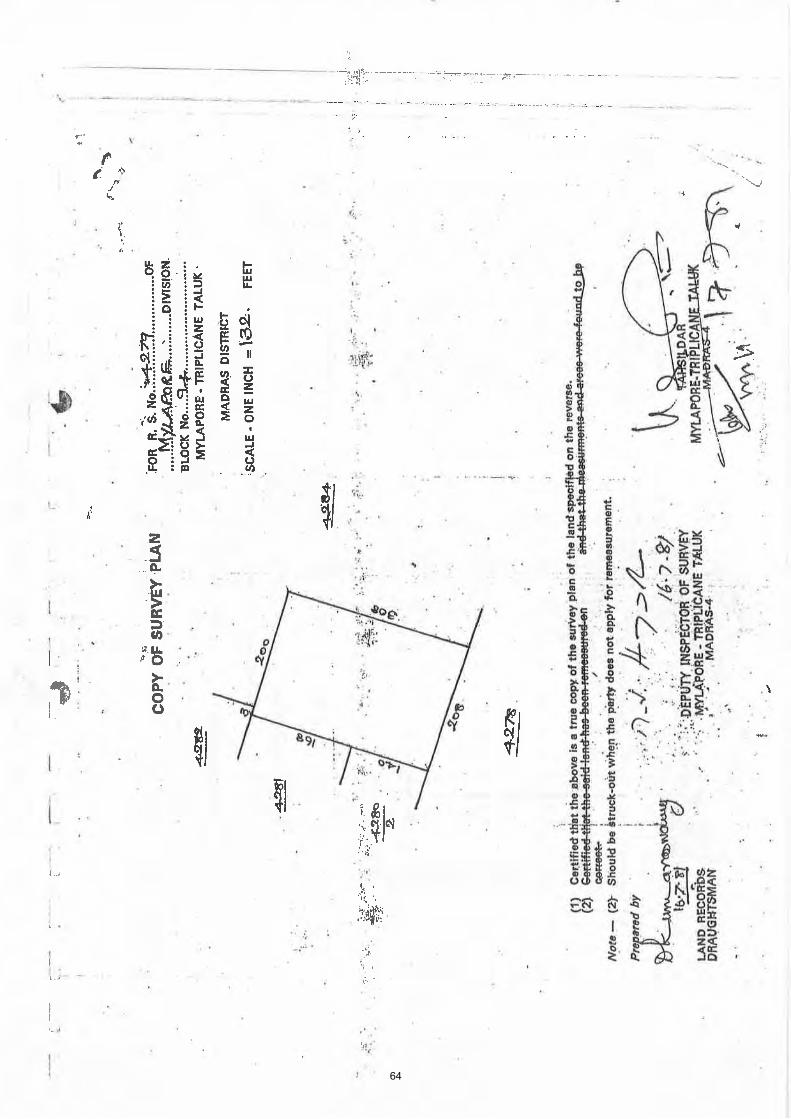
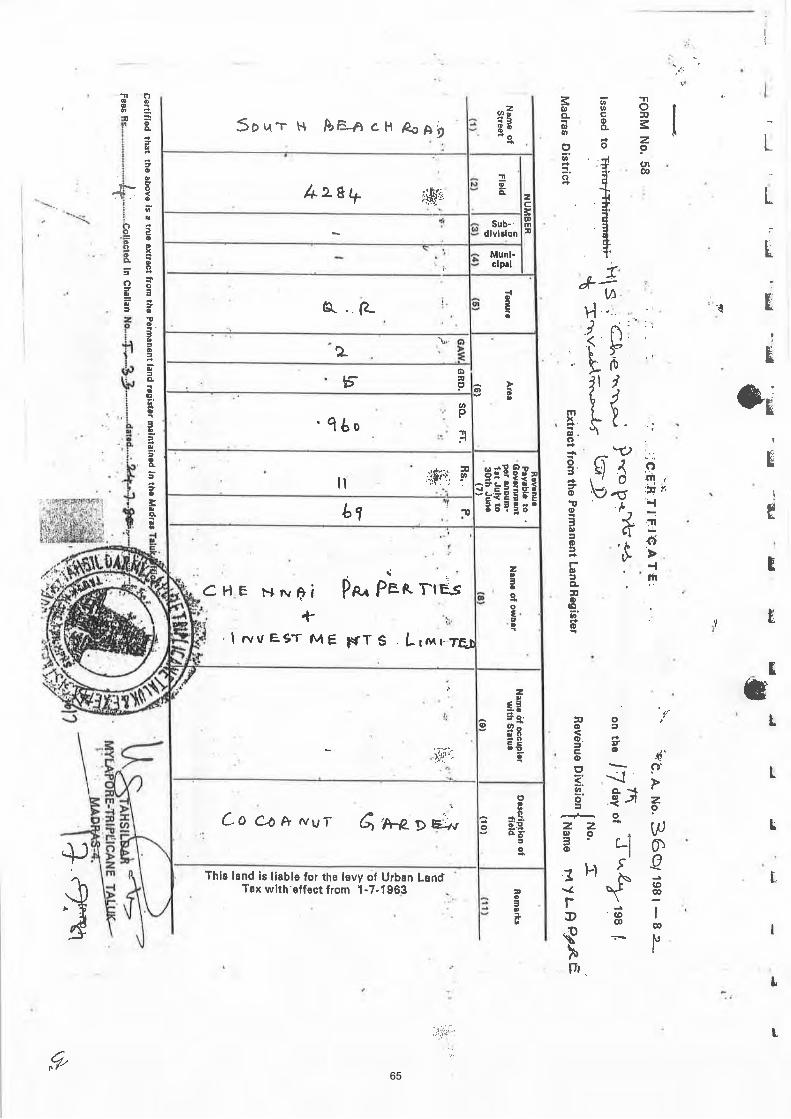
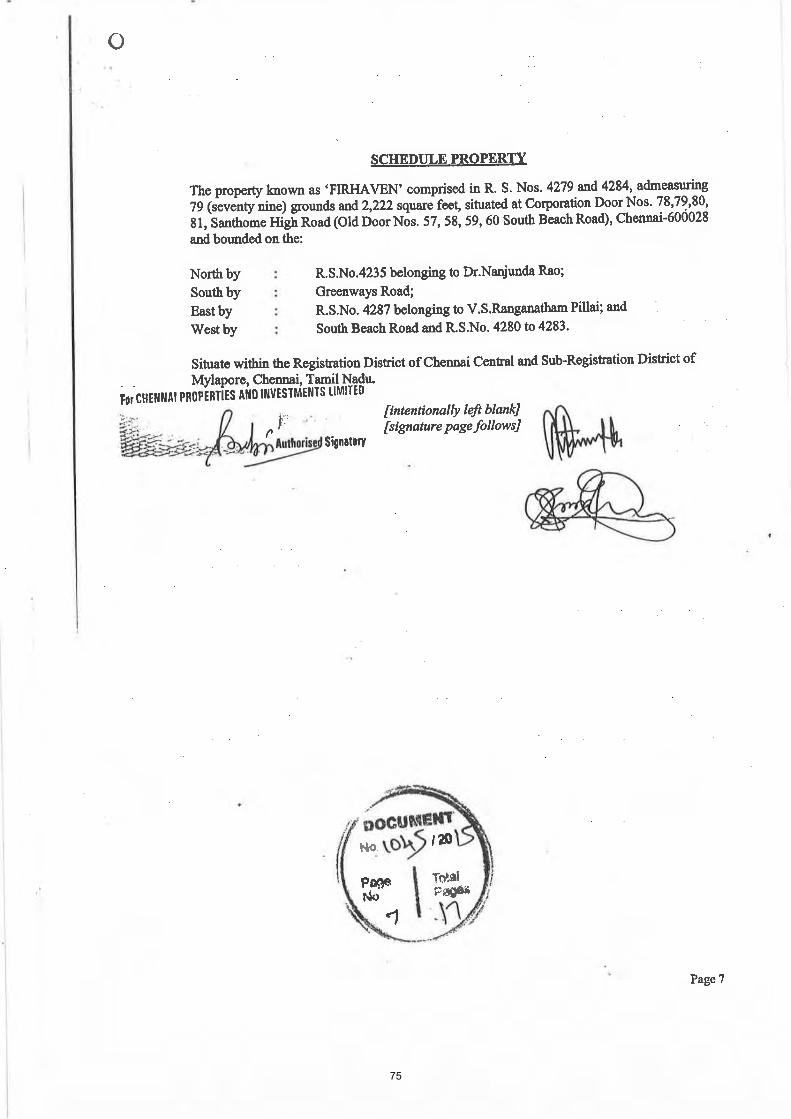
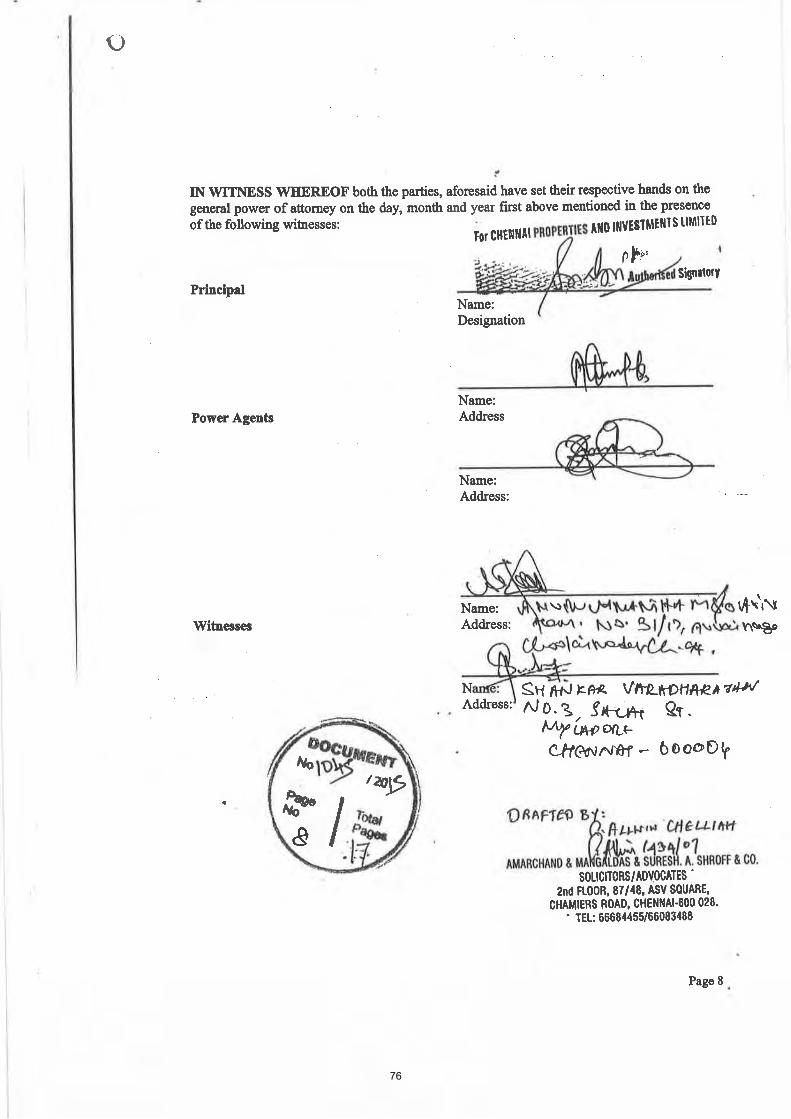
LAND DOCUMENTS

63
64
65

66

67

68

Annexure II
GENERAL POWER OF ATTORNEY


69

70

71

72

73

74
75
76

77

78
79

80
81

82

83

84

Annexure III
CMDA ACKNOWLEDGEMENT
FOR PLANNING PERMISSION

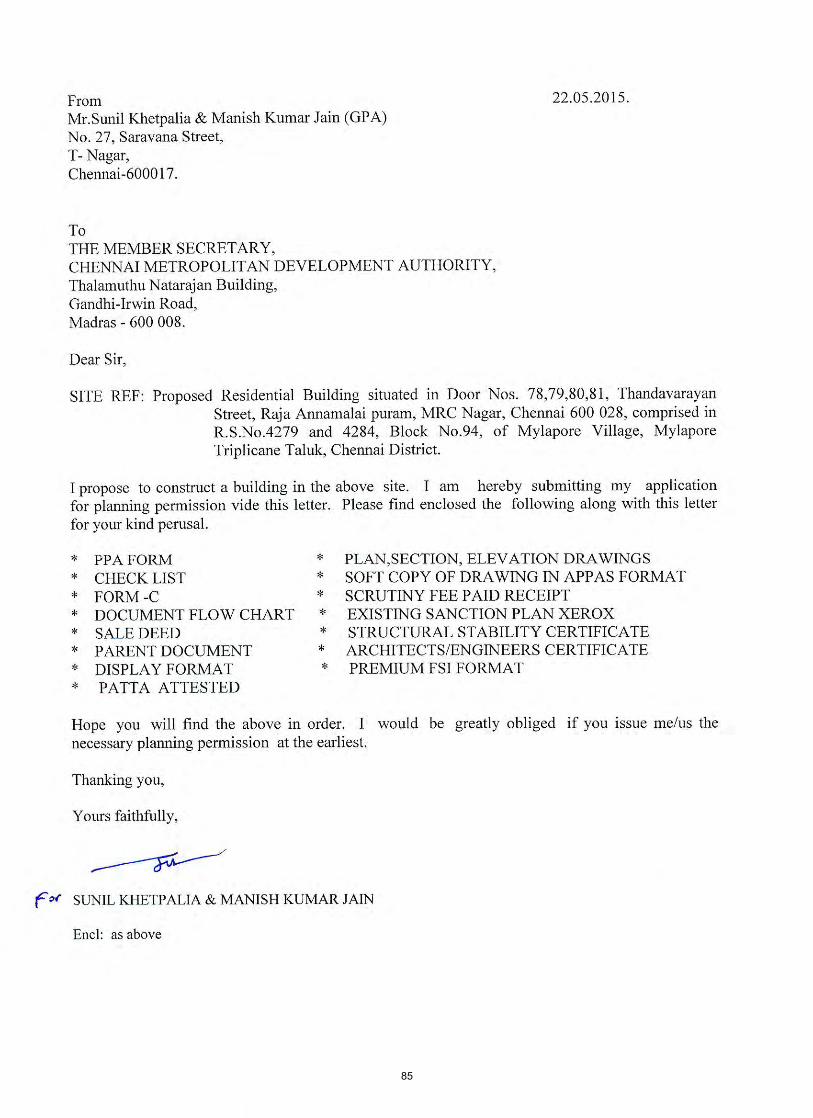
85

86

Annexure IV
CMDA LAND USE MAP


87

88

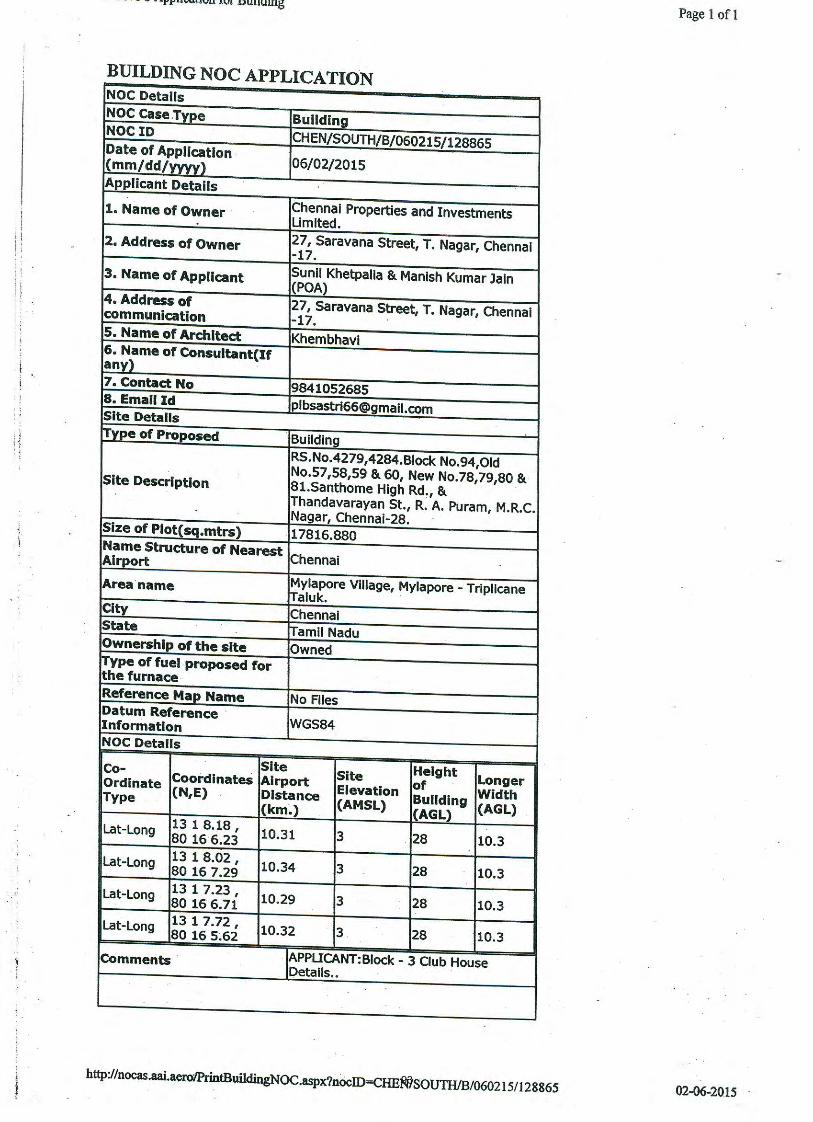
Annexure V
APPLICATION OF AIRPORT
NOC

89

90

91

92
93

94

Annexure VI
GEO TECHNICAL
INVESTIGATION REPORT


1
SOIL EXPLORATION AND FOUNDATION REPORT
FOR THE PROPOSED BUILDING
AT
"CONDOMINIUMS"
NO. 57, 58, 59 & 60
SOUTH BEACH ROAD
SANTHOME
CHENNAI
PROJECT NO. TJE/00597/2015
T.J.ENGINEERS
SOIL EXPLORATION AND FOUNDATION DESIGN DIVISION T.J.HOUSE
NO.4, ANNA NAGAR, 1P
STP STREET,
VELACHERY, CHENNAI-42. [email protected]
[email protected] Ph : 42 33 41 94.
95

2
CONTENTS OF THE REPORT
1.0 INTRODUCTION
2.0 SCOPE OF WORK
3.0 LOCATION AND NUMBER OF BORE HOLES
4.0 GEO TECHNICAL INVESTIGATION
4-1. Field Investigation of Bore Holes
4.2. Grain Size Analysis
4-3. Laboratory Test for Bore Hole Sample
5.0 BORE HOLE DATA
6.0 LABORATORY TEST RESULTS
7.0 GROUND WATER TABLE
8.0 SUB SOIL PROFILE
9.0 FOUNDATION ANALYSIS AND DESIGN
9.1. Computation of Safe Bearing Capacity of the soil at 2.10m depth
9.2. Load carrying capacity of conventional pile
10.0 CONCLUSIONS
11.0 TABLES AND FIGURES
96

3
EXPLORATION REPORT
PROJECT NO. TJE/00597/2015
1.INTRODUCTION:
M/S LANDMARK HOUSING PROJECTS CHENNAI PVT. LTD., has proposed to
construct a Basement Floor + Sixteen Floors Building at "Condominiums" No. 57,
58, 59 & 60, South Beach Road, Santhome, Chennai. The work was entrusted to T.J.
Engineers by the promoter. The location is shown in Fig No.1. The object of the soil
exploration work done is to determine the soil properties of the proposed area and to
arrive at a most suitable type of foundation system for the proposed structure.
2.0 SCOPE OF WORK
The Scope of Work includes the following
BOREHOLES
� Drilling of borehole at the proposed borehole locations as per the
direction of the client.
� Collection of disturbed and undisturbed soil samples and carrying out
the relevant laboratory test on soils.
� Conduction of standard penetration test (SPT) within the borehole at
every 1.50m depth interval or as required.
� Collection of soil sample from bore hole.
� Preparation of geotechnical investigation Report.
3.0 LOCATION & NUMBER OF BORE HOLES
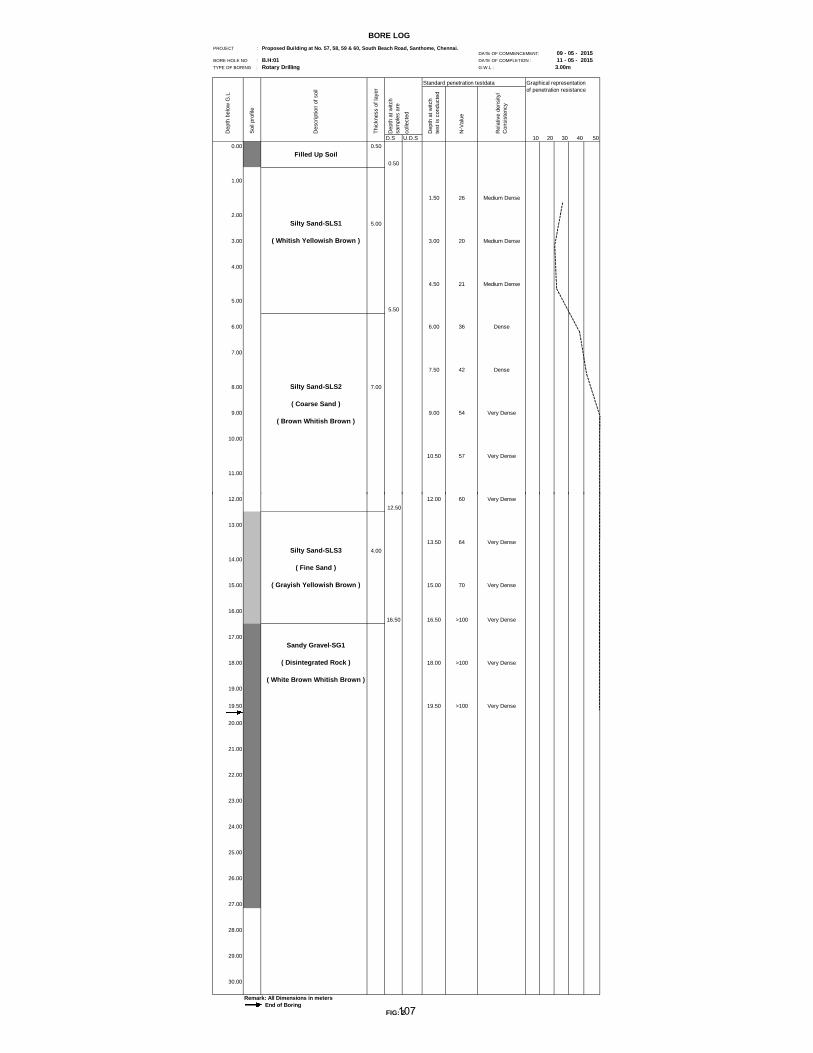
For this purpose five bore holes were bored up to maximum depth of 26.00m below
existing ground level. The bore hole location is shown in Fig No.1 and bore log
details are given in Fig No. 2,3,4,5&6. The bore holes were terminated in the Very
Dense Soft Rock layer.
97

4
4.0 GEOTECHNICAL INVESTIGATIONS
4.1 Filed Investigations of Boreholes
Rotary boring technique was adopted for boring in this area. The Standard
penetration tests were conducted at change of layers and at specified intervals,
commencing the test at 1.50m below the existing ground level. The relative density
of different soil layers obtained from the N-Values are given in the Fig No. 2,3,4,
5&6. Disturbed and undisturbed samples were collected from all the layers for visual
observation, classification tests and strength characteristics of the soil layers.
Standard Penetration Test (SPT)
Standard Penetration Tests were conducted using a split spoon sampler, as per
relevant code provision (IS: 2131 – 1981). The SPT is generally conducted in sandy
and completely weathered rock strata till 45 cm penetration with number of blows
recorded for every 15 cm penetration. The number of blows required for first 15 cm
in neglected. The blows for last 30 cm penetration or refusal ‘N’ value of 100
whichever is earlier is taken as the ‘N’ value. In the clayey strata, when driving of
sampling tube is not possible, SPT was conducted to know the consistency of the soil
strata and to retrieve the disturbed soil sample. The soil samples obtained in the split
spoon sampler are carefully packed in polythene bags for testing in the laboratory.
The SPT values obtained at every 1.50m interval are given in the bore logs.
4.2. Grain Size Analysis
Combined sieve and hydrometer analyses were conducted on the various samples
collected. The results are given in Table-1a&1b. Based on the proportion of the
different soil constituents, the soil is classified.
98

5
4.3 Laboratory Tests for Borehole samples
The following laboratory tests were conducted on collected Soil Samples.
I. Moisture Content as per IS: 2720 (Part 2)
II. Specific Gravity as per IS: 2720 (Part 2)
III. Sieve Analysis as per IS: 2720 (Part 4)
IV. Hydrometer Analysis as per IS: 2720 (Part 4)
V. Liquid Limit as per IS: 2720 (Part 5)
VI. Plastic Limit as per IS: 2720 (Part 5)
VII. Swelling Index as per IS: 2720 (Part 40)
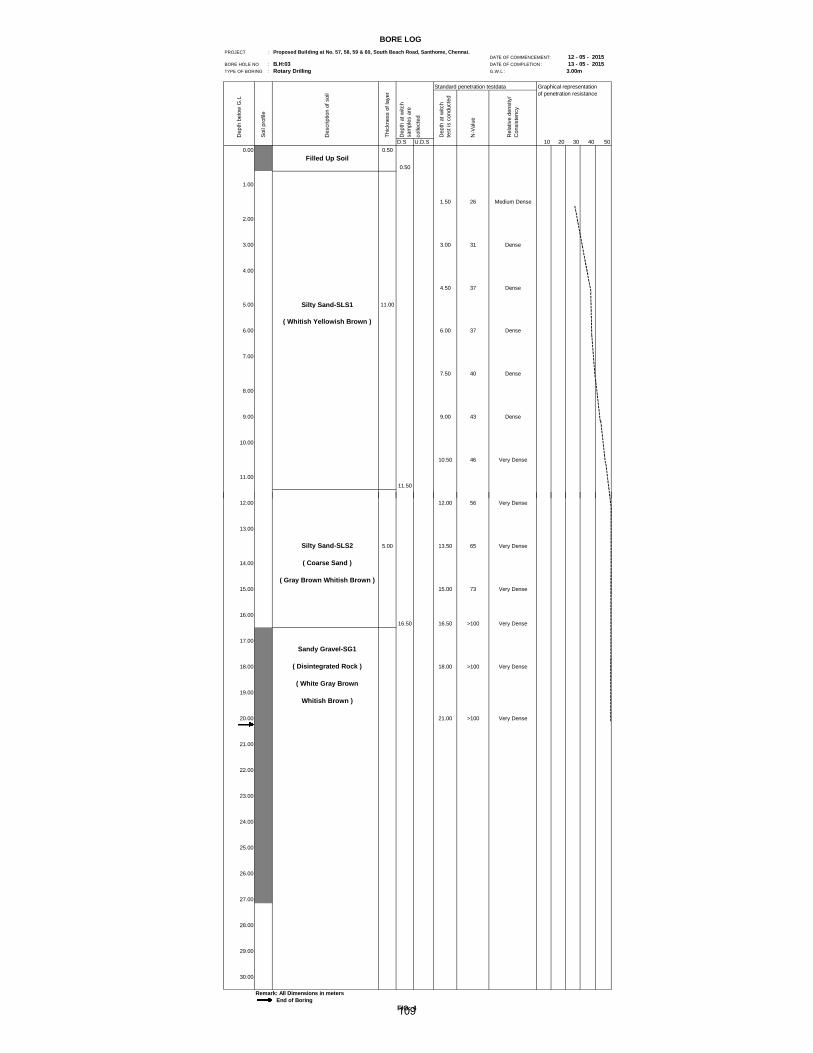
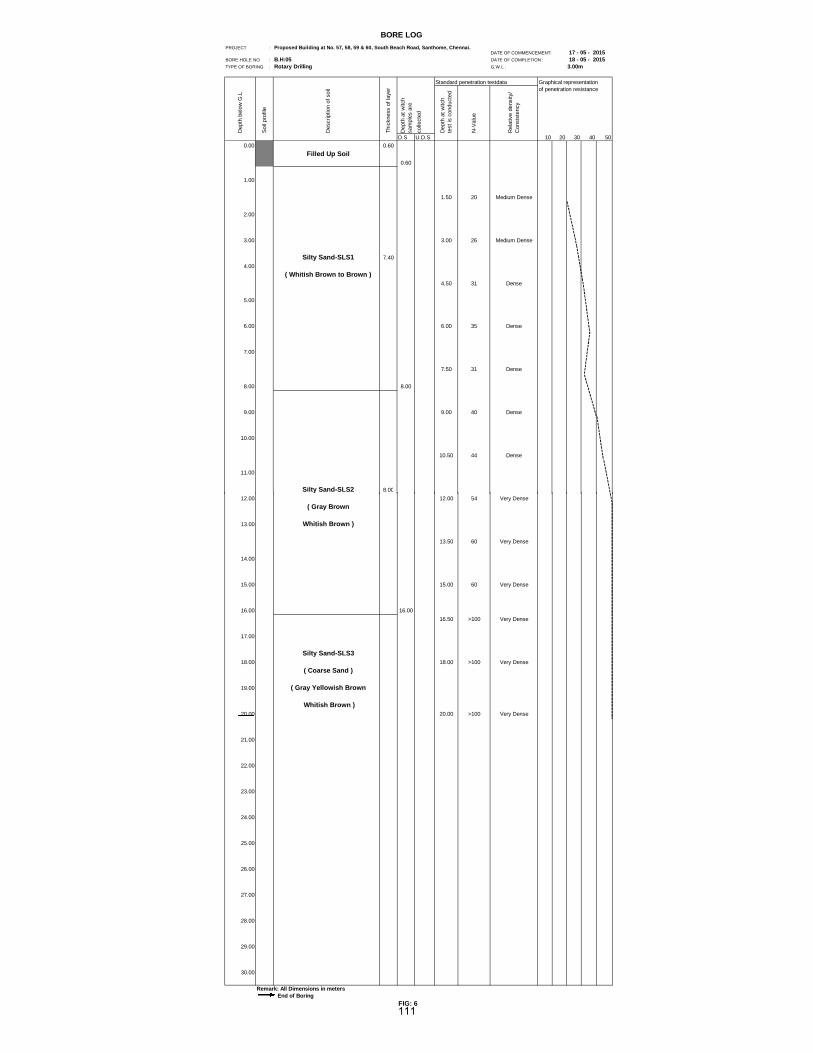
5.0 BORE LOG DATA
The Summary of bore hole log data for BH-01, BH-02, BH-03, BH-04 & BH-05 is
given in Fig-2,3,4,5&6. Bore hole location is given in Fig.1
6.0 LABORATORY TEST RESULTS
The laboratory test results of boreholes samples are presented in Table-1a,1b &
Table-2a,2b.
7.0 GROUND WATER TABLE
The ground water table was encountered at the depth of 3.00m, below the existing
ground level at the time of soil exploration.
8.0 SUB SOIL PROFILE
From the visual identification from field test results, it is concluding that the sub soil
strata is made-up of six distinctive layers.
i. Filled Up Soil 0.00m to 1.00m
ii. M. Dense to Very Dense Silty Sand layer 1.00m to 10.00m SPT’s N=17-54
iii. Very Dense Silty Sand layer 10.00m to 17.00m SPT’s N=44-77
iv. Very Dense Sandy Gravel/Gravelly Sand 17.00m to 22.00m SPT’s N=80-100
v. Very Dense Disintegrated rock 22.00m to 24.00m SPT’s N=>100
99

6
vi. Very Dense Soft Rock 24.00m to 26.00m SPT’s N=>100
The soil profile details are presented in the Bore logs, Presented in Fig-2,3,4,5&6.
9.0. FOUNDATION ANALYSISAND DESIGN
From the bore log data at the top from 0.00m to 1.00m filled up soil is
present. From 1.00m to 10.00m medium dense to dense Silty Sand layer is present.
From 10.00m to 17.00m very dense Silty Sand layer is present. From 17.00m to
22.00m very dense Sandy Gravel/ Gravelly Sand layer is present. From 22.00m to
24.00m disintegrated rock layer is present. Below 24.00m Soft Rock layer is seen, this
layer is fair to rest the pile foundation for heavy loaded structure.
The soil up to 17.00m is the critical zone for open foundation for medium loaded
structure, within the critical zone medium dense very dense to very dense Silty Sand
layer is present. For medium loaded structure Isolated Footing or Continuous Strip
Raft Foundation or Raft Foundation can be adopted. The open foundation can be
placed at the minimum depth 2.10m below the existing ground level. The proposed
structure has got basement floor the SBC at different level has been worked out and
given below.
The proposed structure is high raised, if the SBC is not sufficient for the expected
loading intensity, structure not stable for horizontal force, structure with column
positions are not symmetrical and long span, sensitive for differential settlement, it is
advisable to provide deep foundation of pile foundations. The pile foundation can be
Bored Cast in situ pile or Driven Pile. The pile foundation should be terminated at the
minimum depth of 26.00m below existing ground level, existing ground level at the
time of soil investigation.
100

7
9.1. COMPUTATION OF THE SAFE BEARING CAPACITY AT 2.10m DEPTH Based on the standard penetration test value the ultimate load carrying capacity (qu)
could be calculated from the following formula.
qu = (γ’ Df + (γ- γ’) Dw) Nq + 0.4 γ’ B N γ
The observed N-Value is taken as 20 from Fig. 2,3,4,5&6.
The corresponding bearing capacity factors are,
Nq = 23.89
Nγ = 22.61
Where,
γ = Bulk density = 1.50 t/m 3
γ’ = Submerged density = 0.50 t/m 3
Df = Depth of footing = Considered minimum of 2.10 m.
Dw = Depth of water table = Considered at 1.00m
B = Breadth of the footing = Consider minimum of 1.00m.
Substitute all the above values in the formula,
Qu = (0.50x2.10 + (1.50- 0.50)1.00) 23.89 + 0.4 x 0.50 x 1.00 x 22.61
= 48.97 + 4.52
= 53.49 t/m 2
Safe bearing capacity could be considered with a factor of safety of 2.5
Hence, safe bearing capacity q s = 53.49 / 2.50 = 21.39 t/m 2.
Therefore, Safe Bearing Capacity of the soil at the depth of 2.10m is 21.00 t/m 2
101

8
9.2. LOAD CARRYING CAPACITY OF THE CONVENTIONAL PILE
Based on the standard penetration test value the ultimate load carrying capacity (qu)
could be calculated from the following formula.
Qu = Qb + Qs
Qs = Ultimate unit skin friction on an individual layer
= Ks σ’ vo tan δ π D L
Where
Ks = Co-efficient of horizontal soil stress = 0.471
σ’ vo = average effective overburden pressure = 11.50 t/m2
δ = angle of wall friction = 32
D = Dia meter of pile = 0.40m
L = Length of individual layer = 6.00m
= 0.471 x 11.50 x 0.624 x 3.14 x 0.40 x 6.00
= 25.47 t
qb = Nq σ’ vo Ab
where
Nq = Bearing Capacity Factor = 110
σ’ vo = effective overburden pressure at the toe = 13.00 t/m2
Ab = Cross sectional area at the base
D = Dia of Pile = 0.40m
= 110 x 13.00 x 3.14 x 0.40 2 /4
102

9
= 179.61 t
Qu = Qb + Qs
= 179.61 + 25.47 = 205.08 t
Q safe = Qu/F.S = 205.08/2.5 = 82.03 say 82.00 t
The safe load carrying capacity for five different diameter of piles for the depth of
26.00m are worked and are given below.
Dia of Pile Depth of Pile Safe Load (Tones)
400mm 26.00m 82
450mm 26.00m 102
500mm 26.00m 125
600mm 26.00m 177
750mm 26.00m 272
The above safe loads are provisional and shall be confirmed by conducting pile load
test as per the guide line laid down in IS: 2911 (Part: IV).
103

10
10.0. CONCLUSIONS
1. Soil in the shallow depth is fair to adopt open foundation system for medium
loaded structure.
2. The foundation can be Isolated Footing or Continuous Strip Footing
(Inverted T Beam) or Raft Foundation.
3. The foundation can be placed at the minimum depth of 2.10m below existing
ground level (existing ground level considered as the ground level at the time of
soil investigation).
4. The proposed structure has got basement floor the Safe Bearing Capacity
(SBC) at different level has been worked out and given below.
Sl. No. Depth ( m) SBC (t / m2)
1. 2.10 20
2. 2.50 23
3. 3.00 26
4. 3.50 28
5. 4.00 30
5. The minimum width of footing should be maintained as 1.00m to avoid any
punching shear failure and to achieve suggested SBC.
6. The shallow foundation should rest on natural un disturbed Silty Sand layer.
7. All the foundation should rest on 100 mm thick 1:4:8 concrete mat, over 100mm
thick river sand layer.
8. If Isolated footing provided it is advisable to provide plinth beam connecting
all column on both direction, continuous belt beam at floor level, continuous
sill slab, continuous lintel beam.
104

11
9. Since the soil strata is of sandy precaution should be taken in deep excavation
for underground sump, Swimming pool and septic tank etc. The soil under
footing should not get disturbed, if get disturbed the foundation (footing) depth
should be taken up to the deep excavation depth. The foundation should rest
on the undisturbed strata.
10. If open foundation provided proper dewatering system should be provided,
the soil should not get loosened due to soil boiling.
11. The proposed structure is high raised, if the SBC is not sufficient for the
expected loading intensity, structure not stable for horizontal force, structure
with column positions are not symmetrical and long span, sensitive for
differential settlement, it is advisable to provide deep foundation of pile
foundations. The pile foundation can be Bored Cast in situ pile or Driven Pile.
The pile foundation should be terminated at the minimum depth of 26.00m
below existing ground level, existing ground level at the time of soil
investigation.
12. The safe load carrying capacity for five different diameter of piles for the depth
of 26.00m are worked and are given below.
Dia of Pile Depth of Pile Safe Load (Tones)
400mm 26.00m 82
450mm 26.00m 102
500mm 26.00m 125
600mm 26.00m 177
750mm 26.00m 272
105

12
The above safe loads are provisional and shall be confirmed by conducting pile load
test as per the guide line laid down in IS: 2911 (Part: IV)
13. The pile should be anchored in to the very dense soft rock layer for minimum
2.00m depth.
14. It is advisable to do piling with Hydraulic Rotary drilling with DMC method.
15. The bore hole should be flushed properly before laying concrete.
16. The soil strata is more of sandy, proper precaution should be taken against
sliding of bore hole by maintaining proper dense bentonite slurry or temporary
casing or permanent casing.
17. The soil strata is pure sand Pile concreting should be done as soon as boring
operation is over.
18. It is advisable not to mix pile foundation and shallow foundation in same
building.
19. For foundation design stress due to any eccentricity and horizontal force also
to be considered, and stability should be checked.
20. Depending upon the shape of the structure and horizontal force, type of
foundation can be decided.
21. All suggested foundation recommendations and precautions should be adopted
while undertaking the design aspects and construction activities.
For T.J. Engineers
27 – 05 - 2015
106
BORE LOG
PROJECT :DATE OF COMMENCEMENT: 09 - 05 - 2015
BORE HOLE NO : B.H:01 DATE OF COMPLETION : 11 - 05 - 2015TYPE OF BORING : Rotary Drilling G.W.L : 3.00m
Standard penetration testdata Graphical representation
Dep
th b
elow
G.L
Soi
l pro
file
Des
crip
tion
of s
oil
Thi
ckne
ss o
f lay
er
Dep
th a
t witc
h
sa
mpl
es a
re
colle
cted
Dep
th a
t witc
h
te
st is
con
duct
ed
N-V
alue
Rel
ativ
e de
nsity
/
C
onsi
sten
cy
of penetration resistance
D.S U.D.S 10 20 30 40 50
0.00 0.50
Filled Up Soil0.50
1.00
1.50 26 Medium Dense
2.00
Silty Sand-SLS1 5.00
3.00 ( Whitish Yellowish Brown ) 3.00 20 Medium Dense
4.00
4.50 21 Medium Dense
5.00
5.50
6.00 6.00 36 Dense
7.00
7.50 42 Dense
8.00 Silty Sand-SLS2 7.00
( Coarse Sand )9.00 9.00 54 Very Dense
( Brown Whitish Brown )
10.00
10.50 57 Very Dense
11.00
Proposed Building at No. 57, 58, 59 & 60, South Beach Road, Santhome, Chennai.
12.00 12.00 60 Very Dense
12.50
13.00
13.50 64 Very Dense
Silty Sand-SLS3 4.00
14.00
( Fine Sand )
15.00 ( Grayish Yellowish Brown ) 15.00 70 Very Dense
16.00
16.50 16.50 >100 Very Dense
17.00
Sandy Gravel-SG1
18.00 ( Disintegrated Rock ) 18.00 >100 Very Dense
( White Brown Whitish Brown )19.00
19.50 19.50 >100 Very Dense
20.00
21.00
22.00
23.00
24.00
25.00
26.00
27.00
28.00
29.00
30.0030.00
Remark: All Dimensions in meters End of Boring
FIG: 2107

BORE LOG
PROJECT :DATE OF COMMENCEMENT: 11 - 05 - 2015
BORE HOLE NO : B.H:02 DATE OF COMPLETION : 12 - 05 - 2015TYPE OF BORING : Rotary Drilling G.W.L : 3.00m
Standard penetration testdata Graphical representation
Dep
th b
elow
G.L
Soi
l pro
file
Des
crip
tion
of s
oil
Thi
ckne
ss o
f lay
er
Dep
th a
t witc
h
sa
mpl
es a
re
colle
cted
Dep
th a
t witc
h
te
st is
con
duct
ed
N-V
alue
Rel
ativ
e de
nsity
/
C
onsi
sten
cy
of penetration resistance
D.S U.D.S 10 20 30 40 50
0.00 1.00
Filled Up Soil
1.00 1.00
1.50 17 Medium Dense
2.00
3.00 3.00 24 Medium Dense
Silty Sand-SLS1 6.00
4.00
( Whitish Yellowish Brown )4.50 34 Dense
5.00
6.00 6.00 36 Dense
7.00 7.00
7.50 39 Dense
8.00
Silty Sand-SLS24.00
9.00 ( Whitish Yellowish 9.00 44 Dense
Whitish Brown )10.00
10.50 51 Very Dense
11.00 11.00
12.00 12.00 58 Very Dense
Proposed Building at No. 57, 58, 59 & 60, South Beach Road, Santhome, Chennai.
12.00 12.00 58 Very Dense
13.00
13.50 63 Very Dense
14.00
Silty Gravel Sand-SLGS1 9.00
15.00 15.00 68 Very Dense
( Coarse Sand )
16.00 ( Gray Brown Whitish Brown )16.50 80 Very Dense
17.00
18.00 18.00 >100 Very Dense
19.00
19.50 >100 Very Dense
20.00 20.00
21.00 Sandy Gravel-SG1 21.00 >100 Very Dense
( Disintegrated Rock )22.00
( White Gray Brown
23.00 Whitish Brown )
24.00
25.00
26.00
27.00
28.00
29.00
30.00
Remark: All Dimensions in meters End of Boring
FIG: 3108
BORE LOG
PROJECT :DATE OF COMMENCEMENT: 12 - 05 - 2015
BORE HOLE NO : B.H:03 DATE OF COMPLETION : 13 - 05 - 2015TYPE OF BORING : Rotary Drilling G.W.L : 3.00m
Standard penetration testdata Graphical representation
Dep
th b
elow
G.L
Soi
l pro
file
Des
crip
tion
of s
oil
Thi
ckne
ss o
f lay
er
Dep
th a
t witc
h
sa
mpl
es a
re
colle
cted
Dep
th a
t witc
h
te
st is
con
duct
ed
N-V
alue
Rel
ativ
e de
nsity
/
C
onsi
sten
cy
of penetration resistance
D.S U.D.S 10 20 30 40 50
0.00 0.50
Filled Up Soil0.50
1.00
1.50 26 Medium Dense
2.00
3.00 3.00 31 Dense
4.00
4.50 37 Dense
5.00 Silty Sand-SLS1 11.00
( Whitish Yellowish Brown )6.00 6.00 37 Dense
7.00
7.50 40 Dense
8.00
9.00 9.00 43 Dense
10.00
10.50 46 Very Dense
11.00
11.50
Proposed Building at No. 57, 58, 59 & 60, South Beach Road, Santhome, Chennai.
12.00 12.00 56 Very Dense
13.00
Silty Sand-SLS2 5.00 13.50 65 Very Dense
14.00 ( Coarse Sand )
( Gray Brown Whitish Brown )15.00 15.00 73 Very Dense
16.00
16.50 16.50 >100 Very Dense
17.00
Sandy Gravel-SG1
18.00 ( Disintegrated Rock ) 18.00 >100 Very Dense
( White Gray Brown19.00
Whitish Brown )
20.00 21.00 >100 Very Dense
21.00
22.00
23.00
24.00
25.00
26.00
27.00
28.00
29.00
30.00
Remark: All Dimensions in meters End of Boring
FIG: 4109

BORE LOG
PROJECT :DATE OF COMMENCEMENT: 14 - 05 - 2015
BORE HOLE NO : B.H:04 DATE OF COMPLETION : 17 - 05 - 2015TYPE OF BORING : Rotary Drilling G.W.L : 3.00m
Standard penetration testdata Graphical representation
Dep
th b
elow
G.L
Soi
l pro
file
Des
crip
tion
of s
oil
Thi
ckne
ss o
f lay
er
Dep
th a
t witc
h
sa
mpl
es a
re
colle
cted
Dep
th a
t witc
h
te
st is
con
duct
ed
N-V
alue
Rel
ativ
e de
nsity
/
C
onsi
sten
cy
of penetration resistance
D.S U.D.S 10 20 30 40 50
0.00 1.10
Filled Up Soil
1.00
1.10
1.50 21 Medium Dense
2.00
3.00 3.00 24 Medium Dense
4.00
4.50 28 Medium Dense
5.00 Silty Sand-SLS1 8.90
( Whitish Yellowish6.00 6.00 32 Dense
Whitish Brown )
7.00
7.50 34 Dense
8.00
9.00 9.00 42 Dense
10.00 10.00
10.50 54 Very Dense
11.00
Proposed Building at No. 57, 58, 59 & 60, South Beach Road, Santhome, Chennai.
12.00 12.00 56 Very Dense
13.00 Silty Sand-SLS2 7.00
( Brown White 13.50 61 Very Dense
14.00 Whitish Brown )
15.00 15.00 72 Very Dense
16.00
16.50 >100 Very Dense
17.00 17.00
18.00 18.00 >100 Very Dense
19.00
Silty Sand-SLS3 5.00
20.00 ( Whitish Brown to Brown ) 20.00 >100 Very Dense
21.00 21.00 >100 Very Dense
22.00 22.00 22.00 >100 Very Dense
Rock Core recovery 12%, RQD= 0
Disintegrated Rock23.00 2.00 23.00 >100 Very Dense
( Yellowish Brown to Gray ) Rock Core recovery 15%, RQD= 0
24.00 24.00 24.00 >100 Very Dense
Rock Core recovery 18%, RQD= 0
25.00 25.00 >100 Very Dense
Soft Rock Rock Core recovery 22%, RQD= 0
26.00 ( Yellowish Brown to Gray ) 26.00 >100 Very Dense
27.00
28.00
29.00
30.00
Remark: All Dimensions in meters End of Boring
FIG: 5110
BORE LOG
PROJECT :DATE OF COMMENCEMENT: 17 - 05 - 2015
BORE HOLE NO : B.H:05 DATE OF COMPLETION : 18 - 05 - 2015TYPE OF BORING : Rotary Drilling G.W.L : 3.00m
Standard penetration testdata Graphical representation
Dep
th b
elow
G.L
Soi
l pro
file
Des
crip
tion
of s
oil
Thi
ckne
ss o
f lay
er
Dep
th a
t witc
h
sa
mpl
es a
re
colle
cted
Dep
th a
t witc
h
te
st is
con
duct
ed
N-V
alue
Rel
ativ
e de
nsity
/
C
onsi
sten
cy
of penetration resistance
D.S U.D.S 10 20 30 40 50
0.00 0.60
Filled Up Soil0.60
1.00
1.50 20 Medium Dense
2.00
3.00 3.00 26 Medium Dense
Silty Sand-SLS1 7.40
4.00
( Whitish Brown to Brown )4.50 31 Dense
5.00
6.00 6.00 35 Dense
7.00
7.50 31 Dense
8.00 8.00
9.00 9.00 40 Dense
10.00
10.50 44 Dense
11.00
Silty Sand-SLS2 8.00
Proposed Building at No. 57, 58, 59 & 60, South Beach Road, Santhome, Chennai.
Silty Sand-SLS2 8.00
12.00 12.00 54 Very Dense
( Gray Brown
13.00 Whitish Brown )
13.50 60 Very Dense
14.00
15.00 15.00 60 Very Dense
16.00 16.00
16.50 >100 Very Dense
17.00
Silty Sand-SLS318.00 18.00 >100 Very Dense
( Coarse Sand )
19.00 ( Gray Yellowish Brown
Whitish Brown )20.00 20.00 >100 Very Dense
21.00
22.00
23.00
24.00
25.00
26.00
27.00
28.00
29.00
30.00
Remark: All Dimensions in meters End of Boring
FIG: 6111

112

LABORATARY TEST RESULTS TABLE -1a
B.H NoLayer
thickness Soil classificationSP.
gravity%of free
swell RemarksDS / SPT UDS Clay Silt Sand Gravel
m m m % % % % %
0.00 - 0.50 Filled Up Soil _ _ _ _ _ _ _ _ _
0.50 - 5.50 Silty Sand-SLS1 1.50 _ 2.63 _ 0 12 88 0 _
1 5.50 - 12.50 Silty Sand-SLS2 6.00 _ 2.64 _ 0 6 94 0 _
12.50 - 16.50 Silty Sand-SLS3 13.50 _ 2.64 _ 0 9 91 0 _
16.50 - 19.50 Sandy Gravel-SG1 19.50 _ 2.64 _ 0 0 48 52 _
0.00 - 1.00 Filled Up Soil _ _ _ _ _ _ _ _ _
1.00 - 7.00 Silty Sand-SLS1 1.50 _ 2.63 _ 0 11 89 0 _
2 7.00 - 11.00 Silty Sand-SLS2 7.50 _ 2.63 _ 0 9 91 0 _
11.00 - 20.00 Silty Gravel Sand-SLGS1 12.00 _ 2.64 _ 0 6 85 9 _
20.00 - 21.00 Sandy Gravel-SG1 21.00 _ 2.64 _ 0 0 29 71 _
Depth of sample collected
Grain size distribution
113

LABORATARY TEST RESULTS TABLE -1b
B.H NoLayer
thickness Soil classificationSP.
gravity%of free
swell Remarks
DS / SPT UDS Clay Silt Sand Gravelm m m % % % % %
0.00 - 0.50 Filled Up Soil _ _ _ _ _ _ _ _ _
3 0.50 - 11.50 Silty Sand-SLS1 1.50 _ 2.63 _ 0 12 88 0 _
11.50 - 16.50 Silty Sand-SLS2 12.00 _ 2.63 _ 0 7 93 0 _
16.50 - 20.00 Sandy Gravel-SG1 20.00 _ 2.63 _ 0 0 26 74 _
0.00 - 1.10 Filled Up Soil _ _ _ _ _ _ _ _ _
1.10 - 10.00 Silty Sand-SLS1 1.50 _ 2.63 _ 0 14 86 0 _
4 10.00 - 17.00 Silty Sand-SLS2 10.50 _ 2.63 _ 0 9 91 0 _
17.00 - 22.00 Silty Sand-SLS3 18.00 _ 2.63 _ 0 8 92 0 _
22.00 - 24.00 Disintegrated Rock 22.00 _ 2.63 _ 0 0 0 0 _
24.00 - 26.00 Soft Rock 26.00 _ 2.62 _ 0 0 0 0 _
0.00 - 0.60 Filled Up Soil _ _ _ _ _ _ _ _ _
5 0.60 - 8.00 Silty Sand-SLS1 1.50 _ 2.63 _ 0 13 87 0 _
8.00 - 16.00 Silty Sand-SLS2 9.00 _ 2.63 _ 0 8 92 0 _
16.00 - 20.00 Silty Sand-SLS3 20.00 _ 2.63 _ 0 6 94 0 _
Depth of sample collected
Grain size distribution
114

LABORATARY TEST RESULTSTABLE -2a
B.H No Layer thickness Soil classification LL PL
Bulk density Remarks
DS / SPT UDS eo Cc Cu Om m m % % t/m3 t/m2 degree
0.00 - 0.50 Filled Up Soil _ _ _ _ _ _ _ _ _ _
0.50 - 5.50 Silty Sand-SLS1 1.50 _ _ _ 1.50 _ _ _ 33 _
Depth of sample collected
Consolidation Parameters
Shear Strength Parmeters
1 5.50 - 12.50 Silty Sand-SLS2 6.00 _ _ _ 1.50 _ _ _ 36 _
12.50 - 16.50 Silty Sand-SLS3 13.50 _ _ _ 1.55 _ _ _ 38 _
16.50 - 19.50 Sandy Gravel-SG1 19.50 _ _ _ 1.60 _ _ _ 40 _
0.00 - 1.00 Filled Up Soil _ _ _ _ _ _ _ _ _ _
1.00 - 7.00 Silty Sand-SLS1 1.50 _ _ _ 1.50 _ _ _ 32 _
2 7.00 - 11.00 Silty Sand-SLS2 7.50 _ _ _ 1.50 _ _ _ 35 _
11.00 - 20.00 Silty Gravel Sand-SLGS1 12.00 _ _ _ 1.55 _ _ _ 38 _
20.00 - 21.00 Sandy Gravel-SG1 21.00 _ _ _ 1.60 _ _ _ 40 _
115

LABORATARY TEST RESULTSTABLE -2b
B.H No Layer thickness Soil classification LL PL
Bulk density Remarks
DS / SPT UDS eo Cc Cu Om m m % % t/m3 t/m2 degree
0.00 - 0.50 Filled Up Soil _ _ _ _ _ _ _ _ _ _
3 0.50 - 11.50 Silty Sand-SLS1 1.50 _ _ _ 1.50 _ _ _ 33 _
11.50 - 16.50 Silty Sand-SLS2 12.00 _ _ _ 1.54 _ _ _ 36 _
16.50 - 20.00 Sandy Gravel-SG1 20.00 _ _ _ 1.60 _ _ _ 40 _
0.00 - 1.10 Filled Up Soil _ _ _ _ _ _ _ _ _ _
Depth of sample collected
Consolidation Parameters
Shear Strength Parmeters
0.00 - 1.10 Filled Up Soil _ _ _ _ _ _ _ _ _ _
1.10 - 10.00 Silty Sand-SLS1 1.50 _ _ _ 1.50 _ _ _ 33 _
4 10.00 - 17.00 Silty Sand-SLS2 10.50 _ _ _ 1.50 _ _ _ 36 _
17.00 - 22.00 Silty Sand-SLS3 18.00 _ _ _ 1.55 _ _ _ 40 _
22.00 - 24.00 Disintegrated Rock 22.00 _ _ _ 1.60 _ _ _ 42 _
22.00 - 26.00 Soft Rock 26.00 _ _ _ 1.65 _ _ _ 45 _
0.00 - 0.60 Filled Up Soil _ _ _ _ _ _ _ _ _ _
5 0.60 - 8.00 Silty Sand-SLS1 1.50 _ _ _ 1.50 _ _ _ 33 _
8.00 - 16.00 Silty Sand-SLS2 9.00 _ _ _ 1.52 _ _ _ 36 _
16.00 - 20.00 Silty Sand-SLS3 20.00 _ _ _ 1.60 _ _ _ 40 _
116

117

118

119

120

Annexure VII
AUTHENTICITY OF BASELINE
MONITORING REPORT


121

122

123

124
125

126
127

128

129

130

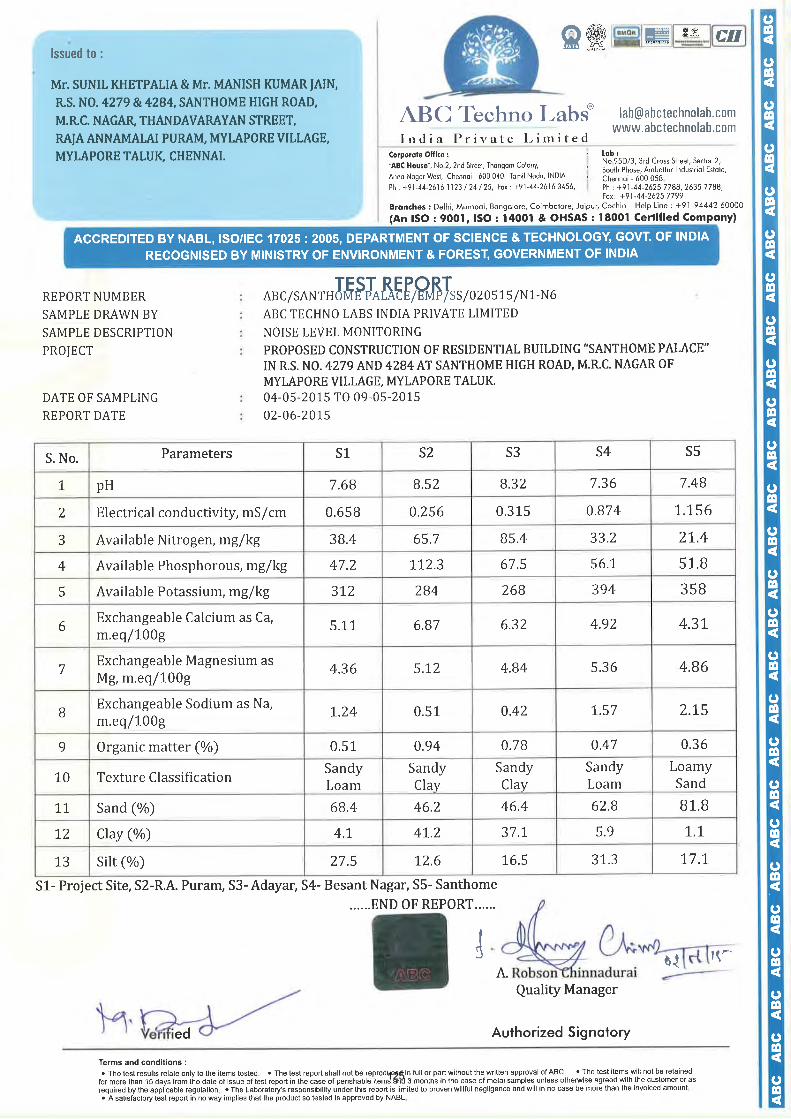
Annexure VIII
SEWAGE TREATMENT
PLANT REPORT


SEWAGE TREATMENT PLANT - 280 KLD
It is proposed to install a sewage treatment plant, in order to conserve water. The
sewage treatment plant will be designed to ensure that treated effluent characteristics
are well below / within the permissible limits, even under varying flow conditions,
which are typical for such systems. This implies that the selected process will be able to
withstand the peak load situation.
The sewage treatment plant shall treat the domestic effluent generated from the toilets,
hand wash, pantry etc, and re use the water for toilet flushing and landscaping. The
sewage treatment plant is designed with a capacity to handle 280 cu.m of soil water
from the Building.
The proposed sewage treatment plant is of “Extended Aeration type system”. It
envisaged collecting all the sewage water through piping network with battery of
inspection chambers and manholes and taken into a raw sewage water collection sump
/ equalization tank through a bar screen chamber. The equalization tank will have a
retention capacity of approximately 9 times the flow rate. Sewage from this tank is
constantly pumped to Aeration tank using effluent transfer pumps to achieve
continuous re - circulation arrangement of the contents of the equalization tank.
The aeration tank will have a detention time varying from 8 to 10 times the flow rate for
continuous aeration. Aerated waste will be allowed to settle in a secondary settling tank
and over flow is let in to semi treated effluent sump. The sludge will be partly fed back
to aeration tank by pumping and the remaining sludge pass through sludge handling
system consisting of automatic filter press, sludge thickener, dry cake handling
equipment, poly electrolyte dosing for disposal. Dried cake will be removed and used as
manure for plants. From semi treated water collection sump, water will be pumped
through activated carbon filter, pressure sand filter and pumped and stored in a treated
water tank used for landscaping after disinfection. From this tank, treated water will be
used for landscaping purpose with separate network of pipelines and pumping system.
A part of the treated water will be earmarked for toilet flushing and will be fed through
ultra filtration process prior to feed to toilet cisterns. The treated effluent from the
Sewage Treatment Plant will be used for irrigation and landscaping purposes. If filter
131

press or sludge drying beds are not opted, periodic cleaning of sludge shall be carried
out by tankers.
DESIGN DETAILS OF STP
Dwelling type Residential apartment
complex
Diversity factor 0.9
Sewage generated 280 KLD
Bar Screen Chamber:
Average daily flow 280 KLD
Average hourly flow 11.66666667 m3/hr
0.0032 m3/sec
Peak hourly flow 35 m3/hr
Design flow velocity 0.3 m/sec
Cross-sectional area of screen channel 0.011 m2
Adjust for the flow-area blocked by the bars
0.016 m2
Required minimum dimensions 0.1 m x 0.1 m
Equalization Tank:
STP quantity 280 m3/day
Hourly average sewage inflow 11.66666667 m3/hr
Equalization tank 30 m3
volume 30 m3
Freeboard 0.3 to 0.5 m
Water depth in tank (excluding freeboard) 2.0 to 2.5 m
Tank area 15 m2
Diffusers required Select size and number to suit the dimensions of the tank
132

Raw Sewage Lift Pumps:
STP quantity 280 m3/day
Pump capacity 14 m3/hr
Quantity 2 Nos. (1w+1s)
Aeration Tank:
STP quantity 280 KLD
BOD in sewage 300 mg/L
0.000300 Kg/L
BOD load/day 84 Kg/day
F/M ratio 0.12
M (Biomass) 700 Kg
Design MLSS level 3500 mg/L
3.5 kg/ m3
Aeration tank volume 200 m3
Average retention time 17.14 hrs
Depth of aeration tank 3 m
Area of aeration tank 67 m2
Width of aeration tank 3.6 m
Length of aeration tank 19 m
BOD load per hour 3.82 Kg/hr
Air requirement for BOD 229 m3/hr
Air requirement for mixing 220 m3/hr
Air requirement for with respect to area of aeration Tank
Air requirement for mixing 133 m3/Hr
Air to be supplied Max Value 229 m3/hr
Select size of diffusers 90 OD x 1000 Length
133

No. of diffusers 29 Nos
Placement of diffusers 12 diffusers (6 pairs) are arranged in a row, set apart by 8 / 6 = 1.3 m
Diffuser configuration Each pair is separate, with its own air hose, nylon tie rope and ballast.
Clarifier Tank:
Design throughput flow 280 m3/day
Max. hourly throughput 14 m3/hr
Design overflow rate 16 m3/m2/day
0.67 m3/m2/hr
Cross-sectional area of tank 21 m2
Dimensions For a square tank- = 3 x 3 m
Side of the tank 4.582575695
For a circular tank- = 3.4 m Dia
Diameter of the tank 5.2
Depth of tank(2.5 m to 3.0 m) 2.5 m
Solids load 49 Kg/hr
Solids loading rate 2.33 Kg/m2/hr
Weir length in clarifier
for a square tank 9.16515139 RM
for a Circular tank 16 RM
Weir loading rate
for a square tank 30.55050463 m3/RM/day
for a Circular tank 17 m3/RM/day
Volume of tank 52.5 m3
Hydraulic detention time 4.5 hrs
134

Airlift Pump:
The airlift pump returns the active sludge to the aeration pump.
The airlift pumps require 5-10 m3/Hrto work.
The air-flow is adjusted till we achieve the exact sludge flow rate
Electric Pumps for Return Sludge:
These pumps are a less-preferred alternative to airlift pumps (see above). However, if
the prevailing conditions do not allow use of airlift pumps, or if the designer opts for
this design option, these pumps are necessary. The design requirements for these
pumps are same as those for the raw sewage lift pumps. Therefore the same pump
models can be selected for the return sludge application.
Sludge generation:
Design throughput flow 280 m3/day
Inlet BOD 300 mg/lit
Sludge production per day 39 Kg/day
Sludge-holding Tank:
Design throughput flow 280 m3/day
Maximum rate of sludge- recirculation 100 % of throughput sewage flow
Sludge tank capacity 5.833333333 m3
Pressure Sand Filter:
Design throughput flow 280 m3/day
Design filtration hours 20 hrs (per day)
Filtration rate 14 m3/hr
Loading rate on filter 12 m3/m2/hr
Filter cross-sectional area required (min) 1.166666667 m2
Diameter of filter (min) 1.2 m
135

Height of filter 1.5 - 1.8 m
Depth of sand layer 0.6 - 0.75 m
Activated Carbon Filter:
Design throughput flow 280 m3/day
Design filtration hours 20 hrs (per day)
Filtration rate 14 m3/hr
Loading rate on filter 10 m3/m2/hr
Filter cross-sectional area required (min) 1.4 m2
Diameter of filter (min) 1.3 m
Height of filter 1.5 - 1.8 m
Depth of carbon layer 0.6 - 0.75 m
UV Disinfection system:
Application Disinfection
System Ultra violet rays
Bulb Quartz
No of bulbs (2 - 4) 4 Nos
End Flanged end
Iength 1.5 m
Average hourly flow 14 m3/hr
Moc Stainless steel housing
Treated Water Collection Tank:
Average hourly flow 14 m3/hr
Requirement 3hrs of quick flow or 8 hours of average flow
Volume 112 m3
136

Mechanical Filter Press:
Design throughput flow 280 KLD
Design BOD removal 84 Kg/day
Excess Sludge produced 21 Kg/day
Slurry consistency (0.8 - 1.0) 0.8 %
Slurry volume 2625 L
Filter press operation 1 batch per day
Each batch takes 4 Hrs
Filter press feed pump 0.5 m3/Hr at 5 kg delivery pressure
Proportion of solids in the cake 0.25
Sludge cake volume 84 L
Cake-holding capacity of the filter press 84 L
Select filter press size 470 x 470
Cake thickness in chamber 20 - 25 mm
Required No. of chambers 26 Nos
PREVENTIVE MEASURES TO AVOID LEACHING OF TREATED SEWAGE INTO
NEARBY WATER COURSES:
Treated sewage from Sewage Treatment Plant will be conveyed to Treated Sewage
Tank through pipelines. All the joints from piping system will be checked periodically
and carrying treated wastewater pipes will be laid in conduits wherever road crossings
are expected.
Garland drains will be constructed all around the Residential Complex for intercepting
water from outside and inside. Thus no leaching of treated sewage into nearby water
courses shall take place. Supervisors will be employed for overall operation &
maintenance of water supply, waste water treatment and other utility services.
137

138
Annexure IX
TRAFFIC CONGESTION
STUDY REPORT


TRAFFIC CONGESTION STUDY REPORT
Background
The purpose of this study is to assist the client to study the regional transportation and
traffic connectivity to the site and to ensure that the proposed development is able to have
access to infrastructures needed for the future development and its functionality. This will
also help in assessing the impact of increase in traffic due to the proposed project. Since the
proposed project site is close to Santhome High Road, which has 2 lanes with dividend.
Another major access road is Thandavarayan Street Road which is connected to Santhome
High Road on west direction. Chances of traffic going slow are high during peak hours.
Traffic study was conducted at Santhome High Road location during May 2015 to cover all
possible traffic variations and to assess the peak traffic flow. The traffic study includes
counting, categorization etc.
Objective
Objective is to review and study the present traffic pattern in the main public roads in and
around the project site as well as to estimate the flow of traffic on completion of the
proposed project.
Site Environment and Traffic Movement
The proposed project site is located at R.S. No. 4279 and 4284 at Santhome High Road,
M.R.C. Nagar of Mylapore village, Mylapore Triplicane taluk, Chennai district, Tamil Nadu.
The main access road to the project site is Santhome High Road which connects to
Kamarajar promanade on North direction (OMR) and Rajiv Gandhi road on South direction.
The road have two way movements of vehicles which consist of different category of
vehicles like two wheeler, four wheeler, buses, autos and logistic vehicles.
139

Figure 1 - Traffic flow diagram of project site
140
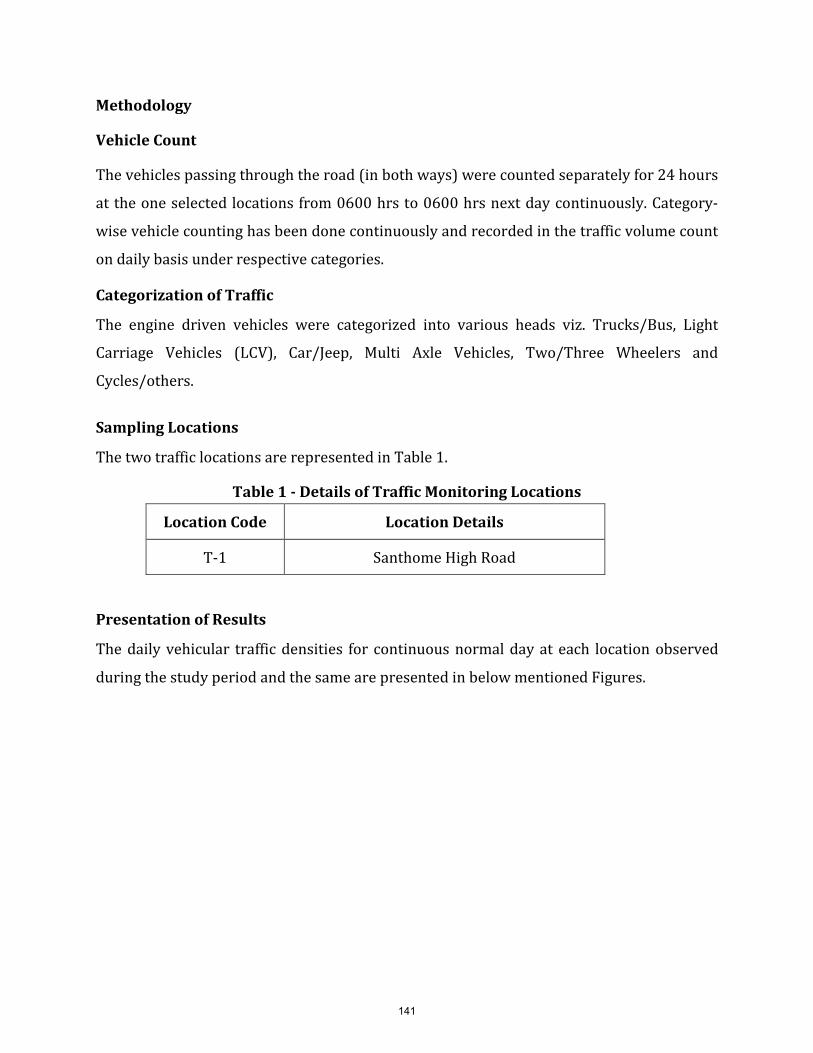
Methodology
Vehicle Count
The vehicles passing through the road (in both ways) were counted separately for 24 hours
at the one selected locations from 0600 hrs to 0600 hrs next day continuously. Category-
wise vehicle counting has been done continuously and recorded in the traffic volume count
on daily basis under respective categories.
Categorization of Traffic
The engine driven vehicles were categorized into various heads viz. Trucks/Bus, Light
Carriage Vehicles (LCV), Car/Jeep, Multi Axle Vehicles, Two/Three Wheelers and
Cycles/others.
Sampling Locations
The two traffic locations are represented in Table 1.
Table 1 - Details of Traffic Monitoring Locations
Location Code Location Details
T-1 Santhome High Road
Presentation of Results
The daily vehicular traffic densities for continuous normal day at each location observed
during the study period and the same are presented in below mentioned Figures.
141

Location Number : T-1 [Santhome High Road]
Details of Vehicle count
Total 18081 PCU/day Min 119 PCU/hr Max 1611 PCU/hr Average 753 PCU/hr
142
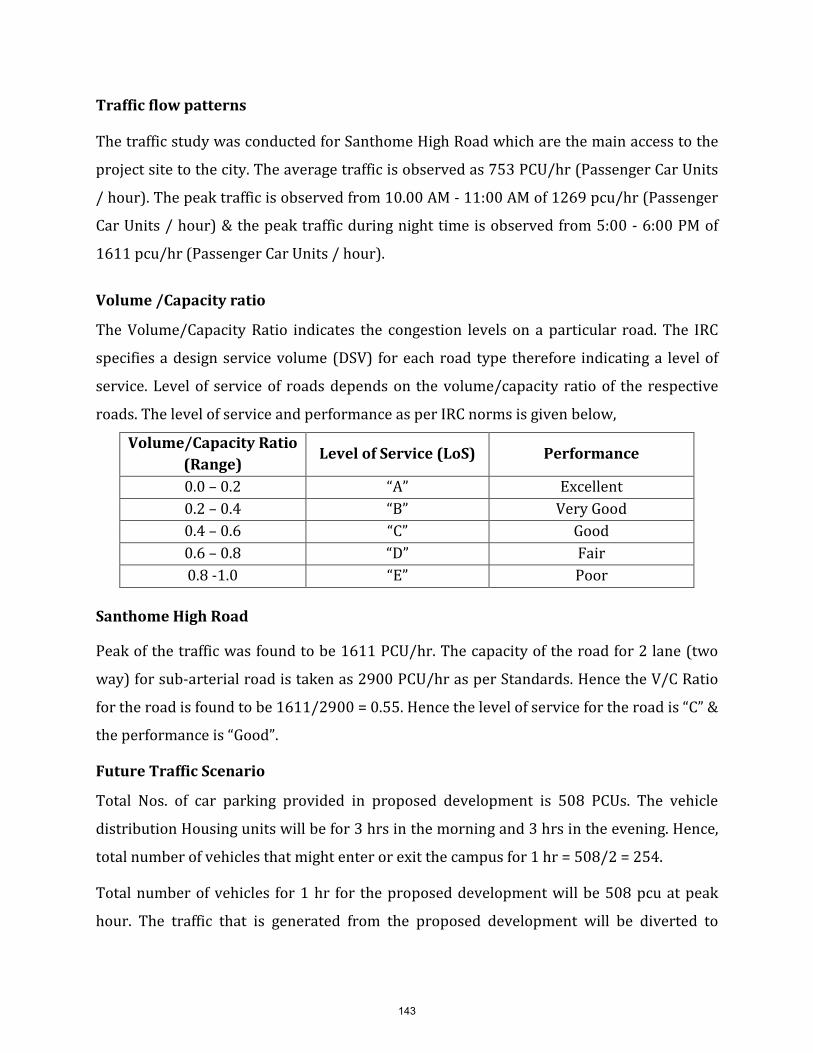
Traffic flow patterns
The traffic study was conducted for Santhome High Road which are the main access to the
project site to the city. The average traffic is observed as 753 PCU/hr (Passenger Car Units
/ hour). The peak traffic is observed from 10.00 AM - 11:00 AM of 1269 pcu/hr (Passenger
Car Units / hour) & the peak traffic during night time is observed from 5:00 - 6:00 PM of
1611 pcu/hr (Passenger Car Units / hour).
Volume /Capacity ratio
The Volume/Capacity Ratio indicates the congestion levels on a particular road. The IRC
specifies a design service volume (DSV) for each road type therefore indicating a level of
service. Level of service of roads depends on the volume/capacity ratio of the respective
roads. The level of service and performance as per IRC norms is given below,
Volume/Capacity Ratio (Range)
Level of Service (LoS) Performance
0.0 – 0.2 “A” Excellent 0.2 – 0.4 “B” Very Good 0.4 – 0.6 “C” Good 0.6 – 0.8 “D” Fair 0.8 -1.0 “E” Poor
Santhome High Road
Peak of the traffic was found to be 1611 PCU/hr. The capacity of the road for 2 lane (two
way) for sub-arterial road is taken as 2900 PCU/hr as per Standards. Hence the V/C Ratio
for the road is found to be 1611/2900 = 0.55. Hence the level of service for the road is “C” &
the performance is “Good”.
Future Traffic Scenario
Total Nos. of car parking provided in proposed development is 508 PCUs. The vehicle
distribution Housing units will be for 3 hrs in the morning and 3 hrs in the evening. Hence,
total number of vehicles that might enter or exit the campus for 1 hr = 508/2 = 254.
Total number of vehicles for 1 hr for the proposed development will be 508 pcu at peak
hour. The traffic that is generated from the proposed development will be diverted to
143
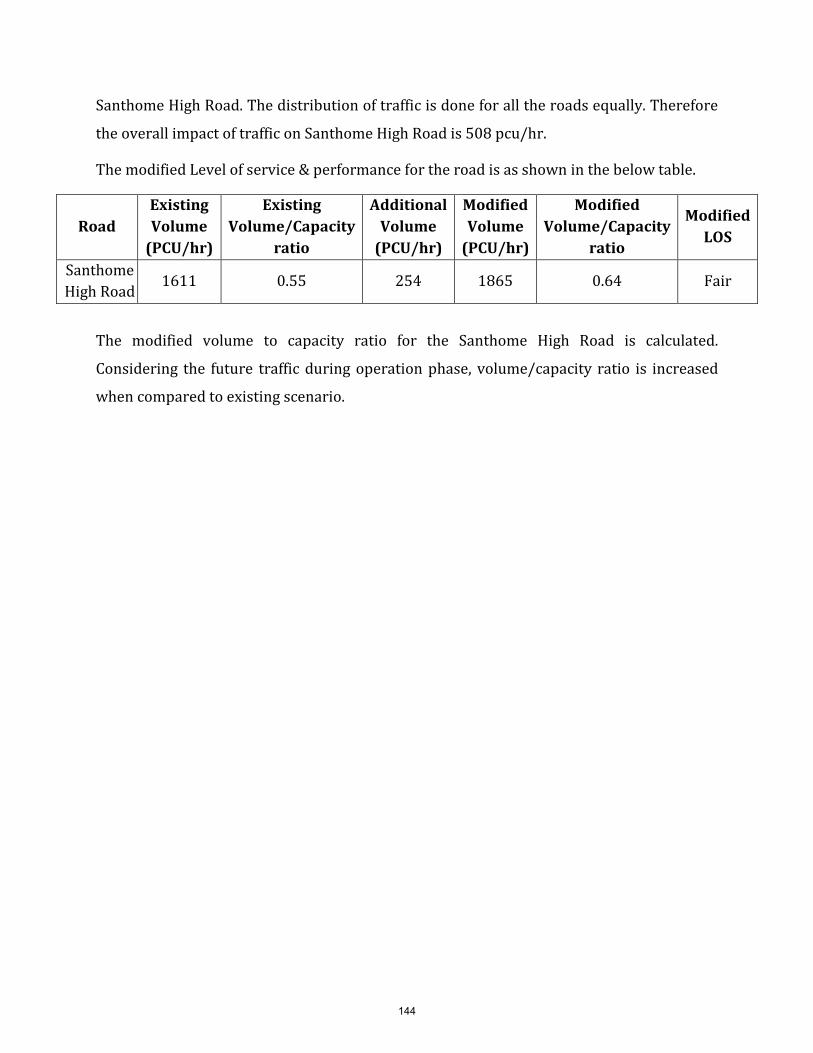
Santhome High Road. The distribution of traffic is done for all the roads equally. Therefore
the overall impact of traffic on Santhome High Road is 508 pcu/hr.
The modified Level of service & performance for the road is as shown in the below table.
Road Existing Volume
(PCU/hr)
Existing Volume/Capacity
ratio
Additional Volume
(PCU/hr)
Modified Volume
(PCU/hr)
Modified Volume/Capacity
ratio
Modified LOS
Santhome High Road
1611 0.55 254 1865 0.64 Fair
The modified volume to capacity ratio for the Santhome High Road is calculated.
Considering the future traffic during operation phase, volume/capacity ratio is increased
when compared to existing scenario.
144

Annexure X
FIRST AID FACILITIES

FIRST AID FACILITES
The proposed development shall be provided with all First Aid facilities to aid in case of
any emergencies,
First Aid Kits
(a) at least one or more Standard Workplace First Aid Kit and/or a Small Workplace
First Aid Kit
(b) any other additional first aid modules or items required to appropriately treat all
reasonably foreseeable injuries or illnesses that could occur as a result of being
at the workplace or as a result of the work performed there
(c) All employees will be made aware of the location of first aid kits and the kits
shall be:
conveniently located and easily accessible;
clearly marked; and
appropriately maintained
First Aid Kit Contents
The Standard Workplace and Small Workplace First Aid Kits shall be marked with an
approval number issued by the Therapeutic Goods Administration and contain (as a
minimum) the items described in Table 1.
The Standard Workplace and Small Workplace First Aid Kits are designed to provide
basic equipment for the provision of first aid for injuries and illnesses such as:
cardiac arrest;
cuts, scratches , punctures, grazes, splinters and animal bites;
minor burns;
amputations and/or major bleeding wounds;
broken bones; and
eye injuries
145

Table 1
Minimum Contents of First Aid Kit
ITEM STANDARD WORKPLACE
KID
SMALL WORKPLACE
KIT Minimum Quantity The first Aid instruction booklet (issued by the appropriate government authority)
1 1
Register of injuries (note book) and black pen 1 1 Resuscitation face mask 1 - Resuscitation face mask or face shield - 1 DRABCD/CPR flow chart (clarity visible and accessible e.g. laminated chart or sticker)
1 1
Disposable, powder-free latex gloves (NB: latex-free gloves to be provided if any first aider is allergic to latex)
5pairs 2pairs
Gauze pieces 7.5cm X7.5cm, stare(5 pieces per pack) 5 packs 2packs Saine (30mls sodium chloride 0.9%) 5 SBA Saine (15mls sodium chloride 0.9%) SBA 4 Wound clearing wipe/(single 1% certified Bp) 10 2 Adhesive dressing strips (packet of 50, individually wrapped)
1 1
Splinter probes – sterile & disposable.( NB: used splinter probes must be safely disposed of via suitable sharps container)
10 5
Tweezers stainless steel 12.5 cm 1 1 Antiseptic liquid, spray, powder or swab (e.g.povidone-iodine 10 % solution )
1 1
Non-adherent wound dressing/pad 5cm X5cm (small) 6 3 Non-adherent wound dressing/pad 7.5cm X10cm (medium)
3 1
Non-adherent wound dressing/pad 10cm X10cm (large)
1 SBA
Conforming cotton bandage 5cm X1.8m 3 1 Conforming cotton bandage 7.5cm X1.8m 3 1 Conforming cotton bandage 10cm X1.8m 1 SBA Scissors – stainless steel 12.5cm (blunt and sharp points)
1 1
Alcohol swabs- single 10 4 Non-stretch, hypoallergenic adhesive tape – 2.5cm wide roll
1 1
Safety pins (packet of 12) 1 1 BPC wound dressings no.14, medium 1 1 BPC wound dressings no.15, large 1 SBA Plastic bags – dip seal ( set of small, medium & large) 1 1 Triangular bandage ( calico or cotton minimum width 2 1
146
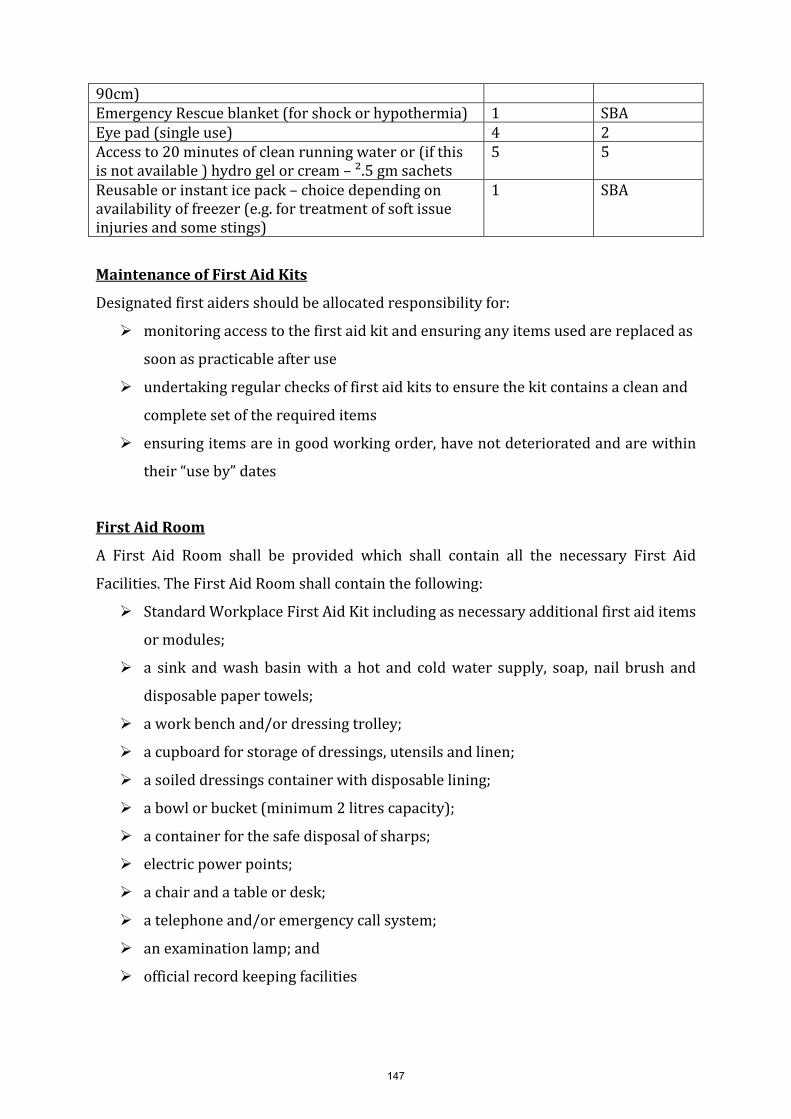
90cm) Emergency Rescue blanket (for shock or hypothermia) 1 SBA Eye pad (single use) 4 2 Access to 20 minutes of clean running water or (if this is not available ) hydro gel or cream – ².5 gm sachets
5 5
Reusable or instant ice pack – choice depending on availability of freezer (e.g. for treatment of soft issue injuries and some stings)
1 SBA
Maintenance of First Aid Kits
Designated first aiders should be allocated responsibility for:
monitoring access to the first aid kit and ensuring any items used are replaced as
soon as practicable after use
undertaking regular checks of first aid kits to ensure the kit contains a clean and
complete set of the required items
ensuring items are in good working order, have not deteriorated and are within
their “use by” dates
First Aid Room
A First Aid Room shall be provided which shall contain all the necessary First Aid
Facilities. The First Aid Room shall contain the following:
Standard Workplace First Aid Kit including as necessary additional first aid items
or modules;
a sink and wash basin with a hot and cold water supply, soap, nail brush and
disposable paper towels;
a work bench and/or dressing trolley;
a cupboard for storage of dressings, utensils and linen;
a soiled dressings container with disposable lining;
a bowl or bucket (minimum 2 litres capacity);
a container for the safe disposal of sharps;
electric power points;
a chair and a table or desk;
a telephone and/or emergency call system;
an examination lamp; and
official record keeping facilities
147

148

Annexure XI
FIRE SAFETY AND
PROTECTION MEASURES


FIRE SAFETY & PROTECTION
The fire extinguishers will be located all over the building for immediate use. The type
of hand appliances provided is such that the fire extinguishers can be directly taken and
used for fire fighting purpose at any location inside the building. The ring main hydrant
system consists of the hydrant valves, hose reels, heavy pipe to withstand a developing
pressure of 10 Kg/Sq.cm, branch pipes, M.S. hose box, anti – corrosive treatment,
pumps, priming tank, valves (Sluice valve, non- return valve, air release valve) and
cables.
The fire prevention measures referred to above should minimise the risk of fire.
However the possibility of a fire at any time for whatever reason cannot be totally
eliminated. The greatest danger arises if a fire occurs at night, when people are asleep.
The volumes of smoke produced by even a small fire can fill a room or corridor very
quickly. The presence of a functioning fire alarm system is provided as an early warning
of a fire. A notice of the procedures to be followed by guests in the event of a fire should
be provided in all guest bedrooms, displayed on the back of each bedroom door. This
concentrates on the evacuation of the premises when hearing the fire alarm or other
warning and drawing attention to the means of escape. Instructions are clear and
concise and are multi-lingual to cater for foreign guests. As guests are unlikely to be
familiar with the internal layout of the premises, the instructions include a simple
location map, indicating the escape routes relative to each room.
FIRE-FIGHTING EQUIPMENT
Every storey of the premises is provided with a minimum of one nine litres water type
or one four kilograms general-purpose powder fire extinguisher (or a number and type
of extinguishers with an equivalent rating).
MAINTENANCE OF FIRE PROTECTION EQUIPMENT AND BUILDING SERVICES
Non-fixed equipment would include portable fire extinguishers and fire-blankets. To
ensure safety all electrical installation and the heating and hot water systems are
149

checked periodically. Fire alarm systems are tested regularly and maintained to ensure
correct operation. Mains operated self-contained alarms are tested at least monthly by
the use of the test button provided on the units, to ensure operation of the sounders. All
alarms are tested at least once a year to ensure that they respond to fire.
ESCAPE ROUTES
In the event of a fire, the escape routes from the premises are available for use and are
not obstructed. The following precautions are taken in relation to all escape routes:
All escape routes are clearly indicated, are not obstructed, and are available for use at
all times;
• The exit doors are capable of being readily and easily opened at all times;
• The external areas at or near exits are not obstructed; and
• The security arrangements for the premises do not impede or prevent the use of
escape routes.
• Exit doors from the building should be capable of being opened from the inside
without the use of a key.
PROTECTED ESCAPE STAIRWAYS
A protected escape stairway is constructed. The walls, doors and ceiling forming the
enclosure to a protected escape stairway have a fire resistance of not less than 30
minutes. Every protected escape stairway leads directly to a place of safety outside the
building at the ground floor level. Escape stairways is also provided with openable
windows, and a roof-light at the top, for the purpose of providing smoke ventilation.
EMERGENCY LIGHTING
In the event of a fire, it is possible that the mains lighting system may fail and this would
make evacuation of the premises difficult, if not impossible. To provide for this, it is
normal a system of emergency lighting to illuminate the escape routes on failure of the
mains electrical supply is provided. Emergency lighting fittings are provided in
protected stairways and protected corridors/lobbies to indicate the direction of escape.
150

The emergency lighting system are regularly inspected, tested and maintained, as
recommended.
FIRE SAFETY RECORDS
A fire safety register for the premises is established and maintained. The register
contains a complete record of all fire safety matters on the premises, and kept up to date
and available for inspection if required.
The fire safety register includes the following information:
Details of premises, including the maximum number of guests accommodated
and details of escape routes;
Emergency and evacuation procedures;
A record of evacuation/fire drills carried out;
Details of fire safety training provided;
Details of fire-fighting equipment;
Details of fire alarm system and maintenance records;
A schedule of all fire resisting doors in the premises;
Details of emergency lighting and maintenance records; and
Details and maintenance records of building services.
151

152
Annexure XII
PERIOD OF COMPLETION BAR CHART


Month
S.No Description 2 4 8 12 16 20 24
1. Foundation Work
2. RCC Structure Work
3. Ceiling Plastering Work
4. Brick Work
5. External Wall Plastering Work
6. Painting Works
7. Plumbing Works
8. Electrical Works
9. Common Area Works
BAR CHART - PROJECT SCHEDULE
153

154

Annexure XIII
DATED SITE PHOTOGRAPHS


RECENT SITE PHOTOGRAPHS
07/05/2015
07/05/2015
155
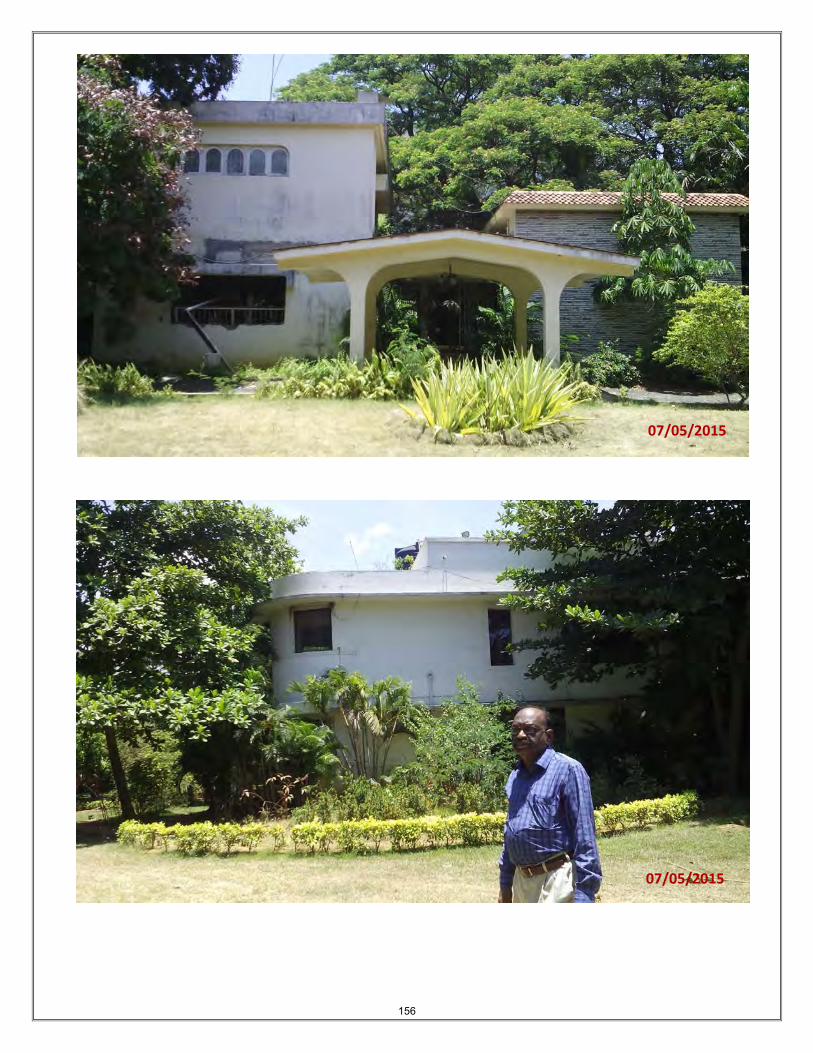
07/05/2015
07/05/2015
156

Annexure XIV
ACKNOWLEDGEMENT OF COMMITMENT LETTER FOR
WATER SUPPLY AND SEWAGE DISPOSAL


157

158

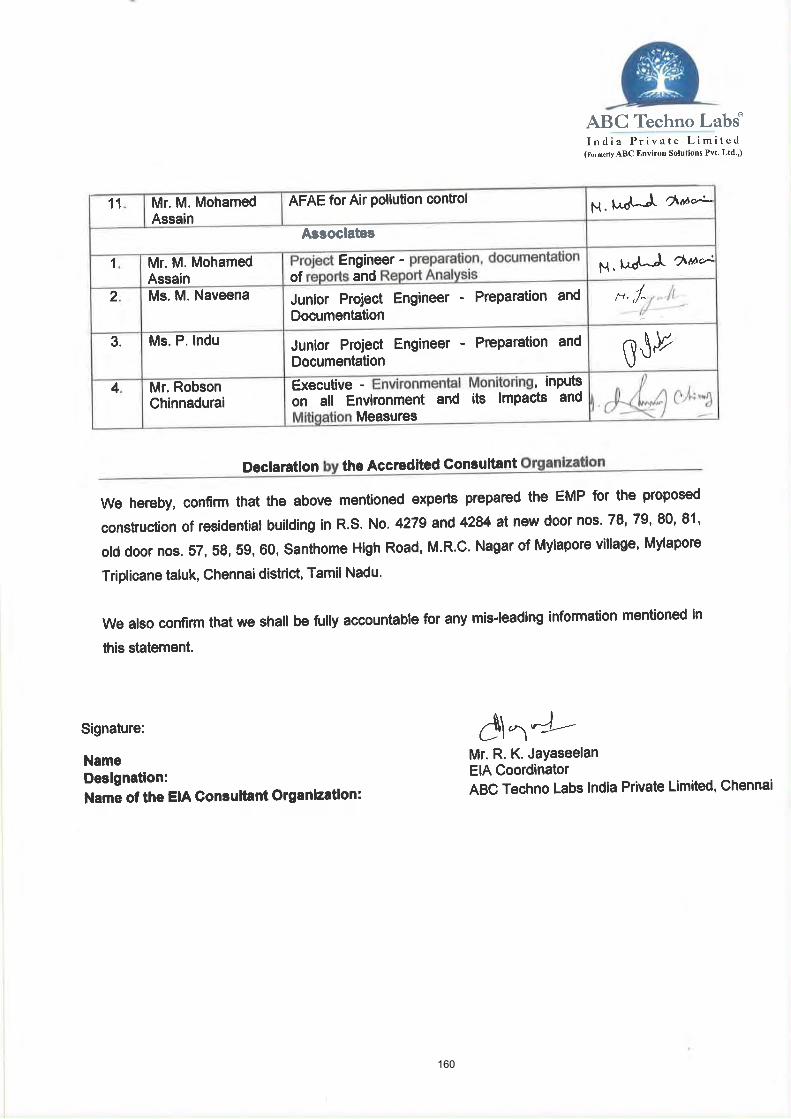
Annexure XV
DECLARATION BY EXPERTS


159
160

160
161

162