ANNEXURE – I TOTAL PENTOSAN ESTIMATION - Shodhganga
69
ANNEXURE – I TOTAL PENTOSAN ESTIMATION Principle Pentosan in the sample is converted to furfural by boiling with HCl which is measured with HCl which is measured colorimetrically using orcinol-iron reagent. Reagents 1. 12% HCl (w/w) 101.6 ml HCl (sp. gr. 1.18) made up to 1 L with distilled water 2. Stock iron solution 0.990 g Ferric ammonium sulphate in 1 L concentration HCl 3. Oncinol-iron reagent 333 ml stock iron solution 467 ml concentration HCl 200 ml distilled water 2.0 g Orcinol (phenol) 4. Standard xylose solution 0.5 g D-Xylose + 1.0 g sodium benzoate in DW – made up to 500 ml in volumetric flask Procedure To 400 mg sample, 100 ml 12% HCl and broken porous was added and heated so that the rate of distillation was 30 ml per 10 min. Run 12% HCl was run from the funnel every 10 min to make up the original volume and 360 to 400 ml was distilled. The condenser was rinsed down with 12% HCl. The distillate was cooled and made up to 500 ml with 12% HCl. A duplicate determination in the same manner using 10 ml standard xylose solution in place of the flour was performed.
Transcript of ANNEXURE – I TOTAL PENTOSAN ESTIMATION - Shodhganga

ANNEXURE – I
TOTAL PENTOSAN ESTIMATION
Principle
Pentosan in the sample is converted to furfural by boiling with HCl which is
measured with HCl which is measured colorimetrically using orcinol-iron reagent.
Reagents
1. 12% HCl (w/w) 101.6 ml HCl (sp. gr. 1.18) made up to 1 L with distilled water
2. Stock iron solution 0.990 g Ferric ammonium sulphate in 1 L
concentration HCl 3. Oncinol-iron reagent 333 ml stock iron solution 467 ml concentration HCl 200 ml distilled water 2.0 g Orcinol (phenol) 4. Standard xylose solution 0.5 g D-Xylose + 1.0 g sodium benzoate in
DW – made up to 500 ml in volumetric flask
Procedure
To 400 mg sample, 100 ml 12% HCl and broken porous was added and heated so that
the rate of distillation was 30 ml per 10 min.
Run 12% HCl was run from the funnel every 10 min to make up the original volume
and 360 to 400 ml was distilled.
The condenser was rinsed down with 12% HCl.
The distillate was cooled and made up to 500 ml with 12% HCl.
A duplicate determination in the same manner using 10 ml standard xylose solution in
place of the flour was performed.
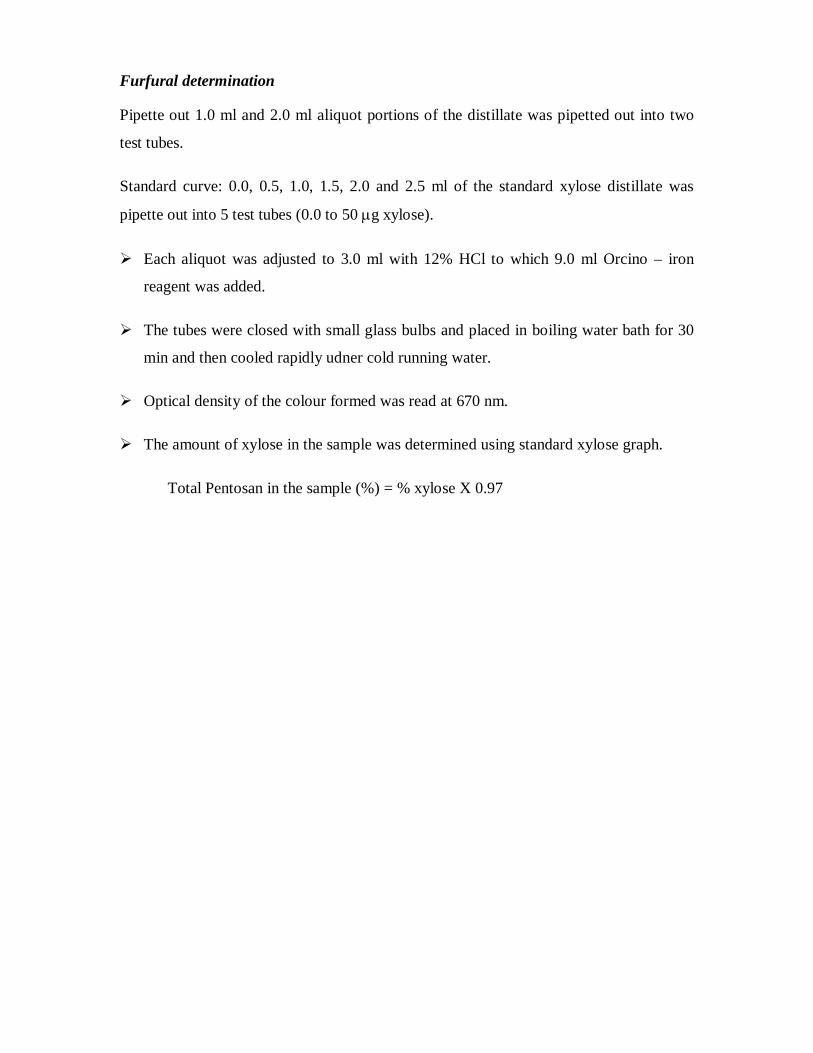
Furfural determination
Pipette out 1.0 ml and 2.0 ml aliquot portions of the distillate was pipetted out into two
test tubes.
Standard curve: 0.0, 0.5, 1.0, 1.5, 2.0 and 2.5 ml of the standard xylose distillate was
pipette out into 5 test tubes (0.0 to 50 g xylose).
Each aliquot was adjusted to 3.0 ml with 12% HCl to which 9.0 ml Orcino – iron
reagent was added.
The tubes were closed with small glass bulbs and placed in boiling water bath for 30
min and then cooled rapidly udner cold running water.
Optical density of the colour formed was read at 670 nm.
The amount of xylose in the sample was determined using standard xylose graph.
Total Pentosan in the sample (%) = % xylose X 0.97
ANNEXURE – II
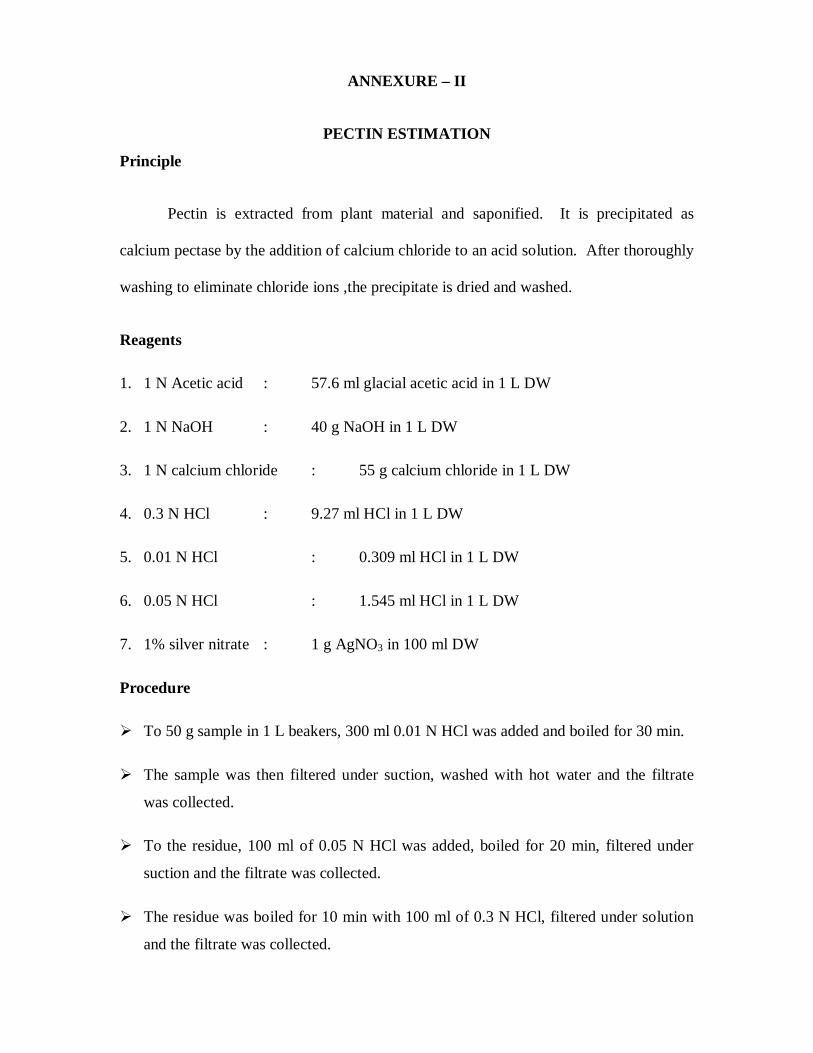
PECTIN ESTIMATION
Principle
Pectin is extracted from plant material and saponified. It is precipitated as
calcium pectase by the addition of calcium chloride to an acid solution. After thoroughly
washing to eliminate chloride ions ,the precipitate is dried and washed.
Reagents
1. 1 N Acetic acid : 57.6 ml glacial acetic acid in 1 L DW
2. 1 N NaOH : 40 g NaOH in 1 L DW
3. 1 N calcium chloride : 55 g calcium chloride in 1 L DW
4. 0.3 N HCl : 9.27 ml HCl in 1 L DW
5. 0.01 N HCl : 0.309 ml HCl in 1 L DW
6. 0.05 N HCl : 1.545 ml HCl in 1 L DW
7. 1% silver nitrate : 1 g AgNO3 in 100 ml DW
Procedure
To 50 g sample in 1 L beakers, 300 ml 0.01 N HCl was added and boiled for 30 min.
The sample was then filtered under suction, washed with hot water and the filtrate
was collected.
To the residue, 100 ml of 0.05 N HCl was added, boiled for 20 min, filtered under
suction and the filtrate was collected.
The residue was boiled for 10 min with 100 ml of 0.3 N HCl, filtered under solution
and the filtrate was collected.

The filtrates were pooled and the volume was made up to 500 ml.
To 100 to 200 ml aliquot of the filtrate in 1 L beakers, 250 ml water was added. The
acid was neutralised with 1 N NaOH using phenolphthalcin indicator. The final
soluiton was allowed to stand overnight.
50 ml of 1 N acetic acid was added. After 5 min, 25 ml 1 N CaCl2 was added slowly
and allowed to stand for 1 hour.
After 1 hour, the mixture was boiled for 1 to 2 min, cooled and filtered through pre-
weighed Whatman No.1 filter paper.
The precipitate was washed with almost boiling water until the filtrate was free from
chlorine which was confirmed by testing with AgNo3.
Filter paper with residue (calcium pectate) was dried overnight at 1000C, cooled in
desicator and weighed.
The calcium pectate content in the sample was calculated as follows:
Wt. Of Ca. Pectate x 500 x 100 % calcium pectate = ml of filtrate taken x sample wt.
% calcium pectate x 100 % Pectin = 110

ANNEXURE – III
CELLULOSE ESTIMATION
Principle
Cellulose undergoes acetolysis with acetic-nitric reagent forming acetylated
cellodextrins which get dissolved and hydrolysed to form glucose molecules on treatment
with 67% H2SO4. This glucose molecule is dehydrated to form hydroxy methyl furfural
which forms green coloured product with anthrone.
Reagents
Acetic – Nitric reagent: 150 ml of 80% glacial acetic acid and 15 ml concentration
nitric acid.
Anthrone reagent: 200 mg anthrone dissolved in 100 ml concentration H2SO4.
Prepared fresh and chilled for two hours before use.
67% H2SO4
Procedure
3 ml acetic – nitric reagent was added to 0.5 g sample in a test tube and vortex mixed.
The tube was placed in water bath at 1000C for 30 min, then cooled and centrifuged
for 15-20 min.
The supernatant was discarded, the residue was washed with distilled water,
centrifuged and again the supernatant was discarded.
To the residue 10 ml of 67% H2SO4 was added and allowed to stand for 1 hour.
1 ml of the above solution was diluted to 100 ml with DW. To
1 ml of this diluted solution, add 1 ml DW and 10 ml of anthrone reagent was added
and mixed well.

The tube was heated in boiling water bath for 10 min, cooled and the colour was
measured at 630 nm.
Standard curve
To 100 mg cellulose in a test tube, add 10 ml of 67% H2SO4 was added and allowed
to stand for 1 hour.
1 ml of the above solution was diluted to 100 ml.
0.2 ml, 0.4 ml, 0.6 ml ................. 2 ml of the diluted solution in different test tubes
was taken corresponding to 20 – 200 g of cellulose and the volume was made up to
2 ml with DW. To this 10 ml anthrone reagent was added, boiled to develop colour
as in case of sample.
Calculation
The amount of cellulose in the sample was calculated using the standard graph.
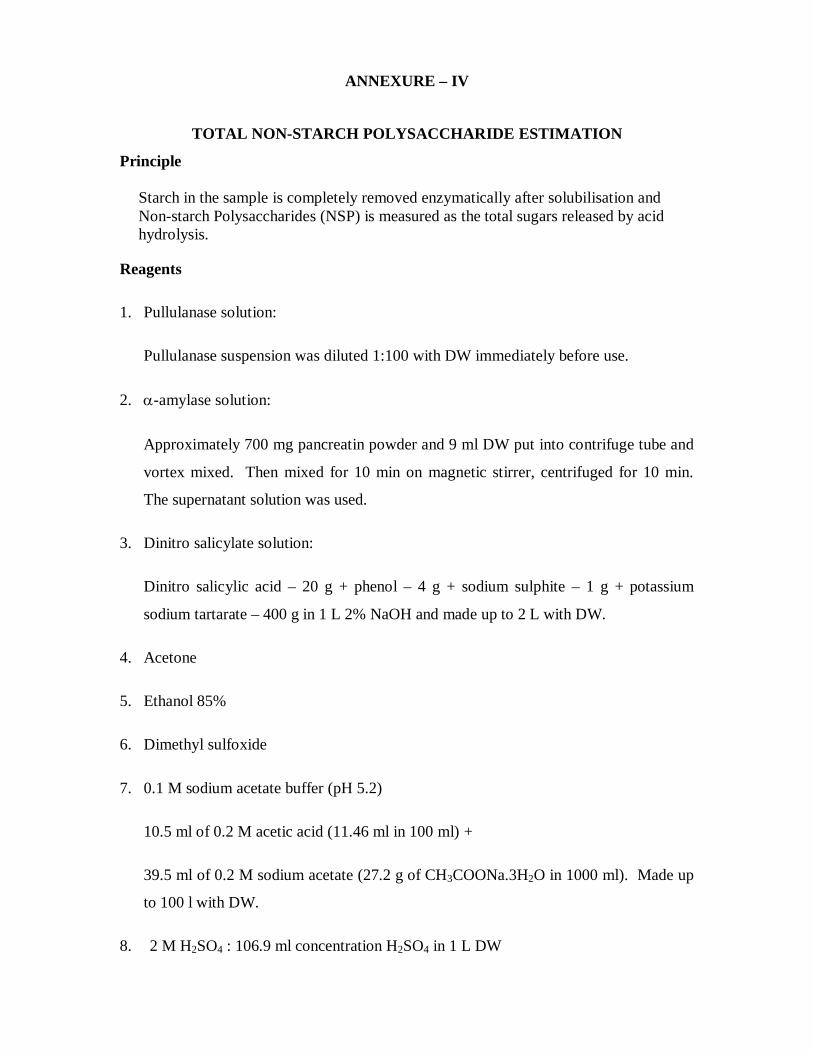
ANNEXURE – IV
TOTAL NON-STARCH POLYSACCHARIDE ESTIMATION
Principle
Starch in the sample is completely removed enzymatically after solubilisation and Non-starch Polysaccharides (NSP) is measured as the total sugars released by acid hydrolysis.
Reagents
1. Pullulanase solution:
Pullulanase suspension was diluted 1:100 with DW immediately before use.
2. -amylase solution:
Approximately 700 mg pancreatin powder and 9 ml DW put into contrifuge tube and
vortex mixed. Then mixed for 10 min on magnetic stirrer, centrifuged for 10 min.
The supernatant solution was used.
3. Dinitro salicylate solution:
Dinitro salicylic acid – 20 g + phenol – 4 g + sodium sulphite – 1 g + potassium
sodium tartarate – 400 g in 1 L 2% NaOH and made up to 2 L with DW.
4. Acetone
5. Ethanol 85%
6. Dimethyl sulfoxide
7. 0.1 M sodium acetate buffer (pH 5.2)
10.5 ml of 0.2 M acetic acid (11.46 ml in 100 ml) +
39.5 ml of 0.2 M sodium acetate (27.2 g of CH3COONa.3H2O in 1000 ml). Made up
to 100 l with DW.
8. 2 M H2SO4 : 106.9 ml concentration H2SO4 in 1 L DW

9. 12 M H2SO4 : 641.4 ml concentration H2SO4 in 1 L DW
10. 50% saturated benzoic acid: 1.7 g benzoic acid in 1 L DW
11. Arabinose
12. Xylose
13. Glucose
14. 3.9 M NaOH : 156 g in 1 L DW
Procedure
100-200 mg dry sample (1 g wet sample) was taken in 50 or 60 ml screw cap tube.
Fat extraction and drying:
- To the sample 40 ml acetone was added and mixed on magnetic stirrer for 30 min.
- Supernatant was removed after centrifugation without disturbing the residue.
- The tube was placed in beaker of 65-700C water on stirrer / hot plate and mixed
for 2-3 min until the residue appeared dry.
Dispersion and hydrolysis of starch:
- 2 ml Dimethyl sulfoxide was added and mixed for 2 min on magnetic stirrer at
room temperature and then placed in a beaker of boiling water for 1 hour.
- After 1 hour the tube was removed and immediately 8 ml of 0.1 M sodium acetate
buffer (pH 5.2) pre-equilibrated at 500C was added and vortex mixed then placed
in 420C water bath for 2-3 min.
- Immediately 0.5 ml -amylase solution followed by 0.1 ml pullulanase solution
was added and vortex mixed.
- The capped tube was incubated at 420C, mixed intermittently for the first hour and
left for 16 hours (overnight).

- The capped tube was incubated at 420C, mixed intermittently for the first hour and
left for 16 hours (overnight).
- 40 ml absolute alcohol was added, mixed well by inversion and left for 1 hour at
room temperature.
- The tube was then centrifuged for 10 min and the supernatant was removed
without disturbing the residue.
- The residue was washed twice with 50 ml of 85% ethanol, mixed well by
inversion, magnetic stirred, centrifuged and the supernatant was removed.
- To the residue, 40 ml acetone was added, stirred for 5 min, centrifuged for 10 min
and the supernatant was discarded.
- The tube was then placed in a beaker of 65-700C water on stirrer / hot plate for 2-
3 min until the residue appeared dry.
Acid hydrolysis of NSP
- To the dried residue, 2 ml of 12 M H2SO4 was added and immediately dispersed
by vortex mixing.
- The tube was left at 350C for 1 hour with occasional mixing.
- After 1 hour, rapidly 22 ml water was added, mixed and then placed in broiling
water for 2 hours with continuous stirring. Then cooled to room temperature.
Estimation of NSP
Standard solution Using Arabinose : Xylose : Glucose (3 : 4 : 3 by weight) solutions of 1.0, 2.0, 3.0 and 4.0 mg total sugar / ml in 50% saturated benzoic acid were prepared.
Immediately before use, the above solution were diluted 1:1 with 2 M H2SO4 to provide standards of 0.5, 1.0, 1.5 and 2.0 mg sugar / ml in 1 M H2SO4.
- Into separate tubes, the following solutions were taken : 1 ml blank solution (1 ml
50 % saturated benzoic acid + 1 M H2SO4 v/v).
1 ml each of standard solution
1 ml of sample hydrolysate

- To each of the tubes 0.5 ml of 0.5 mg glucose / ml and 0.5 ml 3.9 M NaOH was
added and mixed.
- 2 ml DNS solution was added to each tube and vortex mixed.
- All the tubes were placed in boiling water bath for 10 min and then cooled to
room temperature.
- 20 ml deoinised water was added to the above tubes and mixed thoroughly by
inversion.
- Absorbance was measured at 530 nm.
Calculation Per cent of NSP in the sample was calculated as follows:
AT x VT x 100 x 0.89 Total NSP % = AS x WT Where, AT - Absorbance of the text solution VT - Total volume of the test solution (24 ml) AS - Absorbance corresponding to 1 mg sugar /ml taken from the line of best fit from
the sugar standard. WT - Sample weight (mg) 0.89- Scale factor to convert the experimentally determined monosaccharides to
polysaccharides.

ANNEXURE – V
CELLULASE ACTIVITY ASSAY
Principle
The assay is based on the production of reducing sugars i.e., glucose from 50 mg
of Whatman No.1 filter paper which then reacts with dinitro salicylic acid reagent to
produce colour. The colour produced is proportional to the amount of reducing sugars
released and in turn the cellulase activity in the sample.
Unit definition
One filter paper unit (FSU) is defined as the amount of enzyme required to
liberate 1 micro mole of glucose from 50 mg of Whatman No. 1 filter paper per minute at
500C and pH 4.8.
Reagents:
Citric acid monohydrate
Sodium hydroxide
3,5-dinitro salicylic acid
D(+) glucose
Potassium sodium tartarate tetrahydrate
Phenol
Sodium meta sulphite
Sodium meta tri-sulphite
Whatman No.1 filter paper
Preparation of reagents
1. 0.05M citrate buffer (pH 4.8)
210 g of citric acid monohydrate was dissolved in 750 ml DW to which NaOH
pellets were added until the pH reached 4.3. The solution was diluted to 1000 ml
and was diluted the pH was made up to 4.8. This is 1M stock citrate buffer. The
stock solution was diluted 1:20 to prepare 0.05M citrate buffer. pH was adjusted
to 4.8 with acetic acid or NaOH.

2. DNA reagent
a. 8 g of DNS monohydrate was dissolved in 500 ml of DW.
b. 24 g NaOH was dissolved in 200 ml DW
c. 5 g phenol was dissolved in 80 ml Dw.
d. 20 ml of DNS solution (a) was added to the phenol solution (c).
e. 120 ml of NaOH solution (b) was added slowly to the remaining solution (a)
and stirred thoroughly.
f. 200 g of potassium sodium tartarate tetrahydrate was added to solution (e).
g. 5 g of sodium meta tri-sulphite was added to the solution (d) and dissolved.
h. Solutions (f) and (g) were mixed and the volume was made up to 1 L with
DW was filtered. The resulting solution was filtered through absorbent cotton
and 5 g of sodium meta bi-sulphite was added and stored in a dark bottle.
Standard Graph
300 mg of D(+) glucose (oven dried at 1050C for 2 hrs) was dissolved in 100 ml of
0.05 M citrate buffer.
Different dilutions of the standard glucose solution was prepared as follows:
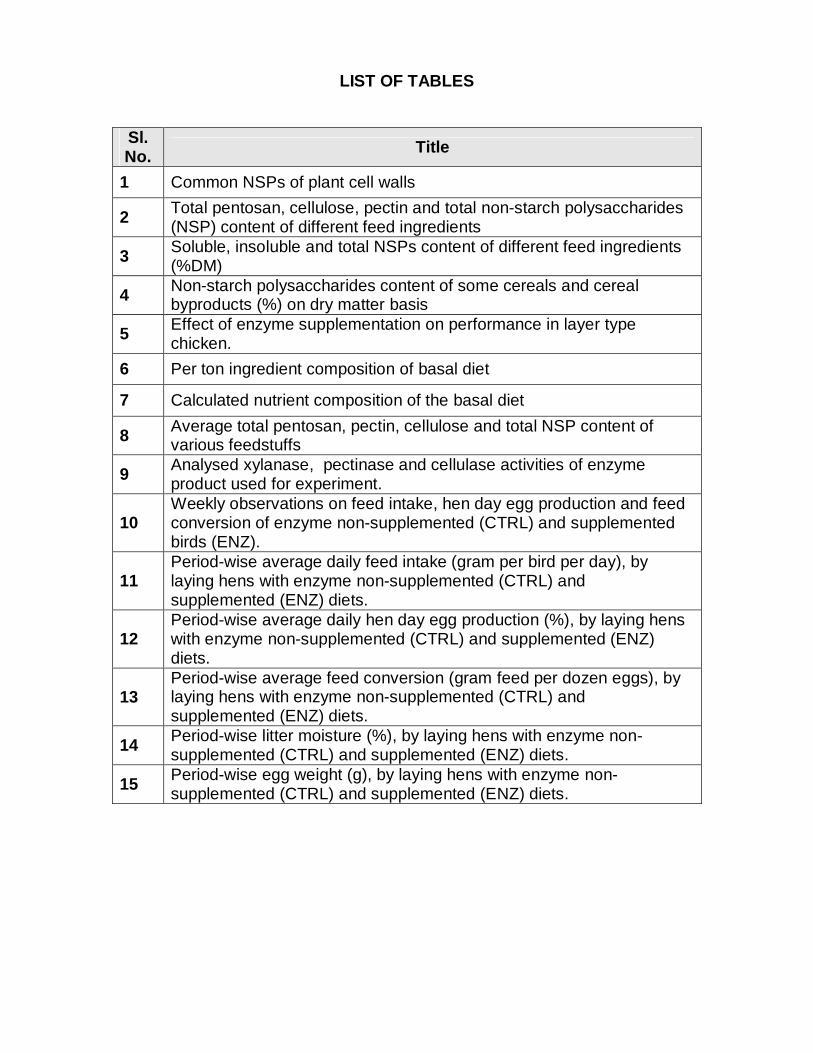
LIST OF TABLES Sl. No. Title
1 Common NSPs of plant cell walls
2 Total pentosan, cellulose, pectin and total non-starch polysaccharides (NSP) content of different feed ingredients
3 Soluble, insoluble and total NSPs content of different feed ingredients (%DM)
4 Non-starch polysaccharides content of some cereals and cereal byproducts (%) on dry matter basis
5 Effect of enzyme supplementation on performance in layer type chicken.
6 Per ton ingredient composition of basal diet
7 Calculated nutrient composition of the basal diet
8 Average total pentosan, pectin, cellulose and total NSP content of various feedstuffs
9 Analysed xylanase, pectinase and cellulase activities of enzyme product used for experiment.
10 Weekly observations on feed intake, hen day egg production and feed conversion of enzyme non-supplemented (CTRL) and supplemented birds (ENZ).
11 Period-wise average daily feed intake (gram per bird per day), by laying hens with enzyme non-supplemented (CTRL) and supplemented (ENZ) diets.
12 Period-wise average daily hen day egg production (%), by laying hens with enzyme non-supplemented (CTRL) and supplemented (ENZ) diets.
13 Period-wise average feed conversion (gram feed per dozen eggs), by laying hens with enzyme non-supplemented (CTRL) and supplemented (ENZ) diets.
14 Period-wise litter moisture (%), by laying hens with enzyme non-supplemented (CTRL) and supplemented (ENZ) diets.
15 Period-wise egg weight (g), by laying hens with enzyme non-supplemented (CTRL) and supplemented (ENZ) diets.
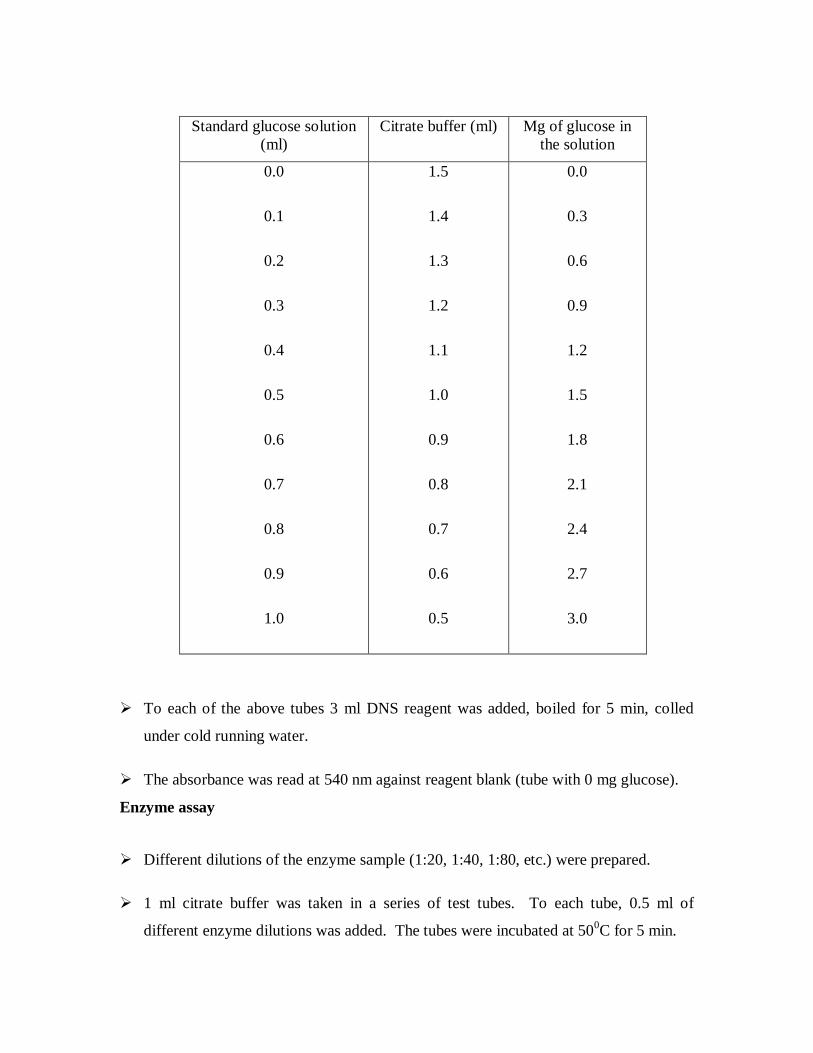
Standard glucose solution (ml)
Citrate buffer (ml) Mg of glucose in the solution
0.0
0.1
0.2
0.3
0.4
0.5
0.6
0.7
0.8
0.9
1.0
1.5
1.4
1.3
1.2
1.1
1.0
0.9
0.8
0.7
0.6
0.5
0.0
0.3
0.6
0.9
1.2
1.5
1.8
2.1
2.4
2.7
3.0
To each of the above tubes 3 ml DNS reagent was added, boiled for 5 min, colled
under cold running water.
The absorbance was read at 540 nm against reagent blank (tube with 0 mg glucose).
Enzyme assay
Different dilutions of the enzyme sample (1:20, 1:40, 1:80, etc.) were prepared.
1 ml citrate buffer was taken in a series of test tubes. To each tube, 0.5 ml of
different enzyme dilutions was added. The tubes were incubated at 500C for 5 min.

After 5 min, to each of the above tubes, 50 mg Whatman No. 1 filter paper (1x6 cm)
was added and vortex mixed.
The tubes were incubated in water bath at 500C for 1 hour.
After 1 hour the tubes were cooled and 3 ml DNS reagent was added.
Simultaneously the tubes were kept in boiling water bath for 5 min.
The tubes were then cooled and add 15 ml DW added.
Enzyme blank.
Similar to the above tubes except that 0.5 ml enzyme dilution was added following 3
ml DNS addition.
Absorbance of the sample tubes against enzyme blank was read at 540 nm.
Calculation
The amount of glucose released was found out using the standard graph.
Cellulase activity in the sample was calculated as follows:
Mg of glucose released x Dilution factor x 100 FPU/g = 180 x 60 x 0.5
ANNEXURE – VI
XYLANASE ACTIVITY ASSAY
Principle
The assay is based on the production of reducing sugars from oat spelt xylan
which reacts with 3.5 – Dinitro salicylic acid (DNS) to produce colour. The intensity of
colour produced is proportional to the amount of reducing sugars released which in turn
is proportional to the xylanase activity in the sample.
Unit definition
One unit of xylanase is defined as the amount of enzyme required to produce 1
micro mole of xylose per minute at pH 4.8.
Reagents
Citric acid monohydrate
Glacial acetic acid
Oat splet xylan (Sigma)
E.5 Dinitro salicylic acid
D(+) xylose
Potassium sodium tartarate tetrahydrate
Sodium hydroxide
Sodium meta b-sulphite
Sodium meta tri-sulphite
Phenol
Preparation of reagents
1. 0.5M citrate buffer (pH 4.8)
210 g of citric acid monohydrate was dissolved in 750 ml DW to which NaOH
pellets were added until the pH reached 4.3. The solution was diluted to 1000 ml
and was diluted the pH was made up to 4.8. This is 1M stock citrate buffer. The
stock solution was diluted 1:20 to prepare 0.05M citrate buffer. pH was adjusted
to 4.8 with acetic acid or NaOH.
2. Xylan substrate
2 g of oat spelt xylan and 1-2 pellets of NaOH was taken in a mortor pestle and
ground. To this citrate buffer was added until the volume reached approximately
80 ml. The pH was adjusted to 4.8 with glacial acetic acid. The final volume was
made up to 100 ml and kept in refrigerator (2-80C) until use.
‘XYLAN SUBSTRATE SHOULD BE PREPARED FRESH”
3. DNA reagent
a. 8 g of DNS monohydrate was dissolved in 500 ml of DW.
b. 24 g NaOH was dissolved in 200 ml DW
c. 5 g phenol was dissolved in 80 ml Dw.
d. 20 ml of DNS solution (a) was added to the phenol solution (c).
e. 120 ml of NaOH solution (b) was added slowly to the remaining solution (a) and
stirred thoroughly.
f. 200 g of potassium sodium tartarate tetrahydrate was added to solution (e).
g. 5 g of sodium meta tri-sulphite was added to the solution (d) and dissolved.
h. Solutions (f) and (g) were mixed and the volume was made up to 1 L with DW
was filtered. The resulting solution was filtered through absorbent cotton and 5 g
of sodium meta bi-sulphite was added and stored in a dark bottle.
Standard Graph
D(+) Xylose was dried to constant weight at 1050C desiccator.
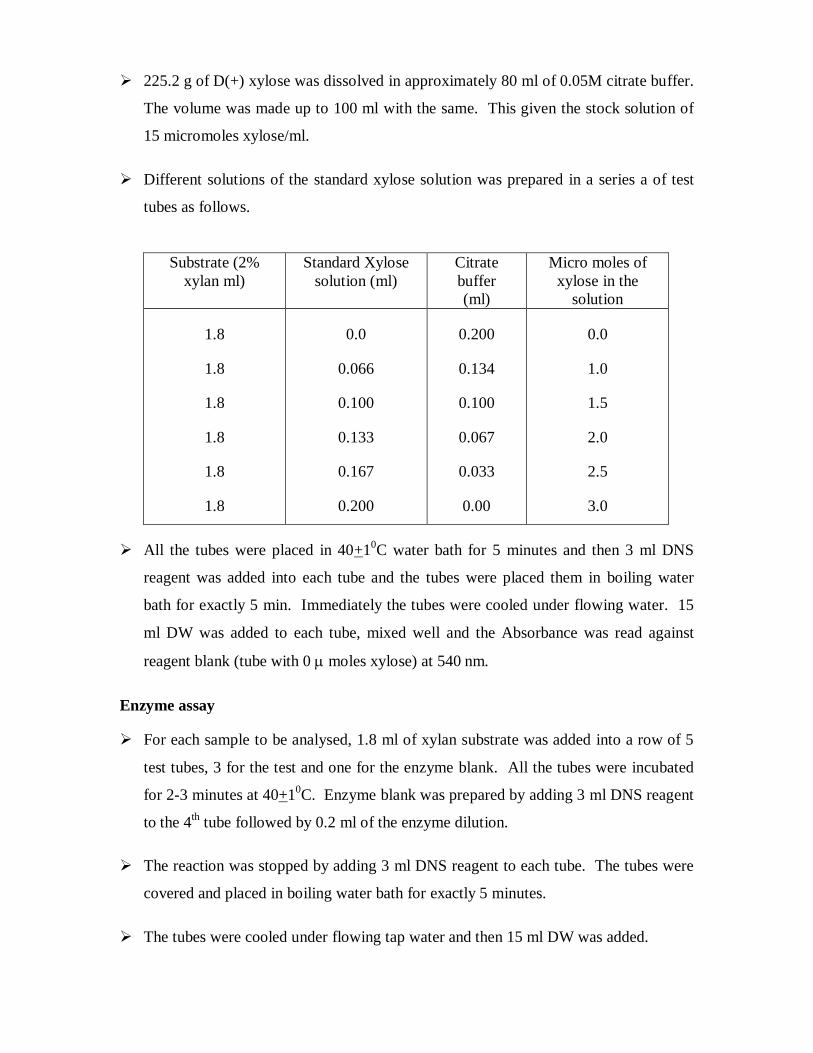
225.2 g of D(+) xylose was dissolved in approximately 80 ml of 0.05M citrate buffer.
The volume was made up to 100 ml with the same. This given the stock solution of
15 micromoles xylose/ml.
Different solutions of the standard xylose solution was prepared in a series a of test
tubes as follows.
Substrate (2% xylan ml)
Standard Xylose solution (ml)
Citrate buffer (ml)
Micro moles of xylose in the
solution
1.8
1.8
1.8
1.8
1.8
1.8
0.0
0.066
0.100
0.133
0.167
0.200
0.200
0.134
0.100
0.067
0.033
0.00
0.0
1.0
1.5
2.0
2.5
3.0
All the tubes were placed in 40+10C water bath for 5 minutes and then 3 ml DNS
reagent was added into each tube and the tubes were placed them in boiling water
bath for exactly 5 min. Immediately the tubes were cooled under flowing water. 15
ml DW was added to each tube, mixed well and the Absorbance was read against
reagent blank (tube with 0 moles xylose) at 540 nm.
Enzyme assay
For each sample to be analysed, 1.8 ml of xylan substrate was added into a row of 5
test tubes, 3 for the test and one for the enzyme blank. All the tubes were incubated
for 2-3 minutes at 40+10C. Enzyme blank was prepared by adding 3 ml DNS reagent
to the 4th tube followed by 0.2 ml of the enzyme dilution.
The reaction was stopped by adding 3 ml DNS reagent to each tube. The tubes were
covered and placed in boiling water bath for exactly 5 minutes.
The tubes were cooled under flowing tap water and then 15 ml DW was added.

The absorbance was read at 540 nm against enzyme blank.
Calculation
Micromoles of xylose released was calculated by comparing the absorbance
values of the samples with the standard graph. The xylanase activity in the sample was
calculated as follows:
Micromoels of xylose released x Dilution factor I.U./g = Wt. Of the sample taken x Incubation time

ANNEXURE – VII
PECTINASE ACTIVITY ASSAY
Principle
The assay is based on the release of reducing groups (galacturonic acids) from
pectin which is then made to react with iodine. The residual iodine is titrated using
solution thiosulphate solution. The amount of residual iodine is inversely proportional to
the amount of glacturonic acid released.
Unit definition
One unit of pectinase (polygalacturonase) is defined as the amount of enzyme
required to release 1 milli mole per min at 250C and pH 4.0.
Reagents
1. 1 M sodium carbonate – 10.6 g of Na2CO3 in 100 ml DW.
2. 0.1 M iodide – 1.3 g iodine in 100 ml DW.
3. 2 M H2SO4 – 10.91 ml concentration H2SO4 in 100 ml DW.
4. 0.05 N sodium thisulphate – 12.41 g in 1000 ml DW.
5. 0.1 N NaOH –0 2 g NaOH in 500 ml DW.
6. 0.5% pectin solution – 0.5 g pectin in 100 ml DW. pH adjusted to 4 using 0.1 N NaOH.
7. Enzyme dilution – 250 lmg enzyme in 10 ml Dw.
Standard curve
100 ml of D-galacturonic acid monohydrate was adjusted in 100 ml DW to give 1
mg sugar/ml. Different dilutions from the stock solution was made as follows:
Stock sugar solution Pectin solution Sugar in the mixture

(ml) (ml) (mg)
0.0
0.1
0.2
0.3
0.4
0.5
0.6
0.7
0.8
0.9
1.0
5.0
4.9
4.8
47
4.6
4.5
4.4
4.3
4.2
4.1
4.0
0.0
0.1
0.2
0.3
0.4
0.5
0.6
0.7
0.8
0.9
1.0
To each of the above dilutions, 0.9 ml 1 M Na2CO3 and 5 ml 0.1 N iodine solution
was added and allowed to stand for 20 min at room temperature. Immediately after 20
min, 2 ml of 2 M H2SO4 was added and the residual iodine was titrated using 0.5 N
Na2S2O5. The volume of Na2S2O3 run down was noted
Assay 1 ml of enzyme dilution was mixed with 0.5% pectin solution and incubated at 400C.
At different intervals, 5 ml of the aliquot was taken out to which 0.9 ml 1 M Na2CO3
and 5 ml 0.1 N iodine was added.
The mixture was stirred thoroughly and allowed to stand at room temperature for 20
minutes.
After 20 minutes, the reaction mixture was acidified with 2 ml of 2 M H2SO4 and the
residual iodine was titrated with 0.05 N Na2S2O3.
The sugars released was calculated by comparing the volume of Na2S2O3 run down
with standard curve.

ENRICHING THE NUTRITIONAL VALUE OF AGRO-INDUSTRIAL BY-PRODUCTS BY ENZYME SUPPLEMENTATION IN POULTRY
Ravikiran D.
Thesis Abstract
A study was conducted to estimate the non-starch polysaccharide (NSP) contents of
various poultry feed ingredients and to assess the possibility of using enzyme complexes for
enhancing the nutritive value of agro-industrial by-products in laying hen diets. NSP
estimation studies revealed that cereals were high in pentosans, oilcakes in pectins and rice
bran and sunflower cake were high in both pectins and cellulose, advocating the usage of
enzyme preparations containing xylanase, pectinase and cellulase. Biological trial with
13176 Bovans White commercial layers over the duration of 24 weeks with or without
enzyme supplementation at the level of 0.5 kg per ton proved that enzyme supplementation
essentially improved the nutritive value of the feed in commercial layers. Enzyme
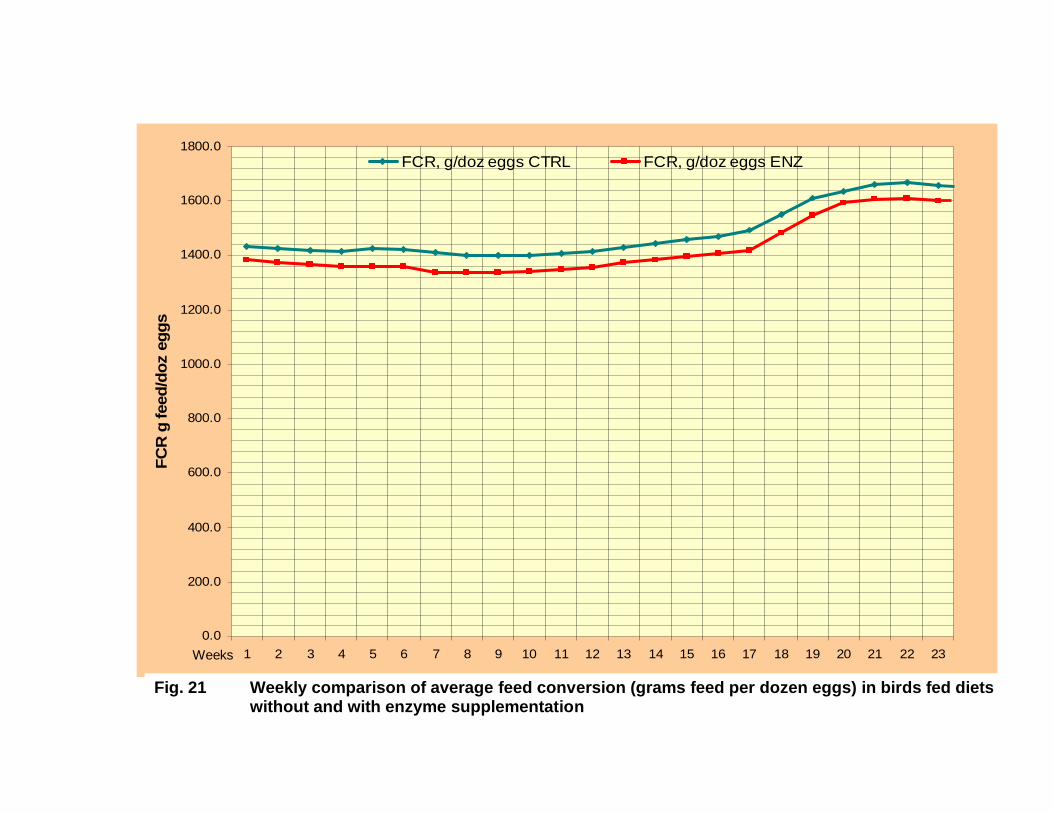
supplementation reduced the feed intake by an average of 4 grams per bird per day and
improved the feed efficiency by about 5grams per egg over the entire duration of the trial,
both suggesting better nutrient utilization upon enzyme supplementation. Enzyme
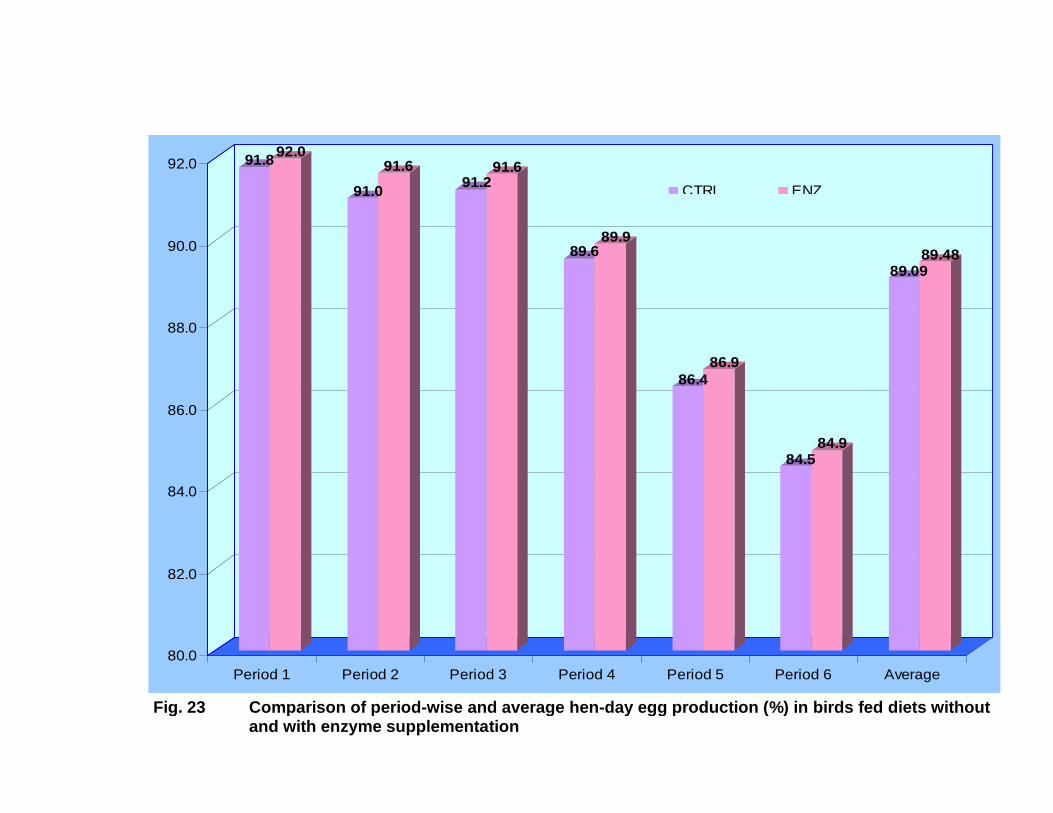
supplementation also had minor desirable influence on egg production (+ 0.4%), gut
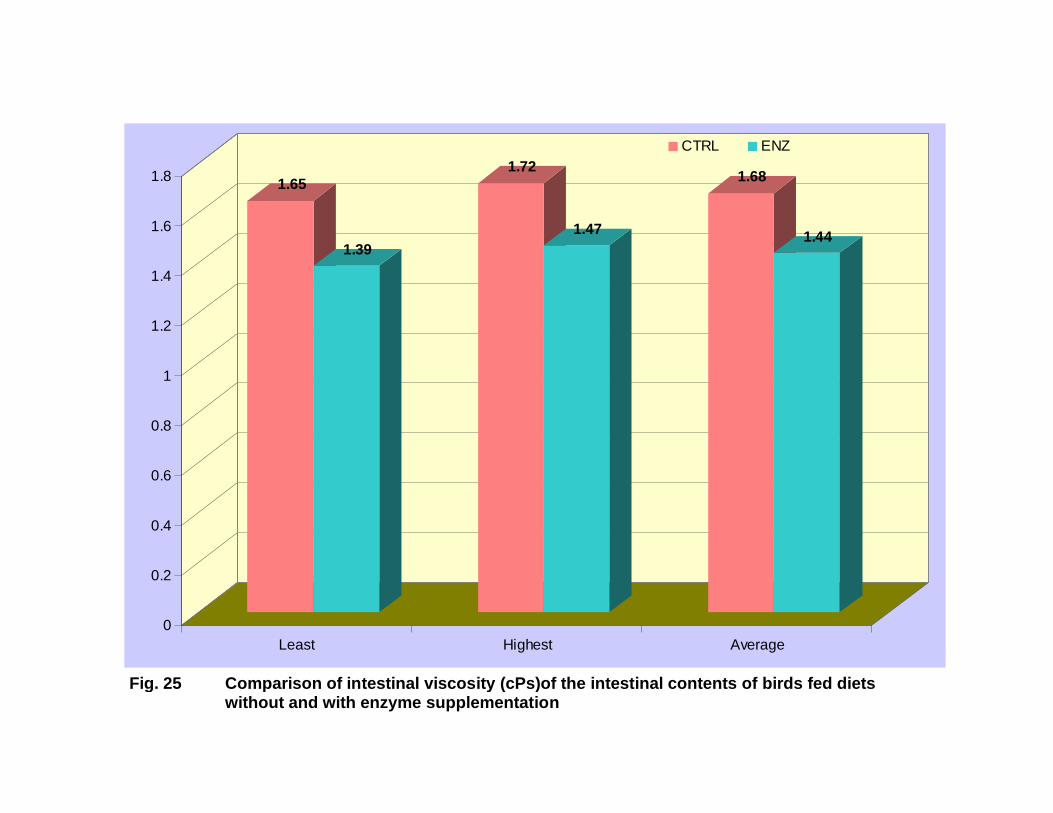
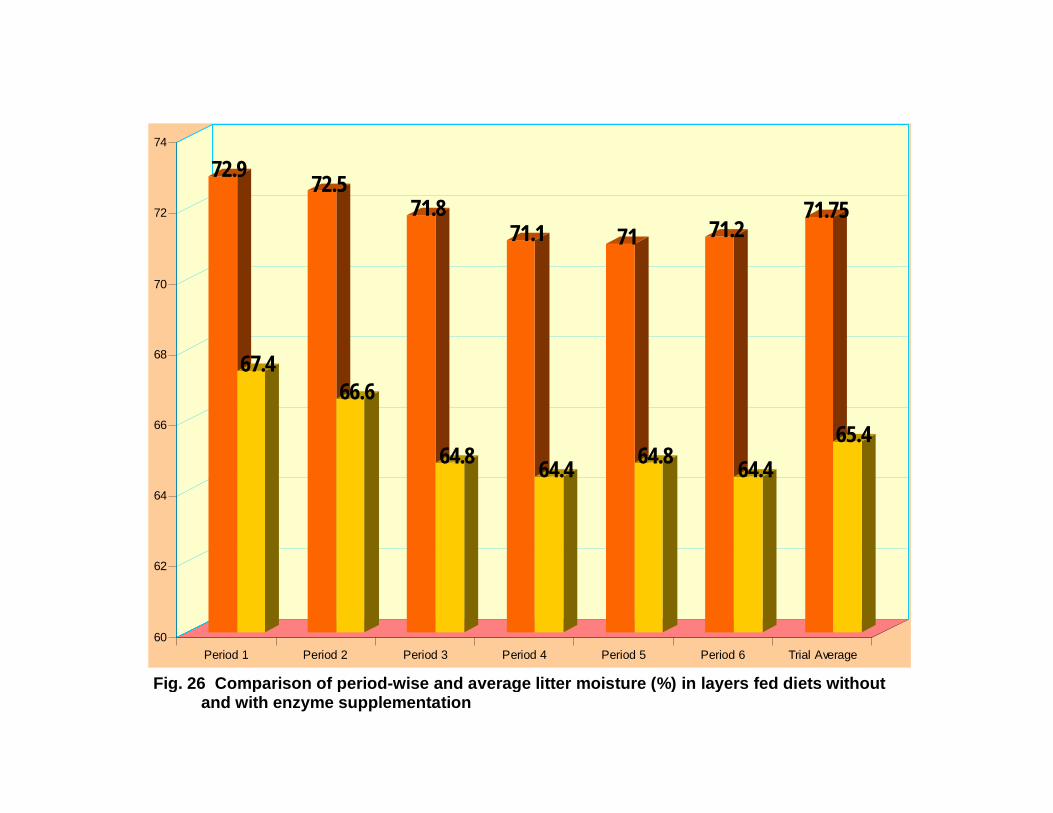
viscosity (-14.3%), litter moisture (- 9.7%), and ileal digestibility of protein (+ 12.5%) as
against the control group. The influence on egg weight and livability were not quite
prominent. Enzyme supplementation also considerably reduced the total bacterial counts
and coliform counts in the intestines of supplemented birds. It is proposed that the reduction
in digesta viscosity and the gut bacterial counts in enzyme supplemented group could have
enabled the better digestion, absorption and utilization of nutrients leading to better gut
health and improved performance.
Prof. G. Devegowda Ravikiran D (Major Advisor) (Student) July 2005 Dept. Avian Production and Management, KVA & FSU – Bidar, Bangalore.
Department of Avian Production and Management
KARNATAKA VETERINARY, ANIMAL & FISHERIES SCIENCES UNIVERSITY, BIDAR

Veterinary College, Hebbal, Bangalore 1. Title of Thesis ENRICHING THE NUTRITIONAL VALUE OF AGRO-
INDUSTRIAL BY-PRODUCTS BY ENZYME SUPPLEMENTATION IN POULTRY
2. Full name of the Student Ravikiran D. 3. Name and Address of PROF. G. DEVEGOWDA, Major Advisor Visiting Professor, Dept Avian Production & Management,
KVA&FSU-Bidar, Bangalore . 4. Degree Awarded Ph.D. 5. Year of award of Degree 2005 6. Major subject Poultry Science 7. Number of pages in thesis 135 8. Number of words in 254 thesis abstract 9. Number of tables 15 10. Number of figures 30 11. Signature, name and address of the Forwarding Authority ______________________________________ PROF. K.S. PRATHAP KUMAR Head, Dept. Avian Production and Management, Veterinary College, Bangalore, KVA&FSU-Bidar Hebbal, Bangalore – 560 024.
CERTIFICATE
This is to certify that I have no objection for supplying to the scientists/ students only one copy of any part of this thesis at a time through reprographic process, if necessary, for rendering reference in a library or documentation center.
________________________ RAVIKIRAN, D.
(Name & Signature of the Student)
Bangalore Date: 09.07.2005
_________________________ PROF. G. DEVEGOWDA
(Name & Signature of the Major Advisor)
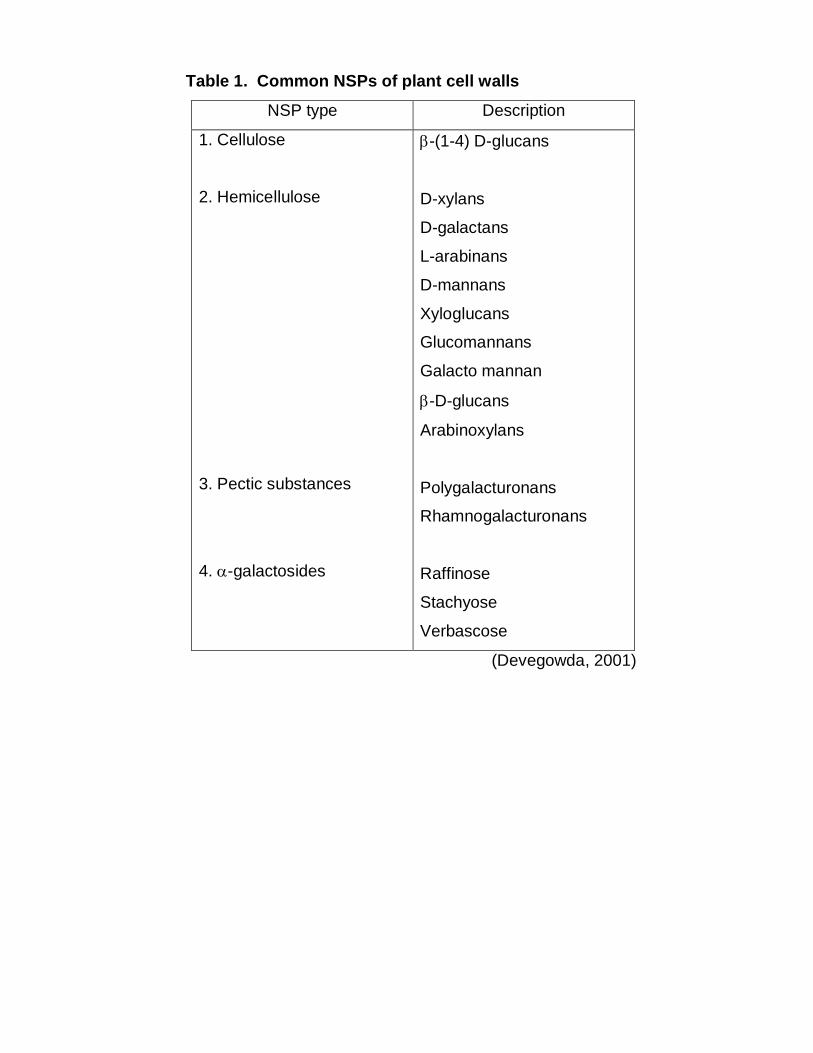
Table 1. Common NSPs of plant cell walls
NSP type Description
1. Cellulose
2. Hemicellulose
3. Pectic substances
4. -galactosides
-(1-4) D-glucans
D-xylans
D-galactans
L-arabinans
D-mannans
Xyloglucans
Glucomannans
Galacto mannan
-D-glucans
Arabinoxylans
Polygalacturonans
Rhamnogalacturonans
Raffinose
Stachyose
Verbascose
(Devegowda, 2001)

Table 2. Total pentosan, cellulose, pectin and total nonstarch polysaccharides (NSP) content of different feed ingredients
Ingredients Total pentosan
(%)
Cellulose
(%)
Pectin
(%)
Total NSP
(%)
Maize 5.35 3.12 1.00 9.32
Sorghum 2.77 4.21 1.66 9.75
Finger millet 3.31 3.03 1.76 9.40
Jowar 2.91 3.99 1.17 9.00
Wheat 7.26 3.47 0.73 12.10
Barley 7.52 3.99 0.73 18.80
Soybean meal 4.21 5.75 6.16 29.02
Sunflower meal 11.01 22.67 4.92 41.34
Rapeseed meal 8.85 14.21 8.86 39.79
Deoiled rice bran 10.65 14.21 15.20 59.97
(Malathi and Devegowda, 2001)

Table 3. Soluble, insoluble and total NSPs content of different feed ingredients (%DM)
Ingredient Soluble NSPs Insoluble NSPs Total NSPs
Wheat 2.40 9.00 11.40
Rye 4.60 8.60 13.20
Barley 4.50 12.20 16.70
Lupins 3.30 7.40 10.70
Soybean meal 13.90 16.40 30.30
Sunflower seed 4.60 23.10 27.60
Rape seed meal 11.30 34.80 46.10
(Smits and Annison, 1996)

Table 4. Non-starch polysaccharides content of some cereals and cereal byproducts (%) on dry matter basis
Ingredients Arabinoxylan Pectin Cellulose -glucans Total
NSP Reference
Barley 7.90 0.40 3.90 4.30 16.70 Choct (1997)
DORB 10.65
8.50
7.25
1.60
15.20
11.20
-
Tr
59.97-
21.80
Malathi and Devegowda (2001)
Choct (1997)
Jowar 2.97
1.90
2.10
2.77
1.17
1.50
0.15
1.66
3.99
2.10
2.20
4.21
-
-
0.2
-
9.00
5.60
4.80
9.75
Nyman et al. (1984)
Classen (1996)
Choct (1997)
Malathi and Devegowda (2001)
Maize 4.30
5.20
4.35
1.00
0.60
1.00
2.60
3.00
3.12
- Trace
- -
8.10
8.10
9.32
Classen (1996)
Choct (1997)
Malathi and Devegowda (2001)
Rice
(pearled)
0.20 0.20 0.30 0.10 0.80 Choct (1997)
Rice bran 10.00 - 6.00 - - Choct (1997)
Rye 8.90 0.50 1.50 2.00 13.20 Choct (1997)
Wheat 7.26
8.10
0.73
0.50
3.47
2.00
-
0.8
12.10
11.40
Nyman et al. (1984)
Choct (1997)
Wheat bran 21.9 1.90 10.70 0.4 35.30 Choct (1997)
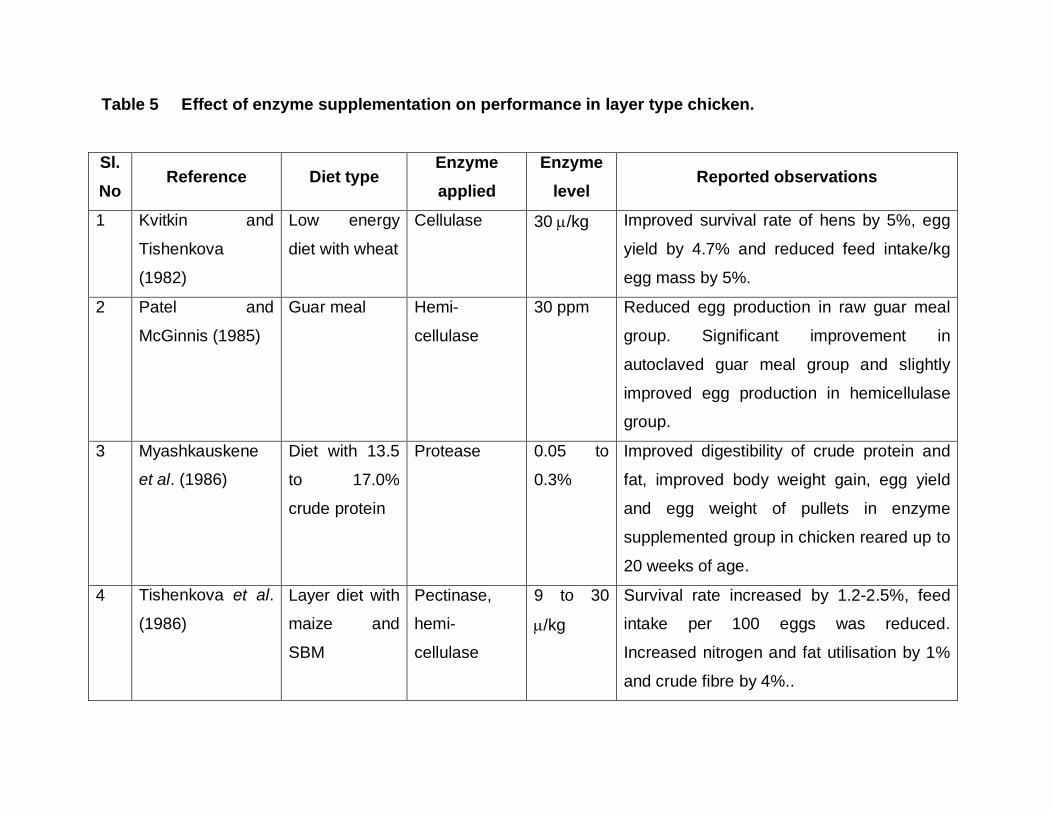
Table 5 Effect of enzyme supplementation on performance in layer type chicken.
Sl. No
Reference Diet type Enzyme applied
Enzyme level
Reported observations
1 Kvitkin and
Tishenkova
(1982)
Low energy
diet with wheat
Cellulase 30 /kg Improved survival rate of hens by 5%, egg
yield by 4.7% and reduced feed intake/kg
egg mass by 5%.
2 Patel and
McGinnis (1985)
Guar meal Hemi-
cellulase
30 ppm Reduced egg production in raw guar meal
group. Significant improvement in
autoclaved guar meal group and slightly
improved egg production in hemicellulase
group.
3 Myashkauskene
et al. (1986)
Diet with 13.5
to 17.0%
crude protein
Protease 0.05 to
0.3%
Improved digestibility of crude protein and
fat, improved body weight gain, egg yield
and egg weight of pullets in enzyme
supplemented group in chicken reared up to
20 weeks of age.
4 Tishenkova et al.
(1986)
Layer diet with
maize and
SBM
Pectinase,
hemi-
cellulase
9 to 30
/kg
Survival rate increased by 1.2-2.5%, feed
intake per 100 eggs was reduced.
Increased nitrogen and fat utilisation by 1%
and crude fibre by 4%..
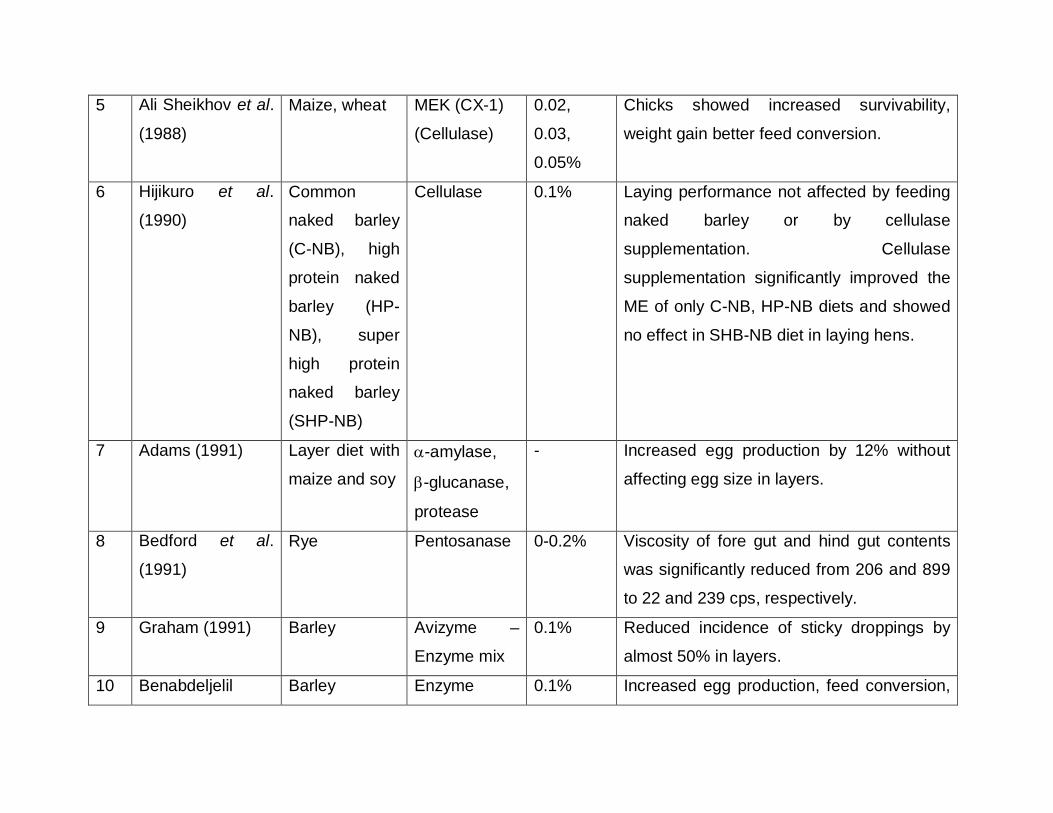
5 Ali Sheikhov et al.
(1988)
Maize, wheat MEK (CX-1)
(Cellulase)
0.02,
0.03,
0.05%
Chicks showed increased survivability,
weight gain better feed conversion.
6 Hijikuro et al.
(1990)
Common
naked barley
(C-NB), high
protein naked
barley (HP-
NB), super
high protein
naked barley
(SHP-NB)
Cellulase 0.1% Laying performance not affected by feeding
naked barley or by cellulase
supplementation. Cellulase
supplementation significantly improved the
ME of only C-NB, HP-NB diets and showed
no effect in SHB-NB diet in laying hens.
7 Adams (1991) Layer diet with
maize and soy -amylase,
-glucanase,
protease
- Increased egg production by 12% without
affecting egg size in layers.
8 Bedford et al.
(1991)
Rye Pentosanase 0-0.2% Viscosity of fore gut and hind gut contents
was significantly reduced from 206 and 899
to 22 and 239 cps, respectively.
9 Graham (1991) Barley Avizyme –
Enzyme mix
0.1% Reduced incidence of sticky droppings by
almost 50% in layers.
10 Benabdeljelil Barley Enzyme 0.1% Increased egg production, feed conversion,

(1992) mixture increased egg weight.
11 Brake (1992) Corn-soy diet -
galactosidase
0.05% Significant dose related increase in egg
production presumably because more ME
liberated from the soybean meal in broiler
breeder female.
12 Gropp et al.
(1992)
30% rye Cellulose,
xylanase,
pectinase,
amylase,
glucanase
- Weight gain (9%) egg production (7%) and
feed efficiency (13%) were significantly
improved.
13 Manoj Sharma et
al. (1992)
Deoiled rice
bran, oilseed
cake
-glucanase 0, 15, 25
and 35
g/quintal
Enzyme supplemented at 15 g/quintal of
feed gave higher performance with respect
to present hen day egg production, egg
weight, low feed cost for production per kg
egg mass.
14 Shan et al. (1992) Corn,
sunflower
Cellulase - Significant increase in digestibility of NSPs
by 37% in layers.
15 Guenter (1993) Wheat, rye Xylanase, -
glucanase
0.1% Reported sticky droppings and
unmanageable litter conditions which were
improved upon enzyme supplementation.
Protein digestibility increased significantly.

16 Jayanna and
Devegowda
(1993)
Groundnut
extract based
diet with
varying energy
levels
Protease,
amylase,
pectinase,
xylanase, -
glucanase
0.2% Egg production and feed efficiency were
considerably improved in lowest energy
groups and did not have significant effect on
egg weight and mortality in layers.
17 Mohandas and
Devegowda
(1993)
Groundnut
extract based
diet with
varying energy
levels
Cellulase 0.1% Enzyme supplementation was beneficial
only in low energy levels (2300 KCal ME/kg
) in improving egg production, feed intake,
feed efficiency and no effect on survivability
and egg weight.
18 Prakash and
Devegowda
(1993)
Maize,
groundnut
extract,
sunflower
extract, DORB
with varying
fibre levels
Cellulase,
protease
0.05% In low energy group, there was considerable
improvement in egg production with
cellulase supplementation and with
protease effect was not significant. Daily
feed consumption was not affected at all
energy levels in Babcock layers.
19 Francesh et al.
(1995)
Barley,
sunflower
meal
Xylanase,
pectinase, -
glucanase
0.1% Egg weight increased by 1%, reduced
percentage of dirty eggs, water intake, feed
: water ratio
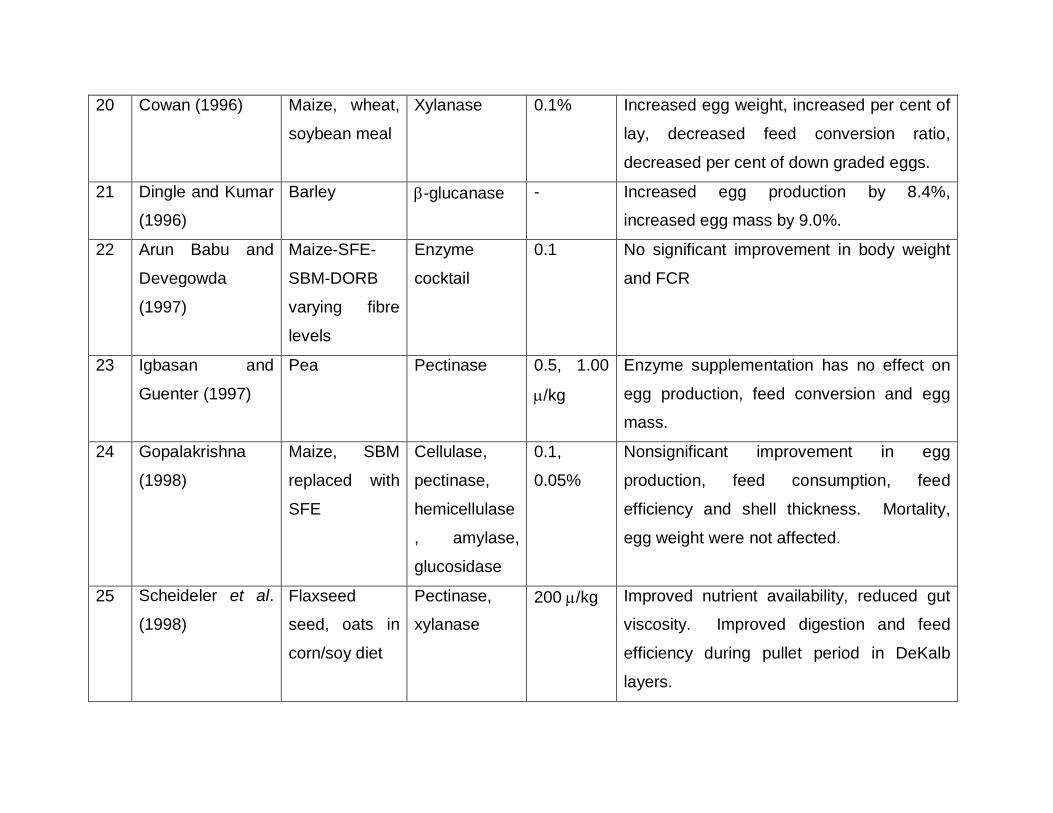
20 Cowan (1996) Maize, wheat,
soybean meal
Xylanase 0.1% Increased egg weight, increased per cent of
lay, decreased feed conversion ratio,
decreased per cent of down graded eggs.
21 Dingle and Kumar
(1996)
Barley -glucanase - Increased egg production by 8.4%,
increased egg mass by 9.0%.
22 Arun Babu and
Devegowda
(1997)
Maize-SFE-
SBM-DORB
varying fibre
levels
Enzyme
cocktail
0.1 No significant improvement in body weight
and FCR
23 Igbasan and
Guenter (1997)
Pea Pectinase 0.5, 1.00
/kg
Enzyme supplementation has no effect on
egg production, feed conversion and egg
mass.
24 Gopalakrishna
(1998)
Maize, SBM
replaced with
SFE
Cellulase,
pectinase,
hemicellulase
, amylase,
glucosidase
0.1,
0.05%
Nonsignificant improvement in egg
production, feed consumption, feed
efficiency and shell thickness. Mortality,
egg weight were not affected.
25 Scheideler et al.
(1998)
Flaxseed
seed, oats in
corn/soy diet
Pectinase,
xylanase 200 /kg Improved nutrient availability, reduced gut
viscosity. Improved digestion and feed
efficiency during pullet period in DeKalb
layers.
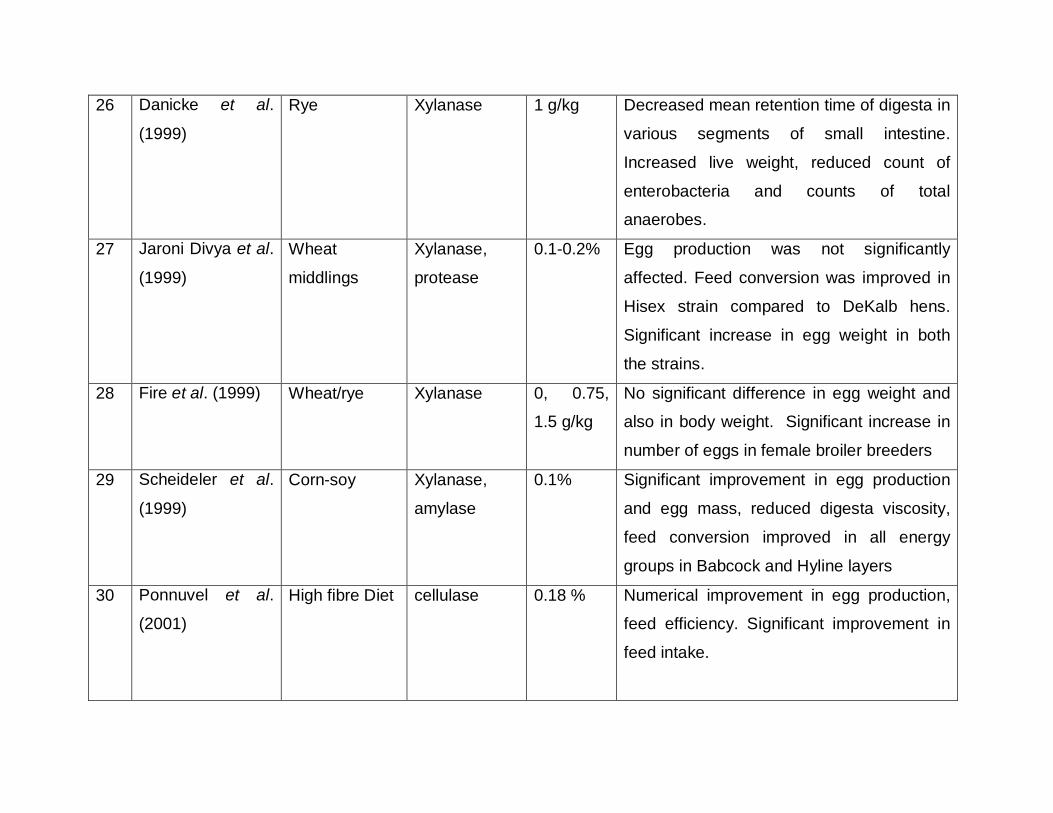
26 Danicke et al.
(1999)
Rye Xylanase 1 g/kg Decreased mean retention time of digesta in
various segments of small intestine.
Increased live weight, reduced count of
enterobacteria and counts of total
anaerobes.
27 Jaroni Divya et al.
(1999)
Wheat
middlings
Xylanase,
protease
0.1-0.2% Egg production was not significantly
affected. Feed conversion was improved in
Hisex strain compared to DeKalb hens.
Significant increase in egg weight in both
the strains.
28 Fire et al. (1999) Wheat/rye Xylanase 0, 0.75,
1.5 g/kg
No significant difference in egg weight and
also in body weight. Significant increase in
number of eggs in female broiler breeders
29 Scheideler et al.
(1999)
Corn-soy Xylanase,
amylase
0.1% Significant improvement in egg production
and egg mass, reduced digesta viscosity,
feed conversion improved in all energy
groups in Babcock and Hyline layers
30 Ponnuvel et al.
(2001)
High fibre Diet cellulase 0.18 % Numerical improvement in egg production,
feed efficiency. Significant improvement in
feed intake.
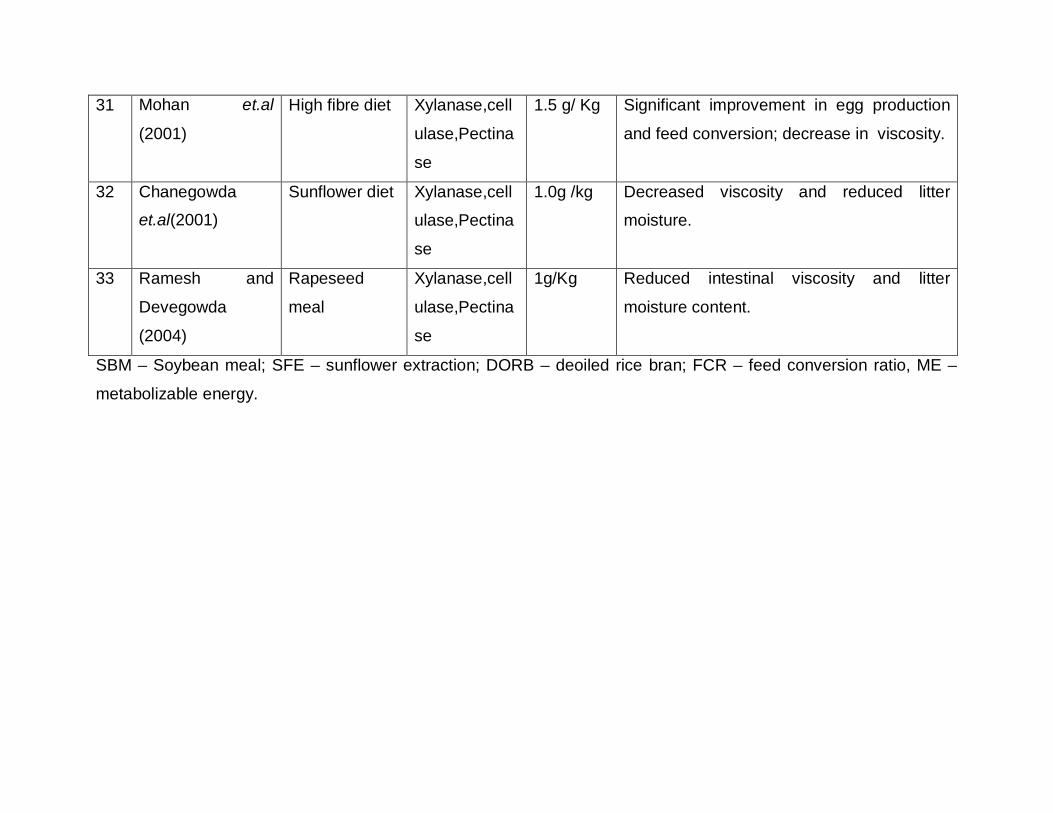
31 Mohan et.al
(2001)
High fibre diet Xylanase,cell
ulase,Pectina
se
1.5 g/ Kg Significant improvement in egg production
and feed conversion; decrease in viscosity.
32 Chanegowda
et.al(2001)
Sunflower diet Xylanase,cell
ulase,Pectina
se
1.0g /kg Decreased viscosity and reduced litter
moisture.
33 Ramesh and
Devegowda
(2004)
Rapeseed
meal
Xylanase,cell
ulase,Pectina
se
1g/Kg Reduced intestinal viscosity and litter
moisture content.
SBM – Soybean meal; SFE – sunflower extraction; DORB – deoiled rice bran; FCR – feed conversion ratio, ME –
metabolizable energy.
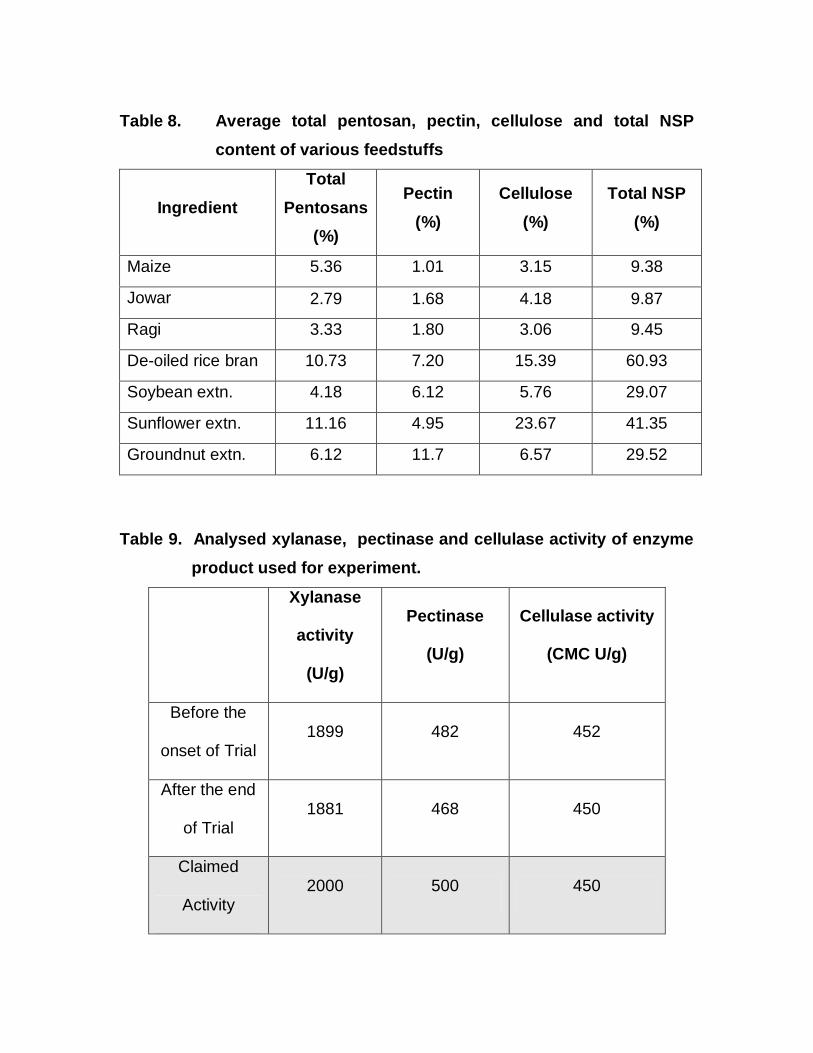
Table 8. Average total pentosan, pectin, cellulose and total NSP content of various feedstuffs
Ingredient Total
Pentosans (%)
Pectin (%)
Cellulose (%)
Total NSP (%)
Maize 5.36 1.01 3.15 9.38
Jowar 2.79 1.68 4.18 9.87
Ragi 3.33 1.80 3.06 9.45
De-oiled rice bran 10.73 7.20 15.39 60.93
Soybean extn. 4.18 6.12 5.76 29.07
Sunflower extn. 11.16 4.95 23.67 41.35
Groundnut extn. 6.12 11.7 6.57 29.52
Table 9. Analysed xylanase, pectinase and cellulase activity of enzyme product used for experiment.
Xylanase
activity
(U/g)
Pectinase
(U/g)
Cellulase activity
(CMC U/g)
Before the
onset of Trial 1899 482 452
After the end
of Trial 1881 468 450
Claimed
Activity 2000 500 450
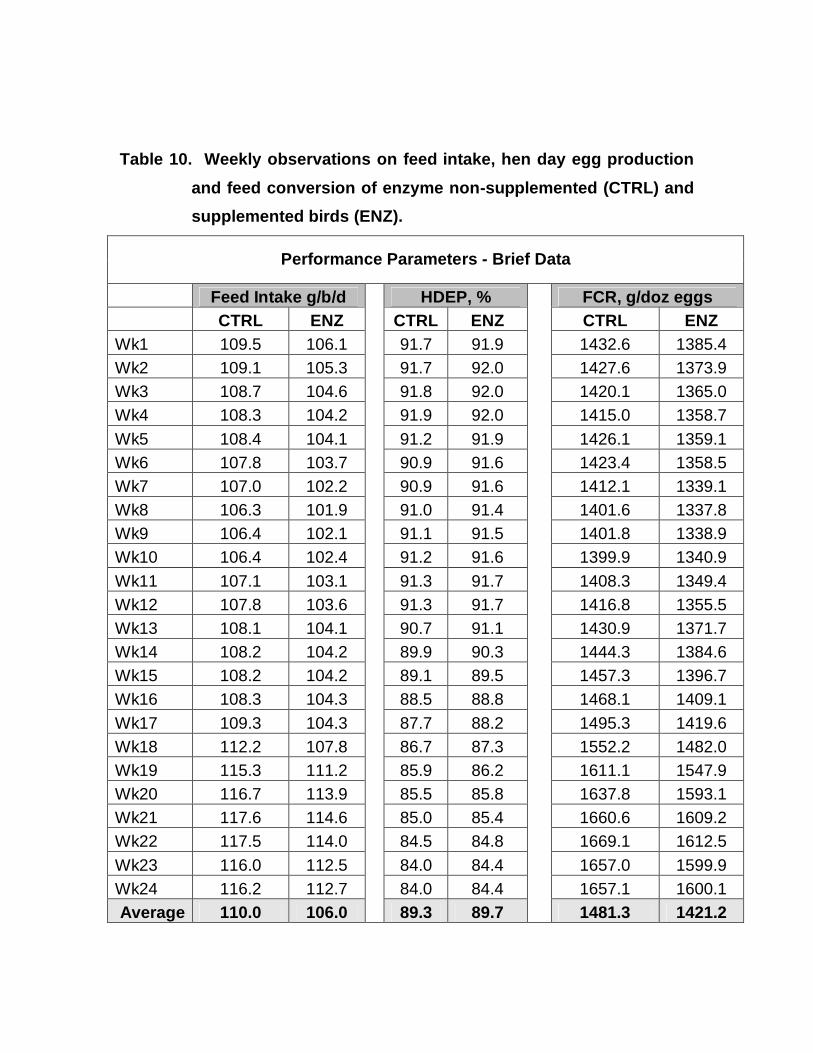
Table 10. Weekly observations on feed intake, hen day egg production and feed conversion of enzyme non-supplemented (CTRL) and supplemented birds (ENZ).
Performance Parameters - Brief Data
Feed Intake g/b/d HDEP, % FCR, g/doz eggs CTRL ENZ CTRL ENZ CTRL ENZ Wk1 109.5 106.1 91.7 91.9 1432.6 1385.4 Wk2 109.1 105.3 91.7 92.0 1427.6 1373.9 Wk3 108.7 104.6 91.8 92.0 1420.1 1365.0 Wk4 108.3 104.2 91.9 92.0 1415.0 1358.7 Wk5 108.4 104.1 91.2 91.9 1426.1 1359.1 Wk6 107.8 103.7 90.9 91.6 1423.4 1358.5 Wk7 107.0 102.2 90.9 91.6 1412.1 1339.1 Wk8 106.3 101.9 91.0 91.4 1401.6 1337.8 Wk9 106.4 102.1 91.1 91.5 1401.8 1338.9 Wk10 106.4 102.4 91.2 91.6 1399.9 1340.9 Wk11 107.1 103.1 91.3 91.7 1408.3 1349.4 Wk12 107.8 103.6 91.3 91.7 1416.8 1355.5 Wk13 108.1 104.1 90.7 91.1 1430.9 1371.7 Wk14 108.2 104.2 89.9 90.3 1444.3 1384.6 Wk15 108.2 104.2 89.1 89.5 1457.3 1396.7 Wk16 108.3 104.3 88.5 88.8 1468.1 1409.1 Wk17 109.3 104.3 87.7 88.2 1495.3 1419.6 Wk18 112.2 107.8 86.7 87.3 1552.2 1482.0 Wk19 115.3 111.2 85.9 86.2 1611.1 1547.9 Wk20 116.7 113.9 85.5 85.8 1637.8 1593.1 Wk21 117.6 114.6 85.0 85.4 1660.6 1609.2 Wk22 117.5 114.0 84.5 84.8 1669.1 1612.5 Wk23 116.0 112.5 84.0 84.4 1657.0 1599.9 Wk24 116.2 112.7 84.0 84.4 1657.1 1600.1 Average 110.0 106.0 89.3 89.7 1481.3 1421.2

Table 11. Period-wise average daily feed intake (gram per bird per day), by laying hens with enzyme non-supplemented (CTRL) and supplemented (ENZ) diets.
CTRL ENZ
Period 1 108.9 105.1
Period 2 107.4 103.0
Period 3 106.9 102.8
Period 4 108.2 104.2
Period 5 113.3 109.3
Period 6 117.0 113.7
Average 110.3 106.3

Table 12. Period-wise average daily hen day egg production (%), by laying hens with enzyme non-supplemented (CTRL) and supplemented (ENZ) diets.
CTRL ENZ
Period 1 91.8 92.0
Period 2 91.0 91.6
Period 3 91.2 91.6
Period 4 89.6 89.9
Period 5 86.4 86.9
Period 6 84.5 84.9
Average 89.09 89.48

Table 13. Period-wise average feed conversion (gram feed per dozen eggs), by laying hens with enzyme non-supplemented (CTRL) and supplemented (ENZ) diets.
CTRL ENZ
Period 1 1423.8 1370.7
Period 2 1415.8 1348.6
Period 3 1406.7 1346.2
Period 4 1450.1 1390.5
Period 5 1574.1 1510.7
Period 6 1662.2 1607.2
Average 1488.8 1429.0
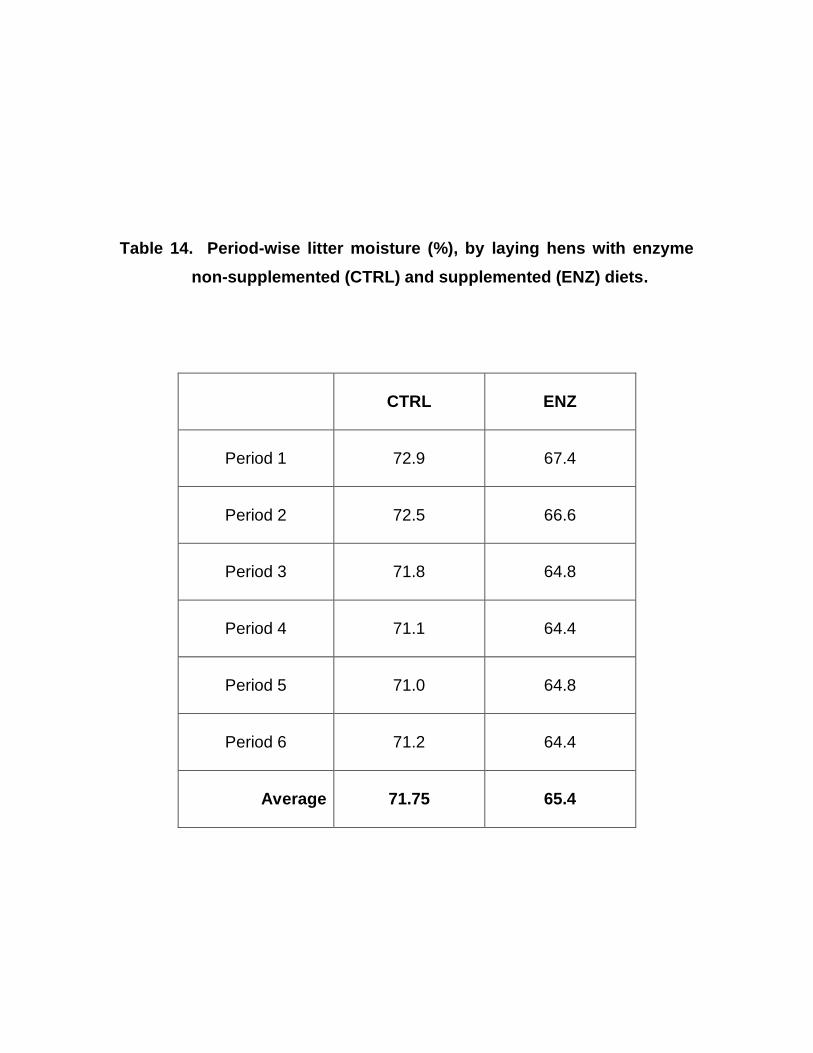
Table 14. Period-wise litter moisture (%), by laying hens with enzyme non-supplemented (CTRL) and supplemented (ENZ) diets.
CTRL ENZ
Period 1 72.9 67.4
Period 2 72.5 66.6
Period 3 71.8 64.8
Period 4 71.1 64.4
Period 5 71.0 64.8
Period 6 71.2 64.4
Average 71.75 65.4

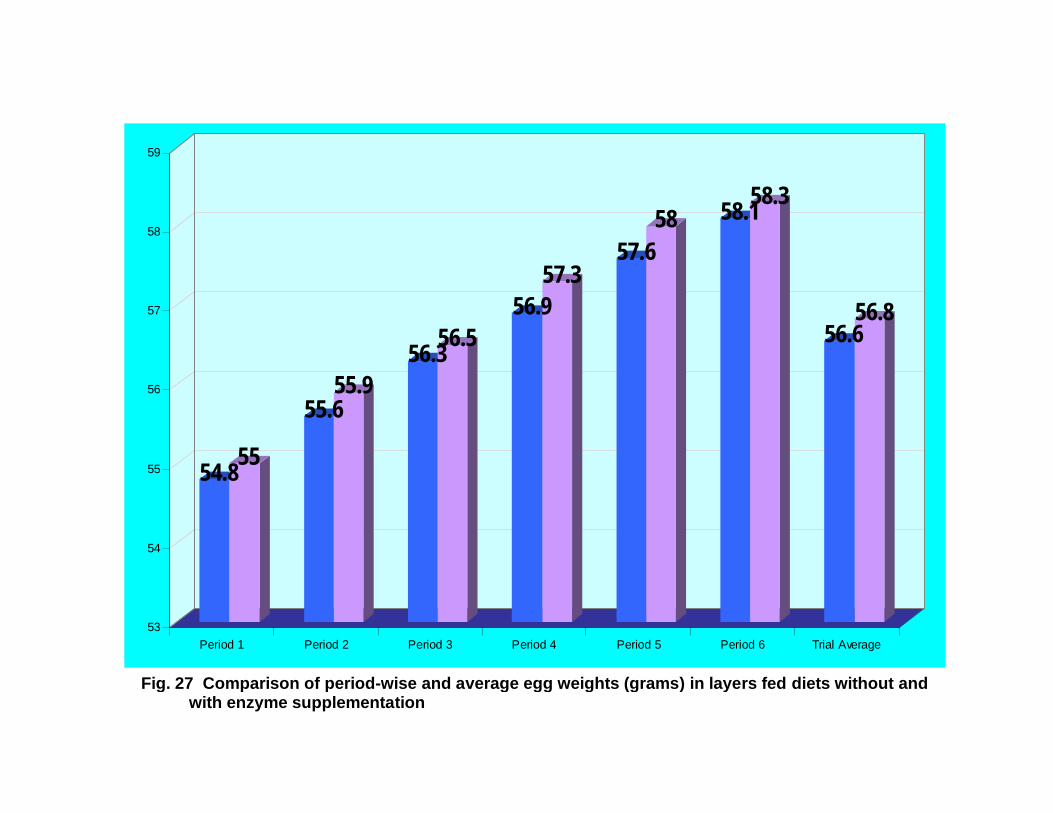
Table 15. Period-wise egg weight (g), by laying hens with enzyme non-supplemented (CTRL) and supplemented (ENZ) diets.
CTRL ENZ
Period 1 54.8 55
Period 2 55.6 55.9
Period 3 56.3 56.5
Period 4 56.9 57.3
Period 5 57.6 58
Period 6 58.1 58.3
Average 56.6 56.8

LIST OF FIGURES Sl. No. Title
1 Skeletal structure of plant cells
2 Arrangement of cellulose, microfibrils and fibrils in plant cell walls
3 Classification of Non-starch polysaccharides
4 Molecular structure of cellulose
5 Molecular structure of arabinoxylan
6 Molecular structure of beta glucans
7 Molecular structure of xylo-glucans
8 Molecular structure of polygalacturonans
9 Molecular structure of rhamnogalacturonans
10 Molecular structure of -galactosides
11 Comparison of Total Pentosans, Pectin, Cellulose and Total NSP values (%) of some cereals commonly used in poultry.
12 Comparison of Total Pentosans, Pectin, Cellulose and Total NSP values (%) of high protein oilcakes commonly used in poultry.
13 Comparison of Total Pentosans, Pectin, Cellulose and Total NSP values (%) of high fiber by-products commonly used in poultry.
14 Comparison of total pentosan content (%) of some feedstuffs commonly used in poultry.
15 Comparison of pectin content (%) of some feedstuffs commonly used in poultry.
16 Comparison of cellulose content (%) of some feedstuffs commonly used in poultry.
17 Comparison of total NSP content (%) of some feedstuffs commonly used in poultry.
18 Comparison of enzyme activities (IU/G) in the commercial enzyme preparation before and after the trial
19 Weekly comparison of average daily feed intake in birds (grams per hen per day) fed diets without and with enzyme supplementation
20 Weekly comparison of average daily hen-day egg production (%) fed diets without and with enzyme supplementation
21 Weekly comparison of average feed conversion (grams feed per dozen eggs) in birds fed diets without and with enzyme supplementation

22 Comparison of period-wise and average daily feed intake (gram per bird per day) in birds fed diets without and with enzyme supplementation
23 Comparison of period-wise and average hen-day egg production (%) in birds fed diets without and with enzyme supplementation
24 Comparison of period-wise and average feed conversion (grams feed per dozen eggs) in birds fed diets without and with enzyme supplementation
25 Comparison of intestinal viscosity (cPs)of the intestinal contents of birds fed diets without and with enzyme supplementation
26 Comparison of period-wise and average litter moisture (%) in layers fed diets without and with enzyme supplementation
27 Comparison of period-wise and average egg weights (grams) in layers fed diets without and with enzyme supplementation
28 Comparison of Total bacterial count and Coliform count (Log 10 values of colony forming units per gram) in the intestinal contents of birds fed diets without and with enzyme supplementation
29 Comparison of farmers’ opinion on enzyme applicability to enhance the profitability of commercial layer operations.
30 Farmers’ observation on the effect of enzymes in commercial layers as applied to production and health parameters.

Fig. 2. Arrangement of cellulose, microfibrils and fibrils in plant cell walls
Fig. 1. Skeletal structure of plant cells

Fig. 5. Molecular structure of arabinoxylan
Fig. 4. Molecular structure of cellulose

Fig. 6. Molecular structure of beta glucans
Fig. 7. Molecular structure of xylo-glucans

Fig. 8. Molecular structure of polygalacturonans
Fig. 9. Molecular structure of rhamnogalacturonans

Fig. 10. Molecular structure of -galactosides

5.35
2.793.33
1.01
1.68 1.80
3.15
4.18
9.389.87
0.00
2.00
4.00
6.00
8.00
10.00
12.00
Maize Jowar
Total Pentosans Pectin Cellulose Total NSP
Fig. 11 Comparison of Total Pentosans, Pectin, Cellulose and Total NSP values (%) of some cereals commonly used in poultry.

4.186.126.12
11.70
5.76 6.57
29.07 29.52
0.00
5.00
10.00
15.00
20.00
25.00
30.00
35.00
Soy GN
Total Pentosans Pectin Cellulose Total NSP
Fig. 12 Comparison of Total Pentosans, Pectin, Cellulose and Total NSP values (%) of high protein oilcakes commonly used in poultry.

10.73 11.16
7.204.95
15.39
23.67
60.93
41.35
0.00
10.00
20.00
30.00
40.00
50.00
60.00
70.00
DORB SFE
Total Pentosans Pectin Cellulose Total NSP
Fig. 13. Comparison of Total Pentosans, Pectin, Cellulose and Total NSP values (%) of high fiber by-products commonly used in poultry.
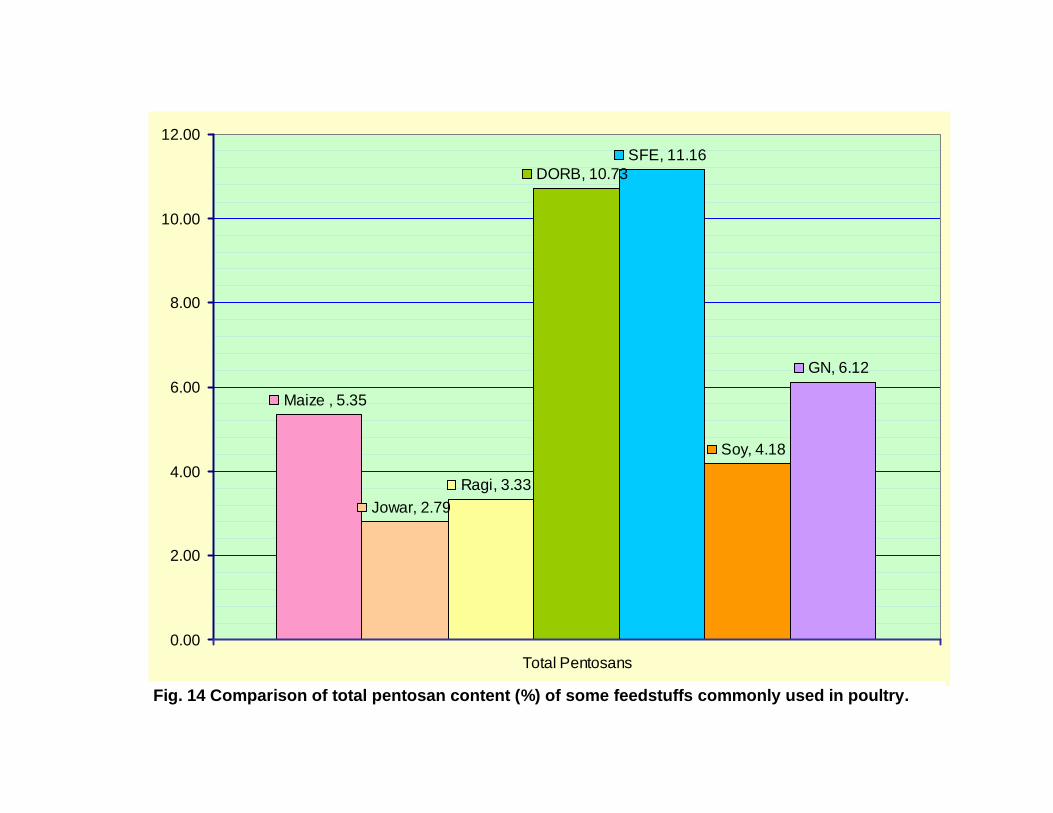
Maize , 5.35
Jowar, 2.79Ragi, 3.33
DORB, 10.73SFE, 11.16
Soy, 4.18
GN, 6.12
0.00
2.00
4.00
6.00
8.00
10.00
12.00
Total Pentosans
Fig. 14 Comparison of total pentosan content (%) of some feedstuffs commonly used in poultry.
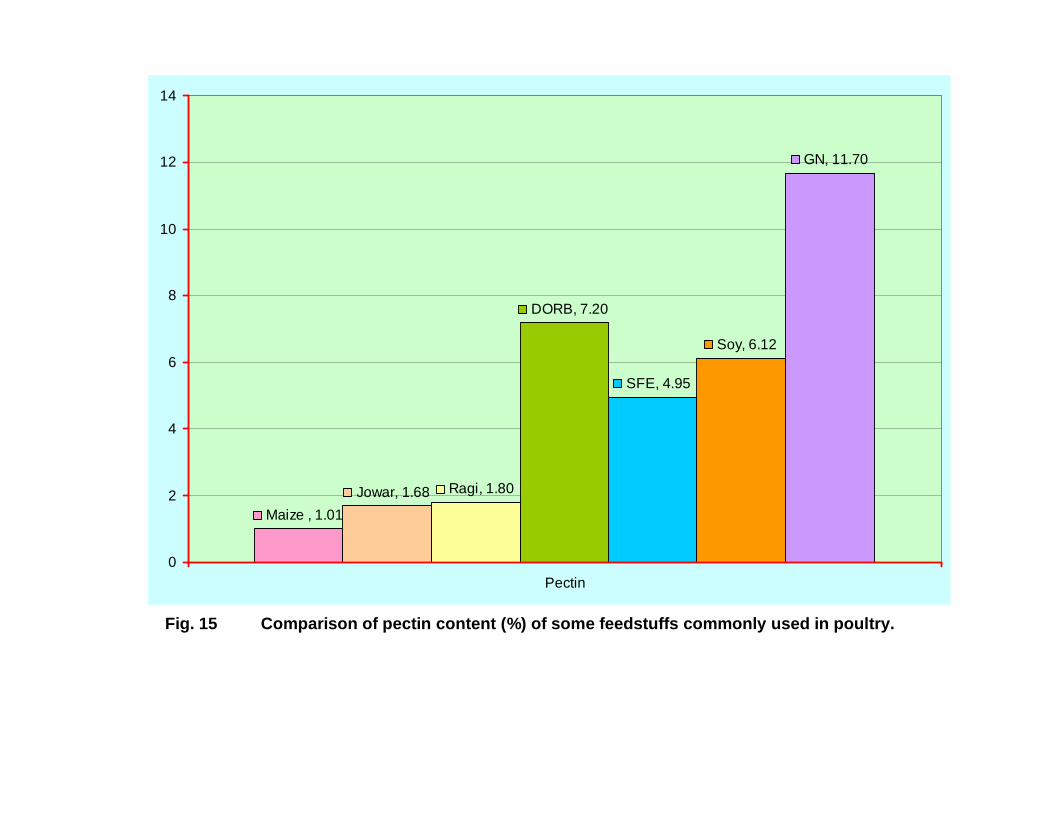
Maize , 1.01Jowar, 1.68 Ragi, 1.80
DORB, 7.20
SFE, 4.95
Soy, 6.12
GN, 11.70
0
2
4
6
8
10
12
14
Pectin
Fig. 15 Comparison of pectin content (%) of some feedstuffs commonly used in poultry.
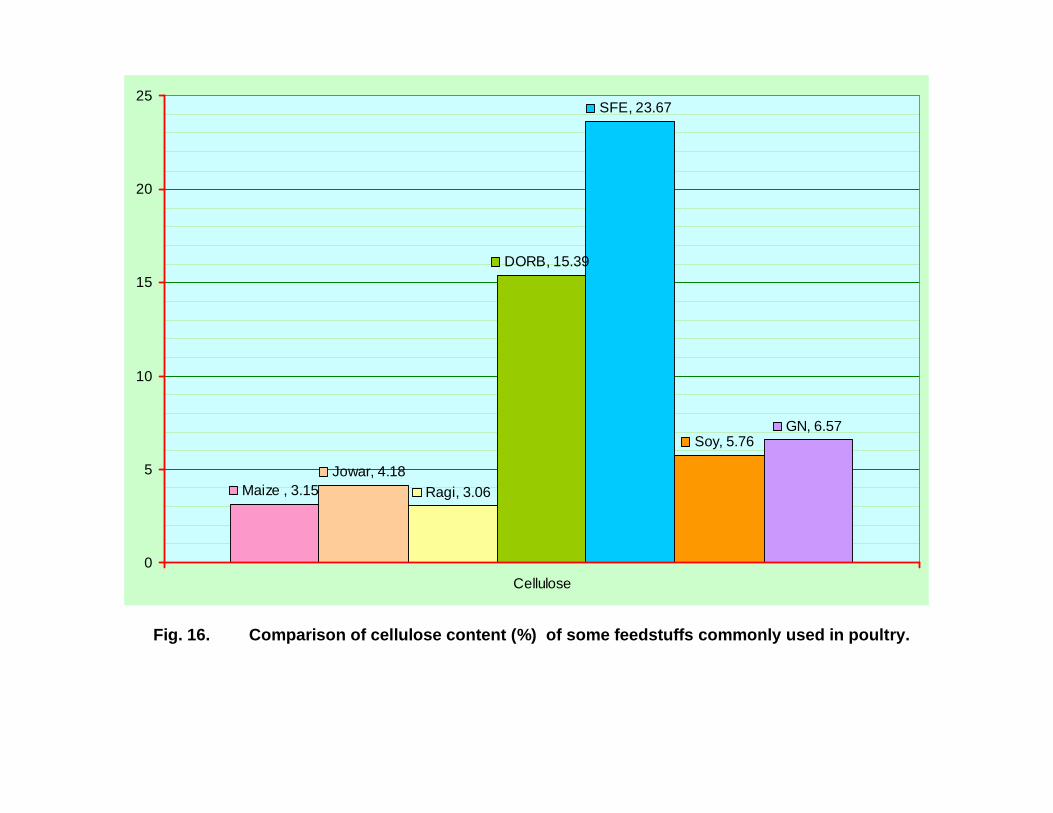
Maize , 3.15Jowar, 4.18
Ragi, 3.06
DORB, 15.39
SFE, 23.67
Soy, 5.76GN, 6.57
0
5
10
15
20
25
Cellulose
Fig. 16. Comparison of cellulose content (%) of some feedstuffs commonly used in poultry.

Maize , 9.38 Jowar, 9.87 Ragi, 9.45
DORB, 60.93
SFE, 41.35
Soy, 29.07 GN, 29.52
0
10
20
30
40
50
60
70
Total NSP
Fig. 17. Comparison of total NSP content (%) of some feedstuffs commonly used in poultry.

Onset, 1899
Onset, 482 Onset, 452
Close, 1881
Close, 468 Close, 450
0
200
400
600
800
1000
1200
1400
1600
1800
2000
Xylanase Pectinase Cellulase
Fig. 18 Comparison of enzyme activities (IU/G) in the commercial enzyme preparation before and after the trial

90.0
95.0
100.0
105.0
110.0
115.0
120.0
Wk1
Wk2
Wk3
Wk4
Wk5
Wk6
Wk7
Wk8
Wk9
Wk1
0W
k11
Wk1
2W
k13
Wk1
4W
k15
Wk1
6W
k17
Wk1
8W
k19
Wk2
0W
k21
Wk2
2W
k23
Feed
inta
ke g
/b/d
Feed Intake g/b/d CTRL Feed Intake g/b/d ENZ
Fig.19 Weekly comparison of average daily feed intake in birds (grams per hen per day) fed diets without and with enzyme supplementation

80.0
82.0
84.0
86.0
88.0
90.0
92.0
94.0
1 2 3 4 5 6 7 8 9 10 11 12 13 14 15 16 17 18 19 20 21 22 23
% H
DE
P
HDEP, % CTRL HDEP, % ENZ
Weeks
Fig. 20 Weekly comparison of average daily hen-day egg production (%) fed diets without and with enzyme supplementation
0.0
200.0
400.0
600.0
800.0
1000.0
1200.0
1400.0
1600.0
1800.0
1 2 3 4 5 6 7 8 9 10 11 12 13 14 15 16 17 18 19 20 21 22 23
FCR
g fe
ed/d
oz e
ggs
FCR, g/doz eggs CTRL FCR, g/doz eggs ENZ
Weeks
Fig. 21 Weekly comparison of average feed conversion (grams feed per dozen eggs) in birds fed diets without and with enzyme supplementation

108.9
105.1
107.4
103.0
106.9
102.8
108.2
104.2
113.3
109.3
117.0
113.7
110.3
106.3
95.0
100.0
105.0
110.0
115.0
120.0
Period 1 Period 2 Period 3 Period 4 Period 5 Period 6 Average
CTRL ENZ
Fig. 22 Comparison of period-wise and average daily feed intake (gram per bird per day) in birds fed diets without and with enzyme supplementation
91.892.0
91.0
91.691.2
91.6
89.689.9
86.486.9
84.584.9
89.0989.48
80.0
82.0
84.0
86.0
88.0
90.0
92.0
Period 1 Period 2 Period 3 Period 4 Period 5 Period 6 Average
CTRL ENZ
Fig. 23 Comparison of period-wise and average hen-day egg production (%) in birds fed diets without and with enzyme supplementation

1423.81370.7
1415.81348.6
1406.71346.2
1450.11390.5
1574.11510.7
1662.21607.2
1488.81429.0
0.0
200.0
400.0
600.0
800.0
1000.0
1200.0
1400.0
1600.0
1800.0
Period 1 Period 2 Period 3 Period 4 Period 5 Period 6 Average
CTRL ENZ
Fig. 24 Comparison of period-wise and average feed conversion (grams feed per dozen eggs) in birds fed diets without and with enzyme supplementation
1.65
1.39
1.72
1.47
1.68
1.44
0
0.2
0.4
0.6
0.8
1
1.2
1.4
1.6
1.8
Least Highest Average
CTRL ENZ
Fig. 25 Comparison of intestinal viscosity (cPs)of the intestinal contents of birds fed diets without and with enzyme supplementation
72.9
67.4
72.5
66.6
71.8
64.8
71.1
64.4
71
64.8
71.2
64.4
71.75
65.4
60
62
64
66
68
70
72
74
Period 1 Period 2 Period 3 Period 4 Period 5 Period 6 Trial Average
Fig. 26 Comparison of period-wise and average litter moisture (%) in layers fed diets without and with enzyme supplementation
54.855
55.655.9
56.356.556.9
57.357.6
58 58.158.3
56.656.8
53
54
55
56
57
58
59
Period 1 Period 2 Period 3 Period 4 Period 5 Period 6 Trial Average
Fig. 27 Comparison of period-wise and average egg weights (grams) in layers fed diets without and with enzyme supplementation
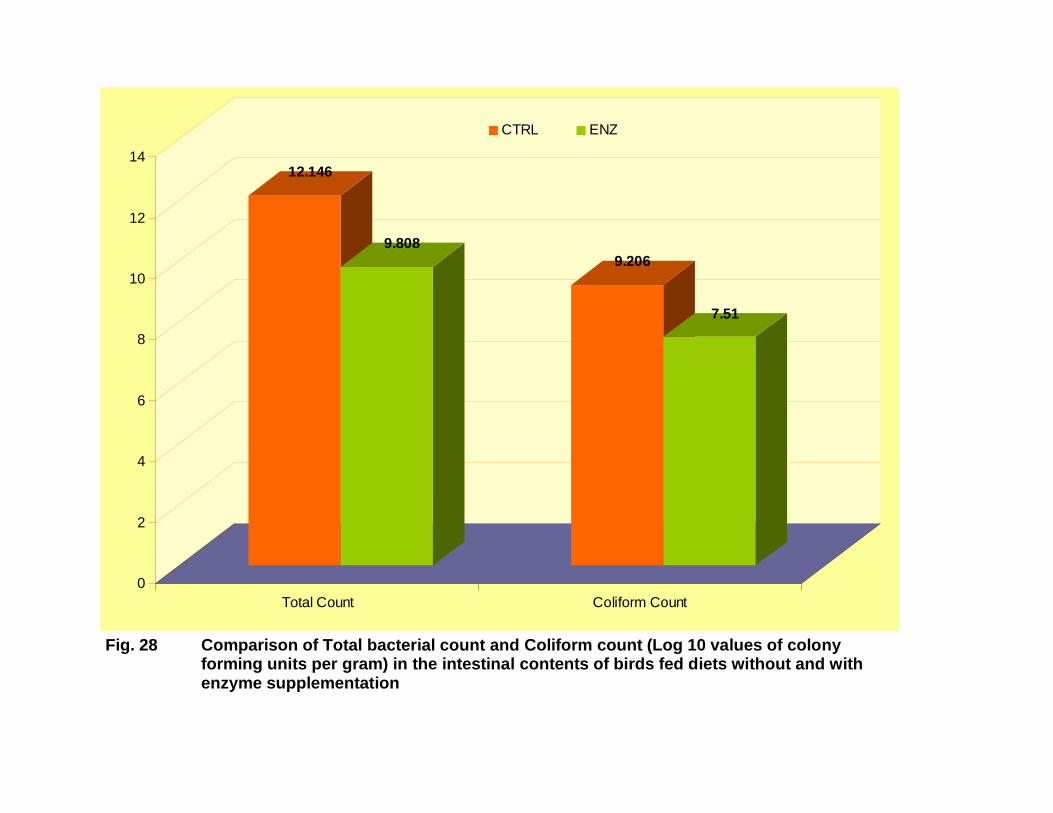
12.146
9.8089.206
7.51
0
2
4
6
8
10
12
14
Total Count Coliform Count
CTRL ENZ
Fig. 28 Comparison of Total bacterial count and Coliform count (Log 10 values of colony forming units per gram) in the intestinal contents of birds fed diets without and with enzyme supplementation

No Use 23.7
No comments
2.6
Very good 52.6
Moderate 21.1
Fig. 29 Comparison of farmers’ opinion on enzyme applicability to enhance the profitability of commercial layer operations.

15.8 13.2
34.242.1
71.1
84.2 86.8
65.857.9
28.9
0.0
20.0
40.0
60.0
80.0
100.0
120.0
Egg Prod. Egg Wt. FC Health Litter
Positive Effect No Positive Effect
Fig. 30 Farmers’ observation on the effect of enzymes in commercial layers as applied to production and health parameters.