Annex I Erasmus+ Programme Annual Report 2014 · This document presents statistics on the...
34
Statistical Annex Annex I Erasmus+ Programme Annual Report 2014
Transcript of Annex I Erasmus+ Programme Annual Report 2014 · This document presents statistics on the...

Statistical Annex
Annex I Erasmus+ Programme Annual Report 2014

EUROPEAN COMMISSION
Directorate-General for Education and Culture
Directorate A — Modernisation of Education I: Europe 2020, country analysis, Erasmus+ coordination
Unit A.3 — Erasmus+ Programme coordination and National Agencies Management
Contact: Francesca PAGNOSSIN
E-mail: [email protected]
European Commission
B-1049 Brussels
EUROPEAN COMMISSION

Table of Contents
Table of Contents ............................................................................................. 3 Introduction .............................................................................................. 4 1.
Erasmus+ 2014 - Budget and Commitments .................................................. 5 2. Budget and EU Commitments by Management Mode and Key Action ............ 5 2.1.
Budget and EU Commitments distribution by Sector .................................. 6 2.2. Overview for the Indirect Management Funds ........................................... 7 2.3.
Indirect Management funds by Sector ..................................................... 8 2.4. Indirect Management funds for School Education ...................................... 9 2.5.
Indirect Management funds for Vocational Education and Training ............. 10 2.6.
Indirect Management funds for Higher Education .................................... 11 2.7. Indirect Management funds for Adult Education ...................................... 12 2.8.
Indirect Management funds for Youth .................................................... 13 2.9. Results of the actions implemented in Indirect Management Mode ............. 14 2.10.
KA1 – Learning Mobility of Individuals ......................................................... 15 3. KA 1 - Mobility of learners and staff ...................................................... 15 3.1.
KA1 – School Education Mobility ........................................................... 16 3.2. KA1 – Vocational Education and Training learner and staff mobility ............ 17 3.3.
KA1 - Higher Education student and staff mobility ................................... 18 3.4.
KA1 - Adult Education staff mobility ...................................................... 19 3.5. KA1 -Youth Mobility ............................................................................ 20 3.6.
KA1 - Participants by Country (Preliminary results) ................................. 21 3.7. KA1 - Participants by programme countries ............................................ 22 3.8.
KA2 – Cooperation for Innovation and the exchange of good practices ............. 23 4. KA2 - Overview for Strategic Partnerships .............................................. 23 4.1.
KA2 - Strategic Partnerships by National Agency and by Sector ................. 24 4.2. KA3 – Support to Policy Reform .................................................................. 25 5.
KA3 - Overview table .......................................................................... 25 5.1.
KA3 - Details for the restricted calls implemented by the Executive Agency 26 5.2. KA3 - Organisations by country for Policy Experimentation ....................... 27 5.3.
Jean Monnet Activities ............................................................................... 28 6. Jean Monnet - Overview of the results ................................................... 28 6.1.
Jean Monnet - Geographical spread of the projects .................................. 29 6.2. Sport Activities ........................................................................................ 31 7.
7.1 Sport - Overview of the results ............................................................. 31 7.2 Geographical spread of the applications ................................................. 32 7.3 Projects by type of organisation ............................................................ 33

Introduction 1. This document presents statistics on the implementation of the Erasmus+ Programme in 2014.
It shows the results of the actions implemented in direct (centralised) and indirect (decentralised) management modes, by the European Commission, the Executive Agency and the National Agencies.
The source system use d to produce the budget and EU commitments tables is ABAC, the EU
Commission's corporate Accounting system. The source systems used to produce the other tables are EPluslink, Mobility Tool for the decentralised actions and Pegasus for the centralised actions.
All tables present data at the contractualisation stage i.e. data from the last amended budget approved by the National Agency except for school-to-school KA2 actions where the data is taken at the time of the grant decision i.e. from budget version 3 in Epluslink. Data has frozen
on 2015, November 25th.
During the months of October and November, National Agencies were requested to validate their data on the KA1, KA2, KA3, TECs based on pre-defined BO reports and excel exports provided by the Commission. Ten NAs did validate the complete set of data and 26 more did
partially validate (mainly KA1 and KA2 data). In 6 more NAs, tests are on-going while we haven't received any feedback from the remaining 18.
The validation exercise allowed for discovering a series of data quality issues, mainly encoding
mistakes and highlighted some misinterpretation of definitions and a need for refining some definitions to improve the data quality. Nevertheless, the EU Commission is confident that the
main issues have been addressed and that remaining issues do not impact the quality of the
information presented. The most relevant definitions used to produce the data are listed below:
Definitions
Submitted Projects Number of projects submitted to the NA i.e. with procedure 1.1 signed
Granted Projects Number of projects contractualised (i.e. with procedure 7.4 signed) except for KA2
– Schools only projects where the number of awarded projects (parent projects) are
counted
Success Rate Number of granted projects divided by the number of applications submitted except
for Higher Education where the success rate = number of participants in granted
projects / number of participants in submitted projects as all applications submitted
by organisations having a ECHE accreditation are granted.
Organisations For KA1 and KA3, number of organisations having a status Valid and not Withdrawn
For KA2, number of organisations included in the last budget version of the project,
approved by the NA except for School only projects where the number of
organisations is counted in budget version 3.
Participants For KA1 and KA2, number of participants as recorded at the activities level in the
budget
For KA2, number of participants in the learning, teaching and training activities
(participants in transnational project meeting,… are not counted)

Erasmus+ 2014 - Budget and Commitments 2.
Budget and EU Commitments by Management Mode and Key Action 2.1.
Source systems = Annual Work Programme and ABAC (extraction date 01/05/2015)
Indirect Indirect
European
CommissionEACEA National Agencies
European
CommissionEACEA National Agencies
KA1 - Learning Mobility of Individuals 30,603,301 115,171,000 1,051,167,544 1,196,941,845 28,448,000 118,605,286 1,056,050,636 1,203,103,923
KA2 - Cooperation for innovation and the exchange of
good practices2,250,000 41,126,073 329,364,666 372,740,739 1,430,934 39,859,006 334,598,100 375,888,040
KA3 - Support to policy reform 41,220,901 44,354,705 5,898,160 91,473,766 34,694,240 42,637,764 5,900,614 83,232,619
Jean Monnet Activities 413,330 38,039,400 38,452,730 619,333 38,169,991 38,789,324
Sport 1,730,000 20,604,390 22,334,390 1,200,591 21,234,390 22,434,981
Management fee National Agencies 64,565,236 64,565,236 64,565,236 64,565,236
Subtotal 76,217,532 259,295,568 1,450,995,606 1,786,508,706 66,393,099 260,506,438 1,461,114,586 1,788,014,123
Administrative expenditure 13,101,653 27,869,679 40,971,332 11,555,564 25,332,870 36,888,434
International cooperation (heading 4) 140,682,761 106,174,865 246,857,626 140,702,760 106,174,865 246,877,625
Total 89,319,185 427,848,008 1,557,170,471 2,074,337,664 77,948,663 426,542,068 1,567,289,451 2,071,780,182
BERASMUS+ 2014 BUDGET/COMMITMENTS PER MANAGEMENT MODE AND KEY ACTION (in EUR)
TOTALTOTAL
Direct Direct
EU COMMITMENTS (in EUR)FINAL BUDGET (in EUR)

Budget and EU Commitments distribution by Sector 2.2.
Source systems = Annual Work Programme 2014 and ABAC
% Amount (in EUR) % Amount (in EUR)
68.90% 1,429,168,290 69.23% 1,434,312,654
755,028,039 761,439,876
386,195,780 382,830,666
182,723,390 185,159,801
60,921,598 63,215,634
Transectorial 44,299,482 41,666,676
1.47% 30,503,301 1.37% 28,348,000
9.71% 201,484,759 9.63% 199,563,928
1.85% 38,452,730 1.87% 38,789,324
1.08% 22,334,390 1.08% 22,434,981
17,334,390 17,217,412
5,000,000 5,217,569
3.11% 64,565,236 3.12% 64,565,236
1,786,508,706 1,788,014,123
1.98% 40,971,332 1.78% 36,888,434
11.90% 246,857,626 11.92% 246,877,625
2,074,337,664 2,071,780,182
Higher Education
School Education
Adult Learning
EU Commitments
Management fees National Agencies
Work Programme Budget
Education and Training, of which:
Administrative expenditure
Total
Vocational Education and Training
Youth
Jean Monnet
Collaborative partnerships, stengthening evidence base for policy
making, dialogue with relevant stakeholders
Support for non-profit European sport events
International cooperation (Heading 4)
Subtotal
Student Loan Guarantee Facility
Sport, of which:

Overview for the Indirect Management Funds 2.3.
Source systems = Annual Work Programme, ABAC, Epluslink (extraction date 25/11/2015)
KA1 KA2 KA1 KA2 KA1 KA2 KA1 KA2 KA1 KA2 KA3 KA1 KA2 KA3
Work Programme 39.56 126.42 279.88 93.73 587.39 37.90 6.68 43.80 137.66 27.52 5.90 1,051.17 329.36 5.90 1,386.43
EU Commitments 44.35 126.42 279.88 93.73 587.39 37.90 6.68 49.01 137.66 27.52 5.90 1,055.96 334.57 5.90 1,396.43
NA Commitments 43.01 124.71 264.12 96.41 600.82 42.02 9.92 45.86 125.70 36.97 5.95 1,043.55 345.96 5.95 1,395.46
in % -3% -1% -6% 3% 2% 11% 49% -6% -9% 34% 1% -1% 3% 1% -0.07%
in million EUR -1.35 -1.71 -15.76 2.67 13.43 4.12 3.24 -3.15 -11.96 9.45 0.05 -12.53 10.67 0.09 -1.77
Adult Education Youth
Difference betwen Funds committed by the NAs and By the EU
TotalTOTAL
AMOUNTS
in million EUR
School EducationVocational Education and
TrainingHigher Education

Indirect Management funds by Sector 2.4.
* Following a transfer of funds between the Belgian Agencies, an amount of 118,984 has been committed twice in 2014. That amount had already been paid and was therefore impossible to de-commit. A recovery order was issued instead and it is not taken into account in the global EU commitment figures presented in tables 2.1 and 2.2 but well in table 2.4
Source systems = Annual Work Programme, ABAC, Epluslink (extraction date 25/11/2015)
Work
Programme
EU
Commitments
NA
CommitmentsDiff.
Work
Programme
EU
Commitments
NA
CommitmentsDiff.
Work
Programme
EU
Commitments
NA
CommitmentsDiff.
Work
Programme
EU
Commitments
NA
CommitmentsDiff.
Work
Programme
EU
Commitments
NA
CommitmentsDiff. Work Programme EU Commitments* NA Commitments Diff.
Belgium BE 3,888,575 3,504,774 4,766,151 36% 8,742,514 8,742,514 7,211,859 -18% 14,600,785 14,600,784 18,038,751 24% 1,139,269 1,256,180 1,553,036 24% 4,360,882 4,360,882 4,348,695 0% 32,732,024 32,465,134 35,918,492 11%
Bulgaria BG 2,728,642 3,480,274 2,721,935 -22% 5,994,651 5,994,651 5,887,729 -2% 9,923,620 9,923,620 10,041,221 1% 803,037 885,947 909,913 3% 3,921,542 3,921,542 3,944,156 1% 23,371,492 24,206,034 23,504,954 -3%
Czech Republic CZ 3,827,457 4,091,699 4,030,000 -2% 8,640,975 8,640,975 8,658,962 0% 14,453,744 14,453,745 14,655,020 1% 1,120,440 1,235,290 1,227,118 -1% 4,209,619 4,209,618 4,302,643 2% 32,252,235 32,631,327 32,873,743 1%
Denmark DK 2,211,240 1,791,218 2,032,681 13% 4,949,097 4,949,098 5,115,878 3% 8,251,403 8,251,403 8,490,696 3% 648,421 715,042 681,725 -5% 3,074,774 3,074,772 3,041,960 -1% 19,134,935 18,781,533 19,362,940 3%
Germany DE 19,751,005 16,449,085 20,074,323 22% 44,561,170 44,561,169 43,642,386 -2% 74,519,085 74,519,085 74,645,139 0% 5,782,611 6,375,462 7,458,399 17% 16,470,253 16,470,253 18,571,426 13% 161,084,123 158,375,054 164,391,673 4%
Estonia EE 1,225,286 1,595,529 1,282,876 -20% 2,730,368 2,730,369 2,727,522 0% 4,733,253 4,733,253 4,649,547 -2% 501,772 555,675 533,022 -4% 2,596,481 2,596,480 2,587,544 0% 11,787,160 12,211,306 11,780,511 -4%
Greece EL 4,194,653 5,680,941 4,262,975 -25% 8,963,638 8,963,638 9,440,628 5% 14,676,647 14,676,647 15,109,777 3% 1,240,962 1,369,985 1,369,281 0% 3,990,409 3,990,409 1,963,239 -51% 33,066,308 34,681,620 32,145,900 -7%
Spain ES 14,787,259 15,899,541 14,154,465 -11% 34,078,812 34,078,811 29,082,117 -15% 57,438,235 57,438,235 64,034,961 11% 4,310,907 4,750,301 4,286,791 -10% 11,068,040 11,068,040 10,808,355 -2% 121,683,252 123,234,928 122,366,689 -1%
France FR 15,873,619 14,028,248 14,790,609 5% 37,444,114 37,444,113 37,925,213 1% 63,638,455 63,638,456 64,249,534 1% 4,605,437 5,071,743 4,902,800 -3% 13,321,410 13,321,410 13,705,975 3% 134,883,035 133,503,970 135,574,131 2%
Croatia HR 1,369,744 1,611,856 1,453,233 -10% 3,049,674 3,049,674 3,049,674 0% 5,232,154 5,232,154 5,222,595 0% 507,808 561,753 560,196 0% 2,863,460 2,863,461 2,824,582 -1% 13,022,840 13,318,898 13,110,280 -2%
Ireland IE 2,087,254 1,867,834 1,563,652 -16% 4,688,156 4,688,156 4,252,353 -9% 7,833,165 7,833,164 7,722,158 -1% 611,637 674,430 1,498,904 122% 2,898,321 2,898,321 2,315,385 -20% 18,118,533 17,961,905 17,352,452 -3%
Italy IT 15,083,382 16,725,796 15,593,199 -7% 33,824,925 33,824,925 33,451,649 -1% 56,436,392 56,436,392 56,838,774 1% 4,421,331 4,875,355 4,599,436 -6% 12,118,906 12,118,906 12,889,950 6% 121,884,935 123,981,374 123,373,008 0%
Cyprus CY 747,803 1,206,701 938,930 -22% 1,677,151 1,677,150 1,786,405 7% 3,024,638 3,024,637 2,924,079 -3% 481,157 534,915 357,071 -33% 2,279,803 2,279,803 2,260,909 -1% 8,210,552 8,723,206 8,267,394 -5%
Latvia LV 1,619,612 2,250,068 1,837,612 -18% 3,614,065 3,614,065 3,256,437 -10% 6,123,417 6,123,418 6,279,380 3% 518,564 572,584 566,887 -1% 2,601,022 2,601,022 2,185,991 -16% 14,476,682 15,161,157 14,126,307 -7%
Lithuania LT 2,347,764 2,937,380 2,474,549 -16% 5,226,576 5,226,576 5,156,656 -1% 8,696,306 8,696,306 8,814,806 1% 689,178 760,087 725,330 -5% 3,089,446 3,089,446 3,115,395 1% 20,049,271 20,709,795 20,286,736 -2%
Luxembourg LU 543,025 428,512 471,111 10% 1,104,929 1,104,929 987,336 -11% 1,824,096 1,824,095 1,661,505 -9% 466,595 520,242 349,989 -33% 1,646,296 1,646,296 1,220,182 -26% 5,584,940 5,524,074 4,690,123 -15%
Hungary HU 3,575,465 3,900,645 2,372,140 -39% 8,007,938 8,007,937 7,932,288 -1% 13,354,735 13,354,735 13,336,991 0% 1,048,323 1,156,011 810,004 -30% 4,289,147 4,289,147 4,302,779 0% 30,275,607 30,708,475 28,754,202 -6%
Malta MT 550,517 438,870 714,729 63% 1,157,492 1,157,492 1,209,980 5% 1,934,353 1,934,353 1,782,473 -8% 467,983 521,647 472,353 -9% 1,640,751 1,640,751 1,693,984 3% 5,751,095 5,693,113 5,873,519 3%
Netherlands NL 5,347,843 4,665,368 5,567,362 19% 12,575,406 12,575,407 14,055,482 12% 21,348,944 21,348,944 20,259,058 -5% 1,552,596 1,709,942 1,559,711 -9% 5,403,586 5,403,586 4,100,380 -24% 46,228,375 45,703,247 45,541,994 0%
Austria AT 3,116,273 2,880,248 3,884,001 35% 7,003,155 7,003,155 7,359,250 5% 11,693,997 11,693,997 13,993,508 20% 913,079 1,006,791 1,360,284 35% 3,495,258 3,495,258 3,504,405 0% 26,221,762 26,079,449 30,101,448 15%
Poland PL 12,206,348 12,723,502 12,712,450 0% 27,501,787 27,501,787 28,645,292 4% 45,967,395 45,967,395 46,382,794 1% 3,574,686 3,941,308 3,591,466 -9% 11,211,511 11,211,510 11,408,797 2% 100,461,727 101,345,502 102,740,799 1%
Portugal PT 4,122,888 5,295,017 4,298,386 -19% 9,213,755 9,213,756 9,562,133 4% 15,352,894 15,352,894 15,691,639 2% 1,209,348 1,333,650 1,351,316 1% 4,259,230 4,259,230 4,384,281 3% 34,158,115 35,454,547 35,287,754 0%
Romania RO 5,984,399 7,449,925 6,182,125 -17% 13,268,759 13,268,759 12,935,075 -3% 22,043,340 22,043,341 22,858,458 4% 1,758,080 1,939,159 1,811,847 -7% 7,043,605 7,043,605 6,782,513 -4% 50,098,182 51,744,789 50,570,019 -2%
Slovenia SI 1,447,103 2,100,305 1,498,235 -29% 3,225,637 3,225,637 3,270,982 1% 5,510,964 5,510,963 5,489,285 0% 511,170 565,139 566,223 0% 2,510,052 2,510,051 2,429,341 -3% 13,204,926 13,912,095 13,254,066 -5%
Slovakia SK 2,430,665 2,466,612 1,992,720 -19% 5,456,634 5,456,633 5,323,584 -2% 9,107,964 9,107,964 10,204,059 12% 712,342 785,471 899,705 15% 3,275,656 3,275,656 3,296,632 1% 20,983,262 21,092,336 21,716,700 3%
Finland FI 2,898,327 3,803,807 3,396,929 -11% 6,515,481 6,515,482 6,778,274 4% 10,881,000 10,881,000 11,234,247 3% 849,166 936,310 962,274 3% 3,098,509 3,098,509 3,191,355 3% 24,242,483 25,235,108 25,563,079 1%
Sweden SE 3,318,701 3,337,851 3,917,636 17% 7,421,375 7,421,374 7,703,607 4% 12,369,283 12,369,283 12,425,974 0% 973,336 1,073,362 1,157,203 8% 4,070,079 4,070,079 3,832,713 -6% 28,152,773 28,271,949 29,037,133 3%
United Kingdom UK 14,776,249 12,027,992 14,268,061 19% 32,030,008 32,030,008 24,000,551 -25% 52,744,806 52,744,805 54,266,544 3% 4,359,768 4,811,441 4,620,722 -4% 13,467,571 13,467,571 13,126,959 -3% 117,378,402 115,081,817 110,282,837 -4%
Iceland IS 575,300 666,979 842,478 26% 1,332,052 1,332,053 1,059,220 -20% 2,300,604 2,300,604 2,195,010 -5% 472,383 526,075 631,056 20% 1,657,435 1,657,435 1,259,926 -24% 6,337,775 6,483,146 5,987,690 -8%
Liechtenstein LI 478,120 310,621 708,825 128% 647,968 647,969 339,102 -48% 865,353 865,353 1,083,990 25% 455,018 508,584 313,214 -38% 418,939 418,939 373,153 -11% 2,865,398 2,751,466 2,818,284 2%
Norway NO 2,086,518 2,192,199 2,001,963 -9% 4,670,635 4,670,634 4,639,271 -1% 7,793,391 7,793,391 6,904,915 -11% 611,830 674,688 643,189 -5% 3,049,270 3,049,270 2,894,454 -5% 18,211,644 18,380,182 17,083,792 -7%
Turkey TR 10,462,472 12,533,817 10,809,307 -14% 23,583,049 23,583,049 23,217,468 -2% 39,423,971 39,423,971 40,112,384 2% 3,063,717 3,377,897 3,353,635 -1% 11,330,562 11,330,563 11,631,630 3% 87,863,772 90,249,297 89,124,423 -1%
FYRM MK 315,881 426,174 99,540 -77% 712,015 712,015 861,063 21% 1,190,280 1,190,280 1,234,155 4% 92,499 101,984 89,875 -12% 342,079 342,079 316,786 -7% 2,652,754 2,772,532 2,601,419 -6%
TOTAL 165,979,390 170,769,388 167,715,188 -2% 373,613,960 373,613,960 360,525,425 -4% 625,288,669 625,288,667 642,833,428 3% 50,474,448 55,684,450 55,773,974 0% 171,073,902 171,073,900 168,616,474 -1% 1,386,430,370 1,396,430,365 1,395,464,489 -0.07%
TOTALSCHOOL EDUCATION VOCATIONAL EDUCATION & TRAINING HIGHER EDUCATION ADULT EDUCATION YOUTH

Indirect Management funds for School Education 2.5.
Source systems = Annual Work Programme, ABAC, Epluslink (extraction date 25/11/2015)
Work
Programme
EU
Commitments
NA
CommitmentsDiff.
Work
Programme
EU
Commitments
NA
CommitmentsDiff.
Belgium BE 927,046 1,039,288 715,188 -31% 2,961,530 2,465,486 4,050,963 64%
Bulgaria BG 628,417 704,504 790,817 12% 2,100,225 2,775,770 1,931,118 -30%
Czech Republic CZ 918,135 1,029,300 1,471,542 43% 2,909,322 3,062,399 2,558,458 -16%
Denmark DK 523,640 587,041 590,439 1% 1,687,600 1,204,177 1,442,242 20%
Germany DE 4,733,280 5,306,369 4,670,854 -12% 15,017,725 11,142,716 15,403,469 38%
Estonia EE 288,262 323,164 318,408 -1% 937,023 1,272,365 964,468 -24%
Greece EL 926,318 1,038,473 1,105,605 6% 3,268,335 4,642,468 3,157,370 -32%
Spain ES 3,656,809 4,099,563 3,660,836 -11% 11,130,449 11,799,978 10,493,629 -11%
France FR 4,061,435 4,553,179 2,501,815 -45% 11,812,185 9,475,069 12,288,794 30%
Croatia HR 321,838 360,805 439,684 22% 1,047,906 1,251,051 1,013,549 -19%
Ireland IE 496,892 557,054 418,765 -25% 1,590,362 1,310,780 1,144,887 -13%
Italy IT 3,582,282 4,016,012 3,658,496 -9% 11,501,100 12,709,784 11,934,703 -6%
Cyprus CY 173,270 194,249 172,422 -11% 574,532 1,012,452 766,508 -24%
Latvia LV 381,821 428,051 419,604 -2% 1,237,791 1,822,017 1,418,008 -22%
Lithuania LT 551,538 618,316 591,967 -4% 1,796,226 2,319,064 1,882,582 -19%
Luxembourg LU 92,478 103,675 77,211 -26% 450,547 324,837 393,900 21%
Hungary HU 847,567 950,187 1,039,585 9% 2,727,898 2,950,458 1,332,555 -55%
Malta MT 99,894 111,989 155,140 39% 450,623 326,881 559,589 71%
Netherlands NL 1,362,059 1,526,972 1,648,051 8% 3,985,784 3,138,396 3,919,311 25%
Austria AT 742,449 832,342 893,094 7% 2,373,824 2,047,906 2,990,907 46%
Poland PL 2,919,299 3,272,758 3,483,614 6% 9,287,049 9,450,744 9,228,836 -2%
Portugal PT 974,140 1,092,085 1,263,662 16% 3,148,749 4,202,932 3,034,724 -28%
Romania RO 1,397,390 1,566,581 1,659,407 6% 4,587,009 5,883,344 4,522,718 -23%
Slovenia SI 340,602 381,841 407,400 7% 1,106,501 1,718,464 1,090,835 -37%
Slovakia SK 578,194 648,200 742,315 15% 1,852,471 1,818,412 1,250,405 -31%
Finland FI 690,857 774,504 1,736,782 124% 2,207,470 3,029,303 1,660,147 -45%
Sweden SE 784,887 879,918 1,195,926 36% 2,533,814 2,457,933 2,721,710 11%
United Kingdom UK 3,334,783 3,738,547 3,254,022 -13% 11,441,466 8,289,445 11,014,039 33%
Iceland IS 124,544 139,623 331,875 138% 450,756 527,356 510,603 -3%
Liechtenstein LI 27,953 31,338 116,980 273% 450,166 279,283 591,845 112%
Norway NO 494,213 554,051 525,470 -5% 1,592,306 1,638,148 1,476,493 -10%
Turkey TR 2,503,862 2,807,021 2,849,894 2% 7,958,611 9,726,796 7,959,413 -18%
FYRM MK 75,596 84,749 99,540 17% 240,285 341,425 - -100%
TOTAL 39,561,752 44,351,749 43,006,410 -3% 126,417,638 126,417,639 124,708,778 -1%
KA1 KA2
SCHOOL EDUCATION

Indirect Management funds for Vocational Education and Training 2.6.
Source systems = Annual Work Programme, ABAC, Epluslink (extraction date 25/11/2015)
Work
Programme
EU
Commitments
NA
CommitmentsDiff.
Work
Programme
EU
Commitments
NA
CommitmentsDiff.
Belgium BE 6,558,386 6,558,386 4,865,774 -26% 2,184,128 2,184,128 2,346,085 7%
Bulgaria BG 4,445,735 4,445,735 4,437,903 0% 1,548,916 1,548,916 1,449,826 -6%
Czech Republic CZ 6,495,351 6,495,351 6,390,039 -2% 2,145,624 2,145,624 2,268,923 6%
Denmark DK 3,704,492 3,704,493 3,871,591 5% 1,244,605 1,244,605 1,244,287 0%
Germany DE 33,485,600 33,485,600 32,201,351 -4% 11,075,569 11,075,569 11,441,035 3%
Estonia EE 2,039,314 2,039,314 2,101,423 3% 691,055 691,055 626,099 -9%
Greece EL 6,553,242 6,553,242 6,366,661 -3% 2,410,396 2,410,396 3,073,967 28%
Spain ES 25,870,107 25,870,107 22,133,208 -14% 8,208,704 8,208,704 6,948,909 -15%
France FR 28,732,630 28,732,629 29,362,728 2% 8,711,484 8,711,484 8,562,485 -2%
Croatia HR 2,276,844 2,276,844 2,232,904 -2% 772,830 772,830 816,770 6%
Ireland IE 3,515,264 3,515,264 2,263,936 -36% 1,172,892 1,172,892 1,988,417 70%
Italy IT 25,342,866 25,342,866 25,024,821 -1% 8,482,059 8,482,059 8,426,828 -1%
Cyprus CY 1,225,800 1,225,800 966,541 -21% 451,350 451,350 819,864 82%
Latvia LV 2,701,195 2,701,194 2,206,357 -18% 912,871 912,871 1,050,080 15%
Lithuania LT 3,901,860 3,901,860 3,871,986 -1% 1,324,716 1,324,716 1,284,670 -3%
Luxembourg LU 654,232 654,233 571,710 -13% 450,696 450,696 415,626 -8%
Hungary HU 5,996,113 5,996,113 6,042,904 1% 2,011,824 2,011,824 1,889,384 -6%
Malta MT 706,699 706,699 744,286 5% 450,793 450,793 465,694 3%
Netherlands NL 9,635,892 9,635,892 10,012,895 4% 2,939,515 2,939,515 4,042,587 38%
Austria AT 5,252,460 5,252,460 4,890,839 -7% 1,750,695 1,750,695 2,468,411 41%
Poland PL 20,652,590 20,652,590 21,668,480 5% 6,849,197 6,849,197 6,976,812 2%
Portugal PT 6,891,553 6,891,554 7,212,609 5% 2,322,202 2,322,202 2,349,524 1%
Romania RO 9,885,841 9,885,841 9,659,412 -2% 3,382,918 3,382,918 3,275,663 -3%
Slovenia SI 2,409,593 2,409,593 2,009,447 -17% 816,044 816,044 1,261,535 55%
Slovakia SK 4,090,437 4,090,436 4,425,490 8% 1,366,197 1,366,197 898,094 -34%
Finland FI 4,887,473 4,887,473 4,793,681 -2% 1,628,009 1,628,009 1,984,593 22%
Sweden SE 5,552,687 5,552,687 5,873,837 6% 1,868,687 1,868,687 1,829,770 -2%
United Kingdom UK 23,591,929 23,591,929 15,598,094 -34% 8,438,079 8,438,079 8,402,457 0%
Iceland IS 881,090 881,090 451,025 -49% 450,962 450,963 608,195 35%
Liechtenstein LI 197,757 197,757 159,869 -19% 450,212 450,212 179,233 -60%
Norway NO 3,496,310 3,496,309 3,580,079 2% 1,174,325 1,174,325 1,059,192 -10%
Turkey TR 17,713,575 17,713,575 17,547,221 -1% 5,869,474 5,869,474 5,670,247 -3%
FYRM MK 534,805 534,805 577,257 8% 177,210 177,210 283,806 60%
TOTAL 279,879,722 279,879,721 264,116,357 -6% 93,734,238 93,734,239 96,409,068 3%
KA2
VOCATIONAL EDUCATION & TRAINING
KA1

Indirect Management funds for Higher Education 2.7.
Source systems = Annual Work Programme, ABAC, Epluslink (extraction date 25/11/2015)
Work
Programme
EU
Commitments
NA
CommitmentsDiff.
Work
Programme
EU
Commitments
NA
CommitmentsDiff.
Belgium BE 13,764,275 13,764,275 17,243,885 25% 836,509 836,509 794,866 -5%
Bulgaria BG 9,330,393 9,330,393 9,404,156 1% 593,227 593,227 637,065 7%
Czech Republic CZ 13,631,982 13,631,982 13,798,878 1% 821,763 821,763 856,142 4%
Denmark DK 7,774,726 7,774,726 7,670,489 -1% 476,677 476,677 820,207 72%
Germany DE 70,277,200 70,277,200 70,291,353 0% 4,241,885 4,241,885 4,353,786 3%
Estonia EE 4,279,967 4,279,966 4,235,252 -1% 453,287 453,287 414,295 -9%
Greece EL 13,753,478 13,753,478 14,186,608 3% 923,169 923,169 923,169 0%
Spain ES 54,294,344 54,294,345 61,031,723 12% 3,143,890 3,143,890 3,003,238 -4%
France FR 60,302,003 60,302,003 61,111,081 1% 3,336,453 3,336,453 3,138,453 -6%
Croatia HR 4,778,478 4,778,478 4,769,945 0% 453,676 453,676 452,650 0%
Ireland IE 7,377,587 7,377,586 7,270,374 -1% 455,578 455,578 451,784 -1%
Italy IT 53,187,808 53,187,808 53,471,486 1% 3,248,584 3,248,584 3,367,288 4%
Cyprus CY 2,572,623 2,572,622 2,670,790 4% 452,015 452,015 253,289 -44%
Latvia LV 5,669,076 5,669,076 5,898,610 4% 454,342 454,342 380,770 -16%
Lithuania LT 8,188,947 8,188,947 8,152,684 0% 507,359 507,359 662,122 31%
Luxembourg LU 1,373,056 1,373,056 1,263,290 -8% 451,039 451,039 398,215 -12%
Hungary HU 12,584,217 12,584,217 12,725,852 1% 770,518 770,518 611,139 -21%
Malta MT 1,483,171 1,483,170 1,428,103 -4% 451,183 451,183 354,370 -21%
Netherlands NL 20,223,125 20,223,125 18,042,422 -11% 1,125,819 1,125,819 2,216,636 97%
Austria AT 11,023,490 11,023,490 12,958,768 18% 670,507 670,507 1,034,740 54%
Poland PL 43,344,189 43,344,189 43,517,395 0% 2,623,206 2,623,206 2,865,399 9%
Portugal PT 14,463,503 14,463,503 14,798,859 2% 889,391 889,391 892,780 0%
Romania RO 20,747,701 20,747,701 21,683,274 5% 1,295,640 1,295,640 1,175,184 -9%
Slovenia SI 5,057,082 5,057,082 4,848,268 -4% 453,881 453,881 641,017 41%
Slovakia SK 8,584,718 8,584,718 9,481,074 10% 523,246 523,246 722,985 38%
Finland FI 10,257,481 10,257,481 10,635,050 4% 623,519 623,519 599,197 -4%
Sweden SE 11,653,586 11,653,586 11,322,784 -3% 715,697 715,697 1,103,190 54%
United Kingdom UK 49,513,066 49,513,065 50,572,406 2% 3,231,740 3,231,740 3,694,138 14%
Iceland IS 1,849,168 1,849,168 1,507,379 -18% 451,436 451,436 687,631 52%
Liechtenstein LI 415,038 415,037 192,025 -54% 450,316 450,316 891,965 98%
Norway NO 7,337,806 7,337,806 5,316,570 -28% 455,585 455,585 1,588,345 249%
Turkey TR 37,175,994 37,175,993 38,337,612 3% 2,247,978 2,247,978 1,774,772 -21%
FYRM MK 1,122,410 1,122,410 978,900 -13% 67,870 67,870 255,255 276%
TOTAL 587,391,686 587,391,682 600,817,346 2% 37,896,983 37,896,985 42,016,082 11%
KA1 KA2
HIGHER EDUCATION
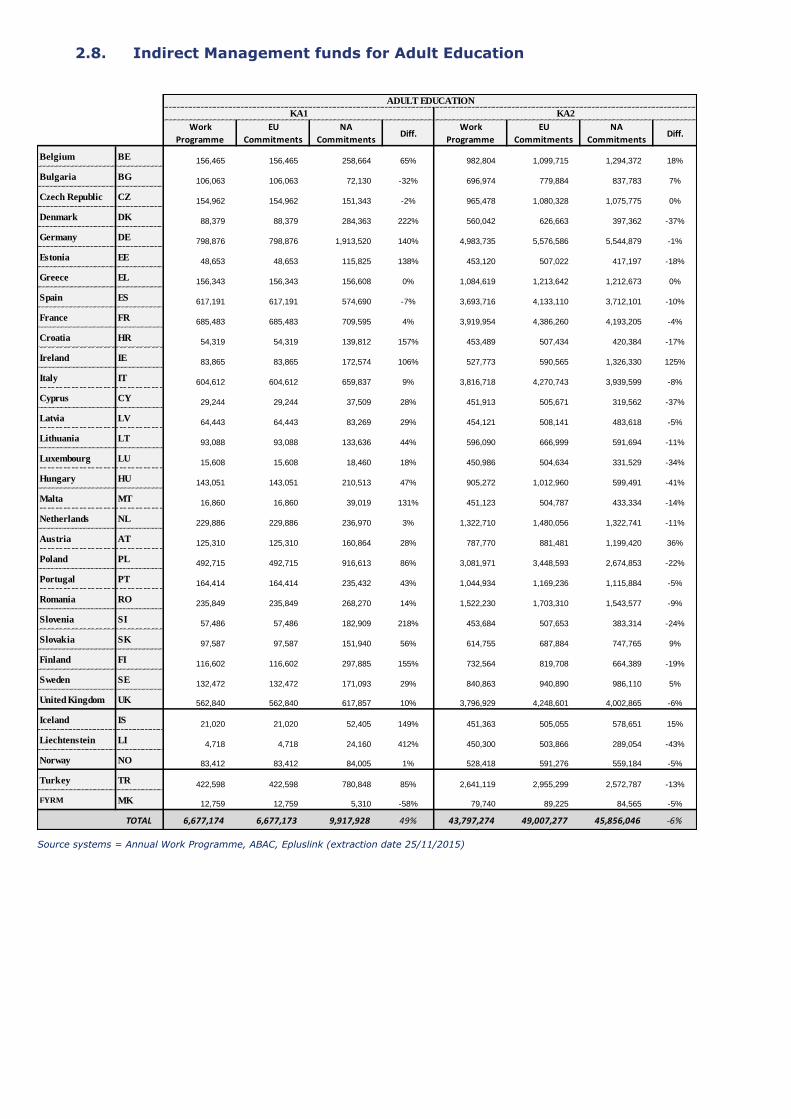
Indirect Management funds for Adult Education 2.8.
Source systems = Annual Work Programme, ABAC, Epluslink (extraction date 25/11/2015)
Work
Programme
EU
Commitments
NA
CommitmentsDiff.
Work
Programme
EU
Commitments
NA
CommitmentsDiff.
Belgium BE 156,465 156,465 258,664 65% 982,804 1,099,715 1,294,372 18%
Bulgaria BG 106,063 106,063 72,130 -32% 696,974 779,884 837,783 7%
Czech Republic CZ 154,962 154,962 151,343 -2% 965,478 1,080,328 1,075,775 0%
Denmark DK 88,379 88,379 284,363 222% 560,042 626,663 397,362 -37%
Germany DE 798,876 798,876 1,913,520 140% 4,983,735 5,576,586 5,544,879 -1%
Estonia EE 48,653 48,653 115,825 138% 453,120 507,022 417,197 -18%
Greece EL 156,343 156,343 156,608 0% 1,084,619 1,213,642 1,212,673 0%
Spain ES 617,191 617,191 574,690 -7% 3,693,716 4,133,110 3,712,101 -10%
France FR 685,483 685,483 709,595 4% 3,919,954 4,386,260 4,193,205 -4%
Croatia HR 54,319 54,319 139,812 157% 453,489 507,434 420,384 -17%
Ireland IE 83,865 83,865 172,574 106% 527,773 590,565 1,326,330 125%
Italy IT 604,612 604,612 659,837 9% 3,816,718 4,270,743 3,939,599 -8%
Cyprus CY 29,244 29,244 37,509 28% 451,913 505,671 319,562 -37%
Latvia LV 64,443 64,443 83,269 29% 454,121 508,141 483,618 -5%
Lithuania LT 93,088 93,088 133,636 44% 596,090 666,999 591,694 -11%
Luxembourg LU 15,608 15,608 18,460 18% 450,986 504,634 331,529 -34%
Hungary HU 143,051 143,051 210,513 47% 905,272 1,012,960 599,491 -41%
Malta MT 16,860 16,860 39,019 131% 451,123 504,787 433,334 -14%
Netherlands NL 229,886 229,886 236,970 3% 1,322,710 1,480,056 1,322,741 -11%
Austria AT 125,310 125,310 160,864 28% 787,770 881,481 1,199,420 36%
Poland PL 492,715 492,715 916,613 86% 3,081,971 3,448,593 2,674,853 -22%
Portugal PT 164,414 164,414 235,432 43% 1,044,934 1,169,236 1,115,884 -5%
Romania RO 235,849 235,849 268,270 14% 1,522,230 1,703,310 1,543,577 -9%
Slovenia SI 57,486 57,486 182,909 218% 453,684 507,653 383,314 -24%
Slovakia SK 97,587 97,587 151,940 56% 614,755 687,884 747,765 9%
Finland FI 116,602 116,602 297,885 155% 732,564 819,708 664,389 -19%
Sweden SE 132,472 132,472 171,093 29% 840,863 940,890 986,110 5%
United Kingdom UK 562,840 562,840 617,857 10% 3,796,929 4,248,601 4,002,865 -6%
Iceland IS 21,020 21,020 52,405 149% 451,363 505,055 578,651 15%
Liechtenstein LI 4,718 4,718 24,160 412% 450,300 503,866 289,054 -43%
Norway NO 83,412 83,412 84,005 1% 528,418 591,276 559,184 -5%
Turkey TR 422,598 422,598 780,848 85% 2,641,119 2,955,299 2,572,787 -13%
FYRM MK 12,759 12,759 5,310 -58% 79,740 89,225 84,565 -5%
TOTAL 6,677,174 6,677,173 9,917,928 49% 43,797,274 49,007,277 45,856,046 -6%
ADULT EDUCATION
KA1 KA2

Indirect Management funds for Youth 2.9.
Source systems = Annual Work Programme, ABAC, Epluslink (extraction date 25/11/2015)
Work
Programme
EU
Commitments
NA
CommitmentsDiff.
Work
Programme
EU
Commitments
NA
CommitmentsDiff.
Work
Programme
EU
Commitments
NA
CommitmentsDiff.
Belgium BE 3,513,809 3,513,810 3,329,422 -5% 696,416 696,416 840,360 21% 150,656 150,656 178,912 19%
Bulgaria BG 3,166,035 3,166,035 3,053,414 -4% 627,489 627,489 758,164 21% 128,018 128,018 132,578 4%
Czech Republic CZ 3,374,659 3,374,659 2,852,762 -15% 692,293 692,293 1,290,721 86% 142,666 142,666 159,160 12%
Denmark DK 2,495,957 2,495,956 2,130,228 -15% 472,219 472,219 805,132 70% 106,597 106,597 106,600 0%
Germany DE 13,204,760 13,204,760 14,350,345 9% 2,684,708 2,684,708 3,653,639 36% 580,785 580,785 567,442 -2%
Estonia EE 2,096,993 2,096,992 1,998,357 -5% 415,611 415,611 463,797 12% 83,877 83,877 125,390 49%
Greece EL 3,203,648 3,203,648 1,584,280 -51% 634,944 634,944 314,302 -50% 151,817 151,817 64,657 -57%
Spain ES 8,918,147 8,918,147 8,874,802 0% 1,767,523 1,767,523 1,585,079 -10% 382,370 382,370 348,474 -9%
France FR 10,718,076 10,718,076 9,620,445 -10% 2,124,259 2,124,259 3,565,856 68% 479,075 479,075 519,674 8%
Croatia HR 2,303,449 2,303,450 2,143,430 -7% 456,530 456,530 572,982 26% 103,481 103,481 108,170 5%
Ireland IE 2,319,861 2,319,861 1,509,059 -35% 473,060 473,060 706,937 49% 105,400 105,400 99,388 -6%
Italy IT 9,764,889 9,764,889 9,982,686 2% 1,935,343 1,935,343 2,537,241 31% 418,674 418,674 370,024 -12%
Cyprus CY 1,834,954 1,834,954 1,673,477 -9% 363,677 363,677 573,512 58% 81,172 81,172 13,920 -83%
Latvia LV 2,061,006 2,061,006 1,729,231 -16% 451,477 451,477 356,760 -21% 88,539 88,539 100,000 13%
Lithuania LT 2,496,430 2,496,430 2,507,262 0% 495,028 495,028 513,933 4% 97,988 97,988 94,200 -4%
Luxembourg LU 1,327,164 1,327,164 779,577 -41% 260,192 260,192 289,255 11% 58,940 58,940 151,350 157%
Hungary HU 3,460,195 3,460,195 3,449,936 0% 688,557 688,557 734,728 7% 140,395 140,395 118,115 -16%
Malta MT 1,320,297 1,320,297 1,400,705 6% 261,675 261,675 233,955 -11% 58,779 58,779 59,324 1%
Netherlands NL 4,429,562 4,429,561 2,880,045 -35% 794,302 794,302 1,071,168 35% 179,723 179,723 149,167 -17%
Austria AT 2,796,527 2,796,527 2,243,623 -20% 572,979 572,979 1,135,250 98% 125,752 125,752 125,533 0%
Poland PL 9,063,570 9,063,570 8,669,192 -4% 1,796,345 1,796,345 2,388,001 33% 351,595 351,595 351,604 0%
Portugal PT 3,363,929 3,363,929 3,399,592 1% 736,891 736,891 797,255 8% 158,410 158,410 187,434 18%
Romania RO 5,581,604 5,581,604 5,335,931 -4% 1,222,687 1,222,687 1,208,174 -1% 239,314 239,314 238,408 0%
Slovenia SI 1,999,061 1,999,061 1,919,574 -4% 423,361 423,361 420,532 -1% 87,629 87,629 89,235 2%
Slovakia SK 2,637,966 2,637,966 2,224,025 -16% 527,036 527,036 962,003 83% 110,654 110,654 110,604 0%
Finland FI 2,505,464 2,505,464 2,499,202 0% 483,741 483,741 578,587 20% 109,304 109,304 113,566 4%
Sweden SE 3,328,474 3,328,474 2,425,084 -27% 609,271 609,271 1,330,889 118% 132,334 132,334 76,740 -42%
United Kingdom UK 10,851,585 10,851,585 9,033,332 -17% 2,150,719 2,150,719 3,549,357 65% 465,267 465,267 544,270 17%
Iceland IS 1,311,811 1,311,811 870,291 -34% 287,361 287,361 375,451 31% 58,263 58,263 14,184 -76%
Liechtenstein LI 336,054 336,054 40,050 -88% 67,835 67,835 321,688 374% 15,050 15,050 11,415 -24%
Norway NO 2,478,705 2,478,705 1,710,594 -31% 467,371 467,371 1,079,480 131% 103,194 103,194 104,380 1%
Turkey TR 9,117,308 9,117,309 9,218,996 1% 1,822,607 1,822,607 1,912,657 5% 390,647 390,647 499,977 28%
FYRM MK 275,259 275,259 256,126 -7% 55,026 55,026 45,000 -18% 11,794 11,794 15,660 33%
TOTAL 137,657,210 137,657,208 125,695,074 -9% 27,518,532 27,518,533 36,971,845 34% 5,898,160 5,898,159 5,949,555 1%
YOUTH
KA1 (incl.TECs) KA2 KA3

Results of the actions implemented in Indirect Management Mode 2.10.
Source system = Epluslink, extraction date = 25/11/2015
Submitted Contracted Success RateTotal
in EURBudget share Total
with Special
Needs
with Fewer
Opportunities
School education staff mobility (KA101) 8,978 2,806 31% 43,006,410 4% 4,252 21,037 58 .
VET learner and staff mobility (KA102) 5,912 3,156 53% 264,116,357 25% 18,094 126,004 1,424
Higher education student and staff mobility (KA103) 3,765 3,620 71% 600,817,346 58% 3,620 341,393 . .
Adult education staff mobility (KA104) 2,296 424 18% 9,917,928 1% 961 5,593 74 .
Youth mobility (KA105) includint Training and Evaluation cycle (KA113) 11,616 5,749 49% 125,695,074 12% 29,851 151,395 4,656 47,129
32,567 15,755 1,043,553,115 100.00% 56,778 645,422 6,212 47,129
Strategic Partnerships for School Education 1,057 206 19% 46,127,908 13% 1,265 13,563
Strategic Partnerships for Schools Only 2,998 522 17% 78,272,387 23% 2,566 93,351
Strategic Partnerships for Adult Education 1,317 215 16% 45,764,442 13% 1,289 8,238
Strategic Partnerships for Higher Education 917 154 17% 42,016,082 12% 1,046 17,130
Strategic Partnerships for Vocational Education and Training 1,657 377 23% 96,034,874 28% 2,492 9,575
Strategic Partnerships for Youth 1,730 258 15% 30,033,152 9% 1,165 16,948
Transnational Cooperation Activities for Youth 6,938,693 2% 12,957
Transnational Cooperation Activities for other Sectors 774,281 0.2% 919
9,676 1,732 18% 345,961,819 100.00% 9,823 172,681
KA3 - Support for policy
reformDialogue between young people and policy makers (KA347) 668 211 32% 5,949,555 100.00% 691 53,393 2,730 .
668 211 32% 5,949,555 100.00% 691 53,393 2,730
42,911 17,698 41% 1,395,464,489 100.00% 67,292 871,496 8,942 47,129 GRAND TOTAL
PARTICIPANTS
KA1 - Learning Mobility
of Individuals
Sub-total Key Action 1
KA2 - Cooperation for
innovation and the
exchange of good
practices
Sub-total Key Action 2
Sub-total Key Action 3
KEY ACTION ACTION ORGANISATIONS
GRANT AMOUNTPROJECTS

KA1 – Learning Mobility of Individuals 3.
KA 1 - Mobility of learners and staff 3.1.
Source system = Epluslink, extraction date = 25/11/2015
Submitted Granted
Involving
National
Consortia
Success
RateActivity Type
Number of Projects
including this
activity type
Number of
Activities of
this type
Total
with
Special
Needs
with Fewer
Opportunities
Staff training abroad 2,718 3626 19185 50 .
Training/teaching assignments abroad 353 407 1852 8 .
Subtotal - KA1 School Education 8978 2806 0 31.25% 43,006,410.00 4252 Subtotal - KA1 School Education 2806 4033 21037 58 .
Staff training abroad 1,689 2025 18943 47
Training/teaching assignments abroad 582 644 4383 2
VET learners traineeships in companies abroad 1,838 2147 66470 743
VET learners traineeships in vocational institutes abroad 1,154 1273 36208 632
Subtotal - KA1 Vocational Education and Training 5912 3156 528 53.38% 264,116,356.90 18094 Subtotal - KA1 Vocational Education and Training 3156 6089 126004 1424
Student mobility for studies between Programme
Countries2,513 2515 213879 . .
Student mobility for traineeships between Programme
Countries2,942 2943 73338 . .
Staff mobility for teaching between Programme
Countries2,572 2573 35186 . .
Staff mobility for training between Programme Countries 2,677 2678 18990 . .
Subtotal - KA1 Higher Education 3765 3620 126 96.15% 600,817,345.54 3620 Subtotal - KA1 Higher Education 3615 10709 341393 . .
Staff training abroad 417 823 5252 71 .
Training/teaching assignments abroad 62 90 341 3 .
Subtotal - KA1 Adult Education 2296 424 35 18.47% 9,917,928.18 961 Subtotal - KA1 Adult Education 424 913 5593 74 .
European Voluntary Service - Partner Countries 741 884 2660 44 1127
European Voluntary Service - Programme Countries 1,536 2008 6168 257 2187
M obility o f youth workers - Partner Countries 602 695 19086 278 4320
M obility o f youth workers - Programme Countries 822 969 24138 317 4925
Youth Exchanges - Partner Countries 584 747 25003 790 8802
Youth Exchanges - Programme Countries 1,829 2309 74340 2970 25768
Subtotal - KA1 Youth 11616 5749 0 49.49% 120,320,134.89 29851 Subtotal - KA1 Youth 5749 7612 151395 4656 47129
32567 15755 689 48.38% 1,038,178,175.51 56778 GRAND TOTAL 15750 29356 645422 6212 47129
120,320,134.89 29851
GRAND TOTAL
Youth
Youth mobility
(KA105)11,616 5,749 0 49.49%
18.47% 9,917,928.18 961
600,817,345.54 3620
Adult
Education
Adult education staff mobility
(KA104)2,296 424 35
Higher
Education
Higher education student and staff mobility
(KA103)3,765 3,620 126 71%
53.38% 264,116,356.90 18094
43,006,410.00 4252
Vocational
Education and
Training
VET learner and staff mobility
(KA102)5,912 3,156 528
School
Education
School education staff mobility
(KA101)8,978 2,806 0 31.25%
FIELD ACTION
PROJECTS ACTIVITIES PARTICIPANTSORGANISATIONS
involved in
projects
GRANT
AMOUNT
(EUR)

KA1 – School Education Mobility 3.2.
Source system = Epluslink, extraction date = 25/11/2015
Out of which
Staff Tra ining
Tra ining/
Teaching
Ass ignments
Other
Costs
Staff
Tra ining
Tra ining/
Teaching
Ass ignments
Tota l with
specia l needsStaff Tra ining
Tra ining/
Teaching
Ass ignments
AT01 286 173 60% 893,094 709,768 32,911 154,350 5,162 2,025 441 410 31 - - - 234
BE01 30 8 27% 144,338 116,758 980 26,600 18,042 1,899 76 75 1 - - - 13
BE02 69 43 62% 501,339 372,587 13,752 116,550 11,659 1,506 333 321 12 - - - 71
BE03 9 7 78% 69,511 55,511 - 14,000 9,930 1,738 40 40 - - - - 7
BG01 204 27 13% 790,817 641,697 45,520 103,600 29,290 2,672 296 265 31 - - - 49
CY01 48 32 67% 172,422 130,530 10,427 31,850 5,388 1,895 91 82 9 - - - 65
CZ01 359 89 25% 1,471,542 1,226,868 40,586 204,400 16,534 2,520 584 547 37 - - - 124
DE03 566 506 89% 4,670,854 3,544,303 307,712 828,800 9,231 1,972 2,368 2,078 290 6 6 - 666
DK01 60 38 63% 590,439 406,188 74,169 116,200 15,538 1,778 332 270 62 - - - 57
EE01 80 36 45% 318,408 252,546 10,643 55,300 8,845 2,015 158 149 9 - - - 64
EL01 399 96 24% 1,105,605 867,720 30,416 207,550 11,517 1,864 593 561 32 - - - 137
ES01 875 208 24% 3,660,836 2,762,231 355,740 544,600 17,600 2,359 1,552 1,267 285 - - - 341
FI01 175 146 83% 1,736,782 1,125,487 270,745 340,550 11,896 1,785 973 734 239 2 1 1 196
FR01 249 205 82% 2,501,815 1,960,634 203,888 352,100 12,204 2,487 1,006 863 143 25 18 7 370
HR01 133 22 17% 439,684 340,998 24,486 74,200 19,986 2,074 212 195 17 - - - 34
HU01 94 63 67% 1,039,585 712,153 164,352 163,100 16,501 2,231 466 332 134 2 2 - 96
IE01 68 20 29% 418,765 309,310 32,105 77,350 20,938 1,723 243 216 27 - - - 27
IS01 49 31 63% 331,875 234,935 31,490 65,450 10,706 1,775 187 158 29 - - - 39
IT02 1,178 107 9% 3,658,496 3,011,921 59,716 596,750 34,192 2,146 1,705 1,653 52 - - - 207
LI01 5 5 100% 116,980 95,980 - 21,000 23,396 1,950 60 60 - - - - 5
LT01 146 29 20% 591,967 472,958 11,302 110,250 20,413 1,879 315 311 4 - - - 44
LU01 4 4 100% 77,211 54,111 - 23,100 19,303 1,170 66 66 - 1 1 - 4
LV01 109 29 27% 419,604 345,160 8,294 66,150 14,469 2,220 189 184 5 - - - 58
MK01 13 10 77% 99,540 84,840 - 14,700 9,954 2,370 42 42 - - - - 13
MT01 34 14 41% 155,140 128,540 - 26,600 11,081 2,041 76 76 - - - - 25
NL01 229 64 28% 1,648,051 1,114,387 251,174 302,400 25,751 1,899 868 710 158 1 1 - 91
NO01 59 44 75% 525,470 424,990 8,450 94,500 11,943 1,946 270 264 6 1 1 - 66
PL01 279 135 48% 3,483,614 2,904,599 18,115 568,750 25,805 2,141 1,627 1,611 16 2 2 - 183
PT01 151 33 22% 1,263,662 1,003,682 1,680 258,300 38,293 1,712 738 736 2 - - - 46
RO01 534 62 12% 1,659,407 1,380,107 - 280,000 26,765 2,074 800 800 - - - - 175
SE01 148 47 32% 1,195,926 831,484 81,992 282,450 25,445 1,482 807 721 86 8 8 - 98
SI01 74 23 31% 407,400 333,805 2,382 73,150 17,713 1,949 209 208 1 - - - 39
SK01 126 54 43% 742,315 585,035 36,330 122,150 13,747 2,127 349 316 33 - - - 99
TR01 1,659 110 7% 2,849,894 2,394,048 7,100 463,400 25,908 2,146 1,328 1,318 10 9 9 - 163
UK01 477 286 60% 3,254,022 2,578,385 110,390 570,850 11,378 1,988 1,637 1,546 91 1 1 - 346
Total 8,978 2,806 31% 43,006,410 33,514,256 2,246,847 7,351,050 15,327 2,044 21,037 19,185 1,852 58 50 8 4,252
National
Agency
PROJECTS PARTICIPANTS
Submitted ContractedSucess
Rate
TOTAL
(EUR)
per Project
(EUR)
per Participant
(EUR)Total
ORGANISATIONS
Details by Activity Details for Participants with Special Needs
GRANT AMOUNT AVERAGE GRANT

KA1 – Vocational Education and Training learner and staff mobility 3.3.
Source system = Epluslink, extraction date = 25/11/2011
Out of which (in kEUR) by Activity Out of which
Staff Training
Training
Teaching
Assignments
Learners in
Companies
Learners in
Vocational
Institutes
Other
costs
Staff
Training
Training
Teaching
Assignments
Learners in
Companies
Learners in
Vocational
Institutes
with special
Needs
with fewer
Opportuni
ties
AT01 97 90 93% 4,890,839 106,049 78,193 1,618,479 2,164,144 926,450 54,343 21,451 1,811 2,928 139 89 1,073 1,627 8 - 625
BE01 34 24 71% 2,563,886 367,724 - 838,204 1,086,020 302,150 106,829 14,087 3,287 962 182 - 278 502 - - 159
BE02 37 30 81% 2,246,354 50,839 182,581 1,443,771 223,263 345,900 74,878 15,492 2,452 1,061 41 104 792 124 - - 139
BE03 2 2 100% 55,534 - - 42,934 - 12,600 27,767 - 1,501 37 - - 37 - - - 6
BG01 131 74 56% 4,437,903 770,736 72,780 1,258,888 1,725,718 635,650 59,972 11,123 2,832 1,966 369 30 678 889 30 - 175
CY01 18 17 94% 966,541 97,939 27,985 412,702 275,315 152,600 56,855 14,645 2,491 454 51 15 228 160 - - 46
CZ01 286 147 51% 6,390,039 323,167 2,324 3,434,507 1,594,691 1,035,350 43,470 24,113 2,186 3,188 261 4 1,837 1,086 55 - 509
DE02 534 502 94% 32,201,351 3,155,534 985,029 10,495,651 10,121,583 7,464,600 64,146 8,274 1,862 21,186 3,149 743 8,768 8,526 115 - 2,236
DK01 48 45 94% 3,871,591 462,937 22,305 1,822,590 785,609 778,150 86,035 9,196 1,963 2,393 406 15 1,360 612 2 - 384
EE01 35 32 91% 2,101,423 197,964 1,941 1,362,093 226,275 313,150 65,669 13,825 2,715 926 151 1 649 125 25 - 222
EL01 204 131 64% 6,366,661 1,846,558 281,923 967,431 2,210,899 1,061,950 48,600 4,548 3,512 3,213 1,225 175 441 1,372 40 - 326
ES01 343 238 69% 22,133,208 1,177,560 57,244 17,411,875 1,364,851 2,126,450 92,997 24,269 5,452 4,972 884 28 3,571 489 20 - 2,131
FI01 63 46 73% 4,793,681 443,013 168,051 2,878,491 277,026 1,027,100 104,210 6,838 2,103 2,980 509 192 2,002 277 155 - 651
FR01 453 318 70% 29,362,728 3,902,267 627,321 16,068,889 3,493,547 5,539,300 92,336 9,546 1,937 18,233 2,633 443 11,897 3,260 27 - 2,160
HR01 74 36 49% 2,232,904 129,614 165,970 988,260 579,820 369,600 62,025 10,533 2,333 1,169 103 109 662 295 - - 127
HU01 164 106 65% 6,042,904 985,145 99,827 3,467,882 531,496 976,150 57,009 7,807 2,605 3,094 701 73 1,946 374 18 - 397
IE01 17 16 94% 2,263,936 137,010 134,648 1,135,991 593,337 262,950 141,496 12,304 3,180 896 77 107 432 280 10 - 89
IS01 13 10 77% 451,025 73,540 9,580 96,801 211,108 64,500 45,103 6,178 4,215 180 65 8 28 79 - - 44
IT01 287 98 34% 25,024,821 1,370,164 69,623 19,401,059 1,235,817 3,486,600 255,355 26,287 3,128 8,953 875 77 7,391 610 187 - 1,729
LI01 1 1 100% 159,869 - - 148,069 - 11,800 159,869 - 4,996 32 - - 32 - - - 15
LT01 93 76 82% 3,871,986 627,482 6,546 1,848,831 715,272 677,250 50,947 7,306 2,390 2,150 524 6 1,202 418 114 - 400
LU01 8 8 100% 571,710 11,800 - 502,360 - 57,550 71,464 38,114 3,737 168 15 - 153 - - - 36
LV01 49 41 84% 2,206,357 230,508 45,660 1,187,876 425,937 317,350 53,814 10,710 3,389 857 179 27 449 202 9 - 155
MK01 26 16 62% 577,257 57,209 - 61,232 351,116 107,700 36,079 14,079 1,944 338 41 - 43 254 20 - 51
MT01 5 3 60% 744,286 100,960 1,480 576,211 - 66,300 248,095 9,793 5,098 222 75 1 146 - - - 51
NL01 55 51 93% 10,012,895 717,669 219,766 6,989,976 1,298,786 1,110,950 196,331 12,392 3,598 3,591 635 173 2,260 523 19 - 461
NO01 74 53 72% 3,580,079 507,096 97,467 1,675,889 942,227 357,400 67,549 11,294 4,129 1,184 274 43 438 429 23 - 303
PL01 394 252 64% 21,668,480 1,458,327 895,339 12,460,520 3,559,768 3,307,600 85,986 15,357 2,434 10,315 984 427 6,693 2,211 55 - 748
PT01 111 74 67% 7,212,609 358,788 148,862 5,499,152 304,026 923,250 97,468 21,659 3,592 2,341 273 60 1,832 176 2 - 574
RO01 234 102 44% 9,659,412 1,430,691 9,280 3,569,576 3,279,202 1,389,700 94,700 13,701 2,764 4,200 697 8 1,724 1,771 25 - 406
SE01 77 48 62% 5,873,837 368,285 25,424 3,075,550 1,607,578 797,000 122,372 17,692 3,217 2,158 312 20 1,255 571 55 - 351
SI01 53 39 74% 2,009,447 360,376 23,092 1,076,648 221,404 361,550 51,524 6,545 2,320 1,173 292 15 698 168 40 - 171
SK01 139 83 60% 4,425,490 133,874 19,455 2,506,480 1,116,640 698,450 53,319 30,312 2,146 2,208 120 26 1,321 741 - - 277
TR01 1482 229 15% 17,547,221 3,193,998 988,477 1,285,280 9,244,448 3,112,650 76,625 7,636 2,490 9,345 1,747 551 829 6,218 221 - 1,340
UK01 271 118 44% 15,598,094 1,409,918 1,328,754 7,373,510 3,443,177 2,076,450 132,187 8,827 3,021 6,931 954 813 3,325 1,839 149 - 600
TOTAL 5912 3156 53% 264,116,357 26,564,741 6,796,927 134,983,658 55,210,100 42,254,150 83,687.06 11,323 2,572 126,004 18,943 4,383 66,470 36,208 1,424 - 18,094
per Project
(EUR)
per Staff
(EUR)
per Learner
(EUR)
Total
PARTICIPANTS ORGANISA
TIONS National
Agency
PROJECTS
Submitted Contracted
GRANT AMOUNT AVERAGE GRANT
Success
Rate
Total
(in EUR)
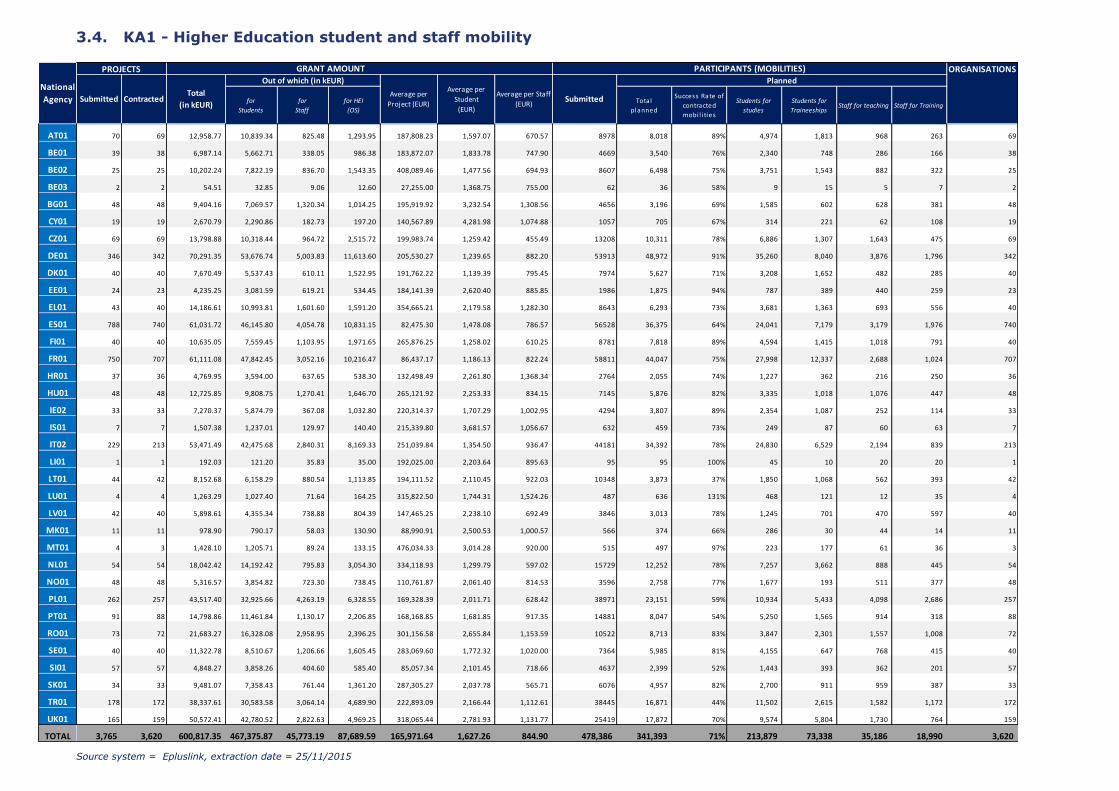
KA1 - Higher Education student and staff mobility 3.4.
Source system = Epluslink, extraction date = 25/11/2015
for
Students
for
Staff
for HEI
(OS)
Tota l
planned
Success Rate of
contracted
mobi l i ties
Students for
studies
Students for
TraineeshipsStaff for teaching Staff for Training
AT01 70 69 12,958.77 10,839.34 825.48 1,293.95 187,808.23 1,597.07 670.57 8978 8,018 89% 4,974 1,813 968 263 69
BE01 39 38 6,987.14 5,662.71 338.05 986.38 183,872.07 1,833.78 747.90 4669 3,540 76% 2,340 748 286 166 38
BE02 25 25 10,202.24 7,822.19 836.70 1,543.35 408,089.46 1,477.56 694.93 8607 6,498 75% 3,751 1,543 882 322 25
BE03 2 2 54.51 32.85 9.06 12.60 27,255.00 1,368.75 755.00 62 36 58% 9 15 5 7 2
BG01 48 48 9,404.16 7,069.57 1,320.34 1,014.25 195,919.92 3,232.54 1,308.56 4656 3,196 69% 1,585 602 628 381 48
CY01 19 19 2,670.79 2,290.86 182.73 197.20 140,567.89 4,281.98 1,074.88 1057 705 67% 314 221 62 108 19
CZ01 69 69 13,798.88 10,318.44 964.72 2,515.72 199,983.74 1,259.42 455.49 13208 10,311 78% 6,886 1,307 1,643 475 69
DE01 346 342 70,291.35 53,676.74 5,003.83 11,613.60 205,530.27 1,239.65 882.20 53913 48,972 91% 35,260 8,040 3,876 1,796 342
DK01 40 40 7,670.49 5,537.43 610.11 1,522.95 191,762.22 1,139.39 795.45 7974 5,627 71% 3,208 1,652 482 285 40
EE01 24 23 4,235.25 3,081.59 619.21 534.45 184,141.39 2,620.40 885.85 1986 1,875 94% 787 389 440 259 23
EL01 43 40 14,186.61 10,993.81 1,601.60 1,591.20 354,665.21 2,179.58 1,282.30 8643 6,293 73% 3,681 1,363 693 556 40
ES01 788 740 61,031.72 46,145.80 4,054.78 10,831.15 82,475.30 1,478.08 786.57 56528 36,375 64% 24,041 7,179 3,179 1,976 740
FI01 40 40 10,635.05 7,559.45 1,103.95 1,971.65 265,876.25 1,258.02 610.25 8781 7,818 89% 4,594 1,415 1,018 791 40
FR01 750 707 61,111.08 47,842.45 3,052.16 10,216.47 86,437.17 1,186.13 822.24 58811 44,047 75% 27,998 12,337 2,688 1,024 707
HR01 37 36 4,769.95 3,594.00 637.65 538.30 132,498.49 2,261.80 1,368.34 2764 2,055 74% 1,227 362 216 250 36
HU01 48 48 12,725.85 9,808.75 1,270.41 1,646.70 265,121.92 2,253.33 834.15 7145 5,876 82% 3,335 1,018 1,076 447 48
IE02 33 33 7,270.37 5,874.79 367.08 1,032.80 220,314.37 1,707.29 1,002.95 4294 3,807 89% 2,354 1,087 252 114 33
IS01 7 7 1,507.38 1,237.01 129.97 140.40 215,339.80 3,681.57 1,056.67 632 459 73% 249 87 60 63 7
IT02 229 213 53,471.49 42,475.68 2,840.31 8,169.33 251,039.84 1,354.50 936.47 44181 34,392 78% 24,830 6,529 2,194 839 213
LI01 1 1 192.03 121.20 35.83 35.00 192,025.00 2,203.64 895.63 95 95 100% 45 10 20 20 1
LT01 44 42 8,152.68 6,158.29 880.54 1,113.85 194,111.52 2,110.45 922.03 10348 3,873 37% 1,850 1,068 562 393 42
LU01 4 4 1,263.29 1,027.40 71.64 164.25 315,822.50 1,744.31 1,524.26 487 636 131% 468 121 12 35 4
LV01 42 40 5,898.61 4,355.34 738.88 804.39 147,465.25 2,238.10 692.49 3846 3,013 78% 1,245 701 470 597 40
MK01 11 11 978.90 790.17 58.03 130.90 88,990.91 2,500.53 1,000.57 566 374 66% 286 30 44 14 11
MT01 4 3 1,428.10 1,205.71 89.24 133.15 476,034.33 3,014.28 920.00 515 497 97% 223 177 61 36 3
NL01 54 54 18,042.42 14,192.42 795.83 3,054.30 334,118.93 1,299.79 597.02 15729 12,252 78% 7,257 3,662 888 445 54
NO01 48 48 5,316.57 3,854.82 723.30 738.45 110,761.87 2,061.40 814.53 3596 2,758 77% 1,677 193 511 377 48
PL01 262 257 43,517.40 32,925.66 4,263.19 6,328.55 169,328.39 2,011.71 628.42 38971 23,151 59% 10,934 5,433 4,098 2,686 257
PT01 91 88 14,798.86 11,461.84 1,130.17 2,206.85 168,168.85 1,681.85 917.35 14881 8,047 54% 5,250 1,565 914 318 88
RO01 73 72 21,683.27 16,328.08 2,958.95 2,396.25 301,156.58 2,655.84 1,153.59 10522 8,713 83% 3,847 2,301 1,557 1,008 72
SE01 40 40 11,322.78 8,510.67 1,206.66 1,605.45 283,069.60 1,772.32 1,020.00 7364 5,985 81% 4,155 647 768 415 40
SI01 57 57 4,848.27 3,858.26 404.60 585.40 85,057.34 2,101.45 718.66 4637 2,399 52% 1,443 393 362 201 57
SK01 34 33 9,481.07 7,358.43 761.44 1,361.20 287,305.27 2,037.78 565.71 6076 4,957 82% 2,700 911 959 387 33
TR01 178 172 38,337.61 30,583.58 3,064.14 4,689.90 222,893.09 2,166.44 1,112.61 38445 16,871 44% 11,502 2,615 1,582 1,172 172
UK01 165 159 50,572.41 42,780.52 2,822.63 4,969.25 318,065.44 2,781.93 1,131.77 25419 17,872 70% 9,574 5,804 1,730 764 159
TOTAL 3,765 3,620 600,817.35 467,375.87 45,773.19 87,689.59 165,971.64 1,627.26 844.90 478,386 341,393 71% 213,879 73,338 35,186 18,990 3,620
Out of which (in kEUR)
Average per
Project (EUR)
Average per
Student
(EUR)
Average per Staff
(EUR)Submitted
Planned
ORGANISATIONS
National
Agency
PROJECTS GRANT AMOUNT PARTICIPANTS (MOBILITIES)
Submitted ContractedTotal
(in kEUR)

KA1 - Adult Education staff mobility 3.5.
Source system = Epluslink, extraction date = 25/11/2015
Out of which (in kEUR)
Staff Training
Training/
Teaching
Assignments
Other
CostsStaff Training
Training/
Teaching
Assignments
Total with special
needsStaff Training
Training/
Teaching
Assignments
AT01 32 20 63% 160.86 102.23 19.27 39.55 8,043.20 1,423.58 113 92 21 - - - 47
BE01 18 6 33% 84.82 69.77 - 15.05 14,136.67 1,972.56 43 43 - 1 1 - 11
BE02 33 15 45% 150.33 102.98 9.90 37.45 10,021.67 1,404.91 107 96 11 - - - 32
BE03 4 3 75% 23.52 17.57 - 5.95 7,839.67 1,383.47 17 17 - - - - 3
BG01 73 2 3% 72.13 61.98 - 10.15 36,065.00 2,487.24 29 29 - - - - 4
CY01 11 6 55% 37.51 30.51 - 7.00 6,251.50 1,875.45 20 20 - - - - 12
CZ01 90 8 9% 151.34 88.69 29.75 32.90 18,917.88 1,610.03 94 65 29 1 1 - 13
DE02 90 41 46% 1,913.52 1,470.68 59.94 382.90 46,671.22 1,739.56 1,100 1,043 57 13 13 - 83
DK01 22 13 59% 284.36 204.32 23.35 56.70 21,874.08 1,744.56 163 145 18 - - - 25
EE01 18 11 61% 115.83 90.98 - 24.85 10,529.55 1,631.34 71 71 - - - - 25
EL01 63 10 16% 156.61 128.00 1.67 26.95 15,660.80 2,033.87 77 75 2 - - - 18
ES01 198 25 13% 574.69 378.05 102.14 95.55 22,987.60 2,097.41 274 197 77 1 1 - 57
FI01 45 20 44% 297.89 216.73 11.86 69.30 14,894.25 1,504.47 198 186 12 - - - 26
FR01 56 14 25% 709.60 562.06 7.34 140.20 50,685.37 1,730.72 410 403 7 14 14 - 31
HR01 22 10 45% 139.81 107.22 3.07 31.50 13,981.20 1,553.47 90 88 2 - - - 22
HU01 60 15 25% 210.51 166.48 8.43 42.70 14,034.20 1,725.52 122 110 12 - - - 41
IE01 21 7 33% 172.57 138.62 - 33.95 24,653.43 1,779.11 97 97 - - - - 12
IS01 10 6 60% 52.41 40.16 - 12.25 8,734.17 1,497.29 35 35 - - - - 10
IT02 175 24 14% 659.84 513.63 30.13 116.20 27,493.21 1,957.97 337 312 25 11 11 - 51
LI01 3 2 67% 24.16 20.66 - 3.50 12,080.00 2,416.00 10 10 - - - - 2
LT01 50 7 14% 133.64 105.64 - 28.00 19,090.86 1,670.45 80 80 - - - - 9
LU01 3 1 33% 18.46 11.81 - 6.65 18,460.00 971.58 19 19 - - - - 3
LV01 73 15 21% 83.27 63.58 6.74 12.95 5,551.27 2,250.51 37 36 1 - - - 50
MK01 10 1 10% 5.31 4.61 - 0.70 5,310.00 2,655.00 2 2 - - - - 2
MT01 18 4 22% 39.02 32.72 - 6.30 9,754.75 2,167.72 18 18 - - - - 8
NL01 31 12 39% 236.97 176.63 13.46 46.90 19,747.50 1,692.64 140 123 17 8 7 1 28
NO01 7 6 86% 84.01 57.51 7.25 19.25 14,000.83 1,448.36 58 51 7 6 4 2 13
PL01 114 43 38% 916.61 710.87 14.23 192.15 21,316.58 1,669.60 549 523 26 - - - 86
PT01 43 6 14% 235.43 186.10 1.38 47.95 39,238.67 1,718.48 137 135 2 - - - 10
RO01 156 15 10% 268.27 219.27 - 49.00 17,884.67 1,916.21 140 140 - - - - 38
SE01 23 9 39% 171.09 130.14 - 40.95 19,010.33 1,462.33 117 117 - - - - 16
SI01 37 16 43% 182.91 139.03 6.87 37.45 11,431.81 1,709.43 107 102 5 - - - 41
SK01 24 6 25% 151.94 124.86 2.23 24.85 25,323.33 2,140.00 71 69 2 - - - 11
TR01 605 15 2% 780.85 629.94 - 151.90 52,056.53 1,799.19 434 434 - - - - 71
UK01 58 10 17% 617.86 508.75 15.76 93.35 61,785.70 2,230.53 277 269 8 19 19 - 50
TOTAL 2,296 424 18.5% 9,917.93 7,612.75 374.75 1,942.95 23,391.34 1,773.28 5,593 5,252 341 74 71 3 961
PARTICIPANTS
Submitted GrantedSucess
Rate
Total
(k EUR)
Average Grant
per Project
(EUR)
Average Grant
per
Participant
(EUR)
Total
National
Agency
ORGANISATIONS
Details by Activity Details for Participants with Special Needs
PROJECTS GRANT AMOUNT

,
KA1 -Youth Mobility 3.6.
Source system = Epluslink, extraction date = 25/11/2015
FUNDING
by Activity Type (in kEUR) by Activity Type Out of which
EVS Youth exchanges Youth workers other EVSYouth
exchanges
Youth
workers
With special
needs
with fewer
opportunitiesEVS
Youth
exchanges
Youth
workers
AT02 137 120 88% 2,243.62 1,049.28 803.94 420.87 11.55 552.68 18,696.86 787.51 193 99 69 25 46 2,849 181 835 190 2,015 644 903 621
BE03 6 5 83% 42.60 31.95 - 10.50 0.15 4.48 8,520.86 1253.07 5 4 - 1 1 34 - 1 4 - 30 1 10
BE04 101 63 62% 1,301.47 431.20 494.94 375.03 0.30 488.32 20,658.25 808.87 99 38 36 25 35 1,609 50 478 58 974 577 725 385
BE05 131 109 83% 1,985.35 755.39 592.05 670.29 6.90 544.90 18,214.20 766.25 132 49 42 41 38 2,591 21 445 132 1,386 1,073 769 559
BG01 376 139 37% 3,053.41 990.13 1,181.57 868.88 17.70 823.89 21,967.01 705.18 154 46 67 41 43 4,330 94 1,246 306 2,682 1,342 1,262 783
CY02 155 73 47% 1,673.48 475.92 533.69 655.51 8.40 440.57 22,924.34 718.85 91 20 36 35 23 2,328 167 712 116 1,243 969 603 481
CZ01 287 156 54% 2,852.76 1,163.56 873.31 808.87 21.15 576.08 18,286.94 762.97 245 103 79 63 60 3,739 109 935 155 2,249 1,335 959 739
DE04 801 584 73% 14,350.34 4,725.66 6,552.00 3,128.78 14.25 5,859.14 24,572.51 764.01 861 287 372 202 355 18,783 692 4,703 506 13,284 4,993 7,995 2,948
DK01 93 69 74% 2,130.23 851.63 769.77 508.82 1.50 642.58 30,872.87 903.40 104 39 40 25 36 2,358 114 549 93 1,541 724 1,078 451
EE01 153 104 68% 1,998.36 649.28 772.64 568.30 12.30 518.59 19,214.97 764.19 134 35 71 28 33 2,615 47 726 94 1,685 836 727 587
EL02 210 62 30% 1,584.28 544.69 456.92 575.24 7.50 487.70 25,552.90 944.71 78 28 25 25 21 1,677 22 433 74 858 745 608 399
ES02 803 475 59% 8,874.80 3,780.60 3,410.87 1,636.40 76.05 2,706.32 18,683.79 885.36 562 265 206 91 172 10,024 242 2,981 586 7,178 2,260 3,248 2,191
FI01 144 105 73% 2,499.20 1,089.80 1,073.95 318.94 17.25 733.63 23,801.92 922.21 144 65 55 24 38 2,710 57 1,016 187 2,034 489 766 449
FR02 703 492 70% 9,620.44 4,938.97 2,956.96 1,713.79 31.65 2,829.16 19,553.75 1057.19 737 432 207 98 250 9,100 408 3,190 1,075 5,748 2,277 2,353 2,084
HR01 271 124 46% 2,143.43 591.31 1,016.14 532.08 9.90 469.85 17,285.72 634.34 141 32 78 31 28 3,379 41 1,296 139 2,456 784 733 622
HU02 353 159 45% 3,449.94 1,345.79 1,406.75 675.30 25.35 836.56 21,697.71 798.23 181 61 85 35 45 4,322 191 1,790 194 3,104 1,024 1,076 868
IE01 79 66 84% 1,509.06 974.20 318.75 215.06 4.50 526.78 22,864.54 1398.57 78 49 17 12 31 1,079 43 441 150 628 301 482 269
IS02 38 35 92% 870.29 265.84 344.55 253.30 6.60 198.79 24,865.46 747.67 46 10 20 16 14 1,164 45 86 46 701 417 311 163
IT03 1,108 462 42% 9,982.69 3,304.97 3,350.88 3,310.29 20.10 4,330.21 21,607.55 802.14 557 157 226 174 236 12,445 251 3,235 464 7,252 4,729 5,228 2,934
LI02 6 6 100% 40.05 28.40 11.20 - 0.45 8.35 6,675.00 1381.03 7 5 2 - 2 29 - 8 5 24 - 5 13
LT02 268 116 43% 2,507.26 957.59 1,113.78 413.84 20.25 607.98 21,614.33 751.13 183 64 95 24 42 3,338 95 940 154 2,587 597 753 662
LU02 52 46 88% 779.58 408.39 325.13 39.31 6.75 191.52 16,947.33 773.39 54 29 22 3 14 1,008 6 276 47 873 88 349 164
LV02 210 93 44% 1,729.23 712.65 483.50 518.98 14.10 522.61 18,593.89 906.31 127 49 51 27 38 1,908 33 497 104 1,101 703 589 470
MK01 123 17 14% 256.13 118.25 101.86 34.97 1.05 93.26 15,066.24 707.53 19 9 8 2 8 362 24 143 20 275 67 142 85
MT01 113 47 42% 1,400.71 720.68 384.56 290.97 4.50 220.47 29,802.24 960.70 61 18 28 15 15 1,458 52 319 96 922 440 413 243
NL02 219 103 47% 2,880.05 1,373.48 799.38 696.57 14.85 992.05 27,961.61 954.29 135 45 50 40 42 3,018 109 947 238 1,657 1,123 933 641
NO02 79 70 89% 1,710.59 945.65 468.96 285.52 15.00 721.78 24,437.06 1257.79 83 42 29 12 28 1,360 81 328 117 909 334 614 299
PL01 907 417 46% 8,669.19 4,055.58 2,940.78 1,604.41 80.85 2,210.31 20,789.43 814.93 585 239 251 95 159 10,638 294 2,674 740 7,400 2,498 2,049 2,101
PT02 335 142 42% 3,399.59 1,364.39 1,125.94 889.63 24.00 1,066.39 23,940.79 967.72 196 62 85 49 51 3,513 84 1,528 199 2,209 1,105 1,031 794
RO01 814 234 29% 5,607.70 2,473.70 1,914.28 1,174.72 57.60 1,004.06 23,964.53 768.81 283 70 147 66 47 7,294 175 2,226 480 4,965 1,849 1,179 1,295
SE02 130 86 66% 2,090.05 811.74 891.30 372.52 15.60 793.12 24,302.90 871.94 115 40 53 22 43 2,397 105 955 130 1,769 498 973 436
SI02 214 134 63% 1,999.57 750.73 808.99 431.73 12.00 408.62 14,922.19 685.96 159 53 65 41 30 2,915 82 826 184 2,079 652 495 585
SK02 197 126 64% 2,207.29 1,050.18 613.70 532.31 19.05 554.21 17,518.17 865.60 147 63 49 35 43 2,550 77 833 169 1,562 819 648 580
TR01 1,566 461 29% 9,219.00 3,737.62 3,877.34 1,552.45 52.95 1,795.97 19,997.82 740.24 560 217 257 86 121 12,454 221 5,055 1,270 8,664 2,520 2,687 2,515
UK01 434 249 57% 9,033.33 2,281.84 3,038.45 3,705.09 7.95 3,712.04 36,278.44 901.80 356 68 133 155 138 10,017 443 4,476 306 5,329 4,382 4,062 1,425
Subtotal 11,616 5,749 49% 125,695.07 49,751.03 45,808.80 29,789.28 640.05 38,472.96 21,863.82 830.25 7,612 2,892 3,056 1,664 2,326 151,395 4,656 47,129 8,828 99,343 43,224 46,749 29,851
EACEA 10 5 50% 350,327.92 350,327.92 70,065.58 196 196
TOTAL 11,626 5,754 49% 476,022.99 400,078.95 151,591 9,024
National
Agency Average per
Participant
(EUR)
Totalin Activities
with Partner
Countries
PROJECTS ACTIVITIES PARTICIPANTS ORGANISATIONS
Submitted ContractedSucess
Rate
Total contracted
(in kEUR)
for Activi ties
with Partner
Countries
Average per
Project
(EUR)
with Partner
CountriesTotal
by Activity Type

KA1 - Participants by Country (Preliminary results) 3.7.
Remark: The table below presents preliminary statistics on the realised mobilities while previous KA1 tables present data on
planned mobilities. Final results will be known once all mobilities will be finalised. The sample used to produce the statistics
represents around 80% of all 2014 mobilities.
Source System = Mobility Tool, Extraction date = 24/11/2015
School
Education
Vocational
Education and
Training
Higher
Education
Adult
EducationYouth TOTAL %
AT Austria 285 2,594 7,808 64 1,216 11,967 2.3%
BE Belgium 270 1,078 9,421 116 1,874 12,759 2.5%
BG Bulgaria 170 1,548 3,234 11 4,468 9,431 1.8%
CY Cyprus 74 379 671 11 1,151 2,286 0.4%
CZ Czech Republic 405 2,868 10,427 78 3,024 16,802 3.3%
DE Germany 1,297 12,117 40,519 617 5,412 59,962 11.6%
DK Denmark 120 1,316 4,378 53 1,048 6,915 1.3%
EE Estonia 122 554 1,738 43 2,360 4,817 0.9%
EL Greece 489 2,550 5,363 48 2,876 11,326 2.2%
ES Spain 1,012 3,019 36,137 134 7,359 47,661 9.3%
FI Finland 489 1,655 5,990 81 1,416 9,631 1.9%
FR France 752 9,518 38,080 309 4,560 53,219 10.3%
HR Croatia 173 1,025 2,159 52 3,002 6,411 1.2%
HU Hungary 303 2,304 5,577 82 3,154 11,420 2.2%
IE Ireland 77 484 3,210 22 921 4,714 0.9%
IS Iceland 127 87 469 21 394 1,098 0.2%
IT Italy 1,202 3,854 24,172 181 8,452 37,861 7.3%
LI Liechtenstein 23 16 71 10 19 139 0.0%
LT Lithuania 234 1,925 5,815 69 3,178 11,221 2.2%
LU Luxembourg 24 69 558 17 318 986 0.2%
LV Latvia 159 710 2,924 28 2,535 6,356 1.2%
MK Former Yugoslav Republic of Macedonia 32 191 140 2 1,687 2,052 0.4%
MT Malta 63 162 416 17 882 1,540 0.3%
NL Netherlands 235 4,876 12,996 79 1,287 19,473 3.8%
NO Norway 17 870 1,896 15 531 3,329 0.6%
PL Poland 2,214 10,698 21,953 338 6,934 42,137 8.2%
PT Portugal 499 1,433 8,332 48 3,316 13,628 2.6%
RO Romania 700 3,210 9,281 143 8,367 21,701 4.2%
SE Sweden 442 1,052 5,128 45 1,232 7,899 1.5%
SI Slovenia 145 841 2,449 75 1,617 5,127 1.0%
SK Slovakia 289 2,013 4,845 27 2,549 9,723 1.9%
TR Turkey 1,083 7,396 11,910 351 6,789 27,529 5.3%
UK United Kingdom 271 2,855 17,198 170 3,123 23,617 4.6%
Total Programme Countries 13,797 85,267 305,265 3,357 97,051 504,737 98%
Region 1 Western Balkans - - - - 2,374 2,374 0.5%
Region 2 Eastern Partnership Countries - - - - 6,150 6,150 1.2%
Region 3 South Mediterranean Countries - - - - 1,263 1,263 0.2%
Region 4 Russian Federation - - - - 654 654 0.1%
Total Partner Countries - - - - 10,441 10,441 2%
Grand Total 13,797 85,267 305,265 3,357 107,492 515,178 100%
Sending Country
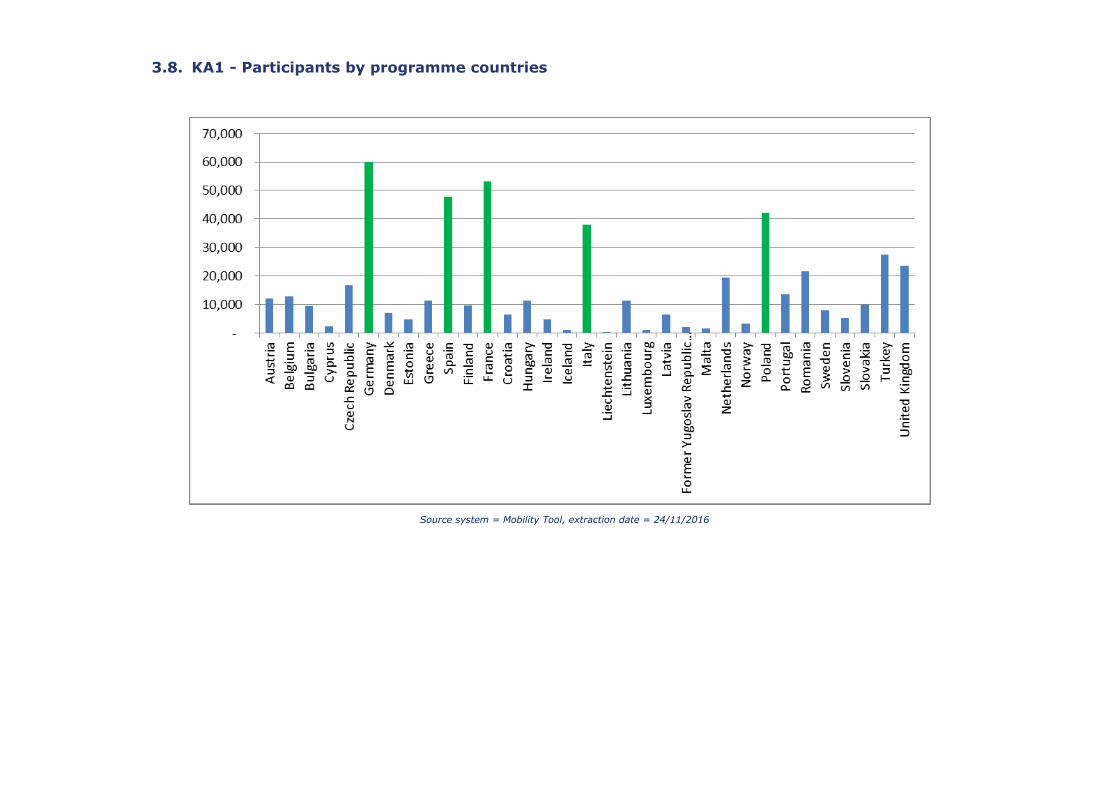
KA1 - Participants by programme countries 3.8.
Source system = Mobility Tool, extraction date = 24/11/2016

KA2 – Cooperation for Innovation and the exchange of good practices 4.
KA2 - Overview for Strategic Partnerships 4.1.
Source system = EplusLink, Extraction date = 25/11/2015
with
IO
with short
term LTTs
with long
term LTTsIO ME
Short term
LTTs
Long term
LTTs
Strategic Partnerships for School Education 1057 206 93% 66% 3% 19.49% 46,127,907.93 1869 802 497 557 13 1,265 6.14 13,563
Strategic Partnerships for Schools Only 2998 522 39% 85% 7% 17.41% 78,272,386.60 4724 867 309 3415 133 2,566 4.92 93,351
Strategic Partnerships for Adult Education 1317 215 94% 53% 3% 16.32% 45,764,441.97 1854 927 538 382 7 1,289 6.00 8,238
Strategic Partnerships for Higher Education 917 154 100% 69% 3% 16.79% 42,016,082.21 1791 931 376 474 10 1,046 6.79 17,130
Strategic Partnerships for Vocational Education and Training 1657 377 95% 48% 3% 22.75% 96,034,874.16 3504 1920 1041 525 18 2,492 6.61 9,575
Strategic Partnerships for Youth 1730 258 82% 52% 4% 14.91% 30,033,151.51 1511 726 427 336 22 1,165 4.52 16,948
Transnational Cooperation Activities for Youth 6,938,693.49 12,957
Transnational Cooperation Activities for other Sectors 774,281.11 919
TOTAL 9676 1732 76% 65% 4% 17.90% 345,961,818.98 15,253 6,173 3,188 5,689 203 9,823 5.67 172,681
PARTICIPANTS
Granted
% GrantedKEY ACTION 2
PROJECTS ORGANISATIONS
SubmittedSucces
Rate
ACTIVITIES
Total
Number
by typeAverage per
Project
GRANT
AMOUNT
(in EUR)Number

KA2 - Strategic Partnerships by National Agency and by Sector 4.2.
Source system = EplusLink, Extraction date = 25/11/2015
Projects
Submitted
Projects
Granted
Succes
Rate
Granted Amount
(EUR)
Projects
Submitted
Projects
Granted
Succes
Rate
Granted Amount
(EUR)
Projects
Submitted
Projects
Granted
Succes
Rate
Granted Amount
(EUR)
Projects
Submitted
Projects
Granted
Succes
Rate
Granted Amount
(EUR)
Projects
Submitted
Projects
Granted
Succes
Rate
Granted Amount
(EUR)
Projects
Submitted
Projects
Granted
Succes
Rate
Granted Amount
(EUR)
AT01 50 17 34% 2,986,038 16 4 25% 1,034,740 29 6 21% 1,197,714 35 11 31% 2,467,466 0 0 0% - 130 38 29% 7,685,958
AT02 0 0 0% - 0 0 0% - 0 0 0% - 0 0 0% - 36 11 31% 948,525 36 11 31% 948,525
BE01 38 8 21% 1,144,964 7 1 14% 347,676 12 2 17% 526,985 17 3 18% 804,121 0 0 0% - 74 14 19% 2,823,746
BE02 69 11 16% 2,765,099 15 1 7% 447,190 14 4 29% 767,387 17 6 35% 1,541,964 0 0 0% - 115 22 19% 5,521,640
BE03 1 1 100% 140,900 1 0 0% - 0 0 0% - 0 0 0% - 1 1 100% 17,750 3 2 67% 158,650
BE04 0 0 0% - 0 0 0% - 0 0 0% - 1 0 0% - 7 1 14% 199,980 8 1 13% 199,980
BE05 0 0 0% - 0 0 0% - 0 0 0% - 0 0 0% - 22 10 45% 450,292 22 10 45% 450,292
BG01 87 11 13% 1,927,318 21 2 10% 637,065 30 3 10% 837,783 28 5 18% 1,448,226 70 6 9% 610,420 236 27 11% 5,460,812
CY01 26 4 15% 759,898 2 1 50% 253,289 12 1 8% 316,962 13 3 23% 819,864 0 0 0% - 53 9 17% 2,150,013
CY02 1 0 0% - 0 0 0% - 0 0 0% - 0 0 0% - 23 5 22% 470,969 24 5 21% 470,969
CZ01 116 24 21% 2,555,714 21 4 19% 856,142 52 5 10% 1,073,950 55 9 16% 2,260,809 85 10 12% 1,064,761 329 52 16% 7,811,376
DE01 0 0 0% - 57 13 23% 4,353,786 0 0 0% - 0 0 0% - 0 0 0% - 57 13 23% 4,353,786
DE02 0 0 0% - 0 0 0% - 127 24 19% 5,524,879 138 42 30% 11,331,035 0 0 0% - 265 66 25% 16,855,914
DE03 391 87 22% 15,390,703 0 0 0% - 0 0 0% - 0 0 0% - 0 0 0% - 391 87 22% 15,390,703
DE04 0 0 0% - 1 0 0% - 1 0 0% - 0 0 0% - 102 18 18% 2,837,189 104 18 17% 2,837,189
DK01 32 7 22% 1,415,242 8 2 25% 820,207 10 2 20% 392,862 16 5 31% 1,236,087 10 6 60% 716,632 76 22 29% 4,581,030
EE01 27 7 26% 951,577 13 1 8% 414,295 8 4 50% 412,822 12 3 25% 612,525 19 8 42% 339,256 79 23 29% 2,730,475
EL01 93 22 24% 3,154,970 27 5 19% 923,169 44 5 11% 1,212,673 53 10 19% 3,068,467 0 0 0% - 217 42 19% 8,359,279
EL02 0 0 0% - 0 0 0% - 0 0 0% - 0 0 0% - 48 2 4% 134,002 48 2 4% 134,002
ES01 398 91 23% 10,487,629 105 13 12% 3,003,238 96 21 22% 3,710,451 190 33 17% 6,928,909 0 0 0% - 789 158 20% 24,130,227
ES02 14 0 0% - 0 0 0% - 0 0 0% - 0 0 0% - 143 17 12% 1,239,179 157 17 11% 1,239,179
FI01 57 14 25% 1,648,557 29 2 7% 599,197 12 4 33% 658,418 26 10 38% 1,952,546 11 4 36% 426,615 135 34 25% 5,285,333
FR01 216 56 26% 12,288,794 64 10 16% 3,138,453 81 17 21% 4,193,205 91 30 33% 8,562,485 0 0 0% - 452 113 25% 28,182,936
FR02 1 0 0% - 0 0 0% - 0 0 0% - 0 0 0% - 52 15 29% 2,886,656 53 15 28% 2,886,656
HR01 45 7 16% 1,013,549 11 2 18% 452,650 14 2 14% 420,384 20 3 15% 816,770 18 3 17% 440,714 108 17 16% 3,144,067
HU01 30 5 17% 1,332,555 15 2 13% 611,139 36 3 8% 598,541 34 8 24% 1,838,029 0 0 0% - 115 18 16% 4,380,264
HU02 0 0 0% - 0 0 0% - 0 0 0% - 0 0 0% - 46 4 9% 557,258 46 4 9% 557,258
IE01 17 6 35% 1,141,393 0 0 0% - 10 7 70% 1,324,554 13 7 54% 1,987,218 18 9 50% 656,172 58 29 50% 5,109,337
IE02 0 0 0% - 7 2 29% 451,784 0 0 0% - 0 0 0% - 0 0 0% - 7 2 29% 451,784
IS01 10 5 50% 493,470 6 3 50% 687,631 4 3 75% 566,376 3 3 100% 594,570 0 0 0% - 23 14 61% 2,342,047
IS02 0 0 0% - 0 0 0% - 0 0 0% - 0 0 0% - 6 4 67% 323,496 6 4 67% 323,496
IT01 1 0 0% - 0 0 0% - 0 0 0% - 234 24 10% 8,415,828 0 0 0% - 235 24 10% 8,415,828
IT02 397 61 15% 11,934,703 89 9 10% 3,367,288 164 15 9% 3,939,599 0 0 0% - 0 0 0% - 650 85 13% 19,241,590
IT03 0 0 0% - 0 0 0% - 0 0 0% - 0 0 0% - 315 9 3% 2,053,841 315 9 3% 2,053,841
LI01 3 3 100% 591,845 3 3 100% 891,965 2 2 100% 289,054 1 1 100% 179,233 0 0 0% - 9 9 100% 1,952,097
LI02 0 0 0% - 0 0 0% - 0 0 0% - 0 0 0% - 2 2 100% 321,688 2 2 100% 321,688
LT01 41 16 39% 1,880,847 14 3 21% 662,122 21 5 24% 591,219 26 8 31% 1,277,715 0 0 0% - 102 32 31% 4,411,903
LT02 0 0 0% - 0 0 0% - 0 0 0% - 0 0 0% - 35 3 9% 368,752 35 3 9% 368,752
LU01 3 3 100% 393,300 2 2 100% 398,215 6 2 33% 331,528 2 2 100% 412,476 0 0 0% - 13 9 69% 1,535,519
LU02 0 0 0% - 0 0 0% - 0 0 0% - 0 0 0% - 8 7 88% 205,855 8 7 88% 205,855
LV01 37 10 27% 1,401,079 16 2 13% 380,770 21 3 14% 483,618 6 4 67% 1,047,645 0 0 0% - 80 19 24% 3,313,112
LV02 0 0 0% - 0 0 0% - 0 0 0% - 0 0 0% - 27 3 11% 219,341 27 3 11% 219,341
MK01 4 0 0% - 8 1 13% 255,255 3 1 33% 84,565 9 2 22% 283,806 9 1 11% 45,000 33 5 15% 668,626
MT01 6 3 50% 546,089 5 1 20% 354,370 6 1 17% 413,000 13 1 8% 449,194 11 1 9% 149,050 41 7 17% 1,911,703
NL01 133 15 11% 3,919,311 50 7 14% 2,216,636 21 5 24% 1,321,641 44 15 34% 4,042,587 0 0 0% - 248 42 17% 11,500,175
NL02 0 0 0% - 0 0 0% - 0 0 0% - 0 0 0% - 28 7 25% 877,668 28 7 25% 877,668
NO01 35 9 26% 1,476,493 17 5 29% 1,588,345 5 2 40% 559,184 13 6 46% 1,059,192 0 0 0% - 70 22 31% 4,683,214
NO02 0 0 0% - 0 0 0% - 0 0 0% - 0 0 0% - 15 7 47% 982,326 15 7 47% 982,326
PL01 260 46 18% 9,228,836 47 12 26% 2,865,399 64 18 28% 2,672,392 93 25 27% 6,976,812 153 22 14% 1,847,289 617 123 20% 23,590,728
PT01 86 15 17% 3,034,724 45 3 7% 892,780 37 4 11% 1,115,884 55 10 18% 2,349,524 0 0 0% - 223 32 14% 7,392,912
PT02 0 0 0% - 1 0 0% - 0 0 0% - 0 0 0% - 73 7 10% 523,515 74 7 9% 523,515
RO01 158 30 19% 4,509,844 33 7 21% 1,175,184 61 8 13% 1,536,717 42 16 38% 3,260,878 71 6 8% 895,674 365 67 18% 11,378,297
SE01 56 17 30% 2,577,910 8 5 63% 1,103,190 13 4 31% 986,110 17 8 47% 1,829,770 0 0 0% - 94 34 36% 6,496,980
SE02 0 0 0% - 0 0 0% - 0 0 0% - 0 0 0% - 18 11 61% 1,149,546 18 11 61% 1,149,546
SI01 57 6 11% 1,083,087 27 3 11% 641,017 39 2 5% 383,314 43 5 12% 1,251,032 0 0 0% - 166 16 10% 3,358,450
SI02 0 0 0% - 0 0 0% - 0 0 0% - 0 0 0% - 25 5 20% 294,005 25 5 20% 294,005
SK01 32 9 28% 1,250,405 15 3 20% 722,985 18 4 22% 745,020 10 4 40% 886,638 0 0 0% - 75 20 27% 3,605,048
SK02 0 0 0% - 0 0 0% - 0 0 0% - 0 0 0% - 21 5 24% 809,353 21 5 24% 809,353
TR01 821 50 6% 7,959,413 59 8 14% 1,774,772 170 12 7% 2,572,787 203 25 12% 5,670,247 114 8 7% 1,630,807 1367 103 8% 19,608,025
UK01 206 52 25% 11,014,039 52 12 23% 3,694,138 74 14 19% 4,002,865 84 30 36% 8,371,207 88 20 23% 3,339,577 504 128 25% 30,421,826
TOTAL 4055 728 18% 124,400,295 917 154 17% 42,016,082 1317 215 16% 45,764,442 1657 377 23% 96,034,874 1730 258 15% 30,033,152 9676 1732 18% 338,248,844
School Education Adult Education VET YouthKA2 *
Higher Education TOTAL

KA3 – Support to Policy Reform 5.
KA3 - Overview table 5.1.
Source systems = Pegasus (Extraction date = 13/11/2015) and Epluslink (Extraction date = 25/11/2015)
Submitted GrantedSuccess
rate
Prospective Initiatives - Policy Experimentation 22 8 36% 13,195,319 1,649,415 127
Dialogue between young people and policy makers 668 211 32% 6,472,412 691 168,762
Civil Society Cooperation: Education and Training 34 20 59% 2,051,076 102,554 20
Civil Society Cooperation: Youth 90 79 88% 3,691,394 46,727 79
National Authorities for Apprenticeships 21 10 48% 2,168,624 216,862 47
Restricted calls implemented by EACEA 294 286 97% 18,020,061 63,007.21 261
Other 37,259,764
Total 1107 606 82,858,650 3,439,433
KEY ACTION 3PROJECTS
ORGANISATIONS PARTICIPANTSGRANT
AMOUNT (EUR)
AVERAGE PER
PROJECT (EUR)
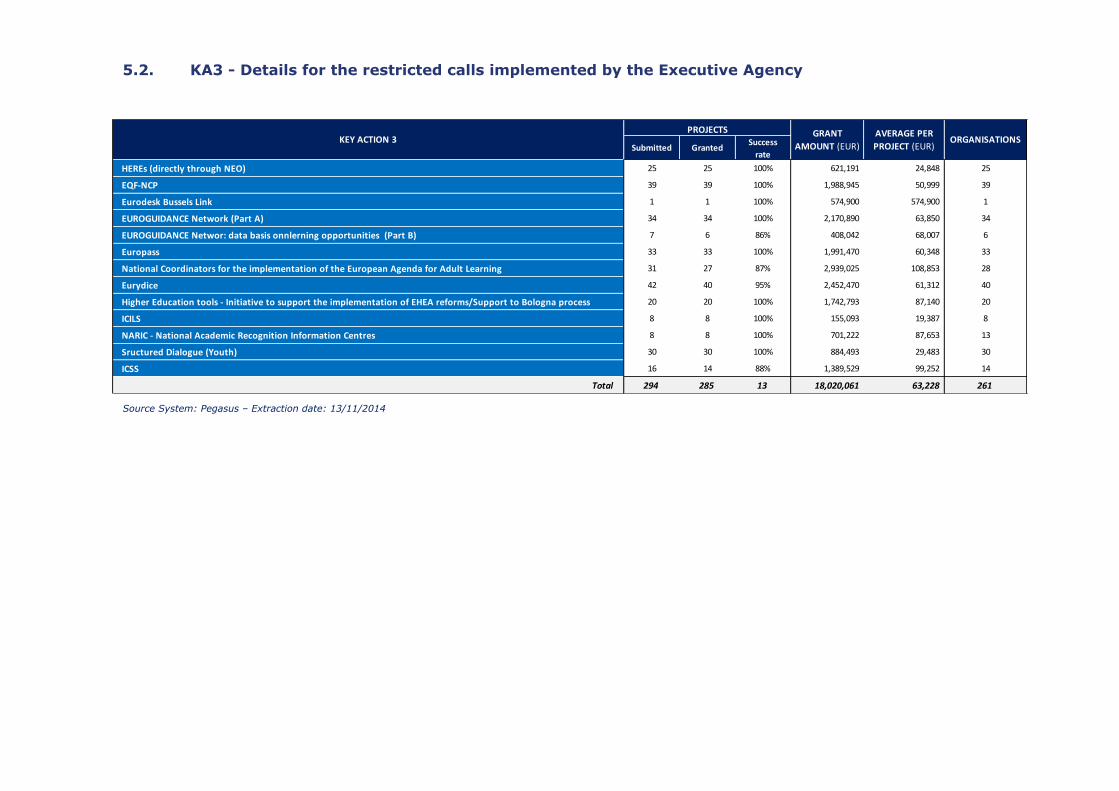
KA3 - Details for the restricted calls implemented by the Executive Agency 5.2.
Source System: Pegasus – Extraction date: 13/11/2014
Submitted GrantedSuccess
rate
HEREs (directly through NEO) 25 25 100% 621,191 24,848 25
EQF-NCP 39 39 100% 1,988,945 50,999 39
Eurodesk Bussels Link 1 1 100% 574,900 574,900 1
EUROGUIDANCE Network (Part A) 34 34 100% 2,170,890 63,850 34
EUROGUIDANCE Networ: data basis onnlerning opportunities (Part B) 7 6 86% 408,042 68,007 6
Europass 33 33 100% 1,991,470 60,348 33
National Coordinators for the implementation of the European Agenda for Adult Learning 31 27 87% 2,939,025 108,853 28
Eurydice 42 40 95% 2,452,470 61,312 40
Higher Education tools - Initiative to support the implementation of EHEA reforms/Support to Bologna process 20 20 100% 1,742,793 87,140 20
ICILS 8 8 100% 155,093 19,387 8
NARIC - National Academic Recognition Information Centres 8 8 100% 701,222 87,653 13
Sructured Dialogue (Youth) 30 30 100% 884,493 29,483 30
ICSS 16 14 88% 1,389,529 99,252 14
Total 294 285 13 18,020,061 63,228 261
KEY ACTION 3PROJECTS
ORGANISATIONSGRANT
AMOUNT (EUR)
AVERAGE PER
PROJECT (EUR)

KA3 - Organisations by country for Policy Experimentation 5.3.
Country Coordinators Partners Total
Belgium 3 11 14
Croatia 8 8
Cyprus 1 4 5
Czech Republic 2 2
Denmark 5 5
Germany 5 5
Spain 9 9
Estonia 4 4
France 1 4 5
Greece 2 2
Iceland 3 3
Ireland 2 2
Italy 12 12
Hi Latvia 2 2
Lithuania 4 4
Luxembourg 2 2
The netherlands 1 8 9
Norway 3 3
Austria 5 5
Poland 1 1
Portugal 1 2 3
Slovenia 11 11
Finland 1 4 5
Sweden 3 3
Turkey 1 1
United Kingdom 2 2
Grand Total 8 119 127
Source System: Pegasus – Extraction date: 13/11/2014

Jean Monnet Activities 6.
Jean Monnet - Overview of the results 6.1.
Source System = Pegasus, Extraction date = 06/10/2015
Management
mode Submitted Granted Success
rate
Total Average per
projectJean Monnet Modules Direct General 182 72 40% 1,783,752 24,774 72 60,885
Jean Monnet Chairs Direct General 114 52 46% 2,260,084 43,463 52 61,168
Jean Monnet Centres of Excellence Direct General 24 14 58% 1,316,310 94,022 19 23,700
Jean Monnet Associations Direct General 14 9 64% 379,585 42,176 9 3,520
Jean Monnet Institutions Direct General 15 3 20% 762,114 254,038 3 1,307
Jean Monnet Network Direct General 17 7 41% 1,973,920 281,989 66 14,305
Jean Monnet Information Project Direct General 125 55 44% 2,867,908 52,144 56 47,671
491 212 43% 11,343,672 792,606 277 212,557
OperatingGrants to support Specified Institutions Direct Restricted 7 7 100% 26,653,400 3,807,629 7 59,941
498 219 44% 37,997,072 4,600,234 284 272,498
Granted Amounts (EUR) Organisations Participants
TOTAL for 2014 Jean Monnet Activities
Subtotal total for 2014 Actions
JEAN MONNET ACTIVITIESType of
Call
Numbre of Projects
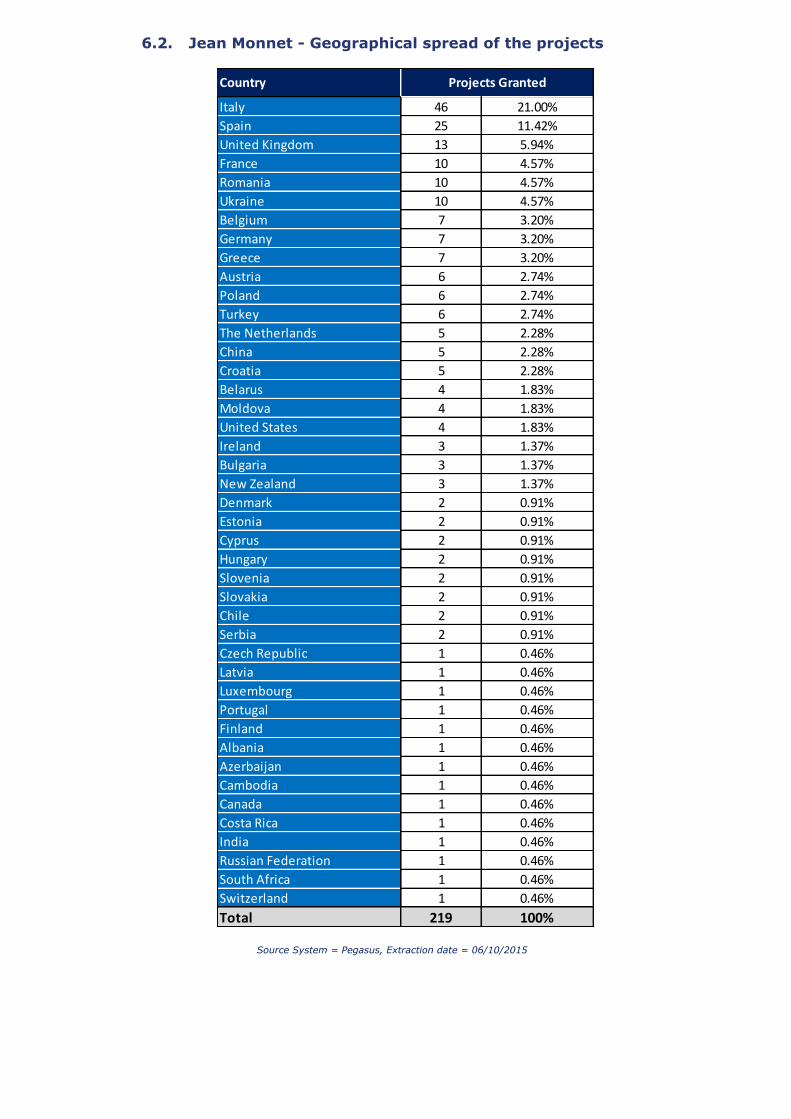
Jean Monnet - Geographical spread of the projects 6.2.
Source System = Pegasus, Extraction date = 06/10/2015
Italy 46 21.00%
Spain 25 11.42%
United Kingdom 13 5.94%
France 10 4.57%
Romania 10 4.57%
Ukraine 10 4.57%
Belgium 7 3.20%
Germany 7 3.20%
Greece 7 3.20%
Austria 6 2.74%
Poland 6 2.74%
Turkey 6 2.74%
The Netherlands 5 2.28%
China 5 2.28%
Croatia 5 2.28%
Belarus 4 1.83%
Moldova 4 1.83%
United States 4 1.83%
Ireland 3 1.37%
Bulgaria 3 1.37%
New Zealand 3 1.37%
Denmark 2 0.91%
Estonia 2 0.91%
Cyprus 2 0.91%
Hungary 2 0.91%
Slovenia 2 0.91%
Slovakia 2 0.91%
Chile 2 0.91%
Serbia 2 0.91%
Czech Republic 1 0.46%
Latvia 1 0.46%
Luxembourg 1 0.46%
Portugal 1 0.46%
Finland 1 0.46%
Albania 1 0.46%
Azerbaijan 1 0.46%
Cambodia 1 0.46%
Canada 1 0.46%
Costa Rica 1 0.46%
India 1 0.46%
Russian Federation 1 0.46%
South Africa 1 0.46%
Switzerland 1 0.46%
Total 219 100%
Country Projects Granted
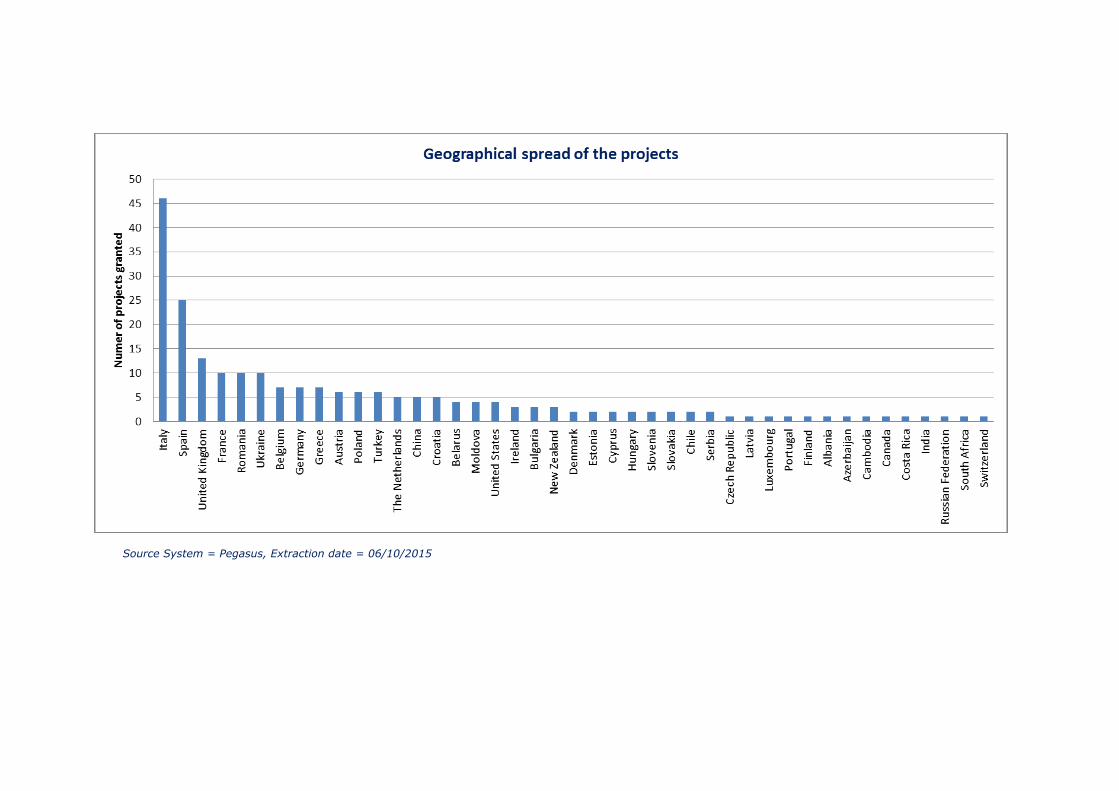
Source System = Pegasus, Extraction date = 06/10/2015

Sport Activities 7.
7.1 Sport - Overview of the results
Source System = Pegasus, Extraction date = 20/11/2015
Submitted GrantedSuccess
rate
Total
(million EUR)
Average per
project (EUR)
Support for Not-for-profit European Sport Events 2014 Direct General 37 3 8% 3.203 86,556 3
Support for Not-for-profit European Sport Events 2015 Direct General 135 3 2% 1.952 14,462 3
Support fo collaborative partnerships Direct General 305 39 13% 15.221 49,907 335
Total 477 45 9% 20.376 341
Granted Amounts
OrganisationsManagement
ModeACTION Type of Call
Projects

7.2 Geographical spread of the applications
Source System = Pegasus, Extraction date = 20/11/2015
Submitted Contracted Success
rateAustria 14 3 21.43%
Belgium 9 1 11.11%
Bulgaria 17
Croatia 12
Cyprus 6
Czech Republic 7
Denmark 14 3 21.43%
Finland 3 1 33.33%
Former Yugoslav Republic of Macedonia (FYROM) 4
France 22 3 13.64%
Germany 17 3 17.65%
Greece 18 2 11.11%
Hungary 19 1 5.26%
Ireland 3 1 33.33%
Italia 118 12 10.17%
Latvia 4
Lithuania 25 1 4.00%
Luxembourg 4 1 25.00%
Malta 3
Poland 35 2 5.71%
Portugal 8
Romania 15
Sewden 3 1 33.33%
Slovakia 2
Slovenia 16 1 6.25%
Spain 19 2 10.53%
The Netherlands 17 3 17.65%
Turkey 23 1 4.35%
United Kingdom 20 3 15.00%
Total 477 45 9.43%
CountryProjects
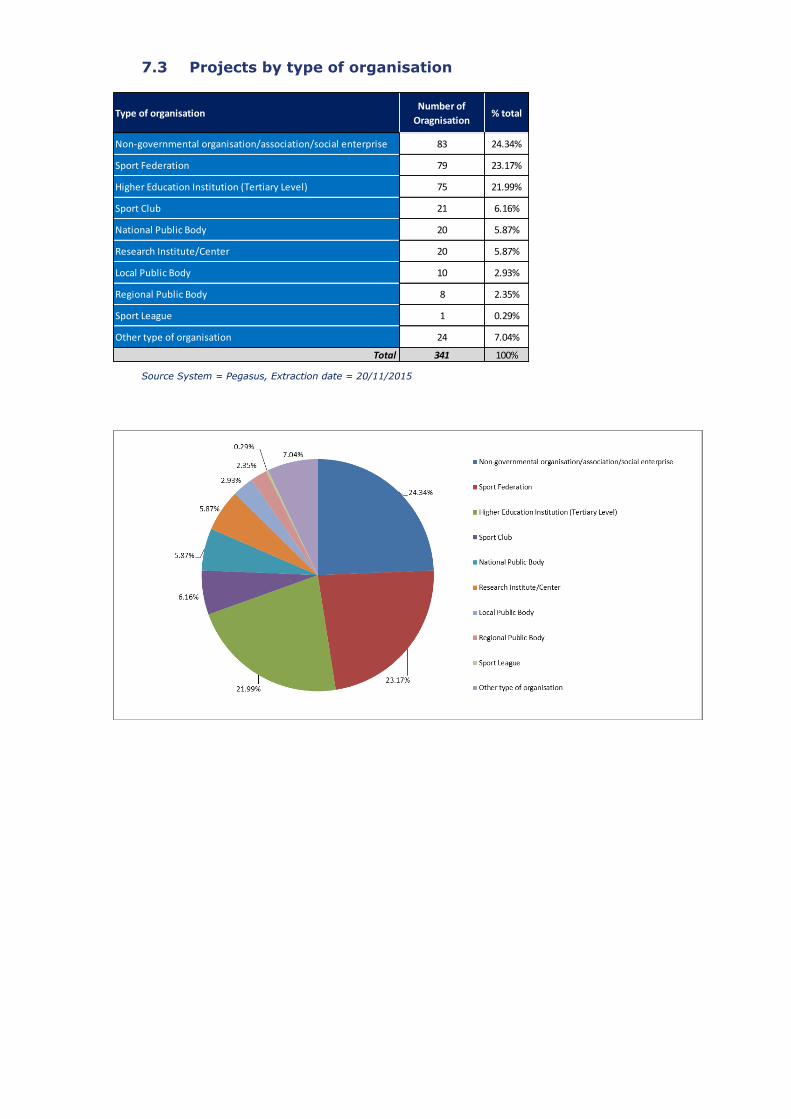
7.3 Projects by type of organisation
Source System = Pegasus, Extraction date = 20/11/2015
Type of organisationNumber of
Oragnisation% total
Non-governmental organisation/association/social enterprise 83 24.34%
Sport Federation 79 23.17%
Higher Education Institution (Tertiary Level) 75 21.99%
Sport Club 21 6.16%
National Public Body 20 5.87%
Research Institute/Center 20 5.87%
Local Public Body 10 2.93%
Regional Public Body 8 2.35%
Sport League 1 0.29%
Other type of organisation 24 7.04%
Total 341 100%

doi:10
ISBN: