Annex 3 - fema-online.eu · 1 Annex 3 - Intelligent Transport System for PTWs User Survey Annex 3...
152
1 Annex 3 - Intelligent Transport System for PTWs User Survey Annex 3 Intelligent Transport System for PTWs User Survey A priority rating of ITS for motorcycling Please refer to this report as follows: Baldanzini, N. Delhaye, A. (2015), Intelligent Transport System for PTWs User Survey – A user priority rating of ITS for motorcycling, Annex 3 of the EC/MOVE/C4 project RIDERSCAN. GRANT AGREEMENT NUMBER MOVE/C4/SUB/2010-125/SI2.603201/RIDERSCAN Project Coordinator: Aline Delhaye, Federation of European Motorcyclists’ Associations (FEMA), Rue des champs, n°62, 1040, Etterbeek (Brussels), Belgium Project Start date: 01/11/2011 Duration 42 months Organisation name of lead contractor for this deliverable: Federation of European Motorcyclists’ Associations (FEMA), Belgium Report Author(s): Baldanzini Niccolò, Florence University (UNIFI), Italy Delhaye Aline, Federation of European Motorcyclists Associations (FEMA), Belgium Due date of deliverable: 30/04/2015 Submission date: 30/04/2015 Project co-funded by the European Commission Dissemination Level: public
Transcript of Annex 3 - fema-online.eu · 1 Annex 3 - Intelligent Transport System for PTWs User Survey Annex 3...

1 Annex 3 - Intelligent Transport System for PTWs User Survey
Annex 3
Intelligent Transport System for PTWs User Survey A priority rating of ITS for motorcycling
Please refer to this report as follows:
Baldanzini, N. Delhaye, A. (2015), Intelligent Transport System for PTWs User Survey –
A user priority rating of ITS for motorcycling, Annex 3 of the EC/MOVE/C4 project
RIDERSCAN.
GRANT AGREEMENT NUMBER MOVE/C4/SUB/2010-125/SI2.603201/RIDERSCAN
Project Coordinator: Aline Delhaye, Federation of European Motorcyclists’ Associations
(FEMA), Rue des champs, n°62, 1040, Etterbeek (Brussels), Belgium
Project Start date: 01/11/2011 Duration 42 months
Organisation name of lead contractor for this deliverable:
Federation of European Motorcyclists’ Associations (FEMA), Belgium
Report Author(s):
Baldanzini Niccolò, Florence University (UNIFI), Italy
Delhaye Aline, Federation of European Motorcyclists Associations (FEMA), Belgium
Due date of deliverable: 30/04/2015 Submission date: 30/04/2015
Project co-funded by the European Commission
Dissemination Level: public

2 Annex 3 - Intelligent Transport System for PTWs User Survey
Table of contents
Table of contents .................................................................................................................... 2
1. Objective ........................................................................................................................ 3
2. Methodology .................................................................................................................. 3
3. Data analysis .................................................................................................................. 6
3.1. Preliminary data screening ........................................................................................ 6
3.2. Data processing .......................................................................................................... 6
3.3. European analysis ...................................................................................................... 7
Creation of a European representative dataset ........................................................... 7
Results ...................................................................................................................... 11
Discussion ................................................................................................................ 27
3.4. National analyses ..................................................................................................... 28
3.4.1. Belgium ................................................................................................................... 29
3.4.2. France ...................................................................................................................... 40
3.4.3. Germany .................................................................................................................. 51
3.4.4. Greece ..................................................................................................................... 64
3.4.5. Italy ......................................................................................................................... 77
3.4.6. Netherlands ............................................................................................................. 89
3.4.7. Scandinavian countries (the Nordics) ................................................................... 102
3.4.8. United Kingdom .................................................................................................... 114
3.4.9. Final considerations on national analyses ............................................................. 126
4. Appendix A: The ITS Riderscan questionnaire ......................................................... 129
5. Appendix B: comparison of the full and normalized national datasets ...................... 143
5.1. France .................................................................................................................... 144
5.2. Germany ................................................................................................................ 147
5.3. United Kingdom .................................................................................................... 149

3 Annex 3 - Intelligent Transport System for PTWs User Survey
1. Objective
The ITS Riderscan survey aimed to capture the attitude of riders towards safety systems at
large. Specifically interest was directed at identifying:
rider subgroups with different attitudes towards safety and safety systems/devices;
national differences within Europe with reference to an average European sample;
systems/functions appreciated by riders;
systems/functions considered dangerous and/or useless by riders.
2. Methodology
An open participation survey was conducted. This dissemination strategy was chosen by the
project team in preference to a survey of a controlled group of riders, as it provided for the
consistent dissemination of the project questionnaire, thereby allowing us to compare the
general interest for the topic. However, this dissemination strategy can create a bias in the
sample of respondents, which has to be taken into account during data processing.
The survey consisted of two parts:
1) a section on the characterization of the respondent in terms of demographic variables,
riding experience and usage of PTW(s), using the same questions as in the
Motorcycling Survey (Annex 1) and with a specific statement on technology/accidents
aimed at interpreting riders’ answers according to overall technology acceptance
views.
2) a section dedicated to safety systems/devices. The respondent was asked to rate each
system/device on a 6-grade scale ranging from dangerous to essential for safety.
The list in the second section consisted of the systems/functions identified by the Monash
University review1 and those initially evaluated / surveyed in the SAFERIDER project
2. A
description of each system/function was provided for reference during the course of
answering the questionnaire. The list was structured according to the functional/kind of
support purpose of the systems/functions to facilitate understanding. The following
classification scheme was used:
I. rider warnings and information systems;
II. maintenance and diagnostic;
III. lighting and visibility;
1 Bayly, M., Regan, M., Hosking, S., Intelligent Transport Systems and Motorcycle Safety, Monash University
Accident Research Centre, 2006,
http://www.monash.edu.au/miri/research/reports/muarc260.html 2 SAFERIDER project, D1.2. Use Cases report, 2008,
http://www.fema-online.eu/riderscan/IMG/doc/saferider_certh_wp2_v3_d1.2_extract_ridersneedsandwants-
2.doc

4 Annex 3 - Intelligent Transport System for PTWs User Survey
IV. braking;
V. stability and balance;
VI. rider fitness;
VII. passive (post-crash) systems;
VIII. communication between vehicles (V2V);
IX. communication between vehicles and infrastructure (V2I).
Technically speaking, the list included both systems currently available on the market and
systems not available for powered two-wheelers or even not available at all for road vehicles.
The latter group includes systems currently being researched and thus only general features
are available to describe their performance.
The detailed content of each group is provided in appendix A, where all the survey questions
are listed.
The survey was open to the general public, though identification was required to participate,
allowing the questionnaire to be completed in stages and preventing the same respondent
answering more than once. To facilitate participation, the questionnaire was available in the
following national languages: Bulgarian, Czech, Danish, Dutch, English, Estonian, Finnish,
French, German, Greek, Hungarian, Italian, Lithuanian, Norwegian, Polish, Portuguese,
Rumanian, Slovakian, Slovenian, Spanish and Swedish. The survey was advertised at national
level through FEMA member associations and partnerships with main national motorcycle
magazines (Table 1). Availability of the survey in each country: 3 months (Table 2).
Table 1: partners advertising the survey.
Country Media Partners Motorcyclists’
Associations
Denmark Touring NYT DMC
MCTC
Finland Bike Smoto
MP69
France MotoMag FFMC
Germany BVDM
BU
Greece Mototriti NTUA
Ireland MAG Ireland
Italy GSM
CIM
Netherlands MAG NL
Norway Bike NMCU
Spain AMM
Sweden MC Foklet SMC
UK Ride BMF
MAG UK

5 Annex 3 - Intelligent Transport System for PTWs User Survey
Table 2: Distribution period of the survey in European countries.
Country Start date End date
Denmark 24/02/2014 24/05/2014
Finland 28/01/2014 28/04/2014
France 14/02/2014 14/05/2014
Germany 26/02/2014 26/05/2014
Greece 25/02/2014 25/05/2014
Ireland 18/01/2014 18/04/2014
Italy 21/02/2014 21/05/2014
Netherlands 10/02/2014 10/05/2014
Norway 29/01/2014 29/04/2014
Spain 27/05/2014 27/08/2014
Sweden 23/01/2014 23/04/2014
UK 28/01/2014 28/01/2014
No specific access policy was implemented to shape the sample of respondents based on
specific parameters (e.g. type of vehicle) and all controls were devolved to the data analysis
phase. The only check programmed was one preventing the same person from answering the
questionnaire more than once.
6 Annex 3 - Intelligent Transport System for PTWs User Survey
3. Data analysis
The survey attracted the interest of 7677 riders all over Europe, though only 4845 actually
completed the questionnaire. The subsequent data processing took into account only complete
answers in order to have a consistent data set.
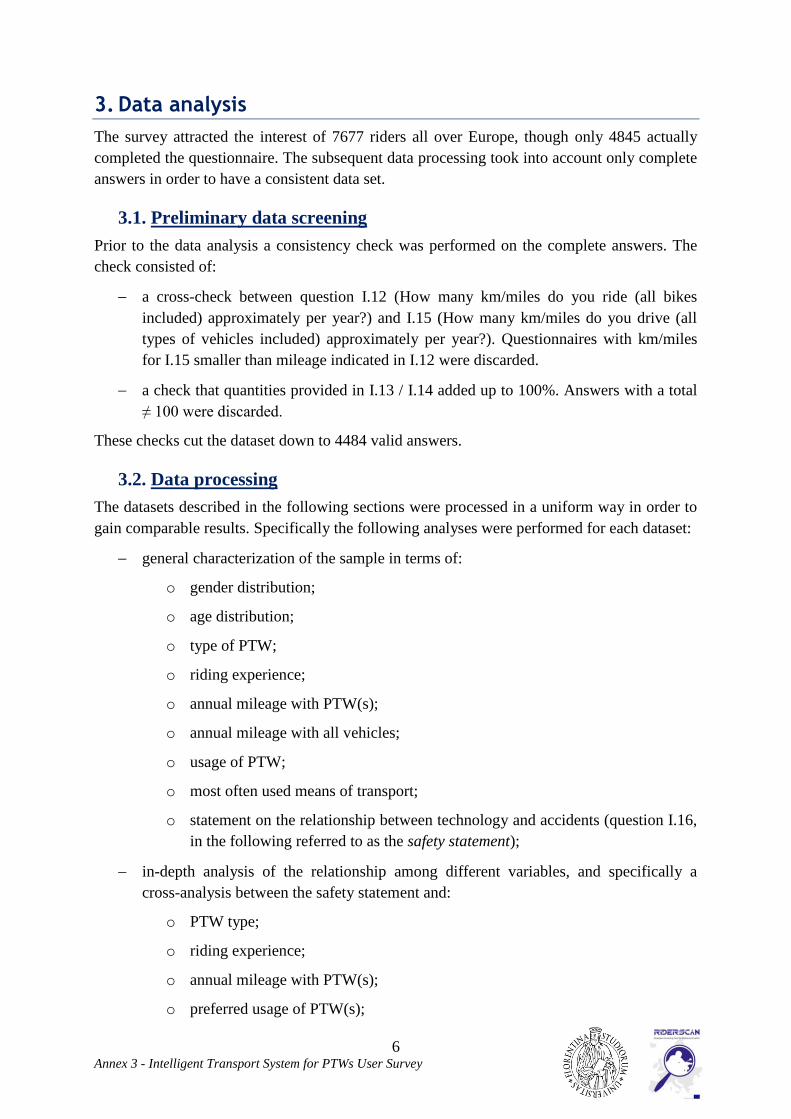
3.1. Preliminary data screening
Prior to the data analysis a consistency check was performed on the complete answers. The
check consisted of:
a cross-check between question I.12 (How many km/miles do you ride (all bikes
included) approximately per year?) and I.15 (How many km/miles do you drive (all
types of vehicles included) approximately per year?). Questionnaires with km/miles
for I.15 smaller than mileage indicated in I.12 were discarded.
a check that quantities provided in I.13 / I.14 added up to 100%. Answers with a total
≠ 100 were discarded.
These checks cut the dataset down to 4484 valid answers.
3.2. Data processing
The datasets described in the following sections were processed in a uniform way in order to
gain comparable results. Specifically the following analyses were performed for each dataset:
general characterization of the sample in terms of:
o gender distribution;
o age distribution;
o type of PTW;
o riding experience;
o annual mileage with PTW(s);
o annual mileage with all vehicles;
o usage of PTW;
o most often used means of transport;
o statement on the relationship between technology and accidents (question I.16,
in the following referred to as the safety statement);
in-depth analysis of the relationship among different variables, and specifically a
cross-analysis between the safety statement and:
o PTW type;
o riding experience;
o annual mileage with PTW(s);
o preferred usage of PTW(s);
7 Annex 3 - Intelligent Transport System for PTWs User Survey
identification of the best/worst rated safety systems/devices:
o top 10 systems/devices rated as definitely useful or essential for safety;
o top 10 systems/devices rated as useless;
o top 10 systems/devices rated as dangerous;
o installation modality of safety functions rated as essential;
in-depth analysis of the relationship among the identified best/worst rated safety
systems/devices and the safety statement.
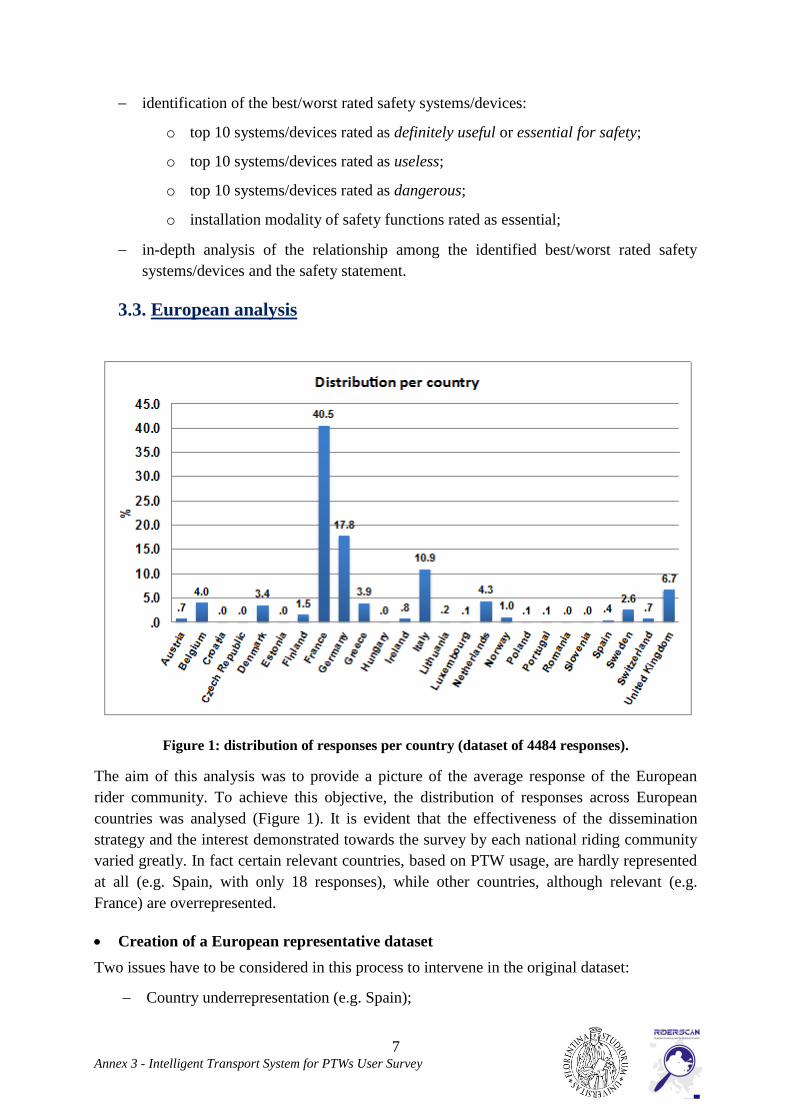
3.3. European analysis
Figure 1: distribution of responses per country (dataset of 4484 responses).
The aim of this analysis was to provide a picture of the average response of the European
rider community. To achieve this objective, the distribution of responses across European
countries was analysed (Figure 1). It is evident that the effectiveness of the dissemination
strategy and the interest demonstrated towards the survey by each national riding community
varied greatly. In fact certain relevant countries, based on PTW usage, are hardly represented
at all (e.g. Spain, with only 18 responses), while other countries, although relevant (e.g.
France) are overrepresented.
Creation of a European representative dataset
Two issues have to be considered in this process to intervene in the original dataset:
Country underrepresentation (e.g. Spain);

8 Annex 3 - Intelligent Transport System for PTWs User Survey
Country overrepresentation (e.g. France).
While the first issue constitutes a limitation of the current study without any way to overcome
it, the latter can be tackled through resampling the original dataset. In order to resample the
dataset two possible criteria were examined in order to quantify the representativeness of a
country:
number of PTW (i.e. rider) fatalities;
total number of PTWs on the roads.
The procedure used to evaluate the best resampling solution was:
selection of a criterion (i.e. accidents or total PTWs) and calculation of each country’s
representativeness (i.e. percentage of data in the dataset for the specific country);
selection of a reference country;
calculation of the expected number of answers in the survey for each country,
maintaining the same ratio of representativeness among each country and the reference
country. In this procedure all the answers of the reference country are considered,
while for the other countries a reduced number is determined.
Simulations were run with both criteria. The following data were respectively used to
compute the country representativeness: ERSO data on moped + motorcycle fatalities
(2009)3; ACEM data on the number of PTWs on a country’s roads (2012)
4. Italy and Greece
were selected as reference countries, since they had a relatively low number of responses
compared to the data of each criterion.
The results of the simulations are reported in Figure 2. It is evident in the diagram that a high
proportion of countries have enough data to be included in the European dataset
independently of the reference country and the selected criterion. Countries excluded are:
Italy, since there was not enough data for normalization to be carried out using the
number of responses from Greece;
Lithuania and Norway, since there is no fatality data for them in the document used
for the normalization process. When normalization is based on the number of PTWs in
each country, they have enough responses, but their contribution to the dataset is 23 /
39 respondents dependent on which reference country is selected.
The results demonstrate a satisfactory degree of stability, indirectly supporting the proposed
approach. The constitution of the European dataset was driven by the expected size of the
dataset: where normalization was carried out on the basis of fatality data, with Italy as the
reference country, the dataset would include 1784 answers. The alternative option, i.e.
normalization on the basis of the number of PTWs on the country’s roads and with Italy as the
reference country, the dataset would be limited to 1253. The former option was selected
(although two countries were left out: Norway and Lithuania), because:
3 http://ec.europa.eu/transport/road_safety/pdf/statistics/dacota/bfs2012-dacota-ntua-motomoped.pdf
4 http://acem.eu/images/publiq/2014/2013-statistics.pdf
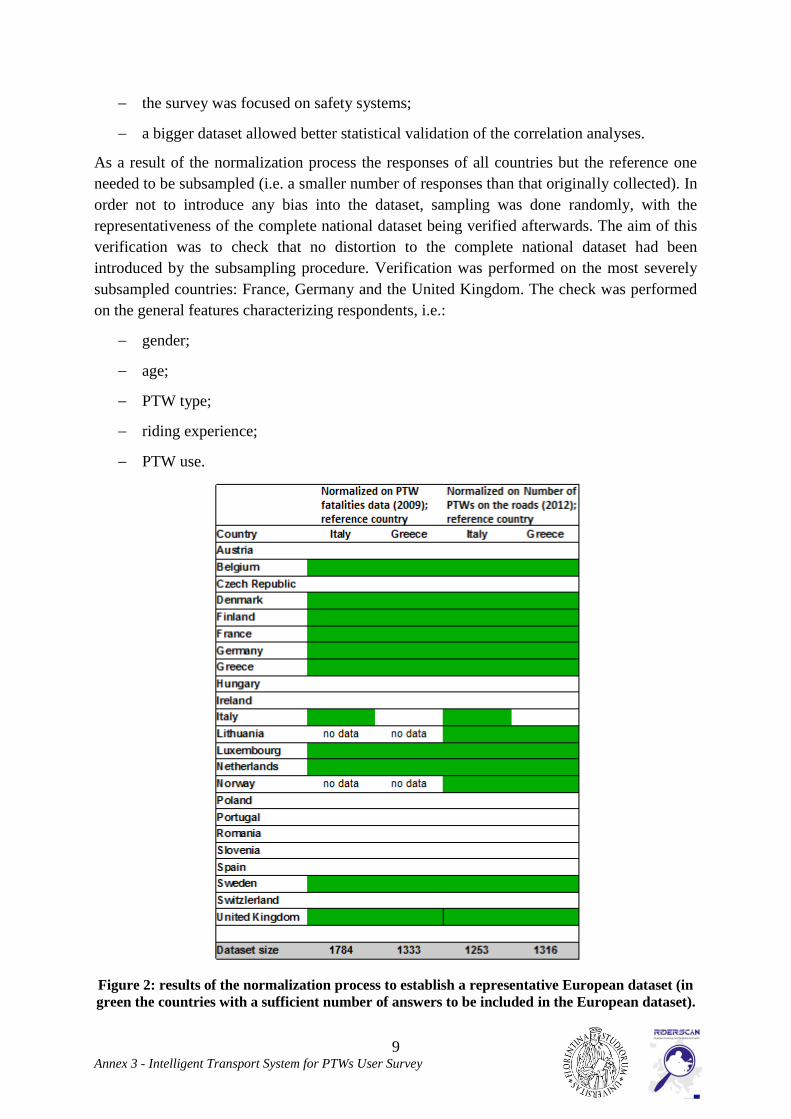
9 Annex 3 - Intelligent Transport System for PTWs User Survey
the survey was focused on safety systems;
a bigger dataset allowed better statistical validation of the correlation analyses.
As a result of the normalization process the responses of all countries but the reference one
needed to be subsampled (i.e. a smaller number of responses than that originally collected). In
order not to introduce any bias into the dataset, sampling was done randomly, with the
representativeness of the complete national dataset being verified afterwards. The aim of this
verification was to check that no distortion to the complete national dataset had been
introduced by the subsampling procedure. Verification was performed on the most severely
subsampled countries: France, Germany and the United Kingdom. The check was performed
on the general features characterizing respondents, i.e.:
gender;
age;
PTW type;
riding experience;
PTW use.
Figure 2: results of the normalization process to establish a representative European dataset (in
green the countries with a sufficient number of answers to be included in the European dataset).

10 Annex 3 - Intelligent Transport System for PTWs User Survey
An example of the verification performed on the national datasets (i.e. comparison of the
frequency counts of the full and normalized datasets) is given in Figure 3. The full set of
comparisons is reported in Appendix B (Figure B. 1 to Figure B. 15). The acceptance of the
procedure was based on the difference in the frequencies between the two datasets.
Differences are in the range of:
France: 0 – 1.8% (higher value in the frequency count of the number of riders with
more than 10 years of experience);
Germany: 0 – 2.2% (higher value in the frequency count of the number of riders with
3 to 10 years of experience);
United Kingdom: 0.1 – 3.6% (higher value in the frequency count of the number of
riders with more than 10 years of experience).
It should be noted that the difference between the datasets increases with decreasing
normalized sample size. In fact the French, German and British normalized datasets have a
size of 474, 294, and 191 responses respectively. Nonetheless the trends in the figures are
identical and the maximum differences are well within acceptable limits. However, since the
differences tend to increase with a decreasing normalized sample size, the overall impact on
the European dataset of discrepancies between the full and normalized sample will become
increasingly negligible.
Figure 3: PTW type in the French datasets (full vs. normalized dataset).
We can conclude by saying that the establishment of the European representative dataset has:
eliminated the overrepresentation of certain countries;
implemented a selection process of the responses for the normalized dataset, which
does not introduce any bias in the national data;

11 Annex 3 - Intelligent Transport System for PTWs User Survey
delivered a European dataset including data from the following countries: Belgium,
Denmark, Finland, France, Germany, Greece, Italy, Luxembourg, Netherlands,
Sweden and the United Kingdom (Figure 4).
The procedure could not solve the problem of underrepresentation of certain countries
(mainly Spain, Poland and Portugal), since no sufficient data were available. This is a
consequence of the initial decisions related to the dissemination of the survey among the
riders, and it has to be taken into account when analysing the results of the European dataset.
Figure 4: distribution of responses per country in the normalized European dataset.
Results
The dataset was initially characterized in terms of demographic data, skills, rider habits as
well as PTWs owned. The dataset is mainly representative of riders 26 and older (Figure 5)
and essentially male riders (Figure 6).

12 Annex 3 - Intelligent Transport System for PTWs User Survey
Figure 5: age distribution (European dataset).
Figure 6: gender distribution (European dataset).
The majority of riders (65.3%) have more than 10 years of experience, and 89.1% more than 3
years (Figure 7). Annual mileage with PTW(s) is pretty uniform, being above 3000 km/year
(Figure 8), while the same distribution for all vehicles driven by the respondent shows a
higher mileage: 22.2% between 10,000 and 15,000 km/year, and 61.1% above 15,000
km/year (Figure 9).

13 Annex 3 - Intelligent Transport System for PTWs User Survey
Figure 7: distribution of riding experience (European dataset).
Figure 8: distribution of annual mileage with PTW(s) (European dataset).

14 Annex 3 - Intelligent Transport System for PTWs User Survey
Figure 9: distribution of annual mileage with all vehicles (European dataset).
The respondents own almost all possible types of PTWs except electric ones (Figure 10;
multiple ownership was included in the data processing). Apart from electric PTWs, only
Supermotards are hardly to be found in the sample (approx. 50 vehicles). The information on
PTW usage was processed in order to analyse preferred usage (i.e. that with the highest
percentage in question I.13). The results show a strong polarization of usage for commuting
(i.e. going to work/school/university) and leisure/hobby/sport/short rides (88.0% overall),
while the most representative among the remaining possibilities is long-distance travelling
(9.0%; Figure 11).
Figure 10: distribution by PTW type (European dataset).

15 Annex 3 - Intelligent Transport System for PTWs User Survey
Figure 11: distribution by the preferred PTW usage (European dataset).
The preferred means of transport is a car (62.3%), followed by a PTW (32.3%). The
remaining transport options represent less than 6% of the responses in the European dataset
(Figure 12). The similarity of the percentages for commuting (Figure 11) and for a PTW
being the preferred means of transport (Figure 12) triggered a more detailed analysis of these
two variables. The intersection of the two distributions showed that 66.1% of car users use
their PTW for leisure/hobby/sport/short rides, while 67.0% of respondents using a PTW as
their preferred means of transport are commuters (Figure 13). Within the European dataset
commuters and leisure riders (i.e. leisure/hobby/sport/short rides) are differently represented
at national level (Figure 14): Germany represents the country with the highest percentage of
leisure riders (almost 70%), while at the opposite end Greece has a share of almost 70% of
commuters and only 20% of leisure riders. In the other countries, leisure riders are the largest
user group in all countries but Belgium5.
5 Denmark, Finland, Luxembourg and Netherlands data were not computed, since their numbers within the
European dataset didn’t allow such an analysis.

16 Annex 3 - Intelligent Transport System for PTWs User Survey
Figure 12: distribution of the most often used means of transport (European dataset).
Figure 13: most often used means of transport vs PTW usage (European dataset) – data add up
to 100% for the most often used means of transport.

17 Annex 3 - Intelligent Transport System for PTWs User Survey
Figure 14: PTW usage by country (European dataset) – data add up to 100% for each country.
The riders were also asked to express their opinion on new technologies and the perceived
relationship to safety. The largest group of riders stated that new technologies have the
potential to improve road use (47.2%), though the second largest user group (28.8%) holds the
opposite opinion (i.e. technology decreases safety as road users are distracted by technology;
Figure 15).
Figure 15: distribution of the "safety statement" (European dataset).

18 Annex 3 - Intelligent Transport System for PTWs User Survey
This statement was analysed and crossed with other variables to highlight possible
relationships. The first analysis was performed versus the PTW type. Results show that for all
PTW types except custom bikes the majority of riders have a positive attitude towards
technology (Figure 16). Nonetheless percentages and distributions vary greatly among groups:
those with the most positive attitude towards technology are scooter and Supersport riders;
Enduro/cross, on/offroad, Sport Touring and Standard follow but with a sharp drop in riders
open to technology; while Supermotard riders feature a less than 10% difference between the
largest and smallest group.
Figure 16: safety statement vs PTW type (European dataset).
The analysis of the safety statement in conjunction with riding experience shows a clear
correlation between the attitude towards technology and riding experience: the greater the
experience the less the riders tend to have a positive attitude towards technology (Figure 17).
The same trend is visible in the correlation with annual PTW mileage (Figure 18): except for
the unexplained dip for annual mileages between 1,000 and 3,000 km/year, the positive
attitude towards technology decreases with increasing mileage and the group of sceptical
riders increases. For those clocking up more than 15,000 km/year, the latter group becomes
the largest one. By contrast no clear relationship could be found with PTW usage, since
similar percentages were found for all usages (Figure 19): only residual usages (i.e. “other”)
have a different distribution, but this is insignificant due to the lack of detail.

19 Annex 3 - Intelligent Transport System for PTWs User Survey
Figure 17: safety statement vs riding experience (European dataset).
Figure 18: safety statement vs riding mileage (European dataset).

20 Annex 3 - Intelligent Transport System for PTWs User Survey
Figure 19: safety statement vs PTW usage (European dataset).
A classification was performed of the safety systems rated as either definitely useful or
essential for safety). These systems/devices were positively rated by 42.8% up to 71.9% of
riders (Figure 20). The same ranking was performed on the subset of respondents who saw
technology as being a distraction for drivers and riders (cf. the safety statement). The first two
systems coincided with the previous ranking, and similarities can be found although the order
of importance is different (Figure 21). The analysis is looked at in greater depth in the section
discussion. In addition riders were also asked about the deployment strategy of essential
safety systems on the market: the majority opted for voluntary adoption of the systems, i.e.
they should be offered as an option and not as a standard feature on all vehicles (Figure 22).

21 Annex 3 - Intelligent Transport System for PTWs User Survey
Figure 20: 10 best safety systems/devices in decreasing order of relevance (European dataset).
Figure 21: 10 best safety systems/devices in decreasing order of relevance, rated by riders with a
sceptical attitude towards technology (European dataset).

22 Annex 3 - Intelligent Transport System for PTWs User Survey
Figure 22: installation modality of essential safety functions (European dataset).
The analysis was also performed at the opposite end of the scale. In this case the analysis was
for useless and dangerous, since these levels express different messages. The 10
systems/devices rated as most useless are reported in Figure 23, while Figure 24 shows the
most dangerous systems/devices. At a first glance there is a certain overlap between useless
and dangerous systems, which will be discussed in the section discussion.
Figure 23: 10 most useless systems/devices for safety in decreasing order of relevance (European
dataset).

23 Annex 3 - Intelligent Transport System for PTWs User Survey
Figure 24: 10 most dangerous systems/devices for safety in decreasing order of relevance
(European dataset).
The previous set of systems was cross-checked with the safety statement. Not surprisingly the
best systems for safety were strongly supported by those riders with a positive attitude
towards technology (from a minimum of 50% of respondents up to almost 90%; Figure 25),
while sceptical and passive riders (i.e. those stating that new technologies are there and we
can’t say “no” to them) pushed the selection of useless and dangerous systems (Figure 26 and
Figure 27). In all figures (Figure 25 to Figure 27) the number of responses from sceptical and
passive riders for the rating of systems are mostly similar, thus defining an almost identical
view of the safety systems.
The systems identified in the European dataset were further analysed to check for possible
different ratings at national level. Only those countries with more than 100 responses in the
full dataset were included: since these plots just collate results from the national analyses, it is
possible to use the full national datasets without restricting them to a subset. Different patterns
can be identified in the (dis)liking of the systems: an almost stable pattern is observed for the
best systems (Figure 28); while a very selective national one is observed for the first three
systems rated as useless, followed by a more uniform grading (Figure 29); and an extremely
selective disliking can be observed for most of the systems considered as dangerous (Figure
30).

24 Annex 3 - Intelligent Transport System for PTWs User Survey
Figure 25: 10 best safety systems/devices vs the safety statement (systems are in decreasing order
of relevance; European dataset).
Figure 26: 10 most useless systems/devices for safety vs the safety statement (systems are in
decreasing order of relevance; European dataset).
25 Annex 3 - Intelligent Transport System for PTWs User Survey
Figure 27: 10 most dangerous systems/devices for safety vs the safety statement (systems are in
decreasing order of relevance; European dataset).
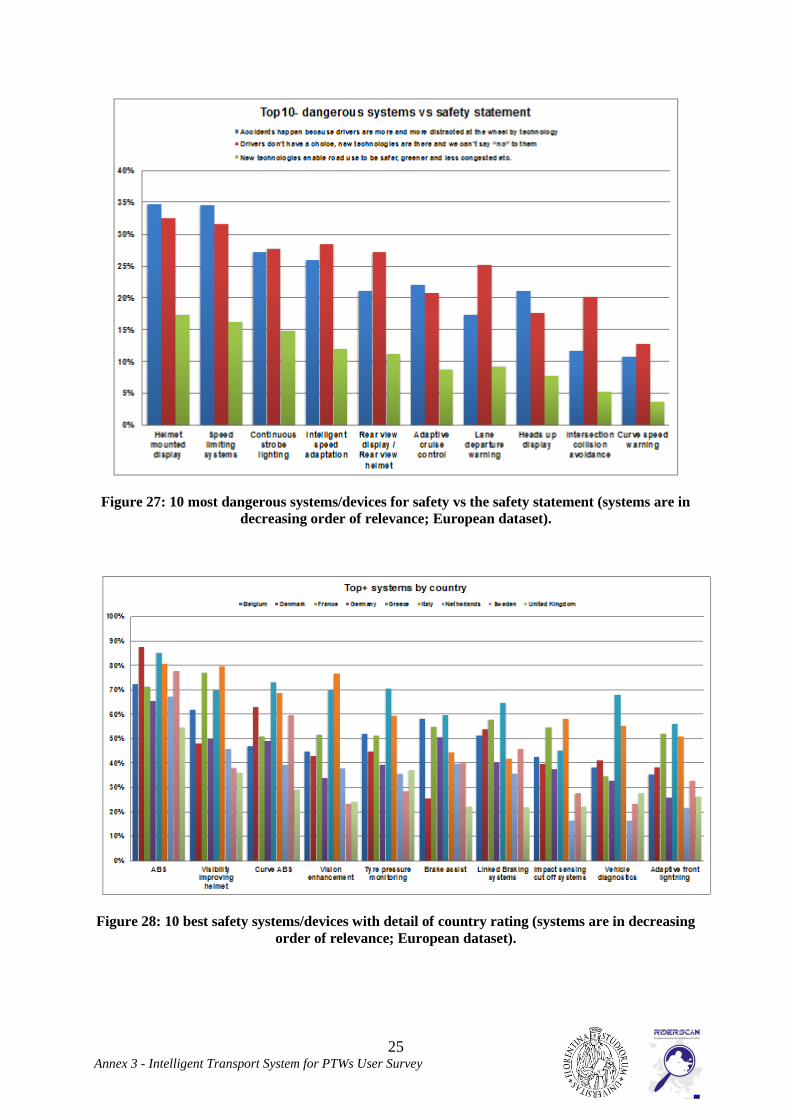
Figure 28: 10 best safety systems/devices with detail of country rating (systems are in decreasing
order of relevance; European dataset).

26 Annex 3 - Intelligent Transport System for PTWs User Survey
Figure 29: 10 most useless systems/devices for safety with detail of country rating (systems are in
decreasing order of relevance; European dataset).
Figure 30: 10 most dangerous systems/devices with detail of country rating (systems are in
decreasing order of relevance; European dataset).

27 Annex 3 - Intelligent Transport System for PTWs User Survey
Discussion
The survey results highlight a relationship between “technology-positive” riders and both
riding experience and annual riding mileage (decreasing relevance of this subgroup of riders
as experience or annual mileage increases; Figure 17 and Figure 18 respectively). Other
interesting relationships involve the types of PTWs used by “technology-positive” riders:
these riders were more likely to own a scooter or a supersport bike (Figure 16). However the
survey data does not permit any understanding of the underlying motives: a further study
would be needed to investigate and understand the different interest in safety systems and to
implement targeted deployment strategies. Motives should be investigated more broadly,
since other data points to a highly fragmented scenario based on different usage patterns: in
fact 67% of those riders using a PTW as their main means of transport are commuters, while
by contrast leisure riders represent 66% of riders using a car as their main means of transport
(Figure 13). It can be expected that these two subgroups have different safety requirements
and also different expectations in terms of safety systems.
In terms of safety systems best rated one is ABS, which is the only real safety device
available on the market. A more general analysis in terms of typology shows that:
4 of the 10 systems are related to braking;
3 of the 10 systems are related to lighting and visibility;
2 of the 10 systems allow improved maintenance of the PTW;
1 of the 10 systems belongs to the post-crash group.
Comparing these 10 systems with the 10 best-rated systems identified through the answers of
“technology-negative” riders, we find that 9 of the 10 systems are identical (Figure 20 and
Figure 21). This result constitutes a strong statement of rider expectations, independent of
their attitude towards technology. The only difference between the two sets of systems is in
the substitution of adaptive front lighting (in the general ranking) with automatic crash
notification (i.e. e-call; in the “technology negative” subgroup of riders; Figure 31).
Figure 31: comparison of 10 best safety systems - full European dataset vs. sceptical riders.
A review of the 10 systems considered to be of least use with regard to safety shows that:
Description All ScepticABS
Visibility improving helmet
Curve ABS
Vision enhancement
Tyre pressure monitoring
Brake assist
Linked Braking systems
Impact sensing cut off systems
Vehicle diagnostics
Adaptive front lightning
Automatic Crash Notification
28 Annex 3 - Intelligent Transport System for PTWs User Survey
3 of the 10 systems belong to the fitness to ride group;
3 of the 10 systems involve warning and information systems;
3 of the 10 systems involve communication between vehicles and infrastructure (V2I);
1 of the 10 systems is related to lighting and visibility.
The same analysis of the 10 systems considered to be dangerous shows that:
3 of the 10 systems involve warning and information systems;
3 of the 10 involve communication between vehicles and infrastructure (V2I);
2 of the 10 systems are related to lighting and visibility;
2 of the 10 systems involve communication between vehicles (V2V).
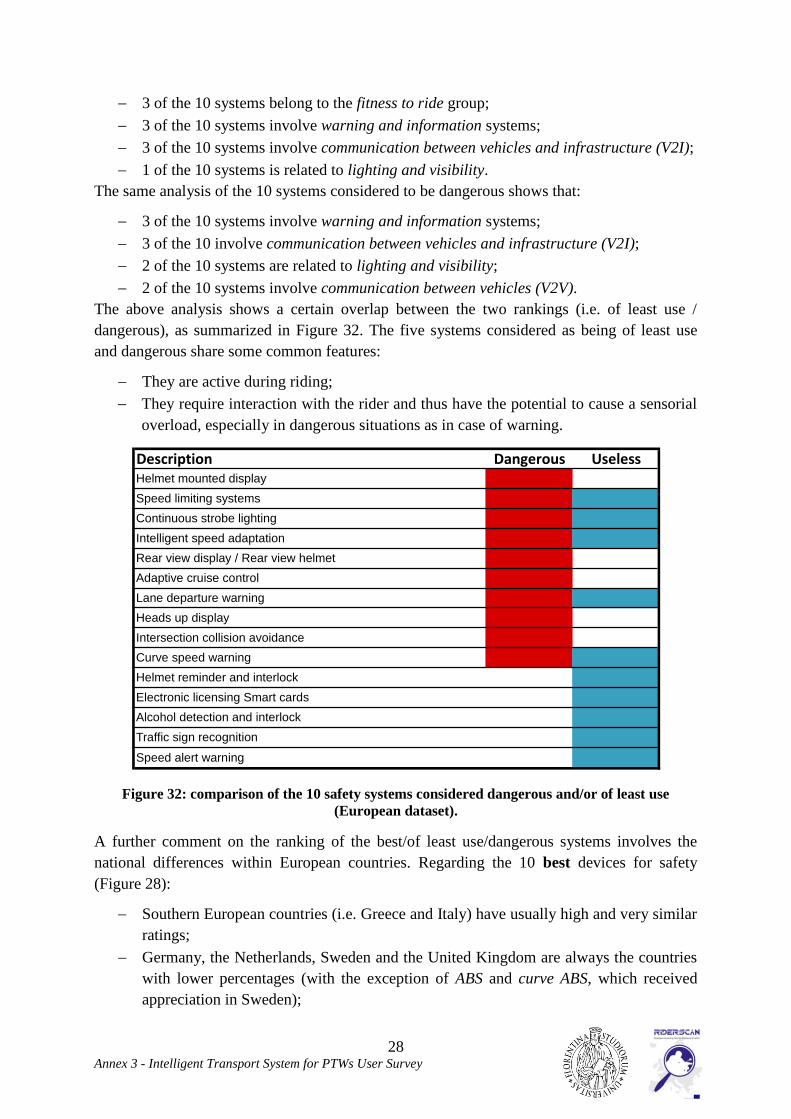
The above analysis shows a certain overlap between the two rankings (i.e. of least use /
dangerous), as summarized in Figure 32. The five systems considered as being of least use
and dangerous share some common features:
They are active during riding;
They require interaction with the rider and thus have the potential to cause a sensorial
overload, especially in dangerous situations as in case of warning.
Figure 32: comparison of the 10 safety systems considered dangerous and/or of least use
(European dataset).
A further comment on the ranking of the best/of least use/dangerous systems involves the
national differences within European countries. Regarding the 10 best devices for safety
(Figure 28):
Southern European countries (i.e. Greece and Italy) have usually high and very similar
ratings;
Germany, the Netherlands, Sweden and the United Kingdom are always the countries
with lower percentages (with the exception of ABS and curve ABS, which received
appreciation in Sweden);
Description Dangerous UselessHelmet mounted display
Speed limiting systems
Continuous strobe lighting
Intelligent speed adaptation
Rear view display / Rear view helmet
Adaptive cruise control
Lane departure warning
Heads up display
Intersection collision avoidance
Curve speed warning
Helmet reminder and interlock
Electronic licensing Smart cards
Alcohol detection and interlock
Traffic sign recognition
Speed alert warning

29 Annex 3 - Intelligent Transport System for PTWs User Survey
Belgium, Denmark and France are more selective, with ratings changing on a per
system basis.
The same pattern, although reversed in terms of percentages, is visible in the assessment of
those systems of least use (Figure 29). In this group the first three systems (i.e. helmet
reminder and interlock, electronic licensing smart cards, alcohol detection and interlock)
show high national differences ranging up to 45%. These differences tend to smooth out as
the degree of uselessness decreases.
In the case of the systems rated as dangerous, Germany and the United Kingdom show high
negative ratings. The United Kingdom is the most critical country with regard to continuous
strobe lighting, speed limiting systems and intelligent speed adaptation, while Germany is the
most critical with regard to the remaining 7 systems (Figure 30). The ratings of the remaining
countries are fragmented, but with smaller differences when compared to Germany and the
United Kingdom. Here again, further research should look for a confirmation of these results
and try to identify the underlying motives. In the current study, no explanation could be
found, even when taking the different use of PTWs at national level into consideration.
3.4. National analyses
3.4.1. Belgium
The Belgian dataset consisted of 181 valid answers. In the national analysis the Belgian
dataset was not subsampled (as was done in the creation of the EU dataset) and all answers
were processed. Data was analysed on the basis of the safety statement in section Error!
Reference source not found. and compared with the results of the European dataset.
Results
Belgian respondents are characterized by an age distribution featuring more 46+ year-old
riders than the overall EU figure (Figure 33), though in line with the EU representative dataset
in terms of gender (Figure 34)
Figure 33: age distribution (Belgium vs Europe).

30 Annex 3 - Intelligent Transport System for PTWs User Survey
Figure 34: gender distribution (Belgium vs Europe).
The riding experience of Belgian riders differs somewhat from the European average. While
there are 4.0% less riders with more than 10 years of experience, there are 3.3% more riders
with 3-10 years of experience (Figure 35). Although slightly less experienced than the EU
average, Belgian riders clock up a higher mileage both with PTWs (Figure 36) and with all
vehicles (Figure 37). In terms of PTW mileage, they are more represented in the mileage
ranges above 7000km/year, while in the mileage with all vehicles they are concentrated in the
range above 15,000km/year (81.8%; +21.7% compared to the EU average).
Figure 35: breakdown of riding experience (Belgium vs Europe).

31 Annex 3 - Intelligent Transport System for PTWs User Survey
Figure 36: breakdown of annual mileage with PTW(s) (Belgium vs Europe).
Figure 37: breakdown of annual mileage with all vehicles (Belgium vs Europe).
The types of PTWs most owned are sport touring, on/off-road and custom bikes (Figure 38),
respectively over-represented at +14.6%, +5.6% and +4.6% versus the EU sample. The
preferred PTW usage is again concentrated in two categories (commuting and leisure/short
rides; Figure 39), together representing 91.7% of PTW usage. Compared to the EU sample
there are more commuters (+7.7%), less leisure riders (-4.0%) and less long-distance
travellers (-3.5%). In Belgium 40.9% of riders use their PTW as their preferred means of
transport, while 53.0% use a car (Figure 40). Compared to the EU average, 8.7% more riders
use a PTW as their main means of transport. In line with the EU sample, those Belgian riders
using a PTW as their preferred means of transport are mainly commuters (73.0%; Figure 41).

32 Annex 3 - Intelligent Transport System for PTWs User Survey
Figure 38: PTW type distribution (Belgium vs Europe).
Figure 39: breakdown of preferred PTW usage (Belgium vs Europe).
Figure 40: breakdown of the most commonly used means of transport (Belgium vs Europe).

33 Annex 3 - Intelligent Transport System for PTWs User Survey
Figure 41: most commonly used means of transport vs PTW usage (dataset: Belgium) data sums
up to 100% on the most commonly used means of transport.
The riders were asked to express their opinion on new technologies and their perceived
relationship to safety. The majority of riders had a positive attitude towards technology
(52.5%), with only 27.6% of them viewing technology as a factor contributing to accidents
(Figure 42). In general, Belgium attitudes towards technology are more positive than the EU
average.
Figure 42: breakdown of the “safety statement” (Belgium vs Europe).
Riders were also asked to rate safety systems based on their experience or their perception of
the potential benefits arising from a specific device or system. The systems rated as either

34 Annex 3 - Intelligent Transport System for PTWs User Survey
definitely useful or essential for safety are listed in Figure 43. The same ranking was also
performed on a subset of respondents, characterized by a sceptical attitude towards
technology (Figure 44). The preferred deployment strategy of the systems was in favour of
their optional installation on PTWs (69.1% vs 30.9%; Figure 45).
Figure 43: 10 best safety systems/devices in decreasing order of relevance (dataset: Belgium).
Figure 44: 10 best safety systems/devices in decreasing order of relevance, rated by riders with
sceptical attitude towards technology (dataset: Belgium).

35 Annex 3 - Intelligent Transport System for PTWs User Survey
Figure 45: installation modality of essential safety functions (Belgium vs Europe).
A similar ranking of the safety systems was carried out to identify the ones considered as
being of least use (Figure 46) or dangerous (Figure 47). This classification was crossed with
the safety statement to identify the contribution of each group of riders to the classification
(Figure 48 to Figure 50).
Figure 46: 10 systems/devices of least use for safety in decreasing order of relevance (dataset:
Belgium).

36 Annex 3 - Intelligent Transport System for PTWs User Survey
Figure 47: 10 systems/devices most dangerous to safety in decreasing order of relevance
(dataset: Belgium).
Figure 48: 10 best safety systems/devices vs the safety statement (dataset: Belgium).

37 Annex 3 - Intelligent Transport System for PTWs User Survey
Figure 49: 10 systems/devices of least use for safety vs the safety statement (dataset: Belgium).
Figure 50: 10 systems/devices most dangerous to safety vs the safety statement (dataset:
Belgium).

38 Annex 3 - Intelligent Transport System for PTWs User Survey
Discussion
The Belgian dataset featured a large share of technology-positive riders (Figure 42), a fact
also reflected in the rating of the 10 best safety systems: the top 5 systems were considered
useful by more than 50% of the riders (51.7% to 72.8%), while the remaining 5 systems
received a minimum share of 44.4% of ratings (Figure 43). Moreover, the 10 best safety
systems were also rated highly by the riders of the other groups. A comparison between the 10
best safety systems for all Belgian riders and those for sceptical riders revealed that 7 of the
10 systems were common to both groups (Figure 51). A breakdown of the top safety systems
for all riders shows that:
4 of the 10 systems are related to braking (all the systems available in this group);
4 of the 10 systems are related to lighting and visibility;
1 of the 10 systems allows improved maintenance of the PTW;
1 of the 10 systems involves rider warnings and information systems.
Of the 3 systems only rated highly by sceptical riders,
2 belong to the passive and post-crash systems group;
1 belongs to the information systems group.
Figure 51: comparison of top 10 best safety systems - full dataset vs sceptical riders (dataset:
Belgium).
Among the systems considered as being of least use, the first one (Helmet reminder and
interlock) was rated as such by 48.9% of riders, while the ratings for the remaining systems
ranged from 36.3% to 23.5% (Figure 49). Differently the dangerous systems, received this
rating with a much lower share of opinions ranging from 23.6% to 7.7% (Figure 50). A
comparison between the systems rated as dangerous and of least use reveals that just 4
systems feature in both classifications (Figure 52). A review of the 10 systems rated as being
of least use to safety shows that:
4 of the 10 systems belong to the fitness to ride group (whole group);
3 of the 10 systems involve warning and information systems;
Description All ScepticABS
Visibility improving helmet
Brake assist
DRL
Tyre pressure monitoring
Linked braking systems
Road surface condition monitoring
Curve ABS
Vision enhancement
Blind spot assistance
Impact sensing cut-off
Navigation systems
Emergency lighting systems

39 Annex 3 - Intelligent Transport System for PTWs User Survey
2 of the 10 systems involve communication between vehicles and infrastructure (V2I);
1 of the 10 systems is related to lighting and visibility.
The same analysis on the 10 systems rated as dangerous found that:
3 of the 10 systems involve warning and information systems;
3 of the 10 systems involve communication between vehicles and infrastructure (V2I)
(whole group);
2 of the 10 systems are related to lighting and visibility;
2 of the 10 systems involve communication between vehicles (V2V).
Again, as in the European sample (Figure 32), dangerous systems are ones considered to
interfere with riding or to potentially increase rider workload.
Figure 52: comparison of top 10 dangerous and useless safety systems (dataset: Belgium).
The safety systems considered most useful were largely supported by riders with a positive
attitude towards technology (for each system more than 50% of the riders considering these
systems to be useful belonged to the latter group; Figure 48). In the case of the systems
considered as being of least use, the ratings came from both sceptical riders and riders with a
positive attitude towards technology (Figure 49). However, technology-positive riders were in
the majority in the cases of alcohol detection and interlock, speed limiting systems and curve
speed warning, with their votes exceeding the second most numerous group by 20%. By
contrast, the dangerous rating for 8 of the 10 systems was supported uniformly by all groups,
with the exception of helmet mounted display and in-vehicle tutoring systems, which were
rated mostly by sceptical riders (Figure 50).
Description Dangerous UselessHelmet mounted display
Speed limiting systems
Intelligent speed adaptation
Rear view display / Rear view helmet
Continuous strobe lighting
Adaptive cruise control
Lane departure warning
Heads up display
Intersection collision avoidance
In-vehicle tutoring systems
Helmet reminder and interlock
Alcohol detection and interlock
Electronic licensing Smart cards
Driver vigilance / drowsiness monitoring
Curve speed warning
Following distance warning
40 Annex 3 - Intelligent Transport System for PTWs User Survey
3.4.2. France
To be included in the European dataset, the French dataset had to be subsampled, since 1817
valid answers were gained through the survey. All data, without any reduction, was processed
to derive the information presented in the next sections. Data was analysed on the basis of the
safety statement in section Error! Reference source not found. and compared with the
results of the European dataset.
Results
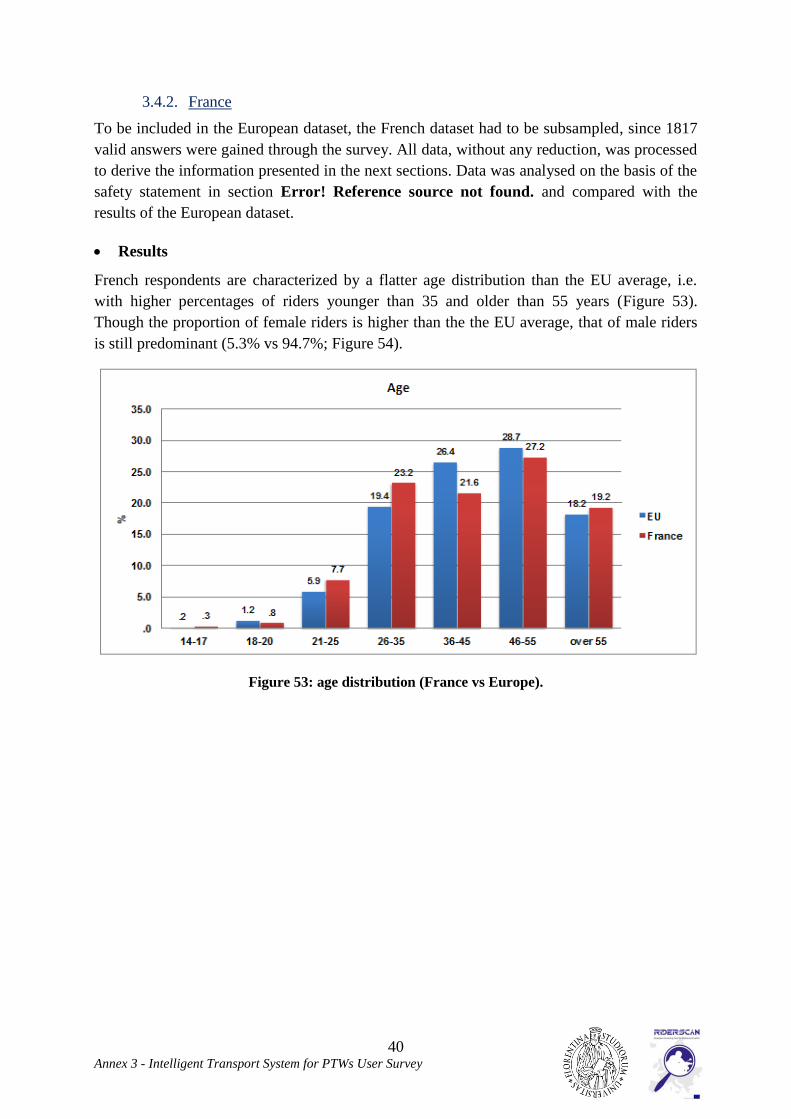
French respondents are characterized by a flatter age distribution than the EU average, i.e.
with higher percentages of riders younger than 35 and older than 55 years (Figure 53).
Though the proportion of female riders is higher than the the EU average, that of male riders
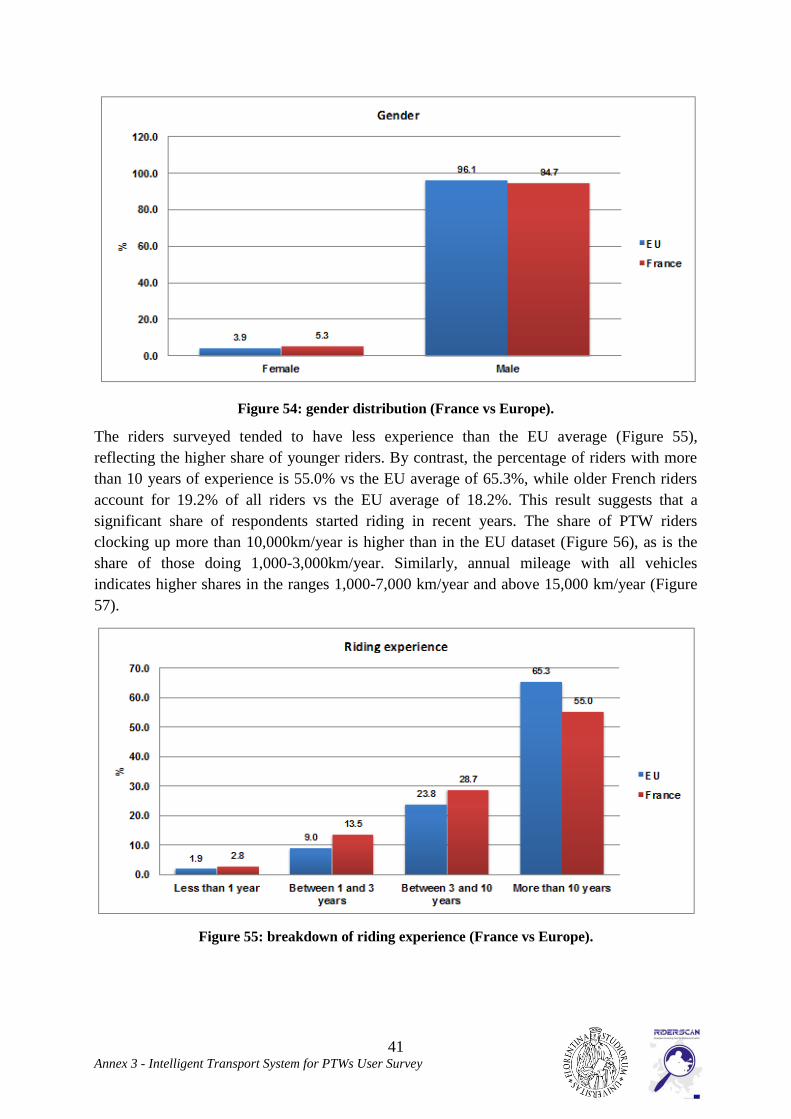
is still predominant (5.3% vs 94.7%; Figure 54).
Figure 53: age distribution (France vs Europe).
41 Annex 3 - Intelligent Transport System for PTWs User Survey
Figure 54: gender distribution (France vs Europe).
The riders surveyed tended to have less experience than the EU average (Figure 55),
reflecting the higher share of younger riders. By contrast, the percentage of riders with more
than 10 years of experience is 55.0% vs the EU average of 65.3%, while older French riders
account for 19.2% of all riders vs the EU average of 18.2%. This result suggests that a
significant share of respondents started riding in recent years. The share of PTW riders
clocking up more than 10,000km/year is higher than in the EU dataset (Figure 56), as is the
share of those doing 1,000-3,000km/year. Similarly, annual mileage with all vehicles
indicates higher shares in the ranges 1,000-7,000 km/year and above 15,000 km/year (Figure
57).
Figure 55: breakdown of riding experience (France vs Europe).

42 Annex 3 - Intelligent Transport System for PTWs User Survey
Figure 56: breakdown of annual mileage with PTW(s) (France vs Europe).
Figure 57: breakdown of annual mileage with all vehicles (France vs Europe).
In France there are two types of PTW dominate: Standard (38.9%; +12,6% vs EU dataset) and
Sport Touring (26.3%; +3.9% vs EU dataset; Figure 58). This is offset by smaller shares for
all remaining PTW types (e.g. scooter -6.4% vs EU dataset). Usage is concentrated
predominantly on commuting (44.2%) and leisure/short rides (47.5%) (Figure 59). Compared
to the EU dataset there is a larger share of commuters (+7.7%), and fewer leisure/short-
distance riders (-4.0%) and long-distance travellers (-3.5%). Means of transport usage patterns
differ greatly from the EU pattern, with PTWs the most commonly used means of transport
among the respondents (50.9%; +18.7% vs EU dataset; Figure 60). Other means of transport,
in decreasing order of relevance, are: car (41.0; -21.3% vs EU dataset), public transport
(4.4%; +1.2% vs EU dataset), and bicycle (2.9%; +1.1% vs EU dataset). The breakdown of
the most used means of transport vs PTW usage is in line with the EU dataset (Figure 61).

43 Annex 3 - Intelligent Transport System for PTWs User Survey
Figure 58: PTW type breakdown (France vs Europe).
Figure 59: breakdown of the preferred PTW usage (France vs Europe).

44 Annex 3 - Intelligent Transport System for PTWs User Survey
Figure 60: breakdown of the most commonly used means of transport (France vs Europe).
Figure 61: most commonly used means of transport vs PTW usage (dataset: France) – data sums
up to 100%.
Riders’ opinions on the relationship between technology and accidents reveal that a large
proportion are sceptical with regard to technology (45.4%; +16.6% vs EU dataset), while
technology-positive riders are much less frequent France (35.4%; -11.8% vs EU dataset;
Figure 62).

45 Annex 3 - Intelligent Transport System for PTWs User Survey
Figure 62: breakdown of the “safety statement” (France vs Europe).
Riders’ rankings of the most useful safety systems (definitely useful or essential for safety
ratings) are listed in Figure 63. A similar ranking was compiled on the basis of the answers of
technology-sceptical riders (Figure 64). The preferred deployment strategy of such systems
was for their installation to be optional (62.9% vs 37.1%; Figure 65).
Figure 63: 10 best safety systems/devices in decreasing order of relevance (dataset: France).

46 Annex 3 - Intelligent Transport System for PTWs User Survey
Figure 64: 10 best safety systems/devices in decreasing order of relevance, rated by riders with a
sceptical attitude towards technology (dataset: France).
Figure 65: installation modality of essential safety functions (France vs Europe).
A similar ranking of safety systems was done to identify those considered as being of least
use (Figure 66) or dangerous (Figure 67). This classification was crossed with the safety
statement to identify the contribution of each group of riders to the classification (Figure 68 to
Figure 70).

47 Annex 3 - Intelligent Transport System for PTWs User Survey
Figure 66: 10 systems/devices of least use for safety in decreasing order of relevance (dataset:
France).
Figure 67: 10 systems/devices most dangerous to safety in decreasing order of relevance
(dataset: France).

48 Annex 3 - Intelligent Transport System for PTWs User Survey
Figure 68: 10 best safety systems/devices vs the safety statement (dataset: France).
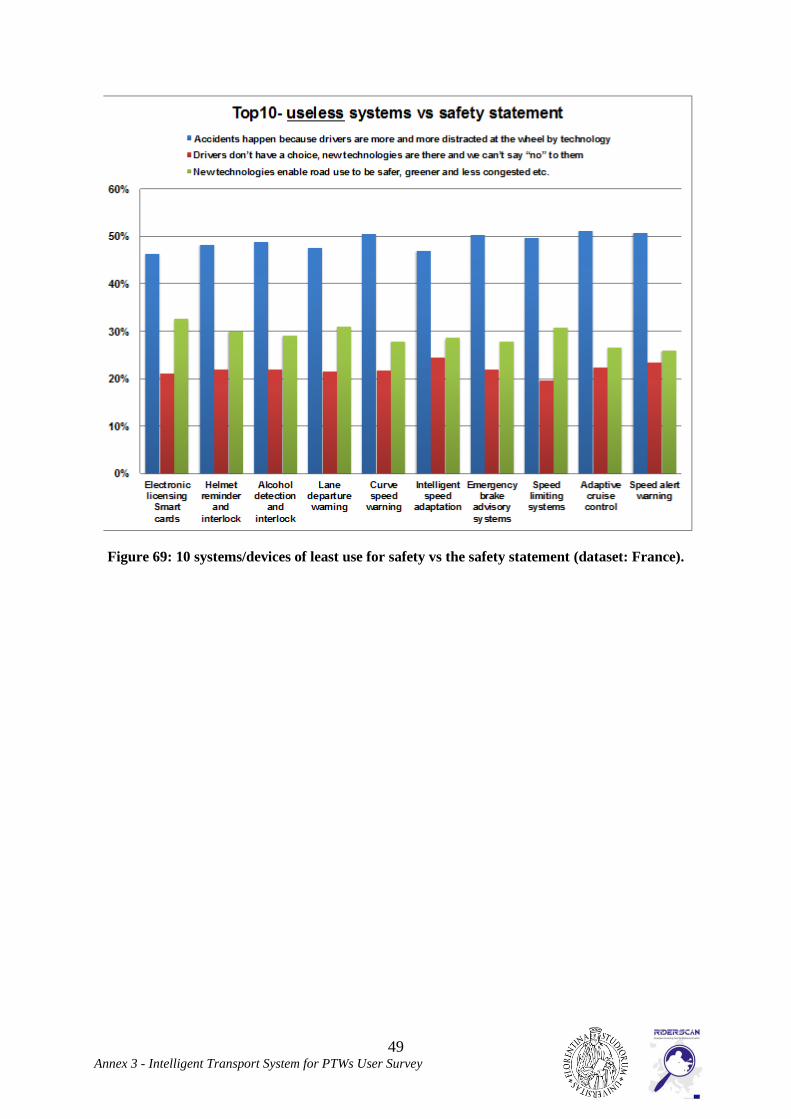
49 Annex 3 - Intelligent Transport System for PTWs User Survey
Figure 69: 10 systems/devices of least use for safety vs the safety statement (dataset: France).

50 Annex 3 - Intelligent Transport System for PTWs User Survey
Figure 70: 10 systems/devices most dangerous to safety vs the safety statement (dataset: France).
Discussion
In the French dataset age distribution was flatter than in the EU dataset, featuring a higher
share of younger and older riders (Figure 53). This was coupled with a lower level of riding
experience (Figure 55), and a higher share of high mileage (for both PTWs and all vehicles;
Figure 56 and Figure 57). Based on the analysis of the EU dataset, lower levels of experience
are associated with higher shares of technology-positive attitudes (Figure 17), while higher
mileage tends to correlate with a more sceptical attitude towards technology (Figure 18).
These contrasting trends could have neutralized the French assessment of the “safety
statement”, with the data showing that technology-sceptical riders are the largest group
(Figure 62).
The analysis of the 10 best PTW safety systems demonstrates broad support from the French
rider community, i.e. not just limited to technology-positive riders. In fact 9 of the 10 systems
were voted by more than 50% of the respondents (the 10th
system –airbag jackets– was rated
as useful by ‘only’ 47.1% of the respondents; Figure 63). Looked at in detail, support for
these systems came in a comparable way from both technology-sceptical and -positive riders
(Figure 68). This breakdown of riders’ opinions was reflected in the top 10 systems rated by
the technology-sceptical riders (Figure 64), 9 of which were in common with those rated as
such by all riders (Figure 71).
The segmentation of the 10 best systems by group shows that:

51 Annex 3 - Intelligent Transport System for PTWs User Survey
4 of the 10 systems are related to braking (all the systems available in this group);
3 of the 10 systems are related to lighting and visibility;
2 of the 10 systems are related to passive safety and post-crash systems;
1 of the 10 systems allows improved maintenance of the PTW.
Figure 71: comparison of top 10 best safety systems - full dataset vs sceptical riders (dataset:
France).
Ratings of systems considered as being of least use range from more than 50% (54.3%,
electronic licensing and smart cards; 52.7% helmet reminder and interlock) to 28.2% for the
speed alert warning (Figure 66). Support for such ratings comes mostly from the subset of
technology-sceptical riders (close to or above 50%; Figure 69). The same pattern, but with a
higher contribution from the technology-sceptical riders, is observed in the rating of systems
seen as dangerous (Figure 70). In their case, rating percentages range from a maximum of
24.3% (helmet-mounted display) to a minimum of 6.6.% (electronic licensing and smart
cards; Figure 67).
The comparison of systems seen as being of least use or dangerous shows a partial overlap (6
of the 10 are common (Figure 72)). Again the ones seen as dangerous are mostly systems
considered to interfere with riding or to increase rider workload. The breakdown of systems
seen as being of least use shows that:
3 of the 10 systems involve the rider fitness group;
3 of the 10 systems involve communication between vehicles and infrastructure (V2I);
2 of the 10 systems involve warning and information systems;
1 of the 10 systems is related to the passive and post-crash group;
1 of the 10 systems involves communication between vehicles (V2V).
The same analysis on the top 10 systems seen as dangerous shows that:
3 of the 10 systems involve warning and information systems;
3 of the 10 systems involve communication between vehicles and infrastructure (V2I)
(whole group);
2 of the 10 systems are related to lighting and visibility;
1 of the 10 systems belongs to the rider fitness group;
Description All ScepticVisibility improving helmet
ABS
Linked braking systems
Brake assist
Impact sensing cut-off
Adaptive front lighting
Vision enhancement
Tyre pressure monitoring
Curve ABS
Airbag jackets
Emergency lighting systems

52 Annex 3 - Intelligent Transport System for PTWs User Survey
1 of the 10 systems involves communication between vehicles (V2V).
Figure 72: comparison of the top 10 safety systems considered dangerous or of least use (dataset:
France).
3.4.3. Germany
The German dataset consisted of 797 valid answers. In the national analysis the German
dataset was not subsampled as was done when creating the EU dataset, i.e. all answers were
processed. Data was analysed on the basis of the safety statement in section Error!
Reference source not found. and compared with the results of the European dataset.
Results
The age distribution of German respondents showed a strong polarization in the range 46-55
years old (44.2%; +15.5% vs the EU dataset; Figure 73). Compared to the EU dataset there
were less riders in the 21-45 age range and only small difference in the remaining ranges.
Gender distribution was basically in line with the EU dataset, with variations of +/-1.4%
(Figure 74).
Description Dangerous UselessHelmet mounted display
Speed limiting systems
Continuous strobe lighting
Lane departure warning
Rear view display / Rear view helmet
Adaptive cruise control
Intelligent speed adaptation
Heads up display
Curve speed warning
Electronic licensing Smart cards
Helmet reminder and interlock
Alcohol detection and interlock
Emergency brake advisory systems
Speed alert warning

53 Annex 3 - Intelligent Transport System for PTWs User Survey
Figure 73: age distribution (Germany vs Europe).
Figure 74: gender distribution (Germany vs Europe).
German respondents have more riding experience than the EU sample, with 73.7% of them
having more than 10 years’ experience (+8.4% vs EU dataset; Figure 75). This higher share is
offset by all other levels of riding experience. Annual PTW mileage is more uniform in the
range 5,000-15,000km/year compared to the EU sample (each sub-range represents 20.6% to
22.1% of riders; Figure 76). By contrast, annual mileage with all vehicles is mainly in the
range above 15,000km/year (72.8%; +11.7% vs EU dataset; Figure 77). The higher share of
riders in this range is offset by lower values in the other mileage ranges.

54 Annex 3 - Intelligent Transport System for PTWs User Survey
Figure 75: breakdown of riding experience (Germany vs Europe).
Figure 76: breakdown of annual mileage with PTW(s) (Germany vs Europe).

55 Annex 3 - Intelligent Transport System for PTWs User Survey
Figure 77: breakdown of annual mileage with all vehicles (Germany vs Europe).
Four PTW types are commonly used in Germany: Standard (23.1%), sport touring (22.7%),
on/off-road (20.6%) and custom (16.2%; Figure 78). Using a PTW for commuting is less
common among German riders (17.2%; -19.3% vs EU dataset), while leisure and short rides
are more common (68.5%; +17.0% vs EU dataset), as is the case with long-distance travelling
(11.3%; +2.3% vs EU dataset; Figure 79). In line with previous data, the large majority of
German riders use a car as their most frequent means of transport (73.4%; +11.1% vs EU
dataset), while only 17.9% of them use a PTW (-14.3% vs EU dataset; Figure 80). Similarly,
bicycles and public transport are used more than the EU average (respectively +2.2% and
+1.2% vs EU dataset). Among the car users, 74.7% of them are leisure/short-distance riders,
while commuters and leisure riders feature fairly equally among regular PTW users (41.1% vs
44.0%; Figure 81).
Figure 78: PTW type breakdown (Germany vs Europe).

56 Annex 3 - Intelligent Transport System for PTWs User Survey
Figure 79: breakdown of preferred PTW usage (Germany vs Europe).
Figure 80: breakdown of the most commonly used means of transport (Germany vs Europe).

57 Annex 3 - Intelligent Transport System for PTWs User Survey
Figure 81: most commonly used means of transport vs PTW usage (dataset: Germany) – data
sums up at 100% on the most commonly used means of transport.
The riders were also asked to express their opinion on new technologies and their perceived
relationship to safety. The largest share of riders had a positive attitude towards technology
(49.4%), with only 14.4% considering technology as a factor contributing to accidents (Figure
82). In Germany the share of technology-positive riders differs slightly from the EU dataset
(+2.2%), while the share of technology-neutral riders is higher (36.1%; +12.1% vs EU
dataset), offsetting the smaller share of technology-sceptical riders.

58 Annex 3 - Intelligent Transport System for PTWs User Survey
Figure 82: breakdown of the “safety statement” (Germany vs Europe).
Riders’ rankings of the most useful safety systems (definitely useful or essential for safety
ratings) are listed in Figure 83. The same ranking was created on the basis of the answers of
technology-sceptical riders (Figure 84). The preferred deployment strategy of the systems was
for their installation to be optional (83.4% vs 16.6%; Figure 85).
Figure 83: 10 best safety systems/devices in decreasing order of relevance (dataset: Germany).

59 Annex 3 - Intelligent Transport System for PTWs User Survey
Figure 84: 10 best safety systems/devices in decreasing order of relevance, rated by riders with a
sceptical attitude towards technology (dataset: Germany).
Figure 85: installation modality of essential safety functions (Germany vs Europe).
A similar ranking of safety systems was done to identify the ones seen as being of least use
(Figure 86) or dangerous (Figure 87). This classification was crossed with the safety
statement to identify the contribution of each group of riders to the classification (Figure 88 to
Figure 90).

60 Annex 3 - Intelligent Transport System for PTWs User Survey
Figure 86: 10 systems/devices of least use for safety in decreasing order of relevance (dataset:
Germany).
Figure 87: 10 systems/devices most dangerous to safety in decreasing order of relevance
(dataset: Germany).

61 Annex 3 - Intelligent Transport System for PTWs User Survey
Figure 88: 10 best safety systems/devices vs the safety statement (dataset: Germany).

62 Annex 3 - Intelligent Transport System for PTWs User Survey
Figure 89: 10 systems/devices of least use for safety vs the safety statement (dataset: Germany).

63 Annex 3 - Intelligent Transport System for PTWs User Survey
Figure 90: 10 systems/devices most dangerous to safety vs the safety statement (dataset:
Germany).
Discussion
The German dataset featured answers from highly experienced riders (Figure 75), with a large
share of middle-aged riders (44.2% of 46-55 years old riders; Figure 73). Annual PTW
mileage is mostly in the range 5,000-15,000km/year (63.7% overall; Figure 76), but generally
exceeds 15,000km/year with all vehicles (72.8%; Figure 77). The four main PTW types
(standard, sport touring, on/off-road and custom; Figure 78), are used mostly by leisure riders
(68.5%; Figure 79). With this profile, German riders are generally positive or neutral towards
technology (85.5% overall; Figure 82).
The analysis of the 10 best systems for PTW safety shows that the top 3 safety systems are
rated as such by more than 50% of riders: ABS (65.8%), brake assist (50.8%) and visibility
improving helmet (50.1%; Figure 83). The remaining systems were considered highly relevant
for safety by 49.2% to 33.8% of riders. This rating was largely supported by technology-
positive riders (above 60% for each system; Figure 88), who are over-represented in their
assessment of this group of systems compared to the breakdown reflected in attitudes towards
the safety statement. Although the latter ranking was not driven by the opinions of
technology-sceptical riders, a comparison with the best safety systems as viewed by this
subgroup of riders shows that 9 of the 10 systems are in common with the opinion of all
German riders (Figure 91). The breakdown of the best safety systems shows that:

64 Annex 3 - Intelligent Transport System for PTWs User Survey
4 of the 10 systems are related to braking (all the systems available in this group);
3 of the 10 systems are related to lighting and visibility;
1 of the 10 systems is related to passive and post-crash systems;
1 of the 10 systems allow improved maintenance of the PTW;
1 of the 10 systems involves rider warning and information systems.
Figure 91: comparison of 10 best safety systems - full dataset vs sceptical riders (dataset:
Germany).
Ratings for systems seen as being of least use range from 62.3% (helmet reminder and
interlock) to 33.2% (traffic sign recognition; Figure 86). In the ratings, technology-neutral
riders were over-represented compared to the breakdown regarding the safety statement
(Figure 89) and exceeded the share of technology-positive riders for most of the systems. The
highest difference between technology-neutral and -positive riders is found for driver
vigilance / drowsiness monitoring and curve speed warning, with the former rider group
exceeding the latter. The breakdown of systems viewed as being of least use shows that:
5 of the 10 systems involve rider warning and information systems group;
3 of the 10 systems involve rider fitness group;
1 of the 10 systems involves communication between vehicles and infrastructure
(V2I);
1 of the 10 systems is related to lighting and visibility.
Ratings of systems considered as dangerous range from 41.2% (rear view display / rear view
helmet) to 16.8% (motorcycle approaching warning system; Figure 87). Ranking was
supported by technology-neutral riders (always the largest group) and to different extents by
technology-sceptical and -positive riders (Figure 90): However, technology-positive riders are
under-represented compared to the breakdown regarding the safety statement. The analysis of
the top 10 dangerous systems showed the following:
3 of the 10 systems involve communication between vehicles and infrastructure (V2I)
(whole group);
3 of the 10 systems involve communication between vehicles (V2V) (whole group);
2 of the 10 systems involve rider fitness group;
Description All ScepticABS 1Brake assist 2Visibility improving helmet 3Curve ABS 4DRL 5Linked braking systems 6Tyre pressure monitoring 7Navigation systems 8Impact sensing cut-off 9Vision enhancement 10Electronic licensing Smart cards 17
Description Dangerous UselessRear view display / Rear view helmet 1Intelligent speed adaptation 2Helmet mounted display 3Lane departure warning 4Intersection collision avoidance 5Speed limiting systems 6Continuous strobe lighting 7Adaptive cruise control 8Heads up display 9Motorcycle approaching warning system 10Helmet reminder and interlock 11Alcohol detection and interlock 12Speed alert warning 13Weather warning 14Forward collision warning 15Driver vigilance / drowsiness monitoring 16Curve speed warning 18Traffic sign recognition 20

65 Annex 3 - Intelligent Transport System for PTWs User Survey
2 of the 10 systems are related to lighting and visibility.
A comparison of the systems identified as being dangerous or of least use shows that only 2 of
the 10 systems (i.e. intelligent speed adaptation, and continuous strobe lighting) are common
to both sets (Figure 92). While the dangerous set is more focused on V2X systems (6 of the
10), perceived as interfering more with riding, rider warning and information systems (5 of
the 10) are seen as being of least use.
Figure 92: comparison of the top 10 safety systems seen as dangerous or of least use (dataset:
Germany).
3.4.4. Greece
The Greek dataset was processed almost entirely within the EU dataset, with 170 of 175 valid
answers being used. In the following the entire dataset was processed on the basis of the
safety statement in section Error! Reference source not found. and compared to the results
of the European dataset.
Results
The Greek data shows that riders are generally younger than the EU average, concentrated in
the 26-45 age range (26-35: 36.0%, +16.6% vs EU dataset; 36-45: 39.4%, +13.0% vs EU
dataset respectively; Figure 93). By contrast, gender distribution is in line with the EU dataset
(Figure 94).
Description All ScepticABS 1Brake assist 2Visibility improving helmet 3Curve ABS 4DRL 5Linked braking systems 6Tyre pressure monitoring 7Navigation systems 8Impact sensing cut-off 9Vision enhancement 10Electronic licensing Smart cards 17
Description Dangerous UselessRear view display / Rear view helmet 1Intelligent speed adaptation 2Helmet mounted display 3Lane departure warning 4Intersection collision avoidance 5Speed limiting systems 6Continuous strobe lighting 7Adaptive cruise control 8Heads up display 9Motorcycle approaching warning system 10Helmet reminder and interlock 11Alcohol detection and interlock 12Speed alert warning 13Weather warning 14Forward collision warning 15Driver vigilance / drowsiness monitoring 16Curve speed warning 18Traffic sign recognition 20

66 Annex 3 - Intelligent Transport System for PTWs User Survey
Figure 93: age distribution (Greece vs Europe).
Figure 94: gender distribution (Greece vs Europe).
The riding experience of Greek riders is similar to the EU sample, with minor variations
(Figure 95). Annual PTW mileage shows higher values, with more riders exceeding 10,000
km/year (21.7%, +2.0% vs EU dataset in the 10,000-15,000 km/year; 17.7%, +5.0% vs EU
dataset in the range above 15,000 km/year; Figure 96). By contrast, mileage with all vehicles
shows the reverse trend, with only 44.6% of riders driving more than 15,000 km/year (-16.5%
vs EU dataset; Figure 97). All other annual mileage ranges are accordingly more populated.

67 Annex 3 - Intelligent Transport System for PTWs User Survey
Figure 95: breakdown of riding experience (Greece vs Europe).
Figure 96: breakdown of annual mileage with PTW(s) (Greece vs Europe).
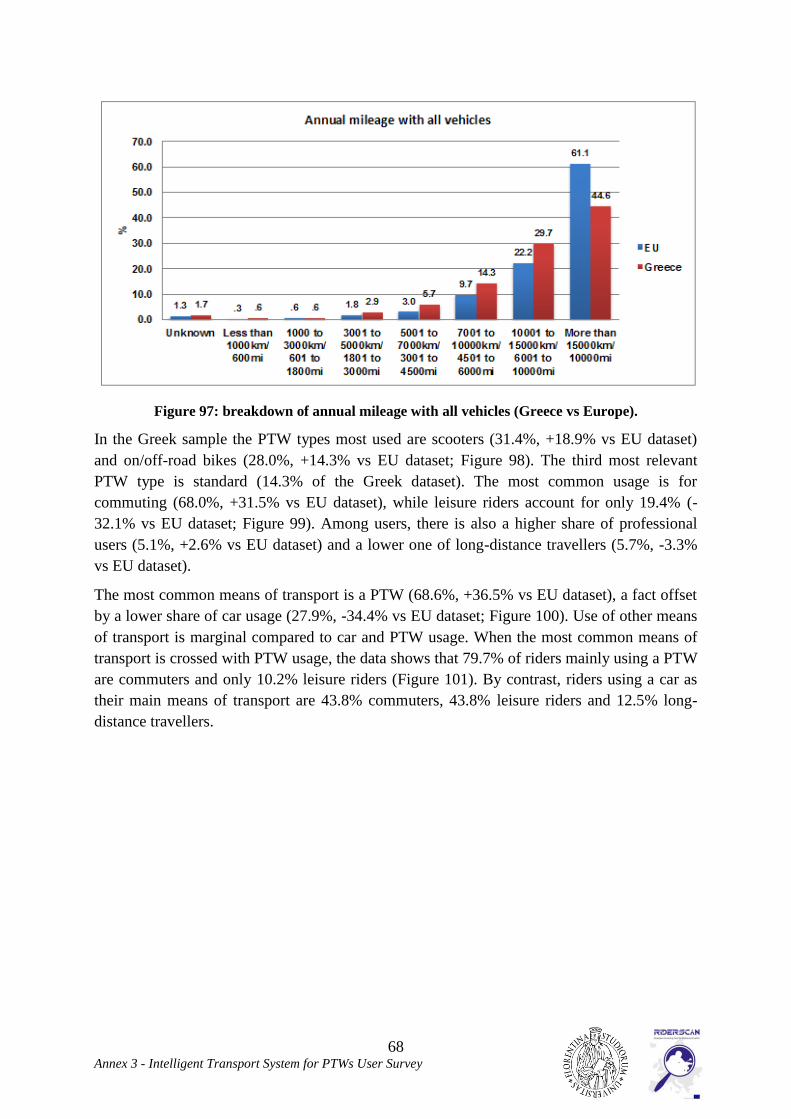
68 Annex 3 - Intelligent Transport System for PTWs User Survey
Figure 97: breakdown of annual mileage with all vehicles (Greece vs Europe).
In the Greek sample the PTW types most used are scooters (31.4%, +18.9% vs EU dataset)
and on/off-road bikes (28.0%, +14.3% vs EU dataset; Figure 98). The third most relevant
PTW type is standard (14.3% of the Greek dataset). The most common usage is for
commuting (68.0%, +31.5% vs EU dataset), while leisure riders account for only 19.4% (-
32.1% vs EU dataset; Figure 99). Among users, there is also a higher share of professional
users (5.1%, +2.6% vs EU dataset) and a lower one of long-distance travellers (5.7%, -3.3%
vs EU dataset).
The most common means of transport is a PTW (68.6%, +36.5% vs EU dataset), a fact offset
by a lower share of car usage (27.9%, -34.4% vs EU dataset; Figure 100). Use of other means
of transport is marginal compared to car and PTW usage. When the most common means of
transport is crossed with PTW usage, the data shows that 79.7% of riders mainly using a PTW
are commuters and only 10.2% leisure riders (Figure 101). By contrast, riders using a car as
their main means of transport are 43.8% commuters, 43.8% leisure riders and 12.5% long-
distance travellers.

69 Annex 3 - Intelligent Transport System for PTWs User Survey
Figure 98: PTW type distribution (Greece vs Europe).
Figure 99: breakdown of the preferred PTW usage (Greece vs Europe).

70 Annex 3 - Intelligent Transport System for PTWs User Survey
Figure 100: breakdown of the most commonly used means of transport (Greece vs Europe).
Figure 101: most commonly used means of transport vs PTW usage (dataset: Greece) – data
sum up at 100% on the most commonly used means of transport.
Riders were also asked to express their opinion on new technologies and their perceived
relationship with safety. A large majority (68.6%) had a positive attitude towards technology,
while the remaining riders are equally distributed between neutral and sceptical attitudes
(respectively 15.4% and 16.0% of the dataset; Figure 102).

71 Annex 3 - Intelligent Transport System for PTWs User Survey
Figure 102: breakdown of the “safety statement” (Greece vs Europe).
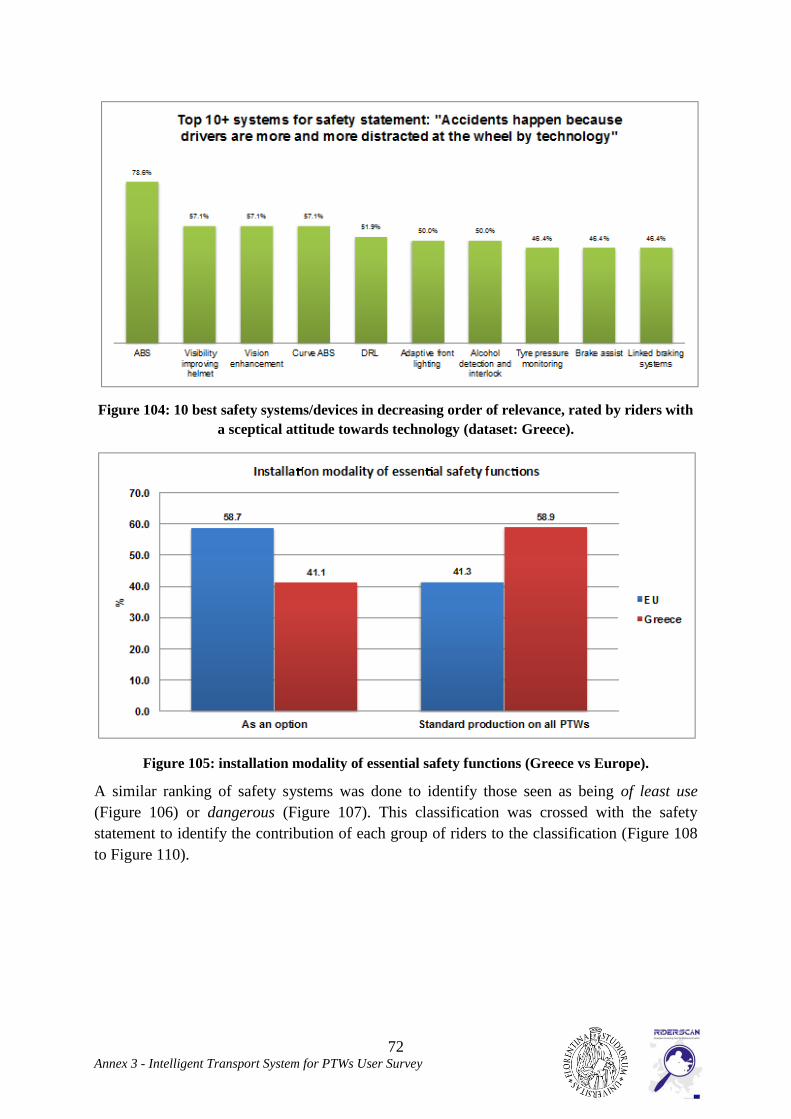
Riders’ rankings of the safety systems seen as most useful (definitely useful or essential for
safety ratings) are listed in Figure 103. A similar ranking was created on the basis of the
answers of technology-sceptical riders (Figure 104). The preferred deployment strategy of the
systems was that their installation be optional on PTWs (83.4% vs 16.6%; Figure 105).
Figure 103: 10 best safety systems/devices in decreasing order of relevance (dataset: Greece).
72 Annex 3 - Intelligent Transport System for PTWs User Survey
Figure 104: 10 best safety systems/devices in decreasing order of relevance, rated by riders with
a sceptical attitude towards technology (dataset: Greece).
Figure 105: installation modality of essential safety functions (Greece vs Europe).
A similar ranking of safety systems was done to identify those seen as being of least use
(Figure 106) or dangerous (Figure 107). This classification was crossed with the safety
statement to identify the contribution of each group of riders to the classification (Figure 108
to Figure 110).

73 Annex 3 - Intelligent Transport System for PTWs User Survey
Figure 106: 10 systems/devices of least use for safety in decreasing order of relevance (dataset:
Greece).
Figure 107: 10 systems/devices most dangerous to safety in decreasing order of relevance
(dataset: Greece).

74 Annex 3 - Intelligent Transport System for PTWs User Survey
Figure 108: 10 best safety systems/devices vs the safety statement (dataset: Greece).

75 Annex 3 - Intelligent Transport System for PTWs User Survey
Figure 109: 10 systems/devices of least use for safety vs the safety statement (dataset: Greece).
76 Annex 3 - Intelligent Transport System for PTWs User Survey
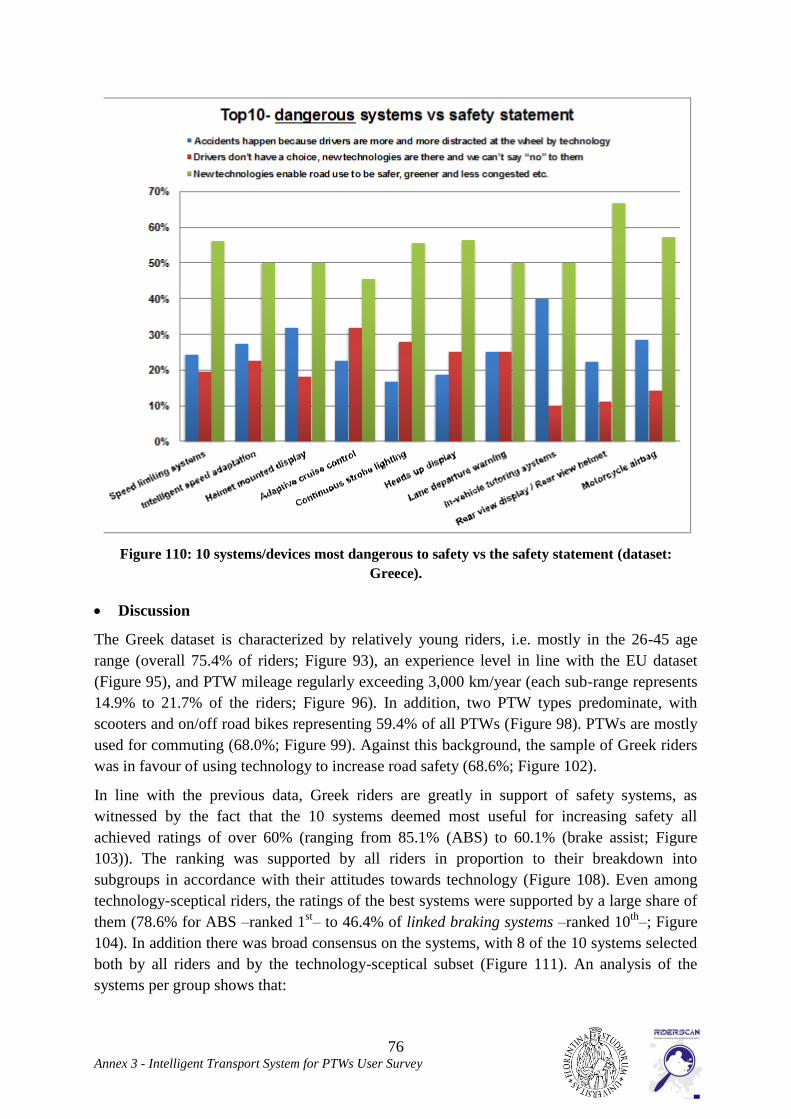
Figure 110: 10 systems/devices most dangerous to safety vs the safety statement (dataset:
Greece).
Discussion
The Greek dataset is characterized by relatively young riders, i.e. mostly in the 26-45 age
range (overall 75.4% of riders; Figure 93), an experience level in line with the EU dataset
(Figure 95), and PTW mileage regularly exceeding 3,000 km/year (each sub-range represents
14.9% to 21.7% of the riders; Figure 96). In addition, two PTW types predominate, with
scooters and on/off road bikes representing 59.4% of all PTWs (Figure 98). PTWs are mostly
used for commuting (68.0%; Figure 99). Against this background, the sample of Greek riders
was in favour of using technology to increase road safety (68.6%; Figure 102).
In line with the previous data, Greek riders are greatly in support of safety systems, as
witnessed by the fact that the 10 systems deemed most useful for increasing safety all
achieved ratings of over 60% (ranging from 85.1% (ABS) to 60.1% (brake assist; Figure
103)). The ranking was supported by all riders in proportion to their breakdown into
subgroups in accordance with their attitudes towards technology (Figure 108). Even among
technology-sceptical riders, the ratings of the best systems were supported by a large share of
them (78.6% for ABS –ranked 1st– to 46.4% of linked braking systems –ranked 10
th–; Figure
104). In addition there was broad consensus on the systems, with 8 of the 10 systems selected
both by all riders and by the technology-sceptical subset (Figure 111). An analysis of the
systems per group shows that:

77 Annex 3 - Intelligent Transport System for PTWs User Survey
4 of the 10 systems are related to braking (all the systems available in this group);
3 of the 10 systems are related to lighting and visibility;
2 of the 10 systems allow improved maintenance of the PTW (all the systems
available in this group);
1 of the 10 systems is related to passive and post-crash systems.
Figure 111: comparison of the 10 best safety systems - full dataset vs sceptical riders (dataset:
Greece).
Ratings of systems deemed to be of least use were supported by an average of 20% of Greek
riders (26.6% for speed limiting systems –ranked 1st– to 15.4% for traffic sign recognition –
ranked 10th
–; Figure 106). In this ranking the contribution of technology-positive riders is
underrepresented compared to the breakdown with regard to the safety statement (Figure 109
and Figure 102). The breakdown of the systems considered to be of least use shows that:
4 of the 10 systems involve warning and information systems;
3 of the 10 systems involve communication between vehicles and infrastructure (V2I)
(whole group);
2 of the 10 systems involve rider fitness group;
1 of the 10 systems belongs to communication between vehicles (V2V).
Regarding the systems considered as dangerous, only the 1st (speed limiting systems) was
voted by a significant share of riders (23.7%), while the remaining 9 systems were voted by a
maximum of 12.8% (intelligent speed adaptation) to a minimum of 4.1% (motorcycle airbag)
of riders (Figure 107). The contribution to the ranking resembles the one for systems of least
use (Figure 110). The group analysis of the top 10 dangerous systems has the following
results:
3 of the 10 systems involve communication between vehicles and infrastructure (V2I)
(whole group);
3 of the 10 systems involve warning and information systems;
2 of the 10 systems are related to lighting and visibility;
1 of the 10 systems is related to the passive and post-crash group;
Description All ScepticABS 1Curve ABS 2Tyre pressure monitoring 3Vision enhancement 4Visibility improving helmet 5Vehicle diagnostics 6Linked braking systems 7DRL 8Emergency lighting systems 9Brake assist 10Adaptive front lighting 16Alcohol detection and interlock 17
Description Dangerous UselessSpeed limiting systems 1Intelligent speed adaptation 2Helmet mounted display 3Adaptive cruise control 4Continuous strobe lighting 5Heads up display 6Lane departure warning 7In-vehicle tutoring systems 8Rear view display / Rear view helmet 9Motorcycle airbag 10Speed alert warning 12Traffic warning 16Helmet reminder and interlock 17Electronic licensing Smart cards 19Traffic sign recognition 20

78 Annex 3 - Intelligent Transport System for PTWs User Survey
1 of the 10 systems involves communication between vehicles (V2V).
The V2I systems were in particular rated both as being both of least use and dangerous, and
are included among the 5 systems common to both rankings (Figure 112). In addition, the
warning and information systems received negative feedback, although different systems were
for the most part selected in the two subsets.
Figure 112: comparison of the top 10 safety systems seen as dangerous or of least use (dataset:
Greece).
3.4.5. Italy
The Italian dataset (490 valid answers) was entirely included in the EU dataset, since it was
used to carry out normalization of the EU dataset. In the following sections the results of the
national analysis, performed on the basis of the safety statement in section Error! Reference
source not found., are presented and compared to the results of the European dataset.
Results
The Italian dataset features riders younger than the EU average (Figure 114): in fact there
are more riders in the 18-45 age range, a fact offset by fewer riders in 45+ age range. The
gender distribution approximates to the EU average, though with slightly fewer female
riders (-2.3% vs EU dataset; Figure 114).
Description All ScepticABS 1Curve ABS 2Tyre pressure monitoring 3Vision enhancement 4Visibility improving helmet 5Vehicle diagnostics 6Linked braking systems 7DRL 8Emergency lighting systems 9Brake assist 10Adaptive front lighting 16Alcohol detection and interlock 17
Description Dangerous UselessSpeed limiting systems 1Intelligent speed adaptation 2Helmet mounted display 3Adaptive cruise control 4Continuous strobe lighting 5Heads up display 6Lane departure warning 7In-vehicle tutoring systems 8Rear view display / Rear view helmet 9Motorcycle airbag 10Speed alert warning 12Traffic warning 16Helmet reminder and interlock 17Electronic licensing Smart cards 19Traffic sign recognition 20

79 Annex 3 - Intelligent Transport System for PTWs User Survey
Figure 113: age distribution (Italy vs Europe).
Figure 114: gender distribution (Italy vs Europe).
Riding experience is in line with the EU average, with minor variations in the 3-10 years’
range (Figure 115). By contrast, annual PTW mileage features lower values, with all ranges
up to 10,000 km/year exceeding the EU averages (Figure 117). Specifically, 68.8% of riders
clock up 3,000-10,000 km/year. The same trend can be noted in the annual mileage with all
vehicles, with only 48.4% of riders driving more than 15,000 km/year (-12.7% vs EU dataset;
Figure 117).

80 Annex 3 - Intelligent Transport System for PTWs User Survey
Figure 115: breakdown of riding experience (Italy vs Europe).
Figure 116: breakdown of annual mileage with PTW(s) (Italy vs Europe).

81 Annex 3 - Intelligent Transport System for PTWs User Survey
Figure 117: breakdown of annual mileage with all vehicles (Italy vs Europe).
Though scooters are the most common PTW type (21.6%), other types also exceed 10% of the
dataset: standard (20.0%), sport touring (18.6%) and on/off-road (14.7). The breakdown
generally differs from that of the EU dataset, being more uniform (Figure 118). Preferred
PTW usage resembles that of the EU dataset, though with a smaller share of commuters
(32.4% vs 36.5% of EU dataset) and long-distance travellers (9.0% vs 6.9% of EU dataset),
and a higher one of leisure riders (57.8% vs 51.5% of the EU dataset; Figure 119).
The most common means of transport is car (79.2%; +16.9% vs EU dataset), a very high
proportion compared to that of PTWs (14.6%; -17.6% vs EU dataset; Figure 120). An in-
depth analysis of usage vs the most common means of transport shows that regular PTW users
are mostly commuters (71.8%), while car users predominantly use their motorbikes for leisure
(64.9%; Figure 121).
Figure 118: PTW type distribution (Italy vs Europe).

82 Annex 3 - Intelligent Transport System for PTWs User Survey
Figure 119: breakdown of preferred PTW usage (Italy vs Europe).
Figure 120: breakdown of the most commonly used means of transport (Italy vs Europe).
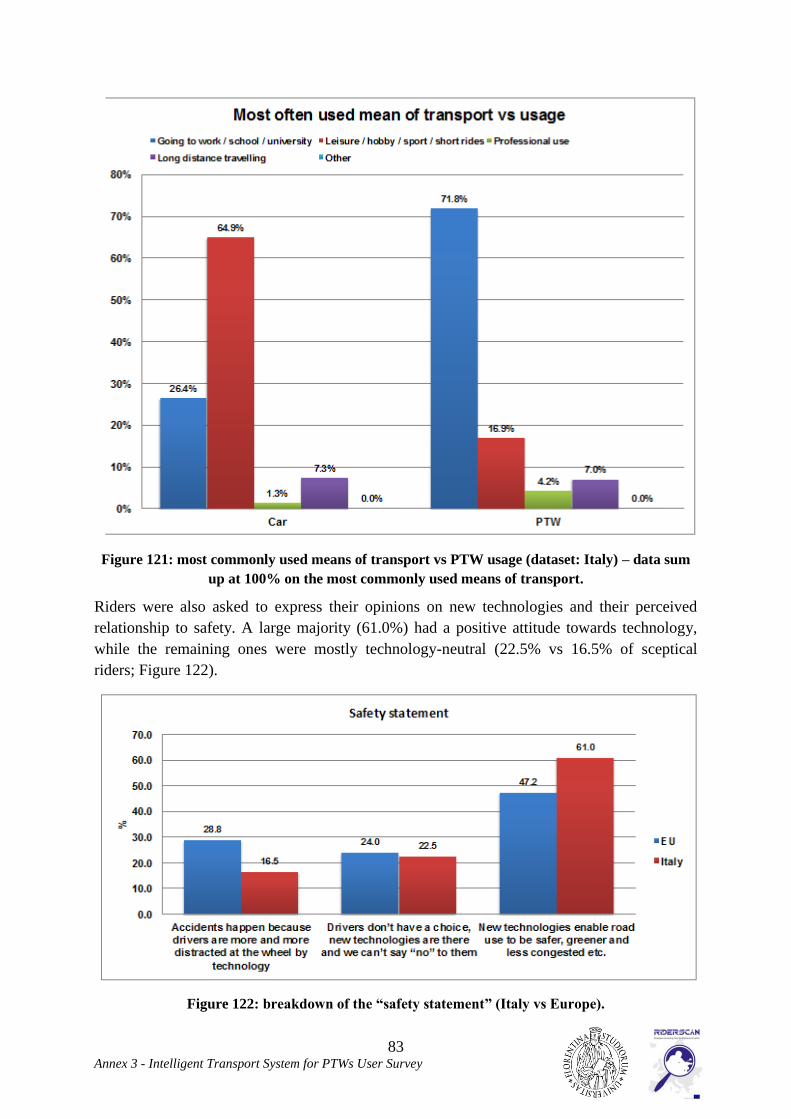
83 Annex 3 - Intelligent Transport System for PTWs User Survey
Figure 121: most commonly used means of transport vs PTW usage (dataset: Italy) – data sum
up at 100% on the most commonly used means of transport.
Riders were also asked to express their opinions on new technologies and their perceived
relationship to safety. A large majority (61.0%) had a positive attitude towards technology,
while the remaining ones were mostly technology-neutral (22.5% vs 16.5% of sceptical
riders; Figure 122).
Figure 122: breakdown of the “safety statement” (Italy vs Europe).

84 Annex 3 - Intelligent Transport System for PTWs User Survey
Riders’ rankings of the most useful safety systems (definitely useful or essential for safety
ratings) are listed in Figure 123. A similar ranking was created on the basis of the answers of
technology-sceptical riders (Figure 124). The preferred deployment strategy of the systems
was that their installation be optional (69.2% vs 30.8%; Figure 125).
Figure 123: 10 best safety systems/devices in decreasing order of relevance (dataset: Italy).
Figure 124: 10 best safety systems/devices in decreasing order of relevance, rated by riders with
a sceptical attitude towards technology (dataset: Italy).

85 Annex 3 - Intelligent Transport System for PTWs User Survey
Figure 125: installation modality of essential safety functions (Italy vs Europe).
A similar ranking was done to identify the safety systems seen as having the least use (Figure
126) or dangerous (Figure 127). This classification was crossed with the safety statement to
identify the contribution of each group of riders to the classification (Figure 128 to Figure
130).
Figure 126: 10 systems/devices of least use for safety in decreasing order of relevance (dataset:
Italy).

86 Annex 3 - Intelligent Transport System for PTWs User Survey
Figure 127: 10 systems/devices most dangerous to safety in decreasing order of relevance
(dataset: Italy).
Figure 128: 10 best safety systems/devices vs the safety statement (dataset: Italy).

87 Annex 3 - Intelligent Transport System for PTWs User Survey
Figure 129: 10 systems/devices of least use for safety vs the safety statement (dataset: Italy).

88 Annex 3 - Intelligent Transport System for PTWs User Survey
Figure 130: 10 systems/devices most dangerous to safety vs the safety statement (dataset: Italy).
Discussion
The riders in the Italian dataset were generally younger than the EU average (Figure 113),
though their riding experience was in line with EU data (Figure 115). Annual PTW mileage
was lower than the EU average (Figure 116), as was annual mileage with all vehicles (Figure
117). The most common type of PTW used was a scooter, followed by standard, sport touring
and on/off-road bikes (representing 74.9% of all PTWs (Figure 118)). Although scooters were
the most common type of PTW, leisure riders accounted for 57.8% of all riders and
commuters for only 32.4% (Figure 119). Italian riders (61.0%) stated that technology has the
potential to support safer riding (Figure 122).
The results of the “safety statement” were in line with the share of riders voting for the 10
most useful safety systems: 80.8% for ABS –ranked 1st– to 55.6% for vehicle diagnostics –
ranked 10th
(Figure 123). The breakdown of votes resembled that for the “safety statement”
(Figure 128). The latter ranking was similar to the one made by technology-sceptical riders,
with 8 of the 10 safety systems common to both categories of riders (Figure 131). Moreover,
in the Italian case there was a strong statement by this subset of riders, with 71.3% of them
supporting vision enhancement –ranked 1st– and 44.4% adaptive front lighting –ranked 10
th–
(Figure 124). An analysis of the systems per group shows that:
2 of the 10 systems are related to braking;

89 Annex 3 - Intelligent Transport System for PTWs User Survey
2 of the 10 systems are related to rider fitness;
2 of the 10 systems are related to lighting and visibility;
2 of the 10 systems allow improved maintenance and diagnostic of the PTW (the 2
systems available in this group);
2 of the 10 systems are related to passive and post-crash systems.
The majority of riders (69.2%) stated that systems useful for safety should be installed as
standard on all PTWs (Figure 125).
Figure 131: comparison of the 10 best safety systems - full dataset vs sceptical riders (dataset:
Italy).
Fewer systems were rated as being of little use: 29.9% of riders supported electronic licensing
and smart cards –ranked 1st– and 15.8% weather warning –ranked 10
th– (Figure 126). Only
the first three systems were voted by more than 20% of riders, confirming the generally
positive attitude towards technology. The breakdown of votes showed an overrepresentation
of technology-sceptical and -neutral riders (Figure 129).
A similar trend can be seen for systems deemed to be dangerous: the ranking is based mainly
on the votes of a small share of riders (Figure 127). Only the most dangerous system, helmet
mounted displays, was voted by 22.3% of riders, while all remaining ones were rated between
14.0% (heads up display) and 4.1% (brake assist). Such small percentages constitute a major
limitation to the validity of the ranking (4.1% corresponds to 20 riders). The breakdown of
votes shows an under-representation of technology-positive riders, as in the ranking of those
systems considered to be of least use (Figure 130).
A comparison of those systems considered to be of least use or dangerous shows that 5 of the
10 systems are common to the two subsets (Figure 132): 2 of them belong to the V2I group
and 2 to lighting and visibility. A more detailed analysis of the systems seen as being of least
use shows that:
3 of the 10 systems involve rider warnings and information systems;
3 of the 10 systems involve communication between vehicles and infrastructure (V2I)
(whole group);
Description All ScepticABS 1Visibility improving helmet 2Vision enhancement 3Curve ABS 4Tyre pressure monitoring 5Airbag jackets 6Driver vigilance / drowsiness monitoring 7Impact sensing cut-off 8Alcohol detection and interlock 9Vehicle diagnostics 10Blind spot assistance 18Adaptive front lighting 20
Description Dangerous UselessHelmet mounted display 1Heads up display 2Speed limiting systems 3Continuous strobe lighting 4Rear view display / Rear view helmet 5Intelligent speed adaptation 6Adaptive cruise control 7Curve speed warning 8Linked braking systems 9Brake assist 10Electronic licensing Smart cards 11Speed alert warning 15Helmet reminder and interlock 17Lane departure warning 18Weather warning 20
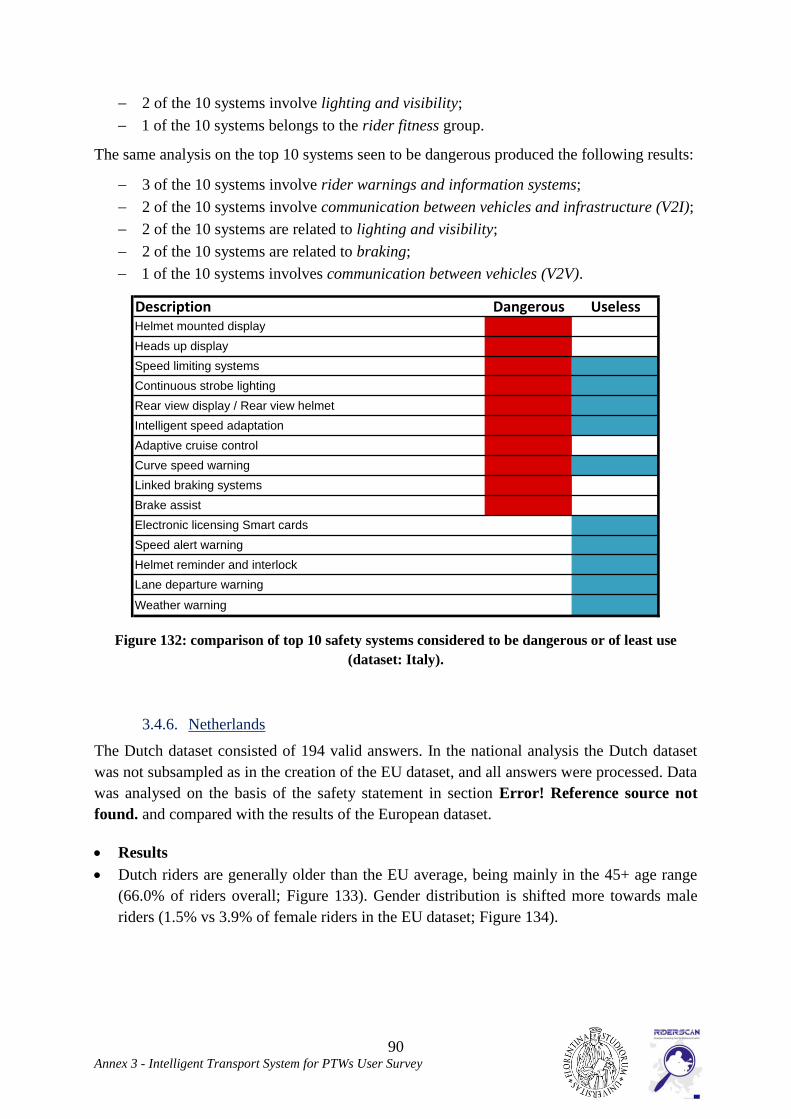
90 Annex 3 - Intelligent Transport System for PTWs User Survey
2 of the 10 systems involve lighting and visibility;
1 of the 10 systems belongs to the rider fitness group.
The same analysis on the top 10 systems seen to be dangerous produced the following results:
3 of the 10 systems involve rider warnings and information systems;
2 of the 10 systems involve communication between vehicles and infrastructure (V2I);
2 of the 10 systems are related to lighting and visibility;
2 of the 10 systems are related to braking;
1 of the 10 systems involves communication between vehicles (V2V).
Figure 132: comparison of top 10 safety systems considered to be dangerous or of least use
(dataset: Italy).
3.4.6. Netherlands
The Dutch dataset consisted of 194 valid answers. In the national analysis the Dutch dataset
was not subsampled as in the creation of the EU dataset, and all answers were processed. Data
was analysed on the basis of the safety statement in section Error! Reference source not
found. and compared with the results of the European dataset.
Results
Dutch riders are generally older than the EU average, being mainly in the 45+ age range
(66.0% of riders overall; Figure 133). Gender distribution is shifted more towards male
riders (1.5% vs 3.9% of female riders in the EU dataset; Figure 134).
Description All ScepticABS 1Visibility improving helmet 2Vision enhancement 3Curve ABS 4Tyre pressure monitoring 5Airbag jackets 6Driver vigilance / drowsiness monitoring 7Impact sensing cut-off 8Alcohol detection and interlock 9Vehicle diagnostics 10Blind spot assistance 18Adaptive front lighting 20
Description Dangerous UselessHelmet mounted display 1Heads up display 2Speed limiting systems 3Continuous strobe lighting 4Rear view display / Rear view helmet 5Intelligent speed adaptation 6Adaptive cruise control 7Curve speed warning 8Linked braking systems 9Brake assist 10Electronic licensing Smart cards 11Speed alert warning 15Helmet reminder and interlock 17Lane departure warning 18Weather warning 20

91 Annex 3 - Intelligent Transport System for PTWs User Survey
Figure 133: age distribution (Netherlands vs Europe).
Figure 134: gender distribution (Netherlands vs Europe).
Looking at riding experience, we find a larger share of riders with more than 10 years of
experience (76.8%; +11.5% vs EU dataset; Figure 135). This result is coupled with a
generally higher annual PTW mileage (exceeding 10,000 km/year): 23.2% in the 10,000-
15,000 km/year range (+3.5% vs EU dataset), and 20.6% above 15,000 km/year (+7.9% vs
EU dataset; Figure 136). The difference is mainly offset in the 3,000-10,000 km/year range.
This trend is confirmed by the annual mileage with all vehicles, with 82.0% of riders having a
mileage in excess of 15,000 km/year (+20.9% vs EU dataset; Figure 137). This higher
mileage was again offset across all the other mileage ranges.

92 Annex 3 - Intelligent Transport System for PTWs User Survey
Figure 135: breakdown of riding experience (Netherlands vs Europe).
Figure 136: breakdown of annual mileage with PTW(s) (Netherlands vs Europe).
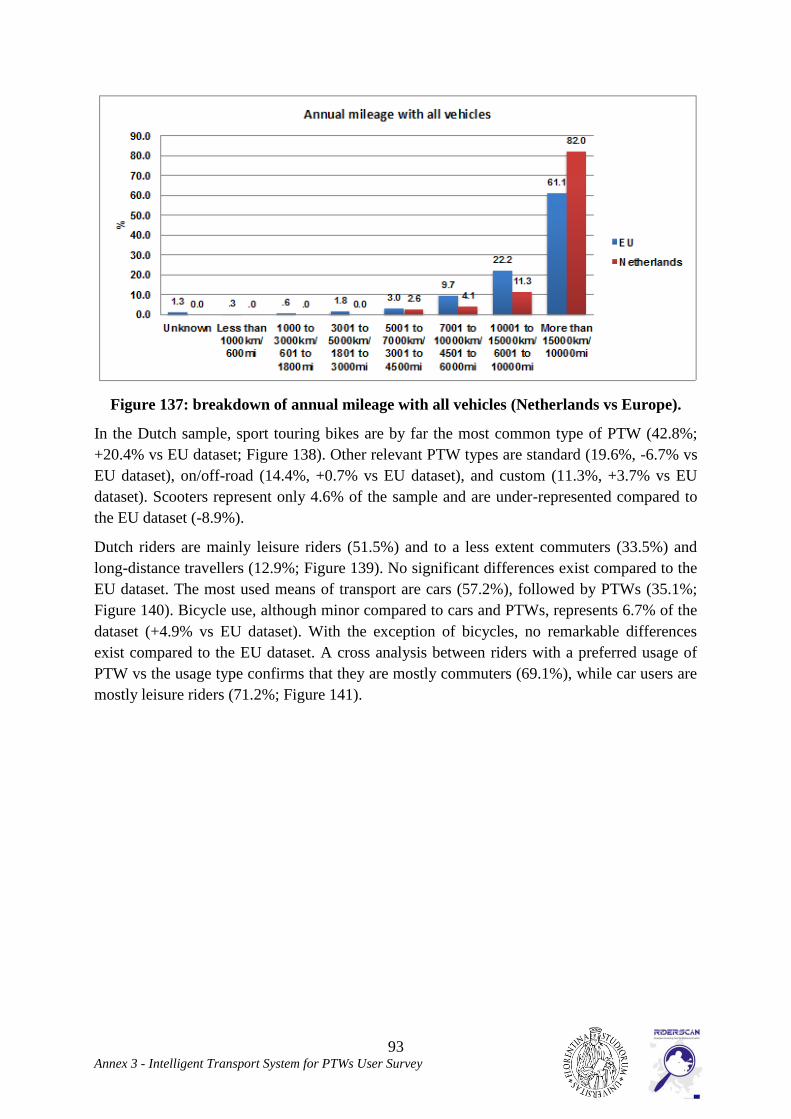
93 Annex 3 - Intelligent Transport System for PTWs User Survey
Figure 137: breakdown of annual mileage with all vehicles (Netherlands vs Europe).
In the Dutch sample, sport touring bikes are by far the most common type of PTW (42.8%;
+20.4% vs EU dataset; Figure 138). Other relevant PTW types are standard (19.6%, -6.7% vs
EU dataset), on/off-road (14.4%, +0.7% vs EU dataset), and custom (11.3%, +3.7% vs EU
dataset). Scooters represent only 4.6% of the sample and are under-represented compared to
the EU dataset (-8.9%).
Dutch riders are mainly leisure riders (51.5%) and to a less extent commuters (33.5%) and
long-distance travellers (12.9%; Figure 139). No significant differences exist compared to the
EU dataset. The most used means of transport are cars (57.2%), followed by PTWs (35.1%;
Figure 140). Bicycle use, although minor compared to cars and PTWs, represents 6.7% of the
dataset (+4.9% vs EU dataset). With the exception of bicycles, no remarkable differences
exist compared to the EU dataset. A cross analysis between riders with a preferred usage of
PTW vs the usage type confirms that they are mostly commuters (69.1%), while car users are
mostly leisure riders (71.2%; Figure 141).

94 Annex 3 - Intelligent Transport System for PTWs User Survey
Figure 138: PTW type distribution (Netherlands vs Europe).
Figure 139: breakdown of the preferred PTW usage (Netherlands vs Europe).

95 Annex 3 - Intelligent Transport System for PTWs User Survey
Figure 140: breakdown of the most commonly used means of transport (Netherlands vs
Europe).
Figure 141: most commonly used means of transport vs PTW usage (dataset:
Netherlands) – data sum up at 100% on the most commonly used means of transport.
Riders were also asked to express their opinions on new technologies and their perceived
relationship to safety. The largest rider group showed a positive attitude towards technology

96 Annex 3 - Intelligent Transport System for PTWs User Survey
(50.0%), followed by those sceptical of technology (31.4%; Figure 142). Minor differences to
the EU dataset exist.
Figure 142: breakdown of the “safety statement” (Netherlands vs Europe).
Riders’ rankings of the most useful safety systems (definitely useful or essential for safety
ratings) are listed in Figure 143. A similar ranking was created on the basis of the answers of
technology-sceptical riders (Figure 144). The preferred deployment strategy of the systems
was for their installation to be optional (76.3% vs 23.7%; Figure 145).
Figure 143: 10 best safety systems/devices in decreasing order of relevance (dataset:
Netherlands).

97 Annex 3 - Intelligent Transport System for PTWs User Survey
Figure 144: 10 best safety systems/devices in decreasing order of relevance, rated by
riders with a sceptical attitude towards technology (dataset: Netherlands).
Figure 145: installation modality of essential safety functions (Netherlands vs Europe).
A similar ranking of safety systems was done to identify the ones seen as being of least use
(Figure 146) or dangerous (Figure 147). This classification was crossed with the safety
statement to identify the contribution of each group of riders to the classification (Figure 148
to Figure 150).

98 Annex 3 - Intelligent Transport System for PTWs User Survey
Figure 146: 10 systems/devices of least use for safety in decreasing order of relevance
(dataset: Netherlands).
Figure 147: 10 systems/devices most dangerous to safety in decreasing order of relevance
(dataset: Netherlands).

99 Annex 3 - Intelligent Transport System for PTWs User Survey
Figure 148: 10 best safety systems/devices vs the safety statement (dataset: Netherlands).

100 Annex 3 - Intelligent Transport System for PTWs User Survey
Figure 149: 10 systems/devices of least use for safety vs the safety statement (dataset:
Netherlands).

101 Annex 3 - Intelligent Transport System for PTWs User Survey
Figure 150: 10 systems/devices most dangerous to safety vs the safety statement (dataset:
Netherlands).
Discussion
Dutch riders are mostly above 45 years old (66.0% of riders overall; Figure 133), have more
than 10 years of experience (76.8%; Figure 135), And tend to clock up a high annual mileage,
both with their PTWs (Figure 136) and with all vehicles (82.0% of riders exceed 15,000
km/year; Figure 137). The majority of Dutch riders are leisure riders, with the second largest
group being commuters (respectively 51.5% and 33.5% of the dataset; Figure 139). The latter
group coincides to a great extent with regular PTW users (69.1%), as does the former one
with car users (71.2%; Figure 141). In this context half of the Dutch respondents stated a
positive attitude towards technology (Figure 142).
Although 50.0% of riders are in favour of technology, the same share of riders cannot be
detected when identifying the most useful safety systems. In fact, apart from the top-rated
system (ABS; 67.7% of riders, the remaining systems were rated as useful by 45.9% of riders
(visibility improving helmet) to just 25.8% of riders (road surface condition monitoring;
Figure 143). A similar pattern can be detected in the ranking of the useful safety systems by
technology-sceptical riders (51.7% for the first system –black spot warning–, but 41.3% for
the second –curve speed warning– to 18.0% for the last –road surface condition monitoring–;
Figure 144). The two ranking have little similarity, sharing just 2 of the 10 systems (Figure
151). Specifically the 10 systems selected by technology-sceptical riders include several items

102 Annex 3 - Intelligent Transport System for PTWs User Survey
from the “rider warnings and information systems” which are also included among the
systems ranked as being of least use in the complete dataset (Figure 144 and Figure 146). The
breakdown of the best safety systems shows that:
4 of the 10 systems are related to braking (all the systems available in this group);
3 of the 10 systems are related to lighting and visibility;
2 of the 10 systems involve rider warning and information systems.
1 of the 10 systems allows improved maintenance of the PTW.
Figure 151: comparison of the top 10 best safety systems - full dataset vs sceptical riders
(dataset: Netherlands).
Systems considered as being of least use attracted a share of riders comparable to that for
useful systems (Figure 143 and Figure 146). However, in the ranking of those systems of least
use, technology-sceptical riders are over-represented compared to technology-positive ones
(Figure 149). The trend towards a lukewarm attitude towards safety systems is accentuated in
the ranking of dangerous systems: only 4 systems received more than 20.0% of votes (37.1%
to 24.9%), while the remaining ones ranged between 17.0% and 8.8% (Figure 147). In this
ranking as well, technology-sceptical riders are over-represented and in 4 cases (i.e. adaptive
cruise control, rear view display / rear view helmet, heads up display, and intersection
collision avoidance) represent more than 50% of riders (Figure 150). A small overlap exists
between the of least use and dangerous subsets (3 of the 10 systems), though 2 of these
systems belong to the V2I group (Figure 152). A detailed analysis of the systems considered
as being of least use shows that:
4 of the 10 systems involve rider warnings and information systems;
3 of the 10 systems involve rider fitness group;
Description All ScepticABS 1Visibility improving helmet 2DRL 3Navigation systems 4Brake assist 5Curve ABS 6Vision enhancement 7Linked braking systems 8Tyre pressure monitoring 9Road surface condition monitoring 10Black spot warning 11Curve speed warning 12Following distance warning 13Forward collision warning 14Heads up display 15Helmet mounted display 16In-vehicle tutoring systems 17Object detection systems 19
Description Dangerous UselessSpeed limiting systems 1Intelligent speed adaptation 2Continuous strobe lighting 3Helmet mounted display 4Adaptive cruise control 5Rear view display / Rear view helmet 6Heads up display 7Lane departure warning 8Emergency brake advisory systems 9Intersection collision avoidance 10Helmet reminder and interlock 11Alcohol detection and interlock 12Electronic licensing Smart cards 13Traffic sign recognition 14In-vehicle tutoring systems 16Speed alert warning 19Curve speed warning 20

103 Annex 3 - Intelligent Transport System for PTWs User Survey
2 of the 10 systems involve communication between vehicles and infrastructure (V2I)
(whole group);
1 of the 10 systems belongs to the lighting and visibility group.
The same analysis on the top 10 dangerous systems came to the following results:
3 of the 10 systems involve communication between vehicles and infrastructure (V2I)
(whole group);
3 of the 10 systems are related to lighting and visibility;
2 of the 10 systems involve communication between vehicles (V2V).
2 of the 10 systems involve rider warnings and information systems.
Figure 152: comparison of the top 10 safety systems considered as dangerous or of least
use (dataset: Netherlands).
3.4.7. Scandinavian countries (the Nordics)
In the national analyses a special Nordic subset was created for the answers from Denmark
(154 answers), Sweden (116), Finland (68), and Norway (45). As this geography was seen to
be relatively homogenous in terms of rider behaviour, it was deemed to be opportune to
perform an aggregate analysis. Differently national analyses would not have been possible
because of the limited amount of national data. Data from the resulting dataset (named the
Nordics dataset; 383 valid answers) was analysed on the basis of the safety statement in
section Error! Reference source not found. and compared to the results of the European
dataset.
Description All ScepticABS 1Visibility improving helmet 2DRL 3Navigation systems 4Brake assist 5Curve ABS 6Vision enhancement 7Linked braking systems 8Tyre pressure monitoring 9Road surface condition monitoring 10Black spot warning 11Curve speed warning 12Following distance warning 13Forward collision warning 14Heads up display 15Helmet mounted display 16In-vehicle tutoring systems 17Object detection systems 19
Description Dangerous UselessSpeed limiting systems 1Intelligent speed adaptation 2Continuous strobe lighting 3Helmet mounted display 4Adaptive cruise control 5Rear view display / Rear view helmet 6Heads up display 7Lane departure warning 8Emergency brake advisory systems 9Intersection collision avoidance 10Helmet reminder and interlock 11Alcohol detection and interlock 12Electronic licensing Smart cards 13Traffic sign recognition 14In-vehicle tutoring systems 16Speed alert warning 19Curve speed warning 20
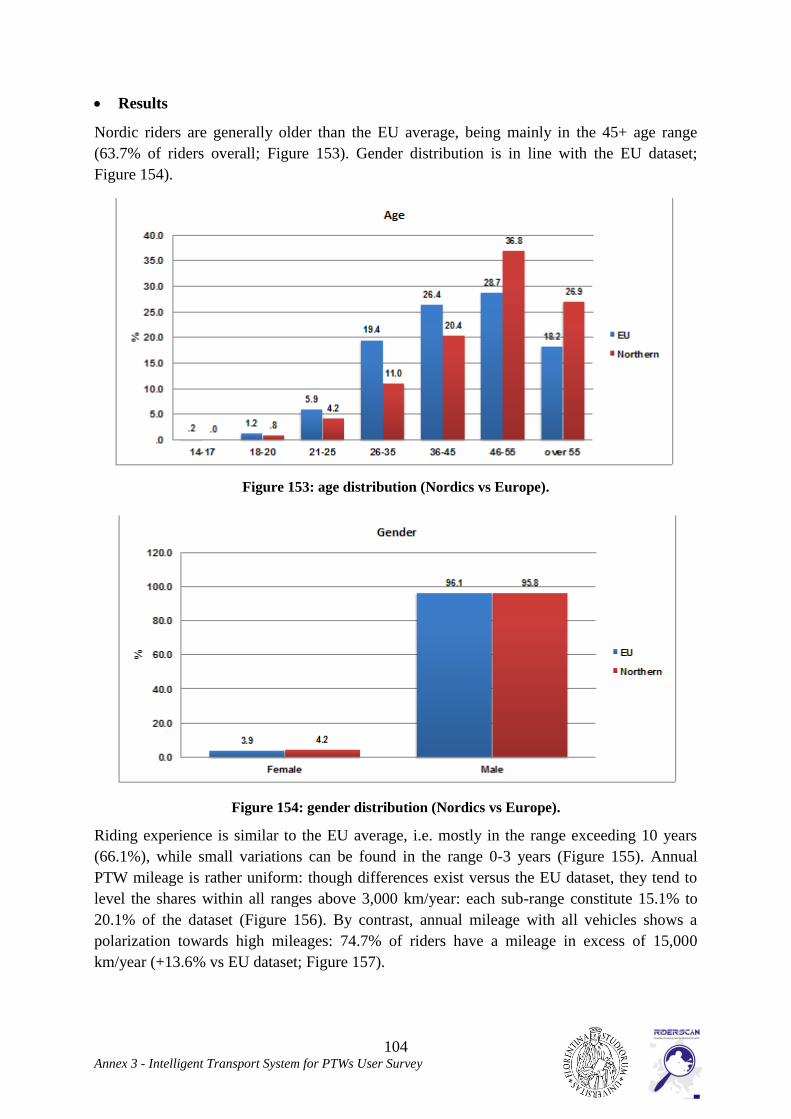
104 Annex 3 - Intelligent Transport System for PTWs User Survey
Results
Nordic riders are generally older than the EU average, being mainly in the 45+ age range
(63.7% of riders overall; Figure 153). Gender distribution is in line with the EU dataset;
Figure 154).
Figure 153: age distribution (Nordics vs Europe).
Figure 154: gender distribution (Nordics vs Europe).
Riding experience is similar to the EU average, i.e. mostly in the range exceeding 10 years
(66.1%), while small variations can be found in the range 0-3 years (Figure 155). Annual
PTW mileage is rather uniform: though differences exist versus the EU dataset, they tend to
level the shares within all ranges above 3,000 km/year: each sub-range constitute 15.1% to
20.1% of the dataset (Figure 156). By contrast, annual mileage with all vehicles shows a
polarization towards high mileages: 74.7% of riders have a mileage in excess of 15,000
km/year (+13.6% vs EU dataset; Figure 157).

105 Annex 3 - Intelligent Transport System for PTWs User Survey
Figure 155: breakdown of riding experience (Nordics vs Europe).
Figure 156: breakdown of annual mileage with PTW(s) (Nordics vs Europe).
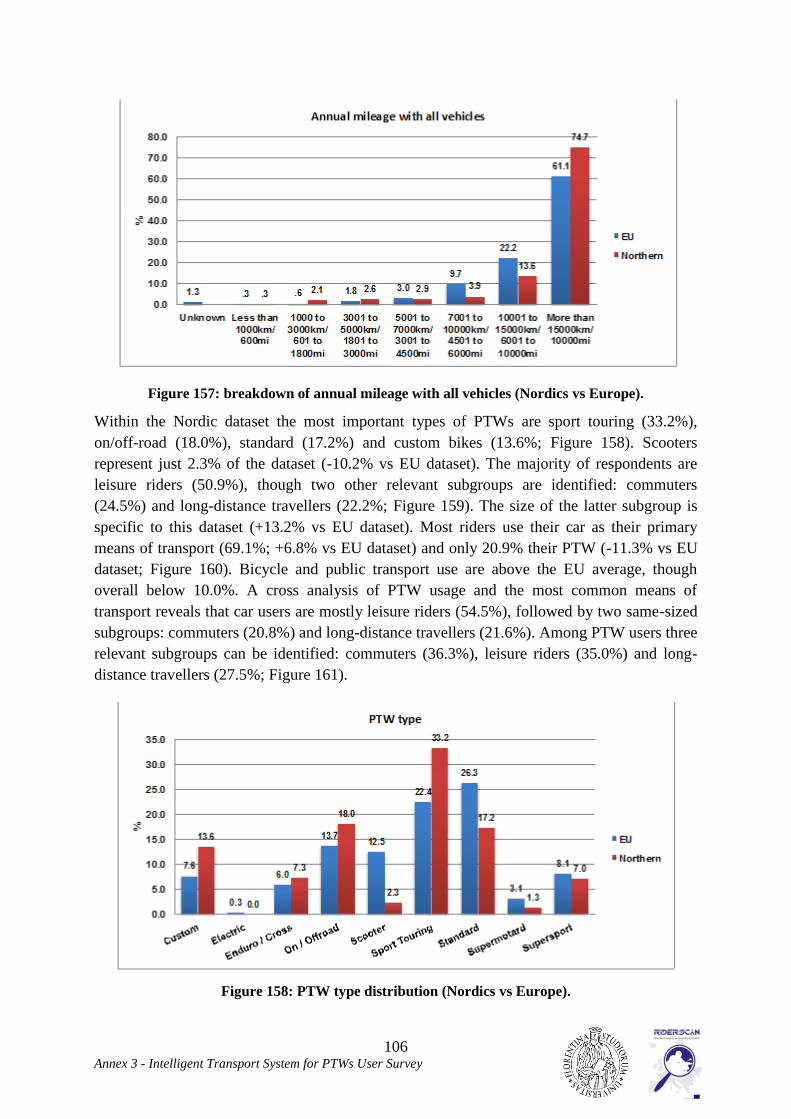
106 Annex 3 - Intelligent Transport System for PTWs User Survey
Figure 157: breakdown of annual mileage with all vehicles (Nordics vs Europe).
Within the Nordic dataset the most important types of PTWs are sport touring (33.2%),
on/off-road (18.0%), standard (17.2%) and custom bikes (13.6%; Figure 158). Scooters
represent just 2.3% of the dataset (-10.2% vs EU dataset). The majority of respondents are
leisure riders (50.9%), though two other relevant subgroups are identified: commuters
(24.5%) and long-distance travellers (22.2%; Figure 159). The size of the latter subgroup is
specific to this dataset (+13.2% vs EU dataset). Most riders use their car as their primary
means of transport (69.1%; +6.8% vs EU dataset) and only 20.9% their PTW (-11.3% vs EU
dataset; Figure 160). Bicycle and public transport use are above the EU average, though
overall below 10.0%. A cross analysis of PTW usage and the most common means of
transport reveals that car users are mostly leisure riders (54.5%), followed by two same-sized
subgroups: commuters (20.8%) and long-distance travellers (21.6%). Among PTW users three
relevant subgroups can be identified: commuters (36.3%), leisure riders (35.0%) and long-
distance travellers (27.5%; Figure 161).
Figure 158: PTW type distribution (Nordics vs Europe).

107 Annex 3 - Intelligent Transport System for PTWs User Survey
Figure 159: breakdown of the preferred PTW usage (Nordics vs Europe).
Figure 160: breakdown of the most commonly used means of transport (Nordics vs Europe).

108 Annex 3 - Intelligent Transport System for PTWs User Survey
Figure 161: most commonly used means of transport vs PTW usage (dataset: Nordics) – data
sums up at 100% on the most commonly used means of transport.
Riders were also asked to express their opinion on new technologies and their perceived
relationship to safety. The largest rider group had a positive attitude towards technology
(54.8%; +7.6% vs EU dataset) followed by the technology-sceptical group (24.3%; -4.5% vs
EU dataset; Figure 162).
Figure 162: breakdown of the “safety statement” (Nordics vs Europe).
Riders’ rankings of the most useful safety systems (definitely useful or essential for safety
ratings) are listed in Figure 163. A similar ranking was created on the basis of the answers of

109 Annex 3 - Intelligent Transport System for PTWs User Survey
technology-sceptical riders (Figure 164). The preferred deployment strategy of the systems
was for their installation to be optional (70.5% vs 29.5%; Figure 165).
Figure 163: 10 best safety systems/devices in decreasing order of relevance (dataset: Nordics).
Figure 164: 10 best safety systems/devices in decreasing order of relevance, rated by riders with
sceptical attitude towards technology (dataset: Nordics).

110 Annex 3 - Intelligent Transport System for PTWs User Survey
Figure 165: installation modality of essential safety functions (Nordics vs Europe).
A similar ranking of the safety systems was done to identify the ones seen as being of least
use (Figure 166) or dangerous (Figure 167). This classification was crossed with the safety
statement to identify the contribution of each group of riders to the classification (Figure 168
to Figure 170).
Figure 166: 10 systems/devices of least use for safety in decreasing order of relevance (dataset:
Nordics).
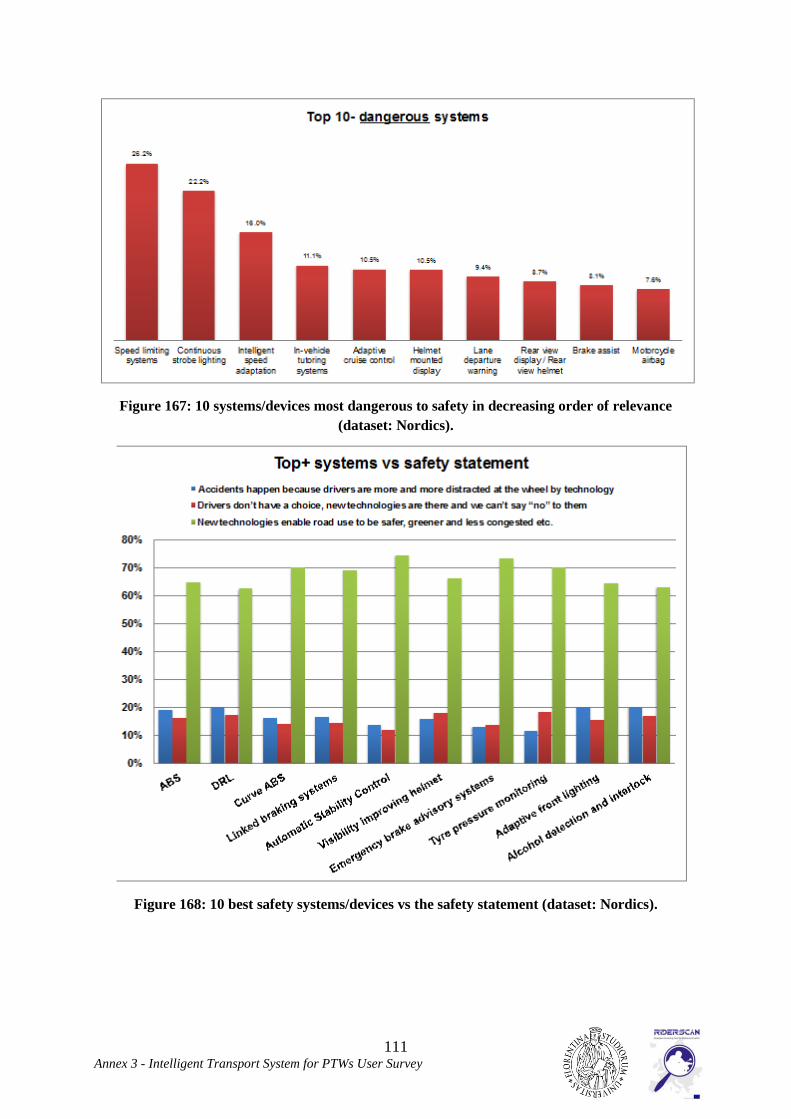
111 Annex 3 - Intelligent Transport System for PTWs User Survey
Figure 167: 10 systems/devices most dangerous to safety in decreasing order of relevance
(dataset: Nordics).
Figure 168: 10 best safety systems/devices vs the safety statement (dataset: Nordics).

112 Annex 3 - Intelligent Transport System for PTWs User Survey
Figure 169: 10 systems/devices of least use for safety vs the safety statement (dataset: Nordics).

113 Annex 3 - Intelligent Transport System for PTWs User Survey
Figure 170: 10 systems/devices most dangerous to safety vs the safety statement (dataset:
Nordics).
Discussion
Nordic riders are for the most part older than 45, i.e. on average older than the EU sample
(Figure 153), but are characterized by an experience in line with the EU average (Figure 155).
Annual PTW mileage is more evenly distributed above 3,000 km/year and there are more
riders clocking up more than 10,000 km/year compared to the EU dataset (Figure 156). In
addition they clock up a higher mileage with all vehicles (74.7% of the riders exceed 15,000
km/year; Figure 157). Four PTW types (sport touring, standard, on/off road and custom)
represent 82.0% of all PTWs owned (Figure 158), and riders are mostly leisure riders with an
above EU average of long-distance travellers (22.2%; comparable to the 24.5% of commuters;
Figure 159). Nordic riders are largely in favour of technology (54.8% of technology-positive
riders vs 24.3% of technology-sceptical ones; Figure 162).
In the ranking of useful safety systems, only the three top-rated systems show broad support
(i.e. they are rated by more than 50% of riders): ABS, DRL, and curve ABS (Figure 163).
Nonetheless, even the bottom-ranked safety system (alcohol detection and interlock) was
rated by 33.8% of the riders. A cross analysis with the safety statement reveals that
technology-positive riders are overrepresented vis-à-vis the other categories in the ranking of
these systems (Figure 168). Sceptical riders are less likely to consider systems useful for
safety: in fact the percentages of votes are lower compared to the general ranking, varying
from 59.8% (ABS) to 19.6% (navigation systems; Figure 164). Despite these differences in

114 Annex 3 - Intelligent Transport System for PTWs User Survey
the assessment, 8 of the 10 systems are common to the two rankings (Figure 171). A further
analysis of the useful systems shows that:
4 of the 10 systems are related to lighting and visibility;
3 of the 10 systems are related to braking;
1 of the 10 systems allows improved maintenance and diagnostic of the PTW;
1 of the 10 systems is related to rider fitness;
1 of the 10 systems is related to stability and balance.
Regarding the installation modality, Nordic riders are largely in favour of the availability of
the systems as an option (Figure 165).
Figure 171: comparison of the top 10 best safety systems - full dataset vs sceptical riders
(dataset: Nordics).
Systems were ranked as being of least use by 40.3% to 23.0% of riders (Figure 166). Among
these riders, technology-positive ones are under-represented, while the other two groups are
over-represented (Figure 169). From a functional perspective a per group analysis of the
systems considered as being of least use shows that:
3 of the 10 systems involve rider warnings and information systems;
3 of the 10 systems involve communication between vehicles and infrastructure (V2I)
(whole group);
2 of the 10 systems involve lighting and visibility group;
2 of the 10 systems belong to the rider fitness group.
Systems were ranked as dangerous to a limited extent by riders (26.2% to 7.6% voted for
them; Figure 167). The ranking is significant solely for the first two items (i.e. speed limiting
systems, 26.2%, and continuous strobe light, 22.2%). An over-representation of technology-
sceptical riders was observed (Figure 170) and, occasionally, i.e. on a per system basis, an
over-representation of technology-neutral riders. The analysis of the top 10 systems
considered as dangerous led to the following results:
Description All ScepticABS
DRL
Curve ABS
Linked braking systems
Automatic Stability Control
Visibility improving helmet
Emergency brake advisory systems
Tyre pressure monitoring
Adaptive front lighting
Alcohol detection and interlock
Road surface condition monitoring
Navigation systems
Description Dangerous UselessSpeed limiting systems
Continuous strobe lighting
Intelligent speed adaptation
In-vehicle tutoring systems
Adaptive cruise control
Helmet mounted display
Lane departure warning
Rear view display / Rear view helmet
Brake assist
Motorcycle airbag
Helmet reminder and interlock
Electronic licensing Smart cards
Speed alert warning
Traffic sign recognition

115 Annex 3 - Intelligent Transport System for PTWs User Survey
3 of the 10 systems involve communication between vehicles and infrastructure (V2I)
(whole group);
2 of the 10 systems involve rider warnings and information systems;
2 of the 10 systems are related to lighting and visibility;
1 of the 10 systems is related to braking;
1 of the 10 systems is related to passive and post-crash systems;
1 of the 10 systems involves communication between vehicles (V2V).
The rankings of least use and dangerous apply to the systems belonging to the V2I group and
to lighting and visibility (Figure 172). Nordic riders proved to be selective in their ratings,
since many of the systems from the latter group also feature in the group of the useful safety
systems.
Figure 172: comparison of the top 10 safety systems considered as dangerous or of least use
(dataset: Nordics).
3.4.8. United Kingdom
The UK dataset consisted of 299 valid answers. In the national analysis the UK dataset was
not subsampled as was the case with the creation of the EU dataset, and all answers were
processed. Data was analysed on the basis of the safety statement in section Error!
Reference source not found. and compared with the results of the European dataset.
Results
UK survey respondents tended to be older than 45 (80.9%; +34.0% vs EU dataset; Figure
173). Gender distribution was in line with the EU dataset (Figure 174).
Description All ScepticABS
DRL
Curve ABS
Linked braking systems
Automatic Stability Control
Visibility improving helmet
Emergency brake advisory systems
Tyre pressure monitoring
Adaptive front lighting
Alcohol detection and interlock
Road surface condition monitoring
Navigation systems
Description Dangerous UselessSpeed limiting systems
Continuous strobe lighting
Intelligent speed adaptation
In-vehicle tutoring systems
Adaptive cruise control
Helmet mounted display
Lane departure warning
Rear view display / Rear view helmet
Brake assist
Motorcycle airbag
Helmet reminder and interlock
Electronic licensing Smart cards
Speed alert warning
Traffic sign recognition

116 Annex 3 - Intelligent Transport System for PTWs User Survey
Figure 173: age distribution (United Kingdom vs Europe).
Figure 174: gender distribution (United Kingdom vs Europe).
In line with the age distribution, riders with more than 10 years of riding experience
accounted for 84.9% of the dataset (+19.6 vs EU dataset; Figure 175). Annual PTW mileage
was similar to the EU average, though with a major difference in the 3,000-5,000 km/year
range (12.4%; -4.9% vs EU dataset), mostly offset by the range above 15,000 km/year
(15.4%; +2.7% vs EU dataset; Figure 176). A different trend however was noticed in the
annual mileage with all vehicles, with riders clocking up more than 15,000 km/year
accounting for just 48.4% (-12.7% vs EU dataset) of respondents (Figure 177).

117 Annex 3 - Intelligent Transport System for PTWs User Survey
Figure 175: breakdown of riding experience (United Kingdom vs Europe).
Figure 176: breakdown of annual mileage with PTW(s) (United Kingdom vs Europe).

118 Annex 3 - Intelligent Transport System for PTWs User Survey
Figure 177: breakdown of annual mileage with all vehicles (United Kingdom vs Europe).
In the UK dataset the most important PTW types are sport touring (32.8%), standard (24.7%),
on/off-road (16.7%), and custom bikes (14.7%; Figure 178). Leisure riders make up the
largest subgroup of riders (47.8%; -3.7%v vs EU dataset), while other relevant subgroups are
commuters (32.4%; -3.1% vs EU dataset) and long-distance travellers (14.7%; +5.7 vs EU
dataset; Figure 179). The most used means of transport is a car for 56.4% of riders (-5.9% vs
EU dataset) and a PTW for 37.2% of riders (+5.0% vs EU dataset; Figure 180). While users
preferring to use a car tend to be leisure riders (65.3%), users preferring a PTW are
commuters (62.2%; Figure 181).
Figure 178: PTW type distribution (United Kingdom vs Europe).

119 Annex 3 - Intelligent Transport System for PTWs User Survey
Figure 179: breakdown of the preferred PTW usage (United Kingdom vs Europe).
Figure 180: breakdown of the most commonly used means of transport (United Kingdom vs
Europe).
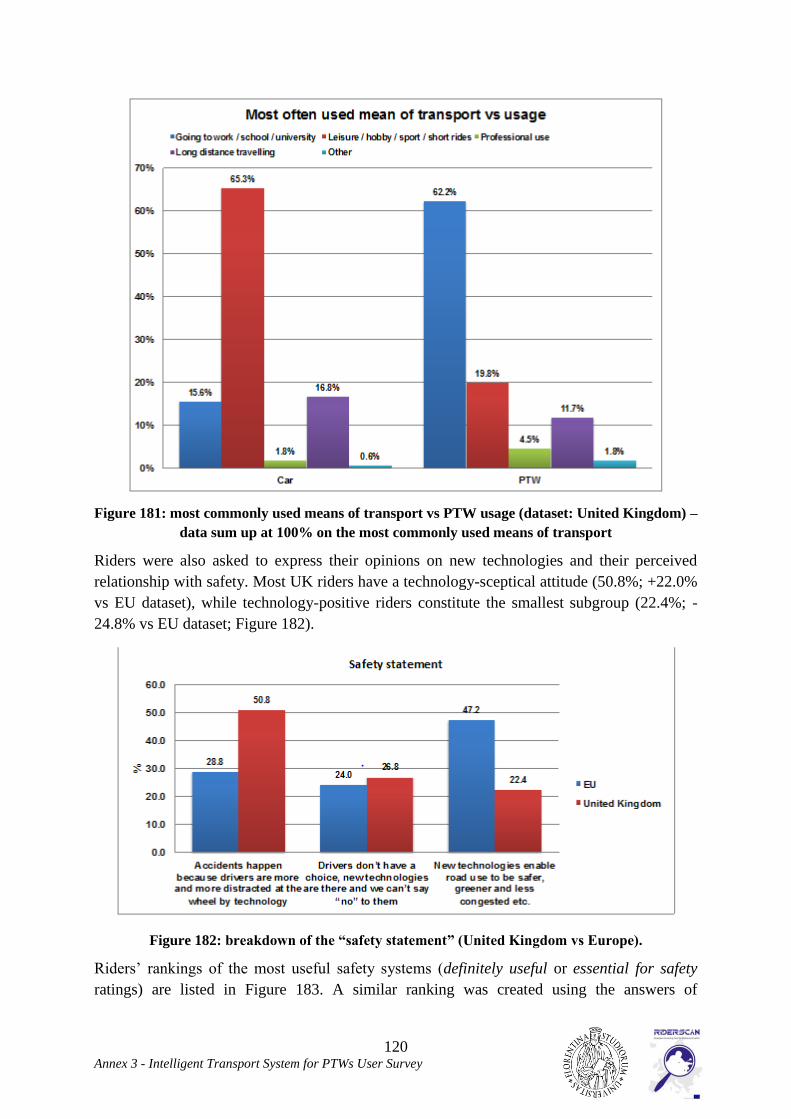
120 Annex 3 - Intelligent Transport System for PTWs User Survey
Figure 181: most commonly used means of transport vs PTW usage (dataset: United Kingdom) –
data sum up at 100% on the most commonly used means of transport
Riders were also asked to express their opinions on new technologies and their perceived
relationship with safety. Most UK riders have a technology-sceptical attitude (50.8%; +22.0%
vs EU dataset), while technology-positive riders constitute the smallest subgroup (22.4%; -
24.8% vs EU dataset; Figure 182).
Figure 182: breakdown of the “safety statement” (United Kingdom vs Europe).
Riders’ rankings of the most useful safety systems (definitely useful or essential for safety
ratings) are listed in Figure 183. A similar ranking was created using the answers of

121 Annex 3 - Intelligent Transport System for PTWs User Survey
technology-sceptical riders (Figure 184). The preferred deployment strategy of the systems
was that their installation be optional (82.3% vs 17.7%; Figure 185).
Figure 183: 10 best safety systems/devices in decreasing order of relevance (dataset: United
Kingdom).
Figure 184: 10 best safety systems/devices in decreasing order of relevance, rated by riders with
a sceptical attitude towards technology (dataset: United Kingdom).

122 Annex 3 - Intelligent Transport System for PTWs User Survey
Figure 185: installation modality of essential safety functions (United Kingdom vs Europe).
A similar ranking of the safety systems was done to identify those considered as being of least
use (Figure 186) or dangerous (Figure 187). This classification was crossed with the safety
statement to identify the contribution of each group of riders to the classification (Figure 188
to Figure 190).
Figure 186: 10 systems/devices of least use for safety in decreasing order of relevance (dataset:
United Kingdom).

123 Annex 3 - Intelligent Transport System for PTWs User Survey
Figure 187: 10 systems/devices most dangerous to safety in decreasing order of relevance
(dataset: United Kingdom).
Figure 188: 10 best safety systems/devices vs the safety statement (dataset: United Kingdom).
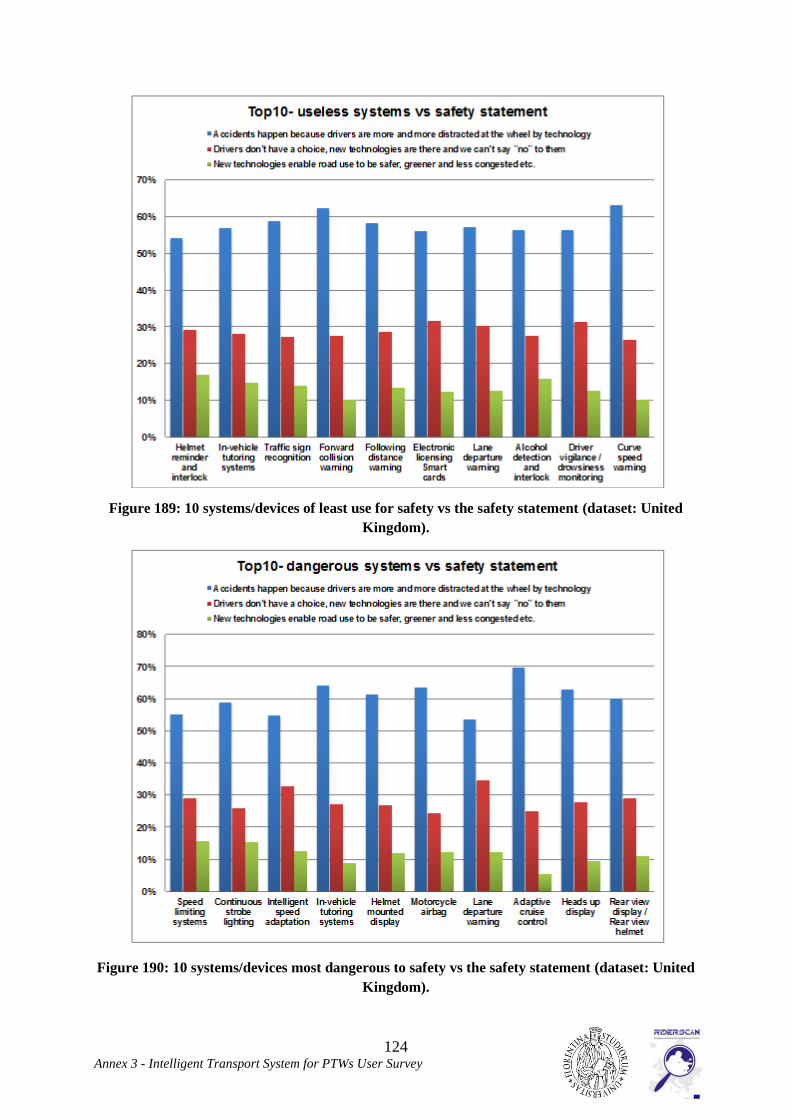
124 Annex 3 - Intelligent Transport System for PTWs User Survey
Figure 189: 10 systems/devices of least use for safety vs the safety statement (dataset: United
Kingdom).
Figure 190: 10 systems/devices most dangerous to safety vs the safety statement (dataset: United
Kingdom).

125 Annex 3 - Intelligent Transport System for PTWs User Survey
Discussion
UK riders are mostly older than 45 (80.9%; +34.0% vs EU dataset; Figure 173) and are
experienced riders (84.9% have more than 10 years of experience; Figure 175). Riders clock
up a higher mileage on their PTWs than the EU average (above 5,000 km/year; Figure 176),
though average annual mileage with all vehicles is below 15,000 km/year (Figure 177). The
most important PTW types are sport touring (32.8%%), standard (24.7%), on/off-road
(16.7%), and custom bikes (14.7%; Figure 178). UK respondents are mostly leisure riders
(47.8%), though a relevant group of long-distance travellers was identified (14.7%). The latter
was larger than in most of the analysed countries apart from the Nordics (Figure 179). UK
riders tend to have a technology–sceptical attitude (50.8%; Figure 182).
Although the largest group of riders has a technology-sceptical attitude, safety systems were
rated as useful by a maximum of 54.7% of riders (ABS) to a minimum of 26.4% (adaptive
front lighting; Figure 183): these values demonstrate an appreciation for such systems even by
the technology-sceptical and -neutral subgroups. In fact, although technology-positive riders
were over-represented in all systems, technology-sceptical riders were still the largest
subgroup for 8 of the 10 systems (Figure 188). Similar percentages were reported for the best
safety systems according only to sceptical riders (Figure 184). A comparison of the two
rankings showed that they share 9 of the 10 systems (Figure 191). The analysis of the best
systems for safety reveals that:
3 of the 10 systems are related to lighting and visibility;
2 of the 10 systems are related to braking;
2 of the 10 systems allows improved maintenance and diagnostic of the PTW (all
systems in the group);
1 of the 10 systems is related to rider fitness;
1 of the 10 systems provides rider warnings and information systems;
1 of the 10 systems is related to communication between vehicles (V2V).
Figure 191: comparison of the top 10 best safety systems - full dataset vs sceptical riders
(dataset: United Kingdom).
Systems of least use were rated by 58.3% of riders (helmet reminder and interlock) down to
26.7% for curve speed warning (Figure 186). In this case technology-sceptical and -neutral
Description All ScepticABS
Tyre pressure monitoring
Visibility improving helmet
Navigation systems
Motorcycle approaching warning system
Curve ABS
Vehicle diagnostics
DRL
Alcohol detection and interlock
Adaptive front lighting
Automatic Crash Notification (eCall)
Description Dangerous UselessSpeed limiting systems
Continuous strobe lighting
Intelligent speed adaptation
In-vehicle tutoring systems
Helmet mounted display
Motorcycle airbag
Lane departure warning
Adaptive cruise control
Heads up display
Rear view display / Rear view helmet
Helmet reminder and interlock
Traffic sign recognition
Forward collision warning
Following distance warning
Electronic licensing Smart cards
Alcohol detection and interlock
Driver vigilance / drowsiness monitoring
Curve speed warning

126 Annex 3 - Intelligent Transport System for PTWs User Survey
riders were over-represented, while technology-positive riders were under-represented (Figure
189).
Selective behaviour was noticed in the ranking of dangerous systems: the first three systems
were ranked by a significant share of riders (speed limiting systems, 57.7%; continuous strobe
lighting, 50.8%; intelligent speed adaptation, 43.1%) while the remaining ones ranged from
27.2% to 15.2% (Figure 187). The latter group of systems shows that a technology-sceptical
attitude is not directly coupled with a critical assessment (i.e. dangerous) of safety systems.
The detailed analysis of the votes per technology subgroup shows the same trend already
found for the systems of least use (Figure 190). The comparison of systems considered as
being of least use or dangerous systems reveals that only 2 of the 10 systems are shared by the
two sets (Figure 192). A subdivision of least-use systems into groups shows that:
5 of the 10 systems involve rider warnings and information systems;
4 of the 10 systems belongs to the rider fitness group (whole group);
1 of the 10 systems belongs to the communication between vehicles and infrastructure
(V2I) group.
The same analysis performed on the dangerous systems results in the following subdivision:
3 of the 10 systems involve communication between vehicles and infrastructure (V2I)
(whole group);
3 of the 10 systems involve rider warnings and information systems;
2 of the 10 systems are related to lighting and visibility;
1 of the 10 systems is related to passive and post-crash systems.
Figure 192: comparison of the top 10 safety systems considered to be dangerous or of least use
(dataset: United Kingdom).
Description All ScepticABS
Tyre pressure monitoring
Visibility improving helmet
Navigation systems
Motorcycle approaching warning system
Curve ABS
Vehicle diagnostics
DRL
Alcohol detection and interlock
Adaptive front lighting
Automatic Crash Notification (eCall)
Description Dangerous UselessSpeed limiting systems
Continuous strobe lighting
Intelligent speed adaptation
In-vehicle tutoring systems
Helmet mounted display
Motorcycle airbag
Lane departure warning
Adaptive cruise control
Heads up display
Rear view display / Rear view helmet
Helmet reminder and interlock
Traffic sign recognition
Forward collision warning
Following distance warning
Electronic licensing Smart cards
Alcohol detection and interlock
Driver vigilance / drowsiness monitoring
Curve speed warning

127 Annex 3 - Intelligent Transport System for PTWs User Survey
3.4.9. Final considerations on national analyses
The national analyses highlight different opinions and attitudes, with the breakdown of riders’
attitudes towards safety summarized in the so-called “safety statement”. An overview of
riders’ attitudes is listed in Figure 193. Results show that in all countries except France and
United Kingdom the largest subgroup is that of technology-positive riders. Moreover, apart
from Germany, this subgroup represents at least 50% of riders (result valid for Belgium,
Greece, Italy, the Netherlands, the Nordics and the United Kingdom).
Figure 193: summary of safety statement (data from national analyses).
The analysis of safety systems considered either definitely useful or essential for safety
highlights a common feeling of riders in different countries. The most relevant findings are
(Error! Not a valid bookmark self-reference.):
the most commonly represented groups of systems are: maintenance and diagnostics
and braking, since all systems in these groups were at least considered once as useful
for safety. Similarly, the lighting and visibility group contains many systems
considered relevant for safety;
communication between vehicles and infrastructure (V2I) was the only group never
perceived as useful for safety. On the contrary, its systems were often ranked among
those systems considered as being of least use or dangerous;
although different attitudes towards technology were recorded, a number of safety
systems were considered useful for safety by all riders in all countries:
tyre pressure monitoring;
visibility improving helmet;
ABS;
curve ABS;

128 Annex 3 - Intelligent Transport System for PTWs User Survey
generally speaking, safety systems related to braking were considered useful in most
of the countries.
Table 3: summary of useful safety systems (from national analyses; percentages indicate
the share of riders who, at national level, ranked the specific system as useful for safety).
Group coding: I – Rider warnings and information systems; II – Maintenance and diagnostic;
III – Lighting and visibility; IV – Braking; V – Stability and balance; VI – Rider fitness; VII –
Passive and post-crash systems; VIII – Communication between vehicles (V2V).
A summary of the preferred installation option for systems considered as essential for safety
shows that there is no relation to attitudes towards technology (Figure 194). In fact more than
60% of riders in all countries apart from Greece and Italy were in favour of a safety system
available as an option. By contrast, in Greece and Italy respectively 58.9% and 69.2% of
riders were in favour of them being standard features.

129 Annex 3 - Intelligent Transport System for PTWs User Survey
Figure 194: summary of preferred installation modality of essential safety functions
(data from national analyses).

130 Annex 3 - Intelligent Transport System for PTWs User Survey
4. Appendix A: The ITS Riderscan questionnaire
ITS USER SURVEY
The RIDERSCAN project is an EU co-funded project aiming at gathering the existing
knowledge in 8 motorcycle safety related areas, in order to identify missing knowledge and
information and provide guidance to road authorities on how to improve motorcycle safety.
Read more here
The ITS - Intelligent Transport Systems - User Survey is the 3rd and last survey launched
in the context of the Riderscan project.
With the objective to draw a European map of riders awareness and acceptance of new
technologies applied to the transport systems, the survey will ask riders to evaluate their
knowledge about and willingness to test, use, and buy systems, which are, for a wide majority
of them, far from being introduced in the market.
This survey will approximately take 15 to 30 minutes (in mother tongue) and is is divided in 2
main sections:
1. About yourself and your mobility habits (2 minutes)
2. About ITS applications/systems for Powered Two Wheeler safety, to have your
opinion about the wide variety of systems currently disucssed among experts and
authorities (between 15 to 30 minutes depending on your knowledge of the systems)
If you have questions or are facing problems answering the questionnaire, please contact the
survey administrator: survey(at)riderscan.eu
THANK YOU! for your time in answering this questionnaire.
FEMA & THE RIDERSCAN TEAM
Notes:
DATA PRIVACY: the survey does not require your personal data and is anonymous;
the privacy of the data is guaranteed. However, if you want to be kept informed about
the results and the Riderscan project, we invite you to fill the email field (question 5 of
the questionnaire);
LANGUAGES: If you would like the questionnaire in another language than English,
please use Google Chrome web browser www.google.com/chrome/ and use the
translate function;

131 Annex 3 - Intelligent Transport System for PTWs User Survey
For technical reasons, it is highly recommended not to leave the page open for more
than twenty minutes without answering, as you might have to start the entire
questionnaire again;
You can save your questionnaire and upload it later, provided you use the buttons at
the bottom of the page (not those from your web browser)
If you have questions or are facing problems answering the questionnaire, please contact the
survey administrator: survey(at)riderscan.eu
THANK YOU! for your time in answering this questionnaire.
FEMA & THE RIDERSCAN TEAM
There are 26 questions in this survey
I. About you and your mobility habits
1 Gender *
Please choose only one of the following:
Male
Female
2 Year of birth *
Please choose only one of the following:
2012
2011
2010
2009
2008
2007
2006
2005
2004
2003
2002
2001
2000
1999
1998
1997
1996
1995
1994
1993
1992
1991
1990
1989
1988
1987
1986
1985
1984
1983
1982
1981
1980
132 Annex 3 - Intelligent Transport System for PTWs User Survey
1979
1978
1977
1976
1975
1974
1973
1972
1971
1970
1969
1968
1967
1966
1965
1964
1963
1962
1961
1960
1959
1958
1957
1956
1955
1954
1953
1952
1951
1950
1949
1948
1947
1946
1945
1944
1943
1942
1941
1940
1939
1938
1937
1936
1935
1934
1933
1932
1931
1930
1929
1928
1927
1926
1925
1924
1923
1922
1921
1920
1919
1918
1917
1916
1915
1914
1913
1912
1911
1910
1909
1908
1907
1906
1905

133 Annex 3 - Intelligent Transport System for PTWs User Survey
1904
1903
1902
1901
1900
3 City
Please write your answer here:
4 Country *
Please choose only one of the following:
Austria
Belgium
Bulgaria
Croatia
Cyprus
Czech Republic
Denmark
Estonia
Finland
France
Germany
Greece
Hungary
Ireland
Italy
Latvia
Lithuania
Luxembourg
Malta
Netherlands
Norway
Poland
Portugal
Romania
Slovakia
Slovenia
Spain
Sweden
Switzerland
United Kingdom

134 Annex 3 - Intelligent Transport System for PTWs User Survey
5 e-mail (optional - but needed to update you on the results)
Please write your answer here: ……………………………………..
6 Professional/social activity
Please choose only one of the following:
Farmer
Small business owner (<10 employees)
Business owner (>10 employees)
Self-employed professional (architect, medical doctor, nurse, lawyer...)
Employee
Factory worker
Pensioner
Student
Job seeker
Other
No professional activity (parent at home, etc.)
7 Your education
(choose the highest education level your have reached so far)
Please choose only one of the following:
Primary school
Secondary school
Technical degree
Licence/Bachelor (university)
Master's degree (university)
Doctorate
Post-Doctorate
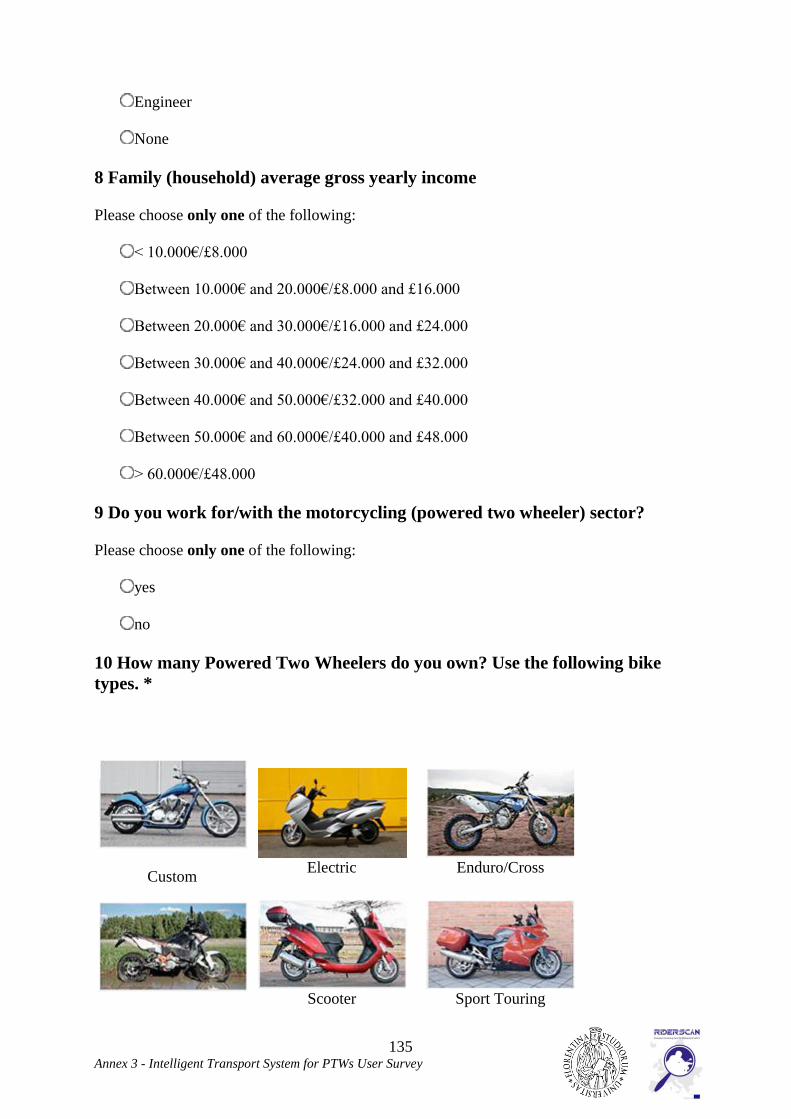
135 Annex 3 - Intelligent Transport System for PTWs User Survey
Engineer
None
8 Family (household) average gross yearly income
Please choose only one of the following:
< 10.000€/£8.000
Between 10.000€ and 20.000€/£8.000 and £16.000
Between 20.000€ and 30.000€/£16.000 and £24.000
Between 30.000€ and 40.000€/£24.000 and £32.000
Between 40.000€ and 50.000€/£32.000 and £40.000
Between 50.000€ and 60.000€/£40.000 and £48.000
> 60.000€/£48.000
9 Do you work for/with the motorcycling (powered two wheeler) sector?
Please choose only one of the following:
yes
no
10 How many Powered Two Wheelers do you own? Use the following bike
types. *
Custom
Electric
Enduro/Cross
Scooter
Sport Touring

136 Annex 3 - Intelligent Transport System for PTWs User Survey
On/offroad
Standard
Supermotard
Supersport
Touring
Trial
Number of bikes (put 0 if the categories you do
not own a bike)
Custom
Electric
Enduro/Cross (including Trial)
On/Offroad
Scooter
Touring (including Sport
Touring)
Standard
Supermotard
Supersport
11 How many years of riding experience do you have? *
Please choose only one of the following:
Less than 1 year
Between 1 and 3 years
Between 3 and 10 years
More than 10 years
12 How many km/miles do you ride (all bikes included) approximately per
year?
Please choose only one of the following:

137 Annex 3 - Intelligent Transport System for PTWs User Survey
Less than 1000km/600mi
1000 to 3000km/601 to 1800mi
3001 to 5000km/1801 to 3000mi
5001 to 7000km/3001 to 4500mi
7001 to 10000km/4501 to 6000mi
10001 to 15000km/6001 to 10000mi
More than 15000km/10000mi
13 Estimate the use of your powered two-wheelers? (If you own several PTWs,
make an average)
Total must reach 100%.
Percent (%)
going to work/school/university (commuting)
leisure/hobby/sport (short rides)
professional use
long distance travelling
Other
14 Which transport means do you use most often?
Total must reach 100%.
Percent (%)
Car
Powered two-wheeler
Bicycle
Public transport
Other
15 How many km/miles do you drive (all types vehicles included) approximately
per year?
Please choose only one of the following:
Less than 1000km/600mi
1000 to 3000km/601 to 1800mi
3001 to 5000km/1801 to 3000mi

138 Annex 3 - Intelligent Transport System for PTWs User Survey
5001 to 7000km/3001 to 4500mi
7001 to 10000km/4501 to 6000mi
10001 to 15000km/6001 to 10000mi
More than 15000km/10000mi
16 Which sentence best defines "ITS for road safety" (e.g. cruise control,
motorcycle airbag, vehicle to vehicle communication, advanced braking, speed
monitoring, etc.)? *
Please choose only one of the following:
Accidents happen because drivers are more and more distracted at the wheel by
technology
Drivers don’t have a choice, new technologies are there and we can’t say “no” to them
New technologies enable road use to be safer, greener and less congested. This is the
solution to an ever-growing traffic demand.
II. About New Technologies (ITS) for PTWs safety
Thank you for providing us this information about you and your riding/driving characteristics.
Now, About new technologies for motorcycling safety
Please do take your time as this is the most important part of the survey :-)
17 For each of the following systems/functions please indicate how these could
be useful for 'safer riding' (if properly developed taking into considerations the
specificities of riding with different PTWs, different users and different riding
styles).
Important notes:
For a general explanation, definitions and classification of ITS
systems/applications, please click here.
In no way the project RIDERSCAN (and its team) is putting emphasis on the
deployment of these systems/applications. The purpose of this questionnaire is only
to collect and gather the views of European powered two wheeler users and
adequately report about these to anybody involves in ITS deployment.
The systems/applications/functions referred in the following questions are, for the
vast majority of them, far from from being implemented in the market. Many of
them are only at prototype phases. Some are indeed being investigated by the
PTW industry, with some examples of implementation, but for a few number of

139 Annex 3 - Intelligent Transport System for PTWs User Survey
vehicles and limited use. Several others are not researched by the industry, but
coming from researchers trying to improve road safety.
The systems listed are NOT in a priority order.
I. Rider warnings and information systems - click here to open the system
overview and complete the questionnaire (the page will open in a new window) -
ONLY choose the 0 value if you believe it should NOT be researched /
developed at all
Please choose the appropriate response for each item:
0 -
Dangerous 1 - Useless
2 - Maybe
useful 3 - Useful
4 -
Definitely
useful
5 -
Essential
for safety
Black Spot
warning
Curve Speed
Warning
Following distance
warning
Forward collision
warning
Heads-up display
Helmet-mounted
display
In-vehicle tutoring
systems
Navigation
systems
Object detection
systems
Road surface
condition
monitoring
Speed
alert/warning
Traffic warning
Weather warning
Traffic sign
recognition
18 II. Maintenance and diagnostic
- click here to open the system overview (the page will open in a new window)

140 Annex 3 - Intelligent Transport System for PTWs User Survey
Please choose the appropriate response for each item:
0 -
Dangerous 1 - Useless
2 - Maybe
useful 3 - Useful
4 -
Definitely
useful
5 -
Essential
for safety
Tyre pressure
monitoring
Vehicle diagnostics
19 III. Lightning and visibility
- click here to open the system overview and complete the questionnaire (the
page will open in a new window)
Please choose the appropriate response for each item:
0 -
Dangerous 1 - Useless
2 - Maybe
useful 3 - Useful
4 -
Definitely
useful
5 -
Essential
for safety
Adaptive front
lightning
Blind spot
assistance system /
Lane changing
collision avoidance
Continuous strobe
lighting
Daytime running
lights
Emergency brake
advisory systems
Rear-view display
/ Rear-view helmet
Visibility
improving helmet
Vision
enhancement
20 IV. Braking
- click here to open the system overview and complete the questionnaire (the
page will open in a new window)
Please choose the appropriate response for each item:

141 Annex 3 - Intelligent Transport System for PTWs User Survey
0 -
Dangerous 1 - Useless
2 - Maybe
useful 3 - Useful
4 -
Definitely
useful
5 -
Essential
for safety
Anti-lock braking
systems
Brake assist
Linked braking
systems
Curve ABS
21 V. Stability and balance
- click here to open the system overview and complete the questionnaire (the
page will open in a new window)
Please choose the appropriate response for each item:
0 -
Dangerous 1 - Useless
2 - Maybe
useful 3 - Useful
4 -
Definitely
useful
5 -
Essential
for safety
Automatic
Stability Control
(Traction control)
Electronic
adjustable
suspension
22 VI. Rider fitness
- click here to open the system overview and complete the questionnaire (the
page will open in a new window)
Please choose the appropriate response for each item:
0 -
Dangerous 1 - Useless
2 - Maybe
useful 3 - Useful
4 -
Definitely
useful
5 -
Essential
for safety
Alcohol detection
and interlock
Driver vigilance
monitoring /
Drowsiness
relieving system
Electronic
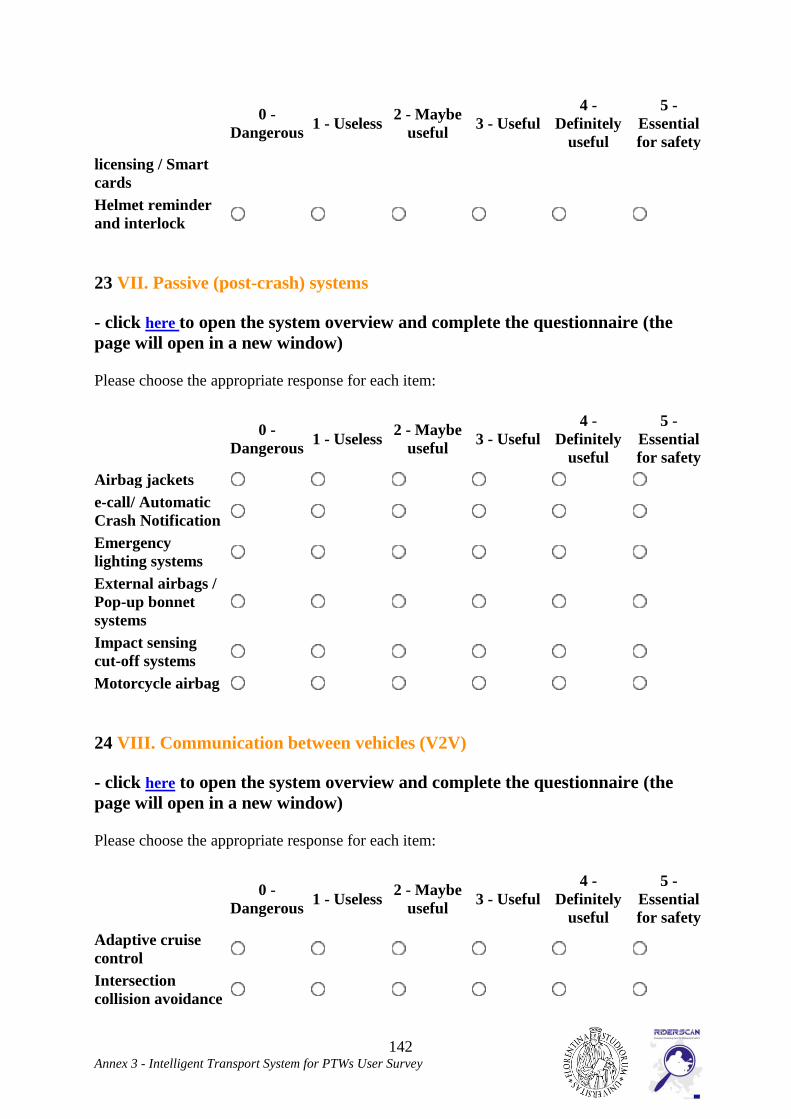
142 Annex 3 - Intelligent Transport System for PTWs User Survey
0 -
Dangerous 1 - Useless
2 - Maybe
useful 3 - Useful
4 -
Definitely
useful
5 -
Essential
for safety
licensing / Smart
cards
Helmet reminder
and interlock
23 VII. Passive (post-crash) systems
- click here to open the system overview and complete the questionnaire (the
page will open in a new window)
Please choose the appropriate response for each item:
0 -
Dangerous 1 - Useless
2 - Maybe
useful 3 - Useful
4 -
Definitely
useful
5 -
Essential
for safety
Airbag jackets
e-call/ Automatic
Crash Notification
Emergency
lighting systems
External airbags /
Pop-up bonnet
systems
Impact sensing
cut-off systems
Motorcycle airbag
24 VIII. Communication between vehicles (V2V)
- click here to open the system overview and complete the questionnaire (the
page will open in a new window)
Please choose the appropriate response for each item:
0 -
Dangerous 1 - Useless
2 - Maybe
useful 3 - Useful
4 -
Definitely
useful
5 -
Essential
for safety
Adaptive cruise
control
Intersection
collision avoidance

143 Annex 3 - Intelligent Transport System for PTWs User Survey
0 -
Dangerous 1 - Useless
2 - Maybe
useful 3 - Useful
4 -
Definitely
useful
5 -
Essential
for safety
Motorcycle
approaching
warning system
25 IX. Communication between vehicles and Infrastructure (V2I)
- click here to open the system overview and complete the questionnaire (the
page will open in a new window)
Please choose the appropriate response for each item:
0 -
Dangerous 1 - Useless
2 - Maybe
useful 3 - Useful
4 -
Definitely
useful
5 -
Essential
for safety
Intelligent speed
adaptation
Lane departure
warning / Lane
keeping assistance
Speed limiting
systems
26 Finally, do you think that the systems/functions that you identified as
"essential" should be proposed on all PTW models by the industry *
Please choose only one of the following:
As an option
Standard production on all PTWs
Thank you for taking the time to answer the RIDERSCAN ITS User Survey. You input is
highly valuable for motorcycling future.
The survey is anonymous and the privacy of all submitted data is guaranteed.
Preliminary results will be disseminate during the next European Motorcyclists Forum, a first
in the debate over ITS deployment for motorcycling.
Do you want to help further and support FEMA's work on motorcycle safety?
Here is what you can do:

144 Annex 3 - Intelligent Transport System for PTWs User Survey
1. Get updates: If you want to know more about FEMA and receive updates about
motorcycling political news from Europe, please subscribe to our Newsletter
2. Support Motorcycle Safety Research: after the conclusion of the RIDERSCAN
project, FEMA intends to collaborate with the 2 Roues Lab' project from the Mutuelle
des Motards (France) to further investigate safety-related issues, by putting together a
'pool of motorcyclists', or panel. If you would like to participate to the project and
become a “Research Panelist”, please fill in our Research Panel form.
3. Support the work of FEMA: the Federation of European Motorcyclists Associations is
a non-profit organization. FEMA represents, defends and promotes motorcycling and
the interests of powered two-wheeler users across Europe. Essentially financed by
motorcyclists’ membership fees, FEMA fulfils its missions thanks to the support of
dedicated motorcyclists, their friends and famil. If you want to further support FEMA,
you can:
Join a Motorcyclists' Association in your country – check FEMA 's members list
Support FEMA with a donation
Give us your point of view as a consumer by becoming a “Consumer Panelist” If you want to
receive more information, please fill in our Consumer Panel form.
Thank you once more for your participation.
FEMA and the RIDERSCAN TEAM
5. Appendix B: comparison of the full and normalized national datasets
In this appendix the plots used for the validation of the subsampling procedure are reported.
The validation was performed on three national datasets, which were heavily subsampled.

145 Annex 3 - Intelligent Transport System for PTWs User Survey
5.1. France
Figure B. 1: gender in the French datasets (full vs. normalized dataset).
Figure B. 2: age in the French datasets (full vs. normalized dataset).

146 Annex 3 - Intelligent Transport System for PTWs User Survey
Figure B. 3: PTW type in the French datasets (full vs. normalized dataset).
Figure B. 4: riding experience in the French datasets (full vs. normalized dataset).

147 Annex 3 - Intelligent Transport System for PTWs User Survey
Figure B. 5: PTW use in the French datasets (full vs. normalized dataset).
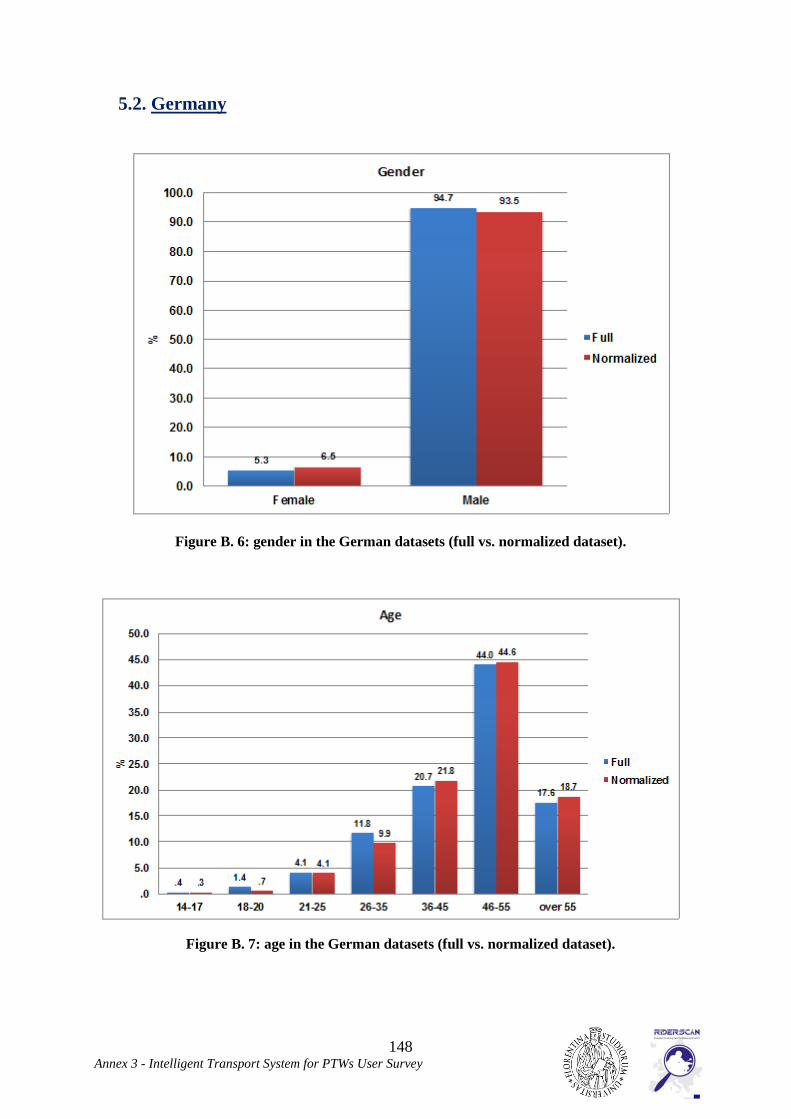
148 Annex 3 - Intelligent Transport System for PTWs User Survey
5.2. Germany
Figure B. 6: gender in the German datasets (full vs. normalized dataset).
Figure B. 7: age in the German datasets (full vs. normalized dataset).

149 Annex 3 - Intelligent Transport System for PTWs User Survey
Figure B. 8: PTW type in the German datasets (full vs. normalized dataset).
Figure B. 9: riding experience in the German datasets (full vs. normalized dataset).

150 Annex 3 - Intelligent Transport System for PTWs User Survey
Figure B. 10: PTW use in the German datasets (full vs. normalized dataset).
5.3. United Kingdom
Figure B. 11: gender in the United Kingdom datasets (full vs. normalized dataset).

151 Annex 3 - Intelligent Transport System for PTWs User Survey
Figure B. 12: age in the United Kingdom datasets (full vs. normalized dataset).
Figure B. 13: PTW type in the United Kingdom datasets (full vs. normalized dataset).
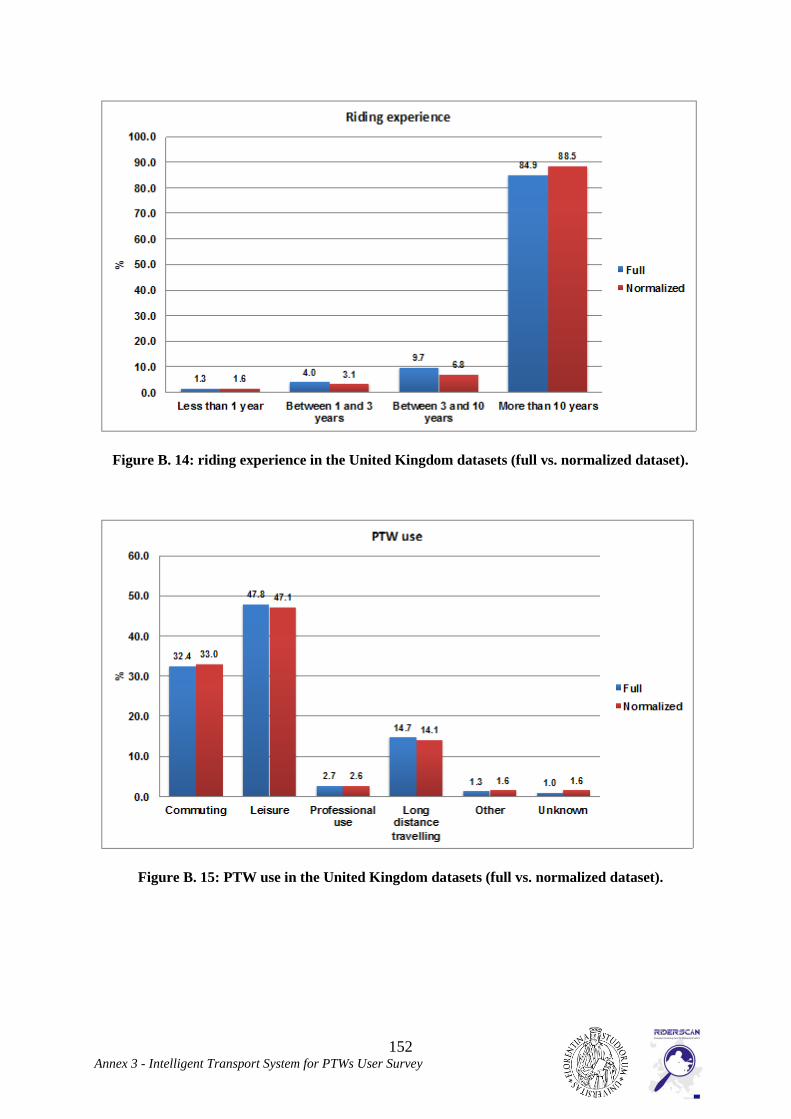
152 Annex 3 - Intelligent Transport System for PTWs User Survey
Figure B. 14: riding experience in the United Kingdom datasets (full vs. normalized dataset).
Figure B. 15: PTW use in the United Kingdom datasets (full vs. normalized dataset).