ANNEX 2 SUMMARY OF EQUATIONS - IPCC - Task … 2: Summary of Equations 2006 IPCC Guidelines for...
34
Annex 2: Summary of Equations 2006 IPCC Guidelines for National Greenhouse Gas Inventories A2.1 ANNEX 2 SUMMARY OF EQUATIONS
Transcript of ANNEX 2 SUMMARY OF EQUATIONS - IPCC - Task … 2: Summary of Equations 2006 IPCC Guidelines for...
Annex 2: Summary of Equations
2006 IPCC Guidelines for National Greenhouse Gas Inventories A2.1
A N N E X 2
SUMMARY OF EQUATIONS
Volume 4: Agriculture, Forestry and Other Land Use
A2.2 2006 IPCC Guidelines for National Greenhouse Gas Inventories
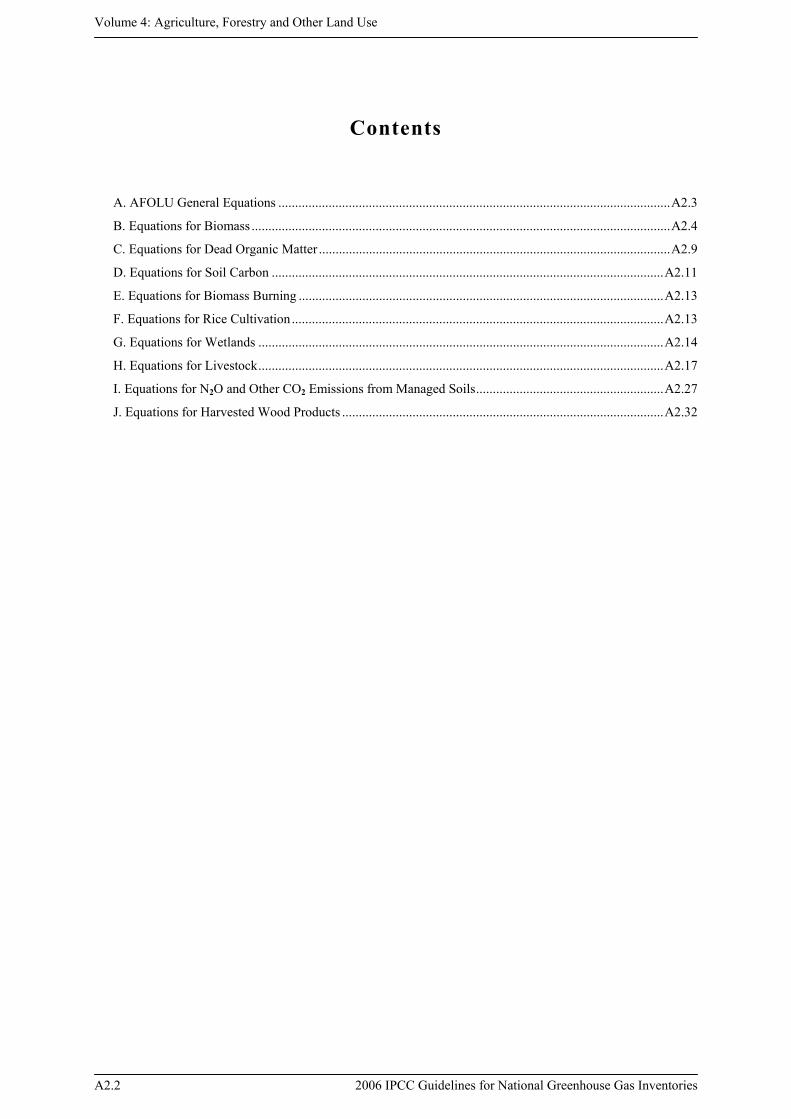
Contents
A. AFOLU General Equations .....................................................................................................................A2.3 B. Equations for Biomass .............................................................................................................................A2.4 C. Equations for Dead Organic Matter .........................................................................................................A2.9 D. Equations for Soil Carbon .....................................................................................................................A2.11 E. Equations for Biomass Burning .............................................................................................................A2.13 F. Equations for Rice Cultivation...............................................................................................................A2.13 G. Equations for Wetlands .........................................................................................................................A2.14 H. Equations for Livestock.........................................................................................................................A2.17 I. Equations for N2O and Other CO2 Emissions from Managed Soils........................................................A2.27 J. Equations for Harvested Wood Products ................................................................................................A2.32
Annex 2: Summary of Equations
2006 IPCC Guidelines for National Greenhouse Gas Inventories A2.3
A. AFOLU GENERAL EQUATIONS
EQUATION 2.1 ANNUAL CARBON STOCK CHANGES FOR THE ENTIRE AFOLU SECTOR ESTIMATED AS THE SUM OF
CHANGES IN ALL LAND-USE CATEGORIES
OLSLWLGLCLFLAFOLU CCCCCCC Δ+Δ+Δ+Δ+Δ+Δ=Δ
Where:
ΔC = carbon stock change
Indices denote the following land-use categories:
AFOLU = Agriculture, Forestry and Other Land Use
FL = Forest Land
CL = Cropland
GL = Grassland
WL = Wetlands
SL = Settlements
OL = Other Land
EQUATION 2.2 ANNUAL CARBON STOCK CHANGES FOR A LAND-USE CATEGORY AS A SUM OF CHANGES IN EACH
STRATA WITHIN THE CATEGORY ∑Δ=Δi
LULU ICC
Where:
ΔCLU = carbon stock changes for a land-use (LU) category as defined in Equation 2.1.
i = denotes a specific stratum or subdivision within the land-use category (by any combination of species, climatic zone, ecotype, management regime etc., see Chapter 3), i = 1 to n.
EQUATION 2.3 ANNUAL CARBON STOCK CHANGES FOR A STRATUM OF A LAND-USE CATEGORY AS A SUM OF
CHANGES IN ALL POOLS HWPSOLIDWBBABLU CCCCCCC
iΔ+Δ+Δ+Δ+Δ+Δ=Δ
Where:
ΔCLUi = carbon stock changes for a stratum of a land-use category
Subscripts denote the following carbon pools:
AB = above-ground biomass
BB = below-ground biomass
DW = dead wood
LI = litter
SO = soils
HWP = harvested wood products
Volume 4: Agriculture, Forestry and Other Land Use
A2.4 2006 IPCC Guidelines for National Greenhouse Gas Inventories
EQUATION 2.4 ANNUAL CARBON STOCK CHANGE IN A GIVEN POOL AS A FUNCTION OF GAINS AND LOSSES
(GAIN-LOSS METHOD) LG CCC Δ−Δ=Δ
Where:
ΔC = annual carbon stock change in the pool, tonnes C yr-1
ΔCG= annual gain of carbon, tonnes C yr-1
ΔCL = annual loss of carbon, tonnes C yr-1
EQUATION 2.5 CARBON STOCK CHANGE IN A GIVEN POOL AS AN ANNUAL AVERAGE DIFFERENCE BETWEEN
ESTIMATES AT TWO POINTS IN TIME (STOCK-DIFFERENCE METHOD)
)(
)(
12
12
tt
CCC tt
−
−=Δ
Where:
ΔC = annual carbon stock change in the pool, tonnes C yr-1
Ct1 = carbon stock in the pool at time t1, tonnes C
Ct2 = carbon stock in the pool at time t2, tonnes C
EQUATION 2.6 NON-CO2 EMISSIONS TO THE ATMOSPHERE
EFAEmission •=
Where:
Emission = non- CO2 emissions, tonnes of the non-CO2 gas
A = activity data relating to the emission source (can be area, animal numbers or mass unit, depending on the source type)
EF = emission factor for a specific gas and source category, tonnes per unit of A
B. EQUATIONS FOR BIOMASS
EQUATION 2.7 ANNUAL CHANGE IN CARBON STOCKS IN BIOMASS
IN LAND REMAINING IN A PARTICULAR LAND USE -CATEGORY (GAIN-LOSS METHOD) LGB CCC Δ−Δ=Δ
Where:
∆CB = annual change in carbon stocks in biomass (the sum of above-ground and below-ground biomass terms in Equation 2.3) for each land sub-category, considering the total area, tonnes C yr-1
∆CG = annual increase in carbon stocks due to biomass growth for each land sub-category, considering the total area, tonnes C yr-1
∆CL = annual decrease in carbon stocks due to biomass loss for each land sub-category, considering the total area, tonnes C yr-1

Annex 2: Summary of Equations
2006 IPCC Guidelines for National Greenhouse Gas Inventories A2.5
EQUATION 2.8 ANNUAL CHANGE IN CARBON STOCKS IN BIOMASS
IN LAND REMAINING IN THE SAME LAND-USE CATEGORY (STOCK-DIFFERENCE METHOD)
)(
)(
12
12
tt
CCC tt
B −
−=Δ (a)
where ∑ •+•••=
jijijiSjiji CFRBCEFVAC
ji,
,,,, })1({,
(b)
Where:
∆CB = annual change in carbon stocks in biomass (the sum of above-ground and below-ground biomass terms in Equation 2.3 ) in land remaining in the same category (e.g., Forest Land Remaining Forest Land), tonnes C yr-1
C t2
= total carbon in biomass for each land sub-category at time t2, tonnes C
C t1 = total carbon in biomass for each land sub-category at time t
1, tonnes C
C = total carbon in biomass for time t1 to t2
A = area of land remaining in the same land-use category, ha (see note below)
V = merchantable growing stock volume, m3 ha-1
i = ecological zone i (i = 1 to n)
j = climate domain j (j = 1 to m)
R = ratio of below-ground biomass to above-ground biomass, in tonnes d.m. below-ground biomass (tonne d.m. above-ground biomass)-1
CF = carbon fraction of dry matter, tonnes C (tonne d.m.)-1
BCEFS = biomass conversion and expansion factor for expansion of merchantable growing stock volume to above-ground biomass, tonnes above-ground biomass growth (m3 growing stock volume)-1, (see Table 4.5 for Forest Land). BCEFS transforms merchantable volume of growing stock directly into its above-ground biomass. BCEFS values are more convenient because they can be applied directly to volume-based forest inventory data and operational records, without the need of having to resort to basic wood densities (D). They provide best results, when they have been derived locally and based directly on merchantable volume. However, if BCEFS values are not available and if the biomass expansion factor (BEFS) and D values are separately estimated, the following conversion can be used:
BCEFS = BEFS ● D
EQUATION 2.9 ANNUAL INCREASE IN BIOMASS CARBON STOCKS DUE TO BIOMASS INCREMENT
IN LAND REMAINING IN THE SAME LAND-USE CATEGORY ∑ ••=Δ
jijiTOTALjiG CFGAC
ji,
,, )(,
Where:
∆CG = annual increase in biomass carbon stocks due to biomass growth in land remaining in the same land-use category by vegetation type and climatic zone, tonnes C yr-1
A = area of land remaining in the same land-use category, ha
GTOTAL = mean annual biomass growth, tonnes d. m. ha-1 yr-1
i = ecological zone (i = 1 to n)
j = climate domain (j = 1 to m)
CF = carbon fraction of dry matter, tonne C (tonne d.m.)-1
Volume 4: Agriculture, Forestry and Other Land Use
A2.6 2006 IPCC Guidelines for National Greenhouse Gas Inventories
EQUATION 2.10 AVERAGE ANNUAL INCREMENT IN BIOMASS
Tier 1 ∑ +•= )}1({ RGG WTOTAL Biomass increment data (dry matter) are used directly
Tiers 2 and 3 ∑ +••= )}1({ RBCEFIG IVTOTAL Net annual increment data are used to estimate GW by
applying a biomass conversion and expansion factor
Where:
GTOTAL = average annual biomass growth above and below-ground, tonnes d. m. ha-1 yr-1
GW = average annual above-ground biomass growth for a specific woody vegetation type, tonnes d. m. ha-1 yr-1
R = ratio of below-ground biomass to above-ground biomass for a specific vegetation type, in tonne d.m. below-ground biomass (tonne d.m. above-ground biomass)-1. R must be set to zero if assuming no changes of below-ground biomass allocation patterns (Tier 1).
IV = average net annual increment for specific vegetation type, m3 ha-1 yr-1
BCEFI = biomass conversion and expansion factor for conversion of net annual increment in volume (including bark) to above-ground biomass growth for specific vegetation type, tonnes above-ground biomass growth (m3 net annual increment)-1, (see Table 4.5 for Forest land). If BCEFI values are not available and if the biomass expansion factor (BEF) and basic wood density (D) values are separately estimated, then the following conversion can be used:
BCEFI = BEFI ● D
EQUATION 2.11 ANNUAL DECREASE IN CARBON STOCKS DUE TO BIOMASS LOSSES
IN LAND REMAINING IN THE SAME LAND-USE CATEGORY
edisturbancfuelwoodremovalswoodL LLLC ++=Δ −
Where: ∆C
L = annual decrease in carbon stocks due to biomass loss in land remaining in the same land-use category, tonnes C yr-1
Lwood-removals = annual carbon loss due to wood removals, tonnes C yr-1 (See Equation 2.12)
Lfuelwood = annual biomass carbon loss due to fuelwood removals, tonnes C yr-1 (See Equation 2.13)
Ldisturbance = annual biomass carbon losses due to disturbances, tonnes C yr-1 (See Equation 2.14)
EQUATION 2.12 ANNUAL CARBON LOSS IN BIOMASS OF WOOD REMOVALS
})1({ CFRBCEFHL Rremovalswood •+••=−
Where:
Lwood-removals = annual carbon loss due to biomass removals, tonnes C yr-1
H = annual wood removals, roundwood, m3 yr-1
R = ratio of below-ground biomass to above-ground biomass, in tonne d.m. below-ground biomass (tonne d.m. above-ground biomass)-1. R must be set to zero if assuming no changes of below-ground biomass allocation patterns (Tier 1).
CF = carbon fraction of dry matter, tonne C (tonne d.m.)-1
BCEFR = biomass conversion and expansion factor for conversion of removals in merchantable volume to total biomass removals (including bark), tonnes biomass removal (m3 of removals)-1, (see Table 4.5 for Forest Land). However, if BCEFR values are not available and if the biomass expansion factor for
Annex 2: Summary of Equations
2006 IPCC Guidelines for National Greenhouse Gas Inventories A2.7
wood removals (BEFR) and basic wood density (D) values are separately estimated, then the following conversion can be used:
BCEFR = BEFR ● D
EQUATION 2.13 ANNUAL CARBON LOSS IN BIOMASS OF FUELWOOD REMOVAL
CFDFGRBCEFFGL partRtreesfuelwood ••++••= ])}1([{
Where:
Lfuelwood = annual carbon loss due to fuelwood removals, tonnes C yr-1
FGtrees = annual volume of fuelwood removal of whole trees, m3 yr-1
FGpart = annual volume of fuelwood removal as tree parts, m3 yr-1
R = ratio of below-ground biomass to above-ground biomass, in tonne d.m. below-ground biomass (tonne d.m. above-ground biomass)-1; R must be set to zero if assuming no changes of below-ground biomass allocation patterns. (Tier 1)
CF = carbon fraction of dry matter, tonne C (tonne d.m.)-1
D = basic wood density, tonnes d.m. m-3
BCEFR = biomass conversion and expansion factor for conversion of removals in merchantable volume to biomass removals (including bark), tonnes biomass removal (m3 of removals)-1, (see Table 4.5 for Forest Land). If BCEFR values are not available and if the biomass expansion factor for wood removals (BEFR) and basic wood density (D) values are separately estimated, then the following conversion can be used:
BCEFR = BEFR ● D
EQUATION 2.14 ANNUAL CARBON LOSSES IN BIOMASS DUE TO DISTURBANCES
})1({ fdCFRBAL Wedisturbancedisturbanc ••+••=
Where:
Ldisturbances = annual other losses of carbon, tonnes C yr-1 (Note that this is the amount of biomass that is lost from the total biomass. The partitioning of biomass that is transferred to dead organic matter and biomass that is oxidized and released to the atmosphere is explained in Equations 2.15 and 2.16).
Adisturbance = area affected by disturbances, ha yr-1
BW = average above-ground biomass of land areas affected by disturbances, tonnes d.m. ha-1
R = ratio of below-ground biomass to above-ground biomass, in tonne d.m. below-ground biomass (tonne d.m. above-ground biomass)-1. R must be set to zero if no changes of below-ground biomass are assumed (Tier 1)
CF = carbon fraction of dry matter, tonne C (tonnes d.m.)-1
fd = fraction of biomass lost in disturbance (see note below)
Note: The parameter fd defines the proportion of biomass that is lost from the biomass pool: a stand-replacing disturbance will kill all (fd = 1) biomass while an insect disturbance may only remove a portion (e.g. fd = 0.3) of the average biomass C density. Equation 2.14 does not specify the fate of the carbon removed from the biomass carbon stock. The Tier 1 assumption is that all of Ldisturbances is emitted in the year of disturbance. Higher Tier methods assume that some of this carbon is emitted immediately and some is added to the dead organic matter pools (dead wood, litter) or HWP.
Volume 4: Agriculture, Forestry and Other Land Use
A2.8 2006 IPCC Guidelines for National Greenhouse Gas Inventories
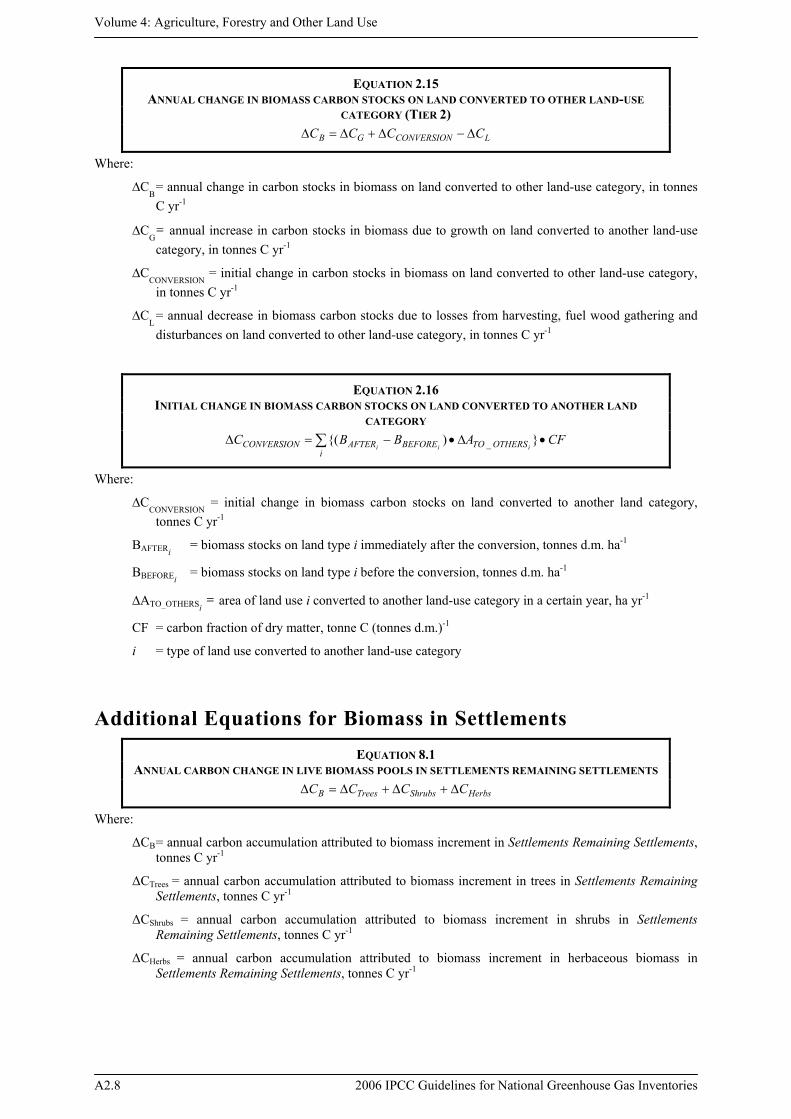
EQUATION 2.15 ANNUAL CHANGE IN BIOMASS CARBON STOCKS ON LAND CONVERTED TO OTHER LAND-USE
CATEGORY (TIER 2)
LCONVERSIONGB CCCC Δ−Δ+Δ=Δ
Where:
∆CB = annual change in carbon stocks in biomass on land converted to other land-use category, in tonnes C yr-1
∆CG = annual increase in carbon stocks in biomass due to growth on land converted to another land-use category, in tonnes C yr-1
∆CCONVERSION
= initial change in carbon stocks in biomass on land converted to other land-use category, in tonnes C yr-1
∆CL = annual decrease in biomass carbon stocks due to losses from harvesting, fuel wood gathering and disturbances on land converted to other land-use category, in tonnes C yr-1
EQUATION 2.16 INITIAL CHANGE IN BIOMASS CARBON STOCKS ON LAND CONVERTED TO ANOTHER LAND
CATEGORY ∑ •Δ•−=Δi
OTHERSTOBEFOREAFTERCONVERSION CFABBCiii}){( _
Where:
∆CCONVERSION
= initial change in biomass carbon stocks on land converted to another land category, tonnes C yr-1
BAFTERi = biomass stocks on land type i immediately after the conversion, tonnes d.m. ha-1
BBEFOREi = biomass stocks on land type i before the conversion, tonnes d.m. ha-1
∆ATO_OTHERSi = area of land use i converted to another land-use category in a certain year, ha yr-1
CF = carbon fraction of dry matter, tonne C (tonnes d.m.)-1
i = type of land use converted to another land-use category
Additional Equations for Biomass in Settlements EQUATION 8.1
ANNUAL CARBON CHANGE IN LIVE BIOMASS POOLS IN SETTLEMENTS REMAINING SETTLEMENTS
HerbsShrubsTreesB CCCC Δ+Δ+Δ=Δ
Where:
ΔCB = annual carbon accumulation attributed to biomass increment in Settlements Remaining Settlements, tonnes C yr-1
ΔCTrees = annual carbon accumulation attributed to biomass increment in trees in Settlements Remaining Settlements, tonnes C yr-1
ΔCShrubs = annual carbon accumulation attributed to biomass increment in shrubs in Settlements Remaining Settlements, tonnes C yr-1
ΔCHerbs = annual carbon accumulation attributed to biomass increment in herbaceous biomass in Settlements Remaining Settlements, tonnes C yr-1
Annex 2: Summary of Equations
2006 IPCC Guidelines for National Greenhouse Gas Inventories A2.9
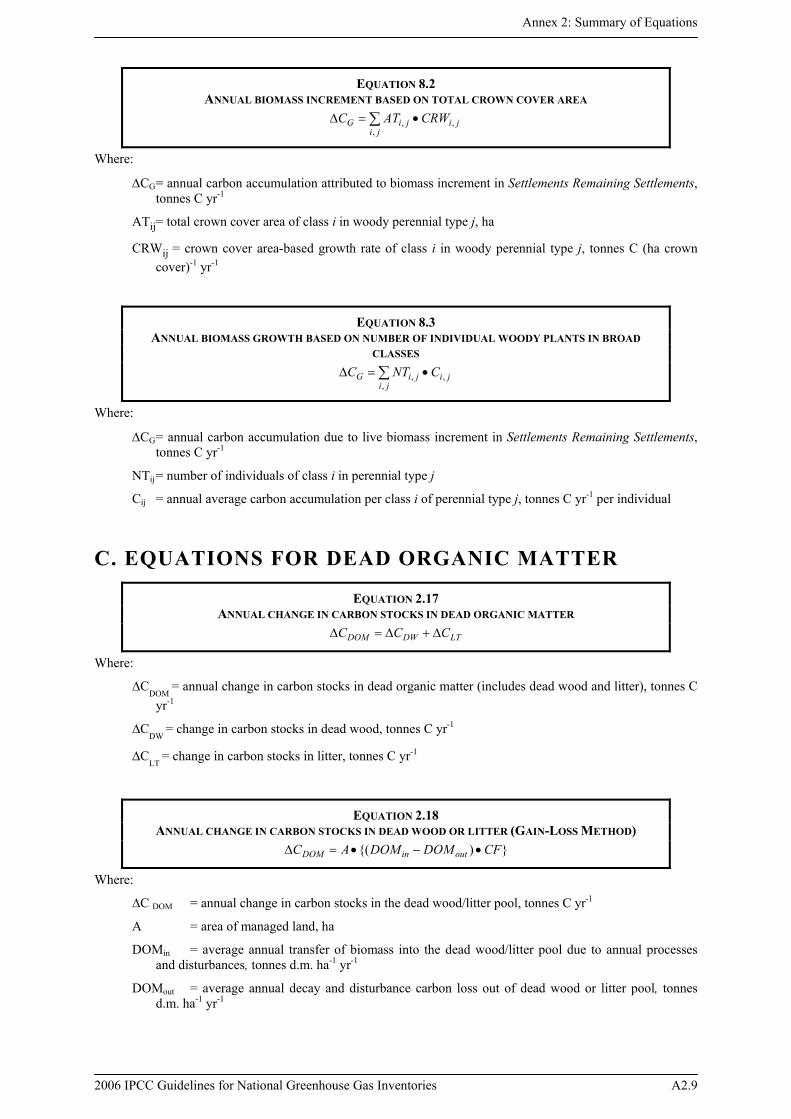
EQUATION 8.2 ANNUAL BIOMASS INCREMENT BASED ON TOTAL CROWN COVER AREA
∑ •=Δji
jijiG CRWATC,
,,
Where:
ΔCG = annual carbon accumulation attributed to biomass increment in Settlements Remaining Settlements, tonnes C yr-1
ATij = total crown cover area of class i in woody perennial type j, ha
CRWij = crown cover area-based growth rate of class i in woody perennial type j, tonnes C (ha crown cover)-1 yr-1
EQUATION 8.3 ANNUAL BIOMASS GROWTH BASED ON NUMBER OF INDIVIDUAL WOODY PLANTS IN BROAD
CLASSES ∑ •=Δ
jijijiG CNTC
,,,
Where:
ΔCG = annual carbon accumulation due to live biomass increment in Settlements Remaining Settlements, tonnes C yr-1
NTij = number of individuals of class i in perennial type j
Cij = annual average carbon accumulation per class i of perennial type j, tonnes C yr-1 per individual
C. EQUATIONS FOR DEAD ORGANIC MATTER
EQUATION 2.17 ANNUAL CHANGE IN CARBON STOCKS IN DEAD ORGANIC MATTER
LTDWDOM CCC Δ+Δ=Δ
Where:
∆CDOM
= annual change in carbon stocks in dead organic matter (includes dead wood and litter), tonnes C yr-1
∆CDW
= change in carbon stocks in dead wood, tonnes C yr-1
∆CLT
= change in carbon stocks in litter, tonnes C yr-1
EQUATION 2.18 ANNUAL CHANGE IN CARBON STOCKS IN DEAD WOOD OR LITTER (GAIN-LOSS METHOD)
}){( CFDOMDOMAC outinDOM •−•=Δ
Where:
∆C DOM = annual change in carbon stocks in the dead wood/litter pool, tonnes C yr-1
A = area of managed land, ha
DOMin = average annual transfer of biomass into the dead wood/litter pool due to annual processes and disturbances, tonnes d.m. ha-1 yr-1
DOMout = average annual decay and disturbance carbon loss out of dead wood or litter pool, tonnes d.m. ha-1 yr-1
Volume 4: Agriculture, Forestry and Other Land Use
A2.10 2006 IPCC Guidelines for National Greenhouse Gas Inventories
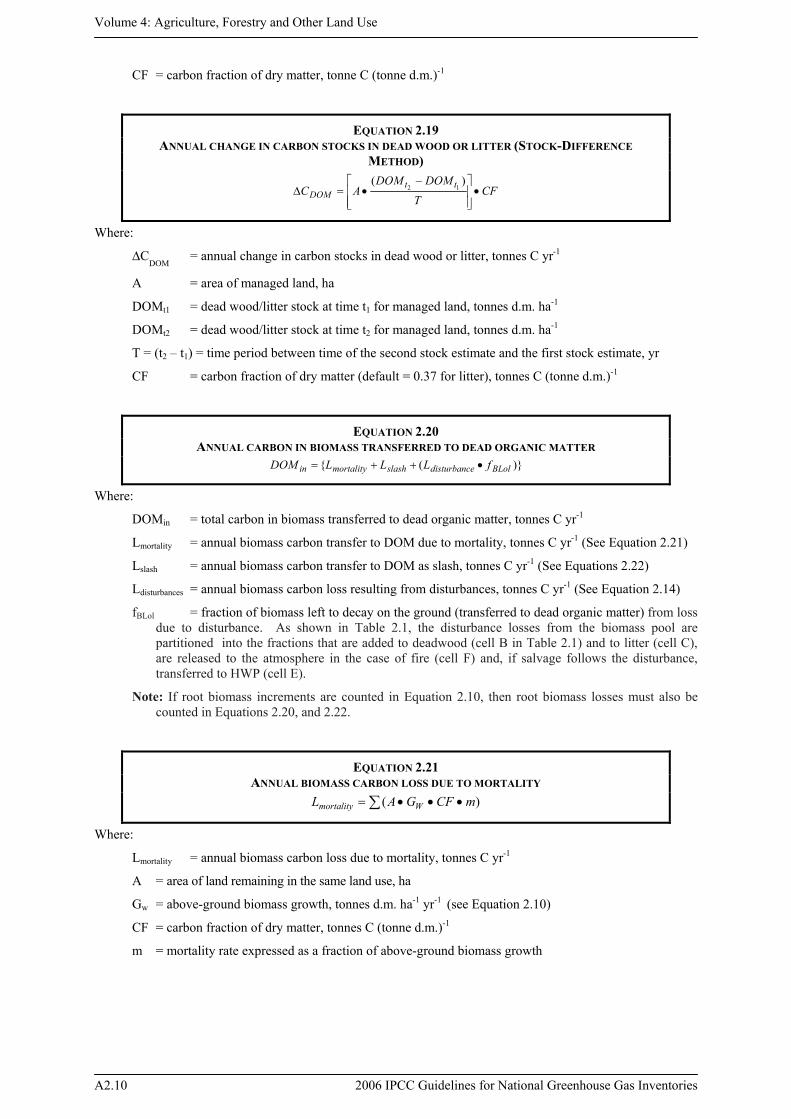
CF = carbon fraction of dry matter, tonne C (tonne d.m.)-1
EQUATION 2.19 ANNUAL CHANGE IN CARBON STOCKS IN DEAD WOOD OR LITTER (STOCK-DIFFERENCE
METHOD)
CFT
DOMDOMAC tt
DOM •⎥⎥⎦
⎤
⎢⎢⎣
⎡ −•=Δ
)(12
Where:
∆CDOM
= annual change in carbon stocks in dead wood or litter, tonnes C yr-1
A = area of managed land, ha
DOMt1 = dead wood/litter stock at time t1 for managed land, tonnes d.m. ha-1
DOMt2 = dead wood/litter stock at time t2 for managed land, tonnes d.m. ha-1
T = (t2 – t1) = time period between time of the second stock estimate and the first stock estimate, yr
CF = carbon fraction of dry matter (default = 0.37 for litter), tonnes C (tonne d.m.)-1
EQUATION 2.20 ANNUAL CARBON IN BIOMASS TRANSFERRED TO DEAD ORGANIC MATTER
)}({ BLoledisturbancslashmortalityin fLLLDOM •++=
Where:
DOMin = total carbon in biomass transferred to dead organic matter, tonnes C yr-1
Lmortality = annual biomass carbon transfer to DOM due to mortality, tonnes C yr-1 (See Equation 2.21)
Lslash = annual biomass carbon transfer to DOM as slash, tonnes C yr-1 (See Equations 2.22)
Ldisturbances = annual biomass carbon loss resulting from disturbances, tonnes C yr-1 (See Equation 2.14)
fBLol = fraction of biomass left to decay on the ground (transferred to dead organic matter) from loss due to disturbance. As shown in Table 2.1, the disturbance losses from the biomass pool are partitioned into the fractions that are added to deadwood (cell B in Table 2.1) and to litter (cell C), are released to the atmosphere in the case of fire (cell F) and, if salvage follows the disturbance, transferred to HWP (cell E).
Note: If root biomass increments are counted in Equation 2.10, then root biomass losses must also be counted in Equations 2.20, and 2.22.
EQUATION 2.21 ANNUAL BIOMASS CARBON LOSS DUE TO MORTALITY
∑ •••= )( mCFGAL Wmortality
Where:
Lmortality = annual biomass carbon loss due to mortality, tonnes C yr-1
A = area of land remaining in the same land use, ha
Gw = above-ground biomass growth, tonnes d.m. ha-1 yr-1 (see Equation 2.10)
CF = carbon fraction of dry matter, tonnes C (tonne d.m.)-1
m = mortality rate expressed as a fraction of above-ground biomass growth
Annex 2: Summary of Equations
2006 IPCC Guidelines for National Greenhouse Gas Inventories A2.11
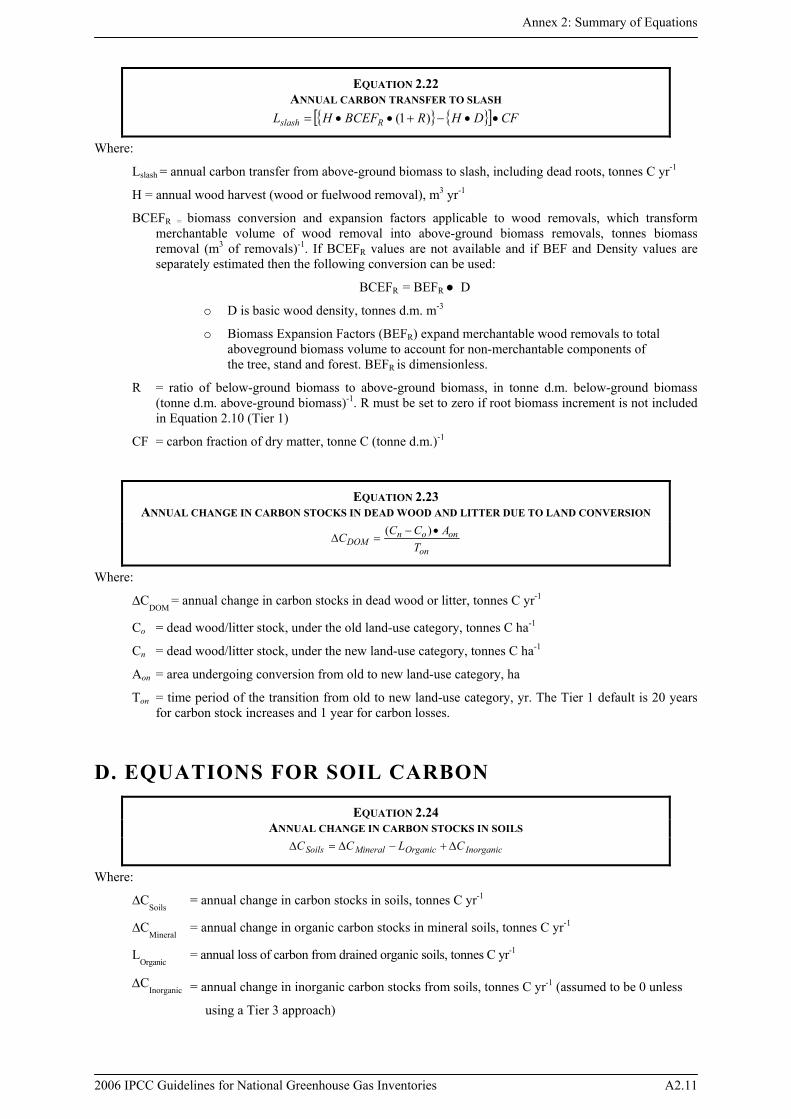
EQUATION 2.22 ANNUAL CARBON TRANSFER TO SLASH
{ } { }[ ] CFDHRBCEFHL Rslash ••−+••= )1(
Where:
Lslash = annual carbon transfer from above-ground biomass to slash, including dead roots, tonnes C yr-1
H = annual wood harvest (wood or fuelwood removal), m3 yr-1
BCEFR = biomass conversion and expansion factors applicable to wood removals, which transform merchantable volume of wood removal into above-ground biomass removals, tonnes biomass removal (m3 of removals)-1. If BCEFR values are not available and if BEF and Density values are separately estimated then the following conversion can be used:
BCEFR = BEFR ● D
o D is basic wood density, tonnes d.m. m-3
o Biomass Expansion Factors (BEFR) expand merchantable wood removals to total aboveground biomass volume to account for non-merchantable components of the tree, stand and forest. BEFR is dimensionless.
R = ratio of below-ground biomass to above-ground biomass, in tonne d.m. below-ground biomass (tonne d.m. above-ground biomass)-1. R must be set to zero if root biomass increment is not included in Equation 2.10 (Tier 1)
CF = carbon fraction of dry matter, tonne C (tonne d.m.)-1
EQUATION 2.23 ANNUAL CHANGE IN CARBON STOCKS IN DEAD WOOD AND LITTER DUE TO LAND CONVERSION
on
ononDOM T
ACCC •−=Δ
)(
Where:
∆CDOM
= annual change in carbon stocks in dead wood or litter, tonnes C yr-1
Co = dead wood/litter stock, under the old land-use category, tonnes C ha-1
Cn = dead wood/litter stock, under the new land-use category, tonnes C ha-1
Aon = area undergoing conversion from old to new land-use category, ha
Ton = time period of the transition from old to new land-use category, yr. The Tier 1 default is 20 years for carbon stock increases and 1 year for carbon losses.
D. EQUATIONS FOR SOIL CARBON
EQUATION 2.24 ANNUAL CHANGE IN CARBON STOCKS IN SOILS
InorganicOrganicMineralSoils CLCC Δ+−Δ=Δ
Where:
∆CSoils
= annual change in carbon stocks in soils, tonnes C yr-1
∆CMineral
= annual change in organic carbon stocks in mineral soils, tonnes C yr-1
LOrganic
= annual loss of carbon from drained organic soils, tonnes C yr-1
ΔCInorganic = annual change in inorganic carbon stocks from soils, tonnes C yr-1 (assumed to be 0 unless
using a Tier 3 approach)
Volume 4: Agriculture, Forestry and Other Land Use
A2.12 2006 IPCC Guidelines for National Greenhouse Gas Inventories
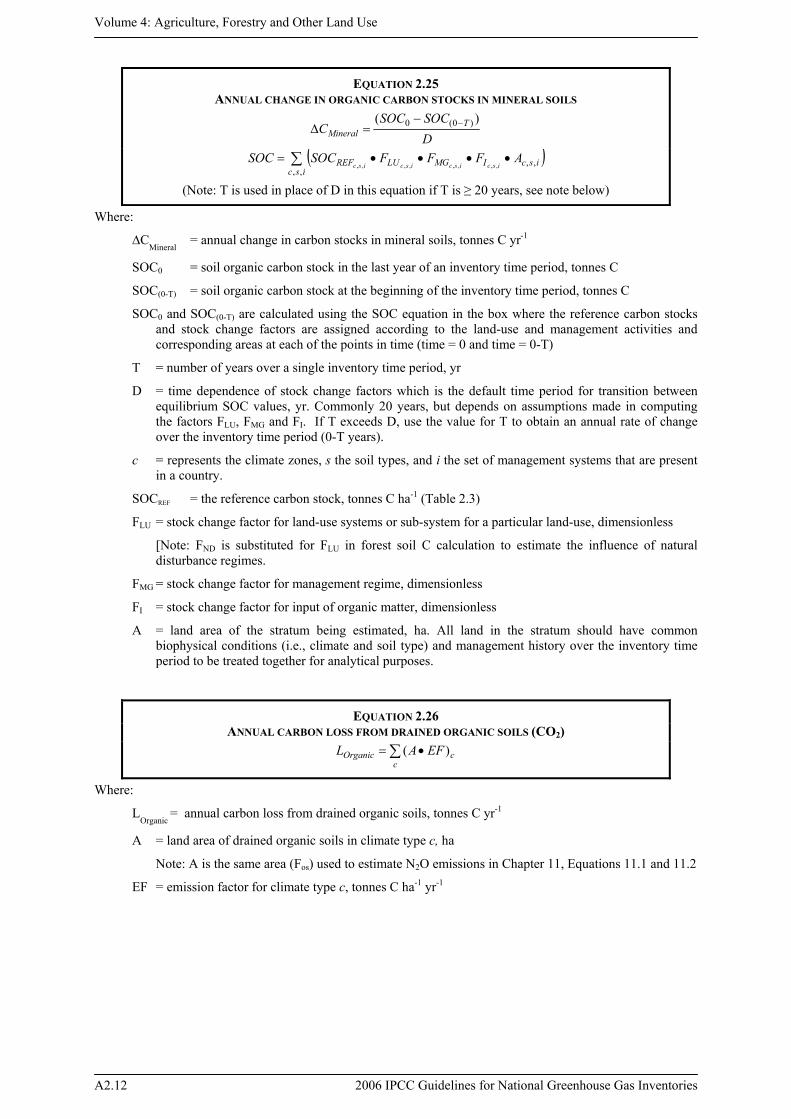
EQUATION 2.25 ANNUAL CHANGE IN ORGANIC CARBON STOCKS IN MINERAL SOILS
DSOCSOC
C TMineral
)( )0(0 −−=Δ
( )∑ ••••=isc
iscIMGLUREF AFFFSOCSOCiscisciscisc
,,,,,,,,,,,,
(Note: T is used in place of D in this equation if T is ≥ 20 years, see note below)
Where:
∆CMineral
= annual change in carbon stocks in mineral soils, tonnes C yr-1
SOC0 = soil organic carbon stock in the last year of an inventory time period, tonnes C
SOC(0-T) = soil organic carbon stock at the beginning of the inventory time period, tonnes C
SOC0 and SOC(0-T) are calculated using the SOC equation in the box where the reference carbon stocks and stock change factors are assigned according to the land-use and management activities and corresponding areas at each of the points in time (time = 0 and time = 0-T)
T = number of years over a single inventory time period, yr
D = time dependence of stock change factors which is the default time period for transition between equilibrium SOC values, yr. Commonly 20 years, but depends on assumptions made in computing the factors FLU, FMG and FI. If T exceeds D, use the value for T to obtain an annual rate of change over the inventory time period (0-T years).
c = represents the climate zones, s the soil types, and i the set of management systems that are present in a country.
SOCREF = the reference carbon stock, tonnes C ha-1 (Table 2.3)
FLU = stock change factor for land-use systems or sub-system for a particular land-use, dimensionless
[Note: FND is substituted for FLU in forest soil C calculation to estimate the influence of natural disturbance regimes.
FMG = stock change factor for management regime, dimensionless
FI = stock change factor for input of organic matter, dimensionless
A = land area of the stratum being estimated, ha. All land in the stratum should have common biophysical conditions (i.e., climate and soil type) and management history over the inventory time period to be treated together for analytical purposes.
EQUATION 2.26 ANNUAL CARBON LOSS FROM DRAINED ORGANIC SOILS (CO2)
∑ •=c
cOrganic EFAL )(
Where:
LOrganic
= annual carbon loss from drained organic soils, tonnes C yr-1
A = land area of drained organic soils in climate type c, ha
Note: A is the same area (Fos) used to estimate N2O emissions in Chapter 11, Equations 11.1 and 11.2
EF = emission factor for climate type c, tonnes C ha-1 yr-1
Annex 2: Summary of Equations
2006 IPCC Guidelines for National Greenhouse Gas Inventories A2.13
E. EQUATIONS FOR BIOMASS BURNING
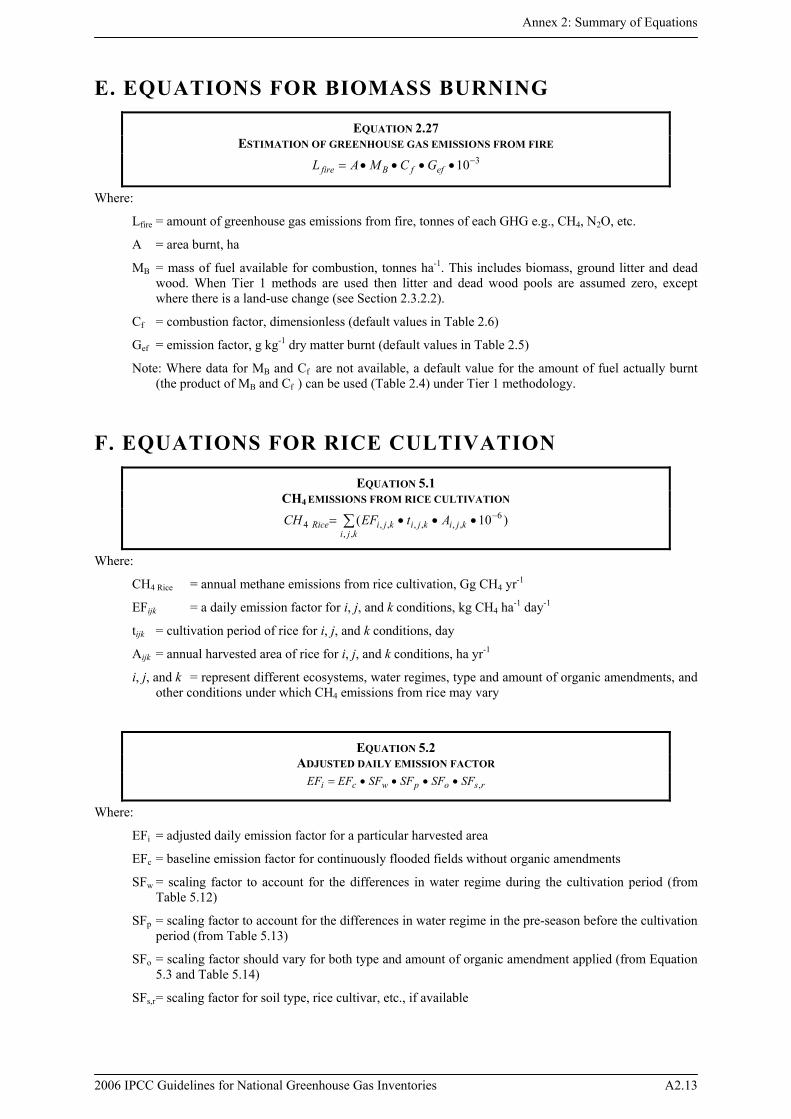
EQUATION 2.27 ESTIMATION OF GREENHOUSE GAS EMISSIONS FROM FIRE
310−••••= effBfire GCMAL
Where:
Lfire = amount of greenhouse gas emissions from fire, tonnes of each GHG e.g., CH4, N2O, etc.
A = area burnt, ha
MB = mass of fuel available for combustion, tonnes ha-1. This includes biomass, ground litter and dead wood. When Tier 1 methods are used then litter and dead wood pools are assumed zero, except where there is a land-use change (see Section 2.3.2.2).
Cf = combustion factor, dimensionless (default values in Table 2.6)
Gef = emission factor, g kg-1 dry matter burnt (default values in Table 2.5)
Note: Where data for MB and Cf are not available, a default value for the amount of fuel actually burnt (the product of MB and Cf ) can be used (Table 2.4) under Tier 1 methodology.
F. EQUATIONS FOR RICE CULTIVATION
EQUATION 5.1 CH4 EMISSIONS FROM RICE CULTIVATION
∑ −•••=kji
kjikjikjiRice AtEFCH,,
6,,,,,,4 )10(
Where:
CH4 Rice = annual methane emissions from rice cultivation, Gg CH4 yr-1
EFijk = a daily emission factor for i, j, and k conditions, kg CH4 ha-1 day-1
tijk = cultivation period of rice for i, j, and k conditions, day
Aijk = annual harvested area of rice for i, j, and k conditions, ha yr-1
i, j, and k = represent different ecosystems, water regimes, type and amount of organic amendments, and other conditions under which CH4 emissions from rice may vary
EQUATION 5.2 ADJUSTED DAILY EMISSION FACTOR
rsopwci SFSFSFSFEFEF ,••••=
Where:
EFi = adjusted daily emission factor for a particular harvested area
EFc = baseline emission factor for continuously flooded fields without organic amendments
SFw = scaling factor to account for the differences in water regime during the cultivation period (from Table 5.12)
SFp = scaling factor to account for the differences in water regime in the pre-season before the cultivation period (from Table 5.13)
SFo = scaling factor should vary for both type and amount of organic amendment applied (from Equation 5.3 and Table 5.14)
SFs,r = scaling factor for soil type, rice cultivar, etc., if available
Volume 4: Agriculture, Forestry and Other Land Use
A2.14 2006 IPCC Guidelines for National Greenhouse Gas Inventories
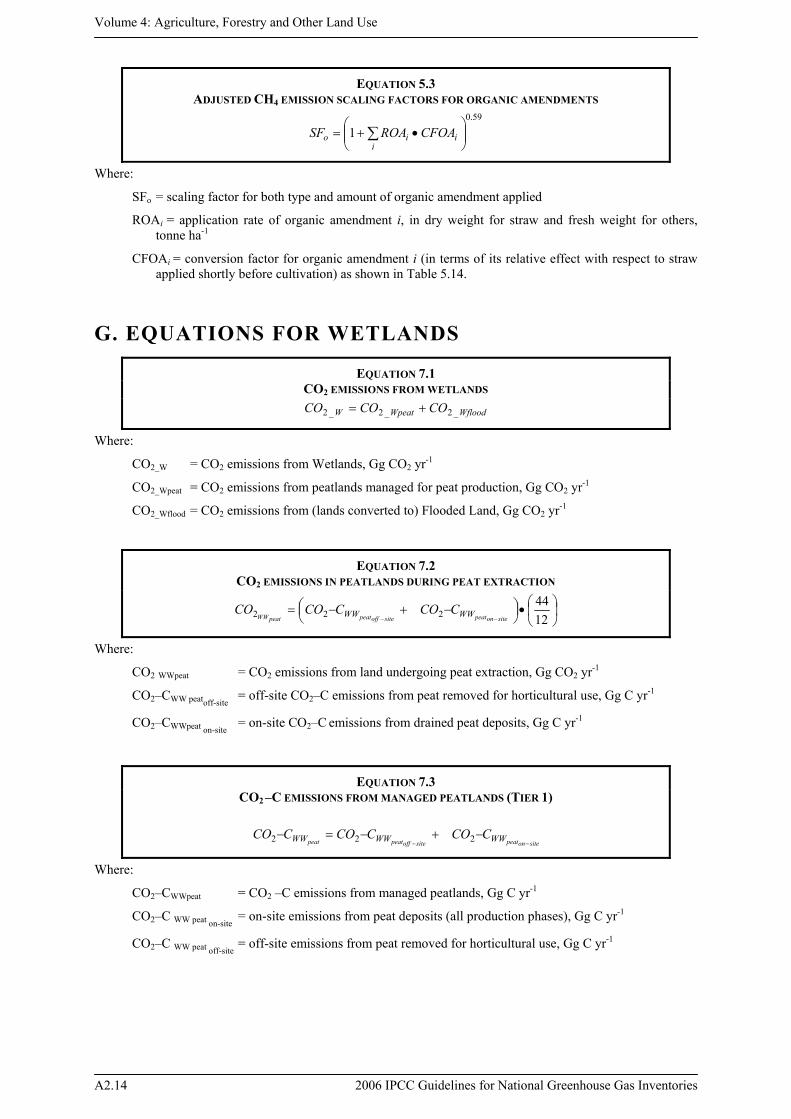
EQUATION 5.3 ADJUSTED CH4 EMISSION SCALING FACTORS FOR ORGANIC AMENDMENTS
59.0
1 ⎟⎟⎠
⎞⎜⎜⎝
⎛•+= ∑
iiio CFOAROASF
Where:
SFo = scaling factor for both type and amount of organic amendment applied
ROAi = application rate of organic amendment i, in dry weight for straw and fresh weight for others, tonne ha-1
CFOAi = conversion factor for organic amendment i (in terms of its relative effect with respect to straw applied shortly before cultivation) as shown in Table 5.14.
G. EQUATIONS FOR WETLANDS
EQUATION 7.1 CO2 EMISSIONS FROM WETLANDS
WfloodWpeatW COCOCO _2_2_2 +=
Where:
CO2_W = CO2 emissions from Wetlands, Gg CO2 yr-1
CO2_Wpeat = CO2 emissions from peatlands managed for peat production, Gg CO2 yr-1
CO2_Wflood = CO2 emissions from (lands converted to) Flooded Land, Gg CO2 yr-1
EQUATION 7.2 CO2 EMISSIONS IN PEATLANDS DURING PEAT EXTRACTION
⎟⎠⎞
⎜⎝⎛•⎟
⎠⎞⎜
⎝⎛ −+−=
−− 1244
222 siteonpeatsiteoffpeatpeatWW WWWW CCOCCOCO
Where:
CO2 WWpeat = CO2 emissions from land undergoing peat extraction, Gg CO2 yr-1
CO2–CWW peatoff-site = off-site CO2–C emissions from peat removed for horticultural use, Gg C yr-1
CO2–CWWpeat on-site = on-site CO2–C emissions from drained peat deposits, Gg C yr-1
EQUATION 7.3 CO2 –C EMISSIONS FROM MANAGED PEATLANDS (TIER 1)
siteonpeatsiteoffpeatpeat WWWWWW CCOCCOCCO−−
−+−=− 222
Where:
CO2–CWWpeat = CO2 –C emissions from managed peatlands, Gg C yr-1
CO2–C WW peat on-site = on-site emissions from peat deposits (all production phases), Gg C yr-1
CO2–C WW peat off-site = off-site emissions from peat removed for horticultural use, Gg C yr-1
Annex 2: Summary of Equations
2006 IPCC Guidelines for National Greenhouse Gas Inventories A2.15
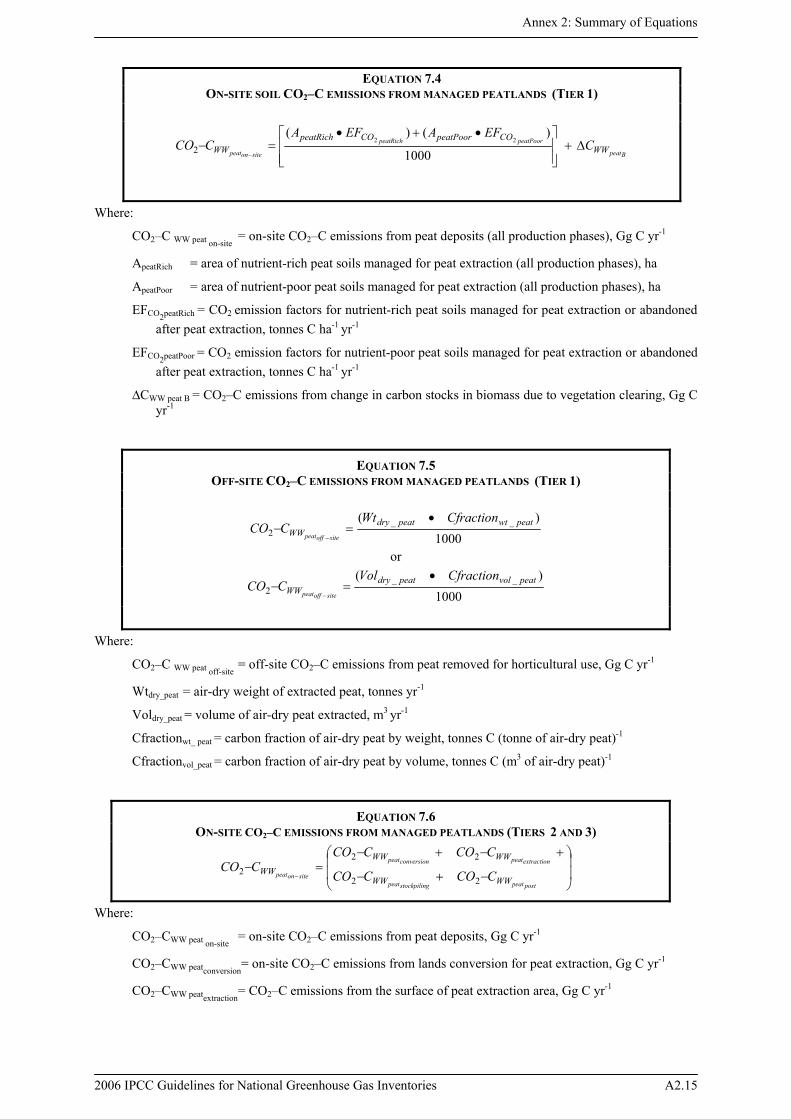
EQUATION 7.4 ON-SITE SOIL CO2–C EMISSIONS FROM MANAGED PEATLANDS (TIER 1)
Bpeat
peatPoorpeatRich
siteonpeat WWCOpeatPoorCOpeatRich
WW CEFAEFA
CCO Δ+⎥⎥⎦
⎤
⎢⎢⎣
⎡ •+•=−
− 1000
)()(22
2
Where:
CO2–C WW peat on-site = on-site CO2–C emissions from peat deposits (all production phases), Gg C yr-1
ApeatRich = area of nutrient-rich peat soils managed for peat extraction (all production phases), ha
ApeatPoor = area of nutrient-poor peat soils managed for peat extraction (all production phases), ha
EFCO2peatRich = CO2 emission factors for nutrient-rich peat soils managed for peat extraction or abandoned after peat extraction, tonnes C ha-1 yr-1
EFCO2peatPoor = CO2 emission factors for nutrient-poor peat soils managed for peat extraction or abandoned after peat extraction, tonnes C ha-1 yr-1
∆CWW peat B = CO2–C emissions from change in carbon stocks in biomass due to vegetation clearing, Gg C yr-1
EQUATION 7.5 OFF-SITE CO2–C EMISSIONS FROM MANAGED PEATLANDS (TIER 1)
1000)( __
2peatwtpeatdry
WWCfractionWt
CCOsiteoffpeat
•=−
−
or
1000)( __
2peatvolpeatdry
WWCfractionVol
CCOsiteoffpeat
•=−
−
Where:
CO2–C WW peat off-site = off-site CO2–C emissions from peat removed for horticultural use, Gg C yr-1
Wtdry_peat = air-dry weight of extracted peat, tonnes yr-1
Voldry_peat = volume of air-dry peat extracted, m3 yr-1
Cfractionwt_ peat = carbon fraction of air-dry peat by weight, tonnes C (tonne of air-dry peat)-1
Cfractionvol_peat = carbon fraction of air-dry peat by volume, tonnes C (m3 of air-dry peat)-1
EQUATION 7.6 ON-SITE CO2–C EMISSIONS FROM MANAGED PEATLANDS (TIERS 2 AND 3)
⎟⎟
⎠
⎞
⎜⎜
⎝
⎛
−+−
+−+−=−
−postpeatgstockpilinpeat
extractionpeatconversionpeat
siteonpeatWWWW
WWWWWW CCOCCO
CCOCCOCCO
22
222
Where:
CO2–CWW peat on-site = on-site CO2–C emissions from peat deposits, Gg C yr-1
CO2–CWW peatconversion= on-site CO2–C emissions from lands conversion for peat extraction, Gg C yr-1
CO2–CWW peatextraction = CO2–C emissions from the surface of peat extraction area, Gg C yr-1
Volume 4: Agriculture, Forestry and Other Land Use
A2.16 2006 IPCC Guidelines for National Greenhouse Gas Inventories
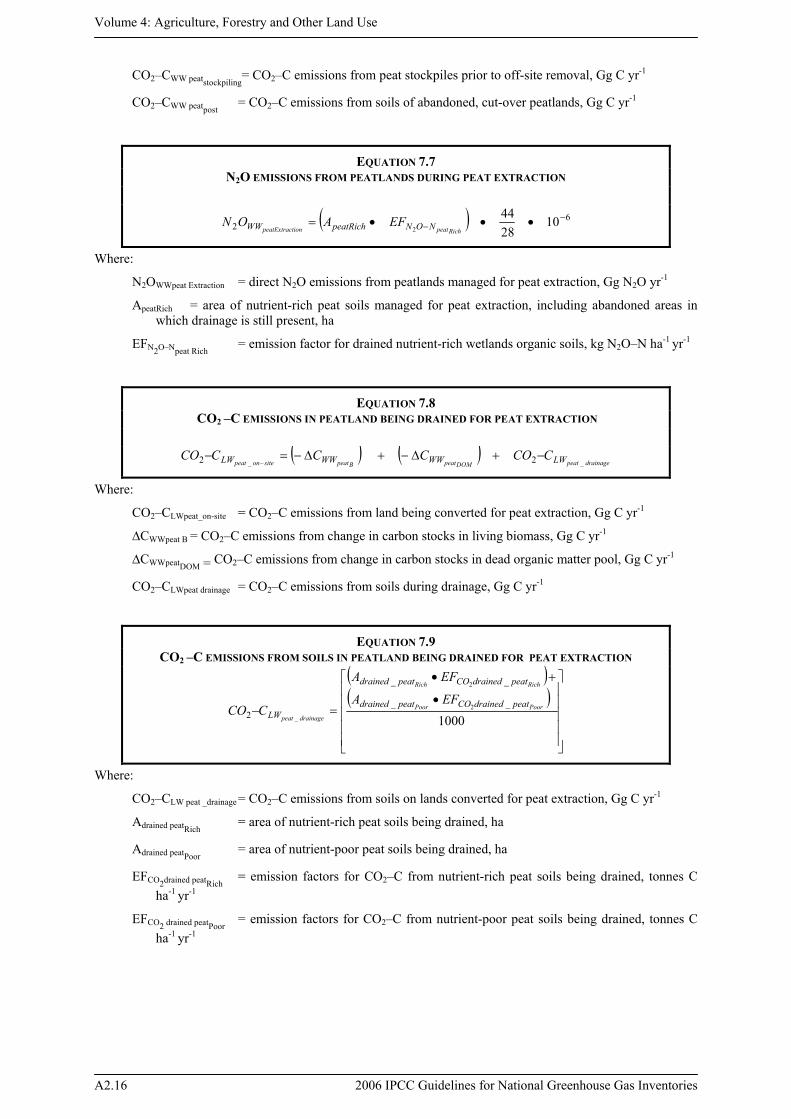
CO2–CWW peatstockpiling= CO2–C emissions from peat stockpiles prior to off-site removal, Gg C yr-1
CO2–CWW peatpost = CO2–C emissions from soils of abandoned, cut-over peatlands, Gg C yr-1
EQUATION 7.7 N2O EMISSIONS FROM PEATLANDS DURING PEAT EXTRACTION
( ) 62 10
2844
2
−− •••=
RichpeattionpeatExtrac NONpeatRichWW EFAON
Where:
N2OWWpeat Extraction = direct N2O emissions from peatlands managed for peat extraction, Gg N2O yr-1
ApeatRich = area of nutrient-rich peat soils managed for peat extraction, including abandoned areas in which drainage is still present, ha
EFN2O–Npeat Rich = emission factor for drained nutrient-rich wetlands organic soils, kg N2O–N ha-1 yr-1
EQUATION 7.8 CO2 –C EMISSIONS IN PEATLAND BEING DRAINED FOR PEAT EXTRACTION
( ) ( )
drainagepeatDOMpeatBpeatsiteonpeat LWWWWWLW CCOCCCCO__ 22 −+Δ−+Δ−=−
−
Where:
CO2–CLWpeat_on-site = CO2–C emissions from land being converted for peat extraction, Gg C yr-1
∆CWWpeat B = CO2–C emissions from change in carbon stocks in living biomass, Gg C yr-1
∆CWWpeatDOM = CO2–C emissions from change in carbon stocks in dead organic matter pool, Gg C yr-1
CO2–CLWpeat drainage = CO2–C emissions from soils during drainage, Gg C yr-1
EQUATION 7.9 CO2 –C EMISSIONS FROM SOILS IN PEATLAND BEING DRAINED FOR PEAT EXTRACTION
( )( )
⎥⎥⎥⎥⎥
⎦
⎤
⎢⎢⎢⎢⎢
⎣
⎡
•
+•
=−1000
__
__
22
2
_
PoorPoor
RichRich
drainagepeat
peatdrainedCOpeatdrained
peatdrainedCOpeatdrained
LWEFA
EFA
CCO
Where:
CO2–CLW peat _drainage = CO2–C emissions from soils on lands converted for peat extraction, Gg C yr-1
Adrained peatRich = area of nutrient-rich peat soils being drained, ha
Adrained peatPoor = area of nutrient-poor peat soils being drained, ha
EFCO2drained peatRich = emission factors for CO2–C from nutrient-rich peat soils being drained, tonnes C ha-1 yr-1
EFCO2 drained peatPoor = emission factors for CO2–C from nutrient-poor peat soils being drained, tonnes C
ha-1 yr-1
Annex 2: Summary of Equations
2006 IPCC Guidelines for National Greenhouse Gas Inventories A2.17
EQUATION 7.10 ANNUAL CHANGE IN CARBON STOCKS IN LIVING BIOMASS ON LAND CONVERTED TO
PERMANENTLY FLOODED LAND
1244
)(
_2−
•Δ=
•⎥⎦
⎤⎢⎣
⎡−•=Δ ∑
LB
iiLB
LWfloodLWflood
Beforei
AfteriLWflood
CCO
CFBBAC
Where:
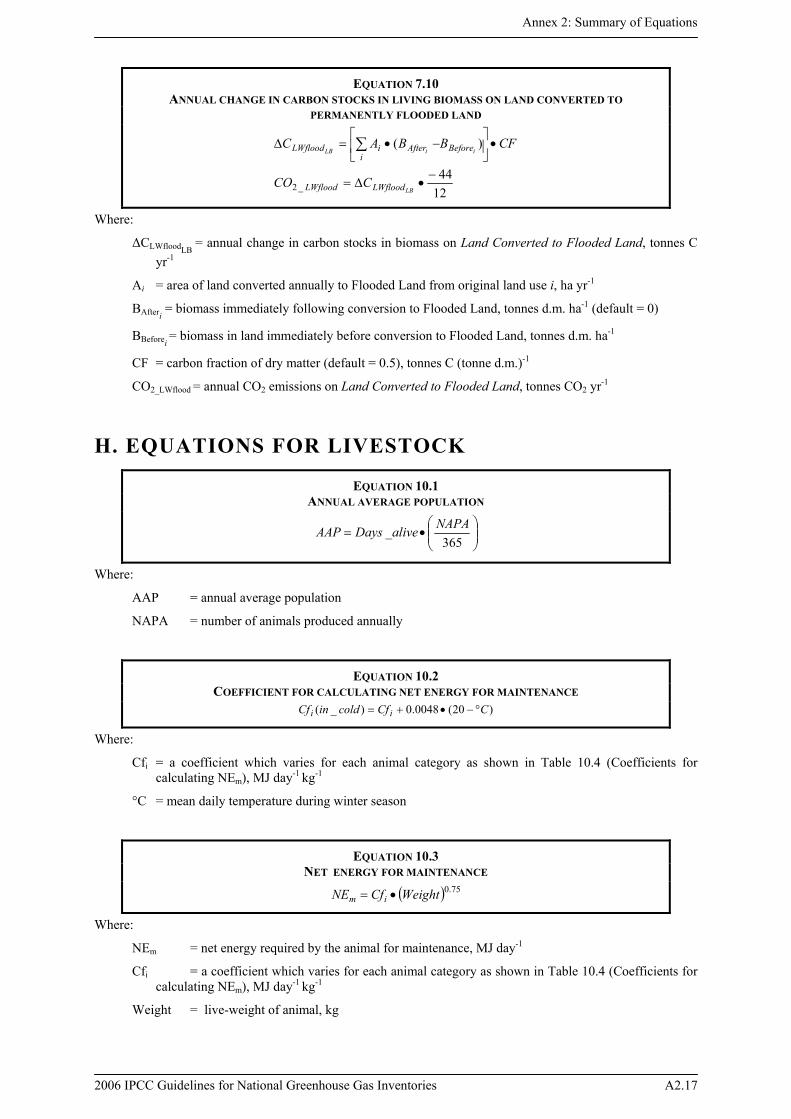
ΔCLWfloodLB = annual change in carbon stocks in biomass on Land Converted to Flooded Land, tonnes C
yr-1
Ai = area of land converted annually to Flooded Land from original land use i, ha yr-1
BAfteri = biomass immediately following conversion to Flooded Land, tonnes d.m. ha-1 (default = 0)
BBeforei = biomass in land immediately before conversion to Flooded Land, tonnes d.m. ha-1
CF = carbon fraction of dry matter (default = 0.5), tonnes C (tonne d.m.)-1
CO2_LWflood = annual CO2 emissions on Land Converted to Flooded Land, tonnes CO2 yr-1
H. EQUATIONS FOR LIVESTOCK
EQUATION 10.1 ANNUAL AVERAGE POPULATION
⎟⎟⎠
⎞⎜⎜⎝
⎛•=
365_ NAPAaliveDaysAAP
Where:
AAP = annual average population
NAPA = number of animals produced annually
EQUATION 10.2 COEFFICIENT FOR CALCULATING NET ENERGY FOR MAINTENANCE
)20(0048.0)_( CCfcoldinCf ii °−•+=
Where:
Cfi = a coefficient which varies for each animal category as shown in Table 10.4 (Coefficients for calculating NEm), MJ day-1 kg-1
°C = mean daily temperature during winter season
EQUATION 10.3 NET ENERGY FOR MAINTENANCE
( ) 75.0WeightCfNE im •=
Where:
NEm = net energy required by the animal for maintenance, MJ day-1
Cfi = a coefficient which varies for each animal category as shown in Table 10.4 (Coefficients for calculating NEm), MJ day-1 kg-1
Weight = live-weight of animal, kg
Volume 4: Agriculture, Forestry and Other Land Use
A2.18 2006 IPCC Guidelines for National Greenhouse Gas Inventories
EQUATION 10.4 NET ENERGY FOR ACTIVITY (FOR CATTLE AND BUFFALO)
maa NECNE •=
Where:
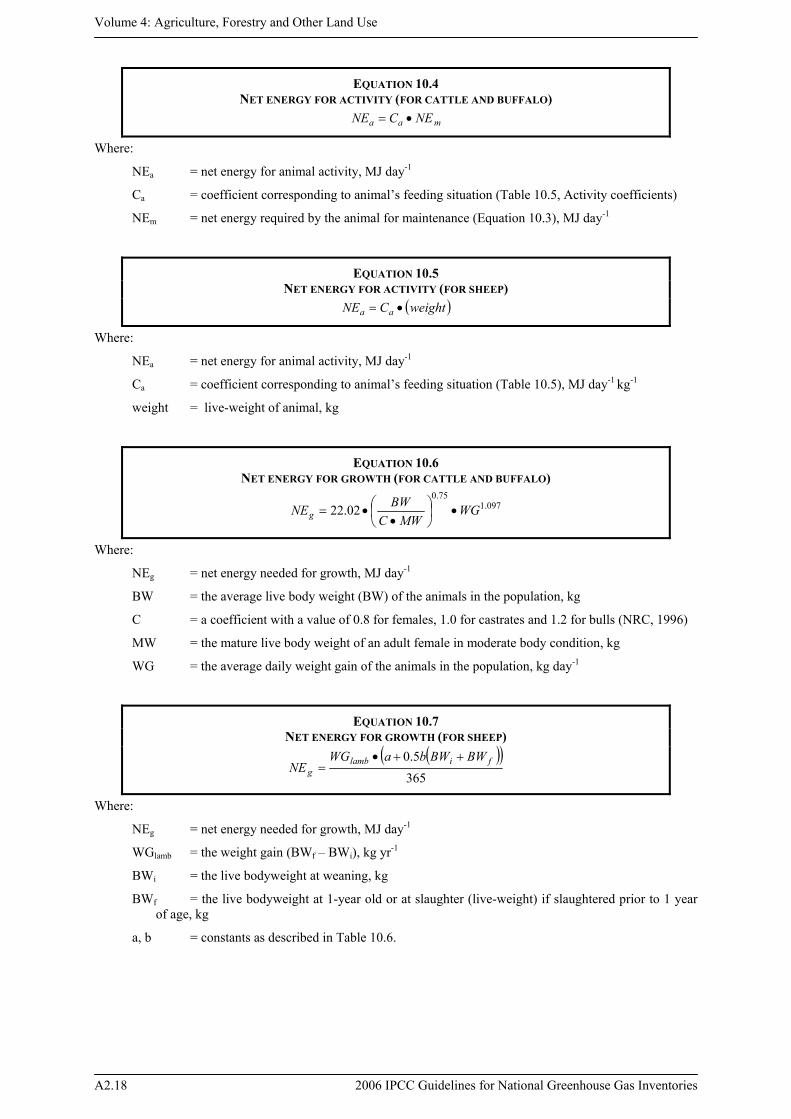
NEa = net energy for animal activity, MJ day-1
Ca = coefficient corresponding to animal’s feeding situation (Table 10.5, Activity coefficients)
NEm = net energy required by the animal for maintenance (Equation 10.3), MJ day-1
EQUATION 10.5 NET ENERGY FOR ACTIVITY (FOR SHEEP)
( )weightCNE aa •=
Where:
NEa = net energy for animal activity, MJ day-1
Ca = coefficient corresponding to animal’s feeding situation (Table 10.5), MJ day-1 kg-1
weight = live-weight of animal, kg
EQUATION 10.6 NET ENERGY FOR GROWTH (FOR CATTLE AND BUFFALO)
097.175.0
02.22 WGMWC
BWNEg •⎟⎠⎞
⎜⎝⎛
••=
Where:
NEg = net energy needed for growth, MJ day-1
BW = the average live body weight (BW) of the animals in the population, kg
C = a coefficient with a value of 0.8 for females, 1.0 for castrates and 1.2 for bulls (NRC, 1996)
MW = the mature live body weight of an adult female in moderate body condition, kg
WG = the average daily weight gain of the animals in the population, kg day-1
EQUATION 10.7 NET ENERGY FOR GROWTH (FOR SHEEP)
( )( )365
5.0 filambg
BWBWbaWGNE
++•=
Where:
NEg = net energy needed for growth, MJ day-1
WGlamb = the weight gain (BWf – BWi), kg yr-1
BWi = the live bodyweight at weaning, kg
BWf = the live bodyweight at 1-year old or at slaughter (live-weight) if slaughtered prior to 1 year of age, kg
a, b = constants as described in Table 10.6.
Annex 2: Summary of Equations
2006 IPCC Guidelines for National Greenhouse Gas Inventories A2.19
EQUATION 10.8 NET ENERGY FOR LACTATION (FOR BEEF CATTLE, DAIRY CATTLE AND BUFFALO)
( )FatMilkNE •+•= 40.047.11
Where:
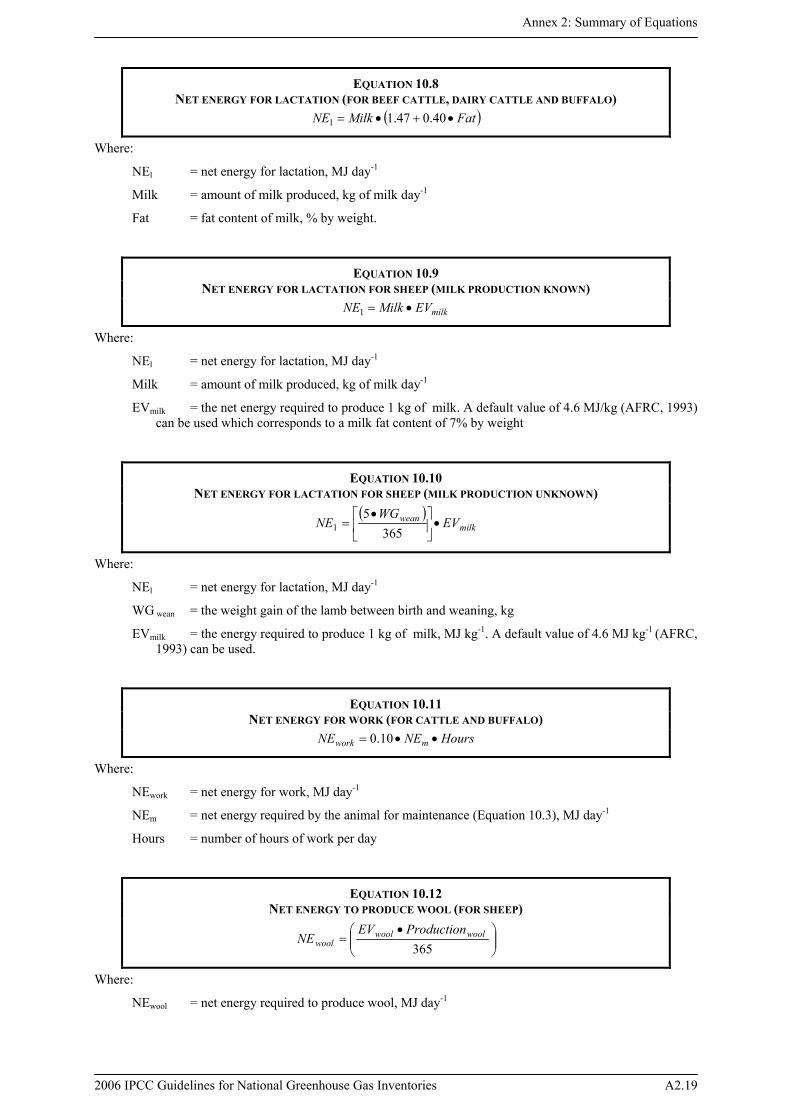
NEl = net energy for lactation, MJ day-1
Milk = amount of milk produced, kg of milk day-1
Fat = fat content of milk, % by weight.
EQUATION 10.9 NET ENERGY FOR LACTATION FOR SHEEP (MILK PRODUCTION KNOWN)
milkEVMilkNE •=1
Where:
NEl = net energy for lactation, MJ day-1
Milk = amount of milk produced, kg of milk day-1
EVmilk = the net energy required to produce 1 kg of milk. A default value of 4.6 MJ/kg (AFRC, 1993) can be used which corresponds to a milk fat content of 7% by weight
EQUATION 10.10 NET ENERGY FOR LACTATION FOR SHEEP (MILK PRODUCTION UNKNOWN)
( )milk
wean EVWG
NE •⎥⎦
⎤⎢⎣
⎡ •=
3655
1
Where:
NEl = net energy for lactation, MJ day-1
WG wean = the weight gain of the lamb between birth and weaning, kg
EVmilk = the energy required to produce 1 kg of milk, MJ kg-1. A default value of 4.6 MJ kg-1 (AFRC, 1993) can be used.
EQUATION 10.11 NET ENERGY FOR WORK (FOR CATTLE AND BUFFALO)
HoursNENE mwork ••= 10.0
Where:
NEwork = net energy for work, MJ day-1
NEm = net energy required by the animal for maintenance (Equation 10.3), MJ day-1
Hours = number of hours of work per day
EQUATION 10.12 NET ENERGY TO PRODUCE WOOL (FOR SHEEP)
⎟⎟⎠
⎞⎜⎜⎝
⎛ •=
365woolwool
woolductionProEV
NE
Where:
NEwool = net energy required to produce wool, MJ day-1
Volume 4: Agriculture, Forestry and Other Land Use
A2.20 2006 IPCC Guidelines for National Greenhouse Gas Inventories
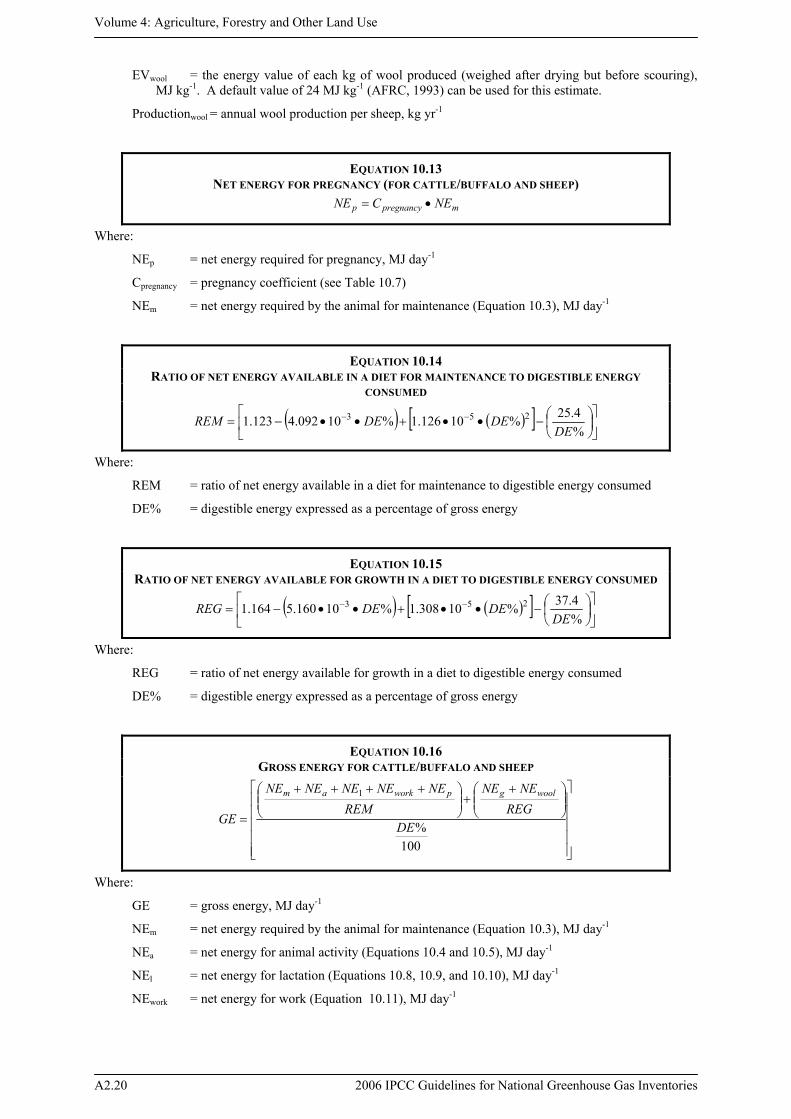
EVwool = the energy value of each kg of wool produced (weighed after drying but before scouring), MJ kg-1. A default value of 24 MJ kg-1 (AFRC, 1993) can be used for this estimate.
Productionwool = annual wool production per sheep, kg yr-1
EQUATION 10.13 NET ENERGY FOR PREGNANCY (FOR CATTLE/BUFFALO AND SHEEP)
mpregnancyp NECNE •=
Where:
NEp = net energy required for pregnancy, MJ day-1
Cpregnancy = pregnancy coefficient (see Table 10.7)
NEm = net energy required by the animal for maintenance (Equation 10.3), MJ day-1
EQUATION 10.14 RATIO OF NET ENERGY AVAILABLE IN A DIET FOR MAINTENANCE TO DIGESTIBLE ENERGY
CONSUMED
( ) ( )[ ] ⎥⎦
⎤⎢⎣
⎡⎟⎠⎞
⎜⎝⎛−••+••−= −−
%4.25%10126.1%10092.4123.1 253
DEDEDEREM
Where:
REM = ratio of net energy available in a diet for maintenance to digestible energy consumed
DE% = digestible energy expressed as a percentage of gross energy
EQUATION 10.15 RATIO OF NET ENERGY AVAILABLE FOR GROWTH IN A DIET TO DIGESTIBLE ENERGY CONSUMED
( ) ( )[ ] ⎥⎦
⎤⎢⎣
⎡⎟⎠⎞
⎜⎝⎛−••+••−= −−
%4.37%10308.1%10160.5164.1 253
DEDEDEREG
Where:
REG = ratio of net energy available for growth in a diet to digestible energy consumed
DE% = digestible energy expressed as a percentage of gross energy
EQUATION 10.16 GROSS ENERGY FOR CATTLE/BUFFALO AND SHEEP
⎥⎥⎥⎥⎥
⎦
⎤
⎢⎢⎢⎢⎢
⎣
⎡⎟⎟⎠
⎞⎜⎜⎝
⎛ ++⎟⎟
⎠
⎞⎜⎜⎝
⎛ ++++
=
100%
1
DEREG
NENEREM
NENENENENE
GE
woolgpworkam
Where:
GE = gross energy, MJ day-1
NEm = net energy required by the animal for maintenance (Equation 10.3), MJ day-1
NEa = net energy for animal activity (Equations 10.4 and 10.5), MJ day-1
NEl = net energy for lactation (Equations 10.8, 10.9, and 10.10), MJ day-1
NEwork = net energy for work (Equation 10.11), MJ day-1
Annex 2: Summary of Equations
2006 IPCC Guidelines for National Greenhouse Gas Inventories A2.21
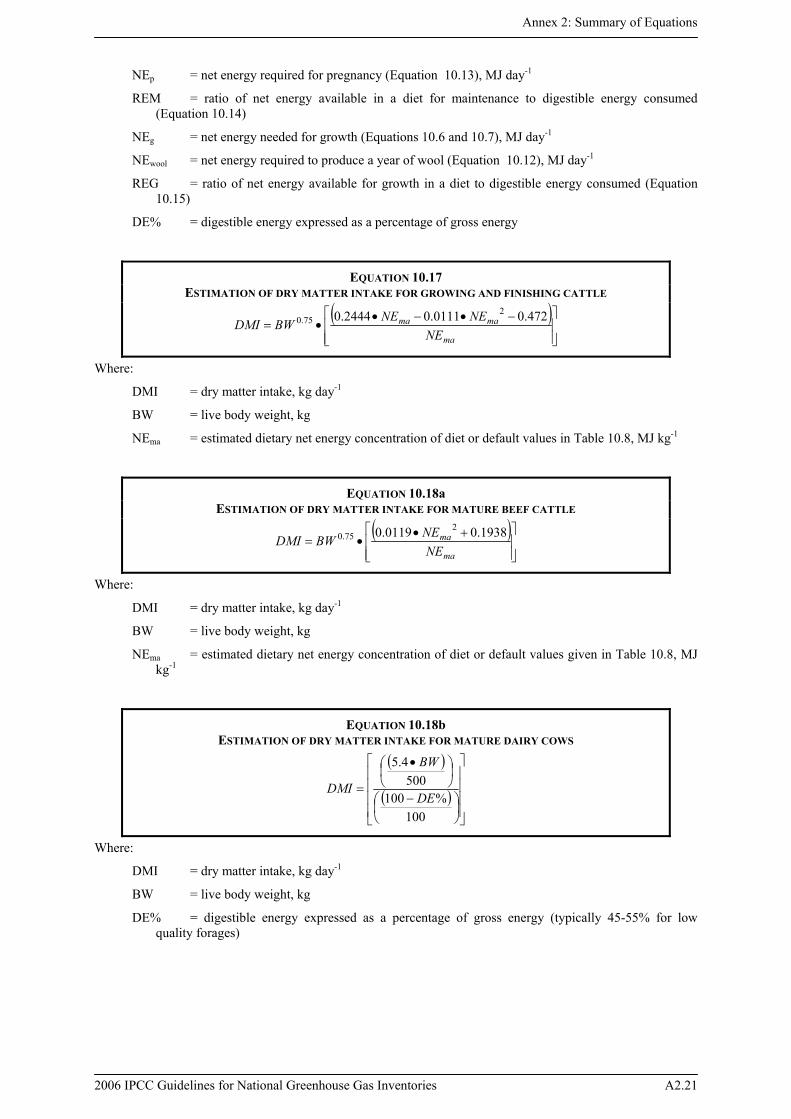
NEp = net energy required for pregnancy (Equation 10.13), MJ day-1
REM = ratio of net energy available in a diet for maintenance to digestible energy consumed (Equation 10.14)
NEg = net energy needed for growth (Equations 10.6 and 10.7), MJ day-1
NEwool = net energy required to produce a year of wool (Equation 10.12), MJ day-1
REG = ratio of net energy available for growth in a diet to digestible energy consumed (Equation 10.15)
DE% = digestible energy expressed as a percentage of gross energy
EQUATION 10.17 ESTIMATION OF DRY MATTER INTAKE FOR GROWING AND FINISHING CATTLE
( )⎥⎥⎦
⎤
⎢⎢⎣
⎡ −•−••=
ma
mama
NENENEBWDMI 472.00111.02444.0 2
75.0
Where:
DMI = dry matter intake, kg day-1
BW = live body weight, kg
NEma = estimated dietary net energy concentration of diet or default values in Table 10.8, MJ kg-1
EQUATION 10.18a ESTIMATION OF DRY MATTER INTAKE FOR MATURE BEEF CATTLE
( )⎥⎥⎦
⎤
⎢⎢⎣
⎡ +••=
ma
ma
NENEBWDMI 1938.00119.0 2
75.0
Where:
DMI = dry matter intake, kg day-1
BW = live body weight, kg
NEma = estimated dietary net energy concentration of diet or default values given in Table 10.8, MJ kg-1
EQUATION 10.18b ESTIMATION OF DRY MATTER INTAKE FOR MATURE DAIRY COWS
( )
( )⎥⎥⎥⎥
⎦
⎤
⎢⎢⎢⎢
⎣
⎡
⎟⎠⎞
⎜⎝⎛ −
⎟⎠⎞
⎜⎝⎛ •
=
100%100
5004.5
DE
BW
DMI
Where:
DMI = dry matter intake, kg day-1
BW = live body weight, kg
DE% = digestible energy expressed as a percentage of gross energy (typically 45-55% for low quality forages)
Volume 4: Agriculture, Forestry and Other Land Use
A2.22 2006 IPCC Guidelines for National Greenhouse Gas Inventories
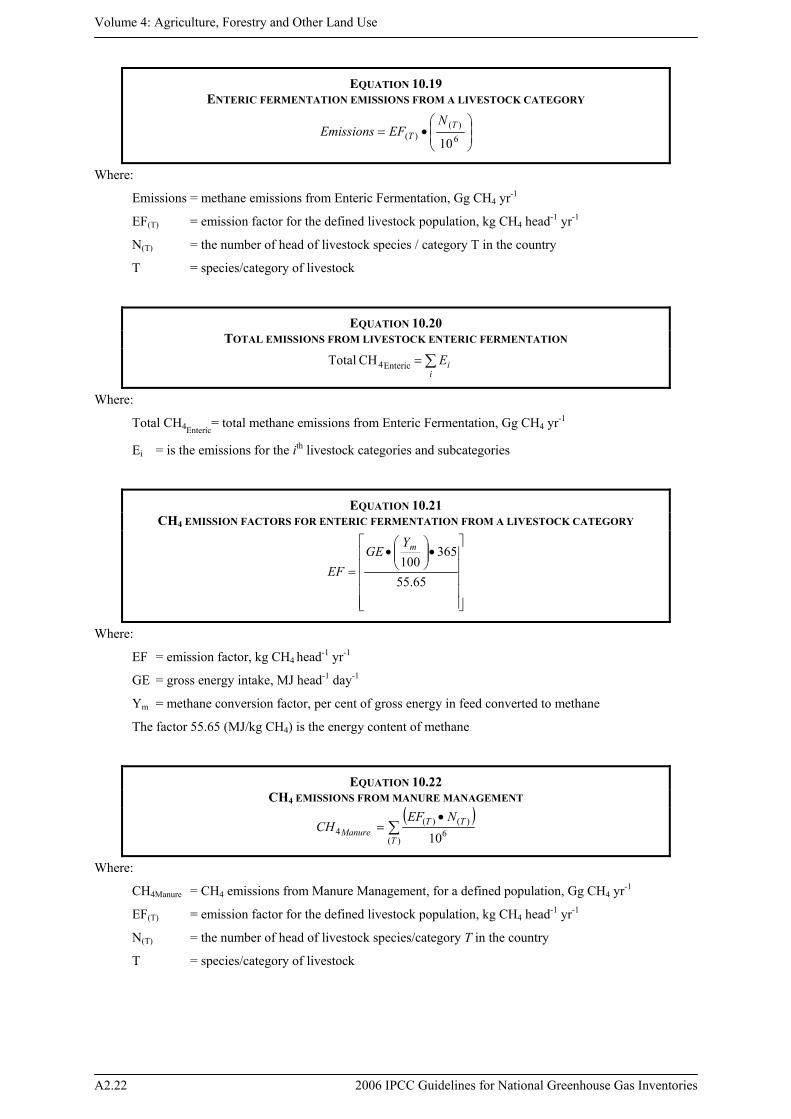
EQUATION 10.19 ENTERIC FERMENTATION EMISSIONS FROM A LIVESTOCK CATEGORY
⎟⎟⎠
⎞⎜⎜⎝
⎛•=
6)(
)(10
TT
NEFEmissions
Where:
Emissions = methane emissions from Enteric Fermentation, Gg CH4 yr-1
EF(T) = emission factor for the defined livestock population, kg CH4 head-1 yr-1
N(T) = the number of head of livestock species / category T in the country
T = species/category of livestock
EQUATION 10.20 TOTAL EMISSIONS FROM LIVESTOCK ENTERIC FERMENTATION
∑=i
iE CH Total Enteric4
Where:
Total CH4Enteric= total methane emissions from Enteric Fermentation, Gg CH4 yr-1
Ei = is the emissions for the ith livestock categories and subcategories
EQUATION 10.21 CH4 EMISSION FACTORS FOR ENTERIC FERMENTATION FROM A LIVESTOCK CATEGORY
⎥⎥⎥⎥⎥
⎦
⎤
⎢⎢⎢⎢⎢
⎣
⎡•⎟⎟⎠
⎞⎜⎜⎝
⎛•
=65.55
365100
mYGE
EF
Where:
EF = emission factor, kg CH4 head-1 yr-1
GE = gross energy intake, MJ head-1 day-1
Ym = methane conversion factor, per cent of gross energy in feed converted to methane
The factor 55.65 (MJ/kg CH4) is the energy content of methane
EQUATION 10.22 CH4 EMISSIONS FROM MANURE MANAGEMENT
( )∑
•=
)(6
)()(4 10T
TTManure
NEFCH
Where:
CH4Manure = CH4 emissions from Manure Management, for a defined population, Gg CH4 yr-1
EF(T) = emission factor for the defined livestock population, kg CH4 head-1 yr-1
N(T) = the number of head of livestock species/category T in the country
T = species/category of livestock
Annex 2: Summary of Equations
2006 IPCC Guidelines for National Greenhouse Gas Inventories A2.23
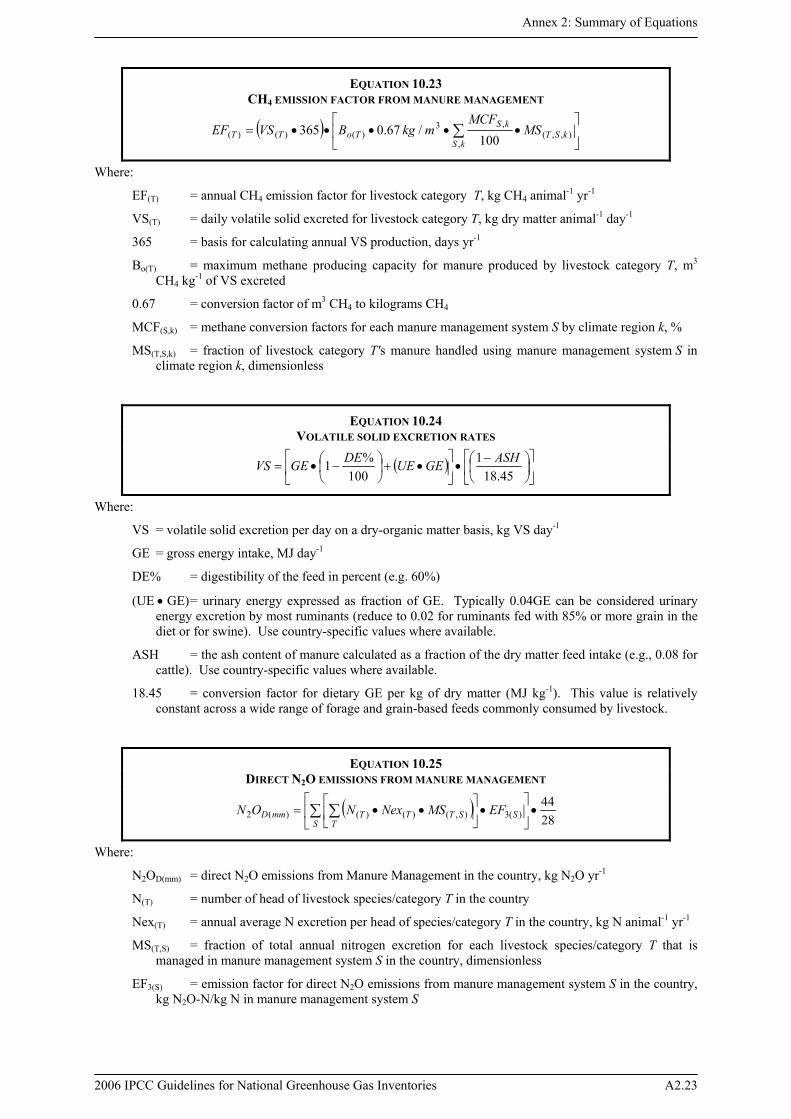
EQUATION 10.23 CH4 EMISSION FACTOR FROM MANURE MANAGEMENT
( ) ⎥⎦
⎤⎢⎣
⎡•••••= ∑ ),,(
,
,3)()()( 100
/67.0365 kSTkS
kSToTT MS
MCFmkgBVSEF
Where:
EF(T) = annual CH4 emission factor for livestock category T, kg CH4 animal-1 yr-1
VS(T) = daily volatile solid excreted for livestock category T, kg dry matter animal-1 day-1
365 = basis for calculating annual VS production, days yr-1
Bo(T) = maximum methane producing capacity for manure produced by livestock category T, m3 CH4 kg-1 of VS excreted
0.67 = conversion factor of m3 CH4 to kilograms CH4
MCF(S,k) = methane conversion factors for each manure management system S by climate region k, %
MS(T,S,k) = fraction of livestock category T's manure handled using manure management system S in climate region k, dimensionless
EQUATION 10.24 VOLATILE SOLID EXCRETION RATES
( ) ⎥⎦
⎤⎢⎣
⎡⎟⎠⎞
⎜⎝⎛ −
•⎥⎦
⎤⎢⎣
⎡•+⎟
⎠⎞
⎜⎝⎛ −•=
45.181
100%1 ASHGEUEDEGEVS
Where:
VS = volatile solid excretion per day on a dry-organic matter basis, kg VS day-1
GE = gross energy intake, MJ day-1
DE% = digestibility of the feed in percent (e.g. 60%)
(UE • GE) = urinary energy expressed as fraction of GE. Typically 0.04GE can be considered urinary energy excretion by most ruminants (reduce to 0.02 for ruminants fed with 85% or more grain in the diet or for swine). Use country-specific values where available.
ASH = the ash content of manure calculated as a fraction of the dry matter feed intake (e.g., 0.08 for cattle). Use country-specific values where available.
18.45 = conversion factor for dietary GE per kg of dry matter (MJ kg-1). This value is relatively constant across a wide range of forage and grain-based feeds commonly consumed by livestock.
EQUATION 10.25 DIRECT N2O EMISSIONS FROM MANURE MANAGEMENT
( )2844
)(3),()()()(2 •⎥⎦
⎤⎢⎣
⎡•⎥
⎦
⎤⎢⎣
⎡••= ∑ ∑
SS
TSTTTmmD EFMSNexNON
Where:
N2OD(mm) = direct N2O emissions from Manure Management in the country, kg N2O yr-1
N(T) = number of head of livestock species/category T in the country
Nex(T) = annual average N excretion per head of species/category T in the country, kg N animal-1 yr-1
MS(T,S) = fraction of total annual nitrogen excretion for each livestock species/category T that is managed in manure management system S in the country, dimensionless
EF3(S) = emission factor for direct N2O emissions from manure management system S in the country, kg N2O-N/kg N in manure management system S
Volume 4: Agriculture, Forestry and Other Land Use
A2.24 2006 IPCC Guidelines for National Greenhouse Gas Inventories
S = manure management system
T = species/category of livestock
44/28 = conversion of (N2O-N)(mm) emissions to N2O(mm) emissions
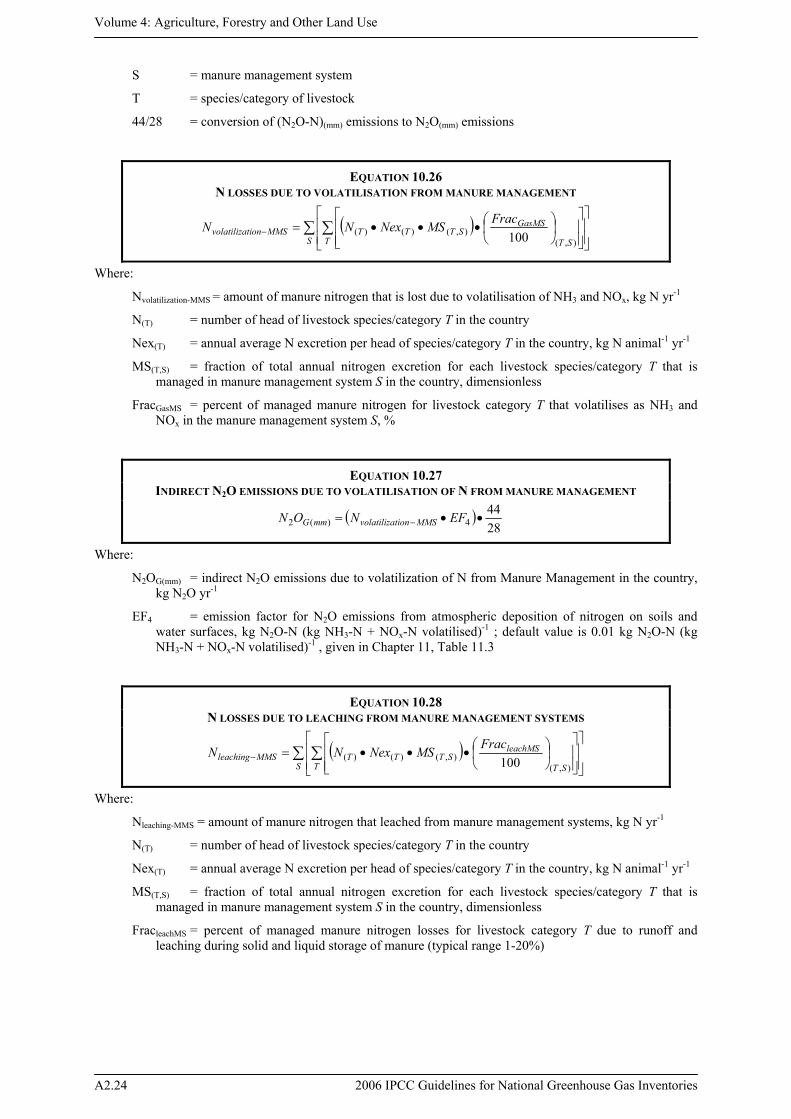
EQUATION 10.26 N LOSSES DUE TO VOLATILISATION FROM MANURE MANAGEMENT
( )∑ ∑⎥⎥⎦
⎤
⎢⎢⎣
⎡
⎥⎥⎦
⎤
⎢⎢⎣
⎡⎟⎠⎞
⎜⎝⎛•••=−
S T ST
GasMSSTTTMMStionvolatiliza
FracMSNexNN),(
),()()( 100
Where:
Nvolatilization-MMS = amount of manure nitrogen that is lost due to volatilisation of NH3 and NOx, kg N yr-1
N(T) = number of head of livestock species/category T in the country
Nex(T) = annual average N excretion per head of species/category T in the country, kg N animal-1 yr-1
MS(T,S) = fraction of total annual nitrogen excretion for each livestock species/category T that is managed in manure management system S in the country, dimensionless
FracGasMS = percent of managed manure nitrogen for livestock category T that volatilises as NH3 and NOx in the manure management system S, %
EQUATION 10.27 INDIRECT N2O EMISSIONS DUE TO VOLATILISATION OF N FROM MANURE MANAGEMENT
( )2844
4)(2 ••= − EFNON MMStionvolatilizammG
Where:
N2OG(mm) = indirect N2O emissions due to volatilization of N from Manure Management in the country, kg N2O yr-1
EF4 = emission factor for N2O emissions from atmospheric deposition of nitrogen on soils and water surfaces, kg N2O-N (kg NH3-N + NOx-N volatilised)-1 ; default value is 0.01 kg N2O-N (kg NH3-N + NOx-N volatilised)-1 , given in Chapter 11, Table 11.3
EQUATION 10.28 N LOSSES DUE TO LEACHING FROM MANURE MANAGEMENT SYSTEMS
( )∑ ∑⎥⎥⎦
⎤
⎢⎢⎣
⎡
⎥⎥⎦
⎤
⎢⎢⎣
⎡⎟⎠⎞
⎜⎝⎛•••=−
S T ST
leachMSSTTTMMSleaching
FracMSNexNN),(
),()()( 100
Where:
Nleaching-MMS = amount of manure nitrogen that leached from manure management systems, kg N yr-1
N(T) = number of head of livestock species/category T in the country
Nex(T) = annual average N excretion per head of species/category T in the country, kg N animal-1 yr-1
MS(T,S) = fraction of total annual nitrogen excretion for each livestock species/category T that is managed in manure management system S in the country, dimensionless
FracleachMS = percent of managed manure nitrogen losses for livestock category T due to runoff and leaching during solid and liquid storage of manure (typical range 1-20%)
Annex 2: Summary of Equations
2006 IPCC Guidelines for National Greenhouse Gas Inventories A2.25
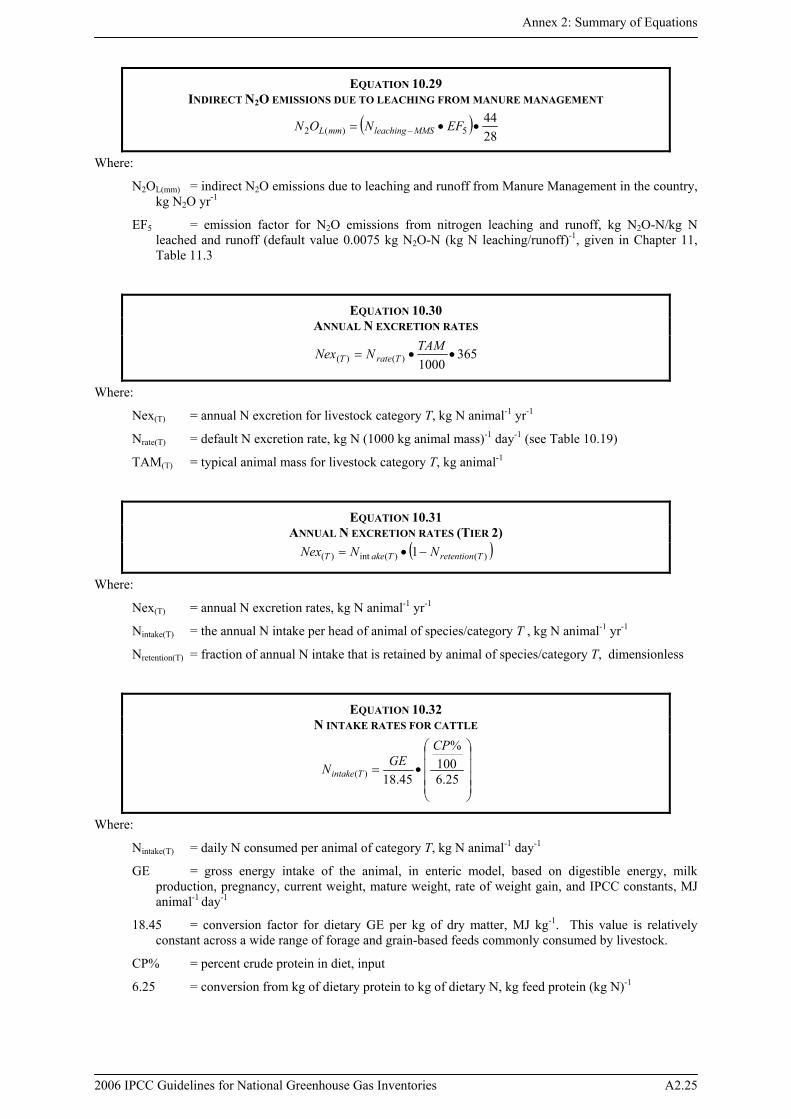
EQUATION 10.29 INDIRECT N2O EMISSIONS DUE TO LEACHING FROM MANURE MANAGEMENT
( )2844
5)(2 ••= − EFNON MMSleachingmmL
Where:
N2OL(mm) = indirect N2O emissions due to leaching and runoff from Manure Management in the country, kg N2O yr-1
EF5 = emission factor for N2O emissions from nitrogen leaching and runoff, kg N2O-N/kg N leached and runoff (default value 0.0075 kg N2O-N (kg N leaching/runoff)-1, given in Chapter 11, Table 11.3
EQUATION 10.30 ANNUAL N EXCRETION RATES
3651000)()( ••=TAMNNex TrateT
Where:
Nex(T) = annual N excretion for livestock category T, kg N animal-1 yr-1
Nrate(T) = default N excretion rate, kg N (1000 kg animal mass)-1 day-1 (see Table 10.19)
TAM(T) = typical animal mass for livestock category T, kg animal-1
EQUATION 10.31 ANNUAL N EXCRETION RATES (TIER 2)
( ))()(int)( 1 TretentionTakeT NNNex −•=
Where:
Nex(T) = annual N excretion rates, kg N animal-1 yr-1
Nintake(T) = the annual N intake per head of animal of species/category T , kg N animal-1 yr-1
Nretention(T) = fraction of annual N intake that is retained by animal of species/category T, dimensionless
EQUATION 10.32 N INTAKE RATES FOR CATTLE
⎟⎟⎟⎟
⎠
⎞
⎜⎜⎜⎜
⎝
⎛
•=25.6
100%
45.18)(
CPGEN Ttakeni
Where:
Nintake(T) = daily N consumed per animal of category T, kg N animal-1 day-1
GE = gross energy intake of the animal, in enteric model, based on digestible energy, milk production, pregnancy, current weight, mature weight, rate of weight gain, and IPCC constants, MJ animal-1 day-1
18.45 = conversion factor for dietary GE per kg of dry matter, MJ kg-1. This value is relatively constant across a wide range of forage and grain-based feeds commonly consumed by livestock.
CP% = percent crude protein in diet, input
6.25 = conversion from kg of dietary protein to kg of dietary N, kg feed protein (kg N)-1
Volume 4: Agriculture, Forestry and Other Land Use
A2.26 2006 IPCC Guidelines for National Greenhouse Gas Inventories
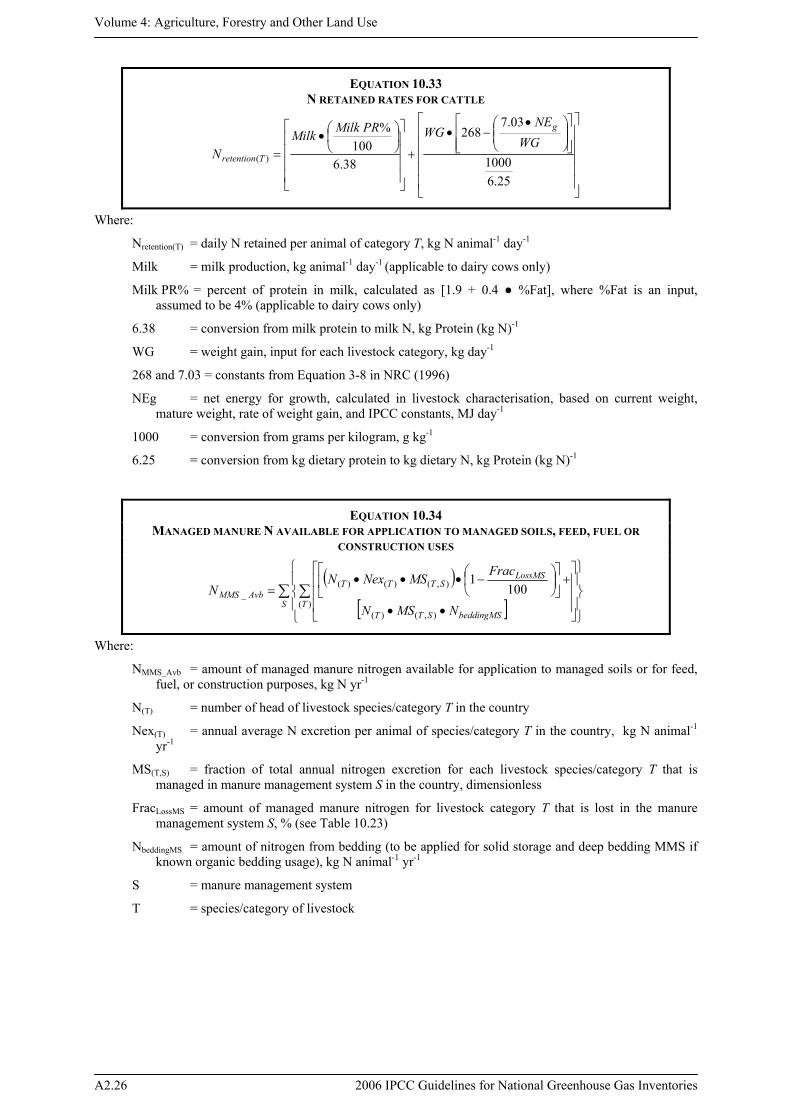
EQUATION 10.33 N RETAINED RATES FOR CATTLE
⎥⎥⎥⎥⎥
⎦
⎤
⎢⎢⎢⎢⎢
⎣
⎡
⎥⎥⎦
⎤
⎢⎢⎣
⎡⎟⎟⎠
⎞⎜⎜⎝
⎛ •−•
+
⎥⎥⎥⎥
⎦
⎤
⎢⎢⎢⎢
⎣
⎡⎟⎠⎞
⎜⎝⎛•
=
25.61000
03.7268
38.6100
%
)(WG
NEWGPRMilkMilk
N
g
Tretention
Where:
Nretention(T) = daily N retained per animal of category T, kg N animal-1 day-1
Milk = milk production, kg animal-1 day-1 (applicable to dairy cows only)
Milk PR% = percent of protein in milk, calculated as [1.9 + 0.4 ● %Fat], where %Fat is an input, assumed to be 4% (applicable to dairy cows only)
6.38 = conversion from milk protein to milk N, kg Protein (kg N)-1
WG = weight gain, input for each livestock category, kg day-1
268 and 7.03 = constants from Equation 3-8 in NRC (1996)
NEg = net energy for growth, calculated in livestock characterisation, based on current weight, mature weight, rate of weight gain, and IPCC constants, MJ day-1
1000 = conversion from grams per kilogram, g kg-1
6.25 = conversion from kg dietary protein to kg dietary N, kg Protein (kg N)-1
EQUATION 10.34 MANAGED MANURE N AVAILABLE FOR APPLICATION TO MANAGED SOILS, FEED, FUEL OR
CONSTRUCTION USES
( )[ ]
∑ ∑⎪⎭
⎪⎬
⎫
⎪⎩
⎪⎨
⎧
⎥⎥⎥
⎦
⎤
⎢⎢⎢
⎣
⎡
••
+⎥⎦
⎤⎢⎣
⎡⎟⎠⎞
⎜⎝⎛ −•••
=S T
beddingMSSTT
LossMSSTTT
AvbMMS
NMSN
FracMSNexNN
)(),()(
),()()(_ 100
1
Where:
NMMS_Avb = amount of managed manure nitrogen available for application to managed soils or for feed, fuel, or construction purposes, kg N yr-1
N(T) = number of head of livestock species/category T in the country
Nex(T) = annual average N excretion per animal of species/category T in the country, kg N animal-1 yr-1
MS(T,S) = fraction of total annual nitrogen excretion for each livestock species/category T that is managed in manure management system S in the country, dimensionless
FracLossMS = amount of managed manure nitrogen for livestock category T that is lost in the manure management system S, % (see Table 10.23)
NbeddingMS = amount of nitrogen from bedding (to be applied for solid storage and deep bedding MMS if known organic bedding usage), kg N animal-1 yr-1
S = manure management system
T = species/category of livestock
Annex 2: Summary of Equations
2006 IPCC Guidelines for National Greenhouse Gas Inventories A2.27
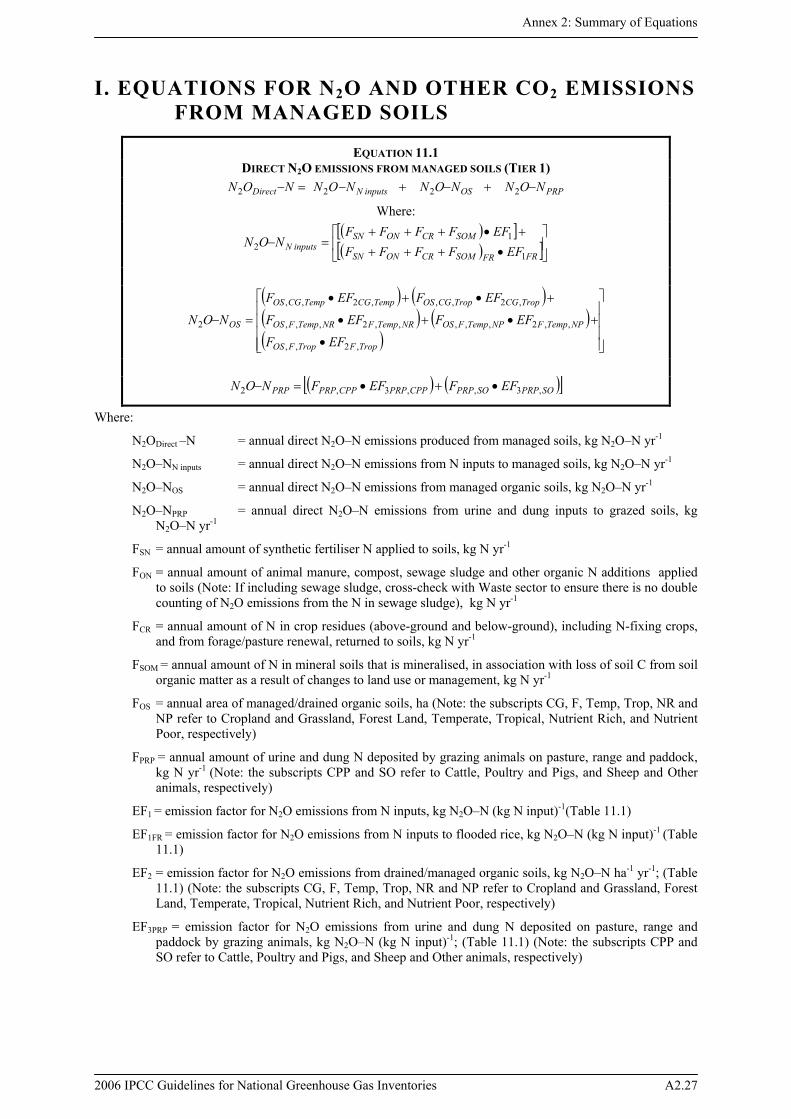
I. EQUATIONS FOR N2O AND OTHER CO2 EMISSIONS FROM MANAGED SOILS
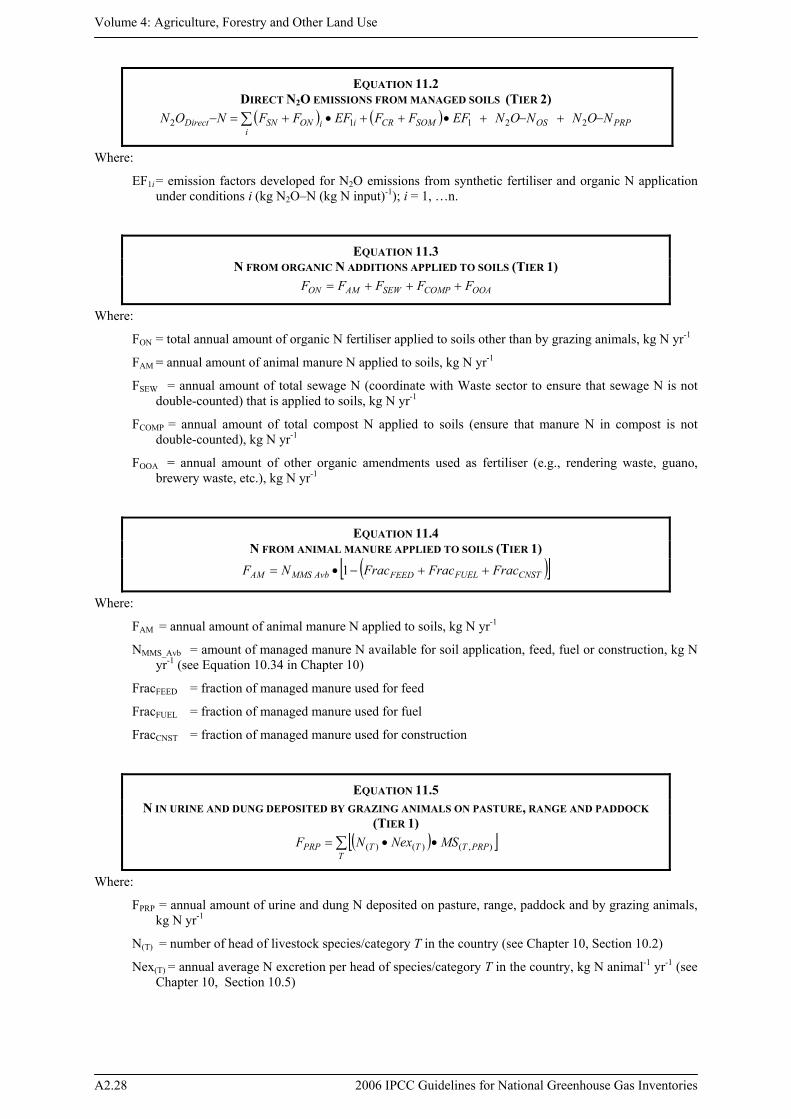
EQUATION 11.1 DIRECT N2O EMISSIONS FROM MANAGED SOILS (TIER 1)
PRPOSinputsNDirect NONNONNONNON −+−+−=− 2222
Where: ( )[ ]( )[ ]⎥⎦
⎤⎢⎣
⎡•+++
+•+++=−
FRFRSOMCRONSN
SOMCRONSNinputsN EFFFFF
EFFFFFNON
1
12
( ) ( )( ) ( )( ) ⎥
⎥⎥⎥
⎦
⎤
⎢⎢⎢⎢
⎣
⎡
•
+•+•
+•+•
=−
TropFTropFOS
NPTempFNPTempFOSNRTempFNRTempFOS
TropCGTropCGOSTempCGTempCGOS
OS
EFF
EFFEFF
EFFEFF
NON
,2,,
,,2,,,,,2,,,
,2,,,2,,
2
( ) ( )[ ]SOPRPSOPRPCPPPRPCPPPRPPRP EFFEFFNON ,3,,3,2 •+•=−
Where:
N2ODirect –N = annual direct N2O–N emissions produced from managed soils, kg N2O–N yr-1
N2O–NN inputs = annual direct N2O–N emissions from N inputs to managed soils, kg N2O–N yr-1
N2O–NOS = annual direct N2O–N emissions from managed organic soils, kg N2O–N yr-1
N2O–NPRP = annual direct N2O–N emissions from urine and dung inputs to grazed soils, kg N2O–N yr-1
FSN = annual amount of synthetic fertiliser N applied to soils, kg N yr-1
FON = annual amount of animal manure, compost, sewage sludge and other organic N additions applied to soils (Note: If including sewage sludge, cross-check with Waste sector to ensure there is no double counting of N2O emissions from the N in sewage sludge), kg N yr-1
FCR = annual amount of N in crop residues (above-ground and below-ground), including N-fixing crops, and from forage/pasture renewal, returned to soils, kg N yr-1
FSOM = annual amount of N in mineral soils that is mineralised, in association with loss of soil C from soil organic matter as a result of changes to land use or management, kg N yr-1
FOS = annual area of managed/drained organic soils, ha (Note: the subscripts CG, F, Temp, Trop, NR and NP refer to Cropland and Grassland, Forest Land, Temperate, Tropical, Nutrient Rich, and Nutrient Poor, respectively)
FPRP = annual amount of urine and dung N deposited by grazing animals on pasture, range and paddock, kg N yr-1 (Note: the subscripts CPP and SO refer to Cattle, Poultry and Pigs, and Sheep and Other animals, respectively)
EF1 = emission factor for N2O emissions from N inputs, kg N2O–N (kg N input)-1(Table 11.1)
EF1FR = emission factor for N2O emissions from N inputs to flooded rice, kg N2O–N (kg N input)-1 (Table 11.1)
EF2 = emission factor for N2O emissions from drained/managed organic soils, kg N2O–N ha-1 yr-1; (Table 11.1) (Note: the subscripts CG, F, Temp, Trop, NR and NP refer to Cropland and Grassland, Forest Land, Temperate, Tropical, Nutrient Rich, and Nutrient Poor, respectively)
EF3PRP = emission factor for N2O emissions from urine and dung N deposited on pasture, range and paddock by grazing animals, kg N2O–N (kg N input)-1; (Table 11.1) (Note: the subscripts CPP and SO refer to Cattle, Poultry and Pigs, and Sheep and Other animals, respectively)
Volume 4: Agriculture, Forestry and Other Land Use
A2.28 2006 IPCC Guidelines for National Greenhouse Gas Inventories
EQUATION 11.2 DIRECT N2O EMISSIONS FROM MANAGED SOILS (TIER 2) ( ) ( )∑ −+−+•++•+=−
iPRPOSSOMCRiiONSNDirect NONNONEFFFEFFFNON 22112
Where:
EF1i = emission factors developed for N2O emissions from synthetic fertiliser and organic N application under conditions i (kg N2O–N (kg N input)-1); i = 1, …n.
EQUATION 11.3 N FROM ORGANIC N ADDITIONS APPLIED TO SOILS (TIER 1)
OOACOMPSEWAMON FFFFF +++=
Where:
FON = total annual amount of organic N fertiliser applied to soils other than by grazing animals, kg N yr-1
FAM = annual amount of animal manure N applied to soils, kg N yr-1
FSEW = annual amount of total sewage N (coordinate with Waste sector to ensure that sewage N is not double-counted) that is applied to soils, kg N yr-1
FCOMP = annual amount of total compost N applied to soils (ensure that manure N in compost is not double-counted), kg N yr-1
FOOA = annual amount of other organic amendments used as fertiliser (e.g., rendering waste, guano, brewery waste, etc.), kg N yr-1
EQUATION 11.4 N FROM ANIMAL MANURE APPLIED TO SOILS (TIER 1)
( )[ ]CNSTFUELFEEDAvbMMSAM FracFracFracNF ++−•= 1
Where:
FAM = annual amount of animal manure N applied to soils, kg N yr-1
NMMS_Avb = amount of managed manure N available for soil application, feed, fuel or construction, kg N yr-1 (see Equation 10.34 in Chapter 10)
FracFEED = fraction of managed manure used for feed
FracFUEL = fraction of managed manure used for fuel
FracCNST = fraction of managed manure used for construction
EQUATION 11.5 N IN URINE AND DUNG DEPOSITED BY GRAZING ANIMALS ON PASTURE, RANGE AND PADDOCK
(TIER 1) ( )[ ]∑ ••=
TPRPTTTPRP MSNexNF ),()()(
Where:
FPRP = annual amount of urine and dung N deposited on pasture, range, paddock and by grazing animals, kg N yr-1
N(T) = number of head of livestock species/category T in the country (see Chapter 10, Section 10.2)
Nex(T) = annual average N excretion per head of species/category T in the country, kg N animal-1 yr-1 (see Chapter 10, Section 10.5)
Annex 2: Summary of Equations
2006 IPCC Guidelines for National Greenhouse Gas Inventories A2.29
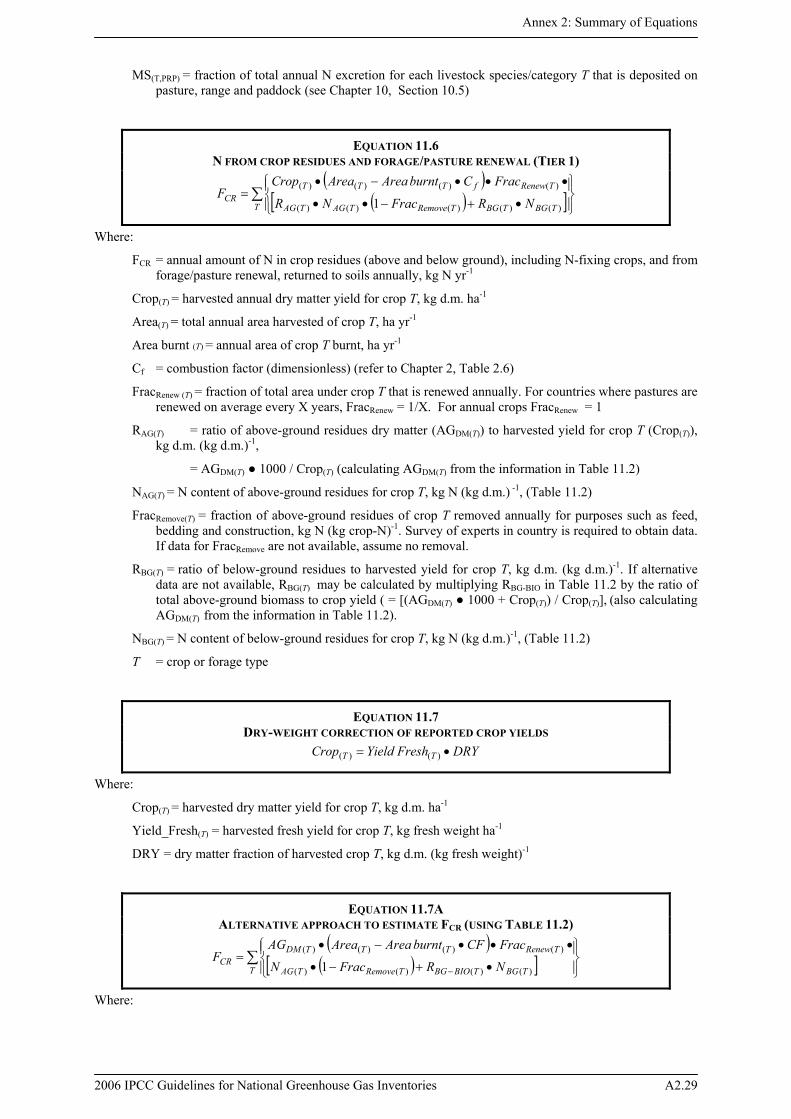
MS(T,PRP) = fraction of total annual N excretion for each livestock species/category T that is deposited on pasture, range and paddock (see Chapter 10, Section 10.5)
EQUATION 11.6 N FROM CROP RESIDUES AND FORAGE/PASTURE RENEWAL (TIER 1)
( )( )[ ]∑
⎪⎭
⎪⎬⎫
⎪⎩
⎪⎨⎧
•+−••
•••−•=
T TBGTBGTmoveReTAGTAG
TnewRefTTTCR NRFracNR
FracCburntAreaAreaCropF
)()()()()(
)()()()(
1
Where:
FCR = annual amount of N in crop residues (above and below ground), including N-fixing crops, and from forage/pasture renewal, returned to soils annually, kg N yr-1
Crop(T) = harvested annual dry matter yield for crop T, kg d.m. ha-1
Area(T) = total annual area harvested of crop T, ha yr-1
Area burnt (T) = annual area of crop T burnt, ha yr-1
Cf = combustion factor (dimensionless) (refer to Chapter 2, Table 2.6)
FracRenew (T) = fraction of total area under crop T that is renewed annually. For countries where pastures are renewed on average every X years, FracRenew = 1/X. For annual crops FracRenew = 1
RAG(T) = ratio of above-ground residues dry matter (AGDM(T)) to harvested yield for crop T (Crop(T)), kg d.m. (kg d.m.)-1,
= AGDM(T) ● 1000 / Crop(T) (calculating AGDM(T) from the information in Table 11.2)
NAG(T) = N content of above-ground residues for crop T, kg N (kg d.m.) -1, (Table 11.2)
FracRemove(T) = fraction of above-ground residues of crop T removed annually for purposes such as feed, bedding and construction, kg N (kg crop-N)-1. Survey of experts in country is required to obtain data. If data for FracRemove are not available, assume no removal.
RBG(T) = ratio of below-ground residues to harvested yield for crop T, kg d.m. (kg d.m.)-1. If alternative data are not available, RBG(T) may be calculated by multiplying RBG-BIO in Table 11.2 by the ratio of total above-ground biomass to crop yield ( = [(AGDM(T) ● 1000 + Crop(T)) / Crop(T)], (also calculating AGDM(T)
from the information in Table 11.2).
NBG(T) = N content of below-ground residues for crop T, kg N (kg d.m.)-1, (Table 11.2)
T = crop or forage type
EQUATION 11.7 DRY-WEIGHT CORRECTION OF REPORTED CROP YIELDS
DRYFreshYieldCrop TT •= )()(
Where:
Crop(T) = harvested dry matter yield for crop T, kg d.m. ha-1
Yield_Fresh(T) = harvested fresh yield for crop T, kg fresh weight ha-1
DRY = dry matter fraction of harvested crop T, kg d.m. (kg fresh weight)-1
EQUATION 11.7A ALTERNATIVE APPROACH TO ESTIMATE FCR (USING TABLE 11.2)
( )( )[ ]∑
⎪⎭
⎪⎬⎫
⎪⎩
⎪⎨⎧
•+−•
•••−•=
−T TBGTBIOBGTmoveReTAG
TnewReTTTDMCR NRFracN
FracCFburntAreaAreaAGF
)()()()(
)()()()(
1
Where:
Volume 4: Agriculture, Forestry and Other Land Use
A2.30 2006 IPCC Guidelines for National Greenhouse Gas Inventories
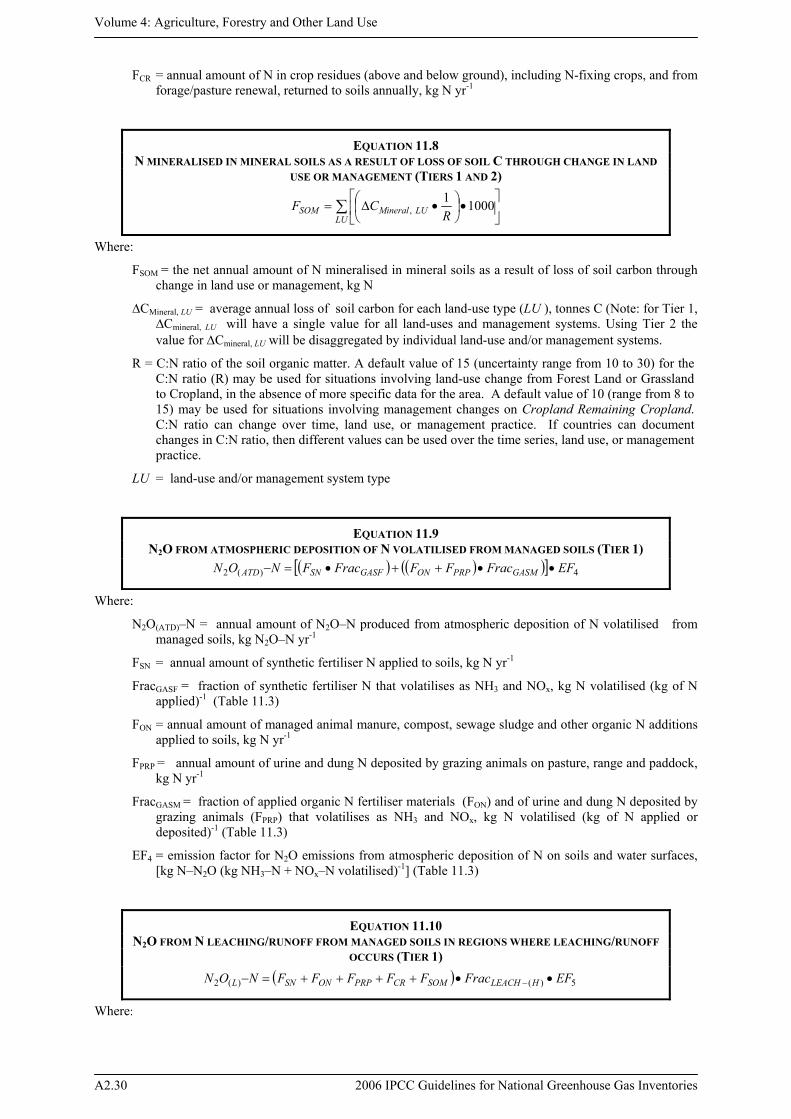
FCR = annual amount of N in crop residues (above and below ground), including N-fixing crops, and from forage/pasture renewal, returned to soils annually, kg N yr-1
EQUATION 11.8 N MINERALISED IN MINERAL SOILS AS A RESULT OF LOSS OF SOIL C THROUGH CHANGE IN LAND
USE OR MANAGEMENT (TIERS 1 AND 2)
∑ ⎥⎦
⎤⎢⎣
⎡•⎟⎠⎞
⎜⎝⎛ •Δ=
LULUeralMinSOM R
CF 10001,
Where:
FSOM = the net annual amount of N mineralised in mineral soils as a result of loss of soil carbon through change in land use or management, kg N
∆CMineral, LU = average annual loss of soil carbon for each land-use type (LU ), tonnes C (Note: for Tier 1, ∆Cmineral, LU will have a single value for all land-uses and management systems. Using Tier 2 the value for ΔCmineral, LU will be disaggregated by individual land-use and/or management systems.
R = C:N ratio of the soil organic matter. A default value of 15 (uncertainty range from 10 to 30) for the C:N ratio (R) may be used for situations involving land-use change from Forest Land or Grassland to Cropland, in the absence of more specific data for the area. A default value of 10 (range from 8 to 15) may be used for situations involving management changes on Cropland Remaining Cropland. C:N ratio can change over time, land use, or management practice. If countries can document changes in C:N ratio, then different values can be used over the time series, land use, or management practice.
LU = land-use and/or management system type
EQUATION 11.9 N2O FROM ATMOSPHERIC DEPOSITION OF N VOLATILISED FROM MANAGED SOILS (TIER 1)
( ) ( )( )[ ] 4)(2 EFFracFFFracFNON GASMPRPONGASFSNATD ••++•=−
Where:
N2O(ATD)–N = annual amount of N2O–N produced from atmospheric deposition of N volatilised from managed soils, kg N2O–N yr-1
FSN = annual amount of synthetic fertiliser N applied to soils, kg N yr-1
FracGASF = fraction of synthetic fertiliser N that volatilises as NH3 and NOx, kg N volatilised (kg of N applied)-1 (Table 11.3)
FON = annual amount of managed animal manure, compost, sewage sludge and other organic N additions applied to soils, kg N yr-1
FPRP = annual amount of urine and dung N deposited by grazing animals on pasture, range and paddock, kg N yr-1
FracGASM = fraction of applied organic N fertiliser materials (FON) and of urine and dung N deposited by grazing animals (FPRP) that volatilises as NH3 and NOx, kg N volatilised (kg of N applied or deposited)-1 (Table 11.3)
EF4 = emission factor for N2O emissions from atmospheric deposition of N on soils and water surfaces, [kg N–N2O (kg NH3–N + NOx–N volatilised)-1] (Table 11.3)
EQUATION 11.10 N2O FROM N LEACHING/RUNOFF FROM MANAGED SOILS IN REGIONS WHERE LEACHING/RUNOFF
OCCURS (TIER 1) ( ) 5)()(2 EFFracFFFFFNON HLEACHSOMCRPRPONSNL ••++++=− −
Where:
Annex 2: Summary of Equations
2006 IPCC Guidelines for National Greenhouse Gas Inventories A2.31
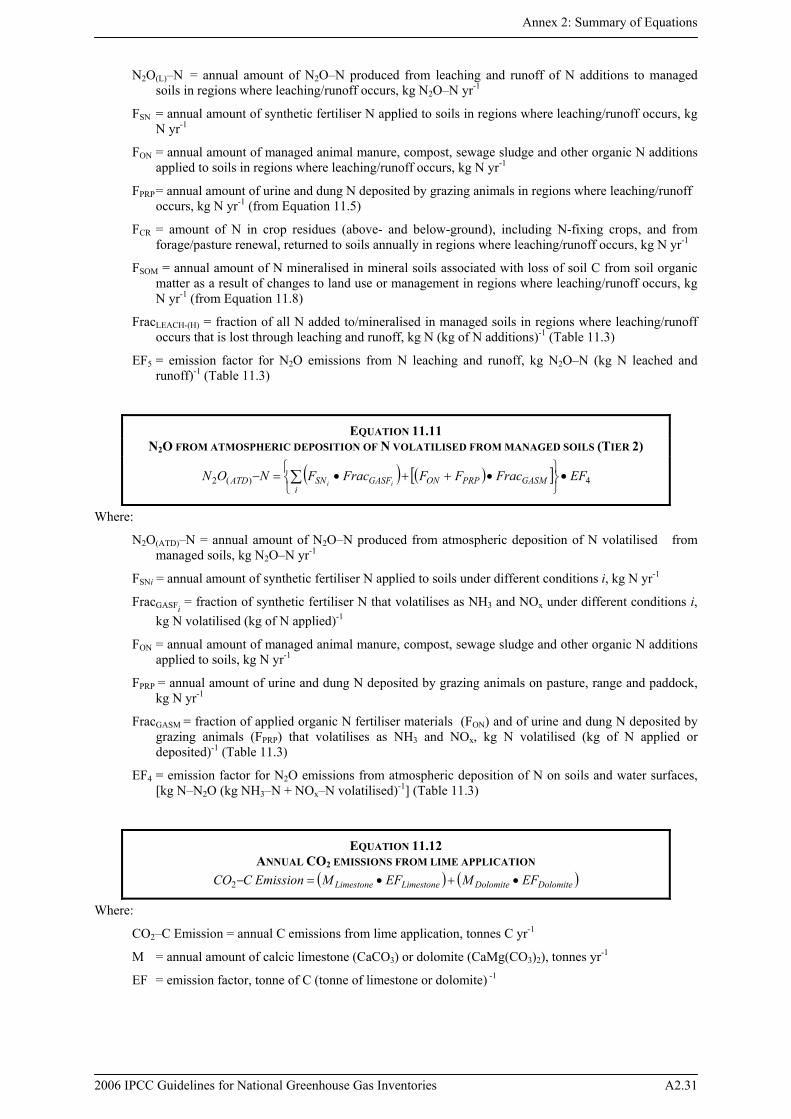
N2O(L)–N = annual amount of N2O–N produced from leaching and runoff of N additions to managed soils in regions where leaching/runoff occurs, kg N2O–N yr-1
FSN = annual amount of synthetic fertiliser N applied to soils in regions where leaching/runoff occurs, kg N yr-1
FON = annual amount of managed animal manure, compost, sewage sludge and other organic N additions applied to soils in regions where leaching/runoff occurs, kg N yr-1
FPRP = annual amount of urine and dung N deposited by grazing animals in regions where leaching/runoff occurs, kg N yr-1 (from Equation 11.5)
FCR = amount of N in crop residues (above- and below-ground), including N-fixing crops, and from forage/pasture renewal, returned to soils annually in regions where leaching/runoff occurs, kg N yr-1
FSOM = annual amount of N mineralised in mineral soils associated with loss of soil C from soil organic matter as a result of changes to land use or management in regions where leaching/runoff occurs, kg N yr-1 (from Equation 11.8)
FracLEACH-(H) = fraction of all N added to/mineralised in managed soils in regions where leaching/runoff occurs that is lost through leaching and runoff, kg N (kg of N additions)-1 (Table 11.3)
EF5 = emission factor for N2O emissions from N leaching and runoff, kg N2O–N (kg N leached and runoff)-1 (Table 11.3)
EQUATION 11.11 N2O FROM ATMOSPHERIC DEPOSITION OF N VOLATILISED FROM MANAGED SOILS (TIER 2)
( ) ( )[ ] 4)(2 EFFracFFFracFNON GASMPRPONi
GASFSNATD ii•
⎭⎬⎫
⎩⎨⎧
•++•=− ∑
Where:
N2O(ATD)–N = annual amount of N2O–N produced from atmospheric deposition of N volatilised from managed soils, kg N2O–N yr-1
FSNi = annual amount of synthetic fertiliser N applied to soils under different conditions i, kg N yr-1
FracGASFi = fraction of synthetic fertiliser N that volatilises as NH3 and NOx under different conditions i,
kg N volatilised (kg of N applied)-1
FON = annual amount of managed animal manure, compost, sewage sludge and other organic N additions applied to soils, kg N yr-1
FPRP = annual amount of urine and dung N deposited by grazing animals on pasture, range and paddock, kg N yr-1
FracGASM = fraction of applied organic N fertiliser materials (FON) and of urine and dung N deposited by grazing animals (FPRP) that volatilises as NH3 and NOx, kg N volatilised (kg of N applied or deposited)-1 (Table 11.3)
EF4 = emission factor for N2O emissions from atmospheric deposition of N on soils and water surfaces, [kg N–N2O (kg NH3–N + NOx–N volatilised)-1] (Table 11.3)
EQUATION 11.12 ANNUAL CO2 EMISSIONS FROM LIME APPLICATION
( ) ( )DolomiteDolomiteLimestoneLimestone EFMEFMEmissionCCO •+•=−2
Where:
CO2–C Emission = annual C emissions from lime application, tonnes C yr-1
M = annual amount of calcic limestone (CaCO3) or dolomite (CaMg(CO3)2), tonnes yr-1
EF = emission factor, tonne of C (tonne of limestone or dolomite) -1
Volume 4: Agriculture, Forestry and Other Land Use
A2.32 2006 IPCC Guidelines for National Greenhouse Gas Inventories
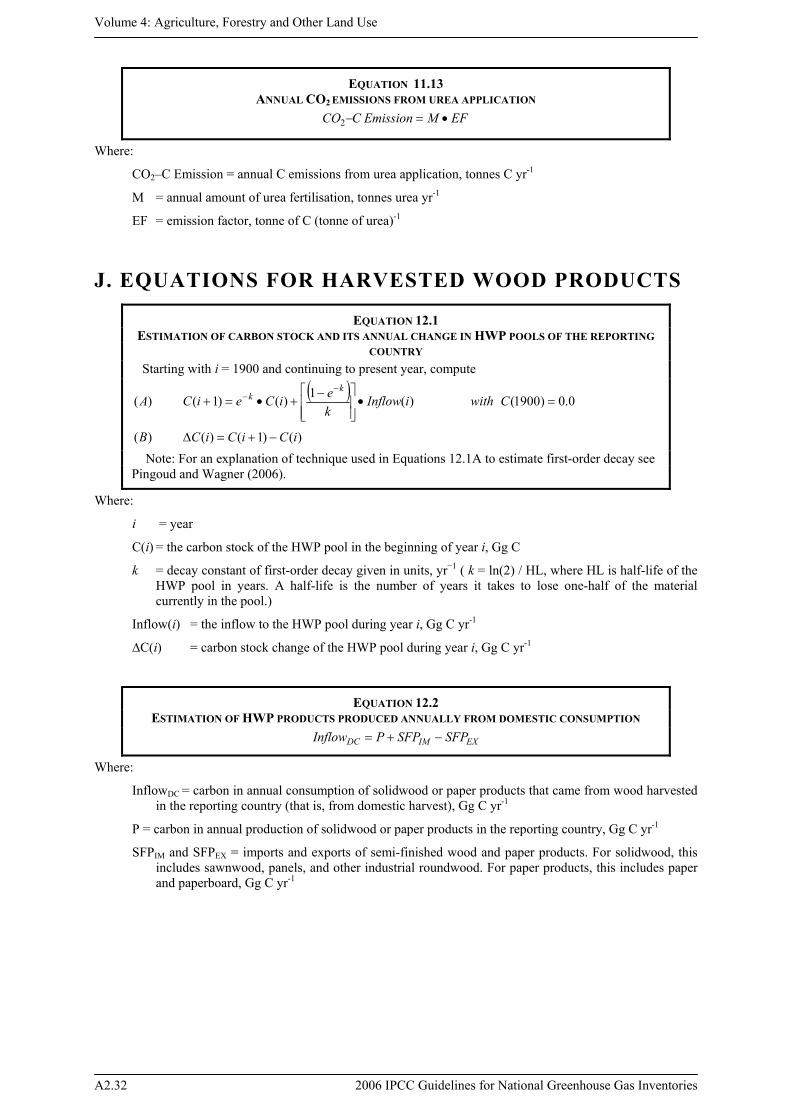
EQUATION 11.13 ANNUAL CO2 EMISSIONS FROM UREA APPLICATION
EFMEmissionCCO •=−2
Where:
CO2–C Emission = annual C emissions from urea application, tonnes C yr-1
M = annual amount of urea fertilisation, tonnes urea yr-1
EF = emission factor, tonne of C (tonne of urea)-1
J. EQUATIONS FOR HARVESTED WOOD PRODUCTS
EQUATION 12.1 ESTIMATION OF CARBON STOCK AND ITS ANNUAL CHANGE IN HWP POOLS OF THE REPORTING
COUNTRY Starting with i = 1900 and continuing to present year, compute
( ) 0.0)1900()(1)()1()( =•⎥⎥⎦
⎤
⎢⎢⎣
⎡ −+•=+
−− CwithiInflow
keiCeiCA
kk
)()1()()( iCiCiCB −+=Δ Note: For an explanation of technique used in Equations 12.1A to estimate first-order decay see Pingoud and Wagner (2006).
Where:
i = year
C(i) = the carbon stock of the HWP pool in the beginning of year i, Gg C
k = decay constant of first-order decay given in units, yr−1 ( k = ln(2) / HL, where HL is half-life of the HWP pool in years. A half-life is the number of years it takes to lose one-half of the material currently in the pool.)
Inflow(i) = the inflow to the HWP pool during year i, Gg C yr-1
∆C(i) = carbon stock change of the HWP pool during year i, Gg C yr-1
EQUATION 12.2 ESTIMATION OF HWP PRODUCTS PRODUCED ANNUALLY FROM DOMESTIC CONSUMPTION
EXIMDC SFPSFPPInflow −+=
Where:
InflowDC = carbon in annual consumption of solidwood or paper products that came from wood harvested in the reporting country (that is, from domestic harvest), Gg C yr-1
P = carbon in annual production of solidwood or paper products in the reporting country, Gg C yr-1
SFPIM and SFPEX = imports and exports of semi-finished wood and paper products. For solidwood, this includes sawnwood, panels, and other industrial roundwood. For paper products, this includes paper and paperboard, Gg C yr-1
Annex 2: Summary of Equations
2006 IPCC Guidelines for National Greenhouse Gas Inventories A2.33
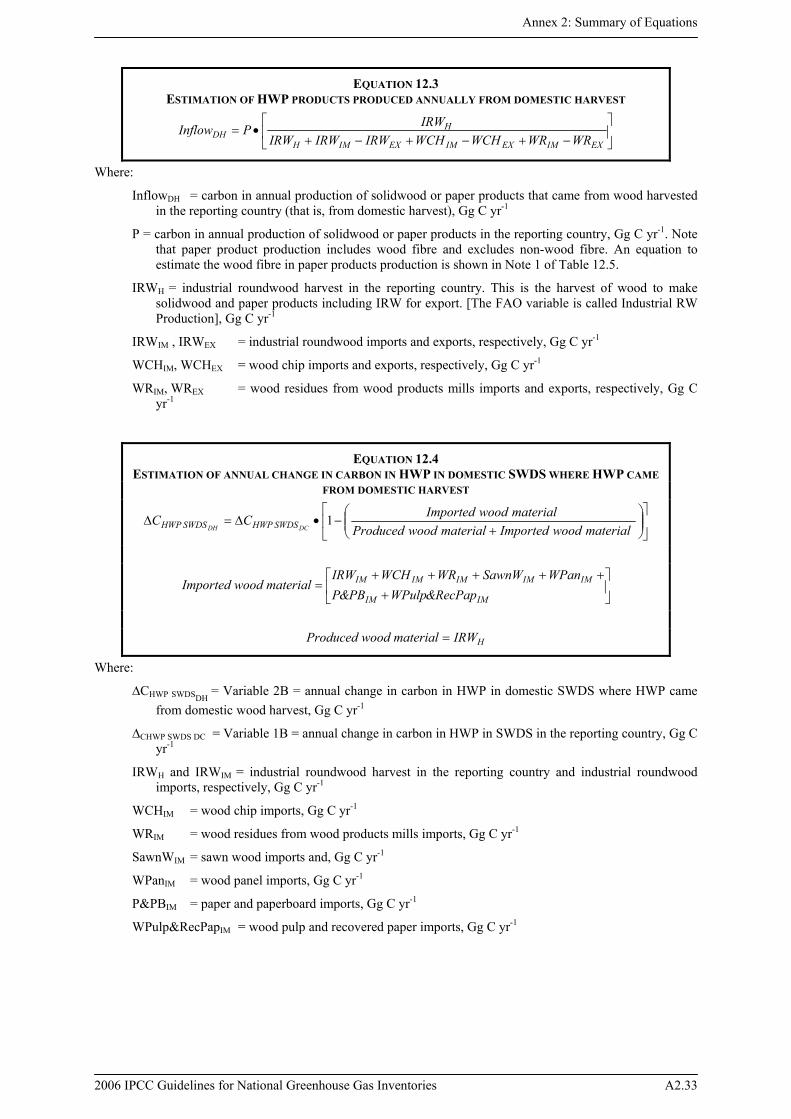
EQUATION 12.3 ESTIMATION OF HWP PRODUCTS PRODUCED ANNUALLY FROM DOMESTIC HARVEST
⎥⎦
⎤⎢⎣
⎡−+−+−+
•=EXIMEXIMEXIMH
HDH WRWRWCHWCHIRWIRWIRW
IRWPInflow
Where:
InflowDH = carbon in annual production of solidwood or paper products that came from wood harvested in the reporting country (that is, from domestic harvest), Gg C yr-1
P = carbon in annual production of solidwood or paper products in the reporting country, Gg C yr-1. Note that paper product production includes wood fibre and excludes non-wood fibre. An equation to estimate the wood fibre in paper products production is shown in Note 1 of Table 12.5.
IRWH = industrial roundwood harvest in the reporting country. This is the harvest of wood to make solidwood and paper products including IRW for export. [The FAO variable is called Industrial RW Production], Gg C yr-1
IRWIM , IRWEX = industrial roundwood imports and exports, respectively, Gg C yr-1
WCHIM, WCHEX = wood chip imports and exports, respectively, Gg C yr-1
WRIM, WREX = wood residues from wood products mills imports and exports, respectively, Gg C yr-1
EQUATION 12.4 ESTIMATION OF ANNUAL CHANGE IN CARBON IN HWP IN DOMESTIC SWDS WHERE HWP CAME
FROM DOMESTIC HARVEST
⎥⎦
⎤⎢⎣
⎡⎟⎟⎠
⎞⎜⎜⎝
⎛+
−•Δ=Δ
1material woodImportedmaterial woodProduced
material woodImportedCCDCDH SWDSHWPSWDSHWP
⎥⎦
⎤⎢⎣
⎡+
+++++=
IMIM
IMIMIMIMIM
cPapRe&WPulpPB&PWPanSawnWWRWCHIRW
materialwoodImported
HIRWmaterialwoodProduced =
Where:
∆CHWP SWDSDH = Variable 2B = annual change in carbon in HWP in domestic SWDS where HWP came
from domestic wood harvest, Gg C yr-1
∆CHWP SWDS DC = Variable 1B = annual change in carbon in HWP in SWDS in the reporting country, Gg C yr-1
IRWH and IRWIM = industrial roundwood harvest in the reporting country and industrial roundwood imports, respectively, Gg C yr-1
WCHIM = wood chip imports, Gg C yr-1
WRIM = wood residues from wood products mills imports, Gg C yr-1
SawnWIM = sawn wood imports and, Gg C yr-1
WPanIM = wood panel imports, Gg C yr-1
P&PBIM = paper and paperboard imports, Gg C yr-1
WPulp&RecPapIM = wood pulp and recovered paper imports, Gg C yr-1
Volume 4: Agriculture, Forestry and Other Land Use
A2.34 2006 IPCC Guidelines for National Greenhouse Gas Inventories
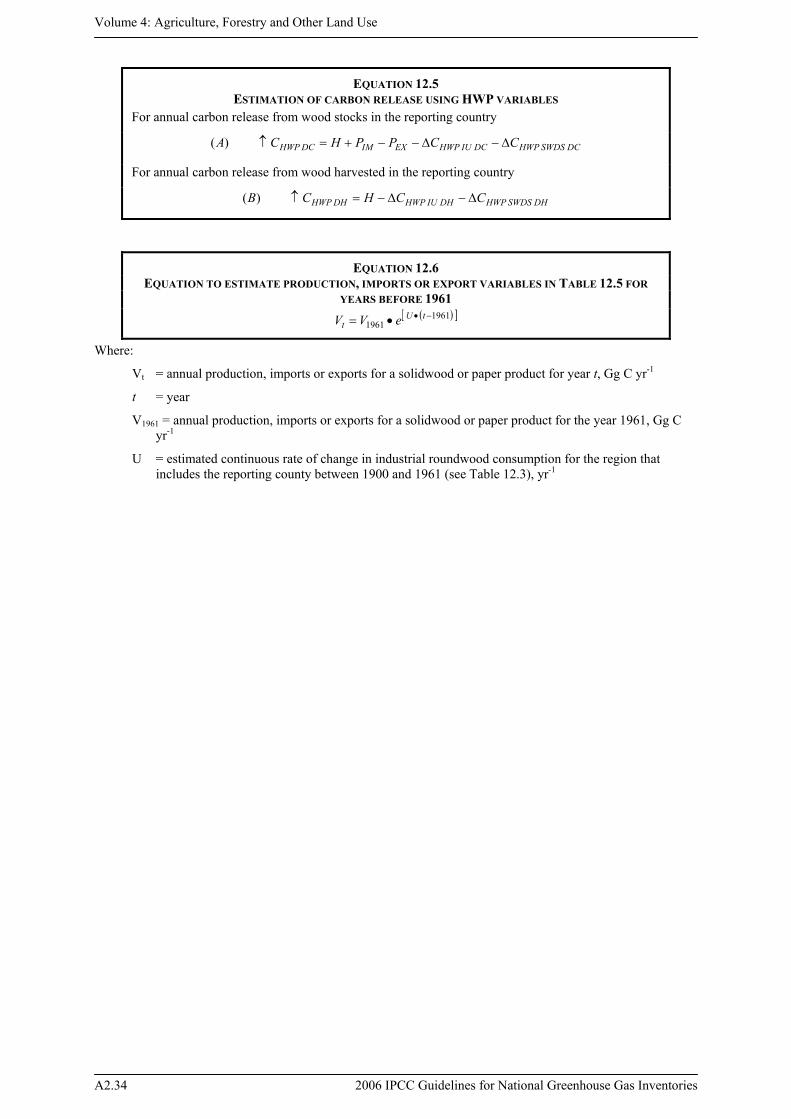
EQUATION 12.5 ESTIMATION OF CARBON RELEASE USING HWP VARIABLES
For annual carbon release from wood stocks in the reporting country
DCSWDSHWPDCIUHWPEXIMDCHWP CCPPHCA Δ−Δ−−+=↑)(
For annual carbon release from wood harvested in the reporting country
DHSWDSHWPDHIUHWPDHHWP CCHCB Δ−Δ−=↑)(
EQUATION 12.6 EQUATION TO ESTIMATE PRODUCTION, IMPORTS OR EXPORT VARIABLES IN TABLE 12.5 FOR
YEARS BEFORE 1961 ( )[ ]1961
1961−••= tU
t eVV
Where:
Vt = annual production, imports or exports for a solidwood or paper product for year t, Gg C yr-1
t = year
V1961 = annual production, imports or exports for a solidwood or paper product for the year 1961, Gg C yr-1
U = estimated continuous rate of change in industrial roundwood consumption for the region that includes the reporting county between 1900 and 1961 (see Table 12.3), yr-1