ANNEX 1 -PROGRAM SUMMARY STATISTICS ACCESS TO SAFE WATER...
24
ANNEX 1 - PROGRAM SUMMARY STATISTICS - ACCESS TO SAFE WATER (BESIK AND GORDTL SYSTEMS) System functioning status Indicator BESIK GoTL Total No. of systems constructed/rehabilitated 62 142 204 Additional people with access to safe water 77,423 145,486 222,909 Additional schools with access to safe water 58 0 58 Additional health centres/posts with access to safe water 44 0 44 % of systems fully functioning after 1 year 86% 80% 82% Indicator Total % of GMFs fully functioning after 1 year • % collecting funds 48% • % meeting regularly 63% % of rural population with access to safe water (Based on 2010 census data) 73% Not functioning 3% Partially functioning 9% Fully functioning 88% System Status: All BESIK and GoTL Systems 82 49 63 48 0 20 40 60 80 100 System fully functioning GMF with > 30% women GMF meeting regularly GMF collecting funds System and GMF status after 12 months (% of GMFs) 2008/09 2010 2011 2012 Other partners 2,056 37,171 43,160 18,480 GoTL 0 42,330 76,556 26,600 BESIK 30,132 18,722 21,726 6,843 0 20,000 40,000 60,000 80,000 100,000 120,000 140,000 160,000 Additional people with access to safe water
Transcript of ANNEX 1 -PROGRAM SUMMARY STATISTICS ACCESS TO SAFE WATER...

ANNEX 1 - PROGRAM SUMMARY STATISTICS - ACCESS TO SAFE WATER (BESIK AND GORDTL SYSTEMS) System functioning status
Indicator BESIK GoTL Total No. of systems constructed/rehabilitated 62 142 204 Additional people with access to safe water 77,423 145,486 222,909 Additional schools with access to safe water 58 0 58 Additional health centres/posts with access to safe water 44 0 44 % of systems fully functioning after 1 year 86% 80% 82% Indicator Total % of GMFs fully functioning after 1 year
• % collecting funds 48% • % meeting regularly 63%
% of rural population with access to safe water (Based on 2010 census data)
73%
Not functioning
3%
Partially functioning
9%
Fully functioning
88%
System Status: All BESIK and GoTL Systems
82
49 63
48
020406080
100
System fullyfunctioning
GMF with >30% women
GMF meetingregularly
GMFcollecting
funds
System and GMF status after 12 months (% of GMFs)
2008/09 2010 2011 2012
Other partners 2,056 37,171 43,160 18,480
GoTL 0 42,330 76,556 26,600
BESIK 30,132 18,722 21,726 6,843
0
20,000
40,000
60,000
80,000
100,000
120,000
140,000
160,000 Additional people with access to safe water

ANNEX 2 - PROGRAM SUMMARY STATISTICS: SANITATION AND HYGIENE Locations of communities with ODF Status
Indicator BESIK Additional people with access to basic sanitation (unimproved & improved) 67,068 Additional people with access to improved sanitation (JMP) 35,995 Number of communities in target areas declaring %100 open defecation free status
165
Additional households in target areas with a hand washing facility and soap 5751 HHs
80% of households (care givers) can recall at least 2 key hygiene and sanitation messages
90%
Number of people with increased knowledge of hygiene practices 387,292
2008/09 2010 2011 2012
Other partners 9427 36718 44421 24333
BESIK 0 3694 25612 37754
0
10000
20000
30000
40000
50000
60000
70000
80000 Additional people with access basic sanitation

ANNEX 3: BESIK PERFORMANCE ASSESSMENT FRAMEWORK (JUNE 2012)
Program Outcome Hierarchy Key Performance Indicators and Questions 2007 (Baseline) To Date Target (June 2012) Status *Rating
Goal Improve the health and quality of life of rural people in Timor-Leste
% of children < 5 years old with diarrhoea in the last 2 weeks* Not available
2009 14.5% (Source:2009/10 DHS) 29,169 cases (14.6% of population <5) were reported by clinics during Jan-Sep 2010) 2012 12.6% (Source: 2012 BESIK Hygiene and Sanitation Evaluation)
Reduction to 10% in target areas
Time taken to collect water Not available
64.4% of rural HHs collect water in under 30 mins (Source:2009/10 DHS)
70% of rural HHs collect water in under
30 minutes
Purpose Sustainably enhanced access to safe water, improved sanitation use and hygiene behaviour in rural communities in Timor-Leste
% of rural population with access to safe water (MDG indicator)* 57% 73%1 70%
% of rural population with access to improved sanitation (MDG indicator)
39 35.8
(Source:2009/10 DHS) 45
# of communities in rural areas declaring %100 open defecation free status 2
0 258 across sector (165 BESIK supported)
N/A3
# of additional households in rural areas with a hand washing facility and soap 0 13000 HHs 3000
Component 1: Enabling Sector Environment
Objective 1 A more enabling sector environment for sustainable and equitable delivery of RWASH services
Breakdown of BESIK commitment to water supply: sanitation and hygiene* 0
Water:77% Sanitation & Hygiene: 23%
Water 70%: Sanitation& Hygiene:
30% A
How has BESIK supported changes in GoRDTL RWASH policies and institutional capacity?*
Analysis and report
available A
Outcome 1.1 Key RWASH policies and strategic frameworks in place
Outcome Indicators To what extent are government and the sector utilizing policies and guidelines in RWASH planning and delivery?
Analysis and report available in March
2012 Ongoing B
Key Output Indicators
National Water Supply Policy, National Sanitation Policy and National Water Policy approved
Key policies need to be revised or
developed
National Water Supply Policy – Draft completed & under consultation
Sanitation Policy – approved by CoM & Gazetted Water Resources Policy – Ready for approval by
CoM
All policies approved Ongoing B
RWASH Sector Strategy and BCC strategy approved and socialised No strategies
RWASH sector strategy and BCC strategy approved and socialised
National Sanitation Strategy started
Strategies approved & socialised
Achieved A
Outcome 1.2 Training institutions and individuals providing specialized training in
Outcome Indicators # of people trained in RWASH delivery by local training institutions & master trainers (breakdown given in BESIK Training Report)
0 7275 (2283F/4982M) participants since project
start
3500 (1400/2100) Completed A
1 Estimated using 2010 Census as a base and additional people with access reported through SPT. 30% losses due to system failures are included in calculation 2 ODF status is measure of latrine use 3 Sector targets are currently being established in Sanitation Strategy

Program Outcome Hierarchy Key Performance Indicators and Questions 2007 (Baseline) To Date Target (June 2012) Status *Rating
RWASH delivery Key Output Indicators # of customized RWASH training courses available through training institutions
0 21 20 Completed A
# of RWASH master trainers able to train others
0
CAP 29 (10F) GMF O&M 24 (1F)
CLTS 10 (2F) Environmental Health 57 (16F)
Environmental Health District Trainers 256 (96F)
CAP 29 GMF O&M 23
CLTS 10 Environmental Health
35
Completed A
% of women participating in training delivered by BESIK
0
2009: 19% of 1578 participants 2010: 35% of 2671 participants 2011: 36% of 2212 participants 2012: 33% of 794 participants
40% Completed B
Outcome 1.3 RWASH agencies promoting gender equality in RWASH delivery
Outcome Indicators How have women and men been involved in planning, decision making, implementation and ongoing management of water and sanitation services and any hygiene promotion?*
Analysis and report available in March
2012 Ongoing A
To what extent are women engaged in all aspects of RWASH service delivery and demand?
Analysis and report available in March
2012 Ongoing A
Key Output Indicators # of community facilitators using gender tools in community engagement
0 259 180 Ongoing A
Gender activities included in DNSAS planning & budgets?
No Inclusion Gender included in AAP
Increased DNSAS expenditure on
promoting gender equity
Ongoing A
Outcome 1.4 DNSAS and SAS improving HR practices, financial planning and reporting
Outcome Indicators Improvements in DNSAS budgets, financial plans and reports as assessed against agreed quality criteria
Poor quality
Budget working group established Budget workshops conducted with district participation Parliament passed budget in Dec 12. Capital for rural water and allocation to O&M in 2013 Annual Action Plan
Budgets, plans & reports meet agreed
standards Ongoing B
Key Output Indicators % of DNSAS rural water budget bid allocated to increasing sustainability (design O&M, community engagement, gender activities and SDF costs in comparison to capital budget)
0%
15.24% in 2013 budget bid (2.81% community management; 1.67% survey design & supervision; 10.76% O&M) In 2012 while included in AAP, approved budget did not included O&M & survey & design.
15% Ongoing C
13 SAS offices regularly submitting monthly financial reports
0
100% of SAS offices submitting regular reports on time. Quality criteria have negotiated and agreed to. Monthly reconciliation forms improved
13 Ongoing A
Outcome 1.5 DNSAS and DNSC coordinating the
Outcome Indicators # of RWASH agencies submitting plans and updates using the Sector
0 10 agencies 12 agencies Ongoing A

Program Outcome Hierarchy Key Performance Indicators and Questions 2007 (Baseline) To Date Target (June 2012) Status *Rating
preparation and monitoring of sector plans
Planning and Reporting Tool Key Output Indicators WASH information system (SIB) established and maintained by DNSAS
No functioning WASH Info systems
97% of rural aldeias entered in SIB SMS testing commenced. Information Management and SIB program mentor engaged SIB still being maintained by BESIK
SIB maintained by DNSAS
Ongoing B
WASH coordination groups functioning and chaired by DNSAS & DNSC WASH forum not functioning
Forum chaired now by DNSAS with significant secretarial support from BESIK
Forum chaired by DNSAS/DNSC
Ongoing B
Outcome 1.6 District RWASH agencies coordinating and integrating the delivery of RWASH services to communities
Outcome Indicators # of communities targeted for all components of RWASH (water, sanitation and hygiene services)
0 97 110 Ongoing A
# of SAS districts plans integrated with district planning processes
Limited integration in all districts
Improved harmony in identification of priorities but need more clarity in District level planning responsibilities between District Administration and SAS. Presence of SDFs has promoted coordination at Sub District level and information flow to SAS.
12 districts Ongoing B
Key Output Indicators Mechanisms for targeting RWASH delivery established in 13 districts
No mechanism established
MoH now implementing CLTS and PAKSI in communities with a new water supply in 7 districts More collaboration between MoI and MSS to deliver vulnerable Household Toilet scheme. Trainers national workshop established a framework for District coordination workshops for BESIK2
12 districts Ongoing B
Mechanism for integration of SAS district plans with district planning processes established in 13 districts
No mechanism established
SIB data used to identify and verify SAS priorities in 12 districts. SIBS has been updated in over 50% of aldeias in last 3 months.
12 districts Ongoing B
Outcome 1.7 Increased MoI capacity in water resource management
Outcome Indicators Water vulnerability assessment completed and options for improved water resources management identified
Inadequate data to assess vulnerability
Vulnerability index completed. Increased awareness of DNGRA staff in vulnerability assessment and water resource management studies. Water Resource Policy and Law finalised after stakeholder consultation
.
Assessment available Ongoing A
Key Output Indicators National hydro-geological map available
Limited hydro-geological data
available
Waiting for Geoscience Australia to print final version
Hydro-geological map providing national
coverage Ongoing
A
Database on groundwater storage and quality established and maintained
No database available
National field trips completed and water quality data obtained. Database consultant recruited and presented draft report. Procedure for 6 monthly sampling developed.
Database established and maintained by
DNGRA Ongoing
A
Component 2: Access to safe water
Objective 2 65,000 of additional people in target areas with access to safe water 0 77,423 65,000 Ongoing A

Program Outcome Hierarchy Key Performance Indicators and Questions 2007 (Baseline) To Date Target (June 2012) Status *Rating
Sustainable water systems delivered to targeted communities
supply through BESIK/WSI systems* 130,000 of additional people in target areas with access to safe water supply through BESIK support to GoRDTL systems* 0
145,486 (Includes 26,600 through systems currently under
construction) 130,000 Ongoing A
# of additional schools and health posts in target areas with access to safe water* 0
58 schools 30 health posts
14 health centres
40 schools/25 health facilities
Ongoing A
80% of new systems fully functioning after 1 year
30%
86% of 2009/2010 systems with support from BESIK are fully functioning, with 10% of systems partially functioning, and 3 % of systems not functioning.
80% of 2010 CFET systems are fully functioning, 12% are partially functioning and 8 % are not functioning
80% Ongoing A
Have some rural water systems been more successful than others? Why?
Analysis and report
available Achieved A
Outcome 2.1 Communities planning and implementing water supplies using a socially and gender inclusive process
Outcome Indicators 150 communities supported to plan and implement water supplies using a socially and gender inclusive process
0 204 systems providing water to 616 aldeias 150 Ongoing A
# of new GMFs with at least 30% women
0
53% of new GMFs with at least 30% women 6% of new GMFs with > 50% women 93% of GMFs with women in technical or management positions
75 Ongoing A
Key Output Indicators 200 community facilitators able to deliver community engagement model
0 259 200 Ongoing A
88 SDFs recruited, trained and mentored by SAS/BESIK 0 88 88 Achieved A
Outcome 2.2 New and rehabilitated systems meet minimum design and construction standards
Outcome Indicators % of new systems that meet minimum standards for survey and design
No systems built BESIK/WSI - 100% Govt – 40% mostly conform
BESIK/WSI -100% Govt – 60%
Ongoing B
% of new systems that meet minimum standards for construction No systems built
BESIK/WSI - 95% Govt – 76% mostly conform
BESIK/WSI -95% Govt – 60%
Ongoing A
Key Output indicators 12 SAS staff monitoring use of Community Water Supply Guidelines & reporting non-compliance
0 All 12 staff trained in the use with 7 using guidelines. Limited reporting of non-compliance
10 Ongoing B
65 technicians able to undertake system survey and design to agreed standards
0 45 65 Ongoing B
Outcome 2.3 Communities maintaining water systems with support from SAS, NGOs and private sector
Outcome Indicators 80% of new GMFs fully functioning after 1 year
0 48% of GMFs are collecting funds and 63% are holding meetings 12 months after formation
80% Ongoing A
Key Output Indicators # of GMFs with members skilled in making minor repairs to water systems
Low skills in O&M 316 150 Ongoing A
Alternate management models developed , implemented and evaluated
No management models for multi-
village systems
O&M pilots for 10 water systems completed (4,206 beneficiaries ) completed in partnership with
DNSAS
Pilots evaluated and recommendations for
adoption Ongoing A

Program Outcome Hierarchy Key Performance Indicators and Questions 2007 (Baseline) To Date Target (June 2012) Status *Rating
Spare parts supply chain pilot, implemented and evaluated Poor spare parts
supply
Components included in O&M trial however substantial spare parts pilot to be included in next
phase of BESIK
Supply chain pilots implemented
Ongoing C
Component 3: Improved hygiene and sanitation
Objective 3 Improved hygiene and sanitation behaviour and practices in targeted communities
# of additional people in target areas with access to improved sanitation*
0 67,068 60,000 Ongoing A
# of communities in target areas declaring %100 open defecation free status
0 165 declared in BESIK target areas
80 Ongoing A
# of additional schools and health clinics in target areas with access to improved sanitation*
0
58 schools 30 health posts
14 health centres
40 schools 20 health posts
Ongoing
A
# of additional households in target areas with hand washing facilities and soap*
0 5,751 HHs 4000 Ongoing A
Have some sanitation approaches been more successful than others? Why?
Sanitation and Hygiene Evaluation completed in June 2012
Analysis and report available
Achieved A
Are the barriers to hygiene and sanitation related behaviour change for women, men, boys and girls understood?
Sanitation and Hygiene Behaviours Formative Research in Timor-Leste,’,March 2010
‘Handwashing with Soap in Timor-Leste, A Behavioural Study’, September 2011
‘Sanitation in Rural Timor-Leste, A Study of Demand and Supply’, November 2010
Analysis and report available
Achieved A
Outcome 3.1 Community health workers facilitating improved hygiene and sanitation through health outreach services in rural areas
Outcome Indicators % of SISCa with Table 4 promoting healthy WASH behaviours 0
86.5% (Based on supervision reports from May to
December 2011) 70% Achieved A
No. of communities engaged in sanitation and hygiene improvement activities through the community engagement process
0 310 aldeias 150 Ongoing A
Key Output Indicators 1200 PSFs promoting hygiene and sanitation through SISCa
0
2465 PSFs trained 87% attend regularly
76% conduct KUBASA (Source: PSF Monitoring Reports)
1200 Ongoing A
# PSF champions supporting sub-district environmental health promotion
0 9 PSFs trained and championing PAKSI 40 Ongoing B
# of community facilitators able to promote healthy WASH behaviours through the community engagement process
0 259 150 Ongoing A
Outcome 3.2 Rural households have improved hygiene and sanitation awareness through delivery of targeted approaches
Outcome Indicators 80% of households (care givers) can recall at least 2 key hygiene and sanitation messages
0 90% (Source: 2012 BESIK Hygiene and Sanitation
Evaluation) 80% Ongoing A
Key Output Indicators # of sucos participating in PAKSI pilots
0 16 3 Ongoing A
300 communities participating in total sanitation approaches 0
269 45 additional communities during reporting period
300 Ongoing A
200 communities participating in WASH behaviour improvement 0 358 200 Ongoing A

Program Outcome Hierarchy Key Performance Indicators and Questions 2007 (Baseline) To Date Target (June 2012) Status *Rating
activities
National HWWS communication campaign developed and implemented
Campaign workshop conducted to finalize communication objectives for HWWS campaign. Advertising Agency engaged and 2 concepts for campaign developed for pretestesting. Campaign scheduled to start July 2012.
Campaign implemented
Ongoing B
Outcome 3.3 Hygiene and sanitation products and services marketed at community level
Outcome Indicators # of sucos with communities purchasing hygiene and sanitation products 4
0 3 3 Ongoing A
% of household heads in target areas know where to access sanitation goods and services
0 Pilots commenced in Jan 2012 5 80% Ongoing A
Key Output Indicators Hygiene and Sanitation Marketing Study completed 0
Marketing Strategy Development Report for Sanitation Marketing completed Sanitation Marketing Implementation Completed
1 Completed A
Sanitation and hygiene products developed and marketing business model piloted with 3 businesses
0 2 3 Ongoing A
# of vulnerable households with access to improved sanitation facilities through subsidy system
0 30406 6000 Ongoing B
*AusAID WASH Strategy Performance Indicator/Question
Rating Scale A= On track to be fully achieved by end of the program B = Will be partly achieved by the end of the program/ too early to determine C=Unlikely to be achieved by the end of the program
4 Products include pit liners, latrine pans, hand washing facilities & latrine construction services 5 Waiting for final data from Hygiene and Sanitation Evaluation 6 Responsibility for this program transferred to ESTATEL in 2011. BESIK supporting DNSSB to prepare plan for 2012

ANNEX 4 COMPARISON OF SANITATION APPROACHES
1.1 INTRODUCTION
In May 2012, BESIK undertook an evaluation to investigate the effectiveness, efficiency, strengths and weaknesses of the sanitation and hygiene approaches piloted to date with support from BESIK.
The evaluation methodology involved a quantitative survey using random sampling to. Data analysis on key indicators was undertaken using SPSS. Surveys were undertaken in a total of 104 aldeias, where BESIK supported projects. They survey included a control area of 15 aldeias in Viqueque District, a district considered to have minimal influence from BESIK or other NGO sanitation and hygiene interventions. Qualitative semi structured interviews were undertaken with key stakeholders, including District Public Health Officers, Clinic Health Staff, NGO Staff, District Water and Sanitation Services Staff, Family Health Promoters, community leaders and community members. Major limitations of the methodology included: respondent recall, as many respondents could not remember finances spent on building their toilet; respondent participation, as occasionally only one of the two household members needed for the survey were available to participate; and remoteness of enumeration areas, as many target areas required long walks to reach, which depleted both time and enumerator energy to complete surveys.
The Evaluation Report is currently being finalised however the initial findings have provided a useful comparison between the approaches supported under BESIK and learning about drivers and barriers. Although the evaluation addressed both sanitation and hygiene, this document focuses on the effectiveness of the different approaches to sanitation supported by BESIK.
1.2 BACKGROUND TO SANITATION IN TIMOR-LESTE
Access to improved sanitation for rural communities in Timor-Leste in 2010 Timor-Leste Population Census was found to be 24.7%. Historically, sanitation projects have involved a subsidy (provision of materials), often linked to water supply programs, with the major implementers since 1999 being through NGO programs. CLTS (non-subsidy approach) was first introduced to Timor-Leste in 2007.
In 2009 BESIK supported the MoH and MoI to undertake a Joint Sanitation Evaluation (JSE) for further learning of impact of subsidy and non-subsidy approaches in Timor-Leste and to provide evidence to the policy makers in the development of Timor-Leste’s national sanitation policy.
BESIK supported the development of the Timor-Leste National Basic Sanitation Policy (NBSP) which was approved in March 2012. Within the policy a sustainable sanitation sector for Timor-Leste is framed by three pillars: 1) demand creation, 2) supply chain and 3) enabling environment. These three pillars aimed at addressing concerns with community demand creation, linked to supply chain development (enabling households to construct improved toilets) with a targeted ‘dmart’ subsidy element whereby vulnerable households that lack the basic resources to improve their sanitation, can also be supported. The policy sets a framework for clear, transparent and well communicated targeting of any subsidies.
1.3 THE EVOLUTION OF BESIK SUPPORT FOR SANITATION IN TIMOR-LESTE SINCE 2009
In 2009, BESIK provided funding support to implement a small number of sanitation projects based on CLTS approach. BESIK monitoring revealed that while senior staff within the implementing NGOs, understood the CLTS approach, the field staff, often lacked the skills. As a result, in late 2009, BESIK supported the development of a CLTS training program, that was implemented by a local training institute, East Timor Development Agency (ETDA).
In mid 2010, the Timor-Leste Government allocated $200,000 to construction of toilets for rural households. In order to support this funding to be targeted to vulnerable households, BESIK with the Department of Sanitation (MoI) developed a Total Sanitation Campaign (TSC) that linked CLTS with sanitation marketing and targeted subsidy

approaches. The TSDC was implemented in partnership with DNSAS Department of Sanitation and five local NGOs. The evaluation of the TSC in April 2011 made a number of recommendations7 which have been useful in further developing approaches to sanitation.
CLTS+ was developed in mid 2011 based on the initial findings of the TSC and bring and the findings of the May 2011 Handwashing with Soap Study. CLTS+ combined CLTS triggering with targeted hygiene promotion, ongoing mentoring of the community and where possible links to sanitation products. The projects were often linked to the GMF and PSF and intentionally targeted areas where BESIK or GoRDTL had developed community groups to manage their water systems building on the community interest in WASH.
The CLTS+I project was the CLTS+ project as detailed above with two additional components: an incentive for achieving ODF and sanitation marketing. BESIK’s monitoring had found that while communities were engaged in sanitation projects, very few were achieving ODF status (ODF being a key public health benefit). Sanitation incentives have been used successfully in other contexts. A further challenge identified was increasing access to improved sanitation (rather than basic), thus CLTS+I included sanitation products marketed in all sucos. CLTS+I was implemented district wide and involved the District Health Services, District Administration and the Suco Leaders for all sucos in the district.
PAKSI has been developed with the Ministry of Health as a longer term approach to scaling up sanitation, owned by government and drawing on the learning from the approaches, studies and evaluations through the BESIK program. PAKSI reflects the NBSP objectives. PAKSI is founded on the CLTS ideology, and modified for the context of Timor-Leste, including a strengthened triggering process for going to scale and links with sanitation marketing. A technical training program has been developed for implementers to strengthen their skills to provide guidance to community members to build improved hygienic toilets. PAKSI is currently being piloted in three sub-districts8.
1.4 EFFECTIVENESS OF DIFFERENT NON-SUBSIDIZED SANITATION APPROACHES
The BESIK program (using non-subsidy approach) has resulted in improved access to sanitation for 67,708 people rural East Timor. The evaluation found that of the houses surveyed 40.2% of the toilets built were improved (under JMP guidelines).
Table 1 provides a summary of outcomes for a range of indicators. The different project durations and starting dates should be noted, as they inevitably impacted opportunity for change to occur as well as influenced our ability to assess sustainability of the approaches.9
Table 1: Summary of Sanitation and Hygiene Impact Evaluation (May 2012) Indicator CLTS+I TSC CLTS+ PAKSI Total Across all
Intervention Areas Control
Start Date (All programs had ongoing support at date of evaluation, April 2012)
Sept 2010 – Start of TSC Feb 2011 – Start Incentive
Sept 2010 Aug 2011 Dec 2011
Project Duration 14 months 8 months 9 months 5 months % ODF Achievement 88% N/AVAIL 26% 0% # of HHs in Intervention Areas 5,229 7,470 16,875 4,592 34,166 3,194 % of people in target areas with access to basic + improved sanitation
86.5% 55.4% 45% 54% 58.4% 34.2%
% of people in target areas with 33.5% 15.1% 15.2% 18.7% 18.2% 3.3%
7 In 2011, a further $78,000 was provided directly to Ministry of State Administration (MAEOT) for the implementation of toilets for vulnerable households. The Department of Sanitation provided some input to MAEOT based on the learning from the evaluation, however were not in a strong position to influence delivery 8 As a result PAKSI was still being implemented at the time of the Sanitation & Hygiene Impact Evaluation in May 2012. 9 For example, based on the positive feedback received from the MoH around PAKSI, it is assumed that the short timeframe of the PAKSI implementation explains the lower rates of improved sanitation and use of the toilets.

Table 1: Summary of Sanitation and Hygiene Impact Evaluation (May 2012) access to basic sanitation % of people in target areas with access to improved sanitation
53% 40.3% 30.2% 35.3% 40.2% 30.9%
1.4.1 KEY FINDINGS The CLTS+I approach had the highest rates of access to sanitation: improved sanitation was 53%, with basic and improved sanitation at 86.5%). The consistent use of toilets also had the highest rate of 60%. The CLTS+I focuses on all aspects: sanitation demand, supply side and additionally the involvement of local leaders which was seen as positive by community members.
The CLTS+I had a higher number of improved latrines than other intervention areas and anecdotally this is linked to the availability of sanitation products in CLTS+I intervention areas.
1.4.2 COST EFFECTIVENESS OF APPROACHES CLTS+ approach has proven to be the most cost effective to date, however there are a number of improvements to the CLTS+ approach proposed. In addition, costs could be influence by scale e,g PAKSI may have a reduced cost per beneficiary, once implemented at scale.
The addition of a substantial incentive fund to the CLTS+I programme has increased the costs per beneficiary for the programme. In the longer term it has to be determined which of the programmes has produced the most sustainable results, especially the number of toilets still in-use after one year post ODF verification. It also has to be determined if there are more cost-effective methods of engaging the local leadership in improving sanitation, through a similar competition monitoring structure rather than through an incentive program.
1.4.3 THE IMPACT OF SUBSIDY PROGRAMS ON THE PROGRESSION FROM A BASIC TO AN IMPROVED TOILET
Overall, while non-subsidized sanitation approaches were effective in engaging households to take the first step on the sanitation ladder by building a basic toile, the majority of community members interviewed believe they had “complied” by building a toilet and now were waiting/hoping to receive materials to allow them to upgrade their toilets. Communities often stated that they engaged in the program to receive materials for an improved toilet. Whether this is a vestige remaining from subsidized programs that used to predominate in Timor-Leste or incorrect information it is critical that all actors in the sanitation sector implement in accordance to the NBSP and convey the same messages about clear criteria to receive a subsidy. Community members expressed confusion in the process, which can lead to distrust and reticence to participate in unsubsidized approaches.
Competing priorities on the household income were often noted as a barrier to using household funds for improved sanitation “If we only use our money for toilet construction there is no problem, but we also use our money for other needs such as paying school fees, so we have to save money for our children’s school.” [Focus Group Discussion, Builicon, Balibo, Bobonaro]. Mobile phone ownership and use in TL has increased dramatically over the past three years, indicating there is a level of household income available for priorities. Marketing of accessible sanitation products at an affordable price, along with triggering events that engage households in “wanting” a toilet are essential to continue to support.
1.4.4 ACHIEVING OPEN DEFECATION FREE STATUS While communities are keen to participate in sanitation, there were challenges to attaining ODF, apart from in the CLTS+I where 88% of those triggered went onto achieve ODF. The evaluation has found that the facilitation skills of the partners to engage with the communities on a regular basis and to provide technical advice on building toilets has
Table 2: Cost per beneficiary for Non-subsidized Approaches
Programme Contract Value
Beneficiaries Cost per beneficiary
CLTS+ $160,593 6434 24 CLTS+I $99,622 1333 74 PAKSI $35,253 773 45

been key to achieving ODF. “The training organized by Maladoe was an effective way to change our behavior. The training was practical and it provided people with on-site technical support.” [Chefe Suco, Acomano, Liquica]
Across all approaches, the distance of some remote households from the community impacted on their participation. Those households far away from where triggering events were conducted and from the communities’ dissemination networks were seen to be marginalized from sanitation promotion activities. In the case of the CLTS+I program, the NGO staff explained that they would spend hours walking to distant households to check on sanitation status and provide technical and motivational support, but because of the time and effort to reach these locations, would usually only visit each house once. Also integral to engagement is making improved sanitation options within the perceived reach of the community. To improve effectiveness of any sanitation approach to achieve 100% ODF i.e. reaching those remote households it is imperative that implementation mechanisms, and staffing take into account difficult to reach populations.
1.4.5 PAKSI PROGRAM The PAKSI pilot programme commenced 5 months prior to the evaluation, and due to the wet season is unlikely to prove its full effectiveness and or cost effectiveness until it has run for a nine month period. PAKSI is integrated with Ministry of Health district and sub-district programs and it is expected that the gains from the PAKSI approach will be better sustained, however many of the lessons from the Sanitation and Hygiene Impact Evaluation will be incorporated into the ongoing development of PAKSI.

ANNEX 7 – SUMMARY OF PERSONNEL INPUTS
Table 1: Indicative Long Term Personnel (months)
Roles WoLWP#1 Jan2009
Sep07-Sep12 1AUD=USD0.7
0
WoLWP#210 Sep2010
Sep07-Jun12 1AUD=USD0.8
Forecast end of
program11 to 16Sep12
Notes
International Long Term Personnel
Program Team Leader -
60 57.5 60 WoLWP#1 + inception period
New Team Leader Feb 2009
Program Coordinator (Operational role)
0 18 25.5 From Sep 2010
(Organisational and) Capacity Development Advisor
60 51.0 52.5 Gap in role Jun 2010- Jan 2011
Environmental Health Advisor 46 34 45.0 Implementation period
WS&S Engineering Advisor 1 (WSEA1), previously RWSSA
50 39 39.2 Implementation period
WS&S Engineering Advisor (Transition)
0 0 2.5 New role for extension period
National Engineering Advisor, previously
WS&S Engineering Advisor 2 – Hydrology
47 45 46 14 mths via WSI
Sanitation Advisor 44 43 45.5 14 mths via WSI
Community Development Advisor 43 39 38.3 Ended early June 2012
Gender Advisor 12 24 24 14 mths via WSI
Behaviour Change and Communication Advisor
22 27.5 30 12 mths via WSI
District Engineering Advisor 1
38 22 30.5 14 mths via WSI
Delayed recruitment due to late WSI
District Engineering Advisor 2
38 19 28 14 mths via WSI
Delayed recruitment due to late WSI
10 As reflected in Contract Amendment 7 11 As reflected in proposed Contract Amendment 9

Roles WoLWP#1 Jan2009
Sep07-Sep12 1AUD=USD0.7
0
WoLWP#212 Sep2010
Sep07-Jun12 1AUD=USD0.8
Forecast end of
program13 to 16Sep12
Notes
Water Resources and Groundwa1990 dayster Advisor
0 12 24.6 via CCAI funding
also Water Resource and Climate Adaptation Advisor
Completed roles Community Management Advisor
Environmental Health Advisor (Inception)
Rural Water Sup and Sanitation Advisor
Social Training Advisor
Sub-total completed roles
(18)
47
-
(18)
47
(18)
47
CMA (inception) became CDA EHA (inception) became EHA
RWSSA (inception) became WSEA1
International sub-total 506 478 538.6 Months
Local staff
Program Operations Manager 59 50 58.5 WoLWP#1 + inception
period
2 Community Development Officers
102 116 121
12 District Community Development Officers
516 431 461 Delayed approval of WoLWP#1
Monitoring & Evaluation Officer 44 41.5 44
Gender Development Officer 42 36 38.5
2 National Training Officers 86 67.5 72.5
2 WS Technical Supervisors 1&2 88 77.5 82.5 26 mths via WSI
Operational Locally Engaged Staff
1,064 1,071 1,194.7 47 mths via WSI; includes drivers, cleaners, administrative and financial staff
TOTAL 2,507 2,356.5 2,606.3 155 via WSI
12 As reflected in Contract Amendment 7 13 As reflected in proposed Contract Amendment 9

Table 2: Indicative Short Term Specialists (by days) Role WoLWP#1
Jan2009
Sep07-Sep12 1AUD=USD0.70
WoLWP#214
Sep2010
Sep07-Jun12 1AUD=USD0.80
Forecast end of
program15
To mid Sep12
Notes/comments
Inception phase
Strategic Framework Specialist 105 127 127 The focus of the inception phase was development of a Program Strategic Framework and other major analytical pieces. The WoLWP#1 was first drafted Feb 2008 for period Jun08-Aug12
PSF Lesson Learnt Specialist 10
PSF Review Specialist 7
Unallocated 5
Also Gender & Sanitation specialist Incorporated below
Implementation
M&E specialist 330 455 437 391+46 (USTA)
Sanitation Policy Specialist 76 123 167 Implementation period
Gender Specialist 60 32 56
Information Management Specialist
120 170 289 Main focus for this role has been establishment of SIB and handover – original inputs underestimated
251+38 (USTA)
MTEF Specialist 210 278 196 MTEF process was not supported by GoTL; focus on long term expenditure
149+47 (USTA)
Policy and Planning Specialist 180 143 189 113+76 (USTA)
Sector Strategy Specialist 180 86 86
Instructional Design Specialist 120 102 168
Environmental Specialist 120 10 10 Some of this specialist role was taken up by the CCAI funded full
14 As reflected in Contract Amendment 7 15 As reflected in proposed Contract Amendment 9

time adviser
Handwashing Specialist 0 0 122 Originally from unallocated
Unallocated STA – CP 315 169 89
Unallocated STA – WSI 266 59 266-207 (allocated to other roles)
Total 1,838 1,971 1,995 Days

ANNEX 9 – FINANCIAL SUMMARY
Table 1: Funding Sources
Funding source and contract category Contract Value
(Amend 9)
Expenditure Sep 2007-
Sep 2012 Balance
AUD AUD AUD
Country Program Funds $28,203,186 $27,998,951 $204,235
Water & Sanitation Initiative $11,880,247 $11,852,385 $27,862
Climate Change Adaptation Initiative $995,754 $633,124 $362,630
BESIK PROGRAM TOTAL $41,079,118 $40,484,461 $594,727
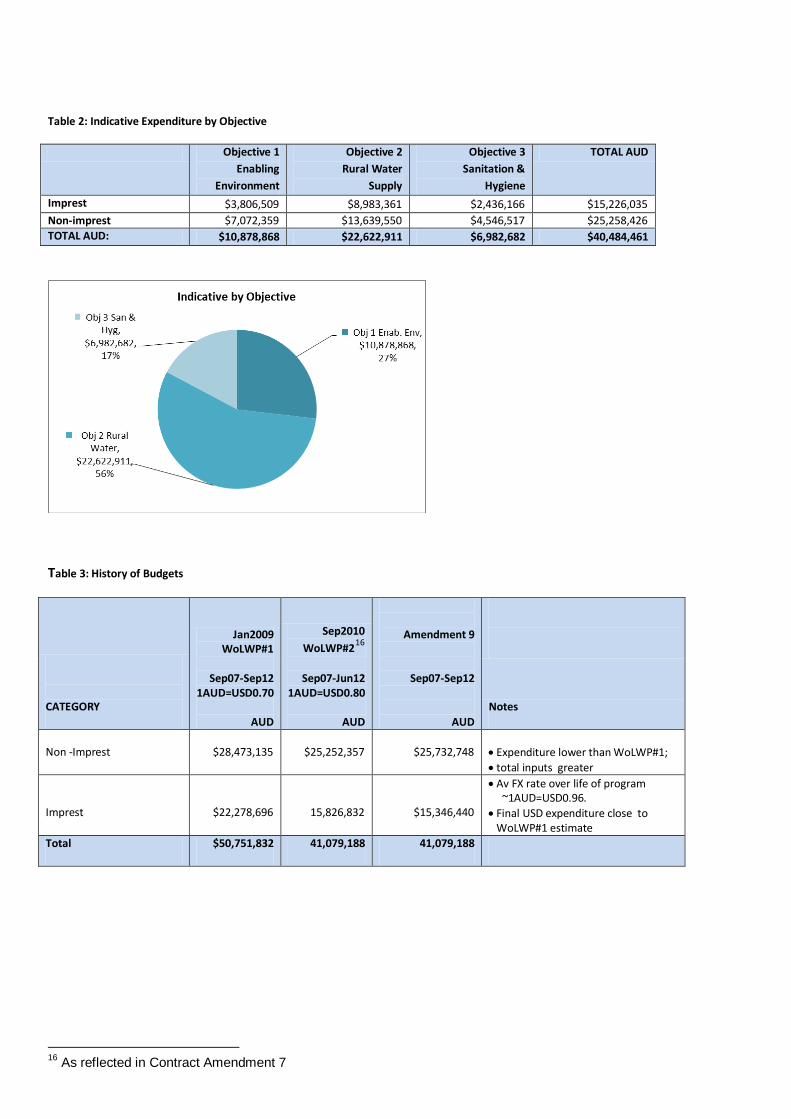
Table 2: Indicative Expenditure by Objective
Objective 1 Enabling
Environment
Objective 2 Rural Water
Supply
Objective 3 Sanitation &
Hygiene
TOTAL AUD
Imprest $3,806,509 $8,983,361 $2,436,166 $15,226,035 Non-imprest $7,072,359 $13,639,550 $4,546,517 $25,258,426 TOTAL AUD: $10,878,868 $22,622,911 $6,982,682 $40,484,461
Table 3: History of Budgets
CATEGORY
Jan2009 WoLWP#1
Sep07-Sep12
1AUD=USD0.70
AUD
Sep2010 WoLWP#216
Sep07-Jun12
1AUD=USD0.80
AUD
Amendment 9
Sep07-Sep12
AUD
Notes
Non -Imprest $28,473,135 $25,252,357 $25,732,748 • Expenditure lower than WoLWP#1; • total inputs greater
Imprest $22,278,696 15,826,832 $15,346,440
• Av FX rate over life of program ~1AUD=USD0.96.
• Final USD expenditure close to WoLWP#1 estimate
Total $50,751,832 41,079,188 41,079,188
16 As reflected in Contract Amendment 7

ANNEX 10 – IMPREST FUND
Indicative - categories and key activities.
CATEGORY / IMPLEMENTER ACTIVITIES AUD$
VALUE %
BESIK 262 1.721 m 11.3%
Assets for Timor-Leste Government Ministries17 1 0.414 m 2.7% Hand-Washing With Soap / Sanitation Research & Monitoring Evaluation 1 0.106 m 0.7%
Pilot Operations & Maintenance Project 1 0.087 m 0.6% Consultants – International 27 0.386 m 2.5%
Consultants – Local 75 0.165 m 1.1%
Contractors 84 3.195 m 21.0%
Buka Timor Hamutuk, pipe and materials supplies 37 1.579 m 10.4% Fugro Airborne Surveys Corp., geophysical surveys 1 0.383 m 2.5%
BJM Construction Builder's Unipessoal Lda, various construction services 5 0.180 m 1.2% Geotechnik Ltd, well drilling 1 0.153 m 1.0%
CALTECH, various services 8 0.133 m 0.9% Government of Timor-Leste 240 1.696 m 11.1%
Direccao Nasional dos Servicos de Aqua e Saneamento (DNSAS) 127 0.802 m 5.3% Ministry of Health (inc Health Promotion and Environmental Health) 59 0.711 m 4.7%
SAS- All Districts 40 0.114 m 0.7% INGOs 17 1.513 m 9.9%
Triangle GH, Covalima 5 Water System Projects 1 0.781 m 5.1% Plan Timor Leste, baseline surveys 2 0.222 m 1.5% Oxfam Australia, Oecussi activities 1 0.156 m 1.0%
World Vision, 2 water systems 2 0.145 m 1.0% Institutions 29 1.350 m 8.9%
Centro Nacional de Emprego e Formacao Profissional, GMF and other training 7 0.292 m 1.9% Institute Teknologi Sepuluh November,Surabaya,Indonesia, scholarships 2 0.460 m 3.0%
NGOs 174 3.966 m 26.0%
Hamoris Timor Oan 17 0.939 m 6.2% Centro Pupuh Ira Timor 19 0.611 m 4.0%
Amizade 14 0.467 m 3.1% Tuna Mutin Fundasaun 8 0.230 m 1.5%
Fundasaun Bia Hula 10 0.227 m 1.5% Naroman Timor Foun 10 0.202 m 1.3%
Malaedoi 7 0.175 m 1.1% Suppliers 70 1.227 m 8.1%
H2O Pump and Power, bore holes 6 0.352 m 2.3% UD Palma MTC, motorbikes 2 0.197 m 1.3%
Silkar International, Lda, electrical systems 2 0.153 m 1.0% Startec Enterprises Lda, pump systems 5 0.115 m 0.8%
GRAND TOTAL 963 15.226 M 100.0%
17 This represents one asset purchase. Total asset purchases, activities on behalf of GoRDTL are higher.

BESIK Activity Completion Report Annex 12 (Training) Page 20
ANNEX 12 – TRAINING SUMMARY STATISTICS (JUNE 2012)
Skills Area Participants No. of activities delivered
No. of Training days
Response to course completion evaluation question: 'I will be able to use in my job what I've learnt in the training' (% of responses)
Males Females Total Strongly Disagree
Disagree Don't know Agree Strongly Agree
Communication 143 29 172 5 1384 0 0 1 48 51
Community Engagement 690 294 984 30 4976 0 0 2 56 42
Gender 741 381 1122 46 1840 0 1 1 57 41
GMF Finance Training 154 152 306 41 466 3 0 5 16 76
GMF Technical Training 570 294 864 58 4608
Health service delivery 960 655 1615 40 25945.5 0 0 1 52 47
Program management 529 180 709 20 2144 0 1 0 53 45
Rural Water Guidelines 177 23 200 16 267 0 0 5 65 30
Sanitation service delivery 458 111 569 20 2085 0 2 2 53 43
SIBS 62 17 79 9 79
Water Resources Management 5 1 6 6 50
Water service delivery 415 122 537 31 1852.5 1 0 3 69 28
Other 78 34 112 3 236 0 2 0 60 38
Totals 4982 2293 7275 325 45933 NFOMATIO
2009 2010 2011 2012
Female 302 950 794 247
Male 1296 1721 1418 547
0200400600800
100012001400160018002000
No.
of p
artic
ipan
ts
Training Participants by Year
CommunityMember Contractor District
GovernmentNational
Government NGO Other
Female 849 8 993 56 363 2
Male 1230 81 2899 93 577 4
0
500
1000
1500
2000
2500
3000
3500
No.
of p
artic
ipan
ts
Training participation by organisation type

BESIK Activity Completion Report Sept 2007 – June 2012. DRAFT V2Annex 13 (Recommendations) Page 21
ANNEX 13 – SUMMARY OF RECOMMENDATIONS FOR BESIK2
DELIVERY OF SUSTAINABLE RURAL WATER SERVICES 1 BESIK2 will be working with a newly elected government that is likely to be preoccupied for its
first six months. It will important for AusAID and BESIK2, however, to find the space for dialogue on priority issues in the sector, particularly sustainability and at-scale. Depending on the new Government, BESIK2 could use the National Strategic Development Plan and associated targets as a basis for this dialogue.
2 BESIK2 to work with both DNSA and ministerial levels of government to gain recognition of the importance of a service delivery (as opposed to infrastructure delivery) approach and the importance of trialling alternative institutional options for service provider models are appropriate to the Timor-Leste context.
3 BESIK2 to work with a range of stakeholders to undertake trials of options for a service delivery approach including operations and maintenance. An effective trial of such models will require significant preparatory work including addressing existing gaps in the institutional framework (e.g. asset ownership) and addressing public financial management constraints in terms of multi-year commitments and fiscal decentralisation. Efforts to improve the supply chain for spare parts and offering a national contact for specialised technical assistance (for instance for pump systems) are needed to underpin all service models. Initial steps are outlined in reports prepared by BESIK.
4 BESIK2 to work with DNSA, MoI and through whole of government channels to further assess the impact of different delivery models for rural water supply and how these models can be aligned.
6 BESIK2 to work with DNSA to strengthen the engagement with the Director General Corporate Services within MoI, with clear justification of budget figures, using evidence based presentation on the importance of MoI investment in services.
7 BESIK2 and DNSAS should continue to: • Work with higher levels of government to better define water infrastructure asset
ownership in rural communities, which is a key principle underpinning O&M. • Strengthen the current institutional framework, where communities are responsible for
O&M for small systems, and gives joint responsibility to communities and DNSA for larger systems that cover more than three communities. Suggested improvements to this model include better developed planning and support processes for communities to undertake O&M, support to professionalise and formalise GMFs, and clarification of the division between DNSA/SAS responsibilities and community responsibilities, capital maintenance roles and cost-sharing arrangements.
8 BESIK2 to support DNSA/SAS to identify and justify required district-level human resources and on-going staff capacity building, including with respect to technical skills, to be able to implement O&M options.
9 BESIK2 to support DNSA to engage globally with the WASH-Cost work (www.washcost.info) and to identify further data collection (possibly a study) on actual maintenance requirements and costs. Analysis of the breadth of life-cycle costs for different system types is needed to contribute to a stronger evidence base for planning and budgeting of on-going service delivery for all sector actors.

BESIK Activity Completion Report Sept 2007 – June 2012. DRAFT V2Annex 13 (Recommendations) Page 22
10 BESIK2 to work with DNSA, Director General and Ministerial level to gain endorsement of sustainability indicators (e.g. functionality of water systems, GMFs, collection of funds) and targets to complement the current focus on coverage; and to ensure resourcing for ongoing implementation of SIBS with regular reports being shared at appropriate levels to influence decision making.
11 BESIK2 should continue to support DNSA to monitor the use of quality standards for design and construction and to provide effective support to community-based service providers through sub-district facilitators. Investment is needed in a robust asset registration and information system to underpin O&M planning.
WATER RESOURCES MANAGEMENT 12 BESIK2 and AusAID should focus on policy dialogue on the importance of managing Timor-
Leste’s water resources, including discussion on where the responsible directorate should be best located to be able to effectively manage Water Resources.
13 BESIK2 and AusAID should continue to support DNCQA (or an alternative Directorate for Water Resources) for at least three years through the provision of an international specialist. A revised capacity development plan should be developed with ongoing carefully selected short-term training courses in relevant subjects in the region, through on-the-job training, and with options for in-country field training by specialist groups, including those supplied by GeoScience Australia.
14 BESIK 2 continue to provide technical support to GoRDTL in the approval of the Water Resources Policy and Law. BESIK2 should provide technical and financial resources to socialise the policy and law at all levels. The future approval of the policy and legislation will lead to further capacity development needs that BESIK2 will be well placed to support.
15 BESIK2 should advocate for and assist in the establishment of a Water Resources Ministerial Council and technical support panel to coordinate water resource planning. This will necessitate further training in Integrated Water Resource Management. Additional investment will be required for development of training of procedures, regulations and capacity to administer the Water Resource Law.
CAPACITY DEVELOPMENT
16 BESIK2 to work with Ministries/Directorates to identify options for accessing resources required to deliver training and mentoring activities (e.g. engage the Human Capital Development Fund18) and to establish systems for that ensure returnees from scholarships are effectively re-integrated in the work place.
17 Through BESIK2 continue to strengthen opportunities for women to participate in training and capacity development activities
18 Through BESIK2, continue to provide resources for mentoring facilitators trained under BESIK to deliver rural WASH activities at the community level.
FRAGILE STATE CONTEXT
18 The GoRDTL has established two multi-year budget funds within the 2012 budget: the Human Capital Development Fund (HCDF) and the Infrastructure Fund. The HCDF is $30million and will allow multi-year funding for human resources development (training, capacity building) for strategic development sectors.

BESIK Activity Completion Report Sept 2007 – June 2012. DRAFT V2Annex 13 (Recommendations) Page 23
19 AusAID, with BESIK2, to engage in policy dialogue with GoRDTL at a senior levels concerning a service delivery approach to WASH (as opposed to an infrastructure approach). Through dialogue reach consensus on how to maximise the sustained impact of current large amounts of capital investment. This is likely to require innovative ways of increasing political commitment to, and thus resources for, non-capital components of WASH service delivery.
COMMUNITY ENGAGEMENT
20 BESIK2 to provide technical support to DNSA, MAEOT and ADN to develop a common approach to delivery and ongoing management of rural water supply, using an evidence base from experience in Timor-Leste and drawing on lessons from other similar contexts.
21 BESIK2 to work with DNSA, ADN, MoH and MAEOT to further develop systems that recognise the role of the community leaders (the Suco Council) in community water supply and improved sanitation and hygiene.
22 BESIK2 work with MAEOT and DNSA to review the existing good practice and relevant laws governing the responsibilities of the Suco Council and the GMF in water system management to formalise the roles of each and relationships of accountability.
EFFECTIVENESS OF SANITATION APPROACHES 23 BESIK2 should continue to work with both DNSC (MoH), DNSSB (MoI) and MAEOT on policy
dialogue and technical support on rural sanitation programs, in line with the National Basic Sanitation Policy. Continued technical support by BESIK2 to the development of the National Sanitation Strategy will be key in strengthening an cohesive approach across Government to the delivery of sanitation, and combined with further evidence based learning contribute to effective models for increased access to sanitation at scale.
24 BESIK2 should work with the TL Government and stakeholders to implement the Sanitation Marketing Implementation Plan (SMIP) developed for Timor-Leste. The SMIP recommends that BESIK2 has a dedicated team with a business development focus that links to the Sanitation Behaviour Change campaign.
25 The BESIK2 Program Design Document (PDD) identifies additional focus on school led total sanitation (SLTS). This will need to be resourced fully, and will need to involve the Ministry of Education.
26 BESIK2 will need to balance undertaking with sanitation and pilots with GoRDTL demand to scale up.
27 BESIK2 should provide technical input to the MoH to increasingly engage with MAEOT on sanitation and hygiene initiatives, specifically linking with the District Health Services to further develop models to scale-up sanitation and hygiene and to ensure long-term support to sustain ODF status.
28 BESIK2 should continue to focus technical and funding support to the MoH and others to strengthen facilitation skills and models for mentoring to achieve HH level behaviour change.
29 BESIK2 should continue to work with both DNSC (MoH), DNSSB (MoI) and MAEOT on policy dialogue and technical support on rural sanitation programs, in line with the National Basic Sanitation Policy. Continued technical support by BESIK2 to the development of the National

BESIK Activity Completion Report Sept 2007 – June 2012. DRAFT V2Annex 13 (Recommendations) Page 24
Sanitation Strategy will be key in strengthening an cohesive approach across Government to the delivery of sanitation, and combined with further evidence based learning contribute to effective models for increased access to sanitation at scale.
GENDER AND SOCIAL INCLUSION 30 A sound base has been established for gender-inclusive programming through training, systems,
materials and monitoring of women’s participation, particularly in the delivery of rural water supply. However these are the initial steps and BESIK2 will need to work with government counterparts to consolidate these successes. In particular, attention is required on encouraging and monitoring achievement of gender balance in GMFs and continual support to identify and resource opportunities for women’s participation in sanitation programs.
31 BESIK2 has an opportunity to monitor the medium-term development and equity outcomes resulting from women’s participation, providing both learning for WASH and development, not only in Timor-Leste but globally.
32 While the building blocks for gender equality have been established for the delivery of rural water supply, given the ongoing scaling up of sanitation BESIK2 needs to maintain a focus on suggestions for gender-inclusive sanitation program, as detailed in the BESIK Gender Impact Report.
33 BESIK has focused on awareness raising, policy development and some options for PLWD. BESIK2 can build upon this by working across Ministries to identify options for GoRDTL to further implement well-targeted support to vulnerable households or individuals in accordance with clear and agreed criteria. BESIK2 could further investigate work with MSS may be a useful co-manager in WASH interventions aimed at responding to the needs of people with disability or other specific vulnerable groups.
34 Menstrual hygiene is increasingly being recognised as a central WASH issue, impacting on access to education for girls, and for income earning training and other opportunities for women. BESIK2 with the MoH could build on the very initial steps that BESIK has taken to further identify appropriate mechanisms in the Timor context to integrate menstrual hygiene into sanitation and hygiene programs are being developed.