Anne Arundel County, MD - Engaging Communities ......Site 3" rain 0.48" rain 0.00" rain 0.55" rain 1...
40
Engaging Communities, Restoring the Landscape, One Watershed at a Time.
Transcript of Anne Arundel County, MD - Engaging Communities ......Site 3" rain 0.48" rain 0.00" rain 0.55" rain 1...

Engaging Communities, Restoring the Landscape, One Watershed at a Time.
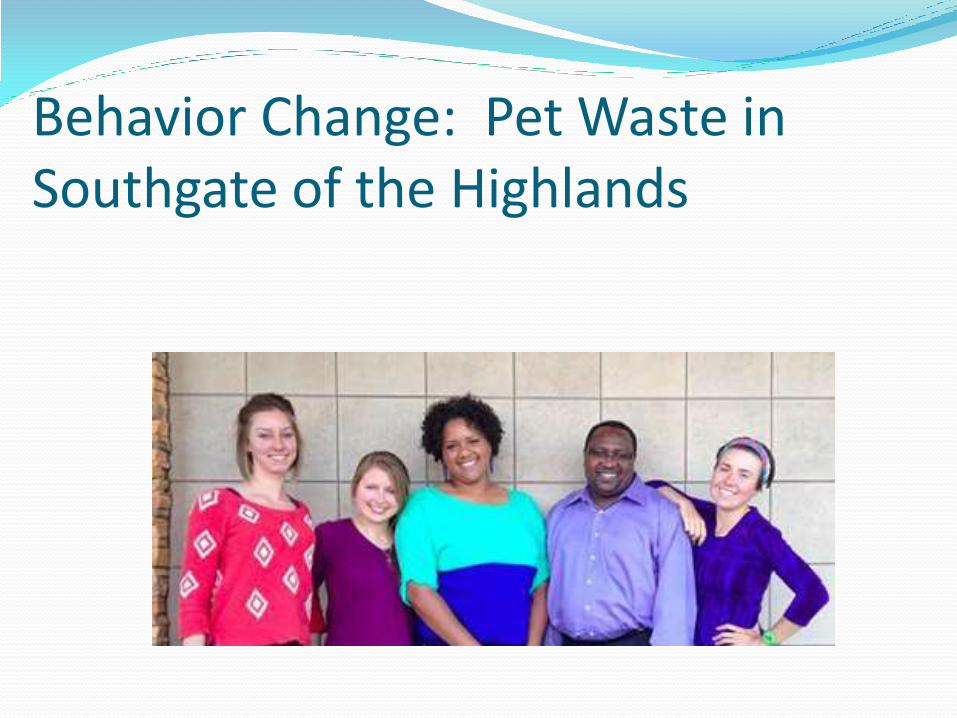
Behavior Change: Pet Waste in Southgate of the Highlands

3/30/2014 4/7/2014 4/26/2014 6/5/2014
Site 3" rain 0.48" rain 0.00" rain 0.55" rain
1 7400 300 108 6250
2 7200 220 120 10,000
3 7500 240 116 10,750
4 4100 740 88 11,900
5 2800 820 84 10,700
Enterococci Acceptable Limit = 100
CFU/100 ml
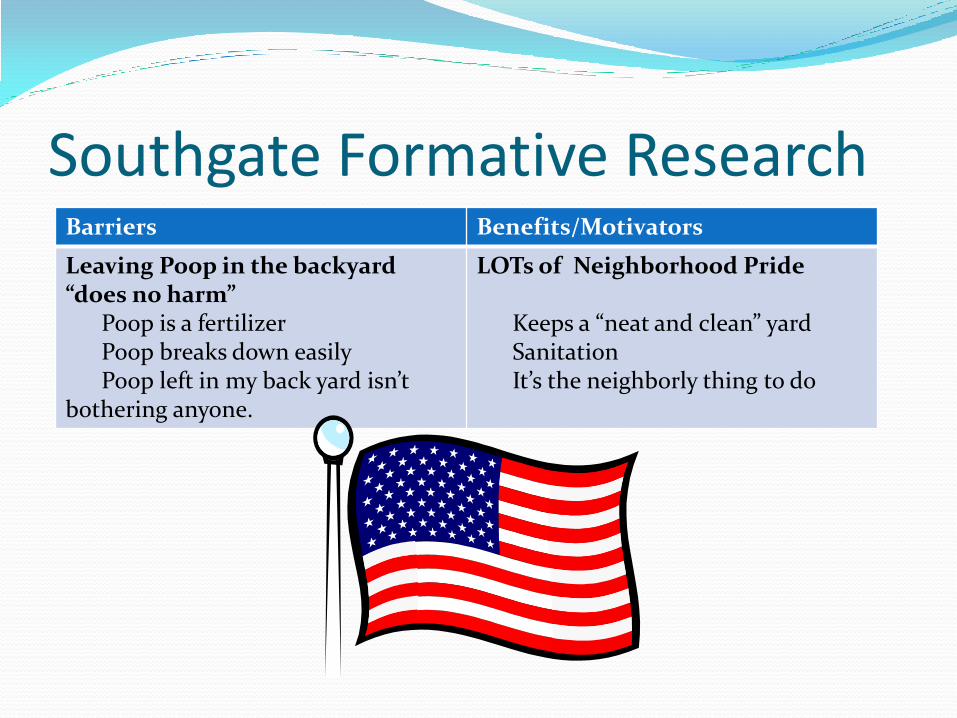
Southgate Formative Research Barriers Benefits/Motivators
Leaving Poop in the backyard “does no harm” Poop is a fertilizer Poop breaks down easily Poop left in my back yard isn’t bothering anyone.
LOTs of Neighborhood Pride Keeps a “neat and clean” yard Sanitation It’s the neighborly thing to do

Southgate Strategies Direct Mail
Canvassing
Commitment
Door Hanger
Magnet Prompt
Block Party
More Direct Mail

Southgate Canvas and Commitments Red: Not yet visited Green: Not home, no dog or no commitment made. Blue: Commitment made! I commit to always “Scoop Poop” after my pet, even in my backyard. Commit to educate others about the importance of picking up their pets’ waste. I also commit to always carry extra doggy bags when I walk my pet. SCOOP IT, BAG IT, & TRASH IT.

Southgate Strategies

Southgate Strategies
Stay tuned this fall to find out what happened!

Anne Arundel County
Watershed Summary
• 12 watersheds
• 354 sub-watersheds
• 35 sub-watersheds
with >30% impervious
area
• 75 sub-watersheds
with 20% - 30%
impervious area
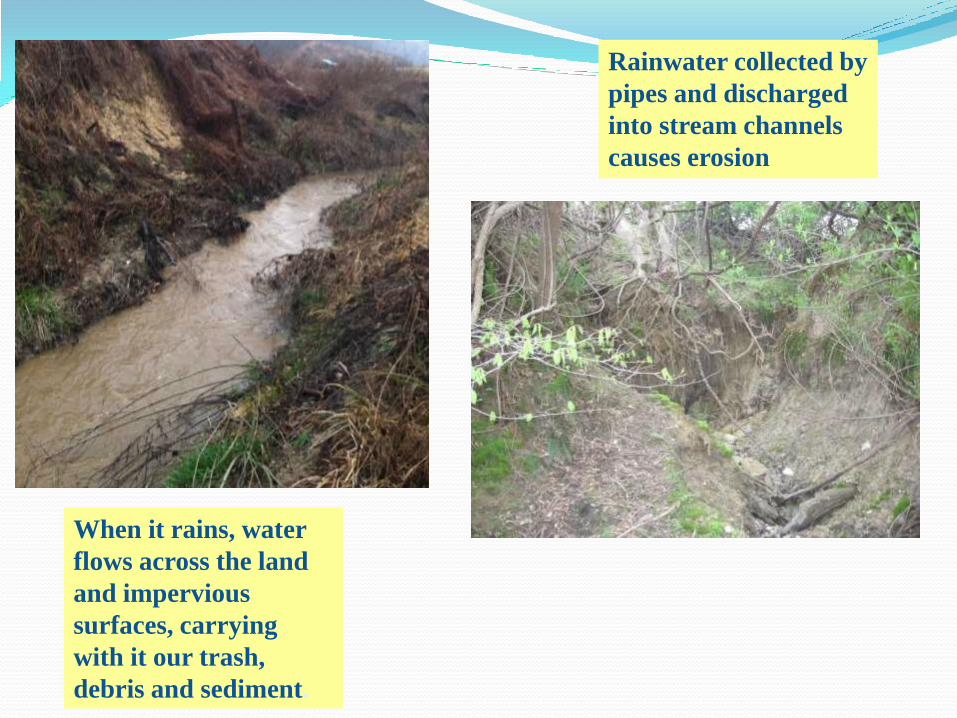
When it rains, water
flows across the land
and impervious
surfaces, carrying
with it our trash,
debris and sediment.
Rainwater collected by
pipes and discharged
into stream channels
causes erosion

Sediment run-off quickly
clouds waterways cutting
off sunlight critical to the
Bay’s ecosystem.
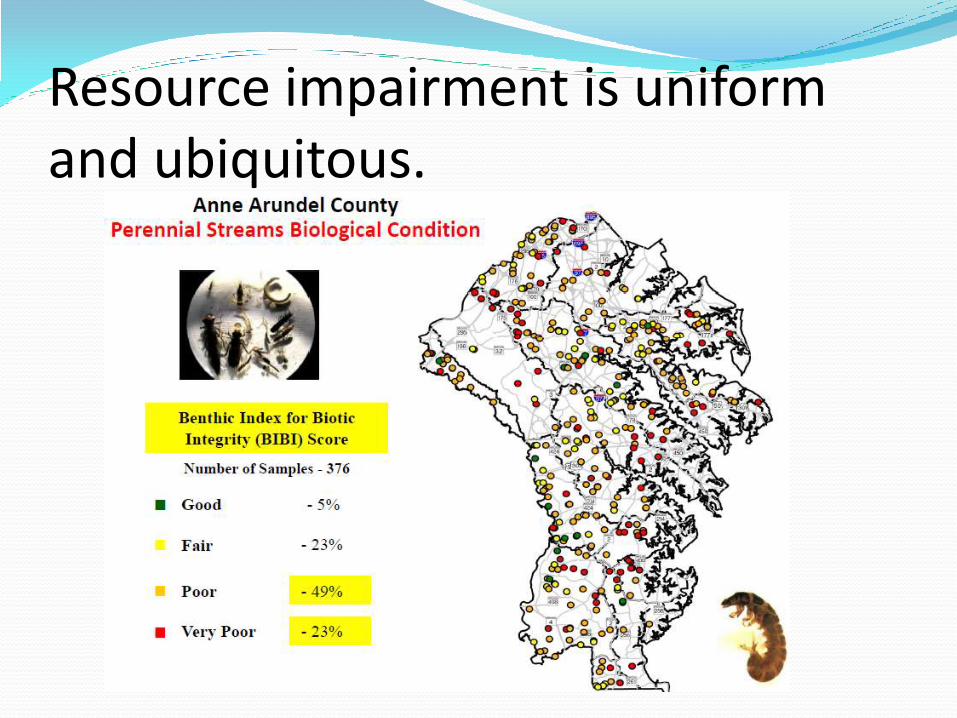
Resource impairment is uniform and ubiquitous.

Sector
Acreage
%
Nitrogen Load
(lbs/year)
%
Phosphorous
Load (lbs/year)
%
Anne Arundel Co.
Government Land 32,398 12% 164,984 15% 19,042 13%
Private Sector Land 170,749 64% 497,390 46% 56,311 39%
Federal Owned Land 20,309 8% 36,630 3% 4,930 3%
State Owned Land 19,277 7% 91,308 9% 13,041 9%
City of Annapolis 4,533 2% 43,710 4% 5,480 4%
Agriculture Land 18,384 7% 243,878 23% 46,224 32%
TOTAL 265,650 100% 1,077,900 100% 157,324 100%
Phase II WIP Distribution of Existing Stormwater Loads Between
Source Sectors

14
HOW: Network Resources to Build Capacity and Provide Support
Identify citizens within communities who are capable
of and willing to act as Master Watershed Stewards.
Educate an army of Master Watershed Stewards on
relevant Bay issues to engage, empower and coordinate
communities to take action.
Support Master Watershed Stewards with a
consortium of support professionals and resources as
they carry out education and restoration initiatives.

What is a Community?
15
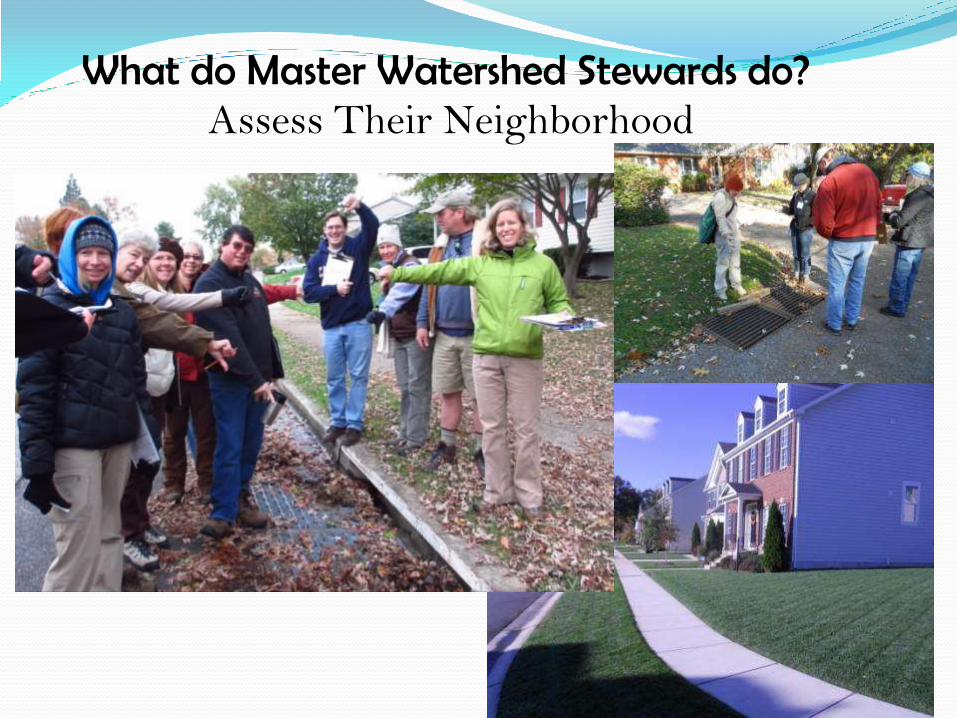
What do Master Watershed Stewards do? Assess Their Neighborhood
16

17
What do Master Watershed Stewards do? Educate and Engage their Community
Over 97 presentations and outreach events
were held, reaching over 9,000 people

18
What do Master Watershed Stewards do? Coordinate Action
Reduce Pollutants RainScape

Unified Subwatershed and Site Reconnaissance (USSR)
Developed by

Designed to:
Identify Pollution Sources
Identify ways to manage pervious surfaces, utilities and public areas to benefit water quality.
Identify potential upland restoration projects.
Assess a subwatershed pollution index and potential for restoration.
On a subwatershed scale.

4 Components of the USSR
Neighborhood Source Assessment
Hot Spot Investigation
Pervious Area Assessment
Streets and Storm drains

Neighborhood Source Assessment
Yards and Lawns
Driveways, Sidewalks, and Curbs
Rooftops
Common Areas

Pollution Sources in Residential Areas
Nutrients Untreated wastewater discharges
Fertilizer- excessive use
Organic matter in gutter/ catch basin
Vehicle/sidewalk washing discharge
Poorly maintained sewer/septic
Pet Waste/ Urban wildlife
Boat discharges
Bacteria
Erosion of dirt roads and construction sites
Lawn/ yard erosion
Driveway deterioration Sediment

Pollution Sources in Residential Areas
Trash Dumping
Poor dumpster management
Poor vehicle maintenance
Oil/ grease in gutter
Household hazardous waste storage/disposal
Oil/ Hazardous Waste
Excess Runoff Volume
Downspouts draining to impervious surface.
Excess, untreated impervious cover

Getting Ready to Conduct a Neighborhood Source Assessment
Maps Subwatershed level
Equipment (Camera, clip board, forms, map)
Staffing Two person team, about 1 to 2 square miles/day
Moderate level training
Desktop Analysis Predetermine neighborhoods, hotspots, and pervious
areas

Neighborhood Source Assessment
Part A: Neighborhood Characterization
• Neighborhood Name?
• Lot Size?
• Estimated Age of Neighborhood?
• Percent of homes with garages? Basements?
• Sewer service?
• Infill, Redevelopment, remodeling?

% of lot with impervious cover?
% of lot with turf grass?
% of lot with landscaping?
% of lot with bare soil?
Part B: Yard and Lawn Conditions
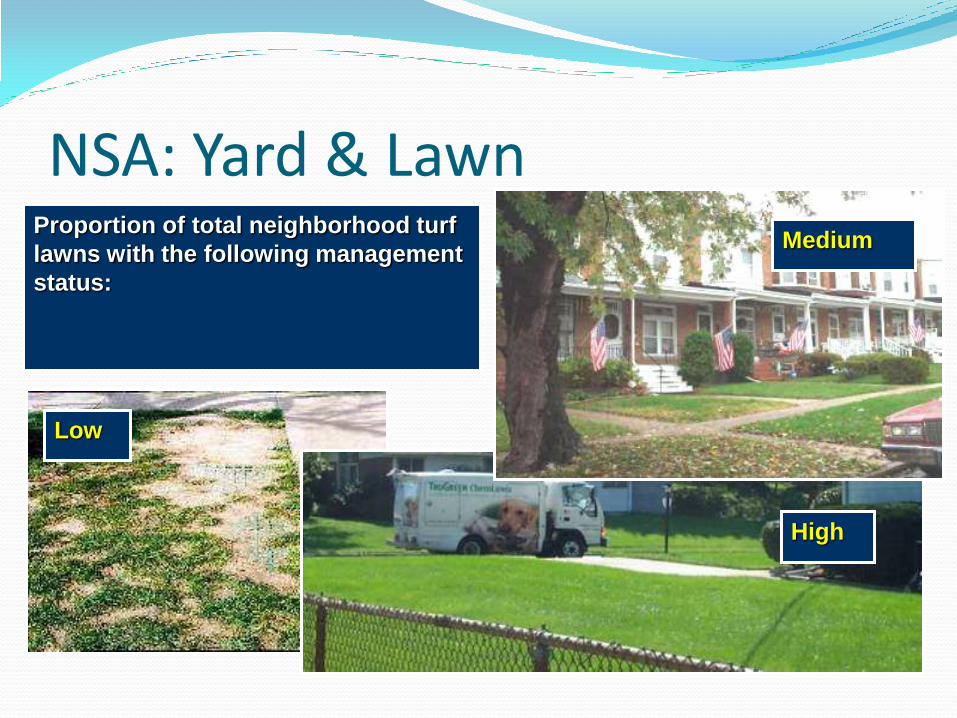
Proportion of total neighborhood turf
lawns with the following management
status:
NSA: Yard & Lawn Medium
High
Low

% of driveways that are impervious?
Are driveways clean? Stained? Dirty? Breaking up?
Part C: Driveways, Sidewalks & Curbs

Part D: Rooftops
% Directed to Impervious Surface?
% Directly Connected? % Discharge to Pervious Area? Room for a Rain Garden?
% Discharge to Rain Barrel?

Designated Use
Buffer Ecroachment
Open space present?
Pet waste? Dumping?
Buffer encroachment?
Part E. Common Areas Undesignated Use

Part F. Recommendations
• Reducing Pollution Sources through Behavior Change
• Residential RainScaping Actions • Pollution Severity • Restoration Opportunity Index • Community Property Opportunities

Yards and Lawns
Problems
High management turf
Potential pesticide use
Non-target irrigation
Extensive turf cover
Low forest canopy
Improper yard waste disposal
Soil erosion
Construction activity
Presence of septic systems
Presence of swimming pools
Stewardship Technique
Reduced fertilizer use
Reduced pesticide use
Xeriscaping /Education
Natural landscaping
Tree planting
Yard waste composting
Erosion repair
Single lot control
Septic system clean-outs
Safe pool discharge

Driveways, Sidewalks, and Curbs Problems
Driveway/curb flows
Driveway conditions
Outdoor car
maintenance
Sidewalk in bad
condition
Stewardship Technique
Safe car washing
Driveway sweeping
Car fluid recycling
Pet waste pick-up,
Streetscaping

Rooftops Problems
Downspout connection
Stewardship Technique
Rain Barrels
Connect Downspout to Rain Garden or other
pervious area

Common Areas Problems
Evidence of pet waste
Stormwater ponds
Turf cover in open space
Condition of storm drain inlets
Sidewalk zone
Evidence of dumping
Stewardship Technique
Pet waste education
Stormwater maintenance
Bufferscaping, reforestation
Storm drain stenciling
Streetscaping
Dumping prevention

Other Assessment Forms
Hot Spot
Pervious Area
Streets and Storm Drains
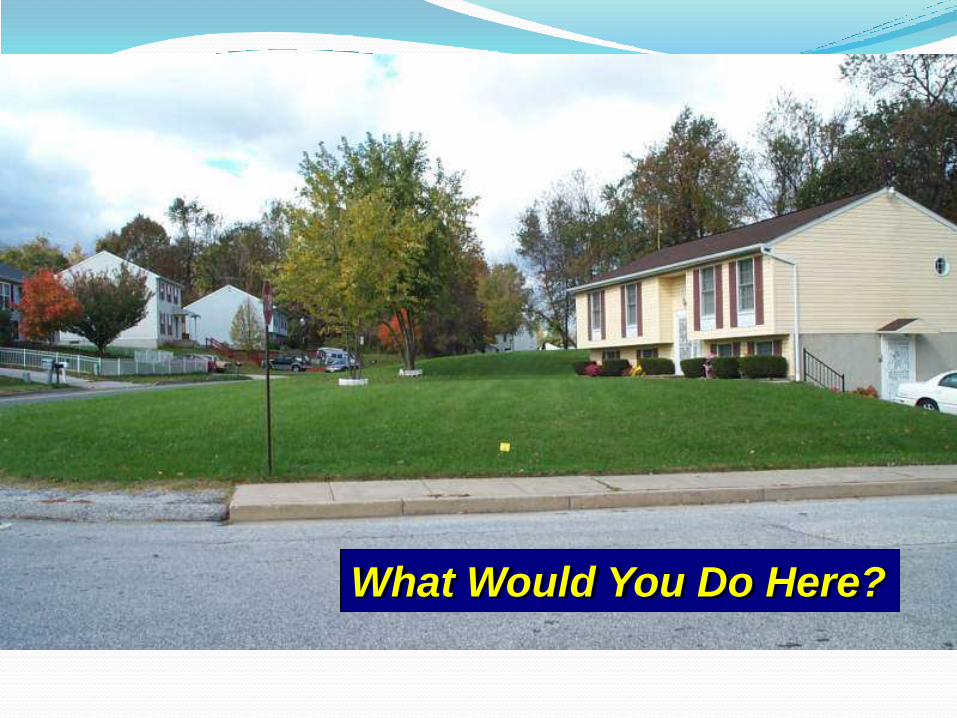
What Would You Do Here?

Put It All Together
Identify Parts of the Neighborhood with Highest Pollution Severity Identify Parts of the Neighborhood with Highest Restoration Potential (low hanging fruit) Create A Plan: 1-2 Rainscaping Practices to promote 1 Behavior to Change.

Your Challenge… Choose 1 or 2 Stewardship behaviors or best management practices to promote in your community.