ANK OF BOTSWANA Statutory... · Table 2.4 Trends in Income Inequality, 1985/86 ... BSE Botswana...
118
ANNUAL REPORT BANK OF BOTSWANA 2004
Transcript of ANK OF BOTSWANA Statutory... · Table 2.4 Trends in Income Inequality, 1985/86 ... BSE Botswana...

1
ANNUAL REPORT
BANK
OF
BOTSWANA
2004

blank page 2

3

4
BANK OF BOTSWANA ANNUAL REPORT 2004

5
BANK OF BOTSWANA ANNUAL REPORT 2004
BOARD MEMBERS
as at December 31, 2004
L. K. Mohohlo
Governor and Chairman of the Board
S. S. G. Tumelo
Board Member
G. K. Cunliffe
Board Member
J. SentshoBoard Member
B. MoeletsiBoard Member
U. CoreaBoard Member

6
BANK OF BOTSWANA ANNUAL REPORT 2004
CONTENTS – PART A
Statutory Report on the Operations and Financial
Statements of the Bank in 2004
Page
1. An Overview of the Bank 15
Objectives of the Bank 15
Functions of the Bank 15
Structure of the Bank 16
Strategies 17
2. Report on the Bank’s Operations 19
Introduction 19
External Relations 20
Management and Administration of the Bank 20
Monetary Policy Implementation 21
Reserve Management 21
Domestic Market Operations 21
Banking, Currency and Payment System Issues 21
Banking Supervision 22
Agency Role 22
Information Technology 22
Protective Services 23
3. Annual Financial Statements 25
7
BANK OF BOTSWANA ANNUAL REPORT 2004
CONTENTS – PART B
Page
1. The Botswana Economy in 2004 51
Output, Employment and Prices 51
Public Finance 57
Exchange Rates, Balance of Payments and International
Investment Position 60
Money and Capital Markets 64
2. Improved Productivity – The Key to Sustained Growth
and Higher Living Standards for All 73
Introduction 73
Productivity And Economic Growth 75
Issues in Measuring Productivity 83
Enhancing and Maintaining Productivity Growth:
The Case of Botswana 90
Productivity, Sustained Growth and Higher Living Standards
for All 102
Conclusion 109
Appendix A: Data Sources and Growth Accounting
Methodology 111

8
BANK OF BOTSWANA ANNUAL REPORT 2004
FIGURE, CHARTS, AND TABLES
Figure Page
Figure 2.1: The Stages of Technological Progress 79
Charts
Chart 1.1 Growth in Real Gross Domestic Product 51
Chart 1.2 Economic Growth by Sector 51
Chart 1.3 Botswana Inflation 56
Chart 1.4 CPI Inflation by Tradeability 56
Chart 1.5 International Inflation 56
Chart 1.6 Nominal and Real Effective Exchange Rates and Relative Prices 61
Chart 1.7 NEER and Nominal Exchange Rate Indices Against
Selected Currencies 61
Chart 1.8 Outstanding Bank of Botswana Certificates (BoBCs) 66
Chart 1.9 Yield to Maturity on BoBCs and Government Bonds 67
Chart 1.10 Real Interest Rates: International Comparisons 68
Chart 1.11 Annual Growth Rates of Credit 68
Chart 2.1 Real GDP, Real GDP Less Mineral Rents, and Growth
Rates of GDP and GDP per Capita (3-Year Moving Averages) 84
Chart 2.2 Labour Force and Capital Stock 85
Chart 2.3 Real Recurrent Expenditure on Health and Education
and 3-Year Moving Average Growth Rates 86
Chart 2.4 Sectoral Share in GDP: 1974/75 87
Chart 2.5 Sectoral Share in GDP: 2002/03 87
Chart 2.6 Sectoral Share in GDP 87
Chart 2.7 Total Factor Productivity Growth 88
Tables
Table 1.1 The Government Budget: 2003/04 – 2005/06 (P million) 58
Table 1.2 Pula Exchange Rates Against Selected Currencies 60

9
BANK OF BOTSWANA ANNUAL REPORT 2004
Table 1.3 Balance of Payments: 2000–2004 (P million) 62
Table 1.4 Major Exports (P million) 62
Table 1.5 Levels of Foreign Investment in Botswana by Industry
(P million as at 31 December 2003) 65
Table 1.6 Levels of Foreign Investment in Botswana by Country
(P million as at 31 December 2003) 65
Table 1.7 Structure of Bank of Botswana Certificate Holdings 67
Table 1.8 Nominal Yields to Maturity on BoBCs and Government
Bonds (Percent) 67
Table 2.1 Percentage Shares of Factor Payments to Capital, Skilled
Labour and Unskilled Labour: 1985/86, 1992/93 and 1996/97 85
Table 2.2 Total Factor Productivity Growth, 1974/75 to 2004/05 90
Table 2.3 Sources of Real GDP Growth for Selected Countries and
Country Groupings 91
Table 2.4 Trends in Income Inequality, 1985/86 – 2002/03
(gini coefficient) 105
Table 2.5 Real Income Growth, 1993/94 – 2002/03 (percent) 105
Table 2.6 Poverty in Botswana (percent of population) 106
Table 2.7 Economically Active Population 1991 – 2001 (‘000) 107
Table 2.8 Unemployment by Settlement Type, 2002/03 (Percent) 107
Table A.1 Factor Inputs and Output: 1974/75 to 2004/05 (1993/94 prices) 112
Table A.2 Growth Competitiveness Index (GCI) Rankings for Selected
Countries: 2003 113
Table A.3 The Networked Readiness Index (NRI) Rankings for
Selected Countries: 2003–2004 114
Table A.4 Trade Competitiveness Rankings for Selected African
Countries: 1980–2001 115
Table A.5 Indicators of Ease or Difficulty of Doing Business
in Selected Countries: 2004 116
Page

10
BANK OF BOTSWANA ANNUAL REPORT 2004
ABBREVIATIONS USED IN THE REPORT
AGOA Africa Growth Opportunity Act
ATM Automated Teller Machine
BCI Business Competitiveness Index
BoBCs Bank of Botswana Certificates
BDC Botswana Development Corperation
BEDIA Botswana Export Development and Investment Agency
BIDPA Botswana Institute for Development and Policy Analysis
BMC Meat Commission
BNPC Botswana National Productivity Centre
BOTEC Botswana Technology Centre
BSB Botswana Savings Bank
BSE Botswana Stock Exchange
BURS Botswana Unified Revenue Services
CSO Central Statistics Office
CEDA Citizen Entrepreneurial Development Agency
DCEC Directorate on Corruption and Economic Crime
DPCF Debt Participation Capital Funding
ECH Electronic Clearing House
EFT Electronic Funds Transfer
FAP Financial Assistance Policy
FDI Foreign Direct Investment
FIAS Foreign Investment and Advisory Service
FTA Free Trade Area
GC Gini Coefficient
GCI Growth Competitiveness Index
GDP Gross Domestic Product
HIES Household Income and Expenditure Survey
ICT Information and Communications Technology
IFSC International Financial Services Centre
IIP International Investment Position
IMF International Monetary Fund
11
BANK OF BOTSWANA ANNUAL REPORT 2004
KBL Kgalagadi Breweries Limited
MDGs Millennium Development Goals
MEI Macroeconomic Environment Index
NDB National Development Bank
NEER Nominal Effective Exchange Rate
NPS National Payment System
NRI Network Readiness Index
NTBs Non-Tariff Barriers
OCC Olympia Capital Corporation Limited
OECD Organisation for Economic Cooperation and Development
OPEC Organisation of Petroleum Exporting Countries
PDSF Public Debt Service Fund
PMS Performance Management System
PMP Privatisation Master Plan
PRI Productive Resource Index
QPI Quality and Public Institutions Index
REER Real Effective Exchange Rate
REI Rigidity Employment Index
RIIC Rural Industries Innovation Centre
RTGS Real Time Gross Settlement
SADC Southern African Development Community
SDR Special Drawing Right
SSA Sub-Saharan Africa
VAT Value Added Tax
TFP Total Factor Productivity
TCI Trade Competitiveness Index
TEI Trade-Enabling Environment Index
TI Technology Index
UN United Nations
UNDP United Nations Development Programme
WEF World Economic Forum

BLANK PAGE 12 NOT NUMBERED

13
PART A
STATUTORY REPORT
ON THE OPERATIONS AND
FINANCIAL STATEMENTS OF
THE BANK, 2004
BANK OF BOTSWANA

14
HEADS OF DEPARTMENT
as at December 31, 2004

15
PART A: STATUTORY REPORT ON THE OPERATIONS AND FINANCIAL STATEMENTS OF THE BANK, 2004
STATUTORY REPORT ON THE OPERATIONS OF THE
BANK IN 2004
1. AN OVERVIEW OF THE BANK
Objectives of the Bank
1.1. The primary objective of the Bank, as stated in the Mission Statement, is to promote
and maintain monetary stability. The Bank also ensures that the payments system
is efficient and that the banking system is sound. These functions of the Bank
support the broad national macroeconomic objectives, including the promotion of
sustainable economic diversification. The Bank’s main responsibilities, its
organisational structure and the framework for its activities are described below.
Functions of the Bank
1.2 As prescribed by the Bank of Botswana Act (CAP 55:01) the major responsibilities
of the Bank include the conduct of monetary policy; provision of banking services
to the Government, banks and selected public sector organisations; regulation and
supervision of banks and other financial institutions; issuance of currency;
implementation of exchange rate policy; management of foreign exchange reserves;
and provision of monetary and financial policy advice to the Government.
(a) Monetary Policy implementation is directed mainly at achieving the primary
responsibility of the Bank, which is the promotion and maintenance of monetary
stability. This requires the achievement of low and sustainable inflation, which
contributes to the promotion and maintenance of domestic and external
monetary and financial stability. This objective, together with fiscal, wage,
trade and exchange rate policies, fosters macroeconomic stability, which is a
crucial precondition for achieving sustained development, high rates of
employment and rising standards of living for Batswana.
(b) Central Banking and Payment System Services are mainly provided for the
Government, commercial banks and other selected institutions. The Bank also
operates a clearing system for the banking sector.
(c) Issuance of Currency (banknotes and coin) of high quality is an essential
ingredient of an efficient payments system as it fosters confidence in the legal
tender which, in turn, facilitates transactions and economic activity in general.
(d) Supervision of Banks and Other Financial Institutions is conducted in
accordance with the Banking Act (CAP 46:02) and other relevant statutes. The
purpose of prudential regulation and supervision is to ensure the safety, solvency
and efficient functioning of the banking system and the overall financial sector.
(e) Exchange Rate Policy is implemented on behalf of the Government in the
overall context of sound macroeconomic management. The objective of the
policy is to promote export competitiveness without compromising
macroeconomic stability. The Bank buys and sells foreign exchange at rates
determined in accordance with the exchange rate policy.
The Bank’s primary
objectives are to promote
monetary stability, ensure
an efficient payments
system and a sound
banking sector
Primary responsibilities
are prescribed by
legislation
16
BANK OF BOTSWANA ANNUAL REPORT 2004
(f) Official Foreign Exchange Reserves are managed by the Bank on behalf of the
Government. The Bank ensures their safety and return by diversifying the
investments within a framework of acceptable risks.
(g) Economic Analysis and Policy Advice are covered in periodic reports, published
research papers and statistical documents. Most of the materials are distributed
to other institutions and the public. The Bank is also represented on a number
of Government-led committees and task forces.
Structure of the Bank
1.3 The Bank of Botswana falls under the purview of the Minister of Finance and
Development Planning, who appoints members of the Board, except the ex-officio
Chairman (Governor of the Bank), who is appointed by His Excellency the President.
The Minister reports to Parliament on the Bank’s operations and financial performance.
The Board
1.4 Under the Bank of Botswana Act and the Bank’s Bye-Laws, overall responsibility
for the operations of the Bank is vested in the Board of the Bank. The Board is
responsible for ensuring that the principal objectives of the Bank, as set out in the
Act, are achieved. It also ensures that appropriate policies, management and
administrative systems as well as financial controls are in place at all times in
order for the Bank to achieve its objectives in an efficient and effective manner.
Accordingly, the Board has a direct role in the strategic planning of the Bank, and
in determining the broad policy framework. In this regard, the Board approves the
annual budget, monitors the financial and operational performance, reviews reports
of the external auditors and may call for any policy review.
1.5 The Board comprises nine members and is chaired by the Governor as required
under the Bank of Botswana Act. As at the end of 2004, six members were in place
and there were three vacancies. The Permanent Secretary of the Ministry of Finance
and Development Planning is an ex-officio member; the other members are drawn
from the public service (not more than two), the private sector and academia in
their individual capacities.
1.6 The Board is required to meet at least once each quarter, although typically it
meets more frequently. The Audit Committee of the Board is chaired by a non-
executive Board member, and its main responsibility is to ensure that accounting
policies, internal controls and financial practices are based on established rules
and regulations. The Governor submits a report, after approval by the Board, on
the operations and the audited financial statements of the Bank to the Minister of
Finance and Development Planning within three months of the end of the Bank’s
financial year.1
The Governor
1.7 In addition to chairing the Board, the Governor is the chief executive officer of the
Bank, and is responsible for the prompt and efficient implementation of the decisions
1 The Bank’s financial year coincides with the calendar year.
Minister of Finance
reports to Parliament on
the Bank’s operations
The Board has overall
responsibility over the
Bank’s operations
The nine-member Board
is required to meet at
least once each quarter
The Governor is the
Bank’s chief executive
officer, supported by the
Executive Committee

17
PART A: STATUTORY REPORT ON THE OPERATIONS AND FINANCIAL STATEMENTS OF THE BANK, 2004
or resolutions of the Board. The Governor manages the Bank on a day-to-day
basis, and represents the institution in its relations with the Government, domestic
financial and other institutions as well as external organisations.
The Executive Committee
1.8 The Executive Committee, which is chaired by the Governor, comprises the Deputy
Governors and Heads of Department; it may include co-opted senior staff. Its
responsibility is to advise the Governor on the day-to-day management of the
Bank as well as the development of the Bank’s medium- and long-term plans.
Departments and Divisions
1.9 In order to carry out its functions and supporting activities, the Bank is organised
into Departments and Divisions. At the end of 2004, the Bank’s seven Departments
comprised Administration, Accounting, Banking, Banking Supervision, Financial
Markets, Information Technology and Research, while the three Divisions were
the Board Secretariat, Security and Internal Audit. The Heads of Department
report through the Deputy Governors to the Governor, as do the Heads of Security
and the Board Secretariat. The Internal Audit Division reports directly to the
Governor.
Strategies
1.10 In pursuing its principal objectives of maintaining monetary stability as well as
ensuring the soundness and efficiency of the financial system, the Bank regularly
reviews and adapts its strategies to deal with the changing conditions prevailing in
the financial sector. The Bank’s activities are mainly in the following areas:
Monetary Operations, Reserve Requirements and the Bank Rate
1.11 Monetary stability is mainly reflected in low and stable inflation. Since inflation is
fundamentally influenced by monetary and credit factors, the Bank’s anti-inflation
strategy focuses on the control of banking system credit as an intermediate target.
However, controlling inflation in a small open economy such as Botswana’s, with
trading partners that have often experienced volatile inflation is a major challenge.
1.12 In implementing monetary policy, the Bank uses indirect policy instruments,
particularly open market operations and the Bank Rate. The Bank may also use
banking regulations and moral suasion to achieve monetary policy objectives.
However, the use of Bank of Botswana Certificates (BoBCs), in both the primary
and secondary markets, to control the liquidity of the financial system and influence
short-term interest rates, plays a prominent role in maintaining monetary stability.
1.13 In addition to the Secured Lending Facility (SLF), the Bank also uses Repurchase
Agreements (Repos) to manage short-term and overnight liquidity fluctuations in
the banking system.
1.14 The Bank incorporates data on fiscal and other policies of the Government in the
design of a monetary policy framework and its implementation strategy in order to
ensure macroeconomic stability. Therefore, whenever necessary, monetary policy
The Bank had seven
Departments and three
Divisions in 2004
Maintaining monetary
stability and a sound and
efficient financial system
are key objectives

18
BANK OF BOTSWANA ANNUAL REPORT 2004
may need to be restrictive in order to counteract expansionary fiscal and wage
policies that may erode monetary stability and, therefore, the nation’s prospects
for sustainable economic development. The broad framework of monetary policy
is presented to the public in the annual Monetary Policy Statement.
Banking Services to the Government and Commercial Banks
1.15 The Bank serves as the banker to the Government, commercial banks as well as
certain other institutions, and has provided a payment, clearing and settlement
system for the financial sector. In this regard, the Bank has promoted, coordinated
and successfully implemented a programme that enhances the efficiency and
security of the payments system. It is also a lender of last resort to the financial
institutions under its supervisory purview.
Implementing the Banking Act and Regulations
1.16 Through ongoing banking supervision and regulatory activities, the Bank seeks to
achieve a sound and stable financial system. Accordingly, the Bank ensures that
the mechanisms for sustaining the safety and soundness of licensed financial
institutions are appropriate and that the institutions are managed in a prudent and
safe manner. To that end, the Bank enforces prudential standards with respect to
capital adequacy, liquidity, asset quality and corporate governance of the banks.
1.17 In addition to its focus on the safety and soundness of licensed financial institutions,
the Bank is responsible for ensuring that banks maintain high professional standards
in their operations in order to provide efficient customer service in a transparent
manner. The Bank also has a surveillance responsibility with regard to breaches of
the Banking Act by the public, especially in the form of activities that involve
unauthorised deposit taking and use of banking names.
1.18 Under the provisions of the Banking Act, the Bank has specific responsibilities
relating to money laundering. Accordingly, banks are required to adhere to ‘know
your customer’ provisions when opening accounts, retain appropriate records, report
suspicious activities and cooperate fully with law enforcement agencies in an effort
to combat financial crimes and, in particular, money laundering.
1.19 The Bank is also responsible for the regulation and supervision of the International
Financial Services Centre (IFSC) entities as well as the administration of the
Collective Investment Undertakings (CIU) Act (CAP56:09).
1.20 The Bank monitors commercial bank compliance with primary reserve requirements
and ensures that clearing and settlement activities are conducted safely and
efficiently. As the volume and value of financial transactions managed by the
financial system increases, and Botswana’s linkages with international financial
markets expand, the Bank has to guard against systemic risks that may arise. It is
for this reason that the Bank continually collaborates with private sector institutions,
international organisations and the Government in introducing improvements to
the safety and efficiency of the payments system.
Supervision and
regulation of financial
institutions are
necessary for confidence
and stability
The Bank also has
responsibility for anti-
money laundering policy
and regulation of
international financial
services

19
PART A: STATUTORY REPORT ON THE OPERATIONS AND FINANCIAL STATEMENTS OF THE BANK, 2004
Implementing Exchange Rate Policy
1.21 The Bank acts as the Government’s agent in implementing the exchange rate policy.
Under the Bank of Botswana Act, the President, on the recommendation of the
Minister of Finance and Development Planning, and after consultation with the
Bank, sets the framework for the determination of the external value of the Pula.
At present, the Pula is pegged to a basket of currencies comprising the South
African rand and the Special Drawing Right (SDR - the unit of account of the
International Monetary Fund). Based on the basket, the Bank calculates the
exchange rate for each business day, and quotes the buying and selling rates for
major international currencies to the banks. The Bank monitors the Pula exchange
rate developments regularly with a view to advising the Government on maintaining
export price competitiveness of domestically produced goods.
Managing Foreign Exchange Reserves
1.22 As Botswana’s foreign exchange reserves have continued to grow, the Bank has
subdivided the reserves into two portfolios to meet different objectives. A large
proportion of the reserves is invested in long-term assets (Pula Fund) with a view
to maximising long-term return, while the remainder comprises the Liquidity
Portfolio, which is invested in money market instruments and short-term bonds.
Advice on Economic Policy, Provision of Statistics and Public Education
1.23 In addition to its responsibilities of formulating and implementing monetary policy,
the Bank serves as economic and financial advisor to the Government on a wide
range of issues. These include exchange rate policy, financial sector development,
borrowing, taxation, industrial development and trade.
1.24 The Bank conducts annual briefings on economic trends and publishes economic
and financial statistics and a research bulletin. The Bank has also formulated and
is implementing a public education programme on banking and financial matters.
Meeting the Needs for Banknotes and Coin
1.25 The availability of a safe and convenient currency is essential for an efficient
payments system. For this reason, the Bank routinely ensures that there is an
adequate supply of high quality notes and coin in circulation by withdrawing soiled
and damaged currency and replacing it with new notes and coin. The Bank maintains
stringent standards in the design and production of both notes and coin to ensure
their acceptance as a medium of exchange and to deter counterfeiting and other
forms of debasement.
2. REPORT ON THE BANK’S OPERATIONS
Introduction
2.1 This section highlights key developments relating to the Bank’s functions during
2004.
Foreign exchange
reserves are managed to
meet specific objectives
The Bank serves as
advisor to Government
The Bank is the sole
supplier of notes and
coin

20
BANK OF BOTSWANA ANNUAL REPORT 2004
External Relations
2.2 The Bank continued to enjoy good relationships with regional and international
organisations in 2004, during which period it attended and participated in seminars,
workshops and conferences hosted by international institutions. Such conferences
and seminars included the SADC Committee of Central Bank Governors, the
Association of African Central Banks, the Bank for International Settlements, the
International Monetary Fund (IMF) and the World Bank. The Bank enjoyed
continued assistance from the IMF through long-term regional advisors, short-
term technical assistance and staff placements. As usual, the Bank held annual
economic briefings for a range of stakeholders, including the media, senior
Government officials, representatives of the private and parastatal sectors and
diplomats.
Management and Administration of the Bank
2.3 The Bank’s authorised establishment was unchanged at 559 positions, with 535
occupied positions and 22 vacancies at the end of the year. Of the occupied positions,
14 were held by staff members on various long-term training programmes at local,
regional and overseas universities. In addition, a large number of staff took part in
various short term training programmes during the year.
2.4 The Staff Health Clinic continued to provide primary health care and to assist in
the implementation of the HIV/AIDS in the Workplace programme, which focuses
on promoting awareness of the HIV/AIDS infection and associated dangers, and
developing a culture of tolerance and combating the stigma of HIV/AIDS. To this
end, both educational and promotional activities were carried out, including a
successful voluntary HIV/AIDS testing exercise for staff, conducted by Tebelopele
Voluntary Counselling and Testing Centre. The challenge for the Bank is to continue
to support those affected by HIV/AIDS in order for all to benefit from improved
quality of life, thereby sustaining a respectable level of productivity.
2.5 The Bank produced a number of publications during the year, including the 2003
Annual Report, the 2003 Banking Supervision Annual Report, the 2004 Monetary
Policy Statement (MPS) and its Mid-Year Review, the Research Bulletin and the
monthly Botswana Financial Statistics.
2.6 The Bank undertook numerous public relations activities and maintained close
relations with the media. It also undertook community service programmes through
the Donations Advisory Group; financial and ‘in-kind’ donations were made to a
number of deserving charities and non-governmental organisations. As part of its
Public Education Programme, the Bank participated in the Botswana Confederation
of Commerce Industry and Manpower and Botswana Annual Financial Trade Fairs
and various school career fairs. The Bank also produced a third booklet in the Tsa
Madi comic series and facilitated schools visits, radio broadcasts and TV magazine
programmes.
2.7 On internal audit matters, 33 scheduled audits and three special audits were
completed based on risk-based auditing, and the reports were rated according to
the significance of the findings. The audits provide a means to continuously assess
internal controls and improve ways of communicating findings while ensuring
Voluntary HIV/AIDS
testing exercise for staff
conducted successfully
The Bank continued to
enjoy good relationships
with regional and
international
organisations
The Bank produced a
number of publications
during the year
Public initiatives were
sustained

21
PART A: STATUTORY REPORT ON THE OPERATIONS AND FINANCIAL STATEMENTS OF THE BANK, 2004
that the Departments and Divisions achieve their objectives in the most efficient
manner.
Monetary Policy Implementation
2.8 The Monetary Policy Committee met six times in 2004 and there was no change in
interest rates, indicating maintenance of a tight policy stance. This stance was
necessitated by the desire to attain the inflation objective of 4 – 7 percent, as
announced in the 2004 Monetary Policy Statement, in a period during which there
were upside risks to inflation as a result of the devaluation of the Pula in February
2004, substantial government salary increases, upward adjustment of some
administered prices and rising international oil prices.
2.9 To enhance the capacity to undertake economic analysis in support of policy
formulation, the Bank continued to work on developing an inflation model for
Botswana, and considerable progress has been made with the assistance of an
IMF-sponsored technical assistance mission comprising staff of the Czech National
Bank. A near-term forecasting framework was finalised, while development of a
core model for medium-term forecasting was initiated towards the end of the year.
Work on a biannual business expectations survey progressed well with the first
report produced towards the end of 2004; going forward, this should provide timely
and substantive information on the real sector.
2.10 With respect to statistics, the implementation of the recommendations of the August
2003 IMF technical assistance mission on monetary statistics is continuing. A
follow-up mission was hosted during the year and laid the groundwork for
introducing an expanded depository corporations survey in 2005.
Reserve Management
2.11 The Management conducted a review of reserve management policies and
guidelines and these were approved by the Board in November 2004. The principles
underlying the Bank’s reserve management policies were reaffirmed, but some
adjustments were made to portfolio sizes and asset allocations.
Domestic Market Operations
2.12 In November 2004, the Bank introduced 14-day Bank of Botswana Certificates
(BoBCs) to increase the efficiency of monetary policy implementation. The 14-day
and 91-day BoBCs are auctioned on a weekly basis to market participants; the
supply of the 91-day paper was gradually reduced, as the market participants
accepted the new 14-day instrument, which is expected to play a progressively
more important role in the Bank’s monetary operations.
Banking, Currency and Payments System Issues
2.13 The National Clearance and Settlement System (NCSS) Regulations were finalised,
as a result of which the NCSS Act came into force on March 1, 2005. Agreement
was reached for the transfer of the electronic clearing house to the commercial
banks; this was necessitated by the NCSS Act, which requires the separation of
operational and supervisory responsibilities for clearing systems. Preparations
Restrictive monetary
policy stance maintained
The Bank introduced 14-
day Bank of Botswana
Certificates
The National Clearance
and Settlement System
(NCSS) Regulations
were finalised
The Bank continued to
work on developing an
inflation model for
Botswana
The implementation of
the recommendations
to improve monetary
statistics continued
Board approves reserve
management policies
and guidelines

22
BANK OF BOTSWANA ANNUAL REPORT 2004
continued for the implementation of the Real Time Gross Settlement (RTGS) system
project in 2005.
2.14 The Bank experienced a problem of dye-stained banknotes which were linked to
robberies during the year. A series of measures were taken to ensure that dye-
stained banknotes were removed from circulation.
2.15 Agreement has been reached on the transfer of the Letlole National Savings
Certificates (LNSCs) scheme to the Botswana Savings Bank (BSB) early in 2005.
2.16 New P100 notes with improved security features were introduced towards the end
of the year.
Banking Supervision
2.17 The financial condition of banks was assessed through regular bilateral and trilateral
meetings, on-site examinations, risk profiling and ‘early warning’ management
reports. There were no issues of supervisory concern with regard to banks’ capital,
profitability, liquidity and management.
2.18 Enterprise Banking Group (Pty) Limited was issued with a banking licence to
operate in the International Financial Services Centre (IFSC). Enterprise will provide
banking services to non-residents through its subsidiaries. As at December 31,
2004, there were three licensed offshore banks in the centre. Furthermore, nine
companies were issued with Exemption Certificates in accordance with IFSC rules.
Stanbic Investment Management Services (Pty) Limited (SIMS) was granted a
licence to manage unit trusts under the CIU Act.
2.19 The total number of licensed and operating bureaux de change as at December 31,
2004 was 34. On-site inspections were conducted on seven bureaux and, in general,
they were found to be operating satisfactorily with no major issues of prudential
concern. The new Bureaux de Change Regulations became effective during the
year.
Agency Role
2.20 As agent of the Government in terms of Section 43 of the Bank of Botswana Act,
the Bank hosted two annual review missions for Botswana’s sovereign credit rating
by the two international credit rating agencies (Standard and Poor’s and Moody’s
Investors Service). The credit ratings, first assigned to Botswana by both agencies
in 2001, were reconfirmed.
2.21 In addition, the Bank continued to act as agent for the Government in the
administration of the Government Bond Programme. Debt Participation Capital
Funding (DPCF) Limited, a special purpose investment company established in
March 2004 to purchase from the Government the Public Service Debt Fund (PDSF)
loan book, made 7 new listings.
Information Technology
2.22 The major IT project implemented during the year was the replacement of existing
Bankmaster core banking system with Globus. Implementation work started in
May 2004 and the system went live in February 2005. In addition, the SWIFT
The Bank experienced a
problem of dye-stained
banknotes
Enterprise Banking
Group (Pty) Limited was
issued with a banking
licence
The total number of
licensed and operating
bureaux de change as at
December 31, 2004 was
34.
The Bank hosted visits
by the international
credit rating agencies
Bankmaster core
banking system replaced
with Globus

23
PART A: STATUTORY REPORT ON THE OPERATIONS AND FINANCIAL STATEMENTS OF THE BANK, 2004
system was successfully migrated to the SWIFTNet platform, which will be used
to support the RTGS implementation.
2.23 A revamped Bank website was launched in June 2004, providing a much broader
range of information about the Bank as well as economic and financial data. The
website carries a range of news items and is one of the Bank’s primary means of
communicating with its stakeholders.
2.24 Protection of the Bank’s network against viruses has been improved with the
installation of a new anti-virus software engine. Software for filtering and blocking
unwanted email messages, commonly referred to as junk mail or ‘spam’, was
acquired and installed on the Bank’s e-mail system. The Bank acquired and
configured an alternative firewall to enhance protection against hackers.
Protective Services
2.25 The banking system in general, and the Bank of Botswana in particular, continued
to experience attempted cheque frauds. Of particular concern to the Bank was the
discovery of high quality forged Government cheques which criminals were
attempting to use to withdraw large sums of money from Government accounts.
The suspects were arrested and the cases are currently before the courts.
In March 2004, a large number of counterfeit P100 banknotes were discovered.
Investigations established that the production and circulation of the counterfeits
was the work of a well organised group. After a vigorous public education drive,
the problem was brought under control.
A revamped Bank
website was launched
A large number of
counterfeit P100
banknotes were
discovered
A new anti-virus
software engine was
installed
The Bank continued to
experience attempted
cheque frauds

BLANK PAGE 24, NOT NUMBERED

25
PART A: STATUTORY REPORT ON THE OPERATIONS AND FINANCIAL STATEMENTS OF THE BANK, 2004
ANNUAL FINANCIAL STATEMENTS
2004
BANK OF BOTSWANA

BLANK PAGE 26 NOT NUMBERED

27
PART A: STATUTORY REPORT ON THE OPERATIONS AND FINANCIAL STATEMENTS OF THE BANK, 2004
CONTENTS
Page
Report of the Independent Auditors 28
Balance Sheet 29
Income Statement 30
Cash Flow Statement 31
Statement of Changes in Shareholder’s Funds 32-33
Accounting Policies 34-39
Notes to the Annual Financial Statements 40-47
The Annual Financial Statements set out on pages 29 to 47 were
approved by the Board on March 22, 2005 and signed by:
__________________ __________________
Linah K. Mohohlo Nozipho A. Mabe
Governor Director, Accounting Department

28
BANK OF BOTSWANA ANNUAL REPORT 2004
29 to 47

29
PART A: STATUTORY REPORT ON THE OPERATIONS AND FINANCIAL STATEMENTS OF THE BANK, 2004
BALANCE SHEET
December 31, 2004
Notes 2004 2003ASSETS P’000 P’000
Property and Equipment 1 130 244 126 645
Foreign Exchange ReservesLiquidity Portfolio 2.1 3 727 352 3 910 508Pula Fund 2.2 20 013 213 19 245 850International Monetary Fund
Reserve Tranche 3.1 134 084 197 373Holdings of Special Drawing Rights 3.2 226 327 219 210Administered Funds 3.4 99 219 144 031
Total Foreign Exchange Reserves 24 200 195 23 716 972
Government of Botswana Bonds 4 108 229 111 723
Advances to Banks 5 11 900 –
Other Assets 6 42 513 53 983
TOTAL ASSETS 24 493 081 24 009 323
LIABILITIES
Notes and Coin in Circulation 7 910 858 817 995Bank of Botswana Certificates 8 9 649 272 8 739 346Deposits 9 1 684 555 1 599 776Allocation of Special Drawing Rights (IMF) 3.3 28 584 28 379Liabilities to Government (IMF Reserve Tranche) 10 134 084 197 373Dividend to Government 11 97 025 188 750Other Liabilities 12 26 370 26 774
Total Liabilities 12 530 748 11 598 393
SHAREHOLDER’S FUNDS
Paid-up Capital 13 25 000 25 000Government Investment Account
Pula Fund and Liquidity Portfolio 8 936 740 9 680 966Currency Revaluation Reserve 129 893 153 138Market Revaluation Reserve 1 270 700 951 826General Reserve 14 1 600 000 1 600 000
Total Shareholder’s Funds 11 962 333 12 410 930
TOTAL LIABILITIES AND SHAREHOLDER’S FUNDS 24 493 081 24 009 323
FOREIGN EXCHANGE RESERVES IN US DOLLARS1 5 660 426 5 338 690
FOREIGN EXCHANGE RESERVES IN SDR2 3 700 210 3 642 927
Note: Bid (2003-mid) rates of exchange used at year-end
1 Pula/United States dollar 0.2339 0.2251
2 Pula/SDR 0.1529 0.1536

30
BANK OF BOTSWANA ANNUAL REPORT 2004
INCOME STATEMENT
Year ended December 31, 2004
Notes 2004 2003
P’000 P’000
INCOME
Interest – Foreign exchange reserves 634 184 719 686
Interest – Debt Participation Capital Funding Limited Loan 23 19 989 –
Interest – Government of Botswana Bonds 10 996 8 626
Net market gains on disposal of securities 439 742 21 284
Dividends 171 156 151 715
Commissions 4 625 5 159
Unrealised currency revaluation gains – Liquidity Portfolio 15 6 872 9 758
Other income 9 263 5 704
1 296 827 921 932
EXPENSES
Interest 16 1 174 385 1 237 173
Administration costs 164 868 131 751
Realised currency revaluation losses 15 341 837 1 778 989
Depreciation 11 604 11 488
Unrealised market revaluation losses – Liquidity Portfolio 8 844 20 459
1 701 538 3 179 860
NET LOSS FOR THE YEAR (404 711) (2 257 928)
TRANSFER FROM CURRENCY REVALUATIONRESERVE
15 338 065 1 766 708
NET LOSS BEFORE TRANSFER FROM GOVERNMENTINVESTMENT ACCOUNT (66 646) (491 220)
TRANSFER FROM GOVERNMENT INVESTMENTACCOUNT 454 746 1 246 220
NET INCOME AVAILABLE FOR DISTRIBUTION 388 100 755 000
APPROPRIATIONS
DIVIDEND TO GOVERNMENT FROM PULA FUND (388 100) (755 000)

31
PART A: STATUTORY REPORT ON THE OPERATIONS AND FINANCIAL STATEMENTS OF THE BANK, 2004
CASH FLOW STATEMENT
Year ended December 31, 2004
Notes 2004 2003
OPERATING ACTIVITIES
P’000 P’000
Cash generated by operations 18 871 845 1 063 542
INVESTING ACTIVITIES
(Net foreign investments purchased)/Net proceeds from
disposal of foreign investments (81 584) 4 210 781
Loan to Debt Participation Capital Funding Limited (800 000) –
Loan Repayment by Debt Participation Capital Funding
Limited 800 000 –
Purchase of Government of Botswana Bonds – (101 903)
Proceeds from disposal of property and equipment 404 215
Purchase of property and equipment 1 (16 107) (11 628)
NET CASH (USED IN)/FRO M INVESTING
ACTIVITIES (97 287) 4 097 465
FINANCING ACTIVITIES
Dividend to Government 11 (479 825) (823 475)
Government Withdrawals (387 596) (4 396 452)
NET CASH USED IN FINANCING ACTIVITIES (867 421) (5 219 927)
NET INCREASE IN CURRENCY IN CIRCULATION (92 863) (58 920)
CURRENCY IN CIRCULATION AT THE BEGINNING OF
THE YEAR (817 995) (759 075)
CURRENCY IN CIRCULATION AT THE END OF THE YEAR (910 858) (817 995)

32
BANK OF BOTSWANA ANNUAL REPORT 2004
STATEMENT OF CHANGES IN SHAREHOLDER’S FUNDS
Year ended December 31, 2004
Paid-up
Share
Capital
Currency
Revaluation
Reserve
Market
Revaluation
Reserve
General
Reserve
P’000 P’000 P’000 P’000
Balance at January 1, 2003 25 000 2 449 842 – 1 600 000
Unrealised currency losses for the year – (1 767 738) – –
Unrealised market gains for the year – – 1 573 082 –
Transfers to/(from) Government Investment Account:
Unrealised market gains for the year – – (621 256) –
Unrealised currency losses for the year – 1 237 742 – –
Government withdrawals – – – –
Net (losses)/gains not recognised in the
Income Statement for the year – (529 996) 951 826 –
Net loss for the year – – – –
Transfer from Currency Revaluation Reserve – (1 766 708) – –
Dividend to Government from Pula Fund – – – –
Transfers to/(from) the Income Statement for the year:
Deficit of Government Pula Fund income over Pula
Fund Dividend – – – –
To cover residual deficit – – – –
Balance at December 31, 2003 as previously
stated 25 000 153 138 951 826 1 600 000
Prior year adjustments resulting from changes in
accounting policies – (7 975) (28 667) –
Balance at December 31, 2003 as restated 25 000 145 163 923 159 1 600 000
Transfer to Income Statement of currency gains realised
on repayment of loan by the IMF’s Poverty Reduction
& Growth Facility (PRGF) Administered Fund – (17 229) – –
Unrealised currency gains for the year – 373 309 – –
Net unrealised market gains for the year – – 427 730 –
Transfers to/(from) Government Investment Account:
Unrealised market gains for the year – – (80 189) –
Unrealised currency gains for the year – (33 285) – –
Government withdrawals – – – –
Net gains/(losses) not recognised in the Income
Statement for the year – 322 795 347 541 –
Net loss for the year before realised currency gains on
the IMF’s PRGF Administered Fund loan repayment – – – –
Currency gains realised on loan repayment by the IMF’s
PRGF Administered Fund – – – –
Transfer from Currency Revaluation Reserve – (338 065) – –
Dividend to Government from Pula Fund – – – –
Transfers to/(from) the Income Statement for the year:
Deficit of Government Pula Fund Income over Pula
Fund Dividend – – – –
To cover residual deficit – – – –
Balance at December 31, 2004 25 000 129 893 1 270 700 1 600 000
1. The Government Investment Account, which represents the Government’s share of the Pula Fund and the Liquidity Portfolio, was
established on January 1, 1997.
2. The dividend to the Government of P388 100 000 for the year was made from the Government’s capital investment in the Pula Fund.

33
PART A: STATUTORY REPORT ON THE OPERATIONS AND FINANCIAL STATEMENTS OF THE BANK, 2004
Government
Investment Account
Accumulated
Profit Total
P’000 P’000 P’000
15 940 124 – 20 014 966 Balance at January 1, 2003
– – (1 767 738) Unrealised currency losses for the year
– – 1 573 082 Unrealised market gains for the year
Transfers to/(from) Government Investment Account:
621 256 – – Unrealised market gains for the year
(1 237 742) – – Unrealised currency losses for the year
(4 396 452) – (4 396 452) Government withdrawals
(5 012 938) – (4 591 108)
Net (losses)/gains not recognised in the
Income Statement for the year
– (2 257 928) (2 257 928) Net loss for the year
– 1 766 708 – Transfer from Currency Revaluation Reserve
– (755 000) (755 000) Dividend to Government from Pula Fund
Transfers to/(from) the Income Statement for the year:
(494 888) 494 888 –
Deficit of Government Pula Fund income over Pula
Fund Dividend
(751 332) 751 332 – To cover residual deficit
9 680 966 – 12 410 930
Balance at December 31, 2003 as previously
stated
(15 358) – (52 000)
Prior year adjustments resulting from changes in
accounting policies
9 665 608 – 12 358 930 Balance at December 31, 2003 as restated
– – (17 229)
Transfer to Income Statement of currency gains realised
on repayment of loan by the IMF’s Poverty Reduction
& Growth Facility (PRGF) Administered Fund
– – 373 309 Unrealised currency gains for the year
– – 427 730 Net unrealised market gains for the year
Transfers to/(from) Government Investment Account:
80 189 – – Unrealised market gains for the year
33 285 – – Unrealised currency gains for the year
(387 596) – (387 596) Government withdrawals
(274 122) – 396 214
Net gains/(losses) not recognised in the Income
Statement for the year
– (421 940) (421 940)
Net loss for the year before realised currency gains on the
IMF’s PRGF Administered Fund loan repayment
– 17 229 17 229
Currency gains realised on loan repayment by the IMF’s
PRGF Administered Fund
– 338 065 – Transfer from Currency Revaluation Reserve
– (388 100) (388 100) Dividend to Government from Pula Fund
Transfers to/(from) the Income Statement for the year:
(94 210) 94 210 –
Deficit of Government Pula Fund Income over Pula
Fund Dividend
(360 536) 360 536 – To cover residual deficit
8 936 740 – 11 962 333 Balance at December 31, 2004

34
BANK OF BOTSWANA ANNUAL REPORT 2004
ACCOUNTING POLICIES
December 31, 2004
BASIS OF PRESENTATION OF FINANCIAL STATEMENTS
The financial statements are prepared on the historical cost basis as modified to include the revaluation of
investments in domestic and foreign assets, liabilities, and the result of the activities of the Pula Fund. The
financial statements comply with International Financial Reporting Standards.
CHANGES IN ACCOUNTING POLICIES
In terms of International Accounting Standard No. 39 ‘Financial Instruments: Recognition and Measurement’,
investments held at year end are required to be valued at bid market prices and liabilities held, at offer/ask
market prices. In accordance with this standard, resultant market values were translated using the bid rates of
exchange, for assets held, and the offer/ask exchange rates for liabilities held. Up until December 31, 2003, all
investments and liabilities were valued at middle market prices, and the resultant market values were translated
to Pula using the middle rates of exchange at the balance sheet date, as required in terms of International
Accounting Standard No. 21 ‘Effects of Changes in Foreign Exchange Rates’. The effect on the Currency
Revaluation Reserve, the Market Revaluation Reserve and the Government Investment Account as at December
31, 2003 as a result of the changes in accounting policies referred to above is as follows:
The cumulative impact of the changes in accounting policies on the income statement as at December 31, 2003
of P413 000 was adjusted during the current year.
The bid rates of exchange for the Pula/United States dollar and the Pula/SDR as at December 31, 2003 were
0.2254 and 0.1538, respectively.
P’000
Currency Revaluation Reserve:
Increase in Pula Fund unrealised currency losses (10 652)
Increase in International Monetary Fund (IMF) reserves
unrealised currency losses (1 239)
(11 891)
Transfer to Government Investment Account 3 916
Net decrease at December 31, 2003 (7 975)
Market Revaluation Reserve:
Decrease in unrealised market gains (40 109)
Transfer to Government Investment Account 11 442
Net decrease at December 31, 2003 (28 667)
Government Investment Account:
Transfer to Currency Revaluation Reserve (3 916)
Transfer to Market Revaluation Reserve (11 442)
Decrease at December 31, 2003 (15 358)

35
PART A: STATUTORY REPORT ON THE OPERATIONS AND FINANCIAL STATEMENTS OF THE BANK, 2004
ACCOUNTING POLICIES (continued)
FINANCIAL INSTRUMENTS
General
Financial instruments carried on the balance sheet include all assets and liabilities, including derivative
instruments, but exclude property and equipment, and notes and coin in circulation.
Short-term Investments (Liquidity Portfolio)
The Bank has designated the Liquidity Portfolio as a fund in which money market instruments and bonds are
invested to facilitate payments for regular transactions.
Securities invested in this portfolio are initially recognised at cost and are subsequently remeasured at market
value based on bid prices. All related realised and unrealised gains and losses are taken to the income statement.
All purchases and sales of investment securities in the portfolio are recognised at trade date, which is the date
the Bank commits to purchase or sell the investments. All other purchases and sales are recognised as derivative
forward transactions until settlement.
Long-term Investments (Pula Fund)
This is a long-term fund intended to maximise returns and is invested in foreign financial instruments with a
long-term duration. These investments, which may be sold in response to needs for liquidity, changes in interest
rates, exchange rates, etc. are classified as available-for-sale. These securities are initially recognised at cost
(which includes transaction costs) and are subsequently remeasured at market value, based on bid prices.
Unrealised gains and losses arising from changes in the market value of the instruments classified as available-
for-sale are recognised in the Currency Revaluation Reserve or the Market Revaluation Reserve as may be
appropriate. When these instruments are disposed of or impaired, the related accumulated market value
adjustments are included in the income statement as gains and losses from investment securities.
All purchases and sales of investment securities in the fund are recognised at trade date, which is the date that
the Bank commits to purchase or sell the investments. All other purchases and sales are recognised as derivative
forward transactions until settlement.
Derivative Instruments
Derivative financial instruments are recognised in the balance sheet at cost (including transaction costs) and are
subsequently remeasured at market value, based on bid prices for assets held or liabilities to be issued, and ask/
offer prices for assets to be acquired or liabilities held. The treatment of market value movements in derivative
instruments depends on whether they are designated as part of the Pula Fund or the Liquidity Portfolio.
FOREIGN CURRENCY ACTIVITIES
During the year ended December 31, 2004, transactions denominated in foreign currencies were translated to
Pula using the middle rates of exchange at the transaction date. With effect from December 31, 2004, transactions
denominated in foreign currencies will be translated using bid and offer rates of exchange, as described in the
Changes in Accounting Policies note above.

36
BANK OF BOTSWANA ANNUAL REPORT 2004
All monetary assets and liabilities denominated in foreign currencies are translated to Pula using the bid and
offer rates of exchange, respectively, at the close of the financial year. All exchange gains/losses realised on
disposal of instruments and unrealised exchange gains/losses on the short-term investments are taken to the
income statement. However, all those gains and losses relating to disposals whose proceeds are reinvested in
foreign assets, and unrealised gains/losses on short-term investments, are appropriated to the Currency
Revaluation Reserve.
BANK OF BOTSWANA CERTIFICATES
As one of its tools for maintaining monetary stability in the economy, the Bank of Botswana issues its own
paper, Bank of Botswana Certificates (BoBCs), to absorb excess liquidity in the market and thereby to influence
the rate of monetary growth, and also interest rates. BoBCs are issued at a discount to counterparties.
The Bank’s liability in respect of BoBCs is stated at market value, based on offer prices, with movements in
matured and unmatured discount recognised in the income statement.
GOVERNMENT OF BOTSWANA BONDS
The Bank acquired Government of Botswana Bonds for purposes of facilitating orderly trading in the local
bond market. The bonds, which may be sold in response to needs to intervene in the market, are classified as
available-for-sale securities.
The bonds are initially recognised at cost and are subsequently remeasured at market value, based on bid prices.
All unrealised gains and losses arising from changes in the market value are recognised in the Market Revaluation
Reserve. When these instruments are disposed of or impaired, the related accumulated market value adjustments
are included in the income statement as gains and losses from Government of Botswana Bonds.
All regular purchases and sales of bonds are recognised at trade date, which is the date that the Bank commits
itself to purchase or sell the bonds.
SECURED LENDING FACILITY
Under the Secured Lending Facility (SLF), the Bank provides emergency and intermittent funding to solvent
financial institutions, intended to bridge overnight liquidity shortages. The advances are secured by Government
of Botswana Bonds and Bank of Botswana Certificates (BoBCs), valued at market prices on the date of the
transaction. The Bank has the right to call for additional collateral, should the value of the security decline
during the tenure of the facility. Interest earned on the advances is credited to the income statement while
advances outstanding as at the balance sheet date are recorded under the heading ‘Advances to Banks’.
REPURCHASE AND REVERSE REPURCHASE AGREEMENTS
This facility is one of the mechanisms designed to deal with short-term liquidity fluctuations in the domestic
money market. It is available to solvent institutions licensed and supervised by the Bank.
Securities purchased under agreement to resell (Repurchase Agreement) are recorded as funds receivable under
the heading ‘Advances to Banks’.
ACCOUNTING POLICIES (continued)

37
PART A: STATUTORY REPORT ON THE OPERATIONS AND FINANCIAL STATEMENTS OF THE BANK, 2004
Only high quality, marketable and freely transferable paper with a minimum amount of risk is acceptable as
security at the discretion of the Bank. Government and Government guaranteed securities of any maturity and
other eligible paper with a remaining life of 184 days or less are also acceptable as security.
Securities sold under agreement to repurchase (Reverse Repurchase Agreement) are disclosed as deposits
received.
The term of the repurchase agreement and reverse repurchase agreement varies from overnight to one month,
depending on the liquidity conditions in the domestic market.
Interest earned by the Bank on repurchase agreements is credited to the income statement while interest paid by
the Bank on reverse repurchase agreements is charged to the income statement.
ASSETS, LIABILITIES AND PROVISIONS RECOGNITION
Assets
Assets are recognised when the Bank obtains control of a resource as a result of past events, and from which
future economic benefits are expected to flow to the Bank.
Contingent Assets
The Bank discloses a contingent asset arising from past events where, it is highly likely that economic benefits
will flow from it, but this will only be confirmed by the occurrence or non-occurrence of one or more uncertain
future events outside the control of the Bank.
Liabilities and Provisions
The Bank recognises liabilities (including provisions) when:
(i) it has a present legal obligation resulting from past events;
(ii) it is probable that an outflow of resources embodying economic benefits will be required to settle this
obligation; and
(iii) a reliable estimate of the amount of the obligation can be made.
Derecognition of Assets and Liabilities
The Bank derecognises a financial asset when it loses control over the contractual rights that comprise the asset
and transfers substantially all the risks and benefits associated with the asset. This arises when the rights are
realised, expire or are surrendered. A financial liability is derecognised when it is legally discharged.
INCOME AND EXPENSE RECOGNITION
Interest income and expense and dividend income are recognised in the income statement on an accrual basis.
ACCOUNTING POLICIES (continued)

38
BANK OF BOTSWANA ANNUAL REPORT 2004
OFFSETTING FINANCIAL INSTRUMENTS
The Bank offsets financial assets and liabilities and reports the net balance in the balance sheet where:
(i) there is a legally enforceable right to set off;
(ii) there is an intention to settle on a net basis or to realise the asset and settle the liability simultaneously;
(iii) the maturity date for the financial assets and liability is the same; and
(iv) the financial asset and liability is denominated in the same currency.
In view of the fact that the Bank values its foreign exchange investments on a portfolio basis, assets and
liabilities within each portfolio have been set off.
GENERAL RESERVE
Under Section 7(1) of the Bank of Botswana Act, (CAP 55:01), the Bank of Botswana is required to establish
and maintain a General Reserve sufficient to ensure the sustainability of future operations of the Bank. The
Bank may transfer to the General Reserve funds from other reserves, which it maintains, for the purposes of
maintaining the required level of the General Reserve.
CURRENCY REVALUATION RESERVE
Any changes in the valuation, in terms of Pula, of the Bank’s assets and liabilities in holdings of Special
Drawing Rights and foreign currencies as a result of any change in the values of exchange rates of Special
Drawing Rights or foreign currencies are transferred to the Currency Revaluation Reserve.
The proportion directly attributable to the Government Investment Account is transferred to such investment
account.
MARKET REVALUATION RESERVE
Any changes in the value of the Bank’s long-term investments held in foreign currencies as a result of any
change in the market values of such investments are transferred to the Market Revaluation Reserve.
The proportion directly attributable to the Government Investment Account is transferred to such investment
account.
PROPERTY AND EQUIPMENT AND DEPRECIATION
Property and equipment are stated at cost less related accumulated depreciation.
No depreciation is provided on land. All other property and equipment are depreciated on a straight line basis
at the following annual rates:-
Percent
Buildings 2.50
Furniture, fixtures and equipment 20–50
Computer hardware 33.33
Computer software 100.00
Motor vehicles – Commercial 25.00
– Bullion Truck 5.00
ACCOUNTING POLICIES (continued)

39
PART A: STATUTORY REPORT ON THE OPERATIONS AND FINANCIAL STATEMENTS OF THE BANK, 2004
RETIREMENT BENEFITS
Pension benefits are provided for employees through the Bank of Botswana Defined Contribution Staff Pension
Fund, which is governed in terms of the Pension and Provident Funds Act (CAP 27:03). Contributions are at
the rate of 21.5 percent of pensionable emoluments of which pensionable employees of the Bank pay 4 percent.
Other than the contributions made, the Bank has no further commitments or obligations to this Fund.
FINANCE LEASES
The Bank classifies leases of land, property and equipment where it assumes substantially all the benefits and
risks of ownership as finance leases. Finance leases are capitalised at the estimated net present value of the
underlying lease payments. The Bank allocates each lease payment between the liability and finance charges to
achieve a constant periodic rate of interest on the finance balances outstanding for each period. The interest
element of the finance charges is charged to the income statement over the lease period. The land, property and
equipment acquired under finance leases are depreciated over the useful lives of the assets, on the basis consistent
with similar property and equipment.
ACCOUNTING POLICIES (continued)

40
BANK OF BOTSWANA ANNUAL REPORT 2004
NOTES TO THE ANNUAL FINANCIAL STATEMENTS
December 31, 2004
1. PROPERTY AND EQUIPMENT Free-
hold
Land
Lease-
hold
Land Buildings
Capital
Works in
Progress
Other
Assets Total
P’000 P’000 P’000 P’000 P’000 P’000
Cost or Valuation
Balance at the beginning of the year 607 3 486 129 556 1 347 64 873 199 869
Additions – – – 5 499 10 608 16 107
Disposals – – (1 128) – (7 249) (8 377)
Transfers – – 261 (261) – –
Balance at the end of the year 607 3 486 128 689 6 585 68 232 207 599
Accumulated Depreciation
Balance at the beginning of the year – – 27 789 – 45 435 73 224
Charge for the year – – 3 231 – 8 373 11 604
Disposals – – (331) – (7 142) (7 473)
Balance at the end of the year – – 30 689 – 46 666 77 355
Net book value at December 31, 2004 607 3 486 98 000 6 585 21 566 130 244
Net book value at December 31, 2003 607 3 486 101 767 1 347 19 438 126 645
2. FOREIGN EXCHANGE RESERVES 2004 2003
P’000 P’000
2.1 Liquidity Portfolio
Bonds 2 059 241 1 166 785
Amounts due from Pula Fund 417 235 782 254
Net Payables – (720)
Cash and Cash Equivalents 1 250 876 1 962 189
3 727 352 3 910 508
2.2 Pula Fund
Equities 8 445 392 8 356 889
Bonds 11 068 919 10 008 682
Amounts due to Liquidity Portfolio (417 235) (782 254)
Net Payables (70 566) (42 466)
Cash and Cash Equivalents 986 703 1 704 999
20 013 213 19 245 850

41
PART A: STATUTORY REPORT ON THE OPERATIONS AND FINANCIAL STATEMENTS OF THE BANK, 2004
NOTES TO THE ANNUAL FINANCIAL STATEMENTS (continued)
Pula Fund Balance Sheet 2004 2003
P’000 P’000
Capital Employed
Government 8 892 951 9 506 781Bank of Botswana 11 120 262 9 739 069
20 013 213 19 245 850
Employment of Capital
Investments 20 013 213 19 245 850
Investments expressed in US dollars (‘000) 4 681 091 4 332 241
Investments expressed in SDR (‘000) 3 060 020 2 956 163
Pula Fund Income Statement
Income
Interest and dividends 665 291 685 904Realised market gains 446 027 –Sundry income 19 49
1 111 337 685 953
Expenses
Realised currency revaluation losses (356 836) (1 177 036)Net realised market losses – (11 878)Administration charges (60 211) (53 668)
(417 047) (1 242 582)
Net Income/(Loss) for the year 694 290 (556 629)
Transfer from Currency Revaluation Reserve 356 836 1 177 036
Net income before transfer from Government InvestmentAccount 1 051 126 620 407
Transfer from Government Investment Account 94 210 494 888
Net income available for distribution 1 145 336 1 115 295
Appropriations
Dividend to Government (388 100) (755 000)
Bank of Botswana’s share of net income 757 236 360 295

42
BANK OF BOTSWANA ANNUAL REPORT 2004
NOTES TO THE ANNUAL FINANCIAL STATEMENTS (continued)
2004 2003
P’000 P’000
3. INTERNATIONAL MONETARY FUND (IMF)
3.1 Reserve Tranche
This asset represents the difference between Botswana’sQuota in the IMF and IMF Holdings of Pula. Botswana’sQuota is its membership subscription, of which at least 25percent was paid for in foreign currencies and the balancein Pula. The holdings of Pula by the IMF, which initiallywere equal to 75 percent of the quota, have changed fromtime to time as a result of the use of Pula by the IMF in itslendings to member countries.
Quota (SDR 63 000 000) 412 034 410 156Less IMF Holdings of Pula (277 950) (212 783)
Reserve Position in IMF 134 084 197 373
The IMF Holdings of Pula are represented by a Non-Interest Bearing Note of P165 324 035 (2003 – P165 324035) issued by the Government of Botswana in favour ofthe IMF, maintenance of value currency adjustments andthe amount in current account held at the Bank (includedin other deposits in Note 9).
3.2 Holdings of Special Drawing Rights 226 327 219 210
The balance on the account represents the value ofSpecial Drawing Rights allocated and purchased lessutilisation to date.
3.3 Allocation of Special Drawing Rights (IMF)
This is the liability of the Bank to the IMF in respect ofthe allocation of SDRs to Botswana. 28 584 28 379
3.4 Administered Funds
(i) Poverty Reduction & Growth Facility (PRGF) Trust – 45 275
The amount representing the equivalent ofSDR6 893 680 (and interest accrued thereon) lent onJuly 1, 1993 to the Poverty Reduction & GrowthFacility (formerly Enhanced Structural AdjustmentFacility Trust), a fund administered in trust by theIMF, which was repaid in March 2004.
(ii) Poverty Reduction & Growth Facility/Heavily IndebtedPoor Countries (PRGF/HIPC) Trust 99 219 98 756
The amount represents SDR 15 065 760 (and interestaccrued thereon) lent on August 31, 2002, to thePoverty Reduction & Growth Facility/HeavilyIndebted Poor Countries Trust Fund, a fundadministered in trust by the IMF.
99 219 144 031

43
PART A: STATUTORY REPORT ON THE OPERATIONS AND FINANCIAL STATEMENTS OF THE BANK, 2004
NOTES TO THE ANNUAL FINANCIAL STATEMENTS (continued)
2004 2003
P’000 P’000
4. GOVERNMENT OF BOTSWANA BONDS
(i) Purchased on May 26, 2003, maturing on June 1,
2005, bearing interest at the rate of 10.75 percent,
receivable semi-annually in arrears:
Market value 19 935 20 125
Interest accrued 179 179
20 114 20 304
(ii) Purchased on March 31, 2003, maturing on March 1,
2008, bearing interest at the rate of 10.25 percent,
receivable semi-annually in arrears:
Market value 85 166 88 471
Interest accrued 2 949 2 948
88 115 91 419
108 229 111 723
5. ADVANCES TO BANKS
Secured Lending Facility 11 900 –
6. OTHER ASSETS
Staff Loans and Advances 37 743 30 022
Uncleared Effects – 16 496
Prepayments 1 059 2 244
Other 3 711 5 221
42 513 53 983
7. NOTES AND COIN IN CIRCULATION
Notes 854 062 766 382
Coin 56 796 51 613
910 858 817 995
Notes and coin in circulation held by the Bank as cash in
hand at the end of the financial year have been netted off
against the liability for notes and coin in circulation t o
reflect the net liability to the public.
8. BANK OF BOTSWANA CERTIFICATES
Face Value 9 755 220 8 870 460
Unmatured Discount (105 948) (131 114)
Market Value 9 649 272 8 739 346
Bank of Botswana Certificates are issued at various short-
term maturity dates and discount rates.

44
BANK OF BOTSWANA ANNUAL REPORT 2004
NOTES TO THE ANNUAL FINANCIAL STATEMENTS (continued)
2004
P’000
2003
P’000
9. DEPOSITS
Government 481 230 848 503Bankers 350 977 520 347Other 852 348 230 926
1 684 555 1 599 776
These represent current accounts lodged by Government,commercial banks, parastatal bodies and others, which arerepayable on demand and are interest free.
The Government balance includes P2 043 479 (2003 –P2 139 258) in respect of the Letlole National SavingsCertificate Scheme, which was launched by the Bank onbehalf of the Government in 1999 as a means ofencouraging savings.
This is analysed as follows:
Issues of National Savings Certificates 5 551 4 769Redemptions (3 517) (2 623)
Net issues 2 034 2 146Amounts awaiting collection from/ (by) agents 9 (7)
Amount due to Government on behalf of the Scheme 2 043 2 139
10. LIABILITIES TO GOVERNMENT (IMF RESERVE
TRANCHE) 134 084 197 373
This balance represents the Bank’s liability to theGovernment in respect of the Reserve Tranche positionin the IMF (Note 3.1)
11. DIVIDEND TO GOVERNMENT
Balance due at the beginning of the year 188 750 257 225Dividend to Government from Pula Fund 388 100 755 000Paid during the year (479 825) (823 475)
Balance due at the end of the year 97 025 188 750
The final instalment of the pre-set dividend ofP97 025 000 unpaid at December 31, 2004 was providedfor in accordance with Section 6 of the Bank of BotswanaAct (CAP 55:01), which requires that all profits of theBank be distributed to the shareholder, the Government.
12. OTHER LIABILITIES
Accounts payable 1 076 1 875Other creditors and accruals 25 294 24 899
26 370 26 774

45
PART A: STATUTORY REPORT ON THE OPERATIONS AND FINANCIAL STATEMENTS OF THE BANK, 2004
NOTES TO THE ANNUAL FINANCIAL STATEMENTS (continued)
2004
P’000
2003
P’000
13. CAPITAL
Authorised and paid-up capital 25 000 25 000
The paid-up capital is the amount subscribed by theGovernment in accordance with Section 5 of the Bank ofBotswana Act (CAP 55:01).
14. GENERAL RESERVE 1 600 000 1 600 000
In the opinion of the Board, the General Reserve, takentogether with other reserves which the Bank maintains, issufficient to ensure the sustainability of future operationsof the Bank.
15. CURRENCY REVALUATION (LOSSES)/GAINS
TAKEN TO INCOME STATEMENT
Total realised losses (341 837) (1 778 989)Unrealised gains – Liquidity Portfolio 6 872 9 758
Total taken to income statement (334 965) (1 769 231)
Appropriated to Currency Revaluation Reserve:
Realised and reinvested in foreign assets 344 937 1 776 466Unrealised – Liquidity Portfolio (6 872) (9 758)
338 065 1 766 708
Net credited/(charged) to income statement 3 100 (2 523)
16. INTEREST EXPENSE
Bank of Botswana Certificates (BoBCs) 1 123 103 1 182 199Debswana Tax Holding Account 38 703 39 161Reverse Repurchase Agreements 12 359 15 624National Savings Certificates 220 189
1 174 385 1 237 173
17. CASH FLOW STATEMENT
This has been prepared under International AccountingStandard No. 7 – Cash Flow Statements (Revised 1992).The definition of cash in the Standard is not whollyappropriate to the Bank. Due to its role in the creationand withdrawal of currency in circulation, the Bank has nocash balances on its balance sheet (also see Note 7).However, it has the ability to create cash when needed.

46
BANK OF BOTSWANA ANNUAL REPORT 2004
NOTES TO THE ANNUAL FINANCIAL STATEMENTS (continued)
2004 2003
P’000 P’000
18. CASH GENERATED BY OPERATIONS
Net loss for the year (404 711) (2 257 928)Adjustments for:
Unrealised exchange losses 338 065 1 766 708Depreciation of property and equipment 11 604 11 391Loss on disposal of property and equipment 500 15
Operating cash flows before movements in working capital (54 542) (479 814)
Increase in Deposits – banks and other 452 052 174 735(Decrease)/Increase in Deposits – Government (367 273) 244 277Increase in Bank of Botswana Certificates 909 926 1 075 889(Increase)/Decrease in other assets (497) 1 720(Decrease)/Increase in other liabilities (67 821) 46 735
Cash generated by operations 871 845 1 063 542
19. CAPITAL COMMITMENTS
Approved and contracted for 6 451 1 609Approved but not contracted for 31 958 38 631
38 409 40 240
These capital commitments will be funded from internalresources.
20. GOVERNMENT OF BOTSWANA BOND AGENCY
In accordance with Sections 45 and 46 of the Bank of Botswana Act (CAP 55:01), the Bank acts asagent of the Government for the issuance and management of the Government Bonds. Ananalysis of the three bonds issued is provided below:
GOVERNMENT OF BOTSWANA BONDS ISSUED AS AT DECEMBER 31, 2004 (P’000)
Bond Detail BW 001 BW 002 BW 003
Date of Issue May 26, 2003 March 31 and
December 1, 2003
May 6 and
November 3, 2003
Total
Since Inception
Date of Maturity June 1, 2005 March 1, 2008 October 31, 2015
Interest Rate (per annum) 10.75 percent 10.25 percent 10.25 percent
Nominal Value 750 000 850 000 900 000 2 500 000
Net Discount (30 401) (21 029) (32 571) (84 001)
Net Proceeds 719 599 828 971 867 429 2 415 999
Interest Paid 120 938 112 750 117 875 351 563
Interest Accrued 6 719 29 042 15 375 51 136
Net proceeds realised from the issue of the bonds were invested in the Government InvestmentAccount.

47
PART A: STATUTORY REPORT ON THE OPERATIONS AND FINANCIAL STATEMENTS OF THE BANK, 2004
Interest is payable on all bonds on a semi-annual basis in arrears. Total cumulative interest payments of
P351 563 000 made to December 31, 2004 (2003 – P91 563 000) were funded from the Government’s
current account maintained with the Bank.
21. COMPARATIVES
Where necessary, comparative figures have been restated to conform with changes in presentation in the
current year. The adjustments required as a result of the changes in accounting policies are reflected in
the Statement of Accounting Policies and the Statement of Changes in Shareholder’s Funds.
22. RISK MANAGEMENT POLICIES IN RESPECT OF FINANCIAL INSTRUMENTS
The risk management policies of the Bank regarding financial instruments are dealt with in regular
reviews of the Bank’s reserve management policies. The main risk areas are market, currency, credit
and interest rates. The Bank invests in investment grade currencies (AA/Aa2) and above. Interest rate
risk is managed by using modified duration, while credit risk is controlled by dealing with the best
quality institutions or counterparties, as determined by international rating agencies.
23. RELATED PARTY TRANSACTIONS
The Bank provides several services to its shareholder, the Government, and to other Government-owned
institutions. The main services during the year to December 31, 2004 were:
(i) provision of banking services, including holding of the principal accounts of the Government;
(ii) management of the Notes and Coin issue, including printing and minting of notes and coin,
respectively; and
(iii) being the Government’s agent in issuing of bonds.
The aggregate balances in Government and other public sector accounts are disclosed in Notes 9 to 11.
No charge is made to the Government for provision of these services, except for commissions charged on
domestic foreign exchange transactions, which are included in ‘Commissions’ in the income statement.
During the year, the Bank lent P800 000 000 to Debt Participation Capital Funding Limited, which was
fully guaranteed by the Government and was repaid in full during the same year. The Bank earned
interest on the loan at the interest rate of 14.25 percent per annum. The interest income earned has been
appropriately disclosed in the income statement.
The Bank also earns interest on its holding of the Government of Botswana Bonds, which is included in
the income statement. Unrealised market value movements in the bonds have been included in the Market
Revaluation Reserve.
NOTES TO THE ANNUAL FINANCIAL STATEMENTS (continued)

Blank page 48
49
PART B
THE BOTSWANA ECONOMY IN 2004AND THEME CHAPTER
BANK OF BOTSWANA

Blank page 50 not numbered

51
CHAPTER 1THE BOTSWANA ECONOMY IN 2004
Source: Central Statistics Office
CHART 1.1: GROWTH IN REAL GROSS DOMESTICPRODUCT
1. OUTPUT, EMPLOYMENT AND PRICES
(a) National Income Accounts11.1 In 2003/04 real gross domestic product (GDP)
grew by a provisional 5.7 percent, lower thanthe revised 7.8 percent growth in2002/03 (Chart 1.1). Reduced growth rates wereexperienced in most economic sectors. Theslowdown in mining growth to 6.9 percent,compared to the robust increase of 10.3 percentin 2002/03, had a significant impact on theoverall growth rate. Despite the loss ofmomentum, mining was still the fastest growingsector and, with a 36 percent share in total output,was the major contributor to GDP during theyear.
1.2 The growth of the non-mining sector slowed to5.1 percent in 2003/04, from 6.4 percent in theprevious year. When government is excluded,the growth rate for the non-mining private sectorwas 5.2 percent, down from 7.3 percent in2002/03.
1.3 As a result of the increasing significance andvolatility of the adjustment items, which impactssignificantly on GDP growth, it is illuminatingto consider the performance of value added atfactor cost separately, as it is not clouded by theeffects of the (sometimes large) fluctuations inthe adjustment items.2 At real factor cost, valueadded rose by 5 percent in 2003/04 comparedwith 5.6 percent in 2002/03. In the non-miningprivate sector, real value added at factor cost roseby 3.5 percent in 2003/04, up from 2.8 percentin the previous year.
1 The national income accounting year runs from July eachyear to June the following year.
2 These are taxes on imports and on products/productionsand would include Southern African Customs Union(SACU) payments and value added tax proceeds, amongothers.
1.4 A sectoral breakdown of GDP growth in2003/04, which shows sources of theslowdown in output during the year, is givenin Chart 1.2. One of the significant dampeninginfluences on GDP growth wasmanufacturing, whose output contractedmarginally by 0.5 percent, reversing themodest growth of 3.1 percent in the previous
CHART 1.2: ECONOMIC GROWTH BY SECTOR
Source: Central Statistics Office
1999/00 2000/01 2001/02 2002/03 2003/04National Accounts Year
Mining Non-mining Total GDPPercent
20
15
10
5
0
-5
ManufacturingAgricultureTransport
Trade, Hotels & RestaurantsWater & Electricity
General GovernmentConstruction
Banks, Insurance and Business ServicesSocial and Personal Services
Mining
Percent-2 0 2 121064 8
2002/03 2003/04

52
BANK OF BOTSWANA ANNUAL REPORT 2004
year. Sub-sectoral data suggest that this poorperformance was due mainly to a substantialcontraction in production of textiles and a slightreduction in the output of beverages. Therecorded contraction of textiles output is,however, inconsistent with the significantgrowth in textile exports by value (which cannotbe attributed solely to price increases, suggestingthat volume effects may have played a role) andregular reports (and acknowledgement in the2005 Budget Speech) that textiles exported underthe United States African Growth andOpportunity Act (AGOA) increased sharplybetween 2003 and 2004.3 Meat and meatproducts also performed relatively poorly,recording growth of 1.4 percent compared withnearly 7 percent in 2002/03, a result mainly oflower livestock throughput at the Botswana MeatCommission (BMC). Other manufactures, whichmight have benefited from the healthy increasein output of the construction and governmentsectors, were nonetheless only marginally up by0.3 percent.
1.5 A sharp fall in the expansion of waterdistribution, despite a 6.6 percent increase in theconsumer base, was the main explanation for themuch slower output growth of water andelectricity sector, down to 3.9 percent from 9.5percent in 2002/03. The slower increase in wateroutput was, however, partially offset by the rapidexpansion in electricity generation, which wasbacked by fairly strong demand from thedomestic and government sectors.
1.6 The trade, hotels and restaurants sector grew at2.9 percent, down from 3.3 percent in 2002/03,largely reflecting the weak performance of thehotels and restaurants sub-sector. The sub-sectorwas adversely affected by a slowdown intourism, which experienced both fewer arrivalsand lower spending by tourists, partly due to theappreciation of the Pula against the US dollar
(an important transacting currency). Growth inthe trade sector picked up somewhat, rising from1.9 to 3.2 percent, consistent with faster growthin consumer spending indicated elsewhere in thenational accounts.
1.7 Agricultural production rose by 1.1 percent, downfrom an expansion of 1.9 percent in 2002/03.Growth was adversely affected by the stagnantlivestock sub-sector, which was recovering fromthe effects of the drought of the previous year.However, a 7.9 percent increase in arable output(which reversed the 3.6 percent decline registeredin 2002/03) and a modest increase in output of‘other agriculture’ of 2.7 percent ensured that thesector’s overall output growth remainedmarginally positive. Arable agriculture benefitedfrom improved rainfall during the year.
1.8 Among the sectors that expanded more rapidlythan in the previous year were social andpersonal services, banking, insurance andbusiness services, construction, generalgovernment, and transport and communications.The construction sector posted the strongest gainin output growth, expanding by 4.9 percent,compared to 0.6 percent in 2002/03, althoughthis is somewhat inconsistent with the recordedcontraction in the sector’s level of employment.
1.9 For banks, insurance and business services, thegrowth in value added of 5 percent was almostdouble the 2.6 percent recorded in 2002/03.Nevertheless, with interest rates remaining high,lending by banks grew more slowly than in theprevious year. Reflecting this, and costcontainment measures, output of the banking sub-sector rose by 6.4 percent, against 9.9 percentgrowth in 2003. The growth of over 11 percent inthe insurance sub-sector was more robust thanthe previous year’s 6.3 percent. The improvedperformance of the sub-sector resulted from asteady increase in premium income and aturnaround in global and domestic investmentmarkets performance, while the Pula devaluationin February 2004 enhanced the local currencyvalue of returns on offshore investments,particularly dollar-denominated portfolios.
3 The inconsistencies may be partly explained by differencesin period coverages (national accounts versus calendar yearfigures), as well as differences in the completeness of firmcoverage in data collection surveys undertaken by variousCSO Units.

53
THE BOTSWANA ECONOMY IN 2004
However, there was a further 1.7 percent declineof the real estate and business services sub-sector.
1.10 The performance of the transport, posts andtelecommunications sector was mixed, with theroad and rail components activity below that ofthe previous year, while air transport expandedsufficiently to offset the fall in road and railoutput. Posts and telecommunications reversedthe previous year’s decline and grew marginallyby 0.4 percent. Overall, the sector grew by 1.2percent, against 0.9 percent in 2002/03. Despitethe modest growth, this sector recorded thefastest growth in employment in 2004.
1.11 The value added for general governmentincreased by 4.6 percent in 2003/04 from 3.7percent in 2002/03. This reflects both theincrease in salaries associated with theimplementation of the new unitary pay structurein April 2004 and increases in staffing, as wellas depreciation associated with past increasesin development spending by the Government.Value added for social and personal services alsoincreased faster, by 6.2 percent from 2.8 percentthe previous year.
1.12 Both private and government final consumptionexpenditure increased more rapidly in 2003/04than in 2002/03, by 7.7 percent and 9.3 percent,in real terms, respectively. Gross fixedinvestment, grew at a respectable rate of 6.6percent, to reach 25 percent of GDP, higher thanthe 1.5 percent growth achieved in 2002/03. Asa result, gross domestic expenditure rose by 9.4percent in real terms compared with 8.9 percentin the previous year. Import growth reboundedin 2003/04, although the expansion was modest,about 1.3 percent. While exports declined in realterms for the third consecutive year, thecontraction of 4.5 percent was less than in thetwo preceding years.
(b) Economic Outlook for 2004/05 and2005/06
1.13 According to the 2005 Budget Speech, GDP isforecast to grow by 4–5 percent in 2004/05 and
2005/06, reflecting slower growth across allsectors. Preliminary indications suggest thatthese projected growth rates may well beexceeded.4 In the first half of 2004/05, miningproduction is estimated to have increased morerapidly than it did in the corresponding period ayear earlier, with diamond production up by 14percent, soda ash by 35 percent and coal by 20percent. Reflecting this growth, value added inmining is estimated to have risen by 8 percentin the first quarter of 2004/05, i.e., July-September 2004. Following a difficult year forDebswana in 2004, characterised by widespreadequipment failure and the disruptive strike andrains early in the year, diamond production isexpected to increase more rapidly in 2005 as aresult of the normalisation of the situation andcontinued efforts at efficiency improvements.Output from the new Mupane Gold Mine shouldalso contribute to the growth of the sector.Provisional estimates for the first quarter of2004/05 indicate that higher GDP growth isanticipated from construction (with growth of31 percent), transport and communications (16percent) and government (6 percent). Whilethese numbers only cover the first quarter, theydo indicate that perhaps the final actual GDPgrowth rate for the year could be somewherehigher than the projected growth rate.
1.14 The expected strong growth of the constructionsector and, to a lesser extent, government sectorshould contribute to the growth ofmanufacturing, although this is not evident yetfrom the 2004/05 first quarter GDP data.Moreover, the rapid increase in governmentpersonal emoluments payments in both 2004/05(due to the introduction of the unitary paystructure) and in 2005/06 (implying a furtherexpansion of the civil service given a freeze onsalaries in that year) should have a beneficialeffect on the output of several sectors – thegovernment sector itself through higher spending
4 Although there is uncertainty on the quality of the dataand, therefore, the reasonableness of the estimated growthrates.

54
BANK OF BOTSWANA ANNUAL REPORT 2004
on salaries, retail, hotels and restaurants andsocial and personal services through higherconsumer spending, and banks, insurance andbusiness services through increased demand forcredit. The more than 12 percent increase inbudgeted development spending for 2005/06should also boost the contribution ofgovernment, manufacturing and constructionsectors to GDP.
1.15 On the downside, arable agriculture will beadversely affected by the drought conditions thathave prevailed throughout the country in therecent past.5 Although livestock conditions inearly 2005 were fair to good, a deterioration isexpected given drought conditions in much ofthe country. This would affect not only outputgrowth of the livestock farming sub-sector, butalso the BMC throughput and, consequently,manufacturing output. The water restrictions inGaborone and areas serviced from the GaboroneDam may adversely impact on constructionactivity. Banks may increasingly find it difficultto improve on interest margins given theincreased number and scope of fixed incomeinvestments instruments (in particular bonds)that have intensified the competition for deposits.
(c) Employment1.16 Formal sector employment growth continued to
be sluggish in the year to March 2004.6 Duringthis period, employment rose by 3.1 percent, animprovement on the 2.6 percent recorded in theprevious period with an increase from 282 000to 291 000. Of the 9 000 new jobs created, over
half (56.1 percent) were in general government,compared with just over a third created in thepreceding year. Within government, centralgovernment employment rose by 5.4 percent,while local government employment rose muchmore slowly, by 1 percent, in 2004.
1.17 Employment growth in the private and parastatalsector was lower, at 2.2 percent in 2004,compared with 2.8 percent in 2003 due to aslowing of the rate of growth of private sectoremployment for the third consecutive year anda contraction in parastatal employment for thesecond year running. Employment growthslowed in these sectors as a result of a reductionin employment levels in several sub-sectors,including community and personal services (24percent), agriculture (13.4 percent), commerce(6.2 percent), electricity and water (3.4 percent)and construction (0.9 percent). As indicatedearlier, the drop in the construction sector’semployment level is not consistent with thesector’s fairly rapid output growth, and noconvincing explanation for this has been found.
1.18 Within the private sector, employment in thetransport and communication sector grew at avery rapid rate of 29.6 percent (which seemsinconsistent with the 1.2 percent growth ofoutput), followed by education (19.4 percent),finance and business services (10.9 percent),mining with (9 percent) and, unexpectedly,manufacturing (8.6 percent). The recorded risein manufacturing employment was not consistentwith the recorded fall in output. The apparentmismatch between employment and outputgrowth in several economic sectors(construction, transport and communications,and manufacturing) and, in the case ofmanufacturing, between output data and tradedata, indicates that attention needs to be paid toissues of data quality, including consistency andcomparability.
1.19 In line with a slowdown in the rate of outputgrowth, employment in the non-mining privatesector (i.e., excluding government and mining)increased at a rate of 2.3 percent, the slowest
5 Normal to above normal rainfall was received in someisolated areas, but most parts of the country had deficientrains through to January 2005. With the delayed rains,ploughing and planting started late with the result that theacreage ploughed/planted was smaller than that of theprevious year, while yields are expected to be lower becauseof the smaller acreage planted and loss of soil moisture.
6 To maintain consistency with previous Annual Reports, thedata reported here is for March 2004. The figures used inthe Government’s Annual Economic Report of 2005 arefor September 2004.

55
THE BOTSWANA ECONOMY IN 2004
since 2000. As a result of slower growth ofemployment in the private and parastatal sector,its share in total employment declined to 60.9percent from 61.4 percent in the previous year,while that of government rose from 38.6 percentin 2003 to 39.1 percent in 2004.
1.20 Prospects for employment growth in 2005 willdepend on improvement in the pace of economicactivity and on the Government budget. Thesluggish rate of employment expansion that hasbeen evident in the past several years may wellcontinue in 2005 given a projected slowdownin economic activity in 2004/05. However, asthe earlier discussion indicated, the rate of GDPgrowth may well be higher than was forecast inthe Budget Speech. On budget outcomes, recentpublic sector reforms, such as performancemanagement contracts, should contribute toefficient and effective implementation ofprojects such that the intended benefits ofgovernment spending can permeate to wherethey are needed most. Therefore, newemployment opportunities are expected to occurin government, mining, construction,manufacturing and retail, hotels and restaurants.
(d) Inflation1.21 World economic activity strengthened in 2004
and global inflation rose, partly due to pressurefrom higher oil prices. Some of the major centralbanks reacted by tightening monetary policy inan attempt to pre-empt inflationary pressures andto sustain expectations of low inflation. Inflationin the major industrial countries rose in 2004,from 1.7 percent in 2003 to 2.6 percent, and wassignificantly influenced by the rise ininternational oil prices. In South Africa, afterrising slightly in the first half, inflation resumedits downward trend in the second half of 2004,largely due to the strengthening of the rand, andremained within that country’s 3–6 percent targetrange. In Botswana, domestic demand pressureseased considerably as growth in both credit andgovernment expenditure was below the rangesconsidered to be consistent with the inflationobjective. However, despite subdued demand,
inflation prospects were negatively influencedby higher costs arising from the 7.5 percentdevaluation of the Pula in February 2004 andsubstantial increases in some administeredprices, including fuel.
1.22 As a result of the devaluation and the increasesin administered prices, annual inflationmaintained an upward trend in 2004, rising from6.4 percent in December 2003 to 7.8 percent inDecember 2004. It is estimated that the 7.5percent devaluation contributed about 2percentage points to inflation during 2004,mostly as a result of higher Pula-denominatedimport prices.7 The decline in South Africaninflation in the second half of the year helpedmitigate somewhat the impact on domesticprices. Overall, inflation, excluding items withadministered prices8 is estimated to have beenbetween 5.5 percent and 6 percent in 2004, wellwithin the 4–7 percent objective.
1.23 Core inflation9, as measured by the 16 percenttrimmed mean, closely tracked headline inflationduring 2004, and was a reflection of the absence
7 This is based on an assumption that without the devaluationand other exceptional items, such as the increase in fuelprices, the rate of increase in prices of imports would havebeen the same or lower (especially given lower SouthAfrican inflation) in 2004 compared to 2003.
8 About 16 percent of items in the consumer price indexbasket have prices that are administratively set by theGovernment and various parastatals outside the normal freemarket price determination. It is recognised, however, thatthese price adjustments are influenced to some degree bygeneral price developments. The cost adjustments arejustified as a way of catching up with market prices, aresponse to higher input costs and a move towards costrecovery, while fuel price adjustments are done in responseto international oil price developments. However, theseprice changes are not directly influenced by monetarypolicy, hence it will not normally respond to them, exceptto the extent that they are expected to influence ‘free’ prices,especially through second round effects.
9 The Bank’s preferred measure of core inflation is based onan approach using the trimmed mean. This approachremoves the most extreme price changes, regardless of theirsource. The core inflation rate is currently calculated bythe Bank from data published by the Central StatisticsOffice.

56
BANK OF BOTSWANA ANNUAL REPORT 2004
of extreme price changes in any of the categoriesof goods and services in the CPI basket.Consequently, core inflation was 8 percent inDecember 2004, from 6.9 percent in June 2004and 6.5 percent in December 2003.
1.24 Price changes by tradeability also trendedupwards in 2004. The annual rate of change inthe cost of tradeables rose to 6.9 percent inDecember 2004 from 6.3 percent in June and 5.7percent in December 2003. This was mainlyattributable to the 7.5 percent devaluation of thePula in February 2004. Within tradeables,inflation for imported tradeables accelerated to7.6 percent in December 2004, from 6.5 percentin June 2004 and 5.5 percent in December 2003,while inflation for domestic tradeables slowed to5.6 percent in December 2004, from 5.9 percentin June 2004 and 6.1 percent in December 2003.For non-tradeables, the annual rate of price changerose to 10.2 percent from 7.7 percent in June 2004and 8.2 percent in December 2003.
(e) Inflation Outlook1.25 Global economic activity is expected to slow
moderately in 2005, with forecast GDP growthof 4.3 percent compared to an estimated 5percent in 2004. The sharp rise in oil prices,which contributed to a weakening of globaldemand expansion towards the end of 2004, is
expected to have a similar effect in 2005.However, after increasing to record levels in2004, oil prices had eased by year-end, in partdue to the Organisation of Petroleum ExportingCountries’ (OPEC) commitment to keepingprices at sustainable levels through outputexpansion, but remain high. Despite theseupward pressures on prices, global inflation isgenerally under control due to productivitygrowth and continued strong competition ininternational goods markets. Labour market
CHART 1.3: BOTSWANA INFLATION
Source: Central Statistics Office
CHART 1.4: CPI INFLATION BY TRADEABILITY
Source: Central Statistics Office
CHART 1.5: INTERNATIONAL INFLATION
Sources: Central Statistics Office, Reuters and Bank ofBotswana
Percent
2001 Apr Jul
Oct
2002 Apr Jul
Oct
2003 Apr Jul
Oct
2004 Apr Jul
Oct
15
13
11
9
7
5
3
1
-1
Core InflationCPI Inflation
Percent
2001 Apr Jul
Oct
2002 Apr Jul
Oct
2003 Apr Jul
Oct
2004 Apr Jul
Oct
17
15
13
11
9
7
5
3
1
Imported TradeablesDomestic TradeablesNon-tradeables
Percent
2001 Mar
May Jul
Sep
Nov
2002 Mar
May Jul
Sep
Nov
2003 Mar
May Jul
Sep
14
12
10
8
6
4
2
0
SA (core) SDR CountriesTrading partners(weighted averages)
Botswana

57
THE BOTSWANA ECONOMY IN 2004
pressures are also subdued and pre-emptivemonetary policy tightening in some countries ishaving the desired effect. In the circumstances,average inflation in SDR countries is forecastto decline from 2.6 percent in 2004 to about2 percent in 2005. Inflation in South Africa,which is one of the more important externalinfluences on inflation in Botswana, is expectedto remain within the South African ReserveBank’s target range over the medium-term.However, the country could raise interest ratesin response to accelerating credit growth, awidening current account deficit and any furthersignificant weakening of the rand.
1.26 Domestic demand, as reflected in growth ratesfor commercial bank credit and governmentexpenditure remained subdued in 2004. In 2005,it is expected that domestic demand pressureswill continue to be restrained, in particular dueto the budgeted moderate growth in governmentexpenditure, which in turn will help sustaincurrent levels of credit growth considered to beconsistent with the inflation objective. Inaddition, it is anticipated that the absence of asalary increase for civil servants will moderatehousehold borrowing which, in 2004,contributed significantly to overall credit growth.
2. PUBLIC FINANCE
(a) Budgetary Performance – 2003/04 and2004/05
2.1 The 2005 Budget Speech stressed the need toeffectively deal with the HIV/AIDS pandemic,to create more job opportunities in the face ofhigh unemployment, and the importance of bothmaintaining the existing public infrastructureand expanding its availability in an effort toimprove service delivery and stimulate economicactivity. The theme of the Budget Speech was‘Meeting the Millennium Development Goals(MDGs) and Vision 2016 Through a Self-ReliantApproach to Development’.10 This themerecognised the congruency between the MDGsand the development ideals of Vision 2016, andthe importance of moving away from heavy
dependence on Government to a spirit of self-reliance at both the individual and corporatelevels.
(i) The 2003/04 Final Budget112.2 Although the deficit for 2003/04 was somewhat
larger than expected, the budget was broadlybalanced. A deficit of P78 million was recorded,compared with the revised estimate ofP24 million, but was much smaller than the finaloutturn of a P1.4 billion deficit for 2002/03(Table 1.1). The slippage in the deficit comparedto expectations was explained by lower thananticipated revenues for non-mineral income taxand value added tax (VAT). Overall revenues andgrants rose by 13 percent to P16.2 billion in2003/04, from P14.3 billion in 2002/03. Totalexpenditure and net lending increased by3.6 percent to P16.3 billion, from P15.7 billionin 2002/03. However, the P229 million dividendspaid to Government by various parastatals, andthe partial proceeds from the sale of the PDSFloan portfolio and proceeds from the sale of someof the Government’s shares in Anglo AmericanCorporation, contributed to the near balancingof the budget.12
(ii) The 2004/05 Revised Budget2.3 The revised 2004/05 Budget deteriorated from
the originally projected near balance (with a
10 In 2000, the Heads of State and Government embraced theUnited Nations Millennium Declaration committingthemselves to take measures to eradicate extreme povertyand hunger; achieve universal primary education; promotegender equality and empowerment; reduce child mortality;improve maternal health; combat HIV/AIDS, malaria andother diseases; ensure environmental sustainability; anddevelop a global partnership for development by the year2015.
11 The Government financial year runs from April to March.12 In terms of the 2001 Government Finance Statistics (GFS)
Manual, proceeds from the sale of Government shares inAnglo American Corporation do not constitute revenue butfinancing. However, they are treated here as revenuebecause Government accounts are not yet prepared in termsof the guidelines in this manual, although the guidelineswill be adopted in due course.

58
BANK OF BOTSWANA ANNUAL REPORT 2004
small surplus of P69 million) to a large deficitof P1.4 billion (Table 1.1). The turnaround wasdue to a combination of lower revised revenuesfrom all sources compared with the originalestimates, against a 3.6 percent rise in totalexpenditure and net lending. Compared with thefinal revenue outturn for 2003/04, the revisedtotal revenue and grants grew at 6.8 percent, anincrease which was nevertheless slower than the15 percent rise in total expenditure, within whichrecurrent expenditure rose more rapidly due tothe sizeable adjustment in personal emoluments.
2.4 The large deficit was justified in terms of theneed to avoid a disruptive cut in governmentspending on ongoing projects from the previousfiscal year as well as the need by Governmentto provide a stabilising role when economicactivity was slowing.
(b) 2005/06 Budget Proposals
(i) Budget Balance and Revenue.2.5 In 2005/06, the Minister proposed to reverse the
2004/05 deficit and balance the budget with a
modest surplus of P112 million, arising fromtotal revenue of P20.6 billion and totalexpenditure of P20.5 billion.
(ii) Revenue.2.6 Total revenue and grants are budgeted to increase
by 18.9 percent in 2005/06, compared to therevised 2004/05 outturn of P20.6 billion. Theexpected rapid increase in total revenue is basedon projected increases in mineral revenues (28.7percent), non-mineral income tax revenues (25.7percent) and fees and charges (45.5 percent),while slower rates of growth are expected forVAT (5 percent) and customs and excise (3.5percent).
2.7 However, it may be difficult to achieve suchlarge increases in both mineral and non-mineralincome tax revenues, even allowing for theproceeds from the implementation of the newagreement between the Government and DeBeers in the case of mineral revenues, and a morerapid pace of economic activity coupled withbetter tax collection in the case of non-mineralincome tax revenue. Nevertheless, the decision
TABLE 1.1: THE GOVERNMENT BUDGET: 2003/04 – 2005/06 (P MILLION)
1. Wages, salaries and related staff costsSource:Financial Statements, Tables and Estimates of the Consolidated Development Fund Revenues 2005/06, MFDP.
2003/04 2004/05 2005/06Budget Revised Final Budget Revised Budget
Revenue 17 539 16 182 16 197 18 209 17 294 20 566Mineral 8 140 6 721 8 163 8 070 7 713 9 926Non-mineral 9 399 9 461 8 034 10 139 9 581 10 640
Expenditure 17 333 16 207 16 276 18 140 18 720 20 454Recurrent 13 319 13 258 12 935 14 571 14 625 15 720
Of which:Salaries1 4 132 3 941 4 142 4 776 4 776 5 436
Development 4 431 4 000 4 256 3 610 4 327 4 858Net lending –417 –1 051 –916 –40 –232 –124
Balance 206 –24 –78 69 –1426 112

59
THE BOTSWANA ECONOMY IN 2004
to draw down dividends from profitableparastatals at the rate of 25 percent of their profitsshould boost other property income. The largeincrease in fees and charges, while perhapsexpected to result from effective implementationof cost recovery measures, may also beoptimistic.
(iii) Expenditure2.8 The proposed total expenditure including net
lending of P20.5 billion is about 40 percent ofGDP, with recurrent and development spendingof P15.7 billion and P4.9 billion, respectively.When net lending is excluded, recurrent anddevelopment spending is budgeted to grow by8.6 percent over the 2004/05 revised estimates,to P19 billion, with development spending risingat a faster rate of 12.3 percent than recurrentexpenditure (7.5 percent). Most of thedevelopment budget will be allocated to ongoingprojects and the maintenance of existinginfrastructure. In particular, a substantial portionof the budget will finance the HIV/AIDSprogramme, upgrading of hospitals, primary andsecondary schools programme, village watersupply and sewerage, urban land servicing, roadsimprovement and support for the BCL copper-nickel mine.
(c) Fiscal Legislation2.9 No new taxes or revision of tax rates were
proposed; instead Government will conduct anin-depth review of the Income Tax Act, No. 12of 1995 in 2005, and a Bill is expected to bepresented to Parliament in 2006.13
2.10 Insufficient tax compliance was highlighted asa major challenge for the newly establishedBotswana Unified Revenue Service (BURS)despite some improvement in compliance overthe past three years. Tax non-compliance wassignificant in the case of VAT with under-
reporting of output taxes and overstatement ofinput taxes. To address the problems, income taxaudits will be intensified and penalties imposedfor misreporting of tax returns. However, BURSis credited with having reduced income taxarrears from P430 million as at 31 March 2002to P180 million as at 31 December 2004.
(d) Policy Reviews2.11 In light of the economic and other changes that
have occurred in the past decade or so,Government reviewed the National Policy onIncomes, Employment, Prices and Profits of1990 in order to align it with currentcircumstances. Based on the review, it isexpected that a report on strategies forstrengthening the institutional mechanismsrequired for effective implementation of thepolicy would be presented to Parliamentin 2005/06.
2.12 For the non-banking financial institutions, theGovernment commenced a review of the existingregulatory framework with a view to explore thepossibility of establishing an appropriatefinancial regulatory authority in order to ensurethe continued stability of the financial systemas a whole. The review process includesreappraisals of current legislation that mayinhibit the development of the financial sector.Among the existing legislation under review arethe Building Societies Act of 1961 and theBotswana Stock Exchange Act of 1994, both ofwhich are expected to be amended in 2005/2006.
2.13 With regard to improving economic efficiency, theGovernment is expected to approve the draftPrivatisation Master Plan (PMP) during the firstquarter of 2005. The plan is a road map for anorderly implementation of the privatisationprocesses under various approaches. The currentinitiatives under consideration include a possiblemerging of the Botswana Savings Bank (BSB) andthe National Development Bank (NDB) or theirprivatisation, ways and means of privatising AirBotswana and the start of privatising the BotswanaTelecommunications Corporation in 2005/06.
13 The Act has been subject to several amendments since 1995,to ensure that the tax legislation remained relevant and up-to-date.

60
BANK OF BOTSWANA ANNUAL REPORT 2004
2.14 Economic efficiency is also expected to benefitfrom the toll roads study, which will becomeavailable in March 2005, to be implemented in2005/06, while the Private-Public Partnershipinitiative will be introduced in the first half of2005.
2.15 International trade and foreign direct investmentand the overall improvement of the businessclimate are expected to benefit from theGovernment’s intention to adopt a foreign directinvestment strategy, a competition policy and torefine the draft foreign direct investment law.Correspondingly, various legislation andregulations are being reviewed and improvedincluding the Industrial Development Act, theCopyright and Neighbouring Rights Act, theMicro-lending regulations, and regulations of thenew Companies Act. In this regard, the plannedestablishment of a joint venture between theGovernment and De Beers to sort and marketdiamonds will stimulate foreign directinvestment and improve business activity.
2.16 Public sector reforms are continuing with theimplementation of the PerformanceManagement System (PMS), which aims atmaintaining a productive civil service andcultivating a culture of effectiveness andefficiency in government.
2.17 Combating poverty has been one of theGovernment’s main priorities. In its efforts tofight poverty, the Government has established aposition of Poverty Reduction Advisor with thehelp of the UNDP, and the post takes effect inthe first half of 2005.
3. EXCHANGE RATES, BALANCE OFPAYMENTS AND INTERNATIONALINVESTMENT POSITION
(a) Exchange Rates3.1 Botswana’s exchange rate policy is aimed at
maintaining the country’s externalcompetitiveness as measured by the real
Nominal Exchange Rates (Foreign currency per Pula)As at end of 2003 2004 Percentage ChangeSA rand 1.4875 1.3233 –11.0US dollar 0.2251 0.2336 3.8Pound Sterling 0.1265 0.1211 –4.3Japanese yen 24.06 23.96 –0.4SDR 0.1536 0.1527 –0.6Euro 0.1791 0.1714 –4.3Nominal Effective Exchange Rate(Index, Nov. 1996 = 100)
101.7 94.1 –7.5
Real Pula Exchange Rate Indices (November 1996=100)SA rand1 130.3 120.9 –7.2
SA rand2 119.3 109.2 –8.4US dollar 117.1 126.8 8.3SDR 118.3 123.5 4.4Real Effective Exchange Rate1 118.4 113.6 4.1
TABLE 1.2: PULA EXCHANGE RATES AGAINST SELECTED CURRENCIES
1. Calculated using core inflation. Core inflation is the all-items consumer price index excluding mortgage interest costsand prices of various volatile food items.
2. Calculated using headline inflation.Source: Bank of Botswana

61
THE BOTSWANA ECONOMY IN 2004
effective exchange rate (REER) of the Pula. Theobjective is achieved primarily by maintaininga stable trade-weighted nominal effectiveexchange rate (NEER) of the Pula against abasket of currencies including the SDR and therand, but also by monetary policy aiming to keepBotswana’s rate of inflation similar to or betterthan inflation in the country’s trading countries.
3.2 The rand strength was attributable to severalfactors, including strong commodity prices, apositive but narrowing interest rate differentialwith the rest of the world, and continued positivesentiment towards the South African economy.The weakening of the US dollar was mainly aresult of the burgeoning budget and the currentaccount deficits in that country.
3.3 During 2004, the Pula depreciated in nominalterms against most major internationalcurrencies as a result of the combined effects ofthe 7.5 percent devaluation in February 2004 andoperation of the Pula basket. The exception wasthe US dollar, which was generally weak in theinternational financial markets, and againstwhich the Pula appreciated. The Pulaappreciation against the US dollar was in linewith the significant 17 percent appreciation ofthe South African rand against the dollar duringthe year.
3.4 Over the past several years, the REER of thePula has appreciated (Chart 1.6) on account ofboth a modest appreciation of the nominaleffective exchange rate (NEER) and higherinflation in Botswana than the average level ofinflation in Botswana’s trading partners. Theappreciation of the REER potentially signals aweakening of the competitive position ofBotswana’s exporters and domestic producerscompeting with imports; this would beparticularly the case when productivity levelsin Botswana are low relative to competitors. Inresponse, the nominal exchange rate of the Pulawas devalued by 7.5 percent in February 2004.By the end of December, however, the REER,which initially fell by the same 7.5 percentdevaluation, was only 4.1 percent lower becauseof the subsequent higher inflation in Botswanathan the trading partners.
3.5 Against individual currencies, the Pulaappreciated in real terms by 8.3 percent againstthe US dollar but depreciated by 8.4 percent(using core inflation) against the South Africanrand during 2004.
(b) Overview of the Balance of Payments3.6 The balance of payments estimates for both 2002
and 2003 have been revised following the
CHART 1.6: NOMINAL AND REAL EFFECTIVEEXCHANGE RATES AND RELATIVE PRICES
Source: Bank of Botswana
CHART 1.7: NEER AND NOMINAL EXCHANGE RATEINDICES AGAINST SELECTED CURRENCIES
Source: Bank of Botswana
Index Nov 1996 = 100
2000 M M J S N
2001 M M J S N
2002 M M J S N
2003 M M J S N
2004 M M J S N
125
120
115
110
105
100
95
90
85
80
Relative prices REERNEER
Index (November 1996 = 100)
1999 M M J S N
2000 M M J S N
2001 M M J S N
2002 M M J S N
2003 M M J S N
2004 M M J S N
150140130120110100908070605040
Rand/Pula NEERSDR/Pula

62
BANK OF BOTSWANA ANNUAL REPORT 2004
completion of the 2003 balance of paymentssurvey and the availability of updatedmerchandise trade data for the two years.14 As aresult of the revisions, the trade surplus rose forboth 2002 and 2003 compared to previousestimates. However, for 2003, despite the highertrade surplus, the favourable balance on currentaccount was revised downwards, due principallyto an increase of P2 088 million in the incomeaccount deficit. For 2004, preliminary estimatesindicate yet another significant current accountsurplus of P3 985 million; despite the continuinglarge net outflows in the financial account, theoverall surplus for the year is estimated at P575million.
(i) Merchandise Trade3.7 Exports are estimated to have risen by 10.8
percent to P16 268 million in 2004 from P14 970million in 2003. Of the total goods exports,
diamonds increased by 12.1 percent followingthe record diamond production in 2004 togetherwith price increases for rough diamonds, whichoffset the general strengthening of the Pulaagainst the US dollar. Copper/nickel pricescontinued to rise in 2004 contributing to the 21percent gain in exports from P1 229 million in2003 to P1 377 million in 2004, while for sodaash the rise was 4.9 percent. Despite the supplyshortfalls from farmers, beef exports by theBotswana Meat Commission (BMC) increasedby 9.1 percent.
3.8 For the period up to October 2004, textiles andautomotive product exports increased by
54 percent and 10.2 percent, respectively. Therise in textile exports was consistent with
14 There have been technical problems hampering theproduction of trade statistics by the Central Statistics Office(CSO) and previous balance of payments estimates for 2002and 2003 were prepared, to a large extent, using trade datato the first quarter of 2002. This applies particularly tomeasures of imports and related activities (e.g. freight onimports) as well as several categories of exports (such asvehicles and textiles) where the Bank of Botswana doesnot collect data directly.
2000 2001 2002* 2003* 2004#
Current Account Balance 2 782 3 491 1 244 2 288 3 985of which Visible Trade Balance 4 603 4 149 4 447 4 441 2 939 Services Balance –1 136 –1 010 182 –46 –85 Income Balance –1 792 –801 –4 418 3 543 –1 323 Net current Transfers 1 108 1 153 1 368 1 436 2 455
Financial Account Balance –1 021 –2 976 –1 375 –1 875 –3 609Capital Account Balance 194 34 4 111 22Net Errors and Omissions –15 474 462 272 177Overall Balance 1 941 1 024 336 797 575
TABLE 1.3: BALANCE OF PAYMENTS: 2000–2004 (P MILLION)
* Revised # ProvisionalSource: Bank of Botswana
2002 2003 2004Diamonds 12 478.5 11 707.3 13 133.1Copper/nickel 523.0 1 229.4 1 376.8Beef 276.6 260.2 284.0Soda Ash 268.0 229.6 250.8
TABLE 1.4: MAJOR EXPORTS (P MILLION)
Source: Bank of Botswana, CSO

63
THE BOTSWANA ECONOMY IN 2004
anecdotal reports that Botswana companies havebegun to benefit from concessions offered bythe United States under AGOA, as well asincreases in exports to South Africa.
3.9 Imports of goods are estimated to have risen by26.6 percent in 2004 to P13 330 million. Theapparently large increase could, however, partlybe due to data deficiencies in 2003, whichnecessitated some adjustments.15
(ii) Current Account3.10 In both 2002 and 2003, there were large changes
in the income account, which resulted in a lower,although still significant, surplus on the currentaccount. Among the factors influencing theincome account were the change in theownership and restructuring of BCL, followingwhich large payments of interest, which had ledto an income account deficit of P4 418 millionin 2002, were eliminated. In 2003, the deficit ofP3 543 million was mainly due to retainedearnings from certain companies. However, theestimated 2004 deficit is much smaller, at onlyP1 323 million. In general, the fluctuations inthe income account are mostly explained by thevolatility of the major debit components (profitsand dividends payments abroad), which aredependent on the year to year variations in thecompanies’ performances.
3.11 The services component of the current accountalso tends to show large variations. Afterdeclining from P1 010 million in 2001 to P127million in 2002, and further (to P46 million) in2003, the deficit was P86 million in 2004. Theprogressive decline in the deficit partly reflectedthe increased production of domestic services,including those related to exports, but could alsobe due to data collection deficiencies.
3.12 During the 2002–2004 period, the surpluses onthe merchandise trade and current transfers havebeen fairly stable. Trade surpluses of P4 477million, P4 441 million and P2 939 million in2002, 2003 and 2004 together with increasingnet current transfers, tended to offset the largeincome deficits.
(iii) Capital and Financial Accounts3.13 The capital account continued to record modest
surpluses during the 2002–2004 period. The netoutflow of P1 875 million shown for the financialaccount in 2003 is P1 600 million less than theoriginal estimate. The revision mainly reflectedan imputed amount of P1 725 million, which isthe counterpart to the increased retained earningsin the income account. For 2002 and 2003 theimpact of retained earnings have in part offsetlarge portfolio investment outflows. However,this effect is not present in the preliminaryestimates for 2004 which show net outflows onthe financial account of P3 609 million.
3.14 In 2004, portfolio investment outflows of P1 930million were lower than in both 2002 and 2003.A major explanation for the reduced amount wasthat externalisation of overseas investmentassociated with the funding of the public officerspension scheme had nearly run its course by2004. ‘Other investments’, which comprisestransactions related to loans, trade credits,currency and deposits and SACU flows, had anet outflow of P433 million.
(iv) Foreign Exchange Reserves3.15 Foreign exchange reserves were P24.2 billion
at the end of December 2004, an increase of P0.5billion (2.1 percent) from P23.7 billion inDecember 2003, equivalent to 17 months ofimports of goods and services. Measured in USdollar and SDR terms, the reserves increased by6 percent and 1.6 percent, respectively.
15 Following the technical problems that have hampered theproduction of trade statistics by the Central Statistics Office(CSO), a critical review of the data has shown inexplicablemovements in a number of individual items, e.g., foodand beverages and machinery and vehicle equipment, whichwhen used without any smoothing have had an effect ofaggravating ‘errors and omissions’ for the estimates.

64
BANK OF BOTSWANA ANNUAL REPORT 2004
(c) International Investment Position andForeign Investment
(i) International Investment Position (IIP)3.16 Comprehensive data on stocks of external
financial assets and liabilities are available upto the end of 2003. For 2004 the data are derivedfrom flows related to the 2003 stocks (excludingvaluation changes). Moreover, the 2004 stocksare up to December 2004 for reserve assets andportfolio investment assets. Botswana’s totalforeign assets increased by P4 867 million fromP39 215 million in 2003 to P44 082 million in2004. The bulk of the increase was in portfolioinvestment assets (P1 930 million). During theperiod, foreign liabilities increased by P913million, from P10 933 million in 2003 to P11 846million in 2004. The increase was mainly in‘other investments’ and especially loans (to bothpublic companies and the private sector).
(ii) Industry and Country Classification ofInvestment
3.17 Tables 1.5 and 1.6 below show Botswana’s stockof foreign liabilities at the end of 2003 byindustry and country owed. The figures are basedon the results of the 2003 balance of paymentssurvey.
3.18 In 2003, the bulk (61.3 percent) of foreign directinvestment was in mining, a decline from 71.3percent in 2002 due to the change in ownershipstructure of BCL.16 The other large recipients ofFDI were the wholesale and retail industry (13.9percent) and the financial sector (12.8 percent).
3.19 By the end of 2003, the principal source of the stockof FDI was Europe (57 percent). South Africa,which was previously a dominant source mainly dueto the accumulated interest debt by BCL reduced its
share to 39 percent of the total at the end of 2003.
3.20 Government’s external debt continued to be themajor component of ‘other investment’accounting for 41.6 percent of these liabilitiesin 2003. The stock of this debt is classified under‘public administration’ in Table 1.5. The shareof mining was 30 percent while construction’sshare was 15 percent due to a long-term loan toone company in 2003 compared to aninsignificant proportion in 2002.
4. MONEY AND CAPITAL MARKETS
(a) Monetary Policy and LiquidityManagement
4.1 The primary objective of monetary policy inBotswana is to foster stability in the value of thePula by maintaining a low and predictableinflation. Low and stable inflation, among others,is necessary for the maintenance of exportcompetitiveness. In 2004, the Bank set andannounced in its Monetary Policy Statement aninflation objective of 4 – 7 percent, a moderatechange from the 4 – 6 percent inflation objectivefor 2003. The widening of the range in 2004 wasintended to accommodate the anticipatedincrease in inflation arising from the devaluationof the Pula in February 2004, but was based asbefore on the forecast inflation for tradingpartner countries, which provided the lower endof the range. Moreover, the wider rangepermitted a general return to stable low inflationwithout placing undue strain on the growth ofoutput and employment by not attempting tocounter the full inflationary fallout of thedevaluation in too short a period of time.
4.2 The devaluation of the Pula and a series ofupward adjustments in administered pricesgenerated a rise in inflation during 2004.Consequently, while inflation was within theobjective range of 4–7 percent for most of theyear, it exceeded and remained above the upperlimit of the range in the fourth quarter. Domesticdemand pressures were, however, moderatepartly due to a lower rate of fiscal expansion
16 Anglo American sold all its shares in BCL to Lion Ore in2002. The transaction entailed payment of accrued debtservice obligations as well as transfer of BCL’s liabilitiesto Anglo American to the Botswana Government. Thishas led to a decline in the dominance of mining sector intotal FDI liabilities.

65
THE BOTSWANA ECONOMY IN 2004
Foreign direct Investment Other InvestmentIndustry Equity Non Equity1 Total Equity Non equity TotalMining 3 672 1 551 5 223 18 1 598 1 711Manufacturing 131 164 295 3 0 3Finance 718 155 873 43 149 192Retail and Wholesale 779 47 826 189 189Electricity, Gas and Water 27 0 27 200 200Real Estate and Business Services 91 3 94 2 75 77Transport, Storage andCommunication
48 106 154 34 34
Construction 1 9 10 2 831 833Hospitality 134 5 154 0 0Public Administration 2 193 2 193Other 1 0 1 1 1Total 5 602 2 041 7 643 68 5 270 5 338
TABLE 1.5: LEVELS OF FOREIGN INVESTMENT IN BOTSWANA BY INDUSTRY (P MILLION AS AT 31 DECEMBER 2003)
1. This covers the borrowing and lending of funds, including debt securities and suppliers’ credits, between parent companiesand their subsidiaries.
Source: Bank of Botswana
Foreign direct Investment Other InvestmentCountry Equity Non Equity Total Equity Non equity TotalNorth and Central America 38 1 39 88 88
of whichUnited States of America 18 … 18 … 88 88
Europe 4 205 172 4 380 2 1 164 1 166of whichUnited Kingdom 516 21 537 … 831 831Netherlands 31 4 34 … … …Luxembourg 3 595 14 3 609 … … …Other Europe 65 29 94 2 60 62
Asia Pacific … … … … 542 542Africa 1 269 1 866 3 135 63 1 736 1 799
of whichSouth Africa 1 224 1 830 3 054 60 1 663 1 723
Middle East 87 … 87 … 57 57Other 1 2 3 3 1 683 1 686Total 5 602 2 041 7 643 68 5 270 5 338
TABLE 1.6: LEVELS OF FOREIGN INVESTMENT IN BOTSWANA BY COUNTRY (P MILLION AS AT 31 DECEMBER 2003)
Source: Bank of Botswana
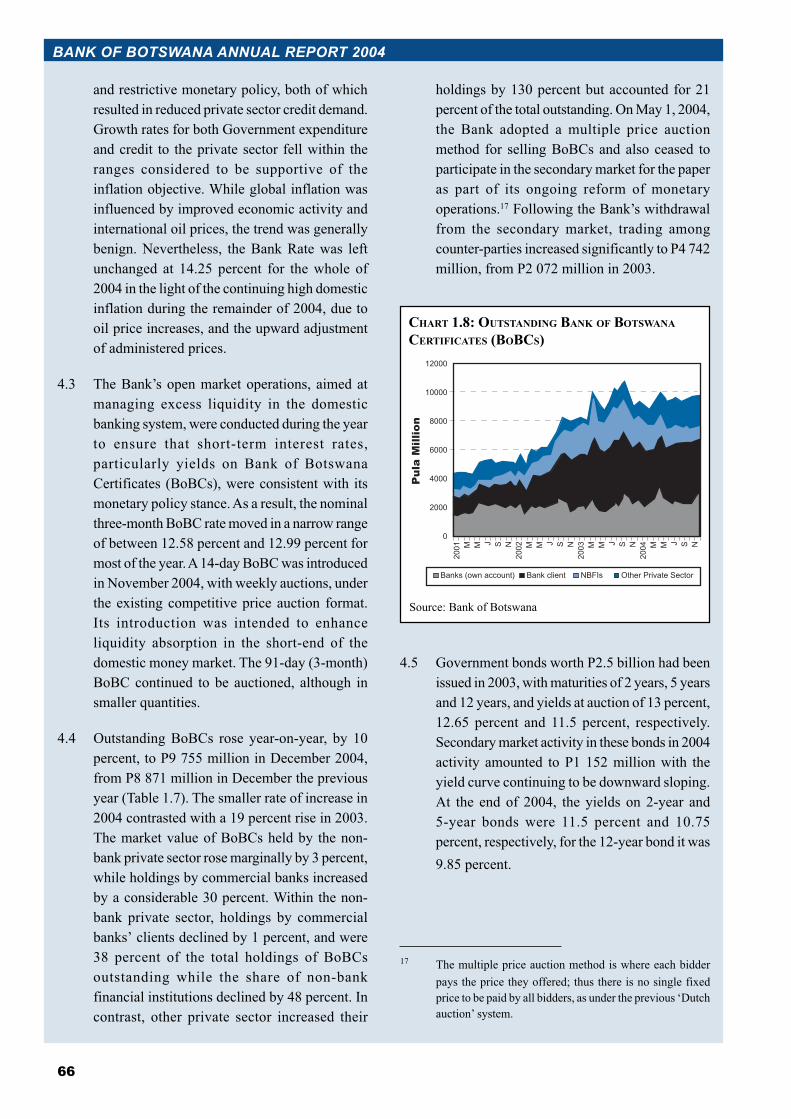
66
BANK OF BOTSWANA ANNUAL REPORT 2004
and restrictive monetary policy, both of whichresulted in reduced private sector credit demand.Growth rates for both Government expenditureand credit to the private sector fell within theranges considered to be supportive of theinflation objective. While global inflation wasinfluenced by improved economic activity andinternational oil prices, the trend was generallybenign. Nevertheless, the Bank Rate was leftunchanged at 14.25 percent for the whole of2004 in the light of the continuing high domesticinflation during the remainder of 2004, due tooil price increases, and the upward adjustmentof administered prices.
4.3 The Bank’s open market operations, aimed atmanaging excess liquidity in the domesticbanking system, were conducted during the yearto ensure that short-term interest rates,particularly yields on Bank of BotswanaCertificates (BoBCs), were consistent with itsmonetary policy stance. As a result, the nominalthree-month BoBC rate moved in a narrow rangeof between 12.58 percent and 12.99 percent formost of the year. A 14-day BoBC was introducedin November 2004, with weekly auctions, underthe existing competitive price auction format.Its introduction was intended to enhanceliquidity absorption in the short-end of thedomestic money market. The 91-day (3-month)BoBC continued to be auctioned, although insmaller quantities.
4.4 Outstanding BoBCs rose year-on-year, by 10percent, to P9 755 million in December 2004,from P8 871 million in December the previousyear (Table 1.7). The smaller rate of increase in2004 contrasted with a 19 percent rise in 2003.The market value of BoBCs held by the non-bank private sector rose marginally by 3 percent,while holdings by commercial banks increasedby a considerable 30 percent. Within the non-bank private sector, holdings by commercialbanks’ clients declined by 1 percent, and were38 percent of the total holdings of BoBCsoutstanding while the share of non-bankfinancial institutions declined by 48 percent. Incontrast, other private sector increased their
holdings by 130 percent but accounted for 21percent of the total outstanding. On May 1, 2004,the Bank adopted a multiple price auctionmethod for selling BoBCs and also ceased toparticipate in the secondary market for the paperas part of its ongoing reform of monetaryoperations.17 Following the Bank’s withdrawalfrom the secondary market, trading amongcounter-parties increased significantly to P4 742million, from P2 072 million in 2003.
4.5 Government bonds worth P2.5 billion had beenissued in 2003, with maturities of 2 years, 5 yearsand 12 years, and yields at auction of 13 percent,12.65 percent and 11.5 percent, respectively.Secondary market activity in these bonds in 2004activity amounted to P1 152 million with theyield curve continuing to be downward sloping.At the end of 2004, the yields on 2-year and5-year bonds were 11.5 percent and 10.75percent, respectively, for the 12-year bond it was9.85 percent.
17 The multiple price auction method is where each bidderpays the price they offered; thus there is no single fixedprice to be paid by all bidders, as under the previous ‘Dutchauction’ system.
CHART 1.8: OUTSTANDING BANK OF BOTSWANACERTIFICATES (BOBCS)
Source: Bank of Botswana
Pula Million
2001 M M J S N
2002 M M J S N
2003 M M J S N
2004 M M J S N
12000
10000
8000
6000
4000
2000
0
Banks (own account) NBFIsBank client Other Private Sector

67
THE BOTSWANA ECONOMY IN 2004
(b) Interest Rates4.6 Short-term nominal interest rates were relatively
stable during 2004, consistent with theunchanged Bank Rate of 14.25 percent the wholeyear. The nominal three-month BoBC ratefluctuated in a range of 12.50 percent and 12.99
percent between January and December 2004,with lower rates occurring in the first quarter ofthe year. Commercial banks held the cost ofborrowing constant by maintaining the prime-lending rate at 15.75 percent during the year,while the average 88-day deposit rate was mostlysteady around 9.17–9.20 band. As a result, thespread between lending rates and deposit ratesincreased marginally, with a slight fall in depositrates while the prime lending rate remainedstable.
4.7 Money market real interest rates were less volatileduring 2004. The twelve-month average was 5.5percent compared to 4.1 percent in 2003. Thiswas a result of the generally stable inflation andthe fact that the Bank Rate was unchanged duringmost of the year. The real three-month BoBC rateranged between 4.4 percent and 6.1 percent. Asat the end of December 2004, the real commercialbank prime lending rate was 7.4 percent,compared to 8.8 percent in December 2003.
P millionYear on yearpercentage Share of total (percent)
2003 2004 change 2003 2004Commercial Banks 2 288.5 29 84.8 30.4 25.8 30.6Banks' Clients 3 758.8 37 13.8 –1.2 42.4 38.1Other Financial Institutions 1 933.7 10 15.3 –47.5 21.8 10.4Other Private Sector 889.5 20 41.3 129.5 10.0 20.9Total 8 870.5 97 55.2 10
TABLE 1.7: STRUCTURE OF BANK OF BOTSWANA CERTIFICATE HOLDINGS
Source: Bank of Botswana
Instrument End of2003 March June September December
3-Month BoBCs at auction date 12.74 12.92 12.99 12.99 12.53BW001 (2 years) 10.25 10.3 11.75 11.35 11.50BW002 (5 years) 9.50 9.75 10.75 10.75 10.75BW003 (12 years) 9.90 9.65 10.75 10.00 9.85
TABLE 1.8: NOMINAL YIELDS TO MATURITY ON BOBCS AND GOVERNMENT BONDS (PERCENT)
Source: Bank of Botswana
CHART 1.9: YIELD TO MATURITY ON BOBCS ANDGOVERNMENT BONDS
Source: Bank of Botswana
3M BoBC
Percent
14
13
12
11
10
9
82-Year (BW 001) 5-Year (BW 002) 12-Year (BW 003)
Dec-04 Dec-03Sep-04Jun-04
Percent

68
BANK OF BOTSWANA ANNUAL REPORT 2004
(c) Banking System
(i) Domestic Credit4.8 The annual growth rate of commercial bank
credit decelerated from 14.2 percent inDecember 2003 to 11.8 percent in December2004.18 The decrease in the annual credit growthrate was mainly due to a much lower rate ofincrease in private business borrowing of 0.2percent in 2004, compared to 14.2 percent in2003, while household borrowing rose at a fasterrate of 18.6 percent. The slowing growth in creditto businesses since 2003, to a significant extent,reflects the reduction in Governmentexpenditure, particularly on developmentprojects upon which business activityconsiderably hinges. Overall, the rate of creditexpansion of 11.8 percent in December 2004 was
below the range of 12–15 percent, and consistentwith the desired inflation objective.
(ii) Monetary Aggregates4.9 Broad money supply (M4) rose by 10.9 percent
(year-on-year) in 2004 compared to growth of13.8 percent in 2003. The influences on monetarygrowth during the year was the expansionaryeffect of the 10.6 percent reduction in Governmentdeposits at the Bank of Botswana, the 11.8 percentrise in private sector credit and the 1.1 percentrise in net foreign assets. By component, theincrease in M4 was a result of a 3.2 percentincrease in non-bank holdings of BoBCs, and an8.3 percent expansion in call, savings, notice andtime deposits. Demand deposits also increased by54.6 percent compared to 10.2 percent during thesame period in the previous year, while foreigncurrency deposits in Pula terms increased by 7.3percent in 2004 primarily due to the continuedappreciation of the Pula against majorinternational currencies, despite its earlierdepreciation. Currency outside banks grew by19.5 percent in 2004, compared to an increase of13.4 percent in 2003.
18 The growth rate was computed after an adjustment to takeinto account the merger, in April 2004, of Stanbic bankwith Investec bank, which led to the loans by the latterbeing reclassified from merchant to the commercial bankcategory.
CHART 1.10: REAL INTEREST RATES:INTERNATIONAL COMPARISONS
Source: Bank of Botswana
CHART 1.11: ANNUAL GROWTH RATES OF CREDIT
Source: Bank of Botswana
Percent
2001 Apr Jul
Oct
2002 Apr Jul
Oct
2003 Apr Jul
Oct
2004 Apr Jul
Oct
8
7
6
5
4
3
2
1
0
-1
-2
-3
SA (core) BotswanaUK USA

69
THE BOTSWANA ECONOMY IN 2004
(iii) Bank of Botswana4.10 Total assets/liabilities of the Bank of Botswana
increased by 2 percent to P24 493 million in2004, following decreases of 20.3 percent and13.3 percent in 2003 and 2002, respectively. Thedecline in the balance sheet in 2002 and 2003was mainly attributable to reductions ingovernment deposits at the Bank of Botswanadue to the transfer of funds to the Public OfficersPension Fund, as well as unrealised currencyrevaluation losses and foreign exchangeoutflows. In 2004 the foreign exchange reservesincreased by 0.6 percent, of which the long-terminvestment portfolio, the Pula Fund, increasedby 4 percent during the year, compared to the21.4 percent decline of 2003. On the other hand,the Liquidity Portfolio fell by 5.6 percentcompared to a 19.5 percent fall of 2003.
(iv) Commercial Banks4.11 Total assets of commercial banks rose by 14.5
percent to P14 842 million in the year toDecember 2004, compared to moderately highergrowth of 15.9 percent in 2003. Contributing tothe increase in total assets were outstanding loansand advances as well as holdings of BoBCs,which expanded by 16.7 percent and 25.4percent, respectively, in 2004.
4.12 On the liabilities side, total private sectordeposits at commercial banks increased by 9.8percent to P11 443 million, in the year toDecember 2004, compared to a growth rate of17.9 percent in 2003. Of the total deposits, 12.3percent was held in foreign currency accountscompared to 14.6 percent in 2003. In the sameperiod, commercial banks’ capital and reservesincreased moderately by 3.7 percent to P1 395million in 2004, compared to a growth rate of22.1 percent in 2003.
(v) Merchant Banks4.13 Total assets/liabilities are exclusively for ABC
(Pty) Ltd, following the takeover of the onlyother merchant bank, Investec Bank by StanbicBank in April 2004. As a result, total assets/
liabilities for merchant banks decreased by 31.1percent during 2004, to P735 million, comparedto an increase of 26 percent in 2003. Thetakeover led to a reduction in all components ofthe assets for this category of institutions.Balances due from domestic banks and loans andadvances recorded sharp decreases of 58 percentand 31 percent, from P143.7 million to P60.2million, and from P503.9 million to P350.1million, respectively. The merchant bank’sholdings of BoBCs also dipped by 17 percent in2004, compared to 35 percent in 2003. Withrespect to liabilities, total deposits, mostly heldin notice and time accounts, decreased by 35.2percent, from P870.6 million in 2003 to P563.9million in 2004 also reflecting the takeover ofInvestec bank.
(d) Non-Bank Financial Institutions4.14 The total assets/liabilities of the Botswana
Building Society (BBS) rose by 13.8 percent in2003, compared to the 7.9 percent recorded in2002. Mortgage loans increased substantially, by25.6 percent to P450 million, from an increaseof 7.2 percent in the previous year. The BotswanaDevelopment Corporation (BDC) increased itsassets by 34.4 percent in the year to June 2004to P1 539 million, in contrast to a growth rate of5 percent in June 2003.
4.15 Trading on the Botswana Stock Exchange (BSE)was less active in 2004 than in the previous year.The domestic company share index generallyexperienced an upward trend, gaining 390 points(15.6 percent) to end the year at 2 889. Marketcapitalization also grew, by 15.2 percent, to reachP10 876 million in December 2004. On the otherhand, the increase in the foreign companies indexslowed to a rise of 11.9 percent, from 13.5percent in the previous year. Trading value fellsubstantially in 2004 to settle at P203 million,from P400 million in 2003.
4.16 The number of domestic companies listed on theBSE dropped to 18 by December 2004, from 19in 2003. Domestic companies listed on theVenture Capital Board of the BSE are Turnstar

70
BANK OF BOTSWANA ANNUAL REPORT 2004
and Afrotourism limited. Two more foreigncompanies, AFDiamonds and Diamonex, werelisted on the Venture Capital Board bringing theirnumber to 3 in 2004. While these are technicallyforeign companies, given that their primarylistings are in London and Australia, theirbusiness activities are located in Botswana. Thebond market was very active in 2004, achievinga record of 15 new corporate bond listings withmaturities ranging between 1 and 20 years. TheDebt Participation Capital Funding (DPCF)Limited, a special purpose investment companyestablished in March 2004 to purchase fromGovernment the Public Service Debt Fund(PDSF) loan book made 7 new listings. BDCand Kgalagadi Breweries Limited (KBL) alsolisted one bond each for the first time while therest were additional listings from commercialbanks and the BBS.
(e) Credit Rating4.17 Moody’s Investors Service and Standard and
Poor’s Sovereigns conducted the annual creditrating assessments of Botswana’screditworthiness in 2004. Moody’s InvestorsService sovereign credit ratings for Botswanaas assigned in 2001, A2 for long term foreigncurrency debt, Prime-1(P-1) for short termforeign currency debt and A1 for domesticcurrency debt and stable outlook remainedunchanged. Standard and Poor’s Sovereignsassigned Botswana ratings of A/A-1 for long-term debt and A+/A-1 for short-term debt aswell as a stable outlook. The investment-graderatings for Botswana reflect the unusually lowpublic debt and very strong liquidity, whichderive from a commitment to prudent fiscal andmonetary policy. However, concern wasexpressed at the spending pressures exerted onthe Government by costs related to HIV/AIDScare and treatment, as well as absence of strongevidence of active diversification efforts asindicated by lack of significant expansion inthe non-mining sector.
(f) Other Financial Sector Developments4.18 During 2004, the Bank achieved considerable
progress in the reform and modernisation of theNational Payments System (NPS) programme.The most significant improvements included:
(a) full automation of cheque clearing housethrough establishment of the ElectronicClearing House (ECH);
(b) ‘Paper-to-Follow’ (which refers to asituation where electronic data is exchangedand used as the basis for clearing, while thepaper pertaining to the electronic data isexchanged at a later date) was successfullyimplemented as part of the electronic codeline clearing initiative;
(c) finalisation of the National Clearance andSettlement Systems (NCSS) ActRegulations;
(d) initiation of preparations for a significantincrease in Government’s utilisation of theElectronic Funds Transfer (EFT) system inrespect of Government payments other thancivil servants’ salaries;
(e) undertaking of logistical arrangements forthe implementation of the Real Time GrossSettlement (RTGS) system. The system willaddress the processing, transmission andsettlement of high-value, time-criticalpayments while also providing an interfaceto the ECH and Bank of Botswana’selectronic banking systems.
4.19 The International Financial Services Centre (IFSC)Certification Committee considered and approvedeleven project proposals, which were referred tothe Bank for regulatory approval in 2004. Out ofthe eleven companies, nine were granted anexemption certificate while one, EnterpriseBanking Group (Pty) Ltd obtained a bankinglicence, and the approvals brought the number ofcompanies operating in the IFSC to 30.
4.20 During 2004, the Letlole National Savings

71
THE BOTSWANA ECONOMY IN 2004
Certificates (LNSCs) registered a decline insales. The value of all purchases was P0.8 millionduring 2004 compared to P1 million sold in2003. On the other hand, redemptions for theyear amounted to P0.9 million, against P0.7million in the previous year. As a result, the netoutstanding NSCs fell by P0.1 million comparedto P0.3 million in 2003.
4.21 Banks continued to introduce new bankingproducts in response to market competition andefforts to improve service delivery. The numberof ATMs installed increased by 3.9 percent, butthere were no additional branches opened. Thebanks continued to invest in new technologiesin order to improve their efficiency and serviceto their clients. The new technologies included‘cheque imaging’, through which customersreceive statements with images of the chequesthey have issued and a messaging service thatallows customers to monitor transactions goingthrough their accounts as the transactions gothrough. The main advantage of the latter, whichuses the text message feature of cellular phonetechnology and e-mail as media ofcommunication, is that it enables customers toprevent and report any unauthorized transactionsimmediately.

Blank page 72

73
CHAPTER 2IMPROVED PRODUCTIVITY – THE KEY TO SUSTAINED GROWTH AND
HIGHER LIVING STANDARDS FOR ALL
1.4 Major economic policy decisions cannot bedivorced from consideration of productivityenhancement. For example, there are two areasthat are of direct interest to the Bank ofBotswana. First, monetary policy and theobjective of low and stable inflation.Productivity growth affects the potential outputof the economy and, in turn, the rate at whichthe economy can expand without causinginflationary pressures at a given rate ofexpenditure increase. The positive feedback ofa benign inflationary environment includes areduction in investment risks associated withhigh inflation, a possible rise in investment andincrease in productivity. The second issue is theexchange rate. There have been suggestions thata devaluation of the Pula is necessary to improvethe competitiveness of the country’s producers.However, it should be noted that the argumentsin favour of a Pula devaluation imply anadmission that productivity in Botswana is nothigh enough to justify the domestic costs ofproduction (wages, rentals, etc). Therefore, inthe absence of enhanced productivity, adevaluation is likely to offer only a temporaryrespite and soon, subsequent knock-on effectswill lead to production cost readjustmentstowards their original, uncompetitive levels. Itis for this reason that the Bank has argued2 thatif the fundamental cause of the lack of exportcompetitiveness is low productivity, then policyresponse should focus on the fundamental issuesof productivity growth and the adjustment of the
1. INTRODUCTION1.1 The theme topic of the 2004 Bank of Botswana
Annual Report is ‘Improved Productivity – theKey to Sustained Growth and Higher LivingStandards for All’. The choice of this topic ismotivated by the importance of continuedincreases in productivity to underpin economicgrowth.
1.2 The importance of rising productivity has beenrecognised in major economic policy objectivesof the Botswana government. In particular, thesecond pillar of Vision 2016 is ‘A prosperous,productive and innovative nation’, an objectivewhich is being implemented in the developmentstrategies set out in National Development Plan9 (NDP 9). Official policy documents frequentlyrefer to the need to improve productivity in thepublic service, the importance of skillsdevelopment, the use of science and technologyin production and the adverse impact of HIV/AIDS on productivity. The establishment of theBotswana National Productivity Centre (BNPC),more than a decade ago, was in recognition ofthe critical role of productivity in promoting bothoutput growth and international competitiveness.
1.3 A very significant dimension of productivityenhancement is its contribution to the nationaleconomic diversification efforts. However, assubsequent sections of this chapter illustrate, thereis little compelling evidence that the productivity-enhancing policy pronouncements and initiativeshave been translated into noticeableimprovements in productivity. While economicgrowth has been maintained, with accompanyingincreases in per capita incomes, it appears thatthis has been mainly through an increase inproduction inputs, rather than their more efficientuse. Efficient use of factors of production acrosssectors appears to be hampered by a number ofstructural rigidities in the economy.1
1 Generally, however, there is a lack of relevant data toinvestigate sectoral trends in detail.
2 See the press release ‘BIDPA Commentary on ExchangeRate Policy’, 16 September 2003. Here it was stated that‘…it will be up to other policy measures [i.e. other thanthe exchange rate policy], such as those to improveproductivity, to ensure that Botswana’s internationalcompetitiveness improves.’
74
BANK OF BOTSWANA ANNUAL REPORT 2004
exchange rate should only be resorted to only incertain circumstances in combination with othercomplementary policies.
1.5 Vision 2016 is explicit that the achievement ofits agenda requires the introduction of ‘a newculture of hard work and discipline’ (page 6). Italso recognises that the new culture will also beone in which ‘effort is rewarded and thenecessary skills are available’, and if theseconditions are not currently met then it wouldnot be surprising if productivity suffers. In thisregard, it is important to recognise thatproductivity is frequently low because ofconstraints that it may not be possible to removeat the level of the individual. More often thannot, addressing productivity constraints is apolicy issue, not least because these constraintsare often the unintended consequences of otherpolicies and regulations. For instance, among themost obvious constraints to production are thosethat impede the smooth functioning of the labourmarket, although their effects may besignificantly offset by improving theproductivity of other inputs to production,including both land and capital. There is alsothe question of the appropriate balance betweengovernment and the private sector where thereis a risk that, through endeavouring to providequality services, the government starts tocompete for the very resources that the privatesector needs to use such services to the bestadvantage.
1.6 Nevertheless, there is a role for individuals inproductivity improvement. In fact, the potentialbenefits of various initiatives to improveproductivity can only be realised if the challengeis accepted by all concerned and reflected inadopting positive attitudes to making tangibleimprovements at the work place by staff at alllevels in an organisation. The need for improvedindividual work performance is perhaps mostcrucial within government itself and associatedinstitutions where efficiency is less easy tomeasure against a financial yardstick. However,it also applies to the private sector, whichfrequently seems to deal with problems of
inefficiency by calling for ever-increasing levelsof support from government.
1.7 The importance of worker efficiency isparticularly important for Botswana for thereason that the country’s main resource is itsworkforce. Whereas it is often the case that inother economies investors may be attracted bythe size of the market or reserves of untappednatural resources, the situation is significantlydifferent in Botswana, where potential investorswould tend to be attracted by the quality of thecountry’s man-made resources: the institutions,the infrastructure and the labour force.
1.8 Improved productivity is closely associated withtechnological progress. As will be demonstratedin the next section, sustained productivity growthis only feasible in the context of continuingadvances in technological innovation throughadoption of new organisational processes,adaptation of new technologies of productionand use of new equipment. However, it is worthstressing from the outset that emphasis ontechnological progress does not imply a narrowfocus on support for the development andadoption of the most advanced technologies.Sometimes this may be what is called for, andthere are certain instances when less developedeconomies can adopt the newest technologies.It is, nevertheless, equally the case thatinvestment in these technologies is frequentlyboth expensive and risky, while much can beachieved through a range of more modestadaptations together with the necessaryaccompanying changes to work processes.
1.9 While the importance of productivity forimproving economic performance may begenerally accepted, the linkage with moregeneral welfare issues is much less wellunderstood and more controversial. If theemphasis of economic policy is to bothencourage productivity increases and allocaterewards accordingly, it follows that those who,for one reason or another, are unable to raisetheir productivity will benefit less. Therefore, itis up to those who argue for primacy to be given

75
IMPROVED PRODUCTIVITY – THE KEY TO SUSTAINED GROWTH AND HIGHER LIVING STANDARDS FOR ALL
to the goal of economic efficiency to provide aconvincing answer to the question of how thisobjective would translate into an improvementin the living standards for all.
1.10 To address these issues, the next section presentsthe analytical and theoretical link betweengrowth in productivity and technologicalprogress. This is followed by an examination ofrecent productivity trends in Botswana, acommentary on selected important policyconcerns that may have a bearing on productivitylevels, and an assessment of the extent to whichan efficient economy is best placed to provideimproved living standards across the population.
2. PRODUCTIVITY AND ECONOMICGROWTH
2.1 ‘Economic growth’ refers to the expansion ofoutput of goods and services, and theaccompanying increases in income andexpenditure. The achievement of economicgrowth is a major objective of economic policy,as it is the foundation for improvements in thewelfare of individuals. An understanding of thecircumstances within which this objective canbe achieved is, therefore, a major concern forpolicy makers, and a source of considerabledebate. While avoiding the more technicaldetails, this section outlines a basic analyticalframework that identifies the key theoreticalreasons for the close relationship betweengrowth, productivity and technologicaldevelopment.
2.2 The most basic measure of productivity is labourproductivity (PL). This is output (Y) divided bythe total input of labour3 (L):
PL = Y/L (1)This relationship can be reformulated to
demonstrate that total output (Y) depends onlabour productivity (PL) and total labour input(L):
Y = L x PL (2)From this formulation it can be demonstratedthat output changes as a result of either variationsin an input or productivity from that input. Italso points to a common misconception, whichis that productivity refers to working harder. Thismay be the case in respect of some productivitymeasures but, fundamentally, productivity ishigher if more output is produced for the samelevel of input and vice versa. In the context ofequation (2), working harder refers to an increasein labour input rather than productivity. Thisdistinction is important because while there isclearly a limit on how much extra work can bedone, it is always possible to work moreeffectively.
2.3 Another implication of this framework is thatthere is a clear connection between labourproductivity and living standards. If Y is theoutput of the whole economy or national income,usually measured by gross domestic product(GDP), and L is taken as the total population,then in equation (1) labour productivity is theequivalent of per capita income, i.e., GDP percapita, which is a standard welfare indicator.Increases in labour productivity (PL) can resultfrom a combination of four distinct sources:
(a) labour itself becomes more efficient (itsquality improves);
(b) the supply of other inputs to production(including supplies of land, and capital, theother basic factors of production) increasein quantity;
(c) the supply of non-labour inputs toproduction increase in quality; or
(d) there are improvements in the way theexisting quantum and quality of inputs worktogether.
While increasing the supply of other factors, (b)
3 The most standard measure of L is in terms of hours worked,but this can vary depending on the context of the calculationand the availability of usable data. Other possible measuresinclude the number of people employed, the total labourforce or, even, the entire population.

76
BANK OF BOTSWANA ANNUAL REPORT 2004
above, (referred to as ‘deepening’ of thesefactors) in relation to a fixed quantum and qualityof labour can boost labour productivity, theextent of the improvement is limited as there isonly so much additional land or machinery thata fixed amount of labour can use. Beyond acertain level of additional non-labour inputs tothe production process, each incremental unit ofthe inputs produces less output per unit than theprevious dosage, a phenomenon known as thelaw of diminishing returns. Nevertheless, ingeneral, sustained increases in output per unitof labour are ultimately from technologicalprogress, either in labour itself (a), other factorsof production (c), or how they are combined (d),which is also known as total (or multi) factorproductivity (TFP).
Proximate and Fundamental Sourcesof Output Growth
2.4 There is a general agreement that technologicalprogress is the basis for production growth,particularly that it is through the improvementsin technology – either development of betterequipment or processes of production – thatsustainable output expansion is achieved. Thiscausal relationship is easily discerned from thehistory of economic development, whichindicates that productivity booms have typicallybeen associated with the emergence of prominentnew technologies. Most recently, productionincreases have benefited from a new generationof information and communications technology(ICT) while earlier examples include thetelegraph (sometimes described as the ‘VictorianInternet’) which was later followed by thetelephone, the steam engines that brought aboutrailway transport, electricity as a source ofpower, mass produced synthetic rubber andplastic, the transistor (and later the microchip),the internal combustion and jet engines.
2.5 There are, nevertheless, significant differencesof opinion regarding the specific factors thathave been important in promoting productivityover time. The allocation of observed increasesin output among the potential sources of growth
listed above and, in particular, betweenproductivity of the various inputs and TFP isknown as growth accounting and is far fromstraightforward, due especially to dificulties withusing the available data which are often eitherunreliable or difficult to match with the requiredcategories. Problems arise especially in respectof inter-country comparisons, which is a typicalobjective of productivity calculations, as thisfurther increases data problems. The next sectionof this chapter includes a growth accountingexercise using Botswana data, which alsoillustrates some of the technical problemsindicated.
2.6 Even without data difficulties, growthaccounting only identifies the proximate ratherthan the fundamental causes of growth;consequently, it is not possible to ascertain howgrowth is attributable to larger quantities ofinputs and factors that directly influence theirproductivity. This implies the need to explainthe conditions under which the changes inproductivity of the various factors have occurredand, in particular, the role of policy and socio-economic institutions in promoting growth. Intrying to answer these questions, considerableresearch has been undertaken, but littleconsensus has emerged that can act as a guideto policy makers.4
The Role of Capital Accumulation2.7 The simplest model of growth focuses on the
role of physical capital (K); i.e. buildings,machinery and equipment) as the other maininput in the production process apart fromlabour:
Y = f(L, K) (3)The model also allows for augmentation of
4 For a more detailed review of this field, which emphasisesthe extent to which there remain wide areas of disagreementsee, for example, Easterly, W. (2002) The Elusive Questfor Growth: Economists Adventures and Misadventures inthe Tropics.

77
IMPROVED PRODUCTIVITY – THE KEY TO SUSTAINED GROWTH AND HIGHER LIVING STANDARDS FOR ALL
labour with additional human capital, whichrefers to increased skills in the labour force andis generally associated with improved levels ofeducation and training.
2.8 With this focus on capital accumulation (eitherphysical or human) as the source of growth, theconsequent policy emphasis in this model is onthe need for investment in such capital: i.e.building up the capital stock. It is readilyapparent how this approach has underpinnedmajor thrusts of policy in Botswana. The designof the development budget, in the context of thegovernment’s investment programme, is centralto the six-year national development plans(NDPs) within which, in principle at least,mineral revenues are reserved for investmentpurposes. Consistent with the need to boostinvestment, there have been high levels of publicspending on education and training; and, morerecently, growth targets of Vision 2016 areexplicitly linked to a need for sustained highlevels of investment, estimated at ‘about 41percent of gross domestic product’.5
2.9 There is little doubt that such an emphasis oninvestment can provide a good basis foreconomic growth. Advanced economiesinvariably have a high capital to output ratio,and it has been argued that the rapid advancesof the ‘tiger’ economies of south-east Asia werebased mainly on exceptional rates of investmentrather than improving the quality of capital orincreasing productivity. However, most studiesindicate that capital accumulation is not by itselfable to account for much of the growth in manycountries. This is especially true in respect offactors that determine rapid growth rates. Forexample, Tahari et al (2004) argue that slowgrowth in Africa is in large part due to it beingtoo much driven by capital accumulation and thatcountries aspiring to higher growth rates (whichis what is relevant to Botswana) should givemore emphasis to investing in better qualitycapital, improvements in productivity and
effective utilisation of productive capacity.6
2.10 There may also be an important distinction to bedrawn between investment by governments andthe private sector. This is a potentially importantdistinction, given the differing roles and objectivesbetween the public and private sectors. There maybe some presumption that, compared togovernment, private sector investment is moredirectly focused on achieving tangible returns andthat such investment is more likely to result ingrowth of productivity and output. Artadi andSala-i-Martin (2003; see footnote 33) emphasisethe potential inefficiencies of governmentspending and its frequent predominance innational investment as a potential explanation oflow growth rates in Africa.
2.11 However, it is also not always easy todemonstrate a strong connection between privateinvestment and higher growth. One possibilitymay be that in the earlier stages of development,economies need a push forward in capitalaccumulation that is independent of potentialfinancial returns and that government is thebetter vehicle for attaining the objective. Sucharguments have certainly been applied in relationto Botswana. Another reason is that privateinvestment is not a sufficient condition forgrowth if the broader set of conditions in theeconomy are not supportive of productivityincreases; in particular, if market incentives aredistorted to an extent that the link betweenfinancial rewards and efficiency and productivityis broken.7 The importance of the institutionalenvironment in influencing productivity andgrowth is discussed further below.
2.12 As for human capital, it is clear that enhancedskill levels play a crucial role in improvinglabour productivity, especially in ensuring the
5 Vision 2016, page 7.
6 Tahari A. et al, (2004) Sources of Growth in Sub-SaharanAfrica IMF Working Paper 04/176.
7 For instance, if the cost of capital is held down throughartificially low interest rates and/or subsidies, investmentmay be plentiful but it is perhaps not surprising that it oftenyields a correspondingly low return.

78
BANK OF BOTSWANA ANNUAL REPORT 2004
effective adoption and use of new technologies.8However, identifying an appropriate measure ismore problematic. Researchers have mostlyfocused on the volume of formal education as ameasure of investment in human capital withincreases identified by growth in the numbersreceiving higher education (i.e. secondaryschooling and beyond). Unfortunately, thevolume per se does not throw light on the qualityof education, its relevance in acquiring work-related skills or the contribution from other, non-formal sources of learning. This dimension ofhuman capital is important, as there areindications that such factors may have a greaterimpact on growth and productivity than simplyincreasing the total quantity of education (seefor example Barro, 2001).9
There is also the question of broader conditions,such as the prospects of worthwhile jobs thatprovide incentives to acquire knowledge and inturn affect the return on investing in education.
2.13 The health of the labour force is an importantcomponent of human capital. The impact of highrates of HIV/AIDS infection is a dramaticexample of how the benefits of education andskills training are quickly eroded if a substantialpart of the labour force is either sick or theirefforts are diverted into caring for others.
2.14 The impact of improvements to productivity thatare not picked up in the data on capitalaccumulation can be measured through anaugmented version of the previous equation (3):
Y =Af(L, K) (4)
In equation (4) A is usually interpreted as aproductivity index and used as a measure of TFP.As will be seen in the next section, such aninterpretation can be useful. But it should berecognized that A is not directly measured but aresidual (i.e. the part of income (Y) that is not
explained by labour input (L) and Capital (K))and, as such, includes the various measurementerrors that can arise.10
2.15 Moreover, even if such errors are properly takeninto account the interpretation of the productivityindex (A) remains highly problematic. Manysuggestions have been made as to the crucialelements that result in, or undermine, economicconditions that promote high levels of and rapidgrowth in productivity. Some are brieflyreviewed below, including some of the importantresults from the relevant research.
Research and Development,Innovation and Growth
2.16 Given the general agreement that technologicalprogress is one of the basic determinants ofsustained productivity, it follows that significantresearch has aimed at a more detailedunderstanding of the causal relationshipinvolved. Progress towards ‘knowledge-based’economies is monitored carefully (see, forexample the Organisation for EconomicCooperation and Development’s (OECD)‘Science, Technology and Industry Scorecard’)11and there are widespread, even if not always wellfounded, concerns among developing countriesthat they will get left behind by the emergenceof an ever-widening ‘digital divide’ that istending to worsen the gap between the rich andpoor countries. The most recent country-specificHuman Development Report for Botswanaprepared by the United Nations DevelopmentProgramme (UNDP) focuses on factors thatinfluence success in harnessing science andtechnology; and it has also been indicated thatthis will be the focus at the planned seconduniversity. The country’s commitment to scienceand technology is spearheaded by the Ministryof Communications, Science and Technology,which was created in 2002, while other
8 Conversely, the choice of technology should take properaccount of the skills that are available in the labour force.
9 Barro, R. J. (2001) ‘Human Capital and Growth’ AmericanEconomic Review – Papers and Proceedings.
10 As a simple example, if the measures of K and L have notbeen adequately adjusted for quality improvements then Awill include changes in factor specific productivity.
11 www.oecd.org
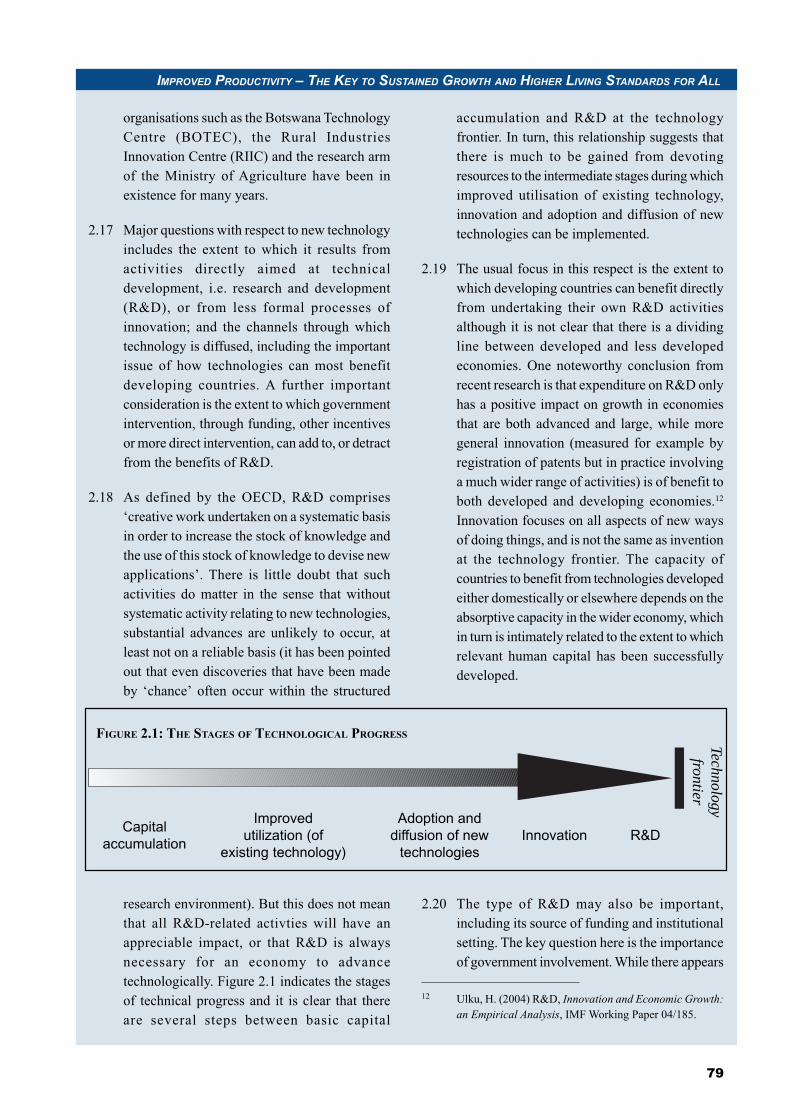
79
IMPROVED PRODUCTIVITY – THE KEY TO SUSTAINED GROWTH AND HIGHER LIVING STANDARDS FOR ALL
organisations such as the Botswana TechnologyCentre (BOTEC), the Rural IndustriesInnovation Centre (RIIC) and the research armof the Ministry of Agriculture have been inexistence for many years.
2.17 Major questions with respect to new technologyincludes the extent to which it results fromactivities directly aimed at technicaldevelopment, i.e. research and development(R&D), or from less formal processes ofinnovation; and the channels through whichtechnology is diffused, including the importantissue of how technologies can most benefitdeveloping countries. A further importantconsideration is the extent to which governmentintervention, through funding, other incentivesor more direct intervention, can add to, or detractfrom the benefits of R&D.
2.18 As defined by the OECD, R&D comprises‘creative work undertaken on a systematic basisin order to increase the stock of knowledge andthe use of this stock of knowledge to devise newapplications’. There is little doubt that suchactivities do matter in the sense that withoutsystematic activity relating to new technologies,substantial advances are unlikely to occur, atleast not on a reliable basis (it has been pointedout that even discoveries that have been madeby ‘chance’ often occur within the structured
research environment). But this does not meanthat all R&D-related activties will have anappreciable impact, or that R&D is alwaysnecessary for an economy to advancetechnologically. Figure 2.1 indicates the stagesof technical progress and it is clear that thereare several steps between basic capital
accumulation and R&D at the technologyfrontier. In turn, this relationship suggests thatthere is much to be gained from devotingresources to the intermediate stages during whichimproved utilisation of existing technology,innovation and adoption and diffusion of newtechnologies can be implemented.
2.19 The usual focus in this respect is the extent towhich developing countries can benefit directlyfrom undertaking their own R&D activitiesalthough it is not clear that there is a dividingline between developed and less developedeconomies. One noteworthy conclusion fromrecent research is that expenditure on R&D onlyhas a positive impact on growth in economiesthat are both advanced and large, while moregeneral innovation (measured for example byregistration of patents but in practice involvinga much wider range of activities) is of benefit toboth developed and developing economies.12Innovation focuses on all aspects of new waysof doing things, and is not the same as inventionat the technology frontier. The capacity ofcountries to benefit from technologies developedeither domestically or elsewhere depends on theabsorptive capacity in the wider economy, whichin turn is intimately related to the extent to whichrelevant human capital has been successfullydeveloped.
2.20 The type of R&D may also be important,including its source of funding and institutionalsetting. The key question here is the importanceof government involvement. While there appears
12 Ulku, H. (2004) R&D, Innovation and Economic Growth:an Empirical Analysis, IMF Working Paper 04/185.
Technologyfrontier
Capitalaccumulation
Improvedutilization (of
existing technology)Adoption anddiffusion of newtechnologies
Innovation R&D
FIGURE 2.1: THE STAGES OF TECHNOLOGICAL PROGRESS

80
BANK OF BOTSWANA ANNUAL REPORT 2004
to be a strong case for government support ofR&D given the likelihood of under-investmentin this area by the private sector due to theproblems caused by positive externalities,research suggests that there is little evidence thatgovernment-sponsored R&D has an appreciableimpact on economic growth in practice. Thisfinding could be due to a variety of factors,including the necessarily broader range ofobjectives pursued by governments and a biastowards more basic research in governmentfunded R&D, as opposed to productdevelopment and, therefore, more difficult torelate to measured output.13
2.21 While there may be a direct and clear linkbetween technology and economic growth (inthe sense that, as already noted, productivitybooms are typically associated with identifiabletechnological advances) the effect of specificnew technologies is very uncertain. Many R&Dinitiatives are abandoned before their practicalapplication, and even for those that, withhindsight, proved pivotal in boostingproductivity, the process of adoption anddiffusion was irregular and generally lengthy.As a general rule there is a substantial lagbetween invention and discernible gains inproductivity. As one example, it took severalyears for the recent advances in ICTs to make aclear difference to productivity levels in theadvanced economies.
2.22 Such lags may reflect a variety of factors,including the significant risks of investing inuntried techniques. But it is also likely to be dueto the fact that technologies are usually notadopted in isolation, but require complementarydevelopments in skills, production process andorganisational structures. Moreover, thecomplementary changes require furtherinvestment. According to some estimates the costof adopting new computer systems can be up to
ten times the cost of the hardware.14 Crucially,precisely because of the large uncertainties thatare involved in use of new technologies, it alsorequires a high degree of flexibility in the restof the economy to allow the requiredcomplementary developments to take placeunhindered.
Pro-Growth Economic Policies2.23 Linking growth to particular policies has obvious
attractions for direct linkages to policy advice,and has been a major focus of research atinstitutions such as the World Bank. There is ageneral consensus that bad policies are harmfulfor growth, with lists of such policies typicallyincluding high levels of government spending,fiscal deficits and public debt, very highinflation, protectionist trade policies andmisaligned exchange rates. However it is lessclear which policies are particularly harmful (ifonly because bad policies often occur togethermaking their individual effects hard todisentangle), and to recognize a policy aspotentially harmful does not imply agreementabout how and when these effects occur. Forexample, it is generally agreed that inflationshould be ‘low and stable’ to support growthpolicies, but how low remains less clear.15
2.24 One area of particular controversy is the extentto which an economy’s openness (that is to freetrade in goods and services and unhinderedfinancial flows) is good for growth, where therehas to some extent been a backlash in recentyears from the simple view that the more openis an economy the better. The most relevantconcerns relate to the question of capital flowswhere moving quickly to full openness hascaused difficulties in several instances while notobviously providing immediate benefits.
13 Guellec, D. & de la Potterie, B. (2004) ‘From R&D toProductivity Growth: Do the Institutional Settings andSource of Funds of R&D Matter?’ Oxford Bulletin ofEconomics and Statistics July 2004 Vol 66(3)
14 Hall, B. (2004) Innovation and Diffusion NBER WorkingPaper 10212
15 For example, Khan and Senhadji (2001; IMF Staff Paper48/1) find a negative relationship between inflation andeconomic growth in developing countries only for inflationrates over 11 percent. For developed countries, the inflation-growth trade-off applies for inflation rates over three percent.

81
IMPROVED PRODUCTIVITY – THE KEY TO SUSTAINED GROWTH AND HIGHER LIVING STANDARDS FOR ALL
2.25 Moreover, once differences between countriesin productivity growth and technological changeare acknowledged as being significant, economicmodels no longer point to unambiguous benefitsof free trade.16 However, there seems to be nocredible evidence that restrictive trade policiescan systematically boost growth. As well asdenying the benefits of specialisation in theproduction of goods and services, policies thatrestrict trade also severely constrain one of themajor potential mechanisms through whichtechnologies can be transferred while, at thesame time, protected producers have littleincentive to operate efficiently or innovate. Forthese basic reasons, claims that protection oflocal producers from external competition issomehow in the ‘national interest’ shouldgenerally be viewed with scepticism.17
2.26 It is generally the case that policies that promotefree trade are unlikely, by themselves, to besufficient, a panacea that invariably results inrapid growth. In particular, the potential benefitsof free international trade are unlikely to beunlocked if there is not similarly free trade withinthe domestic economy, including trade in theinputs to production. If domestic markets are notfunctioning efficiently then the potential foreffective interaction with world markets will beseverely reduced. Economists base thearguments for free trade on countries focusingon producing in areas where they possess‘comparative advantage’. However, this can onlybe achieved when inputs are rewarded in linewith their contribution to production and in line
with international prices – another instance ofthe direct link between productivity and growth.
The Importance of Structures andInstitutions
2.27 The role of institutions as the fundamental sourceof economic growth has been the focus of recentresearch, with the general view that good policiesappear not on a random basis, but are encouragedand nurtured by appropriate legal and politicalarrangements. In recent years there has emergedconsiderable agreement that institutionalweakness is a major cause of the problems oflow growth faced by sub-Saharan Africa.However, there is much less agreement on thefactors leading to such institutional weakness.Various reasons, including geography, ethnicfrictions and the legacies of colonialism, havebeen put forward.
2.28 A focus on institutions has clear practicalapplications. The concern that the growthpotential of poor countries remains mired ininadequate political, legal, and regulatoryframeworks can be directly linked to theincreased insistence from international donorsthat aid programmes are linked to effectivecommitment to ‘good governance’.18
2.29 At the same time, institutional reform is anevolutionary process and appropriate institutionsmay come in a variety of forms depending on thecircumstances. Recognising this variety, it ishelpful to try and identify the essential functionsthat institutions should embrace. FollowingSnowden (2004), these may be seen as including:
(a) market creating institutions, such asproperty rights and contract enforcement, for
16 For example, countries which specialise in sectors that haveslow rates of technological progress may experience lowergrowth rates. See, Snowden, B. (2004) ‘Explaining theGreat Divergence’ (interview with Daron Acemoglu) WorldEconomics 5(2).
17 Particular scepticism should be reserved for claims thatsuch competition is somehow ‘unfair’. The whole point ofengaging in trade (whether between or within countries) isto take advantage of lower prices. Although concerns areoften raised about so-called ‘dumping’ this refers to sellingat prices below the cost of production, which is unlikely tooften be in the producers’ interest and, therefore, is unlikelyto be a common occurrence.
18 See Burnside C. & Dollar, D. (2000), ‘Aid, Policies andGrowth’ American Economic Review vol 90. This reflectsthe current widespread consensus that, to be effective, aidshould go beyond supplying funds for investment and bepart of a package of sound policies and institutions.However, the extent to which this prescription has beenfollowed by donors in practice remains questionable asother considerations can intervene in aid allocation.

82
BANK OF BOTSWANA ANNUAL REPORT 2004
example as provided by security forces andthe judicial system;
(b) market regulating institutions, especially forareas where market ‘failures’ are a threat asin financial services and the regulation ofmonopoly suppliers;
(c) market stabilising institutions (monetary,fiscal and financial authorities);
(d) market legitimising institutions (democracyand social protection).
2.30 It is worth emphasising that the stress on theimportance of markets does not imply acommitment to ‘market fundamentalism’, i.e. aninsistence on a purely laisser faire approach toeconomic development. While mainstreameconomics emphasises the remarkable potentialfor market mechanisms to support and drivedevelopment, there is a recognition of seriousinstances of market failure, which may requirecorrective policy intervention, including, insome instances, replacing markets with moredirect means of resource allocation. Afundamentalist approach would give little, if any,weight to institutions beyond those that createmarkets.
2.31 Similarly, the reference to democracy does notimply a particular democratic model, or denythat there are countries with less than fullydemocratic credentials that have achievedremarkable growth over sustained periods. Atthe same time, the justification of democracydoes not stand or fall on arguments for improvedeconomic efficiency. However, the emphasis onthe need to legitimise the distribution ofeconomic wealth and resources has a naturalaffinity with embracing democratic institutions;in addition, a functioning participatorydemocracy is a sign of high levels of socialcohesion and trust. Overall, research hasindicated that the dominance of institutionswhose purpose is crudely exploitative is usuallyharmful to prospects for growth.
2.32 One of the effects of the recent emphasis oninstitutions is to downplay the role of geography
as a major determinant of growth. Clearlygeography has some impact, as factors such asclimate, location and availability of naturalresources must affect development prospects.Technologies developed in advanced economies,which are concentrated in temperate climatezones, may not easily be adapted to the needs ofcountries in the tropics. However, the moreoptimistic argument is that such difficulties canbe largely overcome if appropriate institutionshave been able to develop. Here, Botswana hasbeen used as a prominent case study. Acemogluet al (2003) argue that the country’sdevelopmental success had been founded in largepart on quality political and social institutionswith origins in the pre-independence period andwhich did not suffer from colonial interference.19In contrast, bad institutions can undermine thepotential of countries that appear to begeographically advantaged, which may go a longway towards explaining the so-called ‘resourcecurse’ where countries have frequently struggledto convert rich natural resource endowments intosustained increases in living standards.20
2.33 Closely related to the soundness of policy andinstitutions is the impact of corruption ongrowth. It is not difficult to see how theprevalence of corrupt practices will be harmfulfor growth, as incentives for efficiency andproductivity are quickly undermined. Lowgrowth is also a stimulus for further corruptionleading to a vicious circle that is particularlydifficult to reverse as, invariably, thoseresponsible for policy, both its design andimplementation, are often involved. On a more
19 See Acemoglu, D. Johnson, S. & Robinson, J. (2003) ‘AnAfrican Success Story: Botswana?’ in Rodrik, D. (ed) InSearch of Prosperity: Analytic Narratives on EconomicGrowth. Princeton University Press.
20 In such economies there may be a substantial coloniallegacy of mainly exploitative institutions, while the large‘rental’ component (revenues far above the costs ofproduction) typically associated with natural resourceextraction further weakens the need for clear connectionsbetweens rewards, efficiency and productivity. Theeffective collection of these rentals as government revenueand their subsequent effective use has been a major reasonfor the relative success of Botswana.

83
IMPROVED PRODUCTIVITY – THE KEY TO SUSTAINED GROWTH AND HIGHER LIVING STANDARDS FOR ALL
positive note, countries that reduce the extent ofcorruption can rapidly restore growth prospects.
Measures of Growth Potential2.34 Many of the results of research on the importance
of sound policies and institutions, geography andtechnology can be seen in the various indicesthat are produced to assess aspects ofcomparative economic performance. Forexample, the three component sub-indices of the‘Growth Readiness Index’ produced by theWorld Economic Forum (WEF) are thetechnology index, the public institutions indexand the macroeconomic environment index. Inturn, each sub-index includes various detailedmeasures, many relating directly to issues raisedin the preceding paragraphs. Geography, in theform of reliance on natural resources andwhether a country is land-locked, is included inthe trade readiness index of the UN EconomicCommission for Africa. Technology has its ownindex, as does corruption with the annualcorruption perceptions index of TransparencyInternational (TI) being among the most wellknown of all.
2.35 Such indices are useful to an extent, butconsidering Botswana immediately signposts apotential puzzle. The country typically scores verywell over a wide range of these indices, to theextent that ratings are generally ahead of othersin Africa and overlap those elsewhere. For 2003it had the highest rank for any African country inthe growth readiness index (although it lost thisposition in 2004). This is despite obvious naturaldisadvantages, such as the country’s landlockedstatus, and is due typically to the high ratings givenfor institutions. For several years the country hasalso fared well in the Corruption PerceptionsIndex, consistently being labelled not only theleast corrupt country in Africa but also faring wellin worldwide comparisons. This raises theobvious question of whether the assessedreadiness for growth has been adequately matchedby performance. These issues of performance andtrends in productivity are, therefore, discussed inthe subsequent sections.
3. ISSUES IN MEASURING PRODUCTIVITY
Introduction3.1 This section discusses productivity trends in
Botswana over a thirty-year period and drawspolicy implications of changes in productivity.Productivity growth is measured using thestandard growth accounting method, while theeffect of changes in productivity and factorinputs on output are analysed. While similarexercises were carried out in the Bank ofBotswana’s 1993 and 1995 Annual Reports, newdata have become available that allow for anupdating of that work. Moreover, unlike previouswork, this Section further makes use ofcomparative statistics on different aspects ofcompetitiveness to judge how well the economyhas been performing vis-à-vis a selected numberof regional and other economies, and how suchperformance has been facilitated by productivityimprovements or inhibited by low productivity.Where deficiencies are identified some solutionsare suggested.
3.2 Central to development planning in Botswanahas been the objective to achieve a sustainablelevel of economic growth as the means to raisingthe nation’s standard of living and reducingpoverty. Overall real output grew at an averageannual rate of 8.6 percent over the three decadesspanning 1974/75 to 2004/0521 (Chart 2.1).However, this masks a decelerating trend in therate of output expansion over this period. Theeconomic growth rate halved from an average12 percent per annum in the first decade to 6percent in the third decade, resulting in a muchlower increase in income per person of 3 percentper annum compared with a 7 percent annualincrease in the first decade. Furthermore, short-to medium-term prospects for output growth arenot as robust as in the past, which, by extension,means that GDP per capita is likely to grow moreslowly in the near future than in the past.
21 GDP data for national accounts years 2003/04 and 2004/05, which run from July each year to June the followingyear, were extrapolated using average growth rates for thethree years immediately preceding each of the years.

84
BANK OF BOTSWANA ANNUAL REPORT 2004
3.3 While the 6 percent output growth is stillrespectable by international standards, it hasgenerated insufficient employmentopportunities. Formal sector employmentincreased at an average annual rate of 2.6percent between 1994/95 and 2004/05, while theunemployment rate rose to 20 percent in 2001from 14 percent in 1991. The most recentHousehold Income and Expenditure Survey(HIES) results (not yet published) show an evenhigher unemployment rate, and that (for certainage groups) unemployment is highest amongsecondary school leavers. These statisticssuggest that a high rate of growth is required toreduce unemployment in any meaningful way,but alone is unlikely to solve all welfareproblems.
3.4 To stretch this point a little further, the 6 percentoutput growth looks even more inadequate whenput against the country’s ambitious aspirationsexpressed in the Vision 2016 document. Toillustrate the point, Vision 2016 identifies oneof its objectives as the tripling of income percapita by 2016 from its 1996 level. For this tobe achieved, the average annual growth rate of
output must be 7.9 percent, of the labour force2.9 percent, and labour productivity 3.9 percent,while investment would have to average 41percent of GDP. These compare with the actualgrowth rate of the labour force of 2.4 percentper annum between 1991 and 2001, and overthe last ten years, a 3.3 percent a year growth oflabour productivity, and an investment rate of26 percent of annual GDP per year. Judgedagainst this background, both actual output andincome per capita growth rates are inadequatefor the achievement of the Vision 2016 objectiveof increasing income per capita threefold fromwhat it was in 1996. Thus, the challenge remainsto raise the level of GDP growth in order tosustain reasonable increases in per capitaincome. Identification of factors that account forchanges in output and the strategies for reversingthe deceleration in output growth constitute thefocus of the next subsections.
Sources of Growth3.5 As discussed in Section 2, the proximate sources
of output growth are factor (capital and labour)accumulation, factor quality improvements andthe efficiency with which factor inputs arecombined to produce output. Further, changesin output may be ascribed to changes in thesectoral composition of output, such as whenproduction shifts towards high productivitygrowth sectors and away from low productivitygrowth sectors. In subsequent subsections, eachof these sources of growth is investigated in thecontext of Botswana’s economic growth record.
3.6 The basic factor inputs, capital and labour, havegrown significantly over the three decades to2004/05 (Chart 2.2), with the capital stockincreasing at an average annual rate of 8.9percent and the labour force at 2.3 percent perannum on average. As a result of the capital stockincreasing more rapidly than the labour force,the capital intensity of production increased. Therate of capital stock expansion was highestduring the period 1984/85–1994/95, reflectingthe coming on stream of the Jwaneng diamondmine in 1982, the second largest (in terms of
Real GDP, Millions (1993/94 Prices)
1974/75
1976/77
1978/79
1980/81
1082/83
1984/85
1986/87
1988/89
1990/91
1992/93
1994/95
1996/97
1998/99
2000/01
2002/03
2004/05
25,000
20,000
15,000
10,000
5,000
0
National Accounts Year
Growth Rate (%)
18
16
14
12
10
8
6
4
2
0
-2
Real GDPReal GDP less Mineral Rents3 Year MA GDP Growth3 Year MA GDP per Capita Growth
CHART 2.1: REAL GDP, REAL GDP LESSMINERAL RENTS, AND GROWTH RATES OF GDP ANDGDP PER CAPITA (3-YEAR MOVING AVERAGES)
Sources: Central Statistics Office and Bank of Botswana

85
IMPROVED PRODUCTIVITY – THE KEY TO SUSTAINED GROWTH AND HIGHER LIVING STANDARDS FOR ALL
carats recovered) of the four Debswana mines,and the launching of the Financial AssistancePolicy (FAP) in 1982 through which capitalgrants were provided to eligible businesses forinvestment in capital items. It also reflectedgrowth in the transport sector, in particular theacquisition of four aircraft by Air Botswana andthe purchase of thirty locomotives by BotswanaRailways (BR) between 1986 and 1991, as wellas the establishment of BR headquarters inMahalapye in 1994.
3.7 It is important that businesses make reasonablereturns on their investment for the investmentrate to be sustained. Similarly, labour requiresadequate compensation in order for employeesto continue to offer their services. As reportedin the 1995 Bank of Botswana Annual Report,the rapid accumulation of the capital stock inthe 1984/85–1994/95 decade did not initiallytranslate into a rising share of factor incomeattributable to capital.22 It did subsequently,however, rise sharply between1992/93 and1996/97, to a high of 61 percent (Table 2.1),
which is likely to be at least partly due to theslowing of employment growth during thisperiod.
3.8 As a result of substantial spending on education(more below), the share of factor income due toskilled labour rose from 35 percent in 1985/86to 39 percent in 1992/93, but dropped to 25percent in 1996/97 – a substantial fall that is noteasily explained, and may reflect datadeficiencies.
3.9 Improvements in the quality of the labour forcelargely reflects heavy investment byGovernment on education and healthinfrastructure and substantial spending onrecurring expenses, in order to improve bothaccess and the quality of education and healthcare services in the country. As Chart 2.3 shows,over the three decades since 1974/75, realspending on education and health grew ataverage annual rates of 12 percent and 11percent, respectively.
3.10 Such investments have the potential to impactpositively on social indicators, such aseducational enrolments, infant and maternalmortality and life expectancy. Indeed, there havebeen improvements in each of these socialindicators, until recently where in the health areathe spread of HIV/AIDS has reduced, and insome cases reversed earlier gains. For example,life expectancy rose from 55.5 years in 1971 to65.3 years in 1991, but by 2001 had fallen to55.7 years, similar to its level in the earlyseventies, largely reflecting the effect of HIV/AIDS (CSO, 2001 Population and Housing
Capital Stock (P Million 1993/94 Prices)
1974/75
1976/77
1978/79
1980/81
1082/83
1984/85
1986/87
1988/89
1990/91
1992/93
1994/95
1996/97
1998/99
2000/01
2002/03
2004/05
45,000
40,000
35,000
30,000
25,000
20,000
15,000
10,000
5,000
0
Labour Force
650,000
600,000
550,000
500,000
450,000
400,000
350,000
300,000
National Accounts YearLabour ForceFixed Capital Stock
CHART 2.2: LABOUR FORCE AND CAPITAL STOCK
Sources: Central Statistics Office and Bank of Botswana
22 This was calculated as net operating surplus plusdepreciation as a percent of factor income.
1985/86 1992/93 1996/97Capital 48.6 45.2 61.3Skilled Labour 35.1 38.8 24.7Unskilled Labour 16.3 16.0 14.0
TABLE 2.1: PERCENTAGE SHARES OF FACTORPAYMENTS TO CAPITAL, SKILLED LABOUR ANDUNSKILLED LABOUR: 1985/86, 1992/93 AND 1996/97
Source: Calculated from Botswana Social AccountingMatrices

86
BANK OF BOTSWANA ANNUAL REPORT 2004
Census Results). These compare with the UNDPfigures for life expectancy of 53.2 years and 44.4years in 1970–75 and 1995–2000, respectively.Infant and under-five mortality rates have morethan halved over the same period, from 99 to 46per 1000 live births and 142 to 59 per 1000 livebirths, respectively (UNDP, 2001, HumanDevelopment Report). Educational enrolmentsand progression rates at all levels have increased.This has been particularly so at the primary levelwhere the enrolment rate rose from 42 percentof the age group enrolled in 1970 to 98 percentin 1997. These statistics say little about thequality of human capital, but evidence fromTable 2.2, on total factor productivity-relatedquality improvements, suggests that the qualityof labour has improved.
Profile of Sectoral Value Added Shifts3.11 Important shifts in sectoral value added occurred
over the 28-year period to 2002/03, namely awayfrom the secondary sector towards the servicessector, in line with international trends.23 Theshare of GDP attributable to the services sector
grew to 48 percent in 2002/03 from 35 percentin 1974/75, while the share of the primary sectorremained unchanged at 40 percent and that ofthe secondary sector declined from 25 percentto 12 percent of GDP. Within the services sector,the more dynamic sub-sectors were the banks,insurance and business services; and trade, hotelsand restaurants, both of which contributedsignificantly to the growth of the output shareof the private services sector. The private sectoraccounted for 64 percent of the output share ofthe services sector in 2002/03, with governmentaccounting for the remaining 36 percent. It isinteresting to note that the share of the privatesector in the output of the services sector roseconsistently, from 56 percent in 1974/75 to 64percent in 2002/03. Although the share ofgovernment in services output declined from 44percent to 36 percent over this period, this doesnot mean that government is any less importantin terms of impacting on output growth. With a17 percent share in total GDP in 2002/03, a figurethat has remained fairly constant for severalyears, government is the second largesteconomic sector, after mining, and thus can haveimportant implications for output growth. Thisis not only through growth of its own output,but also the output of other sectors, givenGovernment’s potential to draw significantresources away from, or facilitate growth of, theprivate sector.
3.12 The output share of the secondary sector fellfrom 25 percent of GDP in 1974/75 to 12 percentin 2002/03, due to declines in the shares ofconstruction and manufacturing (Chart 2.6).Contrary to some international trends, theprimary sector maintained its share at 40 percentboth at the beginning and end of the period, asthe share of mining rose from 14 percent in 1974/
23 The secondary sector consists of economic activities thatinvolve a significant amount of physical processing, i.e.,manufacturing, construction and water and electricity. Theservices sector comprises distributive activities and serviceproviders, i.e., transport; government; trade, hotels andrestaurants; banks, insurance and business services; andsocial and personal services. The primary sector comprisesextractive activities, i.e., mining and agriculture.
Capital Stock (P Million 1993/94 Prices)
1976/77
1978/79
1980/81
1082/83
1984/85
1986/87
1988/89
1990/91
1992/93
1994/95
1996/97
1998/99
2000/01
2002/03
2004/05
3000
2500
2000
1500
1000
500
0
Labour Force
25%
20%
15%
10%
5%
0%
-5%
National Accounts YearEducation
Health Growth RateEducation Growth RateHealth
CHART 2.3: REAL RECURRENT EXPENDITURE ONHEALTH AND EDUCATION AND 3-YEAR MOVINGAVERAGE GROWTH RATES
Sources: Ministry of Finance and Development Planningand Bank of Botswana

87
IMPROVED PRODUCTIVITY – THE KEY TO SUSTAINED GROWTH AND HIGHER LIVING STANDARDS FOR ALL
75 to 38 percent in 2002/03, peaking at 57percent in 1983/84 while that of agriculturedeclined from 26 percent to 3 percent.
Intensity in Factor Input Use3.13 Given its high share in GDP, the services sector
commands a similarly high share ofcompensation to labour, about 67 percent in2000/01, while the private services sectorcontributed 43 percent of compensation tolabour. The share of the primary sector in labourincome in 2000/01 was 13 percent, down from23 percent in 1974/75, while that of thesecondary sector was 20 percent, down from 27percent in 1974/75.
3.14 Capital intensity is highest in the water andelectricity sector while the banks, insurance andbusiness services sector also has a fair amountof capital intensity. Overall, the banks, insuranceand business services; trade, hotels andrestaurants; and mining, were the most dynamicin terms of generating growth, and thisdynamism has partly been spurred by the highcapital intensity, at least in the bank, insuranceand business services sector.
Total Factor Productivity3.15 The preceding sections examined the evolution
of factor inputs and output over a 30-year period.This section examines the relationship betweenfactor inputs and output, i.e., productivity. Ashighlighted in Section 2, productivity can bemeasured in any number of ways, but typicallythe focus has been on the measurement of thenarrower concept of labour productivity.However, a more encompassing measure is totalfactor productivity (TFP), which recognises thatoutput growth arises not only from mere factoraccumulation, but also from all other inputs, theefficiency with which inputs are transformed intooutput plus a host of other factors. It is an indirectmeasure of productivity as it is determined as aresidual after accounting for productivity due tomeasured input growth. Thus, TFP is herecalculated as the difference between the outputgrowth rate and the weighted average rate ofgrowth of the inputs. The results of thecalculations are shown in Table 2.2 andChart 2.7.
SecondarySector26%
PrimarySector40%
GovernmentSector15%Private
ServicesSector19%
ServicesSector34%
CHART 2.4: SECTORAL SHARE IN GDP: 1974/75
Sources: Central Statistics Office and Bank of Botswana
SecondarySector13%
PrimarySector40%
GeneralGovernment
17%
PrivateServicesSector30%
ServicesSector47%
CHART 2.5: SECTORAL SHARE IN GDP: 2002/03
Source: Central Statistics Office and Bank of Botswana
CHART 2.6: SECTORAL SHARE IN GDP
Sources: Central Statistics Office and Bank of Botswana
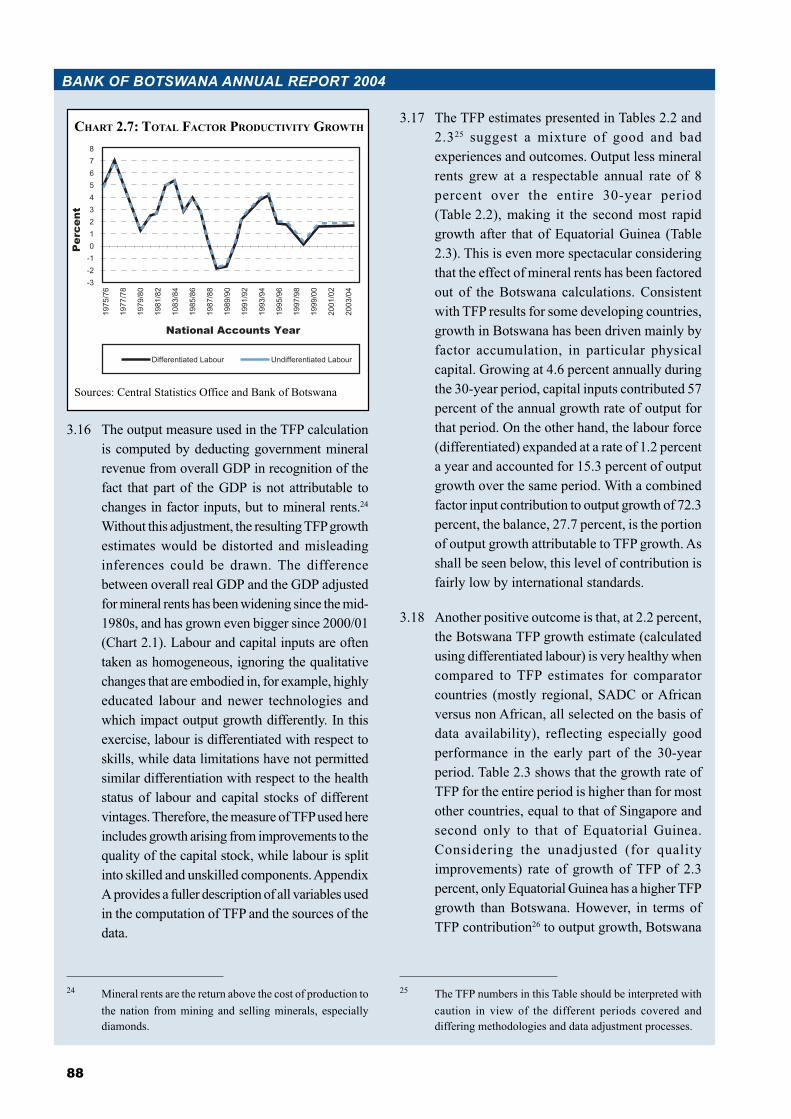
88
BANK OF BOTSWANA ANNUAL REPORT 2004
3.16 The output measure used in the TFP calculationis computed by deducting government mineralrevenue from overall GDP in recognition of thefact that part of the GDP is not attributable tochanges in factor inputs, but to mineral rents.24Without this adjustment, the resulting TFP growthestimates would be distorted and misleadinginferences could be drawn. The differencebetween overall real GDP and the GDP adjustedfor mineral rents has been widening since the mid-1980s, and has grown even bigger since 2000/01(Chart 2.1). Labour and capital inputs are oftentaken as homogeneous, ignoring the qualitativechanges that are embodied in, for example, highlyeducated labour and newer technologies andwhich impact output growth differently. In thisexercise, labour is differentiated with respect toskills, while data limitations have not permittedsimilar differentiation with respect to the healthstatus of labour and capital stocks of differentvintages. Therefore, the measure of TFP used hereincludes growth arising from improvements to thequality of the capital stock, while labour is splitinto skilled and unskilled components. AppendixA provides a fuller description of all variables usedin the computation of TFP and the sources of thedata.
3.17 The TFP estimates presented in Tables 2.2 and2.325 suggest a mixture of good and badexperiences and outcomes. Output less mineralrents grew at a respectable annual rate of 8percent over the entire 30-year period(Table 2.2), making it the second most rapidgrowth after that of Equatorial Guinea (Table2.3). This is even more spectacular consideringthat the effect of mineral rents has been factoredout of the Botswana calculations. Consistentwith TFP results for some developing countries,growth in Botswana has been driven mainly byfactor accumulation, in particular physicalcapital. Growing at 4.6 percent annually duringthe 30-year period, capital inputs contributed 57percent of the annual growth rate of output forthat period. On the other hand, the labour force(differentiated) expanded at a rate of 1.2 percenta year and accounted for 15.3 percent of outputgrowth over the same period. With a combinedfactor input contribution to output growth of 72.3percent, the balance, 27.7 percent, is the portionof output growth attributable to TFP growth. Asshall be seen below, this level of contribution isfairly low by international standards.
3.18 Another positive outcome is that, at 2.2 percent,the Botswana TFP growth estimate (calculatedusing differentiated labour) is very healthy whencompared to TFP estimates for comparatorcountries (mostly regional, SADC or Africanversus non African, all selected on the basis ofdata availability), reflecting especially goodperformance in the early part of the 30-yearperiod. Table 2.3 shows that the growth rate ofTFP for the entire period is higher than for mostother countries, equal to that of Singapore andsecond only to that of Equatorial Guinea.Considering the unadjusted (for qualityimprovements) rate of growth of TFP of 2.3percent, only Equatorial Guinea has a higher TFPgrowth than Botswana. However, in terms ofTFP contribution26 to output growth, Botswana
Percent
1975/76
1977/78
1979/80
1981/82
1083/84
1985/86
1987/88
1989/90
1991/92
1993/94
1995/96
1997/98
1999/00
2001/02
2003/04
876543210-1-2-3
National Accounts Year
Differentiated Labour Undifferentiated Labour
CHART 2.7: TOTAL FACTOR PRODUCTIVITY GROWTH
Sources: Central Statistics Office and Bank of Botswana
24 Mineral rents are the return above the cost of production tothe nation from mining and selling minerals, especiallydiamonds.
25 The TFP numbers in this Table should be interpreted withcaution in view of the different periods covered anddiffering methodologies and data adjustment processes.

89
IMPROVED PRODUCTIVITY – THE KEY TO SUSTAINED GROWTH AND HIGHER LIVING STANDARDS FOR ALL
fares poorly, coming in at 5th position with acontribution to the rate of output growth of 28percent, which is lower than Malaysia’s 44percent, Singapore’s 43 percent, EquatorialGuinea’s 42 percent and Thailand’s 39 percent.This suggests ample room for improvingBotswana’s TFP rate of growth and effortsshould be directed at raising it. This is not todeny that Botswana’s TFP growth iscomparatively high on a global scale, but ratherto recognise that it is low in relation to the rateof economic expansion. To illustrate theimportance of boosting TFP growth, Table 2.3shows that countries with negative TFP growthrates have among the lowest rates of increase inGDP despite having reasonably high growthrates of physical inputs, suggesting that factoraccumulation while a necessary condition forgrowth, is by no means a sufficient one and thatTFP has a fundamental role to play in thedetermination of output changes. As mentionedearlier, to date, output increases in Botswanahave largely been driven by factor accumulationand sooner or later the limits of this approachwill become evident. Therefore efforts shouldbe directed at promoting factors that influenceTFP growth in order to ensure that an appropriaterate of output growth (in terms of the associatedemployment opportunities and per capita incomegrowth) is maintained. This is important foraddressing issues of poverty and improvementin living standards.
3.19 The importance of differentiating the labourforce can be seen from observing the differentialbetween the TFP growth rate calculated usingthe total labour force (2.3 percent) and usingdifferentiated labour (2.2 percent), which, overthe 30-year period, averaged 0.1 percent. Thisdifference reflects the qualitative improvementsin the educational status of the labour force.Chart 2.7 picks up this effect, which is noticeablein the post-1991/92 period, pointing to a positiveeffect on output growth of human capitaldevelopment. However, in the earlier periods,
1975/76–1980/81, the differential is suggestingperhaps that quality improvements areincremental and their impact occurs with a lag.During this period, skilled labour increased at arate of nearly 4 percent per annum compared toa drastically reduced rate of unskilled labourgrowth of 0.8 percent, which led to a drop in theshare of unskilled labour to 38 percent in 2004/05 from nearly 50 percent in 1982/83. However,in the earlier periods, 1975/76–1980/81, thedifferential is hardly noticeable and may beexplained by the slow build-up of skills andknowledge in the first six years of the reviewperiod during which skilled labour grew by 0.1percent annually on average. But even after apick-up in growth of this labour component to 4percent in the following ten years, the impacton TFP was not discernible partly becauseunskilled labour was also growing relativelyfaster at 2.8 percent, but also reflecting thatquality improvements are incremental andimpact TFP with a lag.
3.20 The more worrying outcome is the trend declinein both TFP and factor input growth rates, which,in turn, has contributed to the trend decline inthe growth rate of output. The rate of increaseof TFP fell from an average 3.9 percent perannum (for both differentiated andundifferentiated labour) during 1974/75–1984/85 to 1.5 percent and 1.7 percent a year,respectively, during 1984/85–1994/95, while atthe same time capital and labour inputs increasedat higher rate. The conclusion is that theslowdown in TFP growth was responsible forthe fall in the rate of economic expansionbetween the two periods. In the following decadethe rates of growth of both the TFP and physicalinputs decelerated, resulting in a stronger declinein output growth. The continued decline in theTFP growth rate may be indicative of a nearexhaustion of higher return projects for publicinvestment, especially in more recent years, asmany of these have already been implemented,while the experience of the CEDA VentureCapital Fund with little active interest in itsfunding could be indicative of a similar situationin the private sector.26 Calculated as the percentage share of TFP in output growth.

90
BANK OF BOTSWANA ANNUAL REPORT 2004
3.21 It should be noted that part of the explanationfor the decline in TFP growth rates could be dueto the way in which the calculation is carriedout, using the total labour force rather than theactual labour employed in production (for whichdata is not available). Using total labour availablerather than labour employed will tend to biasproductivity for employed factors of productionestimation downwards. Furthermore, ifunemployment has been rising, as it has been inBotswana, the downward bias may getprogressively greater, hence possibly explainingpart of the downward productivity trend.Nevertheless, to the extent that the data refers tothe productivity with which available factors ofproduction are utilised, the downward trend isrepresentative.
3.22 To complement the discussion on TFP estimates,labour productivity (real output per worker)growth rates were calculated for the period1982–2003 and are presented in the last row of
Table 2.2. The results are somewhat consistentwith those emerging from TFP growth estimates.On average, labour productivity grew by 2.1percent a year between 1982 and 2003. Thiscompares favourably with labour productivity(real output per hour worked) growth for theUSA of 1.4 percent calculated over the period1973–95 (Steindel C. and Stiroh K.J., 2001, seefootnote 4, Table 2.3). Labour productivitygrowth was very strong (5.9 percent p.a.) in theten-year period ending 1984/85, dropped tonearly zero in the following decade, but rose inthe decade to 2004/05.
4. Enhancing and MaintainingProductivity Growth: The Caseof Botswana
4.1 The preceding section reported on TFP andoutput computations for Botswana andcomparable data for other countries. The analysisof TFP growth estimates has yielded three major
Average Share Calculated Average Annual Growth Ratefrom 1985/86 1992/93
1996/97 SAMs1974/75 to1984/85
1984/85 to1994/95
1994/95 to2004/05
1974/75 to2004/05
Real Output Less Mineral Rents 1.000 9.6 8.4 6.0 8.0Capital Stock1 0.517 5.0 5.3 3.4 4.6Labour Force1: of which
Skilled Unskilled
0.4830.3280.155
0.80.60.2
1.51.30.3
1.21.20.1
1.11.00.2
Total Inputs (capital and labour)1Uniform labourDifferentiated labour
5.75.8
6.86.9
4.64.8
5.75.8
Total Factor Productivity GrowthUndifferentiated Labour ForceDifferentiated Labour Force
3.93.9
1.71.5
1.41.2
2.32.2
Input Quality Improvements2 0.0 0.2 0.2 0.1Labour Productivity Growth3 5.9 0.5 3.3 2.1
1. Annual growth rates are weighted by the average shares of capital and labour and factor income (calculated using data fromthe social accounting matrices (SAMs) for the years 1985/86, 1992/93 and 1996/97). The sub-components may not add up tothe whole due to rounding.
2. Refers to the difference between undifferentiated and differentiated labour force and shows TFP growth due to improvementsin the quality of labour.
3. Defined as real output per worker. The period covered starts in 1982 and ends in 2003.Source:Appendix A
TABLE 2.2: TOTAL FACTOR PRODUCTIVITY GROWTH, 1974/75 TO 2004/05

91
IMPROVED PRODUCTIVITY – THE KEY TO SUSTAINED GROWTH AND HIGHER LIVING STANDARDS FOR ALL
conclusions. First, that output growth inBotswana has not only been rapid but higher thanthat in most of the countries reviewed.Nevertheless, the rate of output expansion has
trended downwards over the 30-year reviewperiod, suggesting a significant slowdown inTFP growth, initially, from the mid-1980s tomid-1990s, and a subsequent downward trend
1. Estimates from Tahari, A. et al, Sources of Growth in sub-Saharan Africa (SSA), IMF Working Paper No. WP/04/176, 2004. TheTFP estimates for Botswana have not been adjusted for mineral rents and therefore are not directly comparable with the adjustedBank of Botswana estimates. The data cover the period 1960–2002
2. Estimates from Matovu J and Yuguda L., ‘Sources of Economic Growth’, in IMF, Botswana Selected Issues and Statistical Appendix,1999. The estimates have been adjusted for mineral rents by excluding the mining sector from the calculations. Data cover theperiod 1978–1996.
3. Bank of Botswana estimates calculated for the period 1975–2005. The labour and TFP growth estimates in parentheses have notbeen adjusted for quality improvements and are, therefore, comparable to the TFP results from Tahari et al.
4. Estimates cited in Steindel C. and Stiroh K. J., 2001, Productivity: What Is It, and Why Do We Care About It?, Federal ReserveBank of New York. Estimates are for the period 1973–1995 and from the US Bureau of Labour Statistics (2000).
5. ‘…’ means not available.Source: Tahari, A., et al, 2004, Sources of Growth in Sub-Saharan Africa, IMF Working Paper No. WP/04/176; Matovu J and
Yuguda L., 1999, ‘Sources of Economic Growth’, in IMF, Botswana Selected Issues and Statistical Appendix; CSO, NationalIncome Accounts Reports (various issues), and US Bureau of Labour Statistics, 2000, Multifactor Productivity Trends,1998, USDL 00–267, September 21.
TABLE 2.3: SOURCES OF REAL GDP GROWTH FOR SELECTED COUNTRIES AND COUNTRY GROUPINGS
Contribution of:Real GDP Growth
(Percent)Physical Capital
(percent)Labour
(Percent)TFP
(Percent)Botswana1 7.5 3.8 1.7 2.0
Botswana2 8.4 … … 3.5
Botswana3 8.0 4.6 1.2 (1.1) 2.2 (2.3)
Equatorial Guinea1 11.6 5.0 2.0 4.6
Namibia1 1.9 1.5 1.5 –1.1
South Africa1 3.1 1.5 1.4 0.1
Zimbabwe1 2.6 1.6 1.8 –0.7
Sub-Saharan Africa1 3.2 1.8 1.5 0.0
Middle-income countries1 5.0 2.6 1.5 0.9
Oil-producing countries1 4.6 2.4 1.5 0.6
Low-income countries1 2.7 1.5 1.5 –0.3
Non Sub-Saharan CountriesIndonesia2 4.7 … … 1.2
Malaysia2 4.5 … … 2.0
Singapore2 5.1 … … 2.2
Thailand2 5.2 … … 2.0
United States4 3.0 … … 0.4
92
BANK OF BOTSWANA ANNUAL REPORT 2004
into the decade up to 2004/05. Moreover, therewas also a deceleration in the rate of increase inphysical inputs (capital and labour) during thedecade to 2004/05. Second, output expansionwas driven mainly by factor input accumulation,especially capital and, to a lesser extent, TFP.Third, although TFP increase in Botswana is inabsolute terms, healthier than in most countries,its contribution to the rise in output is lowcompared to other countries. Furthermore, thedownward trend in TFP growth is cause forconcern, a development which needs to bereversed in order to provide a higher sustainablerate of output expansion. What follows is anexplanation of the possible causes of theslowdown in output increase and how a rise inTFP can be achieved.
4.2 Empirical research27 has identified severalfactors that explain why countries may fail tosustain rapid growth, as indicated below.Section 2 refers to various indices that are usedfor assessing some aspects of comparativeeconomic performance. The indices indicate therelative importance of factors that contribute toeconomic growth, including sound policies andinstitutions, geography and technology. Foursuch indices – the World Economic Forum’sgrowth competitiveness index (GCI), businesscompetitiveness index (BCI), the networkedreadiness index (NRI), and the United NationsEconomic Commission for Africa’s tradecompetitiveness index as well as variousindicators of the ease or difficulty of doingbusiness with the World Bank are considered.After reviewing these indices, this section
assesses Botswana’s performance vis-à-vis othercountries. This is followed by a critical analysisof the extent to which Botswana’s growth andproductivity have been influenced byfundamental factors. The country rankings foreach of the indices are in Tables A.2 to A.5. Ingeneral, Botswana scores well on a range ofindices and is typically ranked ahead of manyAfrican countries, but ranked lower than manydeveloped countries.
Growth Competitiveness Index (GCI) Rankings4.3 The GCI measures the potential for countries to
achieve sustained economic growth over themedium and long-term. It provides an overallscore for the impact of institutions, policies andtechnology on the growth process. First, the GCIrecognises that appropriate decision-making byeconomic agents cannot take place in amacroeconomic environment that is unstable;second, it is based on the premise that since theprivate sector interacts with public institutionsin the conduct of its business, inefficient publicinstitutions can retard the expansion of theprivate sector which may, in turn, slow economicgrowth; third, it assigns a key role to technologyfor the attainment of sustained long-run outputexpansion since new ideas embodied inimproved technologies overcome the law ofdiminishing returns unlike physical inputs. Thethree main components of GCI are: theMacroeconomic Environment Index (MEI), theQuality of Public Institutions Index (QPI) andthe Technology Index (TI); the three are furtherdisaggregated into several indicators as shownin Table A.2.
4.4 Table A.2 shows the rankings of 102 countriesbased on their respective growthcompetitiveness. With an overall ranking of 36,Botswana is ahead of all the other Sub-SaharianAfrica (SSA) countries, but outperformed by allthe non-SSA countries. Botswana’s high rankingwas mainly a result of a good rating on the publicinstitutions index, especially the contracts andlaw sub-index in which the country’s rankingwas 16. The soundness of public institutions is
27 IMF, 2000, Policies for Faster Growth and PovertyReduction in Sub-Saharan Africa and the Role of theIMF, IMF Issues Brief No 00/09; Basu A. et al,Promoting Growth in Sub-Saharan Africa: LearningWhat Works, IMF Economic Issues No 23, 2000;Ernesto Hernández-Catá, 2000, Raising Growth andInvestment in Sub-Saharan Africa: What Can BeDone?, IMF Policy Discussion Paper 00/4; andBeaugrand, P., And Schumpeter Said, ‘This is HowThou Shalt Grow’: The Further Quest for EconomicGrowth in Poor Countries, IMF Working Paper NoWP/04/40.

93
IMPROVED PRODUCTIVITY – THE KEY TO SUSTAINED GROWTH AND HIGHER LIVING STANDARDS FOR ALL
also confirmed by other indices in Table A.4 thatwere partly the result of a ranking of 17 on thegovernment waste sub-index, an outcome whichimplies that spending on unproductive activitieshas not been substantial, and thatmacroeconomic conditions are stable. However,Botswana scored less well on the technologyindex, with a ranking of 80 on the innovationsub-index. This outcome should not be a surprisedue to the country’s stage of development andtechnological achievement. The converse of thelow technology index is that Botswana faredrelatively well on the technology transfer sub-index – with a ranking of 24 due to the roleplayed by technology transfer through foreigndirect investment which, although falling as aproportion of gross domestic product in recentyears (FIAS, 2003)28, has contributedsignificantly to economic development.
Business Competitive Index (BCI) Rankings4.5 The BCI focuses on the level of corporate entities
with reference to productivity andcompetitiveness, which in the aggregatecontributes to the country’s overallcompetitiveness. This factor is critical toeconomic development as an indispensablecomplement to macroeconomic stability. TheBCI is a composite measure of two factors,namely, the sophistication of businesscompetition and the quality of themicroeconomic environment in whichbusinesses operate.
4.6 Botswana ranks number 54 out of 102 countrieson the BCI, falling behind Mauritius and SouthAfrica. This suggests the need for efforts to bemade to improve the microeconomicenvironment and the aspects of publicinstitutions that have a bearing on the relevantfactors. Possible areas requiring attention includepromoting increased business access to morehighly skilled labour, better product and labour
market information, a more efficient provisionof public services, provision of improvedinfrastructure, low cost utilities and enhancementof competition, which can be facilitated by freertrade and the existence and effectiveimplementation of competition laws andpolicies. Improvements in these areas shouldencourage companies to adopt efficiencyenhancing business strategies that will delivermore goods and services of higher quality.
Networked Readiness Index (NRI) Rankings4.7 Introduced in 2001–2002, the NRI is defined as
the degree of preparation of a nation orcommunity (comprising individuals, businessesand government) to participate in and benefitfrom information communication technology(ICT) developments. The index has threecomponents – the Environment ComponentIndex, the Readiness Component Index and theUsage Component Index. These are furtherdisaggregated into sub-components as shown inTable A.3.
4.8 The Table shows that with an NRI ranking of 55out of 102 countries, Botswana is ahead of otherAfrican countries such as Namibia andZimbabwe, but lags behind Mauritius and SouthAfrica and is a long way off from the rating ofthe USA which has the highest NRI rank,followed by Singapore and Finland in secondand third place, respectively. The rankingbenefited from a fairly good ranking (position28) of the political, legal and regulatory sub-index, but was weighed down by the poorperformance on the readiness and usagecomponent indices. However, within the sub-index, there are differences in the ability toparticipate in the usage of ICT among the threestakeholders. Government appears to haveintegrated ICT in its operations better thanindividuals or businesses, while in terms ofusage, businesses are better placed thanindividuals or the Government to use and applyICTs.28 Foreign Investment Advisory Service, 2003, Further
Improving the Regulatory and Procedural Framework forEncouraging Private Investment.

94
BANK OF BOTSWANA ANNUAL REPORT 2004
Trade Competitiveness Index (TCI) Rankings4.9 The TCI is a composite index that measures the
overall competitiveness of a country’s trade. Itcomprises three sub-indices, namely, the Trade-enabling Environment Index (TEI), theProductive Resources Index (PRI) and theInfrastructure Index (II). These, in turn, consistof 8 components, which are made up of 31indicators.
4.10 The TEI captures strengths and weaknesses ofthe macroeconomic and political environment,as well as policies that are conducive to trade,including the stability of the exchange rate; levelof inflation; the competitiveness of interest rates;real effective exchange rates; the effect of tariffson export promotion; the effectiveness ofinstitutions especially the judicial systems ordegree of prevalence of corruption which createsdifficulties in attracting capital for productionand export; the complexity of bureaucratic andstringent licensing requirements whichdiscourage investors from exploiting availableeconomic resources and potential; as well as theadverse and/or unstable macroeconomicconditions that may not be conducive to tradeand growth. The PRI comprises the availabilityof direct productive inputs in a country,especially human resources (in terms of size,skill level and health status of the labour force);the existence of other natural resources (arableland and renewable water resources) andgeographical factors that affect a country’sproductive base (being landlocked for rexample).It, therefore, measures a country’s potential tomove up the ‘value chain’ or ‘quality ladder’ ofproducts. The II provides a measure of the degreeof infrastructure development necessary for thefacilitation of economic activities and domesticand international trade in goods and services.
4.11 The TCI is available for five groups of periodsand for selected countries as shown in Table A.4.The Table indicates that out of 30 countries,Botswana’s overall trade competitivenessranking improved dramatically from 22 in 1980–84 to 8 in the most recent period (1997–2001),mainly on account of extremely good
performance of the infrastructure index (II), theranking of which improved from 20 in the 1980sto 4 in 1997–2001. This was a result of theexpansion in telecommunications (a steadyincrease in fixed telephones and exponentialgrowth of the mobile phone market since 1999)and a good transport network. In 1997–2001,countries that fared better than Botswana areMauritius, South Africa, Namibia, Uganda,Gabon, Egypt and Morocco in that order.
4.12 In terms of the TEI, Botswana’s rank was 7,behind Mauritius, South Africa, Namibia,Morocco, Tunisia and the Gambia, while on thePRI the ranking was 26, only 4 positions awayfrom the least trade competitive country. Its lowperformance in the PRI rank reflected twofactors. First, the weak performance in theGeography Index (where its rank was 30 due toits landlocked position), which more than offsetthe relatively good performance in the LabourForce Index for which the rank was 8. Second,Botswana relies heavily on mineral resourcesthat are excluded from the PRI calculations. Butin the II the country is ranked 4th, ahead ofMauritius, South Africa and Namibia.
Factors Affecting the Ease or Difficulty of DoingBusiness
4.13 Cumbersome and/or excessive businessregulation matters, as it stifles productive activityand distorts governments from focussing on thedefinition and protection of property rightsagainst violations by citizens and the state.Business thrives and productive and sustainablejobs are created where property rights are clearlydefined and protected and governments do notheavily regulate every aspect of business activity.Excessive regulation erodes the flexibilityrequired by businesses to adjust to new marketconditions and to take advantage of emergingopportunities for growth, thus delaying orslowing the start of new business ventures thatcreate wealth and new jobs. It also pushesbusinesses to operate in the informal economy.Cumbersome regulation is generally associatedwith more inefficiency in public institutions –

95
IMPROVED PRODUCTIVITY – THE KEY TO SUSTAINED GROWTH AND HIGHER LIVING STANDARDS FOR ALL
long delays in processing of businessapplications, higher cost of doing business whichmay create unemployment and less productivityand investment. Evidence (Doing Business,2004) suggests that countries that regulate mosttend to be poor and yet these have the leastenforcement capacity and the fewest checks andbalances in government to ensure that regulatorydiscretion does not lead to corrupt practices.However, it is also recognised that there is nosingle model of business regulation. Instead,governments should aim for optimal regulation– that which is absolutely necessary – and usetechnology to automate relevant regulatoryprocessing in order to reduce the burden onbusinesses. However, this requires high levelsof human capital in public administration.
4.14 Table A.5 gives a snapshot of the businessclimate in the listed countries. It identifiesspecific regulations and policies in thesecountries that encourage or discourageinvestment, productivity and growth and useseveral indicators to judge the ease or difficultyof operating a business, including starting abusiness, hiring and firing workers, registeringproperty, getting credit, protecting investors,enforcing contracts and closing a business. Ananalysis and comparison of Botswana’s indicesvis-à-vis that of other countries is presentedbelow.
4.15 Starting a Business: This is intended to measurethe ease or difficulty of incorporating andregistering a new business. In 2004, it took 11steps to establish a business in Botswana over108 days on average and at a cost of 11 percentof income per capita. This compares with 2 stepsin Australia over 2 days and at a cost of 2 percentof income per capita. Not only is Botswanauncompetitive against the best (Australia, interms of the number of procedures and the timeit takes to complete them), it is alsouncompetitive against all the countries in TableA.4. Furthermore, although the number ofbusiness start up procedures for Botswana is thesame as the average for Sub-Saharan Africacountries, the duration is much longer in
Botswana, about 1.7 times higher and 4.3 timesthat of the OECD average. However, the cost ofstarting up a business in Botswana is dwarfedby the regional average of 224 percent of percapita income, but closer to the OECD averageof 8 percent. Finally, as in Australia and severalother countries in Table A.4, there is no minimumcapital required to obtain a registration numberin Botswana. This compares with a regionalaverage capital requirement that is 254 percentof per capita income and an OECD average of44 percent.
4.16 Hiring and Firing Workers: Indicators underthis heading measure the flexibility with whichthe labour laws meet the needs of the market,particularly, how difficult it is to hire a newworker, how rigid the regulations are onincreasing or reducing the number of workinghours, and how difficult and costly it is to dismissa redundant worker. Each of these indices isassigned a value in the range of 0 to 100, withhigher values indicating more rigid regulationsand lower values indicating the opposite. Thesub-indices are averaged into an overall Rigidityof Employment Index (REI), also with a valueranging from 0 to 100.
4.17 For Botswana, the REI is 20, which implies agood amount of flexibility in the labour laws. Inparticular, there are no restrictions on hiringworkers while the regulation of working hoursis very flexible. At 40, the difficulty of firingindex is the highest of the three sub-indices andindicates that firing procedures are fairlystringent. However, even at this level,Botswana’s REI is not only lower than the REIfor neighbouring countries, it is well under halfof the average for SSA and 1.7 times lower thanthe OECD average of 34. Considered against theleaders on the list, Singapore and Hong Kong(China) with a zero REI, Botswana’s REI couldbe improved, in particular by addressing thefiring laws. With 19 weeks worth of wagespayable on termination of employment, it ischeaper to fire a worker in Botswana than inmany of the listed SSA countries, Finland or theUK. Firing costs in Botswana are less than one

96
BANK OF BOTSWANA ANNUAL REPORT 2004
third of the average cost for SSA countries andhalf of the OECD average cost, but are stillhigher than those for Singapore and Hong Kong(China).
4.18 Registering Property: Securing rights toproperty strengthens incentives to invest, whilecomplex procedures to register property areassociated with less perceived security ofproperty rights, more informality and corruption.The number of procedures legally necessary totransfer a property title from the seller to thebuyer and the associated time and cost(expressed as a percentage of the property value)measure the ease with which firms can securerights to property. The fewer the procedures, theshorter the time and the cheaper it is to transfertitle and the greater is the facilitation of propertyownership and incentives to invest, as propertycan be used as collateral to get funding forstarting or expanding a business.
4.19 In 2004, it took 69 days on average to complete4 property registration procedures at a cost of 5percent of the property value in Botswana. Bestpractice in this area is in Norway where it takesone day to complete one procedure at a cost of 3percent of the property value. In Saudi Arabiaregistration is free. It is cheaper and takes fewerprocedures to register property in Botswana thanin neighbouring countries and SSA as a whole,while the OECD average costs and number ofprocedures is comparable to those of Botswana.However, the duration is nearly twice as muchas that of the OECD average, but three-fifths ofthe average for SSA countries.
4.20 Getting Credit: Doing Business reports thatworldwide, the difficulty in obtaining credit isconsistently rated by firms as one of the greatestbarriers to operation and growth. Their analysesshow that broader sharing of credit informationand stronger legal rights of creditors in disputesarising out of bankruptcy facilitate more lendingbecause creditors are assured that they will beable to recoup the amounts loaned out. The fiveindicators developed for this aspect of businessactivity are split into two sets, with one set
measuring the coverage, scope, and quality ofaccessibility of credit information through publicand private credit registries (these are institutionsor firms that gather and disseminate informationon credit histories of individuals and firms,which helps creditors to assess risk and allocatecredit more efficiently). The second set ofindicators measures how collateral andbankruptcy laws are designed to facilitate accessto credit and ranges from 0 to 10, with highervalues indicating that those laws are betterdesigned to expand access to credit.
4.21 In terms of availability of credit information,Botswana scores 5 out of 6, which compares withthe SSA and OECD averages of 2 and 5,respectively. With a score of 9 out of 10 for thedesign of collateral and bankruptcy laws, thecountry performs much better than SSA orOECD with averages of 5 and 6, respectively. Itis outperformed by Singapore, Hong Kong(China) and the UK.
4.22 Protecting Investors: The degree to whichinvestors are protected is measured by thedisclosure index, which captures seven waysthrough which ownership and financialinformation is disclosed. The index ranges from0 to 7, with higher values indicating moredisclosure. Botswana scored 5 out of 7, whichis more than twice the SSA average and nearlythe same as the OECD average.
4.23 Enforcing Contracts: Three indicators measurethe ease or difficulty of enforcing contracts; theseinclude the number of procedures legallyrequired from the time a lawsuit is filed with thecourts to the time when actual payment is made,the associated time taken, and the cost (for court,attorneys and related fees and payments)expressed as a percentage of the value of thedebt.
4.24 In Botswana, the cost of enforcing commercialcontracts is a quarter of the debt value, as against43 percent in SSA, 11 percent in the OECD andbest practice of less than 5 percent of the disputedamount in Norway and New Zealand; thecontracts are enforced in less than five months

97
IMPROVED PRODUCTIVITY – THE KEY TO SUSTAINED GROWTH AND HIGHER LIVING STANDARDS FOR ALL
in Botswana against best practice of 7 days inTunisia, while in SSA and OECD countries ittakes 14 months and over 7 months, respectively;and at 26, the number of procedures in Botswanais high relative to an average of 19 for the OECD,but lower than the SSA average of 35.
4.25 Closing a Business: Three indicators measurethe efficiency with which a non-viable businessis closed. These are the time and cost of resolvingbankruptcy, as well as the recovery rate(measuring the efficiency of foreclosure orbankruptcy procedures) expressed in cents onthe US dollars which claimants are able torecover from the insolvent firm. In 2004, it tookover 2 years on average to resolve a bankruptcyin Botswana at a cost of 18 percent of the valueof the estate. This compares with an average of3.6 years for SSA and 1.7 years for the OECDcountries. It was cheaper to resolve a bankruptcyin Botswana compared to the region, but moreexpensive relative to the costs in the OECD. Therecovery rate was just over half, compared with17 cents for SSA and 72 cents for the OECD.
4.26 The conclusion from the analysis above is thatBotswana has scored very well in respect ofsome indices and performed equally badly onothers. On the positive side, Botswana scoredrelatively high on macroeconomic environment,some aspect of political, legal and regulatoryframework, infrastructure (telecommunicationsand roads), provision of credit information andbankruptcy laws, protection of investors,enforcement of commercial contracts and thecost of resolution of bankruptcies. Its majorweaknesses can be summed up in terms of amicroeconomic (business) environment that isnot fully conducive to business operations, asreflected in a number of factors. The country lagsbehind in technological innovation; there isinadequate preparedness to use and benefit fromICTs; trade competitiveness is relatively weakdue to inadequate availability of productiveinputs; there remain many and lengthyadministrative procedures pertaining toenforcement of contracts, property registrationand new business start ups; the laws relating to
firing workers are relatively stringent, and thecoverage of credit histories of potential investorsby bureaux are inadequate.
4.27 What this assessment implies is that there is aneed to focus reforms not only on themacroeconomic environment and the efficiencyof public institutions but also on the broaderaspects of competitiveness in order to enhancethe country’s growth prospects. This conclusionis derived from the fact that progress has alreadybeen made in macroeconomic and institutionalreforms while there is need to focus on identifiedweaknesses. Moreover, in terms of constraintsto doing business in Botswana, reforms wouldneed to be selective given that the country excelsin some areas. The major areas of concern arethe administrative and bureaucratic delays,which have the potential to hold back privatesector investment and the associatedemployment and growth of incomes, while alsodelaying technology transfer that come with FDIand the associated potential technical progressfacilitated by imported newer technologies.Further, it was noted earlier that, generally, thenation is not ready to fully exploit the benefitsof ICTs. This is an important area on which tofocus reform efforts given the key role-playedby technological advances in productivityimprovement.
Assessment of Fundamental Sourcesof Growth in Botswana
Improvements in Institutional Effectiveness,Governance and Elimination of Corruption
4.28 Increasing the pace of capital accumulation inan economy will matter little for the achievementof sustained economic growth if individuals andcompanies do not have meaningful propertyrights, reliable courts that can enforce contracts,and availability of other basic marketinstitutions. It has been shown in the previoussections that in Botswana securing propertyrights is relatively cheap, investors’ rights arewell protected and commercial contracts areenforced in a relatively short period of time. The

98
BANK OF BOTSWANA ANNUAL REPORT 2004
major issue is that of efficiency and effectivenessof public agencies. Furthermore, Botswana hastaken an important step by setting-up aDirectorate on Corruption and Economic Crime(DCEC), although its establishment does notsuggest the existence of rampant corruption.Botswana is well known to excel on measuresof corruption at a global level. On occasion,however, significant cases of alleged corruptpractices do emerge leading to the establishmentof judicial commissions of enquiry such as thaton state land allocations in Gaborone in 2004.The success of the DCEC has been ambiguous,however, and perceptions (although these maynot be borne out of any concrete evidence) aboutthe absence of its full independence, lack ofimpartiality and ineffectiveness have yet to befirmly dealt with.
Soundness and Efficiency of the LegalFramework
4.29 The FIAS study, conducted for the BotswanaGovernment in 2003, concluded that, while fairand transparent, the legal system in Botswananeeds to significantly improve its efficiency andeffectiveness at the implementation level.Evidence from the study suggests that manyadministrative processes and documentation aremanually driven and could be automated toimprove their efficiency and accuracy. Examplesof such systems are the processing of land andof company registration and lawsuits in court.Automation would require the upgrading ofskills in the public service and a change ofmindset so that staff approach work with the rightattitude. This finding is consistent with theoutcome of the analysis of indicators of ease ordifficulty of doing business, in particular, themany procedures involved that inevitably causedelays in processing paperwork. Automation ofmany of the processes would reduce thecompliance burden on businesses but wouldneed to be accompanied by appropriate stafftraining. Improved efficiency would raise civilservice productivity, act as an incentive tobusinesses to increase investment and improvethe country’s economic prospects.
Transparency and Accountability in PublicSector Resource Management
4.30 Botswana has made a start in this regard inimproving transparency and accountability.Accountability has been infused in the publicsector by introducing performance contracts forsenior civil servants and a performance-basedappraisal system for the rest of the employees.Moreover, ministries and governmentdepartments are now more transparent in theiroperations and regularly report progress in themedia on their activities against set measurabletargets. It is still too early to judge the successof these reforms given that they were introducedrecently and their effectiveness is recognised asbeing pro-growth.
Removal of Labour and Product MarketRigidities
4.31 Labour and product market rigidities can impedeoutput growth. The aim of reforms should be tocreate flexibility in these markets. As seen above,the labour market in Botswana is not as heavilyregulated as markets in other countries, exceptwith respect to firing redundant workers wherethere exists a fair amount of rigidity, while theproduct markets operate on market-orientedprinciples, except in cases of administered pricesfor fuel products and those set by monopolyparastatals.
Increased Investment in Human Capital4.32 Continued human capital formation is key to
improving service delivery in all aspects ofeconomic performance and service delivery,especially in the field of education and healthcare. It was noted earlier that in Botswana,government spending in these areas has beensubstantial. Going forward, however, the keyconcern is to ensure that such spending istranslated into sound human capitaldevelopment, which will raise the capability touse technology for improvements ofproductivity. Furthermore, there will be a needto continually develop appropriate responses tothe HIV/AIDS epidemic, which has the potential

99
IMPROVED PRODUCTIVITY – THE KEY TO SUSTAINED GROWTH AND HIGHER LIVING STANDARDS FOR ALL
not only to reduce the labour force throughdeaths but also to militate against productivityimprovements through absenteeism related toillness, the need to care for the young and otherdependents as well as attending to bereavements.
Openness to International Trade4.33 Research has shown that careful timing and
speedy removal of obstacles to trade,particularly, tariffs and non-tariff barriers(NTBs) could potentially improve economicperformance. Freer trade contributes to highereconomic growth by challenging domesticproducers to produce competitively for bothlocal and international markets. For its part,Botswana is implementing provisions of theSouthern African Development Community(SADC) Trade Protocol which seeks to freeintra-regional trade through the lowering ofimport duties and simplification of tariffstructures. This is done in the context of a freetrade area (FTA) agreement expected to belaunched in 2008. The Protocol envisages thatat least 85 percent of intra-SADC trade shouldbe tariff free by that year, while NTBs shouldhave been eliminated. Opening up of trade isexpected through the negotiations on FTAsbetween SACU, of which Botswana is amember, and other countries (USA) and regionalorganisations (the Southern Common Market29(MERCOSUR)). Freeing up trade is importantfor Botswana in view of the fact that it did notfeature on the list of the top 5 most tradecompetitive countries in Africa despite its goodperformance on many aspects of economicperformance. The development of the resourcebase and further improvements in infrastructurewould contribute greatly to facilitatingBotswana’s trade with the rest of the world.
Maintenance of Macroeconomic Stability4.34 An appropriate macroeconomic environment is
characterised by, among others, low fiscal
deficits as a proportion of GDP. This parameterreduces the risk of unsustainable fiscal deficitswhich would result in arrears, higher inflation,or higher future taxes. Large government debtor fiscal deficits are inimical to private investorsbusiness confidence. Fiscal deficits and largedebts can be contained through improving theefficiency of the tax system and reduction ofunnecessary expenditures. Lower fiscal deficitspermit government to reduce its borrowing fromthe financial system, thereby providing greaterscope for bank financing of the private sector.Fortunately, the Botswana Government is not amajor borrower from the banking system, as aresult the possibility of crowding out the privatesector borrowing is currently not a problem. Infact, to the extent that the Government hasborrowed domestically – through issuance ofbonds in 2003 – it has done so in an effort todevelop the local capital market.
4.35 Botswana’s tax system is fairly streamlined, withone of the lowest marginal tax rates in the regionand is reasonably efficient. These attributesnotwithstanding, the recent FIAS study hasconcluded that the two-tier company tax systemis complex and should be simplified for thebenefit of investors and for improvement inadministrative efficiency and effectiveness.Although sound in principle, the proposal mayhave problems in its practical application. Therecent establishment of an operationallyindependent Botswana Unified RevenueServices Authority, which will deal with tax-related issues, is expected to boost administrativeefficiency and effectiveness.
4.36 Another aspect of a proper macroeconomicenvironment is the maintenance of low andstable inflation. High inflation raises the cost ofborrowing and reduces the rate of capitalinvestment and output growth by adverselyaffecting business planning and expectations. Inan environment of high inflation there isuncertainty regarding the return on capital asinvestors cannot accurately forecast costs andprofits. Large and rapidly growing fiscal deficitscomplicate monetary policy management to the
29 MERCOSUR comprises Argentina, Brazil, Paraguay andUruguay.

100
BANK OF BOTSWANA ANNUAL REPORT 2004
extent that the large and continuing fiscal deficitsgenerate inflationary pressures. Growth ofGovernment expenditure is one of the twoindicators of demand pressures that is closelymonitored in the current monetary policyframework of the Bank of Botswana.Fortunately, Government expenditure growthhas in recent years complemented anti-inflationmonetary policy.
Maintenance of a Realistic Exchange Rate4.37 An overvalued exchange rate discourages
production for exports while import substituteswhich become cheap relative to domesticallyproduced goods limit the degree of economicdiversification and, therefore, the country’sability to withstand external supply shocks.Botswana’s exchange rate policy aims atsupporting the competitiveness of domesticproducers by ensuring relative stability of thevalue of the Pula over the long term. Asmeasured by the real effective exchange rate(REER), export competitiveness has been erodedin recent years. It is, however, worth noting thatthe exchange rate is by no means the primeinstrument for achieving competitiveness.Productivity improvement, which is a functionof business management and other factorspreviously cited, is important as well.Furthermore, it is impossible to set the exchangerate to suit the needs of all users of foreignexchange, which is why hedging has historicallyformed part of managing foreign currencydenominated transactions.
Improvements in Infrastructure andPrivatisation of State-Owned Enterprises
4.38 Research has shown that major privateinvestment cannot take off unless there is anadequate provision of quality essential publicgoods and services. As previously stated,Botswana has scored well on the infrastructureindex, but this was mainly a result of goodtelecommunications and road networks.However, the country has performed less wellin other areas, such as energy and water
resources development. In some of these areas,government intervention through state ownedenterprises may no longer be justified andprivatisation could be a serious option in viewof the need to improve efficiency and encourageinnovation and dynamism in the private sector,while ensuring that sufficient competition isintroduced. Under appropriate regulatorysystems it would be beneficial for productivityto transfer a public monopoly to a privatemonopoly. However, there are diverse viewswith regard to employment generation throughprivatisation. While the Government has, inprinciple, embraced privatisation, itsimplementation has been slow. A privatisationmaster plan, which provides a framework for theprivatisation process, has been prepared, whilein-depth studies of potential candidates forprivatisation are ongoing. However, none of theidentified institutions have been privatised todate. Furthermore, a competition policy is beingdeveloped to address, among others, competitionissues in general and uncompetitive practicesthat might emerge as state-owned enterprises areopened up to private sector participation. Acareful consideration of the privatisation policyis a necessity considering the smallness of thedomestic market, which makes it potentiallyvulnerable to the emergence of collusion inpricing among newly privatised oligopolies thatcan work against competition. In the past, suchcollusive tendencies have been alluded to inrelation to banks and major constructioncompanies.
Strong Financial System4.39 The financial system of a country facilitates
economic activity by providing efficientfinancial intermediation. Successfulintermediation requires the existence of a broadrange of financial intermediaries withappropriate instruments capable of adequatelyserving the financial needs of different economicagents. An inefficient and ineffective financialsystem could retard economic growth. Attemptsat reforming the financial sector are oftendirected at initiating or strengthening policies

101
IMPROVED PRODUCTIVITY – THE KEY TO SUSTAINED GROWTH AND HIGHER LIVING STANDARDS FOR ALL
that enhance savings mobilisation and theireffective use by deficit sectors as well as thedevelopment of appropriate market-orientedtools for controlling inflation. The frameworknecessary for the attainment of this objectiveinvolves deepening and broadening financialmarkets, more effective regulation, andsupervision of banks and non-bank financialinstitutions, timely dealing with the problem ofpotential insolvency of banks, fostering offinancial sector competition and strengtheningthe legal framework for banking activities.
4.40 While statutorily an agent of the Government,the Bank of Botswana is operationallyindependent with respect to the setting ofmonetary policy, except on a consultative basis.Over the years, the Bank has increasinglybecome more transparent in terms of its conductof monetary policy. It has, since 1998, issuedmonetary policy statements each year and from2002, included an explicit inflation objective forthe year ahead. The regulatory and supervisoryoversight of the banking system provided by theBank is adequate, banks are sound, while theBank successfully handled the exit of failingbanks in the past (see 2001 Bank of BotswanaAnnual Report). Recently, the 2003 Bank’sAnnual Report concludes that ‘…the regulatoryenvironment in Botswana has become morecompetition-friendly’(p107). There is anoverwhelming presence of foreign capital in thebanking system and competition is fairly healthy,although this may, at first sight, seem counter-intuitive considering the high concentrationlevels and profitability in the banking system.However, there is no overarching regulatory andsupervisory authority for non-bank financialinstitutions; work is in progress for the creationof such an authority.
Need for Increasing the Ratio of PrivateInvestment to GDP
4.41 This ratio can be increased by the combinedeffect of all the preceding factors that relate tosound policies, effective institutions, a suitablemicroeconomic environment, the existence of
good infrastructure, well developed humanresources, an increase in the capability to useand apply technology at the individual, businessand government levels, the existence of healthycompetition and good governance. Some of thespecific issues that would need to be dealt within order to raise investment are addressed below.
4.42 A survey of senior managers of firms conductedby FIAS revealed that the lack of access to landand delays in issuing work and residence permitswere among the main concerns to investors. Theother areas of concern include tender regulations,competition law, labour regulations, businesslicensing and tax administration. All of thesefactors ultimately have a bearing on economicefficiency, productivity, output growth andhuman welfare. Access to land needs to beimproved by eliminating the legal obstacles thatcause artificial shortage of serviced land in someareas.
4.43 A further observation in the FIAS report is theneed for clarity in government functions andremoval of overlapping responsibilities amongvarious agencies as well as simplification ofprocedures for the benefit of both investors andexecuting agencies. Inefficiencies in thesegovernment functions ultimately have an adversebearing on economic efficiency, productivity,output growth and, therefore, human welfare.
4.44 A major policy challenge is the declining ratioof FDI to GDP in recent years, while localentrepreneurship is not developing rapidlyenough to substitute for the slowdown in FDI.In this respect, the FIAS study made severalrecommendations on ways to attract FDI andaddress identified deficiencies in Government’sadministrative and bureaucratic functions. Itconcludes that Botswana must maintain its openand liberal policy towards FDI while payingsufficient attention to the development of localentrepreneurship and fostering appropriatelinkages between the two. The inadequacy ofFDI suggests that the Botswana ExportDevelopment and Investment Agency (BEDIA)needs to enhance its efforts to attract investment.

102
BANK OF BOTSWANA ANNUAL REPORT 2004
However, the institution responsible forpromoting local entrepreneurship development,the Citizen Entrepreneurial DevelopmentAgency (CEDA) offers subsidised financialsupport at the lower end of the scale of supportand investment finance at market-related interestrates at the upper end through a venture capitalfund.30 It also provides training and mentoringservices. Although this effort is a commendablesupport to business growth, it remains to be seenhow well the programme will assist in bringingabout sustainable and high quality businessventures capable of exporting. The 2005 BudgetSpeech noted that through its training andmentoring programmes CEDA has trained 600potential investors to date on entrepreneurialdevelopment, basic accounting and sectorspecific issues. However, challenges remainfacing CEDA projects, eg., managementproblems, lack of basic infrastructure andunfavourable credit terms from suppliers.
5. PRODUCTIVITY, SUSTAINED GROWTHAND HIGHER LIVING STANDARDS FORALL
5.1 So far, this review has mainly dealt with the needto raise productivity in order to increase outputon a sustainable basis. This section examines,in more detail, how such output growth translatesinto rising prosperity as measured by householdincomes. The analysis is done in the context ofrecent data on household income growth andemployment trends in Botswana.
5.2 For purposes of perspective, it should be stressedthat there is little dispute about the need forsustainable output growth since higher livingstandards cannot be achieved purely throughredistribution of existing income and wealth andpolicies that seek to improve the ‘quality of life’.
Therefore, it is important to investigate the extentto which an economic system, which stressesefficient production, and the rewards of innovationand productivity, can both promote output growthand be relied upon to secure rising prosperity acrossthe population, or whether significant additionalpolicy interventions are also needed.
5.3 In this regard, it should be recognised that theobjective of economic efficiency is notsynonymous with concerns for equity and socialjustice. In fact, the two cannot be expected tocoincide: the former is based on rewardingcontribution, the latter on allocation accordingto need. It would only be through coincidencethat contribution and need could be matched, andattempts to combine them to any significantextent would itself result in inefficiency as wellas result in policy and administrative confusion.
5.4 That is why the use of minimum wages as majortool for poverty reduction creates practicalproblems of trying to combine the two objectivesof efficiency and equity. Wages are paid toindividual workers based on their contributionat the work place, but whether this covers theirneeds and, therefore, their level of poverty, isdetermined by other factors, particularly the sizeand/or incomes from other members of theworkers’ households, and it is hard to imagine astructure for wages that can successfully takethese specific situations into account.31
5.5 However, this observation does not imply thatthe objectives of efficiency and equity areinexorably in conflict to the extent that pursuingone necessitates significant compromises on theother. One of the main purposes of this reviewis to emphasise the great potential of economicefficiency to support the broader socialobjectives, and that Botswana is a good exampleof efforts to attain the two objectives in practice.
5.6 In this context, it should be recalled that Section30 Limits are as follows: Small Micro Scale Projects – P500to P150 000 at 5 percent interest rate per annum; MediumScale Projects – P150 001 to P2 000 000 at 7.5 percentinterest rate per annum and Large Scale (Venture CapitalFund) Projects – over P2 000 000, promoters pay 25 percentof total project cost as equity and pay market related interestrates.
31 This is not to say that there is no justification for minimumwages, but that their use as a tool of poverty reduction isseverely limited.
103
IMPROVED PRODUCTIVITY – THE KEY TO SUSTAINED GROWTH AND HIGHER LIVING STANDARDS FOR ALL
2 discussed the institutional basis for growthwhich included the dimension of marketlegitimising institutions; these in turn, coveredexplicit reference to the need for the provisionof social protection. Therefore, the task of layingdown the foundation for productivity andgrowth, should take into account the needs ofthose who lose out and that this approach is anessential ingredient for a pro-growth economicenvironment.
Economic Growth, Poverty and Inequality5.7 In Section 2, it was indicated that there is a direct
link between productivity and living standardsin that per capita GDP (Y/L), or average incomefor the whole population, is mathematicallyidentical to average labour productivity. But,while per capita GDP is one of the most widelyused summary indicators of welfare, it is notdifficult to see its limitations. On the one hand,the measure of labour force is the wholepopulation which includes large numbers whoare not in the workforce, especially the elderly,the young, the sick and the unemployed. On theother hand, not all of GDP is distributed directlyto the households in the form of incomes. InBotswana, for example, employment incomecomprises only about one-third of GDP, whileconsumption spending by government hasmostly been of similar magnitude to that ofhouseholds. Therefore, it is easy to appreciatethe concern that the income received byhouseholds may have little in common withtrends in what may be a rather notionally relatedaverage, such as per capita GDP.
5.8 Such concerns become even more serious in thecontext of growth that is based on technicalinnovation, as the inevitable accompaniment oftechnical progress is the redundancy of existingskills and technologies. There can be no denyingthat dynamic development is a process wherethere are both winners and losers, and resistanceto change by the latter is understandable. This isespecially the case since job losses due tochanging technologies are less likely to betransitory as the job-specific skills of the affected
workers are no longer in high demand. Even ifsuch displaced workers are able to findalternative employment, there is a stronglikelihood that such alternatives would attractlower levels of remuneration.
5.9 This factor points immediately to the need forcredible mechanisms of support for those whodo not immediately benefit from technologydriven economic growth in order to amelioratetheir prospects in the short term. However, it isalso apparent that the focus of such supportshould be to facilitate adjustments to newpatterns of employment based on utilising newtechnologies to the best advantage rather thanthe protection of unproductive jobs. Even if thereare legitimate concerns about the impact oftechnology on employment, most economistswould not argue for policies that stand in theway of innovation, as these are likely to worsenunemployment and social welfare.32 Moreover,while the fear that advances in technology leadto permanent job losses remains common, it isnot supported by evidence. In fact, experiencesuggests that there is a case for technology thatis directly ‘labour saving’ since immediate joblosses are, over time, offset by the wider impactof lower costs and prices which increaseopportunities for poorer households and theaccompanying stimulus to demand that providesnew employment prospects. There is evidenceto suggest that unemployment tends to be morepersistent when the labour market is constrainedby regulations that, however well intentioned,aim to ‘protect’ jobs and slow down innovation.
5.10 However, there is a legitimate concern regardingthe extent to which growth is typicallyaccompanied by widening inequality in income,
32 See Humphrey, T. (2004) ‘Ricardo versus Wicksell on JobLosses and Technological Change’ Economic Quarterly,Federal Reserve Bank of Richmond Vol 90/04. This debatehas recently resurfaced in the context over the concerns of‘outsourcing’ of jobs in the United States. But it is of widerrelevance, including in Botswana where there is on-goingdebate over whether additional efforts should be made toencourage processing of natural resources within thecountry.

104
BANK OF BOTSWANA ANNUAL REPORT 2004
which implies that the number of ‘winners’ willtend to be relatively small compared to ‘losers’.This concern is commonly reflected in thecommon assertion that ‘the rich get richer whilethe poor get poorer’. There is little hard evidenceto support such a claim, and certainly not as ageneral trend. Rather, research indicates that:
(a) poverty reduction is closely related tosustained economic growth in the long run.In other words, growth is not anti-poor;
(b) the benefits of growth can, and frequentlydo, take considerable time to filterthroughout the population;
(c) the impact of growth on inequality is largelydependent on country-specificcircumstances. Growth can foster bothincreased inequality and its reduction.
5.11 In Africa, there are cases where over the pastthirty years or so the poor have become poorerand inequalities have increased (see Artadi andSala-i-Martin, 2003).33 However, this findingrelates mainly to countries that have generallyhad very low growth rates. It cannot, therefore,be assumed that in countries with higher growthrates due to the adoption of policies that havetransformed institutions and mechanisms forincome distribution, that the same degree ofincome inequality would prevail.34
Income Growth, Poverty and Inequality inBotswana
5.12 Nevertheless, in the case of Botswana, whichhas achieved high growth rates, there is
widespread belief that income inequalities arehigh and rising. However, this perception is notsupported by available evidence, the most recentof which is from the 2002/03 HIES as indicatedbelow.
5.13 First, average household disposable income,between 1993/94 (when the previous HIES wasconducted) and 2002/03, grew by 139 percent,or approximately 14 percent in real terms onceinflation is taken into account. This ratecompares with an increase of 164 percent in GDPper capita (31 percent in real terms).35 Thisresults may initially suggest that growth inhousehold incomes has lagged significantlybehind that of per capita GDP. However, accountalso needs to be taken of household sizes, whichfell by about 11 percent on average over the sameperiod. Once this is allowed for, the growth inhousehold incomes was 167 percent (27 percentin real terms), which is very close to growth inper capita GDP. This finding provides supportto the claim that, within a relatively short period,GDP growth is reflected in a rise in incomes.The breakdown of the income growth isdiscussed in more detail below.
5.14 Information on trends in income inequality isgiven in Table 2.4 for the 1985/86 – 2002/03period using data from the three surveysconducted in Botswana.36 The Table shows thegini coefficient (GC), which is a standardsummary statistic for measuring inequality. TheGC varies between zero and one, with a lowervalue indicating greater equality. Only data forthe national and urban categories are shown forall three periods as the division between ruraland urban villages was introduced only in 1993/94.
5.15 At the national level there has been no clearmovement in overall inequality. The GC hasmoved in both directions, and most recently
33 Artadi, E. & Sala-I-Martin, X. (2003) The EconomicTragedy of the XXth Century: Growth in Africa NBERWorking Paper 9865 for detailed calculations of patternsof income inequality in Africa.
34 This is not to claim that rapidly widening inequalities wouldautomatically be averted at higher average growth rates.As noted, this will be determined by country-specificcircumstances. But, given the nature of institutions thatform the foundations for growth on a sustained basis, itmay be hoped that the most egregious cases could generallybe avoided.
35 To make real comparisons household incomes and percapita GDP are deflated by the change in the consumerprice index and the GDP deflator, respectively.
36 There was also an earlier Rural Income Distribution Survey(RIDS) conducted in 1974/75.

105
IMPROVED PRODUCTIVITY – THE KEY TO SUSTAINED GROWTH AND HIGHER LIVING STANDARDS FOR ALL
upwards, suggesting an increase in inequality.But this has not been to any significant degreeand certainly not enough to support any claimsabout dramatic increases in inequality, especiallyas it is in the context of high GDP growth rates.In terms of international comparison, while a GCof about 0.4 or below is normal for mostdeveloped countries, a level of about 0.55 is high,but not exceptionally so, for developingcountries.37
5.16 There have been more significant changes to theGCs for the various sub categories. While urbaninequality has decreased, it has increased in both
urban village and rural areas. To help interpretthese trends, Table 2.5 gives more informationon the growth in average incomes, broken downaccording to the type of settlement (urban, urbanvillage, and rural). Both household and per capitaincomes are shown as well as two measures ofaverage income: the mean and the median. Tothe extent that the median income has grownfaster (slower) than the mean this is an indicatorof income growth being more concentrated inlower (higher) income households.
5.17 Taking the information from Tables 2.4 and 2.5together, the following picture emerges for thethree settlement types:
• Urban: real income levels are up by 18percent on a per capita basis and more forthe median than the mean. This is consistentwith well functioning urban economy whererapid expansion has substantially benefitedmost households.
• Urban Villages: Average per capita incomeshave risen sharply by 45 percent. While themedian income has gone up by a lot less thanthe mean, it is still higher than the increasein the urban areas. This points to morepositive reasons for increased inequality,reflecting a transition to a more moderneconomy where, as seen in the incomefigures, the benefits are spreading quitewidely. However, growing inequality mayreflect a more pervasive lack of incomeearning opportunities than in the urban areas.
1985/86 1993/94 2002/03National 0.56 0.54 0.57Cities & Towns 0.54 0.54 0.50Urban Villages 0.45 0.52Rural 0.41 0.51
TABLE 2.4: TRENDS IN INCOME INEQUALITY,1985/86 – 2002/03 (GINI COEFFICIENT)
1. The gini coefficients are calculated on a per capitarather than a household basis.
Source: Central Statistics Office
37 See, for example the 2004 UNDP Human DevelopmentReport, where Table 14 in the Human DevelopmentIndicators section includes GCs for a wide range ofcountries. For instance, this shows that the average GC forthe four other SACU members is 0.64. However, care mustbe taken in making comparisons, as the basis of calculationmay differ between countries. (The same table gives a valuefor Botswana of 0.63, substantially higher than reportedabove, and the source for which is not known.)
Household Per capitaH’hold Size Mean Income Median Income Mean Income Median Income
National –10.6 13.6 20.4 27.1 34.8Cities & Towns –6.7 10.3 13.0 18.1 21.1Urban Village –8.6 32.8 16.5 45.3 27.4Rural –14.6 2.4 –15.0 19.8 –0.6
TABLE 2.5: REAL INCOME GROWTH,1 1993/94 – 2002/03 (PERCENT)
1. Real income is calculated by adjusting for the change in the national Consumer Price Index between December 1993 andDecember 2002.
Source: Bank of Botswana

106
BANK OF BOTSWANA ANNUAL REPORT 2004
• Rural: Lower rates of income growth havebeen partly offset by the more rapid declinein average household size. But while meanreal incomes have increased at a healthy rate(20 percent) the median income has fallenby one percent. This suggests the emergenceof a significant rural underclass which hasyet to benefit from the recent expansion ofthe economy and which risks getting leftfurther behind. This is the negative side ofincreasing national inequality.
5.18 Table 2.6 provides estimates of poverty basedon the HIES. In 2002/03 the proportion of thepopulation classified as poor was just over 30percent. This compares to 47 percent in 1993/94and 59 percent in 1985/86. That living standardshave increased across the population is furthersupported by evidence on living conditions inthe 2001 census, which records significantimprovements in areas such as housing,sanitation and access to modern energy. The mostdramatic falls in poverty were in the towns andcities where, after virtually no change since1985/86, the rate fell from 29 percent to 10percent between 1993/94 and 2002/03. Thisprovides further support to the view that a wellfunctioning market economy includingwidespread access to employment opportunitiesis the most effective means of poverty reduction.It is of course a matter of opinion whether thisrate of poverty reduction has been sufficientlyrapid, but it would be hard to point to a countrywith a better record and, furthermore, such a rateof progress is close to what is required to meetthe ambitious targets for poverty reduction inVision 2016.38
Employment Trends5.19 It seems clear that one of the priorities should
be for growth to be generated in such a way thatit also increases employment opportunitiesacross the population. If more people are
contributing to output and gaining directly fromtheir participation in economic activity, then thisimmediately reduces the potential burden ofwelfare support programmes, lessens resistanceto job losses through innovation, and eases thetask of maintaining faith in the legitimacy of themarket system. However, a pro-employmentgrowth-oriented policy is not necessarily infavour of labour intensive activities. It impliesadaptation to changing market conditions andflexibility in labour mobility which can befacilitated by training and re-trainingprogrammes.
5.20 The challenge of job creation in Botswana isgenerally recognised. According to the 2001Population and Housing Census, unemploymentwas nearly 20 percent, sharply up from 14percent at the time of the previous census.Subsequent indicators suggest that it hascontinued to rise with the 2002/03 HIESestimating a national unemployment rate of 24percent.
5.21 Obviously such high levels of unemploymentare not desirable. However, the aggregateunemployment rate tells only part of the story.While rising unemployment is usually taken asa sign that growth in Botswana has beenunbalanced with too little diversification intosectors where jobs could be created in largernumbers, there is also evidence that the increasewas due in large part to continuing dynamicdevelopment with the potential rewards of themodern economy leading to the erosion ofprevious employment patterns.
38 Which aims to halve poverty levels by 2006 and eradicateit by 2016
1985/86 1993/94 2002/03National 59 47 30Cities & Towns 30 29 10Urban Villages 58 46 25Rural 68 55 45
TABLE 2.6: POVERTY IN BOTSWANA (PERCENT OFPOPULATION)
Source: Central Statistics Office

107
IMPROVED PRODUCTIVITY – THE KEY TO SUSTAINED GROWTH AND HIGHER LIVING STANDARDS FOR ALL
5.22 Table 2.7 shows in more detail the changingpatterns of employment in Botswana betweentwo censuses and points to more positiveaspects. Most importantly in this respect, thenumbers of new jobs being created at 121 000,including self-employed, was very similar to,slightly greater even, than the increase of 118000 in the labour force. The entire increase inunemployment was due to the dramatic declinein the numbers working in more traditionaloccupations, particularly traditional agriculture.There is no reason to believe that opportunitiesin these sectors have declined, at least notsignificantly, as farmers frequently complainthat they cannot find enough workers. Rather,people have chosen not to work in thesubsistence sectors, where low levels ofproductivity are matched by low incomes. Thisputs a different perspective on the resultingunemployment. At an earlier stage ofdevelopment in Botswana, it was assumed thatunemployment would not be a serious problemas jobless people would return to subsistenceagriculture; while minimum wages were setdeliberately in relation to rural incomes in orderto discourage migration to towns and cities.However, this model clearly no longer appliesas urbanisation has become more permanent.The challenge is to create conditions whichensure that the increase in unemploymentresulting from rapid economic transformationis only temporary.
5.23 Table 2.7 also emphasises the potentialimportance of self-employment, which grew byan average of nearly seven percent per annum,nearly twice as fast as that in paid employment.The importance of the small business sector foremployment creation is a feature of manyeconomies, and it is important that anyconstraints are removed that may impederealising its employment creation potential. Thisis not to say that self-employment offers highlyremunerative jobs: many, such as the variousstreet vendors, are clearly in the low-incomecategory. But as the figures for urban incomesillustrate, this can still have a significant impacton improving the livelihoods of poorerhouseholds.
5.24 Table 2.8 gives estimates from the HIES ofunemployment by settlement and gender. Thedata appear to be generally consistent with thetrends in income discussed above. The lowestunemployment is in the urban areas. This isattributable to a well functioning urban marketeconomy, and was associated with greaterequality in incomes related to which is thecontinuing rural to urban migration. Ruralunemployment is very close to the nationalaverage and may reflect the continuing relianceon subsistence farming by the remaining ruralpopulation, which may have mitigatedunemployment but has not resulted in significantincreases in income levels. Unemployment ishighest in the urban villages, suggesting thatthere is only a partial spread of the moderneconomy to these areas together with anincreased reluctance (especially among the
TABLE 2.7: ECONOMICALLY ACTIVE POPULATION1991 – 2001 (‘000)
Source: Central Statistics Office
1991 2001
Change(%)
Annualgrowth
(%)Employee 275.7 370.5 34.3 3.0Self-Employed 28.6 54.7 90.8 6.7
Family Business 7.9 6.4 –18.8 –2.1Lands and Cattle Posts 67.6 17.6 –73.9 –12.6
Seeking Work 60.4 109.5 81.4 6.1
Total 440.3 558.7 26.9 2.4Unemployment Rate (%) 13.7 19.6
Male Female TotalNational 21.4 26.3 23.8Cities and Towns 15.5 21.6 18.5Urban Villages 28.9 30.3 29.6Rural 20.3 26.7 23.1
Source: Central Statistics Office
TABLE 2.8: UNEMPLOYMENT BY SETTLEMENT TYPE,2002/03 (PERCENT)

108
BANK OF BOTSWANA ANNUAL REPORT 2004
young – the unemployment in urban villages inthe 20–24 age group was 56 percent) to take uptraditional subsistence activities.
5.25 For employment opportunities to be increased,it is important that people have realisticexpectations concerning remuneration.Acquiring additional skills may notautomatically enhance earning potential,especially for new job seekers compared withthose that are changing jobs. The latter have awork track record of relevant skills that arereflected in their remuneration levels in previousemployment. The possibility that overly highexpectations about wages can contribute tounemployment should not be ignored especiallyin relation to those entering the job market forthe first time where formal educationalqualifications are only an imperfect indicator ofcapacity to produce in a work environment. Thismay be relevant to Botswana in the context ofthe rapidly increasing numbers passing throughhigher-level education. This can raiseexpectations of immediate access to good jobsto an unrealistic degree. Again this is a problemthat reflects the pace of adjustment in theeconomy, where its small size makes fluctuationsin the size and composition of the labour forcemore difficult to absorb (and adds further to thedifficulties in effective manpower planning) aswell as, perhaps, practical problems associatedwith the rapid expansion of tertiary education,which may have in some cases compromised thequality or the relevance of courses.
5.26 It is also important for other inputs toproduction to be readily available. It will berecalled from Section 2 that of the four sourcesof increased labour productivity, only one wasdirectly due to labour itself; the others wereeither due to other inputs or the way theyoperate together. Except in special cases, labourworking by itself, even when highly skilled, canachieve very little. This is the main reason whymuch labour intensive production is not veryremunerative: it is typically not veryproductive, even if the work involved is selfevidently ‘hard’. Productive potential and,
hence, productive employment, entails workingeffectively with other inputs.
5.27 Improving accessibility to other inputs has manydimensions. It is one reason why the role of thefinancial sector in providing funds in thenecessary form to suit the needs of business isso important. Also the potential of smallbusinesses may not be fully unlocked if there isnot easy access to other inputs, such as land andmachinery, in sufficiently small quantities andreasonable prices and with adequate security (i.e.backed by properly enforceable contracts).Improving access does not, however, entailcharging artificially low prices; prices mustproperly reflect the costs of supply. Although insome instances subsidies may appear justified,it must never be forgotten that subsidies mustbe financed, which requires a transfer ofresources from elsewhere (through additionaltaxation or reductions in other spending), andthe impact of this must also be considered.
The Limits of Redistribution5.28 It is realistic to assume that there will always be
a significant number of people requiringassistance over and above what they receivethrough employment and other sources ofpersonal income. Such support normally takesthe form of social safety nets. In Botswana, theassistance is promoted in the form of old agepensions, orphan care allowances, destituteallowances and drought relief schemes.Government’s spending on the safety net hasbeen increased by the demographic trends thathave accompanied the dynamic development ofthe economy. In particular, increasedurbanisation has weakened the extended familysystem which has, in the past, provided informalnetworks of social support. At the same time, asincomes have risen the standards expected ofwelfare provision have correspondingly risen,often beyond the scope of intra-family transfers.Moreover, the socially disruptive impact of theHIV/AIDS epidemic has increased theGovernment’s burden further.
109
IMPROVED PRODUCTIVITY – THE KEY TO SUSTAINED GROWTH AND HIGHER LIVING STANDARDS FOR ALL
5.29 The major burden of funding such social welfareprogrammes is borne by the financially betteroff sections of the economy in the form ofprogressive taxation. In Botswana’s case low-income earners are not subject to direct taxation,while those with higher incomes are taxed at amaximum rate of income tax of 25 percent.
5.30 With the assistance of mineral revenue,Botswana has been able to implement ambitiousspending programmes without resorting to arelatively high rate of taxation. For this reason,the challenges are to ensure that support is welltargeted and that those with ability to pay forpublic services do so. It is against thisbackground that the introduction of cost recoverymeasures, while inevitably unpopular, areexpected to increase the resources that wouldbe available to those most in need of assistance.
6. CONCLUSION6.1 This review demonstrates that productivity is an
important input to economic growth, whichsupports development and a rise in livingstandards. To improve output growth,productivity has to increase for all the factors ofproduction, including labour and physicalcapital. An important feature of productivitygrowth is innovation and technologicalimprovements that induce enhanced contributionto production and output by both capital andlabour. However, apart from technology, nationalpolicies, institutions and attitudes play animportant role in productivity improvements.While increases in productivity contribute tohigher incomes and faster growth, most of theincome and increase in living standards accrueto the section of the population that is directlyinvolved in productive activity with those whoare not benefiting less. Despite this, achievinghigh rates of growth ultimately leads to overallimprovements in living standards even ifaccomplished by direct allocation of resourcesto those who are less well off.
6.2 For Botswana, overall output growth has beenrelatively high but has declined in the more
recent past, with a significant deceleration, froman average of twelve percent per annum between1975 and 1985 to six percent in the last ten years.The measures used in this review show that whilemost of the growth in output has beenattributable to an increase in capital and to alesser extent, a rise in the contribution of labour,there has also been notable contribution fromgrowth in productivity. The faster growth incapital compared to labour has resulted in a risein capital intensity of production as well as afaster increase in the income share of capitalcompared to the income share of labour. Theincrease in productivity reflects the impact oftechnology improvements on capital, which also,together with enhanced skills generated byhigher investment in education and health,contributed to the rise in productivity of thelabour force.
6.3 The growth in productivity is also associatedwith shifts in sectoral contributions to output,notably the shift away from the secondary sector(e.g., manufacturing, construction and water andelectricity) towards private sector services, inparticular, banking, insurance and businessservices.39 The importance of this shift is alsoreflected in factor use as indicated by the rise incapital intensity and labour income for theservices sector. The review also indicates thatwhile the growth in productivity is relativelyhigh on a global scale it is, nevertheless,significantly lower in relation to the rate ofoutput expansion, suggesting that there isconsiderable scope for improvement to supporteven higher rates of economic growth. Thishighlights the fact that although factoraccumulation is a necessary condition forgrowth, it is not sufficient, and that an increasein factor productivity plays a fundamental rolein the determination of output growth. Moreover,it is worrisome that there has been a trend decline
39 The primary sector comprising mining and agriculture haslargely maintained its share because of the importance ofthe former while the share of agriculture has rapidlydeclined.

110
BANK OF BOTSWANA ANNUAL REPORT 2004
in factor productivity as well as in the growthrates of inputs (capital and labour), all of whichcontributed to a slowing of overall output growthin the more recent period.
6.4 It has also been shown in this review thatpolicies, institutions and attitudes are importantinfluences on productivity. For Botswana, thereare important areas of policy and institutions thatare mostly conducive to increases in productivityand improvement in living standards, while someregulatory processes constrain speedy decisionson investment. Broadly, macroeconomicpolicies, in terms of both the focus and recordhave been less of a restraining factor forproductivity growth although there may bediffering views as to the appropriate balance andlevels, for example, with respect to monetarypolicy, the exchange rate and fiscal expansion.Nevertheless, to the extent that there isconsistency and transparency in policypromulgation, there is a clear basis for decisionsby economic agents. This is one of the reasonsfor the country’s high scores, relative to otherdeveloping countries in international rankingson measures that incorporate factors related topolitical and economic governance and thedegree of corruption.
6.5 The environment is, however, less conducive withrespect to microeconomic factors, includingcompetitiveness across industries, the level ofskills, infrastructural support, public sectorservices and the flow of information. This mightexplain the decline in productivity and overallgrowth in the recent years, in the absence of largepublic investment projects, which are lessinfluenced by the above-indicated microeconomicfactors. There is, therefore, a need forimprovement in these areas in order to add to thepositive influence of a largely favourablemacroeconomic environment so as to facilitatesustenance of higher productivity andcompetitiveness. It is apparent from this reviewthat more value could, at the margin, be added byan increased focus on the microeconomic factorsthat constrain investment growth, higher marketcompetition and technology transfer.
6.6 The theme chapter further highlights the fact thateconomic growth underpins improvements inliving standards. In this respect, there arelegitimate concerns about how the wealthderived from high rates of economic growth isdistributed. This leads to considerations for asocial safety net to support those who are unable,either permanently or temporarily, to participateeffectively in the productive economy. This isparticularly so where growth is accompanied bywidening inequality in incomes. In the case ofBotswana it is evident that the relatively highrate of economic growth has provided benefitsacross the population and is the primary factorin reducing the incidence of poverty from 59percent in 1985/86 and 47 percent in 1993/94 to30 percent in 2002/03. Although at the nationallevel inequality in incomes has not changedmuch since the mid-1980s, there has been anotable decrease for urban areas while inequalityhas increased in both the urban villages and therural areas, indicating an absence of incomeearning opportunities in these areas, beyond thetraditional activities. In particular, the level ofunemployment is higher in the urban villagesand the rural areas where people increasinglychoose not to work in the more traditionaloccupations, despite the presence ofopportunities, particularly for the low skill jobs.
6.7 Overall, it is apparent that improvements inproductivity can generate higher rates of growthand increase in living standards. In particular,enhanced level of skills, health, technology,efficiency of public institutions and policies thatpromote investment and market competitionenlarge and sustain employment opportunities,in terms of both employability of individuals andthe range of productive entities. This is importantbecause there is a limit to redistribution in theform of social safety nets or handouts whilehigher earning capacity raises the livingstandards of those engaged in productive activityand at the same time increases scope for helpingthe less well off.

111
IMPROVED PRODUCTIVITY – THE KEY TO SUSTAINED GROWTH AND HIGHER LIVING STANDARDS FOR ALL
APPENDIX A: DATA SOURCES ANDGROWTH ACCOUNTING METHODOLOGY1. A number of macroeconomic aggregates –
physical capital, skilled and unskilled labour andGDP excluding mineral rents were calculated forpurposes of computing total or multifactorproductivity (TFP or MFP) using the standardgrowth accounting method that is typicallyapplied in empirical work on TFP estimation(Table A.1).
2. The output measure used in the calculation ofTFP was total GDP excluding governmentmineral revenue (an approximation of mineralrents), the latter deflated using the GDP deflator.GDP and its deflator were sourced from thenational income accounts compiled by the CSO,while mineral revenue was from the FinancialStatements, Tables and Estimates ofConsolidated and Development Fund Revenuesfrom the Cash Flow Unit, Ministry of Financeand Development Planning.
3. The capital stock (real) was from the nationalincome accounts compiled by the CSO and iscalculated using the perpetual inventory method(PIM), which computes additions to the stockthrough gross fixed capital formation anddeductions through depreciation.
4. The labour inputs were computed from thelabour force using the population censuses of1971, 1981, 1991 and 2001.40 The interveningyears were interpolated using annual intercensalgrowth rates. The growth rate for the decade to2001 was assumed to apply to the years 2002 to2005. Whereas similar work done in 1995
ignored the 1971 census data for the reason thatthere was under-enumeration and hence used1964 census results, this Report uses the 1971labour force count adjusted for under-enumeration, where the adjustment factor comesthrough an adjusted population count as reportedon page 8 of the 1981 Population and HousingCensus Analytical Report. In the final analysis,the results are not very different from thosereported in the 1995 Bank of Botswana AnnualReport.
5. The unskilled proportion of the population ateach census was taken as a proxy for theunskilled proportion of the labour force. Thosewho never attended school and who did notcomplete more than primary school were classedas unskilled, and the remainder treated as skilled.
6. The factor shares were from the CSO, SocialAccounting Matrices, 1985/86, 1992/93 and1996/97. In calculating the factor shares, themineral revenues noted at paragraph 2 werededucted from the net operating surplus of themining sector.
40 The total labour force (not the actual labour employed)was taken as a proxy for labour inputs. This means that allthe available labour at the national level was included inthe labour input measure. Quite apart from the datalimitations that would have accompanied use ofdisaggregated data, this methodology is consistent withprevious growth accounting work on Botswana andelsewhere. While the use of this measure has the potentialto lead to lower TFP growth when unemployment is rising,the use of a labour input measure that includes only theactual workforce would result in an overstatement of TFPgrowth when employment is increasing.

112
BANK OF BOTSWANA ANNUAL REPORT 2004
NationalAccounts Year
GDP(P million)
GDP lessMineral Rents
(P million)Capital Stock(P million)
Labour Force(persons)1
SkilledLabour
(persons)1UnskilledLabour
(persons)11974/75 1 760 1 696 3 323 309 474 154 669 154 7961975/76 2 083 1 920 3 618 310 464 154 886 155 5701976/77 2 169 2 062 3 808 311 458 155 103 156 3471977/78 2 594 2 443 4 147 312 454 155 320 157 1291978/79 2 852 2 657 4 649 313 454 155 537 157 9151979/80 3 256 2 932 5 380 314 457 155 755 158 7041980/81 3 584 3 172 6 133 315 475 156 025 159 4501981/82 3 876 3 550 6 762 326 233 162 235 163 9621982/83 4 491 4 110 7 163 337 357 168 692 168 6031983/84 4 976 4 287 7 546 348 861 175 406 173 3741984/85 5 300 4 206 8 298 360 757 182 387 178 2811985/86 5 708 4 337 8 771 373 059 189 646 183 3261986/87 6 200 4 339 9 443 385 780 197 194 188 5141987/88 7 123 5 176 10 638 398 936 205 042 193 8491988/89 8 791 6 539 12 428 412 539 213 203 199 3351989/90 9 201 6 956 14 471 426 607 221 688 204 9761990/91 10 010 7 356 16 415 441 203 230 461 210 7421991/92 10 634 8 237 17 976 451 748 238 988 212 3441992/93 10 612 8 440 19 423 462 545 247 831 213 9571993/94 11 041 8 763 20 690 473 599 257 000 215 5841994/95 11 398 9 214 21 898 484 918 266 509 217 2221995/96 12 029 9 835 23 173 496 508 276 370 218 8731996/97 12 704 10 097 24 587 508 374 286 596 220 5361997/98 13 729 10 541 26 424 520 525 297 200 222 2121998/99 14 296 12 179 28 801 532 965 308 196 223 9011999/00 15 239 11 153 30 982 545 703 319 600 225 6032000/01 16 555 11 717 32 884 558 745 331 425 227 3172001/02 16 906 13 201 34 907 572 099 343 688 229 0452002/03 18 038 14 314 37 036 585 772 356 404 230 7862003/04 18 863 15 318 39 296 599 772 369 591 232 5402004/05 19 920 16 236 41 693 614 107 383 266 234 307
TABLE A.1: FACTOR INPUTS AND OUTPUT: 1974/75 TO 2004/05 (1993/94 PRICES)
1. Skilled and unskilled labour may not add up to total labour force due to rounding.

113
IMPROVED PRODUCTIVITY – THE KEY TO SUSTAINED GROWTH AND HIGHER LIVING STANDARDS FOR ALL
Country Index & Ranking1 Botsw
ana
Mau
ritius
Nami
bia
South
Afric
a
Zimb
abwe
Hong
Kon
g
Singa
pore
Finlan
d
UK USA
Growth Competitiveness Index(GCI)
36 46 52 42 97 24 6 1 15 2
Macroeconomic EnvironmentIndex (MEI)
30 57 53 40 102 15 1 2 12 14
Macroeconomic StabilitySubindex
23 64 49 41 101 8 2 7 54 52
Government Waste Subindex 17 58 48 37 100 9 1 2 12 16Country Credit Rating 38 46 57 40 100 26 17 11 5 3Public Institutions Index (PII) 26 44 48 43 90 10 6 2 12 17Contracts and Law Subindex 16 36 45 40 93 12 7 1 10 17Corruption Subindex 36 57 55 48 84 9 5 4 12 24Technology Index (TI) 59 49 62 40 75 37 12 2 16 1Innovation Subindex 80 73 76 58 87 34 15 3 13 1ICT Subindex 65 40 64 44 80 8 6 2 16 5TechnologyTransfer Subindex 24 48 33 3 41 … … … … …
Business Competitiveness Index(BCI)
54 44 55 27 78 19 8 1 6 2
Company Operations & Strategy 67 35 64 28 70 22 12 4 8 2Quality of National BusinessEnvironment
50 46 52 28 81 15 4 1 6 2
TABLE A.2: GROWTH COMPETITIVENESS INDEX (GCI) RANKINGS FOR SELECTED COUNTRIES: 2003
1. The main goal of the GCI is to analyse the potential for countries to achieve sustained economic growth over the medium andlong term. It summarises the set of institutions, policies and structures that drive the growth process. The GCI consists of threemain components, viz: the Macroeconomic Environment Index (MEI), the Quality of Public Institutions Index (QPI) and theTechnology Index (TI). All three are further disaggregated into several indicators as shown in the Table. The rankings have beencomputed for 102 countries. The lower the ranking the greater is the growth potential, while the opposite is true for higherrankings.
Source: World Economic Forum, Global Competitiveness Report, 2004.

114
BANK OF BOTSWANA ANNUAL REPORT 2004
Country Index & Ranking Botsw
ana
Mau
ritius
Nami
bia
South
Afric
a
Zimb
abwe
Hong
Kon
gSA
R
Singa
pore
Finlan
d
UK USA
Networked Readiness Index1 55 43 59 37 95 18 2 3 15 1
Environment Component Index 43 48 37 33 97 11 2 3 14 1Market Environment Subindex 52 53 71 45 80 23 1 3 13 2Political & RegulatoryEnvironment Subindex
28 54 44 23 100 2 5 1 9 8
Infrastructure EnvironmentSubindex
53 44 23 43 95 16 5 15 19 2
Readiness Component Index 68 41 73 46 91 28 4 1 10 3Individual Readiness Subindex 74 55 77 67 70 24 22 4 7 5Business Readiness Subindex 73 49 67 33 82 31 4 1 14 3Government Readiness Subindex 54 20 74 44 101 27 1 2 10 3
Usage Component Index 60 37 79 33 93 15 2 9 21 1Individual Usage Subindex 67 41 68 57 78 22 18 10 21 8Business Usage Subindex 54 61 63 24 70 14 2 11 20 1Government Usage Subindex 58 25 83 27 100 4 1 8 18 2
TABLE A.3: THE NETWORKED READINESS INDEX (NRI) RANKINGS FOR SELECTED COUNTRIES: 2003–2004
Notes: Introduced in 2001–2002, the Networked Readiness Index (NRI) is defined as the‘degree of preparation of a nation orcommunity (disaggregated into individuals, businesses and government or the so-called stakeholders), to participate inand benefit from ICT developments’ (Dutta, S. et al, 2004). The NRI has three components – environment, readiness andusage – which, in turn, have three sub-indices each as shown in the Table. The macroeconomic and regulatory environmentprovides the setting in which the three key stakeholders operate. Readiness refers to the degree of capability (emanatingfrom ICT usage skills at the individual level, access and affordability of ICT for corporations and integration of ICT ingovernment operations) of stakeholders to use and benefit from ICT. Usage refers to the actual use and application ofICTs. The rankings have been calculated for 102 countries. The lower the ranking the higher the capability of a countryto use and benefit from ICTs and vice versa.The environment component of the NRI measures the degree of conduciveness of the environment that a country providesfor the development and use of ICTs. Its sub-component, the market, evaluates the presence of appropriate humancapital and ancillary businesses to support a knowledge-based economy. The political and regulatory sub-index assessesthe pulse and impact of a country’s political, legal, and regulatory frameworks on the development and use of ICTs.Quality infrastructure is a pre-condition for the adoption and use of ICT. In terms of readiness sub-indices, readiness andusage are closely connected and at the individual level can be interpreted to encompass literacy rates, form and points ofaccess to the Internet and the extent of connectivity of individuals. At the level of businesses, this involves measuringfirm’s willingness to utilise ICT and invest in the creation of ICT skills of their workers. From a government’s perspective,its readiness is reflected in its policy priorities, application of ICTs in its internal process and in the provision of onlineservices. Usage of ICT at the individual level is assessed by the use of connectivity-enhancing technologies such astelephone and the Internet; examples of usage of ICT at the level of businesses is the level of e-commerce betweenbusinesses and between businesses and consumers; while at the level of the government it is assessed by the volume oftransactions that businesses have with government and services available online.
Source: Dutta, S. et al, 2004, The Global Information Technology Report, 2003–2004: Towards an Equitable Information Society,World Economic Forum, infoDev and INSEAD.

115
IMPROVED PRODUCTIVITY – THE KEY TO SUSTAINED GROWTH AND HIGHER LIVING STANDARDS FOR ALL
YearsCountry, Ranking and Index
1980–1984 1985–1989 1990–1994 1995–1999 1997–2001
BotswanaOverall Trade Competitiveness Index (TCI) 22 8 7 8 8
Trade-enabling Environment Index (TEI) 7 3 3 7 7
Productive Resource Index (PRI) 27 26 25 26 26
Infrastructure Index (II) 20 16 3 4 4
MauritiusOverall Trade Competitiveness Index (TCI) 1 2 2 1 1
Trade-enabling Environment Index (TEI) 1 4 2 3 1
Productive Resource Index (PRI) 3 3 3 1 2
Infrastructure Index (II) 2 2 4 2 1
NamibiaOverall Trade Competitiveness Index (TCI) 6 3 3 3 3
Trade-enabling Environment Index (TEI) 5 1 4 2 3
Productive Resource Index (PRI) 11 12 7 10 15
Infrastructure Index (II) 11 9 2 3 3
South AfricaOverall Trade Competitiveness Index (TCI) 2 1 1 2 2
Trade-enabling Environment Index (TEI) 3 2 1 1 2
Productive Resource Index (PRI) 4 4 4 5 5
Infrastructure Index (II) 1 1 1 1 2
ZimbabweOverall Trade Competitiveness Index (TCI) 20 18 12 19 23
Trade-enabling Environment Index (TEI) 15 13 7 12 22
Productive Resource Index (PRI) 23 22 22 24 25
Infrastructure Index (II) 12 13 7 14 14
TABLE A.4: TRADE COMPETITIVENESS RANKINGS FOR SELECTED AFRICAN COUNTRIES: 1980–2001
Notes: The trade competitiveness rankings were computed for 30 African countries. The overall Trade CompetitivenessIndex (TCI) is a composite index that measures the overall competitiveness of a country’s trade. It comprises threesub-indices, namely, the Trade-enabling Environment Index (TEI), the Productive Resources Index (PRI) and theInfrastructure Index (II). These, in turn, consist of 8 components, themselves made up of 31 indicators in total.The TEI has two components – the Macroeconomic Environment Index (MEI) and the Institutional Quality Index(IQI). Indicators that make up the MEI are the average tariff rate, real GDP per capita growth, consumer price inflation,lending interest rates, real effective exchange rate, and the ratio of domestic credit to the private sector to GDP.Corruption, rule of law, government stability, bureaucratic quality, and democratic accountability constitute the IQI.The PRI also consists of two components – the Labour Force Index (LFI) and the Geography Index (GI). The indicatorsfor the LFI are the labour force as percentage of the total population, the percentage of adult illiteracy rate, schoolenrolments at primary, secondary and tertiary levels, percent of urban population, and life expectancy. The GI takes asits measures the landlockedness of a country, arable land use, and actual renewable water resources.The II has four components – the Telecommunications Index (TI) (with three indicators – fixed line and mobile phonesubscribers, telephone mainlines, and the average cost of local calls); the Energy Index (EI) (computed from electricityproduction and consumption data); Transport Network Index (TNI) (total road network and tarred roads); and Accessto Information Index (AII) (measures access to personal computers, radios and television sets).
Source: United Nations Economic Commission for Africa, Economic Report on Africa 2004.

116
BANK OF BOTSWANA ANNUAL REPORT 2004
Country Index & Ranking Bots
wan
a
Nam
ibia
Sout
hA
fric
a
Zim
babw
e
Hon
gK
ong,
Chi
naSi
ngap
ore
Finl
and
UK
USA
Sub-
Saha
ran
Afr
ica
OEC
DA
vera
ge
Starting a BusinessNumber of Procedures 11 10 9 10 5 7 3 6 5 11 6Duration (days) 108 85 38 96 11 8 14 18 5 64 25Cost (% GNI per capita) 11.3 19.3 9.1 304.7 3.4 1.2 1.2 0.9 0.6 223.8 8Minimum Capital (% GNI per capita) 0 0 0. 53 0 0 29.3 0. 0 254.1 44.1Hiring and Firing Workers 0Rigidity of Employment Index 20 33 52 24 0 0 44 20 3 56 34.4Difficulty of Hiring Sub-index 0 0 56 11 0 0 33 11 0 53.2 26.2Rigidity of Hours Sub-index 20 60 40 40 0 0 60 40 0 64.2 50Difficulty of Firing Sub-index 40 40 60 20 0 0 40 10 10 50.6 26.8Firing Costs (weeks worth of wages) 19 26 38 29 13 4 24 25 8 59.5 40.4Registering PropertyNumber of Procedures 4 9 6 4 3 3 3 2 4 6 4Time (days) 69 28 20 30 56 9 14 21 12 114 34Cost (% of property per capita) 5 9.7 11.3 18.1 2 1.5 4 4.1 0.5 13.2 4.9Getting CreditCost to Create Collateral (% of
income per capita)2 28.3 2.3 2.4 0.2 0.3 0.8 0.1 0.1 41.8 5.2
Legal Rights Index 9 … 6 7 10 10 6 10 7 4.6 6.3Credit Information Index 5 5 5 0 4 4 4 6 6 2.1 5Public Credit Reg. Cover
(borrowers/1000 adults)0 0 0 0 0 0 0 0 0 1.1 76.2
Private Bureau Coverage(borrowers/1000 adults)
309 353 636 0 615 335 148 1000 1000 39.4 577.2
Protecting InvestorsDisclosure Index 5 1 6 6 6 5 5 7 7 2.1 5.6Enforcing ContractsNumber of Procedures 26 31 26 33 16 23 27 14 17 35 19Time (days) 154 270 277 350 211 69 240 288 250 434 229Cost (% of debt) 24.8 28.3 11.5 19.1 12.9 9 7.2 15.7 7.5 43 10.8Closing a BusinessTime (years) 2.2 1 2 2.2 1.1 0.8 0.9 1 3 3.6 1.7Cost (% of estate) 18 4 18 18 8 1 1 6 8 20.5 6.8Recovery Rate (cents on the dollar) 50.9 53.7 31.8 9.2 82.3 91.3 90.2 85.8 68.2 17.1 72.1
TABLE A.5: INDICATORS OF EASE OR DIFFICULTY OF DOING BUSINESS IN SELECTED COUNTRIES: 2004

117
IMPROVED PRODUCTIVITY – THE KEY TO SUSTAINED GROWTH AND HIGHER LIVING STANDARDS FOR ALL
Notes: The indicators for starting a business are the number of procedures required to set up a business, the time (in calendar days) it takes to registerit, the associated cost of each procedure (expressed as a percent of income per capita), and the minimum capital required to obtain a businessregistration number (expressed as a percent of income per capita).The regulation of hiring and firing workers is measured by an overall indicator – the rigidity of employment index – which is an average ofthree sub-indices, namely, the difficulty of hiring, rigidity of hours, and difficulty of firing. All three sub-indices take values between 0 and100, with higher values indicating more rigid regulations. Each one of them also has several components (see source for detailed explanation).The cost of firing a redundant worker is calculated on the basis of weeks worth of salary in severance, advance notification and penalties thatmust be paid to dismiss a worker.The efficiency and effectiveness with which property registration is carried out is measured by the number of procedures legally required toregister or transfer a property title from the seller to the buyer, time spent completing the procedures and the costs (e.g., legal fees, transfertaxes, stamp duties, etc.) associated with the registration process (expressed as a percentage of the property value).Five indicators are used to measure the degree of credit information sharing and the legal rights of borrowers and lenders, namely, the cost tocreate and register collateral, index of credit information availability (which measures the scope, quality and accessibility of credit informationthrough public and private registries and is assigned values from 0–6, with higher values indicating more credit information from public andprivate registries and lower values the opposite), coverage of public and private credit registries (these are firms or institutions providing thenumber and credit histories of individuals or firms on their records per 1000 adult population size), and the legal rights index, which measuresthe degree to which collateral and bankruptcy laws facilitate lending, and ranges from 0–10, with higher values indicating that the laws arebetter designed to expand access to credit.The degree of protection of investors is measured by the disclosure index which captures seven ways through which ownership and financialinformation is disclosed, i.e., information on family, indirect ownership, beneficial ownership, voting agreements between shareholders, useof audit committees that review and certify financial data, legal requirements that external auditors be appointed and public availability ofownership and financial information to current and potential investors. The index ranges from 0 to 7, with higher values indicating moredisclosure.Three indicators measure the ease or difficulty of enforcing contractors, viz: the number of procedures legally required from the time of filinga lawsuit to the time when payment is made, the associated time taken and the cost (in court, attorney and other fees and payments) expressedas a percentage of the value of the debt.Three indicators measure the efficiency with which a non-viable business is closed. These are the costs and time required to resolve bankruptcy,and the recovery rate (measuring the efficiency of foreclosure procedures) expressed in per dollar claimants recover from the insolvent firm.
Source: Doing Business, World Bank website: http://rru.worldbank.org/DoingBusiness; Simeon Djankov, et al., February 2002, ‘The Regulation ofEntry’ in Quarterly Journal of Economics, 117, pp.1–37; Juan Botero, et al., November 2004, ‘The Regulation of Labor’, Quarterly Journalof Economics; Simeon Djankov, et al., forthcoming, ‘Property’, ongoing research project; Rafael La Porta, et al., 1998, ‘Law and Finance’ inJournal of Political Economy, 106, pp. 1113–55; Simeon Djankov, et al., forthcoming, ‘Corporate Theft’ an ongoing research project; SimeonDjankov, et al., May 2003, ‘Courts’ in Quarterly Journal of Economics, 118, pp.453–517; and Simeon Djankov, et al., forthcoming, ‘Efficiencyin Bankruptcy’, an ongoing research project.

Blank page 118