ANITA VINCENT PERFORMANCE ANALYSIS OF PASSIVE UHF …
58
ANITA VINCENT PERFORMANCE ANALYSIS OF PASSIVE UHF RFID SENSOR TAGS ON VARIOUS MATERIALS Master of Science thesis Examiner: Prof. Leena Ukkonen Examiner and topic approved by the Faculty Council of the Faculty of Computing and Electrical Engineering on 7th October 2015.
Transcript of ANITA VINCENT PERFORMANCE ANALYSIS OF PASSIVE UHF …

ANITA VINCENT
PERFORMANCE ANALYSIS OF PASSIVE UHF RFID SENSOR
TAGS ON VARIOUS MATERIALS
Master of Science thesis
Examiner: Prof. Leena Ukkonen Examiner and topic approved by the Faculty Council of the Faculty of Computing and Electrical Engineering on 7th October 2015.

i
ABSTRACT
ANITA VINCENT: Performance Analysis of Passive UHF RFID Sensor Tags on Various Materials Tampere University of Technology Master of Science Thesis, 45 pages, 04 Appendix pages October 2015 Master’s Degree Programme in Information Technology Major: Communication Systems and Networks Examiner: Professor Leena Ukkonen Keywords: Radio Frequency Identification, RFID, sensor code, RSSI, Impedance, tags
RFID (Radio Frequency Identification Technology), came into existence during the
Second World War, when the military used this technology for IFF (Identification of
Friend or Foe) purposes. In recent years RFID is used extensively. Wal-Mart the multi-
national retail enterprise have invested millions of dollars to replace their bar code sys-
tem with RFID technology.
The main advantage of using an RFID system is that it is simple, inexpensive, mainte-
nance free, flexible and portable. The entire system consists of a reader, tag, IC, anten-
nas and a controller. There can be numerous readers present in a particular area, and
these readers network via a controller.
However, it is vital to test the RFID system to ensure it performs optimally. The tags
can be placed virtually on any material, but it is necessary to analyze how the tag will
perform on the different materials under various environmental conditions. It should be
possible for the tag to provide accurate results with changing environmental conditions,
for instance, in the presence of moisture. Sensor tags provide a solution to this problem.
Sensor tag is a type of RFID tag which can sense moisture, temperature or pressure lev-
els and adjust the readings accordingly. Sensor code and RSSI code values are im-
portant factors determining the performance of the sensor tag.
This thesis mainly focuses on the analysis of the performance of a sensor tag known as
sensor dogbone tag on different materials under different environmental conditions us-
ing a reader (NordicID), which is specifically used to read sensor tags. A comparative
study is made on the above conditions to determine the most suited position for the tag
to be placed, in order to obtain results. The tag is placed on reference materials at con-
stant read range and measurements are taken using a NordicID reader under various
instances like, sunny outdoors, presence of moisture, embedded inside materials, en-
closed inside a cardboard box etc. This thesis also offers an introduction to the RFID
technology, its components and the communication of the RFID network.

ii
PREFACE
This master thesis, “Performance Analysis of Passive UHF RFID Sensor Tags on Vari-
ous Materials” was done in partial fulfilment of the requirement for the Master of Sci-
ence degree in Communication Systems and Networks major, in the Department of
Electronics and Communication Engineering at the Tampere University of Technology.
All research and investigations have been done under the supervision of Prof. Leena
Ukkonen.
I would like to express my sincere gratitude to my thesis examiner and supervisor Prof.
Leena Ukkonen for her immense guidance, influence and encouragement, which has
helped increase my interest towards RFID technology. I am also very thankful to Jussi-
Pekka Turunen and Muhammad Rizwan of the WISE team, for all the help and infor-
mation provided to me during my thesis writing.
Finally, I would like to acknowledge my family, especially my husband for his continu-
ous reassurance and support.
Tampere, October 2015
Anita Vincent

iii
CONTENTS
1. INTRODUCTION .................................................................................................... 1
1.1 Overview ........................................................................................................ 1
1.2 Objective of the Thesis ................................................................................... 2
1.3 Structure of the Thesis.................................................................................... 3
2. RFID THEORY ........................................................................................................ 4
2.1 Basics of RFID ............................................................................................... 4
2.2 Classification of RFID Tags ........................................................................... 5
2.2.1 Power Source ................................................................................... 5
2.2.2 Memory Types ................................................................................. 6
2.3 Modes of Operation ........................................................................................ 6
2.4 FDX/HDX Procedures ................................................................................... 7
2.4.1 Inductive Coupling ........................................................................... 7
2.4.2 Electromagnetic Backscatter Coupling ............................................ 7
2.4.3 Close Coupling ................................................................................. 8
2.4.4 Electrical Coupling .......................................................................... 9
2.5 Sequential Procedures .................................................................................... 9
2.5.1 Inductive Coupling ........................................................................... 9
2.5.2 SAW Transponder.......................................................................... 10
2.6 Frequency of Operation ................................................................................ 10
2.6.1 Frequency Range used by RFID .................................................... 10
2.6.2 Preferred Frequencies for Different Applications .......................... 11
2.7 Data Authentication and Precision in RFID Communication ...................... 12
2.7.1 Parity Checking .............................................................................. 12
2.7.2 LRC Technique .............................................................................. 12
2.7.3 CRC Procedure .............................................................................. 12
3. RADIO ESSENTIALS OF RFID ........................................................................... 14
3.1 Communication Theory................................................................................ 14
3.1.1 Modulation ..................................................................................... 14
3.1.2 Multiplexing ................................................................................... 14
3.2 Basics of RFID Tag Antenna ....................................................................... 15
3.2.1 Performance of Tag Antenna ......................................................... 16
3.3 Antenna Design Parameters ......................................................................... 16
3.3.1 Frequency Range............................................................................ 16
3.4 Antenna Design Process ............................................................................... 18
3.5 Cross Dipole Antenna .................................................................................. 18
3.6 Impedance .................................................................................................... 19
3.6.1 Intrinsic Impedance ........................................................................ 20
3.6.2 Wave Impedance ............................................................................ 20
3.6.3 Characteristic Impedance ............................................................... 20

iv
3.7 Impedance Matching .................................................................................... 21
4. RFID COMPONENTS USED FOR MEASUREMENTS...................................... 23
4.1 Sensor Tag .................................................................................................... 23
4.1.1 Sensor Tag Properties .................................................................... 24
4.1.2 Sensor Tag Applications ................................................................ 25
4.2 Sensor Code and RSSI value of Sensor Tags ............................................... 25
4.3 Sensor Dogbone Tag .................................................................................... 26
4.4 Nordic ID Tag Reader .................................................................................. 27
4.4.1 Factors Affecting the Readings of the Nordic ID reader ............... 27
5. MEASUREMENT ANALYSIS ............................................................................. 29
5.1 On-Chip RSSI and Sensor code ................................................................... 29
5.2 Materials used for Measurement Analysis ................................................... 30
5.2.1 Dogbone Tag is in LOS of the Reader ........................................... 31
5.2.2 Tag is placed outdoors ................................................................... 33
5.2.3 Tag has a Dab of Tap Water .......................................................... 34
5.2.4 Tag is placed inside a Cardboard Box ........................................... 35
5.2.5 Tag is sandwiched between Two Slabs of Same Material ............. 36
5.2.6 A Dab of Acetic Acid placed on the Tag ....................................... 37
5.3 Comparison of the Sensor Code values under Different Conditions ........... 38
6. CONCLUSIONS ..................................................................................................... 41
6.1 Conclusion .................................................................................................... 41
7. REFERENCES........................................................................................................ 43
8. APPENDIX A: FUTURE ANALYSIS................................................................... 46
8.1 Tag placed 10 cm from the Reader Antenna ................................................ 46
8.2 Tag placed 40 cm from the Reader Antenna ................................................ 47
8.3 Comparison of Sensor Code LOS from 10 cm and 40 cm ........................... 48

v
LIST OF FIGURES
Figure 2.1: Working Principle of UHF RFID System [1] ................................................ 4
Figure 2.2: Zebra R110Xi4 RFID printer used for printing RFID tags [7] ..................... 5
Figure 2.3: Different operating principles in RFID system .............................................. 7
Figure 2.4: Close coupling tag inserted into a reader with magnetic coupling
coils [2] ..................................................................................................... 8
Figure 2.5: Electrically coupled RFID system [2] ........................................................... 9
Figure 2.6: SAW Tag. Interdigital transducers and reflectors on piezoelectric
crystal [2] ................................................................................................ 10
Figure 2.7: Step by Step calculation of CRC checksum[10] .......................................... 13
Figure 3.1: Performance of the Tag Antenna [15] ......................................................... 16
Figure 3.2: RFID Tag Antenna Design Process [14] ..................................................... 18
Figure 3.3: Co-ordinate system Representing Impedance [19]...................................... 19
Figure 3.4: Circuit equivalent to that of an RFID tag [21] ............................................ 21
Figure 3.5: Backscattered signal modulated by Chip Impedance (Zc) change [14] ...... 22
Figure 4.1: Passive Sensor Tag consisting of Magnus-S die and Antenna [25] ............ 23
Figure 4.2: A Water Drop on the Sensor Capacitor of Sensor Tag [25]........................ 23
Figure 4.3: Sensor Code Change Indicating the Presence of Moisture [25] ................. 24
Figure 4.4: Dogbone tag made with RFMicron’s Magnus S Sensor [29] ...................... 27
Figure 4.5: Nordic ID reader used for the measurement analysis [29] ......................... 28
Figure 4.6: Nordic ID mobile reader used to read RFID tags in a textile factory
[29] .......................................................................................................... 28
Figure 5.1: Nordic ID Reader depicting the Sensor Code and RSSI Code .................... 29
Figure 5.2: Tag placed 10 cm apart from reader antenna ............................................. 31
Figure 5.3: Readings taken when a dab of Acetic acid is placed on the tag that is
10 cm away from the Reader Antenna ..................................................... 37
Figure 5.4: Analysis of Sensor Code on different materials ........................................... 39
Figure 8.1: Tag placed 40 cm from the Reader Antenna ................................................ 47
Figure 8.2: Analysis of Sensor Code w.r.t Distance ....................................................... 48

vi
LIST OF TABLES
Table 5.1: Measurement readings for the mentioned materials inside the lab ............... 31
Table 5.2: Measurement readings for the mentioned materials in sunny outdoors ....... 33
Table 5.3: Measurement readings for the materials in presence of moisture ................ 34
Table 5.4: Measurement readings of the materials when tag is placed inside a
cardboard box ......................................................................................... 35
Table 5.5: Measurement readings when the tag is placed between two slabs of
same material .......................................................................................... 36
Table 5.6: A dab of Acetic Acid placed on the tag .......................................................... 37
Table 5.7: Comparison of Sensor tags under different conditions ................................. 38
Table 8.1: Measurement readings for materials when tag is in 10 cm LOS with the
Reader Antenna ....................................................................................... 46
Table 8.2: Measurement readings for materials when tag is in 40 cm LOS with the
Reader Antenna ....................................................................................... 47
Table 8.3: Comparison of Sensor tags w.r.t distance of 10 cm and 40 cm ..................... 48

vii
LIST OF SYMBOLS AND ABBREVIATIONS
AC Alternating Current
ADC Analog to Digital Converter
AR Axial Ratio
ASIC Application Specified Integrated Circuit
ASK Amplitude Shift Keying
CDMA Code Division Multiple Access
CRC Cyclic Redundancy Check
CW Continuous Wave
EIRP Effective Isotropic Radiated Power
EPC Electronic Product Code
FDMA Frequency Division Multiple Access
FDX Full Duplex
FR4 Flame Retardant
GHz Gigahertz
HDX Half Duplex
HF High Frequency
IC Integrated Circuit
IFF Identification Friend or Foe
ISM Industrial Scientific and Medical
ITU International Telecommunication Union
K Kelvin
KHz Kilohertz
LF Low Frequency
LOS Line Of Sight
LRC Longitudinal Redundancy Check
MHz Megahertz
NFC Near Field Communication
PC Personal Computer
PIE Pulse Interval Encoding
POM Polyoxymethylene
POM-C Polyoxymethylene Copolymer
PR-ASK Phase Reverse Amplitude Shift Keying
PTFE Polytetrafluoroethylene
PVC Polyvinyl chloride
RF Radio Frequency
RFID Radio Frequency Identification
RO Read Only
RSSI Received Signal Strength Indication
RW Read Write
SAW Surface Acoustic Wave
SBR Styrene Butadiene Rubber
SDMA Space Division Multiple Access
SEQ Sequential systems
SRD Short Range Device
TDMA Time Division Multiple Access
TE Transverse Electric
TEM Transverse Electro-Magnetic

viii
TM Transverse Mode
TUT Tampere University of Technology
TX Transmission
UHF Ultra High Frequency
UPC Universal Product Code
VT Ventec USA
WORM Write Once Read Many
XOR Logical Exclusive OR
Г Transmission co-efficient
σ Material Conductivity
θ Beam width
α Attenuation Constant
γ Complex Propagation Constant
π Pi
ε Dielectric Constant
λ Wavelength
Ω Resistance (Ohm)
cm centimeter
f Frequency
c Speed of light in vacuum
G Gain
P Power
Q Electric Charge
R Resistance
m Meter
X Reactance
Z Impedance

1
1. INTRODUCTION
1.1 Overview
Radio Frequency Identification (RFID) came into existence in the 1930s, when the
technology was first used in IFF by military aircrafts. Transponders installed in air-
planes used this technique to help identify the plane in case of lack of visibility, due to
fog, rain etc. This technology is also used widely to aid in the identification and tracking
of countable articles like gadgets, consumer products, artifacts and various other ob-
jects. It is now embedded in the human body and animals for identification, tracking
and monitoring purposes [1].
In recent years RFID is used tremendously in manufacturing, servicing, government,
industrial and business environments as tags can be attached to virtually anything. Wal-
Mart, the American multinational retail corporation has invested millions of dollars to
replace the omnipresent bar code labels with RFID tags. These tags can store much
more information than a simple bar code, and is also used to share information with an
accuracy rate of up to 98%. This technique gained popularity because it facilitates re-
tailers in tracking the buying patterns, demand rate, number of items, updating of items,
production rate, manufacturing date, manufacturing place, expiry date, inventory situa-
tion, and distributor’s information of products sold by them. Simplicity is another major
aspect of RFID technique. Therefore RFID technology is considered to be one of the
fastest growing sector in the radio technology besides mobile phones and cordless
phones.[2]
Moreover tags makes tracking specific objects ergonomic for humans as it is not neces-
sary to scan the tags manually, the reader can do the job using a technique similar to
NFC. The products containing the RFID tags is passed through a portal containing a tag
reader and all the information present in the tag is gathered and stored in a database for
future reference. This is a very time saving process compared to the bar code system.
The tag information can also be updated in the database if a particular product is either
purchased or replenished. RFID systems are also used in toll booths where a car passing
through the booth gets automatically registered and money is paid directly from the
bank without manual intervention. These are just a few examples portraying the conven-
ience of using RFID.[3][4]
Although RFID proves to be a very efficient system, the main reason of adopting this
technique is that the components of RFID are cheap and simple to implement. The re-
duced price of electronics after the invention of transistors and chips makes installation

2
of an RFID system quite easy. Moreover passive tags do not require a battery to operate.
[4][5][1][3]
Nowadays, passive UHF RFID tags are installed with sensing function so that the tags
can sense various environmental changes like, change in temperature, moisture level,
pressure etc. Passive sensor tags have been embedded with various sensing prototypes
for sensing changes in the surroundings. Temperature and pressure sensor tags are being
implemented. Sensor dogbone tag which comprises of RFMicron’s Magnus S sensor, is
a sensor tag which is specifically designed to detect moisture levels. The tag is passive
and can tune itself in the presence of moisture. Furthermore, the sensor chip installed in
sensor dogbone tag can operate at temperatures from -40 °C to +85 °C. [6]
1.2 Objective of the Thesis
Since RFID technique is gaining importance in many fields, the tags must be tested for
flexibility and accuracy for every given situation. Heat and other chemicals present in
the environment are major factors affecting the accuracy of the data readings. Moreover
extreme temperature, types of material the tag is embedded in, density of the environ-
ment, distance between the tag and reader are other aspects that are possible to disturb
the readings.
It is vital to note that the performance of the tag varies according to the material it is
placed in and also the environment. RFID tags must be able to sense moisture to a cer-
tain extent so that the moisture present in the environment does not tamper the readings.
Moreover, sensor tags have the ability to sense moisture levels in the environment.
Therefore, a sensor function is integrated into RFID tags to detect the level of moisture
present.
In addition, HF tags can penetrate through water than UHF or microwave signals, there-
fore HF is considered a better choice for tagging in damp conditions. Sensor dogbone
tag is one such tag which has the ability to sense moisture thus making the tag work
efficiently in humid conditions. But it is also important to check its ability to perform in
various other conditions like warm weather conditions, below zero temperatures, acidic
environment, on different materials etc.
This thesis performs the measurement analysis of sensor dogbone tag on various envi-
ronmental conditions for given reference materials and a comparative study is made, to
estimate the degree of performance of the tag. The values are compared and a graph is
produced for the same. It is noticed that the graph tallies with the analytical concept.
Moreover, the optimum environmental condition can be determined for the tag to pro-
vide better performance results.

3
1.3 Structure of the Thesis
This thesis analyzes the performance of a sensor dogbone tag on materials the RFID
technique is applied in. Furthermore, Chapter 1 introduces the RFID system and ex-
plains the importance of RFID and the reason for its growing popularity. Chapter 2
deals with the basics of RFID, the components that comprise an RFID system and the
communication between each component. It also provides details on what criteria the
tags can be classified, the different modes of operation of the RFID system and the fre-
quencies through which the whole structure communicates.
In addition, Chapter 3 enlightens the theoretical concepts of antenna, impedance and
impedance matching are described and how the above factors influence an RFID system
are studied. Chapter 4 explains the RFID reader and the tag used for the measurement
analysis of this thesis. The reader is Nordic ID and the tag used is a sensor tag known as
sensor dogbone tag. The concepts of sensor code and RSSI value is explained in this
section, and also the materials used for the measurement analysis and its chemical prop-
erties which makes it unique is also described. Chapter 5 consists of the actual meas-
urement analysis of the tag on different materials under various environmental condi-
tions. A comparative study of the tag’s performance is illustrated with the help of a
graph. Finally, Chapter 6 concludes the thesis and provides further measurement ideas
that can be performed on the sensor dogbone tag.

4
2. RFID THEORY
2.1 Basics of RFID
Figure 2.1: Working Principle of UHF RFID System [1]
The RFID system mainly comprises of a tag reader, tag, IC also known as silicon chip,
controller and antennas. The antennas and the IC is embedded on the tag. Tags also re-
ferred to as ‘smart labels’ transmit and receive data, to and from the reader. The reader
also known as the interrogator, can communicate with more than 1 tag at a single in-
stance. Anti-collision algorithm is implemented in the reader so that the data present in
one tag read by the reader does not interfere with the data of other tags. The reader gets
information of the specific object from the tag placed on the object. There can be many
readers present in a warehouse and they can all be connected to a single controller. The
controller is considered to be brains of the RFID system. [1][6]
Moreover, the controller can be a PC or workstation which have the required applica-
tions running that connect the readers together to form a network. This network aids in
communication. The readers and controller are connected together, they interrogate the
tags to process information. In addition, the chip consists of a memory slot where all the
data of the particular tag is stored. Batteries and transistors are not included in the chip,
this makes the passive tag simple and maintenance free. Printing the antenna onto a

5
plastic substrate and installing the IC is one of the common methods adopted to create
the tags. Figure 2.2 shows a printer that is used for printing RFID tags that uses conduc-
tive ink like gold, silver, copper etc. [2]
Figure 2.2: Zebra R110Xi4 RFID printer used for printing RFID tags [7]
Reader reads the data from tags, processes it and sends it to the controller. The reader
supplies power to the passive tag and also writes information into the tag. The tag and
the reader communicate via radio waves. The digital transmission of data from tag to
reader and vice versa is in binary fashion. The reader consists of the three components,
antennas, an RF electronics module and controller electronics module. Unlike bar-code
system, in RFID the reader does not require the tag to be in LOS with it to obtain the
reading. RFID is not NFC, but both have a lot of similar characteristics. [8]
2.2 Classification of RFID Tags
Tags can be classified based on power source and memory type as follows:
2.2.1 Power Source
The power consumed by the tag is quite an important criteria. Tags are manufactured
such that they can be either dependent, independent or partially dependent on in-built
power. Tags can be classified according to power consumption as follows:
Active Tags - The Active tag facilitates information to be stored directly into the tag as
they have an in-built power source, such as, a battery. Active tags are able connect with
less powerful readers, they can also transmit data over longer distances. The memory
capacity of these tags are up to 128Kbytes. [3] This way information can be obtained
directly without the need of looking into a database. This form of tags is very useful

6
during overseas shipments. Unfortunately, active tags are much expensive compared to
passive tags and they also require maintenance as the batteries need to be replaced.
Passive Tags - Passive tags do not have a power source attached to it. They directly
derive power from the reader. Therefore these tags are much cheaper and easier to
maintain. The effective range of these tags are shorter compared to active tags.
Semi-passive Tags - These tags are also known as battery-assisted passive tags, since
they have a battery installed, but do not use the available battery for signal transmission.
They mainly use the battery for on-board electronics. An example of usage of semi-
passive tag is, a food producing firm can use semi-passive tags equipped with tempera-
ture sensors to monitor the temperature of the food during transportation and storage. If
the temperature rises above a threshold level then this occurrence must be marked in the
database of the tag. Such tags require battery during the transportation and storage pro-
cess [3].
2.2.2 Memory Types
Memory of the tag can be defined as the amount of data a particular tag can store with-
out the aid of any external data-base. Tags can be classified according to memory type
as follows:
Read-only - These tags can be programmed only once by the product manufacturer and
the contents of the tag cannot be altered in any condition.
Read-write - Also known as smart tags can be flexible with data. The stored data can
be modified according to the needs of the user. Large amounts of data can be stored and
altered. RW tags are more expensive than RO tags.
Write Once Read Many - WORM tags are similar to RO tags, they are mainly used in
assembly line to enter the manufacturing details like serial number of the tag, before
shipment.
In addition to the above classification, tags come in various shapes and sizes according
to the needs of the consumer and the environment the tag is to be placed in. Tags can
also be manufactured using different materials using different printing tech-
niques.[1][4][2]
2.3 Modes of Operation
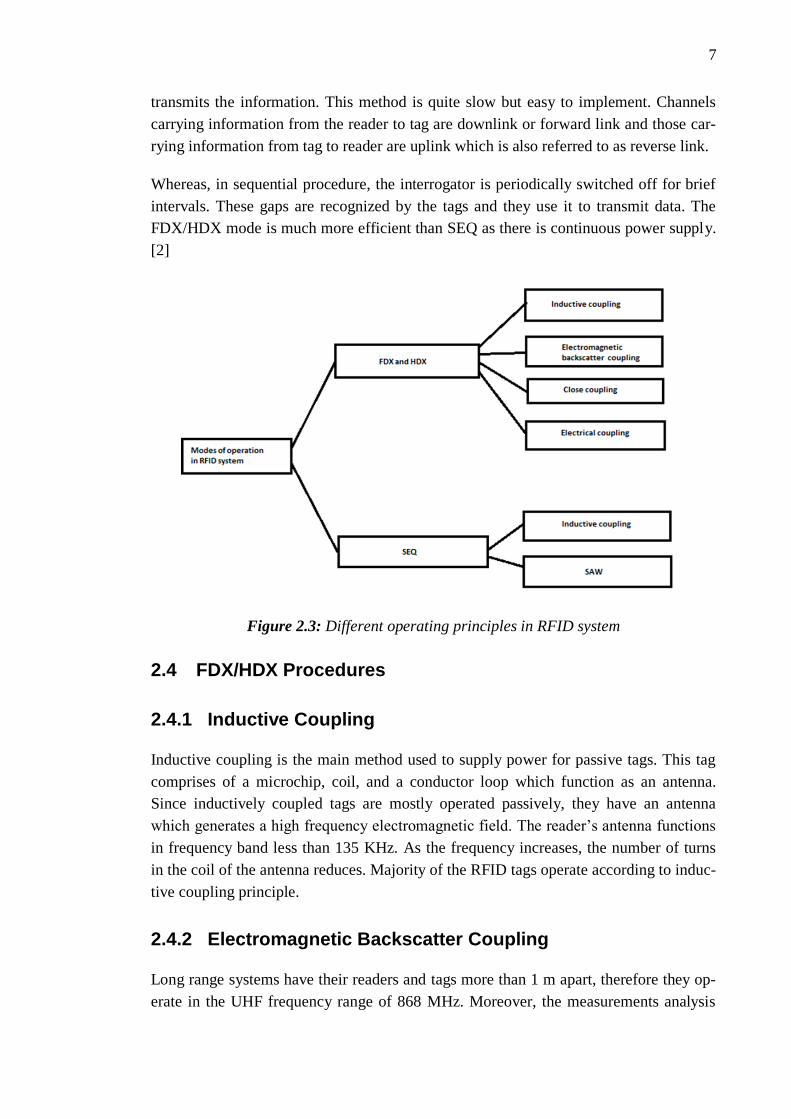
RFID systems can operate in FDX or HDX, and SEQ modes. In full-duplex and half
duplex systems, when the reader is in the RF field, its response is broadcasted to all tags
present in the vicinity, since the tag’s antenna is too weak to obtain the signal. The sig-
nal is transmitted via load modulation technique using a subcarrier. Load impedance
7
transmits the information. This method is quite slow but easy to implement. Channels
carrying information from the reader to tag are downlink or forward link and those car-
rying information from tag to reader are uplink which is also referred to as reverse link.
Whereas, in sequential procedure, the interrogator is periodically switched off for brief
intervals. These gaps are recognized by the tags and they use it to transmit data. The
FDX/HDX mode is much more efficient than SEQ as there is continuous power supply.
[2]
Figure 2.3: Different operating principles in RFID system
2.4 FDX/HDX Procedures
2.4.1 Inductive Coupling
Inductive coupling is the main method used to supply power for passive tags. This tag
comprises of a microchip, coil, and a conductor loop which function as an antenna.
Since inductively coupled tags are mostly operated passively, they have an antenna
which generates a high frequency electromagnetic field. The reader’s antenna functions
in frequency band less than 135 KHz. As the frequency increases, the number of turns
in the coil of the antenna reduces. Majority of the RFID tags operate according to induc-
tive coupling principle.
2.4.2 Electromagnetic Backscatter Coupling
Long range systems have their readers and tags more than 1 m apart, therefore they op-
erate in the UHF frequency range of 868 MHz. Moreover, the measurements analysis

8
for this thesis work operates in the similar frequency range. For the tag to access the
available energy, free space path loss is calculated:
𝑎𝐹 = −147.6 + 20 log(𝑟) + 20 log(𝑓 ) − 10 log(𝐺𝑇) − 10 log(𝐺𝑅) (2.1)
In the above equation GT and GR is the gain of the tag and reader respectively separat-
ed by a distance r and operating at frequency f, free space path loss obtains the relation
between the RF power of the tag and reader. Substituting the values of distance r in the
above given equation for a constant frequency band of 868MHz the free space path loss
is obtained.
Distance r(m) aF (dB) for 868 MHz
0.3 18.6
1 29.0
3 38.6
10 49.0
Table 2.1: Free space path loss for different distance r in dB (modified from [2])
In order to retain the battery life, the chips installed in RFID system have ‘standby’
mode. If the reader moves away from the tag, the chip automatically turns to ‘standby’
mode. Communication between the reader and tag is solely based on the electromagnet-
ic field emitted by the reader.
2.4.3 Close Coupling
In this system the reader and the tag are placed in ranges between 0.1 cm and 1 cm. This
technique is similar to NFC. The tag is generally inserted into the reader, this way it is
precisely positioned into the reader and facilitates reading in an efficient way. The volt-
age is proportional to the frequency the tag works in. High frequency must be selected
for ideal working of the system and for losses to be low. Close coupling is perfect for
high power consumption microprocessors.
Figure 2.4: Close coupling tag inserted into a reader with magnetic coupling coils [2]

9
2.4.4 Electrical Coupling
In electrical coupling the system generates a high frequency electrical field. The antenna
of the reader has a large conductive area like a metal foil or a metal plate. The system
operates in a voltage range of a few hundred volts to a few thousand volts. The resonant
frequency of the circuit corresponds to the transmission frequency of the reader. The
current that flows between the electrodes of an electrically coupled system is very small.
Electrical coupling is another source of power supply to passive transponders.[2]
Figure 2.5: Electrically coupled RFID system [2]
2.5 Sequential Procedures
2.5.1 Inductive Coupling
SEQ mode of operation uses inductive coupling for frequencies below 135 KHz. Alter-
nating field from the reader induces the voltage generated in the tag which can be used
as a power supply. The tag goes into standby mode when not in use or when charging,
this way almost all the received energy is used effectively. Minimum capacitance of the
capacitor can be obtained from the equation below:
𝐶 = 𝑄
𝑈=
𝐼𝑡
(𝑉𝑚𝑎𝑥 − 𝑉𝑚𝑖𝑛)
(2.2)
The parameters Vmax and Vmin are the voltage limit, I is the power consumption and t
is the time required for the transmission of data.[6]
10
2.5.2 SAW Transponder
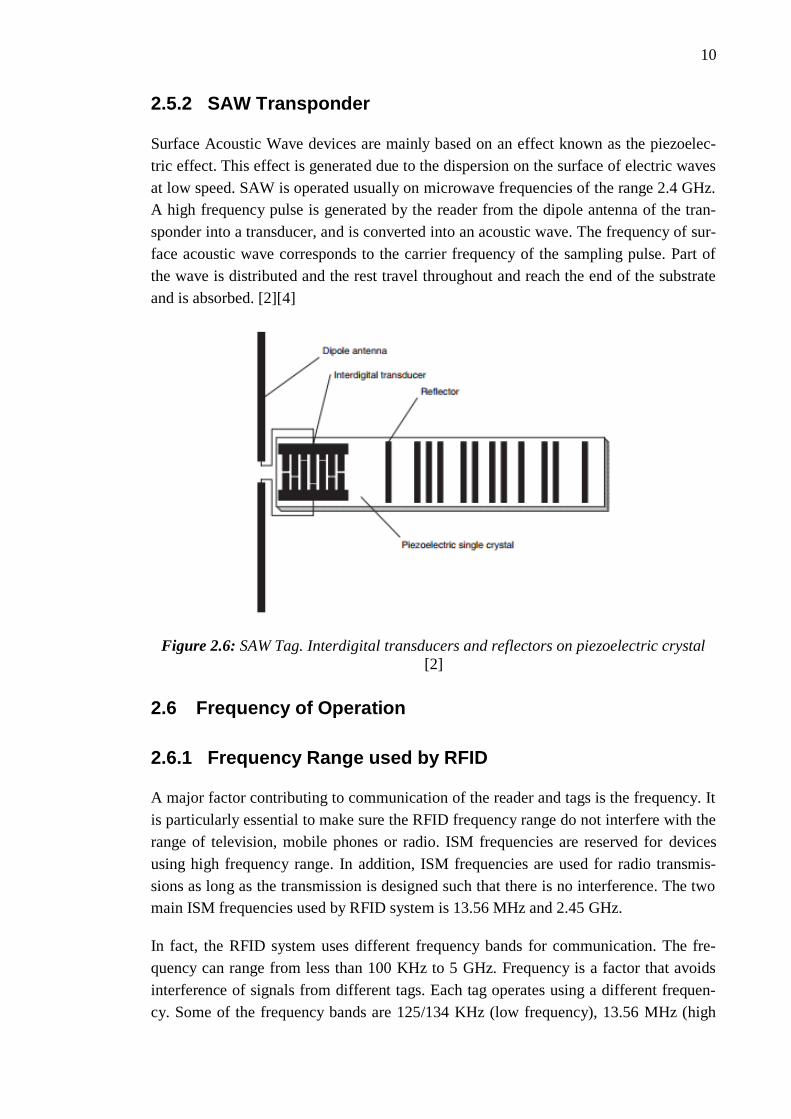
Surface Acoustic Wave devices are mainly based on an effect known as the piezoelec-
tric effect. This effect is generated due to the dispersion on the surface of electric waves
at low speed. SAW is operated usually on microwave frequencies of the range 2.4 GHz.
A high frequency pulse is generated by the reader from the dipole antenna of the tran-
sponder into a transducer, and is converted into an acoustic wave. The frequency of sur-
face acoustic wave corresponds to the carrier frequency of the sampling pulse. Part of
the wave is distributed and the rest travel throughout and reach the end of the substrate
and is absorbed. [2][4]
Figure 2.6: SAW Tag. Interdigital transducers and reflectors on piezoelectric crystal
[2]
2.6 Frequency of Operation
2.6.1 Frequency Range used by RFID
A major factor contributing to communication of the reader and tags is the frequency. It
is particularly essential to make sure the RFID frequency range do not interfere with the
range of television, mobile phones or radio. ISM frequencies are reserved for devices
using high frequency range. In addition, ISM frequencies are used for radio transmis-
sions as long as the transmission is designed such that there is no interference. The two
main ISM frequencies used by RFID system is 13.56 MHz and 2.45 GHz.
In fact, the RFID system uses different frequency bands for communication. The fre-
quency can range from less than 100 KHz to 5 GHz. Frequency is a factor that avoids
interference of signals from different tags. Each tag operates using a different frequen-
cy. Some of the frequency bands are 125/134 KHz (low frequency), 13.56 MHz (high
11
frequency), 860-960 MHz (UHF), 2.4 GHz and above (microwave readers). The UHF
range is mainly used for SRDs. Moreover the wave propagation of UHF frequency band
is quasi-optical, where the diffraction becomes significant and huge obstacles cause
reflection of the incident wave. [1][4]
The read range of a passive tag is 30cm or less in LF range [9], since the antenna gain is
quite low. Antenna gain is directly proportional to the wavelength and wavelength is
inversely proportional to the frequency band the tag operates in. The wavelength of an
RFID tag ranges from 12cm to 2km. The mathematical relation of frequency and wave-
length is as follows:
𝜆 =𝑐
𝑓 (2.3)
Passive tags operate in LF, HF and UHF whereas active tags use UHF and microwaves.
UHF and microwave have been assigned power limits due to health reasons, since high
frequency radio waves can be hazardous to health. LF tags have low data rates. HF tags
are gaining importance nowadays as it is smaller and less expensive to produce com-
pared to LF tags. Data rates of the system increases with the frequency. However, size
of the antenna should be increased in order to produce LF and HF signals compared to
UHF waves and microwaves. In UHF RFID systems, the tag antenna is smaller than the
wavelength and therefore, inductive coupling is adopted. At higher frequencies capaci-
tive coupling is adopted. [1][2]
2.6.2 Preferred Frequencies for Different Applications
Frequencies less than 135 KHz is considered for much longer range compared to HF,
and are low cost tags. In this frequency range high level of power supply is available for
the tag and power consumption of the tag is also quite low. There is also high penetra-
tion rate. Whereas, 6.78 MHz frequency is the global ISM frequency according to ITU,
and this range can be used for low cost and medium speed tags, the available power is
slightly more than the NFC range, which is 13.56 MHz.
Similarly, 13.56 MHz is also a globally available ISM frequency which can be used for
high speed and high end applications. It can also be used for medium speed, low end
applications. This frequency is mostly used for fast transmissions and has a high clock
frequency as the speed is directly proportional to the frequency used by the RFID sys-
tem, but the frequency is inversely proportional to the distance of communication. The
frequency 27.125 MHz is used only for special applications and is not a worldwide ISM
frequency. It has really fast transmission rate because of the large bandwidth. The fre-
quency 27.125 MHz is suitable for small ranges and has a high clock frequency facili-
tating cryptological functions. [2][4][9][5]

12
2.7 Data Authentication and Precision in RFID Communication
Data authentication, encryption and decryption is adopted by the reader for security
reasons. It is necessary to take appropriate measures for the transmitted data to be accu-
rate. Hence, the following methods are adopted for data precision:
2.7.1 Parity Checking
Parity checking is a simple and popular checksum procedure for checking transmission
errors and initiating correcting methods. A parity bit is inserted into every byte so a byte
has 9 bits instead of 8. Before sending the data, it must be checked whether the trans-
mitted data has even parity or odd parity. Odd parity has odd number of the value 1 and
even parity bit has even number of 1s. The parity is checked using the XOR operation.
2.7.2 LRC Technique
This process is quick and easy. The checksum is XOR is generated by gating the XOR
recursively in a data byte. For instance byte 1 is XOR gated with byte 2 and the result is
XOR gated with the next byte that is byte 3 and so on. The obtained result must always
be zero, if not there is presence of error in the transmitted data. The algorithm used for
this procedure is very simple and quick. Unfortunately, LRC technique is not very relia-
ble as it results in quite a lot of errors and mismatching of obtained data.[9][8]
2.7.3 CRC Procedure
This is a highly reliable error detection mechanism. The CRC algorithm is quite com-
plex, therefore checksums of large data quantities can be generated using this process.
This method can detect burst errors. CRC is more powerful than parity checking and
LRC in detecting errors. Unfortunately, this technique does not support error correction.
The calculation of CRC is a cyclic procedure. The given string to be detected is divided
by a divisor and if the resulting remainder is zero, then there is no error. Figure 2.7
shows the step by step procedure on how to calculate a CRC check sum:[4][2][10]

13
Figure 2.7: Step by Step calculation of CRC checksum[10]

14
3. RADIO ESSENTIALS OF RFID
3.1 Communication Theory
RFID operates in the magnetic and electromagnetic fields of the electromagnetic spec-
trum. Electromagnetic waves radiate charges. It is important for a radiating device to
transmit charges that do not cancel out for a long distance. As mentioned earlier, induc-
tive coupling can be adopted to avoid cancelling of charges.
3.1.1 Modulation
A CW does not carry any information, hence the signal must be modulated in order to
carry information. Modulation is the process of introducing the baseband information
and carrier frequency into the continuous signal. The carrier wave, an unmodulated
electromagnetic wave alters the signal parameters. Moreover, modulation depends on
three factors which are, power, frequency and phase position. If a wave is modulated it
must be demodulated back to reconstruct the original signal in the baseband to recog-
nize and rectify any transmission errors. Therefore, the normal configuration of an
RFID system consists of a modem (modulator-demodulator). RFID technology uses
digital modulation procedures like ASK, FSK and PSK. However, PIE is adopted in
order to avoid power problems. [1][6]
3.1.2 Multiplexing
In order to read the signal from a particular tag without any interference from the other
tags multiplexing technique is adopted. This process involves multiple signals propagat-
ing through a single medium. The anti-collision techniques are FDMA, TDMA, SDMA
and CDMA also known as spread spectrum. FDMA is a commonly used multiplexing
technique in RFID. TDMA is also used. For frequency multiplexing to take place the
signal must be modulated.
FDMA - In this technique, an individual user is allocated a specific pair of frequencies,
one for downlink and one for uplink. If the channel is not used it is considered idle, this
way there is resource wastage. After the allocation of frequency the transmission of data
from the tag to the reader is continuous and simultaneous. FDMA operates in narrow
bandwidth generally. FDMA systems are less complex compared to TDMA systems.
TDMA - In FDMA the frequency band remains idle and thus results in resource wast-
age. To avoid this problem TDMA is used. In TDMA systems, the entire bandwidth is

15
available to a single user for a fixed period of time. It is important to note that TDMA
requires time synchronization in order to avoid collision. Since several tags use a single
carrier frequency the allocation of time slots depends on available bandwidth. Data
transmission in this multi access technique is not continuous which results in low power
consumption as the power is switched off when channel is not in use.
SDMA - In SDMA the distance between the transmitter and receiver is the main factor
that is taken into consideration. The same frequency is used in channels that are separat-
ed by some distance. This facilitates frequency re-use. This approach increases the ca-
pacity of the system due to frequency re-use.
CDMA - It is one of the spread spectrum techniques used in multiplexing. This tech-
nique is used to transmit narrowband signals without interference from the tags to read-
er and vice versa. In this method the entire channel is allocated to all the tags at all
times. The tags are differentiated by a unique code. However, CDMA experiences near
far problem. [11][12]
3.2 Basics of RFID Tag Antenna
An antenna is a device that radiates charges which travels long distances without getting
cancelled. Antenna must also be able to send out a continuous wave. In order to make
the wave continuous, the wave sent by the antenna must be a periodic function of time.
Inductive coupling, radiative coupling or capacitive coupling can be used to avoid can-
cellation of charges. Tags use induced antenna coil voltage for operation. In RFID, at
lower frequencies inductive antennas are opted, but for higher frequencies dipole anten-
na is used. [13]
Moreover, antenna gain, impedance, frequency and bandwidth have a deep impact on
the design of the antenna. As mentioned earlier antenna gain is directly proportional to
antenna size, but higher the antenna gain, more expensive the device. A simple dipole
antenna consists of a copper wire of definite length. A half-wave dipole antenna con-
tains the line copper wire of length l = λ/2. Moreover, a well-designed antenna system is
required for the RFID system to communicate efficiently. [14]
In the RFID system, the reader antenna sends an RF signal to the tag and the tag anten-
na receives the signal which in turn powers up the IC component of the tag. In addition,
the tag acknowledges the signal to the reader thus modulating the backscattered signal.
For this purpose the impedance of the reader antenna and the tag antenna must be
matched. If the antenna of the tag is matched with the operating frequency of the tag,
then the signal can be radiated successfully. [14][15][13]
The read range of the tag antenna can be determined by the maximum distance in which
the reader can detect the backscattered signal from the tag. Moreover, the reader is more

16
sensitive than the tag itself. Read range which is the maximum distance the signal can
travel, depends on factors such as, the material in which the tag is placed in, environ-
ment the tag is placed in, orientation of the tag, presence of moisture in the tag, tem-
perature of the environment etc.[15]
3.2.1 Performance of Tag Antenna
Figure 3.1: Performance of the Tag Antenna [15]
In Figure 3.1 the contours of constant range that is normalized is shown as gain-
transmission co-efficient where the multiplier of the range (ro) is given by:
𝑟𝑜 = (𝜆4𝜋⁄ )√
𝑃𝑡 𝐺𝑡𝑃𝑡ℎ
⁄ (3.1)
3.3 Antenna Design Parameters
The antenna of the tag is influenced by many factors:
3.3.1 Frequency Range
Different countries are allocated a particular frequency range to operate on. Depending
on the regulations of the country, the frequency of operation of the tag will be deter-
mined.
Size of the Antenna - The type and make of object the tag should be placed also de-
fines the antenna design. The tag can be designed to be attached to various materials

17
such as books, bags, buildings, bottles etc. Therefore, the antenna design changes ac-
cordingly.
Read Range - The read range of the tag is further determined by factors such as, EIRP
specific to the country, object the tag is placed in, orientation of the tag, coverage of the
tag etc.
Type of Application - Depending on the whether the application is mobile or not, the
design of the tag antenna can be modified. Moreover, in this type of design, the Doppler
Shift should be taken into consideration due to the mobility of the tag.
Cost - It is one of the main factor that determines the design parameters. Even though
tags are low cost devices, the antenna of the tag and the substrate the tag is made of af-
fect the cost of the tag. As mentioned before, the conductive ink used for tag antenna
design is copper, silver or aluminum.
Reliability - It is important to access the antenna based on the reliability of the tag,
since it is placed in conditions which vary due to change in temperature, humidity, pres-
sure etc. [1][2][4]

18
3.4 Antenna Design Process
Initially, the tag to be placed on the application is selected. The design parameters is
checked and confirmed. The materials for the construction of the antenna is determined.
The RF impedance of the packaged ASIC is evaluated. The type of antenna is identified
(whether it is mobile or not). The parameters for the antenna is chosen too. Next step is
the parametric study and optimization. If the parameters are met and optimized, the de-
sign requirements are satisfied, after which the design process can be carried out to con-
struct the tag antenna. The entire process is illustrated by a flowchart given below:
Figure 3.2: RFID Tag Antenna Design Process [14]
3.5 Cross Dipole Antenna
The reader (Nordic ID Medea) used for the measurement purpose of this thesis work
consists of a cross dipole antenna. A cross dipole antenna is typically used for UHF
band of wireless communication, such as satellite communication, WLAN, RFID etc.
due to its low cost, easy fabrication and simple implementation property. In SAW de-
vices high frequency waves are radiated by the dipole antenna. Moreover Nordic ID
reader uses cross dipole antenna since this antenna offers the possibility of an enhanced
impedance and AR bandwidth for achieving a circularly polarized wave. Also by choos-
ing an optimum radius of the delay, the impedance can be improved even more.

19
RFID communication prefers the cross dipole antennas to have an omnidirectional an-
tenna pattern. A dipole antenna functions by radiating signals from transmitter to re-
ceiver. The signal strength of this antenna is uniform at most of the points, but at some
points the signal strength will be zero creating invisible spots called “nulls”. Null spots
can occur even when the tag is placed in the vicinity of moisture and metals, or even if
two tags are placed in close proximity of each other. Fortunately, this shortcoming can
be overcome by implementing frequency hopping technique in the antenna. [16][4]
A cross dipole antenna is operated by a single coaxial cable and is compact. The first
dipole arm pair is longer that the second pair of arms, so that an automatic phase shift of
45, 135, 225, 315 degrees is achieved without the aid of an external phase shifter. [17]
3.6 Impedance
Impedance is the measure of extent to which a particular circuit opposes the flow of
electricity. It is a 2-Dimensional quantity comprising of two scalar quantities, resistance
and reactance. Impedance is measured using a multimeter. Materials loose energy in the
form of heat due to the presence of resistance that is offered by the material. This in turn
reduces the flow of current in the circuit which is made using the material. Thus, lower
the resistance, lower is the impedance. In AC the impedance of the material is influ-
enced by inductance and capacitance, whereas in DC, the impedance is equal to re-
sistance. Inductance and capacitance together is known as reactance. The reactance of a
material depends on the frequency and components of the material. Reactance is present
in AC but not in DC. [18]
Electric conductors like copper, gold, silver etc. have low impedance. Dielectrics have
very high impedance. Dielectrics include glass, water, mica, polythene etc. Semi-
conductors like silicon, gallium etc. have intermediate levels of impedance.
Figure 3.3: Co-ordinate system Representing Impedance [19]

20
Figure 3.3 illustrates a complex-number impedance. Horizontal axis is resistance, the
left side of the horizontal axis is not numbered since negative resistance is not used in
practice. Inductive reactance is denoted on the positive side of the y-axis. Capacitive
reactance is represented on the negative side of y-axis. In the above graph 4 ohms of
resistance and +j5 ohms of inductive capacitance gives a vector impedance marked as a
linear curve. Both the reader and tag of the RFID system have complex input impedanc-
es. [18][19][20][21]
Impedance is extensively used for the analysis of AC circuits. Gradually it was applied
to transmission lines which served for communication purposes. Moreover, it is an im-
portant link between electromagnetic theory and circuit theory. Impedance which is a
crucial factor for RFID communication can be classified as:
3.6.1 Intrinsic Impedance
This particular impedance is mainly dependent on the material parameters of the medi-
um. For plane waves, intrinsic impedance is equal to wave impedance. Intrinsic imped-
ance (η) is related to material co-efficient as follows:
𝜂 = √𝜇
𝜀
(3.2)
3.6.2 Wave Impedance
Wave impedance is the characteristic of a particular wave. It varies from wave to wave.
TEM, TM and TE waves have the respective impedance, ZTEM, ZTM, ZTE. The im-
pedance of the above mentioned waves depend on the wave guide, material and operat-
ing frequency. The wave impedance (ZW) is given as:
𝑍𝑊 =1
𝑌𝑊=
𝐸𝑡
𝐻𝑡
(3.3)
3.6.3 Characteristic Impedance
It is the ratio between voltage and current for a wave travelling on a particular transmis-
sion line. For TEM, the characteristic impedance is unique due to the fact that the volt-
age and current are uniquely defined for TEM waves. However, for TM and TE waves
the impedance is not uniquely defined. The characteristic impedance is given as:
𝑍𝑜 =1
𝑌𝑜=
𝑉+
𝐼+
(3.4)

21
3.7 Impedance Matching
Impedance matching can be simply defined as the technique of making one impedance
look like another. In the case of RFID system, it is essential to match the load imped-
ance of reader to the impedance of the sensor tag. A trusted tool to measure impedance
matching is the Smith chart, which is a graphical impedance chart. [20][22][23]
Impedance matching affects the power consumption, read range, frequency utilization
etc. of the tags. The impedance can be affected by the frequency and power of the re-
ceived signal. Read range, which is the maximum distance from which the tag can be
detected, is an important characteristic that affects the RFID system. It is crucial to have
a good read range for the impedance to match. Improvement in read range can help
match the impedance better to obtain good power consumption. In order to design an
antenna that could maximize the read range, Friis equation is adopted. [24]
𝑟 = 𝜆
4𝜋 √(
𝑃𝑡𝐺𝑡 ( 𝜃, 𝜙) 𝐺𝑟(𝜃′, 𝜙′)𝑝 |𝑇𝑡𝑎𝑔|2
𝑃𝑡ℎ)
(3.5)
In the above given equation λ is the wavelength, Pt is the transmitted power (reader), Gr
(θ, ϕ) is the gain of the transmitting antenna (reader) facing the tag. The product Pt Gt is
the EIRP of the transmitter (reader). Gr (θ’, ϕ’) is the receiving antenna (tag) gain facing
the reader antenna. Pth is the minimum power required to turn the chip on. Ttag is the
power transmission coefficient of the receiver (tag), p is the polarization efficiency.[24]
The above equation shows that there are not many parameters to be changed to improve
the performance of the system. As mentioned above the RFID tag consists of a dipole
antenna printed onto a substrate, the gain of the antenna is estimated to be 2 dBi which
is quite impossible to improve without compensating for the omni-directional property
of the tag.
Consider the circuit of the RFID tag as shown below:
Figure 3.4: Circuit equivalent to that of an RFID tag [21]

22
The above given circuit represents an RFID tag in receiving mode where, Zc is the chip
impedance and Za is the antenna impedance. Both Za and Zc are dependent on frequen-
cy. Moreover, the impedance of the reader and tag must be matched for the passive tag
to receive minimum threshold power from the reader in order to respond to the reader.
This threshold power is dependent on the transmission co-efficient. Therefore, the per-
formance of the tag greatly depends on the transmission co-efficient Г. The antenna
matching and chip matching is vital for the implementation of a well-designed tag. The
antenna and chip impedance can be normalized if both the impedances are matched. The
reflection co-efficient is given as:
𝛤𝑡𝑎𝑔 = 𝑍𝑐 − 𝑍𝑎
𝑍𝑐 + 𝑍𝑎
(3.6)
However the calculated power reflection co-efficient curve is not quite accurate for
proper designing of the antenna. Therefore, it is necessary to also take into considera-
tion the impedance of the chip during the designing process which is in turn character-
ized by the transmission co-efficient. [21][23][13]
Figure 3.5: Backscattered signal modulated by Chip Impedance (Zc) change [14]
23
4. RFID COMPONENTS USED FOR MEASURE-
MENTS
4.1 Sensor Tag
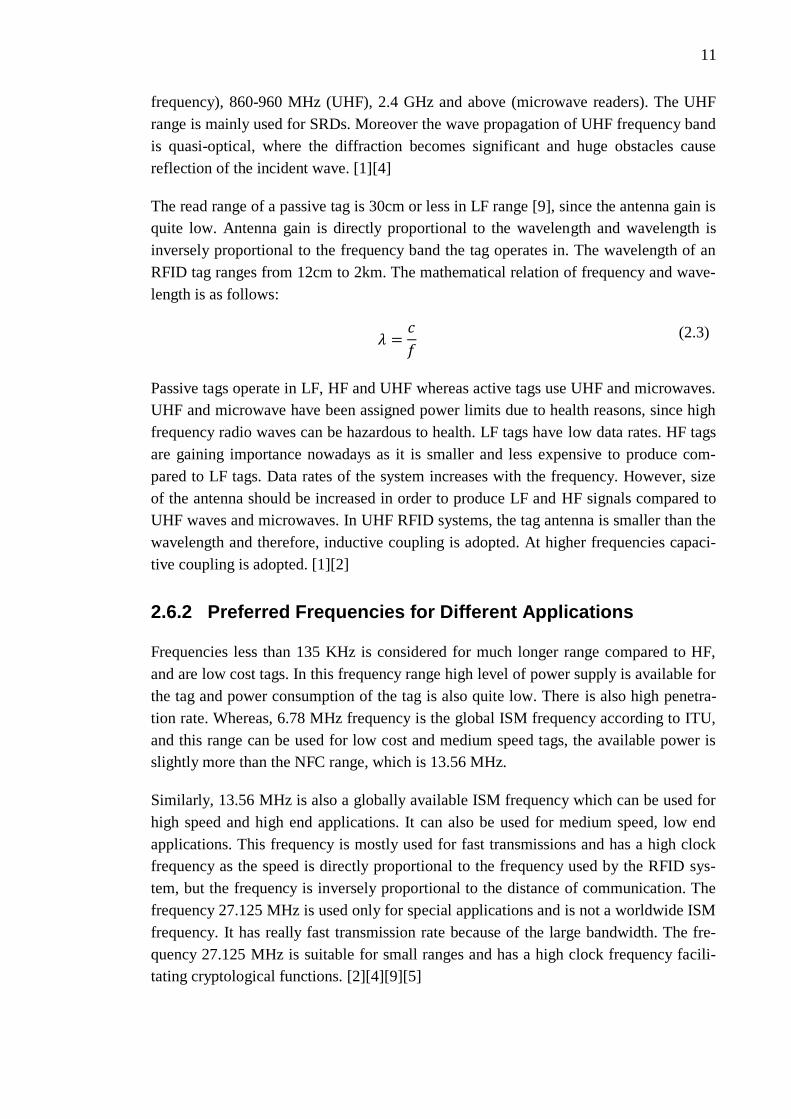
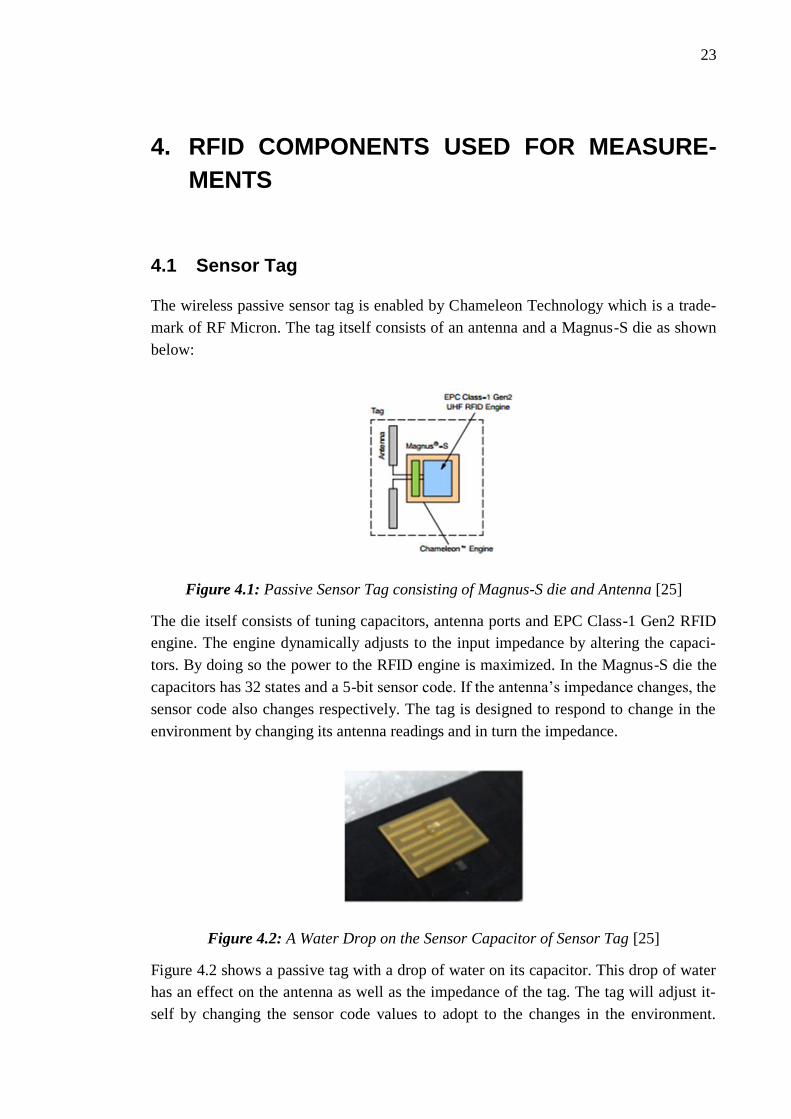
The wireless passive sensor tag is enabled by Chameleon Technology which is a trade-
mark of RF Micron. The tag itself consists of an antenna and a Magnus-S die as shown
below:
Figure 4.1: Passive Sensor Tag consisting of Magnus-S die and Antenna [25]
The die itself consists of tuning capacitors, antenna ports and EPC Class-1 Gen2 RFID
engine. The engine dynamically adjusts to the input impedance by altering the capaci-
tors. By doing so the power to the RFID engine is maximized. In the Magnus-S die the
capacitors has 32 states and a 5-bit sensor code. If the antenna’s impedance changes, the
sensor code also changes respectively. The tag is designed to respond to change in the
environment by changing its antenna readings and in turn the impedance.
Figure 4.2: A Water Drop on the Sensor Capacitor of Sensor Tag [25]
Figure 4.2 shows a passive tag with a drop of water on its capacitor. This drop of water
has an effect on the antenna as well as the impedance of the tag. The tag will adjust it-
self by changing the sensor code values to adopt to the changes in the environment.
24
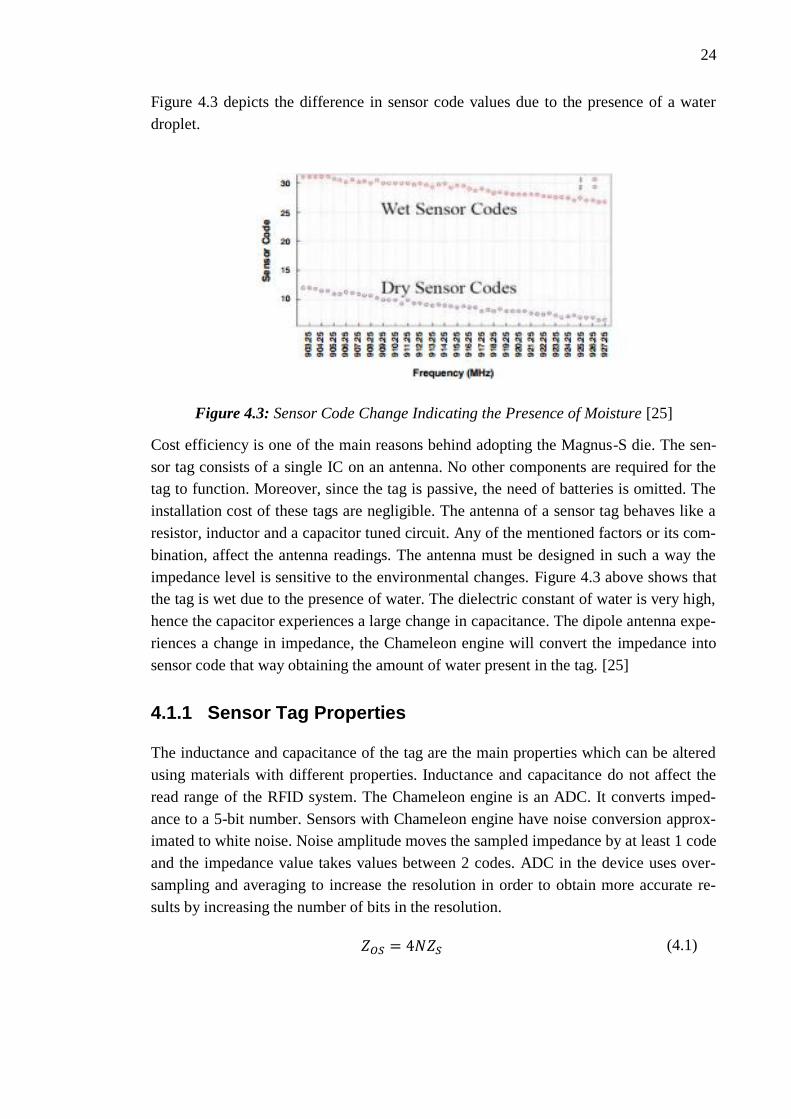
Figure 4.3 depicts the difference in sensor code values due to the presence of a water
droplet.
Figure 4.3: Sensor Code Change Indicating the Presence of Moisture [25]
Cost efficiency is one of the main reasons behind adopting the Magnus-S die. The sen-
sor tag consists of a single IC on an antenna. No other components are required for the
tag to function. Moreover, since the tag is passive, the need of batteries is omitted. The
installation cost of these tags are negligible. The antenna of a sensor tag behaves like a
resistor, inductor and a capacitor tuned circuit. Any of the mentioned factors or its com-
bination, affect the antenna readings. The antenna must be designed in such a way the
impedance level is sensitive to the environmental changes. Figure 4.3 above shows that
the tag is wet due to the presence of water. The dielectric constant of water is very high,
hence the capacitor experiences a large change in capacitance. The dipole antenna expe-
riences a change in impedance, the Chameleon engine will convert the impedance into
sensor code that way obtaining the amount of water present in the tag. [25]
4.1.1 Sensor Tag Properties
The inductance and capacitance of the tag are the main properties which can be altered
using materials with different properties. Inductance and capacitance do not affect the
read range of the RFID system. The Chameleon engine is an ADC. It converts imped-
ance to a 5-bit number. Sensors with Chameleon engine have noise conversion approx-
imated to white noise. Noise amplitude moves the sampled impedance by at least 1 code
and the impedance value takes values between 2 codes. ADC in the device uses over-
sampling and averaging to increase the resolution in order to obtain more accurate re-
sults by increasing the number of bits in the resolution.
𝑍𝑂𝑆 = 4𝑁𝑍𝑆 (4.1)

25
In the above given equation N is the number of bits of resolution, ZOS is the number of
oversampled channels and ZS is the number of sampled channels before oversampling
takes place. Usually ZS is considered to be 1. [25]
4.1.2 Sensor Tag Applications
The applications of sensor tags are unlimited. A sensor can detect change in capaci-
tance, resistance or inductance devices placed in such situations can employ a sensor.
Due to sampling at multiple frequencies the resolution can be as high as 7.8 bits.
Sensor tags can be placed to read measurements in moisture laden environments. For
sensing, the wetness in a desired dry environment, detecting leaks, identifying water
vapors etc. these tags are used. Sensor tags can also respond to gaseous circumstances
to detect imbalance of gases in industries. The tags can also be embedded inside build-
ings to detect the change in moisture levels. The movement of buildings can be recog-
nized by pressure sensitive sensor tags.
4.2 Sensor Code and RSSI value of Sensor Tags
The measurement analysis for the thesis uses sensor dogbone tag as the tag and Nor-
dicID Medea as the reader which comprises the main components of the RFID system.
As mentioned above, impedance matching is an important aspect for obtaining the max-
imum amount of information from the tag, by the reader. Two important factors for im-
pedance matching in dogbone tag is on chip RSSI and sensor code. Sensor code indi-
cates the impedance of the RF input, and on chip RSSI measures the power received by
the tag from the reader. The values of the above mentioned factors fluctuate accordingly
to match the impedances. Tags placed on different materials have different sensor code
and different RSSI values. [26][4]
RSSI value is not only used in measuring the power received by the tag from the reader,
but it is also used to estimate the distance between the reader and tag. Higher the RSSI
value closer is the tag to the reader, thus making it possible for a more accurate reading.
Moreover, RSSI value is also used for identifying the direction of movement of the tag,
that is whether tag is coming closer or moving farther away from the reader, but RSSI
value does not estimate where the particular tag is headed. These values are used for
analyzing the optimum conditions for the tag to work efficiently and also for locating
the local host system.
RSSI value is affected by various factors like metals and reflecting elements the tag is
placed on, other materials attached to the tag, objects that come in LOS of the tag and
reader, moisture present in the tag, height difference of the reader and tag etc. [26]

26
4.3 Sensor Dogbone Tag
Sensor dogbone tag used for measurements in this thesis work, is a moisture sensing,
self-tuning passive UHF sensor tag. Operating in the frequency range 860-960 MHz
(UHF), it comprises of EPC Gen 2 standardization. (EPC is used to represent individual
number associated with the RFID tag or chip. EPC was developed in 2000 at MIT’s
Auto-ID center. EPC is the modern day replacement for the UPC [6].) The dogbone tag
is made with a Magnus S Sensor chip supplied by RFMicron which can operate in tem-
peratures ranging from -40 °C to +85 °C and it consists of a sensor code and on-chip
RSSI code. The sensor code is a 5-9 bit value and the RSSI code is a 5 bit value
[27][25]. Larger the above mentioned values, higher is the power the tag is receiving
and operating in. The sensor code fluctuates according to the changing RSSI values, that
way the tag matches the impedance according to the changing conditions. An applica-
tion is installed into the reader, which is supplied by RFMicron to read the dogbone tag.
Sensitivity of the tag depends on the type of user the tag is designed for. Moreover,
shorter the read range, more accurate will be the reading.
The sensor tag can be designed by the manufacturer according to the needs of the user.
For example, in health care environment, customization of tags is quite essential. If the
dogbone tag is placed in an environment, the reader can detect the presence or absence
of moisture in that particular environment, due to the change in impedance value expe-
rienced by the antenna. These tags are also used for storing drug information in pharma-
ceutical companies where presence of moisture is unavoidable. [28]
Sensor dogbone tags are also a brilliant way to detect the amount of moisture present in
soil, cement, glass, plastic, cardboard etc. Presently, these tags are also being modified
to detect the presence of moisture and humidity in the surrounding environment.
Since the tag is passive and requires a reader to capture the readings, it is not possible to
store data in tags. However it is possible for the reader to automatically forward the
readings for different environments periodically to a cloud based server. Although the
main advantage of a passive tag is that it can be embedded inside construction material,
without the need to worry about replacing batteries. [29]

27
Figure 4.4: Dogbone tag made with RFMicron’s Magnus S Sensor [29]
4.4 Nordic ID Tag Reader
Nordic ID is a hand held mobile tool for reading RFID tags. It has touch screen facility
and a cross dipole antenna. RFMicron application is installed in the Nordic ID reader to
read the tags and display the values of the fields. When the reader is in the vicinity of
many tags, it displays details of all the tags present. This can be very misleading as
reading required for the particular tag cannot be obtained, hence for that reason every
tag has a unique tag model number, which makes it easier to obtain the desired details
of the required tag. In a normal scenario, items with tags ranging up to 2000 or more
will be placed next to each other or bundled on top of each other. The reader will have
to read all the tags and provide the details of all the tags in a readable fashion. Therefore
the reader has to consider all types of tag arrangement and provide accurate infor-
mation.[27] [30]
4.4.1 Factors Affecting the Readings of the Nordic ID reader
Numerous factors affect the reading of the RFID tag by the Nordic ID reader. The effi-
ciency of the reader is directly proportional to the transmission power. It is essential to
have the power up to maximum since the tags are placed really close to each other,
hence more the RF power, more response from the tags. TX modulation is another fac-
tor, the settings for this particular reader is ASK and PR-ASK .In ASK the wave’s am-
plitude is altered, and in PR-ASK the phase of the wave with altered amplitude can shift
suddenly. The main advantage of adopting PR-ASK to ASK is that the former is slightly
easier to read. Unfortunately, not all tags support PR-ASK. [30]
Session is another affecting factor. Session is a tool for managing inventory of the read-
er easier to manage. There are 4 types of sessions specified in ISO 18000-6c RFID spec,
session 0 to 3. The allocation of session to tags makes it much easier to read a lot of tags
that are placed close to each other. When a tag is placed into inventory it is silent, thus
making the reader to discover more tags in the vicinity. If the tag is inventoried then a
session number is assigned to it. Session 0 does not stay inventoried at all, session 1

28
stays inventoried for 0.5-5 seconds. Session 2 stays inventoried for at least 2 seconds,
session 3 also stays inventoried for at least 2 seconds. In the above situations the tag is
out of RF field and not receiving power. When the tag is receiving power, session 0, 2
and 3 stays inventoried for indefinite time. Round value is another factor, it evaluates
the number of inventory rounds done before the results are returned to the host applica-
tion. When the round is set to 1, then the RFID module has only one inventory round.
Figure 4.5: Nordic ID reader used for the measurement analysis [29]
The Nordic ID reader should be configured so that it can read tags which are placed
really closed to each other or placed on top each other in a disorganized way. The eval-
uation can be based on speed and accuracy. The two factors influence each other, if the
speed is high, then the accuracy is compromised and vice versa. Distance is also influ-
ential. Shorter the distance, better is the speed and/or accuracy. A good scanning pattern
can read up to 90% of the tags in 50% of the given time. When the number of tags to be
read exceeds a particular limit, that scanning becomes impossible before session 2 or 3,
then the tag reverts back to its original position, thus altering the results. It is recom-
mended to partition the tags in 30 second batches so that it is possible to read all the
tags taking into account the session. [30][31]
Figure 4.6: Nordic ID mobile reader used to read RFID tags in a textile factory [29]

29
5. MEASUREMENT ANALYSIS
5.1 On-Chip RSSI and Sensor code
Measurements analysis have been taken when the tag is placed in the following envi-
ronmental circumstances, LOS of reader, sunny outdoors, in the presence of moisture,
inside a cardboard box, sandwiched between two slabs of the same material and acidic
conditions. The sensor code and RSSI code values for the given reference materials un-
der the above conditions is measured and noted, the different values are analyzed and a
final graph is produced to compare the performance of the tag in various situations. All
measurements on the above materials were conducted in Tampere University of Tech-
nology (TUT) and the frequency used for the measurement purpose is 865-868 MHz
which is the UHF band.
Figure 5.1: Nordic ID Reader depicting the Sensor Code and RSSI Code
Figure 5.1 clearly shows the sensor code and RSSI code graph. This measurement is
obtained after the tag was placed in LOS with NordicID reader antenna. NordicID read-
ers are exclusively designed to read sensor tags. It is touch screen based, and has a soft-
ware produced by RF Micron. The installed software helps identify the sensor tags and
aids to take readings. The reader can even be connected with the PC via the port provid-
ed in the reader.

30
In Figure 5.1 given above, the tag is placed 10 cm away from the reader on a material
substrate. After the tag is placed on the material slab, the reader is not disturbed. The
measurements are obtained when the reader antenna is kept still. This particular graph
has both the sensor code and the on-chip RSSI value constant. The sensor code value
shows 26 and the RSSI value remains a constant 31 without any fluctuations. The value
2233445566778899AABBCCDD on the topmost section of the reader is the unique
number given to the sensor dogbone tag which helps differentiate it from the other tags.
The frequency band used for the measurement is shown on the top left corner of the
reader which is 866300 KHz. The antenna chosen for this measurement is antenna 1,
antenna 0 is also selected for measurement purposes.
5.2 Materials used for Measurement Analysis
Various materials were used for measurements and analysis. The sensor tag is placed on
the given reference materials and readings are obtained via Nordic ID reader. The rub-
ber material is waterproof and a good insulator. It is also elastic and resistant to tearing.
After vulcanization rubber can retain back its original shape after stretching. The rubber
sheet used for this particular measurement has dimensions 130×130×4mm, 1.55g/cm3,
SBR standard.
Polytetrafluoro-ethylene (PTFE) is a thermoplastic polymer which has a melting point
of 600K. PTFE has one of the lowest coefficients of friction. It is mainly used as a non-
stick coating for cookware, as it is non-reactive to most of the substances. PTFE with
dimensions 130×130×4mm, 2.18g/cm3, Guarniflon PTFE G400 is used for the compar-
isons. Polyvinyl Chloride (PVC) is a widely used synthetic plastic polymer, which has
both rigid and flexible forms. Rigid form used in construction of pipes, manufacturing
bottles, packaging. Flexible form mainly used to plumbing and electrical cable insula-
tion [32] . The measurements of PVC are, dimensions 130×130×4mm, 1.4g/cm3, Etra-
dur.
The next material used was cardboard with dimensions and density 130×130×2mm,
1500g/m2. Cardboard is known for its insulating properties. It is recyclable, puncture
resistant and also does not tear very easily. Main use of cardboard is packaging, includ-
ing food materials. POM with dimensions 130×130×4mm, 1.41g/cm3, Ertacetal C, is a
highly stiff thermoplastic material, with low friction, high heat resistance, low moisture
absorption, high strength and rigidity.
Fiber glass used has dimensions 130×130×4mm and 73% sand (silicon dioxide), 15%
soda (sodium carbonate), 10% limestone (calcium carbonate) and 2% various additives.
Fiber glass is highly resistant to chemical and heat erosion. It is strong, light weight,
does not conduct electricity, non-magnetic [33][34] . FR-4 is a flame resistant material
composed of woven fiberglass cloth. It is mainly used for electrical insulation. FR4 is
known to retain its mechanical properties and electrical insulation in both dry and hu-

31
mid conditions. Dimensions of FR-4 used for the measurements are 130×130×3.2mm,
1.850 kg/m3 Ventec VT-481. [6][26][35]
5.2.1 Dogbone Tag is in LOS of the Reader
Figure 5.2: Tag placed 10 cm apart from reader antenna
Figure 5.2 shows that the tag is placed 10 cm from the reader antenna and measure-
ments were performed inside the lab, having the tag in LOS with the reader, at a tem-
perature of 22°C on different materials using Nordic ID tag reader to determine the
RSSI code and sensor code on dogbone tag. The materials used have a specific density
and make. In order to test for impedance matching, the tags are placed in different envi-
ronments and the difference in sensor code and RSSI code values are compared and
evaluated.
Material Frequency
[KHz]
Antenna RSSI
[dBm]
Sensor code On-Chip
RSSI
Chan-
nel
Rubber 866300 Antenna 0 -60 14 30 Single
PTFE 866300 Antenna 1 -52 13,14,15 31 Single PVC 866300 Antenna 1 -52 13,14 31 Single
Cardboard 866300 Antenna 1 -52 13,14 31 Single
POM 866300 Antenna 1 -52 15,16 18,31 Single
Glass 866300 Antenna 1 -52 12,14,20 31,24 Single
FR4 866300 Antenna 1 -52 15,16,17,28 31,15 Single
Foam wrap 866300 Antenna 1 -52 13,14,31 31 Single
Table 5.1: Measurement readings for the mentioned materials inside the lab
As seen in Table 5.1, the frequency for all the materials is the same that is 866.300
MHz, which is well within the range of 860-960 MHz [36], and also channel used is
32
single channel in this form of communication. There were two antennas present in the
measurement, antenna 1 and antenna 0. The antennas keep fluctuating when the reader
is placed in various positions. The two values that are different for different materials in
the measurements are sensor code and on-chip RSSI value, this fluctuation aids in im-
pedance matching
Initially the tag is placed in a rubber sheet. The RSSI values is -60 which is quite differ-
ent from the RSSI value of other materials. The sensor code is 14 and the on-chip RSSI
is 30, which is quite unchanged. Antenna reading was taken from antenna 0 which is
also different from rest of the materials antenna, which is antenna 1. When the tag was
placed in a PTFE slab, the RSSI values is -52 which is quite similar from the RSSI val-
ue of other materials. The sensor code alters between values 13, 14, 15 and the on-chip
RSSI remains 31, which is quite constant.
Moreover, the sensor code for PVC is shifting between 13, 14 and the on-chip RSSI is
31 which remains constant throughout the measurement process. The cardboard piece
has fluctuating sensor code of 13, 14 and on-chip RSSI of 31. POM has a changing sen-
sor code of 15, 16 and on-chip RSSI which is 31 but has peaks of 18 at various inter-
vals. Fiber glass (Float Glass) has a sensor code which varies between values 12, 14, 20
and on-chip RSSI of 31, with periodic peaks of 24. FR4 has a sensor code of fluctuating
values 15, 16, 17, 28 and on-chip RSSI of 31, and random peaks at value 15. Finally
foam wrap which is folded 4 times has unstable sensor code of 13, 14, 31 and on-chip
RSSI of 31.

33
5.2.2 Tag is placed outdoors
Table 5.2 below shows the measurement readings outdoors for the same materials. The
weather is cool and sunny with a temperature reading of 11 °C and a humidity of 61%.
The dew point is 3.0 °C. Measurements were taken in the morning at 11:00am Finnish
time. The tag in placed on top of the respective material which is then positioned direct-
ly in front of the antenna of the NordicID Medea. The reader is placed 10 cm away from
the IC chip of the tag. The particular tag is free from moisture and placed on a dry envi-
ronment. The antenna is not disturbed when the following readings are taken:
Material Frequency
[KHz]
Antenna RSSI
[dBm]
Sensor code On-Chip
RSSI
Chan-
nel
Rubber 866300 Antenna 0 -64 20 26,31 Single
PTFE 866300 Antenna 0 -64 30 27 Single
PVC 866300 Antenna 0 -60 27 31 Single
Cardboard 866300 Antenna 0 -64 29,30 24,25 Single
POM 866300 Antenna 1 -52 15,16,17 31 Single
Glass 866300 Antenna 1 -54 3 31 Single
FR4 866300 Antenna 1 -52 13,14,15 31 Single
Foam wrap 866300 Antenna 1 -52 18,20 31 Single
Table 5.2: Measurement readings for the mentioned materials in sunny outdoors
Table 5.2 depicts that the frequency for all the materials is the same that is 866.300
MHz, the channel used is single channel in this form of data transmission. There two
antennas present in the measurement are, antenna 1 and antenna 0 which fluctuates
when the reader is moved. The sensor code and on-chip RSSI value keeps fluctuating in
this particular condition to match the impedance, this fluctuation aids in impedance
matching which helps in the maximum utilization of power by the tag.
The tag placed in rubber sheet had RSSI value of -64. The sensor code is 20 and the on-
chip RSSI is 31, but has a dip at 26 when the reader is disturbed. When the Nordic ID
reader is untouched then sensor code and on chip RSSI values do not change. Antenna
reading was taken from antenna 0. When the tag was placed in a PTFE slab, the RSSI
value is -64 too, which is quite similar to the RSSI value of rubber. The sensor code
remains unchanged at 30 and the on-chip RSSI remains 27, which is quite constant.
On the other hand, the sensor code for PVC is 27 and the on-chip RSSI is 31. The two
values remain constant throughout the entire measurement process. The RSSI value is -
60 for PVC. The cardboard piece has RSSI value of -64, and fluctuating sensor code of
29, 30 and on-chip RSSI is 24, 25. POM has a changing sensor code of 15, 16, 17 and
on-chip RSSI which is constant at 31. Fiber glass has a sensor code value which is un-
changed at 3 and on-chip RSSI of 31. FR4 has a sensor code of unstable values 13, 14,
15 and on-chip RSSI of 31. Lastly foam wrap which is folded has sensor code of 18, 20

34
and on-chip RSSI of 31. The RSSI value for POM, FR-4 and foam wrap is -52. Glass
has RSSI value of -54.
5.2.3 Tag has a Dab of Tap Water
Table 5.3 demonstrates the readings inside the laboratory at a temperature of 21 °C. Tap
water is swabbed onto the IC of the sensor dogbone tag using a paper towel. The tag is
placed in LOS of the reader with a distance of 10 cm separating the tag and the reader.
Material Frequency
[KHz]
Antenna RSSI
[dBm]
Sensor
code
On-Chip
RSSI
Channel
Rubber 866300 Antenna 1 -52 16,17 31 Single
PTFE 866300 Antenna 1 -52 13,14,16 19,31 Single
PVC 866300 Antenna 1 -52 23,24,26 31 Single
Cardboard 866300 Antenna 1 -52 19,21 24,31 Single
POM 866300 Antenna 1 -52 18,19 18,31 Single
Glass 866300 Antenna 1 -52 16,17 31 Single
FR4 866300 Antenna 1 -52 23,24 31 Single
Foam wrap 866300 Antenna 1 -52 18 31 Single
Table 5.3: Measurement readings for the materials in presence of moisture
Table 5.3 above shows that the frequency remains the same that is 866.300 MHz, the
channel used is single channel in this form of data transmission. The antenna used is
Antenna 1 for all the reading instances. The sensor code and on-chip RSSI value keeps
fluctuating in this particular condition to match the impedance.
Initially the tag was placed in rubber sheet, the sensor code showed 16, 17 and the on-
chip RSSI is 31. Antenna reading was taken from antenna 1. When the tag was placed
in a PTFE slab, the RSSI value is also -52 dBm. The RSSI remains -52 dBm for all the
materials. The sensor code switches between 13, 14 and 16 and the on-chip RSSI is 19
and 31. The sensor code for PVC fluctuates between 23, 24 and 26, and the on-chip
RSSI is 31. The material made of cardboard has a varying sensor code of 19 and 21.
The on-chip RSSI is 24, 31. POM has a changing sensor code of 18, 19 and on-chip
RSSI of 18, 31. Fiber glass has a sensor code of 16, 17 and on-chip RSSI of 31. FR4 has
a sensor code of values 23, 24 and on-chip RSSI of 31. Lastly foam wrap which is fold-
ed, has sensor code of 18 and on-chip RSSI of 31.

35
5.2.4 Tag is placed inside a Cardboard Box
Measurements were taken inside the lab, at a temperature of around 21°C on the above
mentioned reference materials using Nordic ID tag reader. The given materials were
placed inside a thick box of cardboard material and the box was placed 5 cm away from
the reader in the absence of moisture, then the RSSI value and sensor code on the sensor
dogbone tag was determined. The following readings were obtained:
Material Frequency
[KHz]
Antenna RSSI
[dBm]
Sensor
code
On-Chip
RSSI
Channel
Rubber 866300 Antenna 1 -54 9 31 Single
PTFE 866300 Antenna 1 -52 20,21 31 Single
PVC 866300 Antenna 1 -52 19,20 31 Single
Cardboard 866300 Antenna 1 -52 20,21 31 Single
POM 866300 Antenna 1 -52 17,19 31 Single
Glass 866300 Antenna 1 -52 8 31 Single
FR4 866300 Antenna 1 -52 14 31 Single
Foam wrap 866300 Antenna 1 -52 20 31 Single
Table 5.4: Measurement readings of the materials when tag is placed inside a card-
board box
Table 5.4 indicates that the frequency for all the materials remains the same that is
866.300 MHz, the channel used is single channel in this form of data transmission. The
sensor code and on-chip RSSI value keeps fluctuating to facilitate impedance matching.
When the tag was placed in rubber sheet, it had an RSSI value of -54. The sensor code
was only 9 and the on-chip RSSI is 31. When the tag was placed in a PTFE slab, the
RSSI value is -52. The sensor code fluctuates between 20 and 21, and the on-chip RSSI
remains the same that is 31. The RSSI value remains -52dBm for all the reference mate-
rials except rubber, which is -54dBm. The sensor code for PVC is 19 and 20, and the
on-chip RSSI is 31.
The RSSI value is -52dBm for PVC. The cardboard piece has RSSI value of -52, and
fluctuating sensor code of 20, 21. The on-chip RSSI of cardboard is 31. POM has a
changing sensor code of 17 and 19 and on-chip RSSI which is constant at 31. Fiber
glass has a sensor code value which is stagnant at 8 and on-chip RSSI of 31. FR4 has a
sensor code of 14 and on-chip RSSI remains the same, 31. Finally foam wrap which is
folded has a constant sensor code of 20 and on-chip RSSI of 31. It is noticed that the
RSSI value remains constant for the reading of all the materials.

36
5.2.5 Tag is sandwiched between Two Slabs of Same Material
Measurements were performed indoors, inside the lab, at a constant temperature of
22°C on the given reference materials using Nordic ID tag reader. The materials were
sandwiched between two slabs of the same material with similar dimensions. The reader
was placed 10 cm away from the tag and it is made sure that no moisture is present in
the tag. The RSSI value and sensor code on the sensor dogbone tag was determined.
The following readings were obtained:
Material Frequency
[KHz]
Antenna RSSI
[dBm]
Sensor
code
On-Chip
RSSI
Channel
Rubber 866300 Antenna 1 -52 9 31 Single
PTFE 866300 Antenna 1 -52 18,19,20 31 Single
PVC 866300 Antenna 1 -52 15 31 Single
Cardboard 866300 Antenna 1 -52 18,19 31 Single
POM 866300 Antenna 1 -54 15,16 31 Single
Glass 866300 Antenna 1 -54 0 31 Single
FR4 866300 Antenna 1 -54 5 31 Single
Foam wrap 866300 Antenna 1 -52 16,17 31 Single
Table 5.5: Measurement readings when the tag is placed between two slabs of same
material
The frequency for all the materials remains 866.300 MHz, the channel is single channel.
Antenna 1 is the antenna used by the reader for sensing the tag. The sensor code value
keeps fluctuating to facilitate impedance matching. Whereas the on-chip RSSI is con-
stant at 31.
When the tag was placed in rubber sheet, it had an RSSI value of -52. The sensor code
was only 9 and the on-chip RSSI is 31. When the tag was placed in a PTFE slab, the
RSSI value is -52. The sensor code fluctuates between 18, 19 and 20, and the on-chip
RSSI remains the same, which is 31. The sensor code for PVC is 15, and the on-chip
RSSI is 31. The RSSI value is -52dBm for PVC. The cardboard piece has RSSI value of
-52, and fluctuating sensor code of 18 and 19.
Moreover, the on-chip RSSI of cardboard is a constant value of 31. POM has a sensor
code of 15 and 16, and on-chip RSSI which is constant at 31. Fiber glass has a sensor
code value which is stagnant at 0, no amount of displacement changes the result. The on
chip RSSI value of POM is 31. FR4 has a sensor code of 14 and on chip RSSI value
remains the same, 31. POM, glass and FR4 has an RSSI of -54dBm. Folded foam wrap
has a varying sensor code of 16 and 17 and on-chip RSSI of 31. The RSSI value is -
52dBm for foam wrap.

37
5.2.6 A Dab of Acetic Acid placed on the Tag
A dab of acetic acid is swabbed on the IC of the sensor dogbone tag. Table 5.6 below
shows the measurement readings for the above mentioned scenario. The readings were
taken inside the lab, with the temperature maintained at 21.0 °C. The tag in placed on
the material which is then placed 10 cm from the reader antenna. The reader is placed
10 cm away from the IC chip of the tag. Table 5.6 shows the measurement readings
taken for the mentioned scenario.
Material Frequency
[KHz]
Antenna RSSI
[dBm]
Sensor
code
On-Chip
RSSI
Channel
Rubber 866300 Antenna 1 -52 4 31 Single
PTFE 866300 Antenna 1 -52 16 31 Single
PVC 866300 Antenna 1 -52 13,14,16 31 Single
Cardboard 866300 Antenna 1 -52 13,14 31 Single
POM 866300 Antenna 1 -52 13,14 31 Single
Glass 866300 Antenna 1 -54 19,20 31 Single
FR4 866300 Antenna 1 -52 7 31 Single
Foam wrap 866300 Antenna 1 -52 13,14 31 Single
Table 5.6: A dab of Acetic Acid placed on the tag
Figure 5.3: Readings taken when a dab of Acetic acid is placed on the tag that is 10 cm
away from the Reader Antenna
When the tag was placed in rubber sheet, it had an RSSI value of -52. The sensor code
was 4 and the on-chip RSSI is 31. When the tag was placed in a PTFE slab, the RSSI
value is -52. The sensor code remains constant at 16 and the on-chip RSSI is the same

38
that is 31. The RSSI value remains -52dBm for all the reference materials except glass,
which is -54dBm. The sensor code varies between 13, 14 and 16, the on-chip RSSI is
31. The RSSI value is -52dBm for PVC. The cardboard piece has RSSI value of -52,
and fluctuating sensor code of 13, 14. The on-chip RSSI of cardboard is 31. POM has a
changing sensor code of 13, 14 and on-chip RSSI which is constant at 31. Fiber glass
has a sensor code value of 19, 20 and on-chip RSSI of 31. FR4 has quite a low sensor
code of 7 but the on-chip RSSI remains the same, 31. Finally foam wrap which is folded
has a sensor code of 13, 14 and on-chip RSSI of 31.
It is noticed that the RSSI value remains constant for the reading of all the materials.
Table 5.6 represented above also indicates that the frequency for all the materials re-
mains the same that is 866.300 MHz, the channel used is single channel in this form of
data transmission. Even when displaced, the reader uses only antenna 1 to detect the tag
in this particular set of readings.
5.3 Comparison of the Sensor Code values under Different
Conditions
Taking into consideration the optimum value of the fluctuating sensor code, a table is
created for the different measurements taken. From the obtained table, a graph is plotted
for the given material substrates and the varying conditions. The sensor dogbone tag has
different levels of performance under different environmental conditions. A graph can
easily portray the performance of the tag. This way the performance of the tag can be
analyzed and compared for different conditions easily.
Material Inside lab Sunny out-
doors
Dab of Water Embedded in
box
Sandwiched
b/w slabs
Dab of Acetic
Acid
Rubber 14 20 16 9 9 4
PTFE 13 30 14 21 19 16
PVC 14 27 24 20 15 14
Cardboard 14 29 21 21 19 14
POM 15 16 19 19 16 13
Glass 14 3 17 8 0 19
FR4 17 14 24 14 5 7
Foam wrap 14 20 18 20 17 14
Table 5.7: Comparison of Sensor tags under different conditions

39
Figure 5.4: Analysis of Sensor Code on different materials
The above graph is plotted using the optimum value of the sensor code under different
circumstances. Six curves are obtained for six different measurement analysis per-
formed. The plotted values prove that the performance of the dogbone tag is different
for different material substrates and under different conditions. The graph shows that in
sunny outdoors the sensor code is the highest so highest power consumption by the tag
will take place in this situation. As sensor code decreases the power consumption also
decreases, hence the performance of the tag will also be reduced. The graph also illus-
trates that the type of material the tag is placed in also affects the readings. In case of
fiber glass the sensor code has a dip in all circumstances except inside the lab when ace-
tic acid is present on the tag, this in fact proves that glass is not an ideal material to
place the tag on, in order to obtain the desired results.
Inside the lab, the values are almost constant for all materials, this may be due to the
reason that the temperature is maintained inside the lab and also the tag is in LOS with
the materials giving it a less probable chance for variation. Materials made of PTFE,
PVC, cardboard and POM have almost similar sensor code values for most of the situa-
tions. FR4 material has a slightly higher sensor code value making the tag performance
high in FR4 substrate.
It is also noticed that tap water and acetic acid have different effect on the sensor code
as the sensor code values have noticeable difference for both liquids. But, the tag is able
to perform well even in the presence of moisture with high sensor code values since the
sensor tags do respond to the moisture present in the environment. When tag is placed
inside a cardboard box, the sensor code readings are comparatively high even though
the tag is not in LOS with the reader antenna. Also when the tag is sandwiched between
two slabs of similar material, the sensor code values seems to be high, which makes the
dogbone tag suitable to be embedded inside building walls and placed inside cartons,

40
boxes etc. Moreover, the presence of moisture inside the buildings will not affect the
readings to a very high extent and this way desired results can be obtained in such cir-
cumstances.

41
6. CONCLUSIONS
6.1 Conclusion
In this master thesis, a sensor tag known as the sensor dogbone tag is used as the tran-
sponder and NordicID reader is used to take the measurements from the sensor dogbone
tag. The chosen tag is placed on the given reference materials with varying chemical
properties. This is done in order to compare the performance of the sensor tag on differ-
ent materials which has different make and varying density, chemical properties and
level of flexibility. The readings are taken from the tag on the above mentioned materi-
als under different circumstances. The circumstances include the tag being placed, in-
side the lab in LOS with the reader, sunny outdoors, the materials slab placed inside a
cardboard box along with the tag, inside the lab with the tag having a dab of moisture
on its IC etc. The tag is placed at a constant distance of 10 cm from the reader antenna.
Therefore distance is not a factor that is taken into consideration in this master thesis.
Moreover, the reader is not moved while the measurements are taken.
However, the readings taken when the tag is placed on the given reference materials in
different conditions show a lot of variations. Impedance should be matched in order to
obtain maximum power hence the fluctuations seen in the sensor code. It is noticed
from the measurements that is sensor code value is the main factor that is fluctuating,
the RSSI code value has negligible impact on the change in material or circumstance.
RSSI value is mostly constant. Environmental changes like temperature change, pres-
ence of moisture etc. also affect the sensor code. Situational changes like, when the tag
is embedded inside buildings or present inside boxes also affect the sensor code read-
ings to a high extent. These changes are illustrated in the measurement analysis and the
various results obtained are presented in a graph for easy comparison under different
circumstances.
Sensor dogbone tag is a passive sensor tag that can operate without the aid of inbuilt
power supply. Therefore, the tag is activated by the power received from the reader. The
NordicID Medea reader is mainly used to measure the sensor code and RSSI code. The
reader depicts the mentioned factors in the form of a graph for improved accuracy.
There is fluctuations present in the sensor code values and the RSSI values in order to
provide reliable readings. The frequency band used by the sensor tag for measurement
analysis is UHF between the ranges 860-960 MHz.
In order to maintain compatibility, the RFID system follows a particular standardiza-
tion. The Nordic ID reader makes use of cross dipole antenna. The dogbone tags gener-

42
ally use dipole antenna. A dipole antenna improves the impedance matching of the sys-
tem thus improving the power received by the tags eventually providing better results.
Obtaining readings from the sensor dogbone tag using Nordic ID reader is very easy
and does not consume much time.
It is vital to continuously monitor the tags performance under different conditions to
modify the tags such that they can provide improved and more reliable results. These
measurements analysis provide a means to choose the optimum material and condition
where the tag is placed to obtain the maximum sensor code value which in turn helps
aid maximum power consumption by the sensor dogbone tag from the NordicID reader.
Future analysis can be carried out focusing on the read range of the tag antenna. Moreo-
ver, the initial measurements taking into consideration the read range with the reader
and tag antennas in LOS is provided further in Appendix A.

43
7. REFERENCES
[1] D. M. Dobkin, The RF in RFID: Passive UHF RFID in Practice. Newnes, 2007.
[2] T. by D. M. Finkenzeller, Klaus, “RFID Handbook,” John Wiley & Sons, Ltd,
2010. .
[3] M. P. V. Daniel Hunt, Albert Puglia, “RFID: A Guide to Radio Frequency
Identification,” A John Wiley & Sons, Inc., Publication, 2007. .
[4] Bill Glover ; Himanshu Bhatt, “RFID Essentials,” O’Reilly Media, 2006. .
[5] K. P. Fishkin, M. Philipose, and A. Rea, “Hands-On RFID: Wireless Wearables
for Detecting Use of Objects,” in Ninth IEEE International Symposium on
Wearable Computers (ISWC’05), 2005.
[6] P. J. S. II, “RFID For Dummies,” Wiley Publishing, Inc., 2005. .
[7] “Zebra R110Xi4 RFID Printer.” [Online]. Available:
http://www.barcodesinc.com/zebra/r110xi4.htm. [Accessed: 05-Aug-2015].
[8] T. Deyle, H. Nguyen, M. Reynolds, and C. C. Kemp, “RFID Receive Signal
Strength Indicator (RSSI) Images for Sensor Fusion and Mobile Manipulation.”
[9] “RFID Tag Maximum Read Distance.” [Online]. Available:
http://skyrfid.com/RFID_Tag_Read_Ranges.php. [Accessed: 29-Sep-2015].
[10] “Cyclic Redundancy Check (CRC).” [Online]. Available:
http://ecomputernotes.com/computernetworkingnotes/communication-
networks/cyclic-redundancy-check. [Accessed: 28-Aug-2015].
[11] T. S. Rappaport, Wireless Communications: Principles and Practice, Second.
Singapore: Pearson Education, Inc., 2002.
[12] K. Feher, Wireless digital communications : modulation and spread spectrum
applications. Upper Saddle River N.J.: Prentice-Hall PTR, 1995.

44
[13] F. Leipold, V. Furtula, M. Salewski, H. Bindslev, S. B. Korsholm, F. Meo, P. K.
Michelsen, D. Moseev, S. K. Nielsen, and M. Stejner, “Antenna design for fast
ion collective Thomson scattering diagnostic for the international thermonuclear
experimental reactor,” Rev. Sci. Instrum., vol. 80, no. 9, pp. 359–370, 2009.
[14] K. V. S. Rao, P. V. Nikitin, and S. F. Lam, “Antenna design for UHF RFID tags:
a review and a practical application,” IEEE Trans. Antennas Propag., vol. 53, no.
12, 2005.
[15] D. M. Pozar, “Microwave Engineering,” John Wiley & Sons, Inc., 2012. .
[16] Y. He, W. He, and H. Wong, “A Wideband Circularly Polarized Cross-Dipole
Antenna,” IEEE Antennas Wirel. Propag. Lett., vol. 13, pp. 67–70, 2014.
[17] W. Ernest Payne, “Cross-dipole antenna configurations,” Dec. 2012.
[18] “What is Impedance?” [Online]. Available: http://www.wisegeek.org/what-is-
impedance.htm. [Accessed: 02-Sep-2015].
[19] M. Rouse, “Impedance,” 2005.
[20] R. public of K. K. Yang-Hann (Korea Advanced Instit ute of Science and
Technol ogy (KAIST), “Sound Propagation: An Impedance Based Approach,”
John Wiley & Sons (Asia) Pte L td, 2 Clementi Loop, # 02-01, 2010. .
[21] K. V. S. Rao, P. V. Nikitin, and S. F. Lam, “Impedance matching concepts in
RFID transponder design,” Proc. - Fourth IEEE Work. Autom. Identif. Adv.
Technol. AUTO ID 2005, vol. 2005, no. 1, pp. 39–42, 2005.
[22] L. Frenzel, “Back to basics: impedance matching,” 2011. [Online]. Available:
http://electronicdesign.com/communications/back-basics-impedance-matching-
part-1. [Accessed: 16-Jun-2015].
[23] P. V. Nikitin, K. V. S. Rao, S. F. Lam, V. Pillai, R. Martinez, and H. Heinrich,
“Power reflection coefficient analysis for complex impedances in RFID tag
design,” IEEE Trans. Microw. Theory Tech., vol. 53, no. 9, pp. 2721–2725, 2005.
[24] C. Loo, K. Elmahgoub, F. Yang, A. Elsherbeni, D. Kajfez, T. Elsherbeni, L.
Ukkonen, L. Sydänheimo, and M. Kivikoski, “Impedance Matching for RFID
Tag Antennas,” 24th Annu. Rev. Prog. Appl. Comput. Electromagn., pp. 749–
753, 2008.

45
[25] A. Note, “AND9209 / D Chameleon t Technology Enables Low ‐ Cost Smart,”
pp. 1–4, 2015.
[26] “Applying RSSI filters for optimal RFID performance - RFID Arena.” [Online].
Available: http://rfidarena.com/2013/8/28/applying-rssi-filters-for-optimal-rfid-
performance.aspx. [Accessed: 11-Jun-2015].
[27] RF Micron, “RFMicron Application Note AN002,” pp. 1–3, 2014.
[28] L. Catarinucci, R. Colella, M. De Blasi, L. Patrono, and L. Tarricone, “Enhanced
UHF RFID tags for drug tracing.,” J. Med. Syst., vol. 36, no. 6, pp. 3451–62,
Dec. 2012.
[29] “Smartrac’s New Passive Sensor DogBone Transmits Moisture Levels - RFID
Journal.” [Online]. Available: http://www.rfidjournal.com/articles/view?12723.
[Accessed: 10-Jun-2015].
[30] “Nordic ID Medea.” [Online]. Available: https://www.flickr.com/photos/mobile-
rfid/sets/72157647490735878/. [Accessed: 16-Jun-2015].
[31] “RFID card, Proximity Card of Huayuan RFID, The RFID manufacturer.”
[Online]. Available: http://www.rfidhy.com/. [Accessed: 16-Jun-2015].
[32] “poly(vinyl chloride) (CHEBI:53243).” [Online]. Available:
http://www.ebi.ac.uk/chebi/searchId.do?chebiId=53243. [Accessed: 12-Jun-
2015].
[33] F. Sarvar, N. J. Poole, and P. A. Witting, “PCB glass-fibre laminates: Thermal
conductivity measurements and their effect on simulation,” J. Electron. Mater.,
vol. 19, no. 12, pp. 1345–1350, Dec. 1990.
[34] “» Eurograte® Fiberglass Components FRP Products GRP Properties.” [Online].
Available: http://www.eurograte.co.uk/fibreglass/. [Accessed: 12-Jun-2015].
[35] K. Azar and J. E. Graebner, “Experimental determination of thermal conductivity
of printed wiring boards,” in Twelfth Annual IEEE Semiconductor Thermal
Measurement and Management Symposium. Proceedings, 1996, pp. 169–182.
[36] “The Different Types of RFID Systems | Impinj.” [Online]. Available:
http://www.impinj.com/resources/about-rfid/the-different-types-of-rfid-systems/.
[Accessed: 11-Jun-2015].

46
8. APPENDIX A: FUTURE ANALYSIS
8.1 Tag placed 10 cm from the Reader Antenna
Read range is considered to be an important aspect determining the impedance matching
factor of the RFID tag. It is important to analyze the sensor code of the sensor tag con-
sidering the read range as an important factor. Taking into consideration an instance
from the previous measurement analysis performed inside the lab. The tag being placed
10 cm in LOS with the reader antenna. The following readings are obtained:
Material Frequency
[KHz]
Antenna RSSI
[dBm]
Sensor code On-Chip
RSSI
Chan-
nel
Rubber 866300 Antenna 0 -60 14 30 Single
PTFE 866300 Antenna 1 -52 13,14,15 31 Single
PVC 866300 Antenna 1 -52 13,14 31 Single
Cardboard 866300 Antenna 1 -52 13,14 31 Single
POM 866300 Antenna 1 -52 15,16 18,31 Single
Glass 866300 Antenna 1 -52 12,14,20 31,24 Single
FR4 866300 Antenna 1 -52 15,16,17,28 31,15 Single
Foam wrap 866300 Antenna 1 -52 13,14,31 31 Single
Table 8.1: Measurement readings for materials when tag is in 10 cm LOS with the
Reader Antenna
Figure 8.1: Tag placed 10 cm from the Reader Antenna

47
8.2 Tag placed 40 cm from the Reader Antenna
To compare the read range with the previous range of 10 cm. The next set of measure-
ments were taken inside the lab where the distance between the tag and the reader an-
tenna is 40 cm.
Figure 8.2: Tag placed 40 cm from the Reader Antenna
The followings readings were obtained for the measurement analysis where the tag and
reader antenna is separated by a distance of 40 cm:
Material Frequency
[KHz]
Antenna RSSI
[dBm]
Sensor
code
On-Chip
RSSI
Channel
Rubber 866300 Antenna 1 -58 19,20 31 Single
PTFE 866300 Antenna 1 -54 26 31 Single
PVC 866300 Antenna 1 -56 26,28 31 Single
Cardboard 866300 Antenna 1 -54 26 31 Single
POM 866300 Antenna 1 -56 26 31 Single
Glass 866300 Antenna 1 -60 23,25 24,31 Single
FR4 866300 Antenna 1 -58 22 31 Single
Foam wrap 866300 Antenna 1 -56 24 31 Single
Table 8.2: Measurement readings for materials when tag is in 40 cm LOS with the
Reader Antenna

48
8.3 Comparison of Sensor Code LOS from 10 cm and 40 cm
The optimum values were taken from the reading
Material LOS 10 cm LOS 40 cm
Rubber 14 19
PTFE 13 26
PVC 14 26
Cardboard 14 26
POM 15 26
Glass 14 23
FR4 17 22
Foam wrap 14 24
Table 8.3: Comparison of Sensor tags w.r.t distance of 10 cm and 40 cm
Figure 8.3: Analysis of Sensor Code w.r.t Distance
It is evident from the above graph that distance has an impact on the sensor code value
of the dogbone sensor tag. But, the graph contradicts the above mentioned theory that
the sensor code value increases as the distance from the tag and the reader decreases.
One of the reason for this kind of behavior can be the increase in path loss with the in-
crease in distance. As mentioned in chapter 2, the equation for path loss is:

49
𝑎𝐹 = −147.6 + 20 log(𝑟) + 20 log(𝑓 ) − 10 log(𝐺𝑇) − 10 log(𝐺𝑅) (8.1)
Substituting the UHF frequency range in the above given equation we get the following
distance which is also mentioned in chapter 2. As shown in the table below, the free
space path loss increases as the distance increases.
Distance r(m) aF (dB) for 868 MHz
0.3 18.6
1 29.0
3 38.6
10 49.0
Table 8.4: Comparison of Free Space Path loss at different distance [2]
Moreover, the power received by the antenna also varies as the antenna distance chang-
es. Since the power has an effect on the IC, the capacitors experience impedance
change. The sensor code reflects the antenna environment of the tag. The antenna envi-
ronment has a larger effect on the tag when the distance increases between the tag and
reader. Therefore, this particular behavior of the sensor code value needs to be studied
further on different materials to make concrete analysis.