ANISOTROPIC UNDRAINED SHEAR STRENGTH FROM...
8
ANISOTROPIC UNDRAINED SHEAR STRENGTH FROM BACK ANALYSIS Raghvendra Singh, Ph.D Candidate (QIP), Dept. of Civil Engrg., IIT Kharagpur, WB 721302, INDIA Debasis Roy, Assistant Professor, Dept. of Civil Engrg., IIT Kharagpur, WB 721302, INDIA ABSTRACT Residual undrained shear strength ( u s ) of sand and silt is often estimated from back analysis of deformed geometries of embankments resulting from undrained loading. Although these back analyses are based on the assumption of inherently isotropic soil behaviour, saturated sand and silt exhibit strong inherent anisotropy during undrained loading. A simple procedure for back analysis has been proposed considering inherently anisotropic soil behaviour. Thirteen case histories on undrained response of embankments were back analyzed using the proposed procedure to develop a set of correlations between normalized cone tip resistance and SPT blow count and u s for extension, simple shear and compression modes of loading. These correlations were then used to assess undrained static stability of one embankment and one tailings dyke and undrained seismic stability of two dams. These results are consistent with observations. RÉSUMÉ Résiduel undrained la résistance de cisailles ( u s ) de sable et de limon est souvent estimée de de retour l'analyse de géométries déformé de remblais qui résulte de chargeant undrained. Bien que ces dos analyse est basé la supposition de comportement de sol en soi d'isotropie, le sable et le limon saturés exposent fort inhérent anisotropy pendant chargeant undrained. Une procédure simple pour de retour l'analyse a été proposée considérant comportement de sol en soi de l'anisotropique. Treize histoires de cas sur undrained la réponse de remblais était l'utilisation analysée arrière la procédure proposée pour développer une série de corrélations entre la résistance de pointe de cône normalisé et SPT souffle le compte et pour l'extension, les cisailles simples et les modes de compression de chargement. Ces corrélations ont été alors utilisées pour évaluer la stabilité undrained statique d'un remblai et une digue de queues et la stabilité undrained sismique de deux barrages. Ces résultats sont conforme aux observations. 1. INTRODUCTION Residual undrained shear strength, u s , of sand and silt is often estimated from back analysis of deformed geometries of dams and embankments caused by undrained loading (e.g., Olson et al. 2003). Although these procedures are usually based on the assumption of inherently isotropic material behaviour, saturated sand and silt exhibit strong inherent anisotropy during undrained loading (Vaid et al. 1990 and Yoshimine et al. 1998). A simple, limit-equilibrium back-analysis procedure has been proposed here accounting for inherently anisotropic undrained behaviour of granular soils. Laboratory test data obtained from testing of undisturbed frozen samples have been utilized to develop this framework. Thirteen case histories on static undrained response of dams and embankments have been back-analyzed using the proposed procedure to develop a set of correlations between normalized cone tip resistance, 1 c q , and Standard Penetration Test (SPT) blow count, ( ) 60 1 N , and anisotropic undrained residual shear strength ratio, v u s σ ′ representing various modes of deformation, e.g., plane strain compression and extension, and simple shear. Symbol v σ ′ has been used here to denote the vertical effective stress prior to the onset of undrained loading. In this study the following normalization scheme is used for 1 c q and ( ) 60 1 N : ( ) 5 . 0 1 v a c c P q q σ ′ × = and ( ) ( ) ER P N N v a × ′ × = 5 . 0 60 1 σ , where c q is the cone tip resistance in MPa, a P is the atmospheric pressure in the same unit as v σ ′ , N is the raw SPT blow count and ER is the energy ratio. For validation, the correlations were used to assess undrained stability two embankments. For the embankment at J-Pit within the Syncrude premises in Alberta, the undrained deformation was rather small. The second embankment, an upstream- constructed tailings dam at Sullivan Mines in British Columbia, underwent flow failure during a rapid loading event. We begin with a discussion on the main factors that influence the anisotropy in undrained shear strength. The back-analysis methodology and the case histories analyzed in this study are then briefly described. The 1 c q - v u s σ ′ and ( ) 60 1 N - v u s σ ′ relationships for various loading modes are then presented. Finally the results of stability assessment of J-Pit embankment and Sullivan Mines tailings dam are presented. 2. INHERENT ANISOTROPY Inter-particle contacts tend to develop preferentially in the direction of gravitational field during deposition. 1227 Sea to Sky Geotechnique 2006
Transcript of ANISOTROPIC UNDRAINED SHEAR STRENGTH FROM...
ANISOTROPIC UNDRAINED SHEAR STRENGTH FROM BACK ANALYSIS
Raghvendra Singh, Ph.D Candidate (QIP), Dept. of Civil Engrg., IIT Kharagpur, WB 721302, INDIA Debasis Roy, Assistant Professor, Dept. of Civil Engrg., IIT Kharagpur, WB 721302, INDIA ABSTRACT Residual undrained shear strength (
us ) of sand and silt is often estimated from back analysis of deformed geometries of
embankments resulting from undrained loading. Although these back analyses are based on the assumption of inherently isotropic soil behaviour, saturated sand and silt exhibit strong inherent anisotropy during undrained loading. A simple procedure for back analysis has been proposed considering inherently anisotropic soil behaviour. Thirteen case histories on undrained response of embankments were back analyzed using the proposed procedure to develop a set of correlations between normalized cone tip resistance and SPT blow count and
us for extension, simple shear and
compression modes of loading. These correlations were then used to assess undrained static stability of one embankment and one tailings dyke and undrained seismic stability of two dams. These results are consistent with observations. RÉSUMÉ Résiduel undrained la résistance de cisailles (
us ) de sable et de limon est souvent estimée de de retour l'analyse de
géométries déformé de remblais qui résulte de chargeant undrained. Bien que ces dos analyse est basé la supposition de comportement de sol en soi d'isotropie, le sable et le limon saturés exposent fort inhérent anisotropy pendant chargeant undrained. Une procédure simple pour de retour l'analyse a été proposée considérant comportement de sol en soi de l'anisotropique. Treize histoires de cas sur undrained la réponse de remblais était l'utilisation analysée arrière la procédure proposée pour développer une série de corrélations entre la résistance de pointe de cône normalisé et SPT souffle le compte et pour l'extension, les cisailles simples et les modes de compression de chargement. Ces corrélations ont été alors utilisées pour évaluer la stabilité undrained statique d'un remblai et une digue de queues et la stabilité undrained sismique de deux barrages. Ces résultats sont conforme aux observations. 1. INTRODUCTION Residual undrained shear strength,
us , of sand and silt is
often estimated from back analysis of deformed geometries of dams and embankments caused by undrained loading (e.g., Olson et al. 2003). Although these procedures are usually based on the assumption of inherently isotropic material behaviour, saturated sand and silt exhibit strong inherent anisotropy during undrained loading (Vaid et al. 1990 and Yoshimine et al. 1998). A simple, limit-equilibrium back-analysis procedure has been proposed here accounting for inherently anisotropic undrained behaviour of granular soils. Laboratory test data obtained from testing of undisturbed frozen samples have been utilized to develop this framework. Thirteen case histories on static undrained response of dams and embankments have been back-analyzed using the proposed procedure to develop a set of correlations between normalized cone tip resistance,
1cq , and Standard Penetration Test (SPT)
blow count, ( )601N , and anisotropic undrained residual
shear strength ratio, vu
s σ ′ representing various modes of
deformation, e.g., plane strain compression and extension, and simple shear. Symbol
vσ ′ has been used
here to denote the vertical effective stress prior to the onset of undrained loading. In this study the following normalization scheme is used for
1cq and ( )
601N :
( ) 5.0
1 vaccPqq σ ′×= and ( ) ( ) ERPNN
va×′×=
5.0
601σ ,
where c
q is the cone tip resistance in MPa, a
P is the
atmospheric pressure in the same unit as v
σ ′ , N is the
raw SPT blow count and ER is the energy ratio.
For validation, the correlations were used to assess undrained stability two embankments. For the embankment at J-Pit within the Syncrude premises in Alberta, the undrained deformation was rather small. The second embankment, an upstream- constructed tailings dam at Sullivan Mines in British Columbia, underwent flow failure during a rapid loading event.
We begin with a discussion on the main factors that influence the anisotropy in undrained shear strength. The back-analysis methodology and the case histories analyzed in this study are then briefly described. The
1cq -
vus σ ′ and ( )
601N -vu
s σ ′ relationships for various loading
modes are then presented. Finally the results of stability assessment of J-Pit embankment and Sullivan Mines tailings dam are presented.
2. INHERENT ANISOTROPY Inter-particle contacts tend to develop preferentially in the direction of gravitational field during deposition.
1227
Sea to Sky Geotechnique 2006
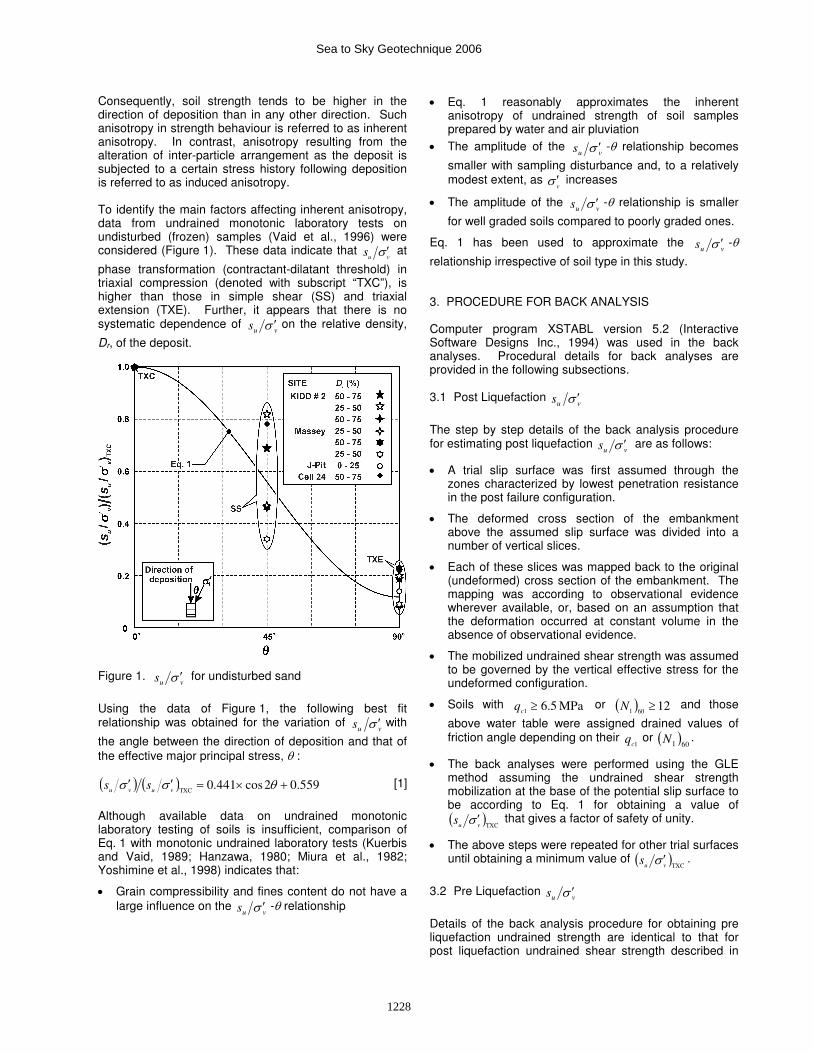
Consequently, soil strength tends to be higher in the direction of deposition than in any other direction. Such anisotropy in strength behaviour is referred to as inherent anisotropy. In contrast, anisotropy resulting from the alteration of inter-particle arrangement as the deposit is subjected to a certain stress history following deposition is referred to as induced anisotropy. To identify the main factors affecting inherent anisotropy, data from undrained monotonic laboratory tests on undisturbed (frozen) samples (Vaid et al., 1996) were considered (Figure 1). These data indicate that
vus σ ′ at
phase transformation (contractant-dilatant threshold) in triaxial compression (denoted with subscript “TXC”), is higher than those in simple shear (SS) and triaxial extension (TXE). Further, it appears that there is no systematic dependence of
vus σ ′ on the relative density,
Dr, of the deposit.
Figure 1.
vus σ ′ for undisturbed sand
Using the data of Figure 1, the following best fit relationship was obtained for the variation of
vus σ ′ with
the angle between the direction of deposition and that of the effective major principal stress, θ : ( ) ( ) 559.02cos441.0
TXC+×=′′ θσσ
vuvuss [1]
Although available data on undrained monotonic laboratory testing of soils is insufficient, comparison of Eq. 1 with monotonic undrained laboratory tests (Kuerbis and Vaid, 1989; Hanzawa, 1980; Miura et al., 1982; Yoshimine et al., 1998) indicates that:
• Grain compressibility and fines content do not have a large influence on the
vus σ ′ -θ relationship
• Eq. 1 reasonably approximates the inherent anisotropy of undrained strength of soil samples prepared by water and air pluviation
• The amplitude of the vu
s σ ′ -θ relationship becomes
smaller with sampling disturbance and, to a relatively modest extent, as
vσ ′ increases
• The amplitude of the vu
s σ ′ -θ relationship is smaller
for well graded soils compared to poorly graded ones.
Eq. 1 has been used to approximate the vu
s σ ′ -θ
relationship irrespective of soil type in this study.
3. PROCEDURE FOR BACK ANALYSIS Computer program XSTABL version 5.2 (Interactive Software Designs Inc., 1994) was used in the back analyses. Procedural details for back analyses are provided in the following subsections. 3.1 Post Liquefaction
vus σ ′
The step by step details of the back analysis procedure for estimating post liquefaction
vus σ ′ are as follows:
• A trial slip surface was first assumed through the zones characterized by lowest penetration resistance in the post failure configuration.
• The deformed cross section of the embankment above the assumed slip surface was divided into a number of vertical slices.
• Each of these slices was mapped back to the original (undeformed) cross section of the embankment. The mapping was according to observational evidence wherever available, or, based on an assumption that the deformation occurred at constant volume in the absence of observational evidence.
• The mobilized undrained shear strength was assumed to be governed by the vertical effective stress for the undeformed configuration.
• Soils with MPa 5.61 ≥c
q or ( ) 12601 ≥N and those
above water table were assigned drained values of friction angle depending on their
1cq or ( )
601N .
• The back analyses were performed using the GLE method assuming the undrained shear strength mobilization at the base of the potential slip surface to be according to Eq. 1 for obtaining a value of ( )
TXCvus σ ′ that gives a factor of safety of unity.
• The above steps were repeated for other trial surfaces until obtaining a minimum value of ( )
TXCvus σ ′ .
3.2 Pre Liquefaction vu
s σ ′
Details of the back analysis procedure for obtaining pre liquefaction undrained strength are identical to that for post liquefaction undrained shear strength described in
1228
Sea to Sky Geotechnique 2006
Section 3.1 except that in this case the undeformed geometry is analysed.
4. CORRELATIONS FOR vu
s σ ′
Thirteen post-deformation geometries from case histories pertaining to static undrained response of earth embankments were back analyzed using anisotropic undrained shear strength. These case histories are listed in Table 1. The results of these back analyses are summarized in Table 2. The results from isotropic back analyses are also included in Table 2 for comparison. It appears from the results presented in Table 2 that the undrained shear strengths from isotropic back analyses are in general similar to the anisotropic undrained shear strengths for simple shear loading. Using the results of back analyses, correlation between
vus σ ′ and penetration resistances were developed as
discussed in the following subsections. 4.1. Post liquefaction
vus σ ′ −
1cq and
vus σ ′ − ( )
601N
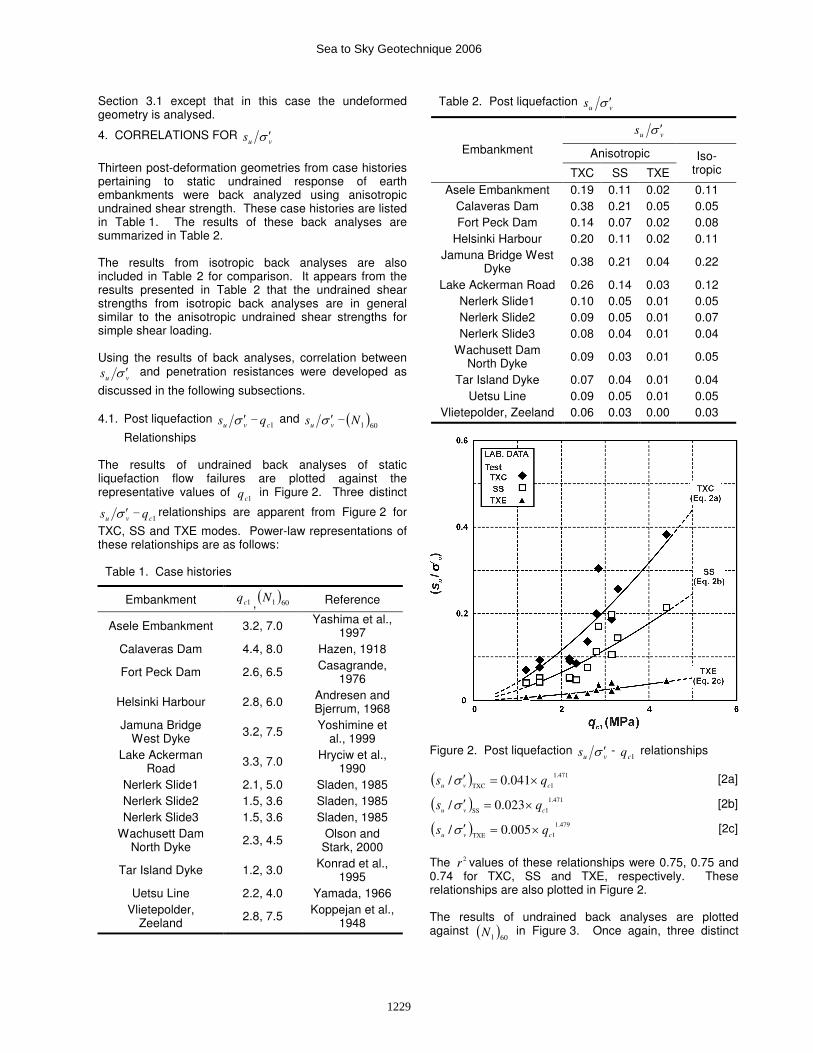
Relationships The results of undrained back analyses of static liquefaction flow failures are plotted against the representative values of
1cq in Figure 2. Three distinct
vus σ ′ −
1cq relationships are apparent from Figure 2 for
TXC, SS and TXE modes. Power-law representations of these relationships are as follows:
Table 1. Case histories
Embankment 1cq , ( )
601N Reference
Asele Embankment 3.2, 7.0 Yashima et al., 1997
Calaveras Dam 4.4, 8.0 Hazen, 1918
Fort Peck Dam 2.6, 6.5 Casagrande, 1976
Helsinki Harbour 2.8, 6.0 Andresen and Bjerrum, 1968
Jamuna Bridge West Dyke 3.2, 7.5 Yoshimine et
al., 1999 Lake Ackerman
Road 3.3, 7.0 Hryciw et al., 1990
Nerlerk Slide1 2.1, 5.0 Sladen, 1985 Nerlerk Slide2 1.5, 3.6 Sladen, 1985 Nerlerk Slide3 1.5, 3.6 Sladen, 1985
Wachusett Dam North Dyke 2.3, 4.5 Olson and
Stark, 2000
Tar Island Dyke 1.2, 3.0 Konrad et al., 1995
Uetsu Line 2.2, 4.0 Yamada, 1966 Vlietepolder,
Zeeland 2.8, 7.5 Koppejan et al., 1948
Table 2. Post liquefaction vu
s σ ′
vus σ ′
Anisotropic Embankment
TXC SS TXE Iso-
tropic
Asele Embankment 0.19 0.11 0.02 0.11 Calaveras Dam 0.38 0.21 0.05 0.05 Fort Peck Dam 0.14 0.07 0.02 0.08
Helsinki Harbour 0.20 0.11 0.02 0.11 Jamuna Bridge West
Dyke 0.38 0.21 0.04 0.22
Lake Ackerman Road 0.26 0.14 0.03 0.12 Nerlerk Slide1 0.10 0.05 0.01 0.05 Nerlerk Slide2 0.09 0.05 0.01 0.07 Nerlerk Slide3 0.08 0.04 0.01 0.04
Wachusett Dam North Dyke 0.09 0.03 0.01 0.05
Tar Island Dyke 0.07 0.04 0.01 0.04 Uetsu Line 0.09 0.05 0.01 0.05
Vlietepolder, Zeeland 0.06 0.03 0.00 0.03
Figure 2. Post liquefaction vu
s σ ′ - 1c
q relationships
( ) 471.1
1TXC041.0/
cvuqs ×=′σ [2a]
( ) 471.1
1SS023.0/
cvuqs ×=′σ [2b]
( ) 479.1
1TXE005.0/
cvuqs ×=′σ [2c]
The 2r values of these relationships were 0.75, 0.75 and
0.74 for TXC, SS and TXE, respectively. These relationships are also plotted in Figure 2. The results of undrained back analyses are plotted against ( )
601N in Figure 3. Once again, three distinct
1229
Sea to Sky Geotechnique 2006
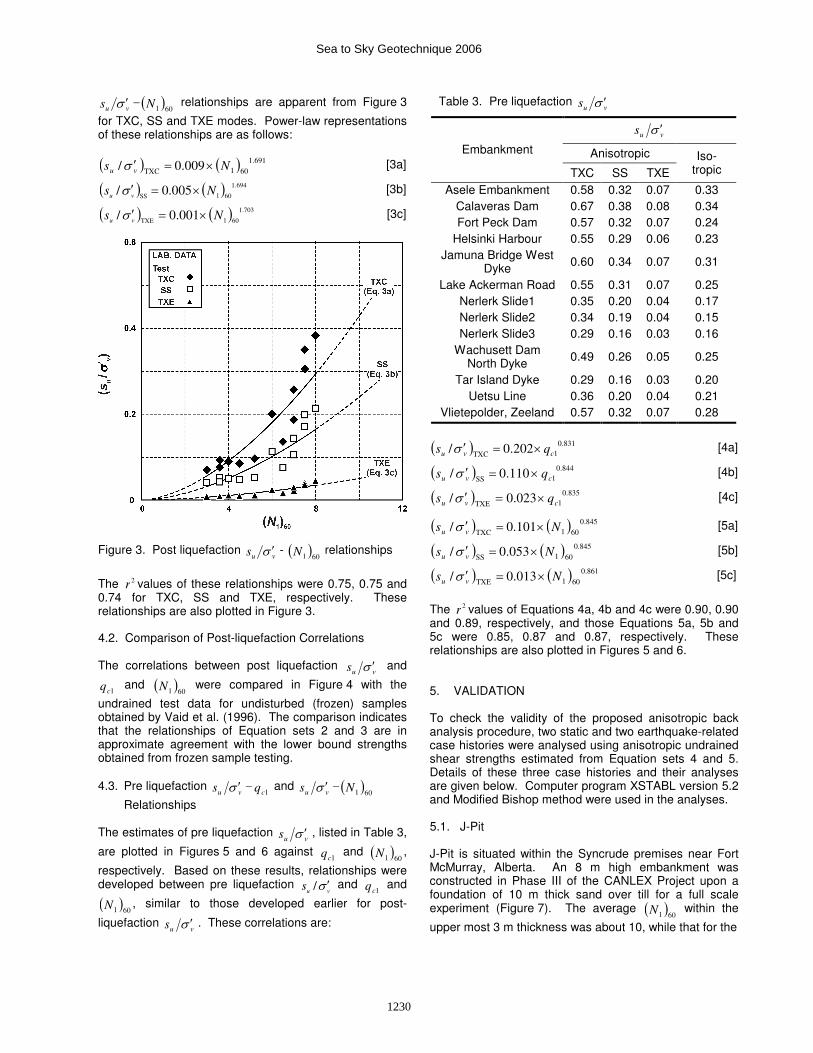
vus σ ′ − ( )
601N relationships are apparent from Figure 3
for TXC, SS and TXE modes. Power-law representations of these relationships are as follows:
( ) ( ) 691.1
601TXC009.0/ Ns
vu×=′σ [3a]
( ) ( ) 694.1
601SS005.0/ Ns
vu×=′σ [3b]
( ) ( ) 703.1
601TXE001.0/ Ns
vu×=′σ [3c]
Figure 3. Post liquefaction vu
s σ ′ - ( )601N relationships
The 2r values of these relationships were 0.75, 0.75 and
0.74 for TXC, SS and TXE, respectively. These relationships are also plotted in Figure 3.
4.2. Comparison of Post-liquefaction Correlations The correlations between post liquefaction
vus σ ′ and
1cq and ( )
601N were compared in Figure 4 with the
undrained test data for undisturbed (frozen) samples obtained by Vaid et al. (1996). The comparison indicates that the relationships of Equation sets 2 and 3 are in approximate agreement with the lower bound strengths obtained from frozen sample testing. 4.3. Pre liquefaction
vus σ ′ −
1cq and
vus σ ′ − ( )
601N
Relationships The estimates of pre liquefaction
vus σ ′ , listed in Table 3,
are plotted in Figures 5 and 6 against 1c
q and ( )601N ,
respectively. Based on these results, relationships were developed between pre liquefaction
vus σ ′/ and
1cq and
( )601N , similar to those developed earlier for post-
liquefaction vu
s σ ′ . These correlations are:
Table 3. Pre liquefaction vu
s σ ′
vus σ ′
Anisotropic Embankment
TXC SS TXE Iso-
tropic
Asele Embankment 0.58 0.32 0.07 0.33 Calaveras Dam 0.67 0.38 0.08 0.34 Fort Peck Dam 0.57 0.32 0.07 0.24
Helsinki Harbour 0.55 0.29 0.06 0.23 Jamuna Bridge West
Dyke 0.60 0.34 0.07 0.31
Lake Ackerman Road 0.55 0.31 0.07 0.25 Nerlerk Slide1 0.35 0.20 0.04 0.17 Nerlerk Slide2 0.34 0.19 0.04 0.15 Nerlerk Slide3 0.29 0.16 0.03 0.16
Wachusett Dam North Dyke 0.49 0.26 0.05 0.25
Tar Island Dyke 0.29 0.16 0.03 0.20 Uetsu Line 0.36 0.20 0.04 0.21
Vlietepolder, Zeeland 0.57 0.32 0.07 0.28
( ) 831.0
1TXC202.0/
cvuqs ×=′σ [4a]
( ) 844.0
1SS110.0/
cvuqs ×=′σ [4b]
( ) 835.0
1TXE023.0/
cvuqs ×=′σ [4c]
( ) ( ) 845.0
601TXC101.0/ Ns
vu×=′σ [5a]
( ) ( ) 845.0
601SS053.0/ Ns
vu×=′σ [5b]
( ) ( ) 861.0
601TXE013.0/ Ns
vu×=′σ [5c]
The 2
r values of Equations 4a, 4b and 4c were 0.90, 0.90 and 0.89, respectively, and those Equations 5a, 5b and 5c were 0.85, 0.87 and 0.87, respectively. These relationships are also plotted in Figures 5 and 6. 5. VALIDATION To check the validity of the proposed anisotropic back analysis procedure, two static and two earthquake-related case histories were analysed using anisotropic undrained shear strengths estimated from Equation sets 4 and 5. Details of these three case histories and their analyses are given below. Computer program XSTABL version 5.2 and Modified Bishop method were used in the analyses. 5.1. J-Pit J-Pit is situated within the Syncrude premises near Fort McMurray, Alberta. An 8 m high embankment was constructed in Phase III of the CANLEX Project upon a foundation of 10 m thick sand over till for a full scale experiment (Figure 7). The average ( )
601N within the
upper most 3 m thickness was about 10, while that for the
1230
Sea to Sky Geotechnique 2006
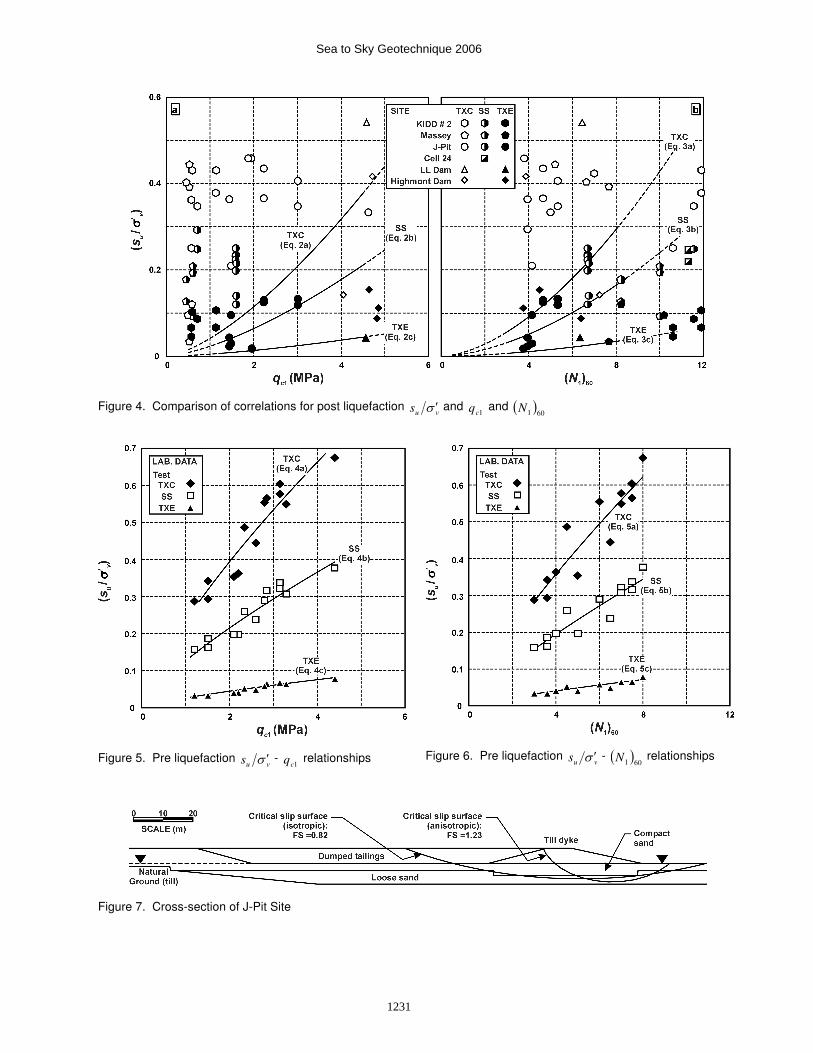
Figure 4. Comparison of correlations for post liquefaction vu
s σ ′ and 1c
q and ( )601N
Figure 5. Pre liquefaction
vus σ ′ -
1cq relationships
Figure 6. Pre liquefaction
vus σ ′ - ( )
601N relationships
Figure 7. Cross-section of J-Pit Site
1231
Sea to Sky Geotechnique 2006
rest of the sand layer was about 5. Tailings sand was rapidly dumped behind the embankment to subject the embankment to undrained loading. This experiment led to the development of a very limited amount of deformation (Byrne et al., 2000). Anisotropic undrained shear strengths were estimated from Equation set 4 except that for soils with
MPa 5.61 ≥c
q or ( ) 12601 ≥N and for those above water
table drained values of friction angle were used depending on the
1cq of the soil unit. The input soil
properties used in this analysis are listed in Table 4.
Table 4. Anisotropic soil properties
Site Soil Types Cohesion TXC*φ
(1)
Till dyke 10 kPa 38° Dumped tailings ─ 0°
Loose sand ─ 23° Compact sand ─ 32°
J-Pit
Natural ground ─ 38°
Dyke 10 kPa 38° Iron tailings ─ 38°
Old iron tailings ─ 13°
Sullivan Mines
Tailings Dyke Glacial till ─ 38°
Core 65 kPa 0° Masonry wall 80 kPa 0°
Shell 9.4 kPa 30.5° Chang Dam
Liquefiable sand and silt ─ 13°
Compacted embankment 65 kPa 0°
Alluvium / slide debris: Liquefied ─ 7°
Lower San Fernando
Dam Alluvium / slide debris: Non
liquefied ─ 30°
(1) ( )TXC
1TXC
* /sinvu
s σφ ′= − . Strengths in other modes of
loading are from Equation 1. From the analysis, a limit equilibrium factor of safety of 1.23 was obtained. This result is in agreement with the stable performance that was observed during the full scale experiment. The critical slip surface of this analysis is shown on Figure 7. In contrast, if
vus σ ′ estimated from isotropic back
analysis is used, a limit equilibrium factor of safety of 0.82 is obtained. Such a result would have indicated failure. 5.2. Sullivan Mines Sullivan Mine was in operation near Kimberley, British Columbia. A tailings dyke within the Mine premises experienced a static liquefaction and flow failure in 1991, in which toe was displaced by up to 45 m in the
downstream direction from its original position. The failure occurred due to the triggering of static liquefaction within the old iron tailings characterized with an average ( )
601N of about 4. For more details on this case history
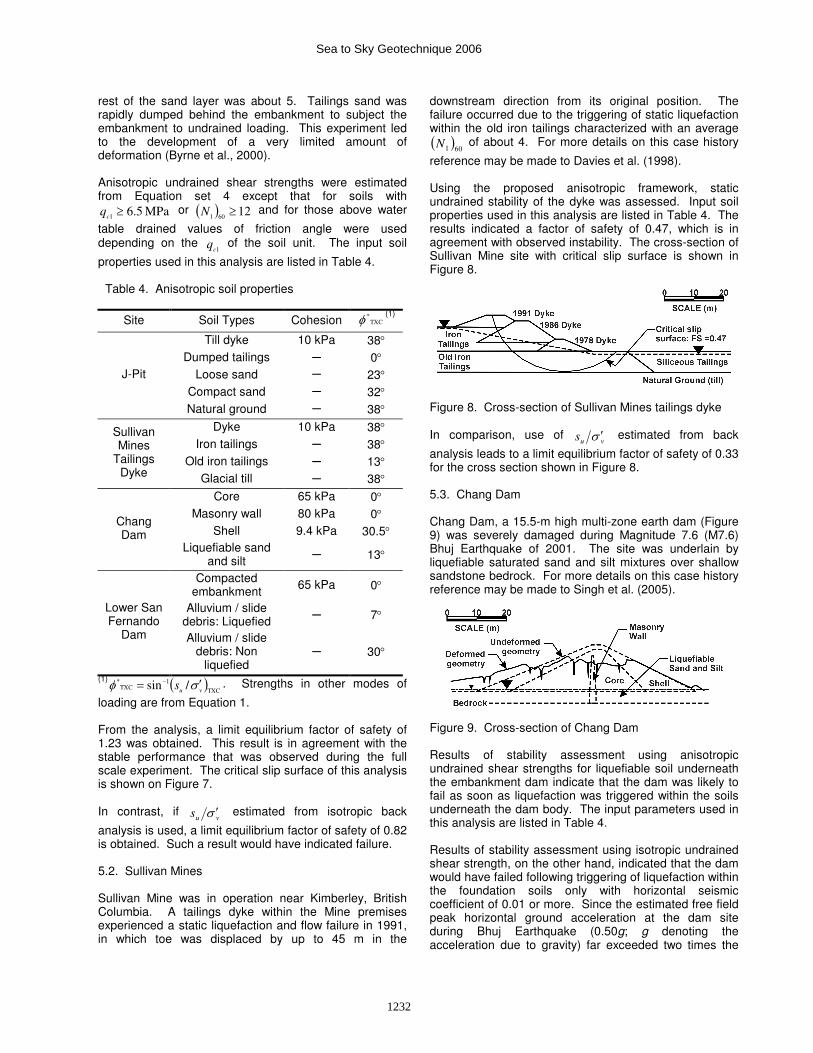
reference may be made to Davies et al. (1998). Using the proposed anisotropic framework, static undrained stability of the dyke was assessed. Input soil properties used in this analysis are listed in Table 4. The results indicated a factor of safety of 0.47, which is in agreement with observed instability. The cross-section of Sullivan Mine site with critical slip surface is shown in Figure 8.
Figure 8. Cross-section of Sullivan Mines tailings dyke In comparison, use of
vus σ ′ estimated from back
analysis leads to a limit equilibrium factor of safety of 0.33 for the cross section shown in Figure 8. 5.3. Chang Dam Chang Dam, a 15.5-m high multi-zone earth dam (Figure 9) was severely damaged during Magnitude 7.6 (M7.6) Bhuj Earthquake of 2001. The site was underlain by liquefiable saturated sand and silt mixtures over shallow sandstone bedrock. For more details on this case history reference may be made to Singh et al. (2005).
Figure 9. Cross-section of Chang Dam Results of stability assessment using anisotropic undrained shear strengths for liquefiable soil underneath the embankment dam indicate that the dam was likely to fail as soon as liquefaction was triggered within the soils underneath the dam body. The input parameters used in this analysis are listed in Table 4. Results of stability assessment using isotropic undrained shear strength, on the other hand, indicated that the dam would have failed following triggering of liquefaction within the foundation soils only with horizontal seismic coefficient of 0.01 or more. Since the estimated free field peak horizontal ground acceleration at the dam site during Bhuj Earthquake (0.50g; g denoting the acceleration due to gravity) far exceeded two times the
1232
Sea to Sky Geotechnique 2006
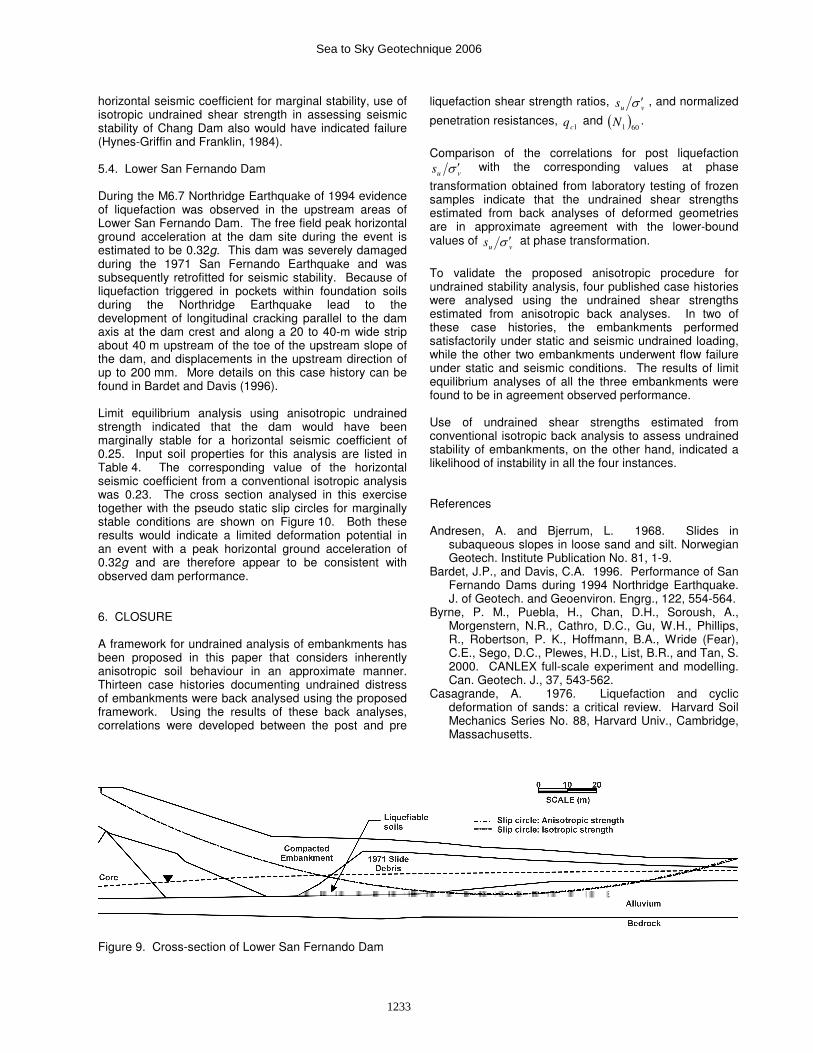
horizontal seismic coefficient for marginal stability, use of isotropic undrained shear strength in assessing seismic stability of Chang Dam also would have indicated failure (Hynes-Griffin and Franklin, 1984). 5.4. Lower San Fernando Dam During the M6.7 Northridge Earthquake of 1994 evidence of liquefaction was observed in the upstream areas of Lower San Fernando Dam. The free field peak horizontal ground acceleration at the dam site during the event is estimated to be 0.32g. This dam was severely damaged during the 1971 San Fernando Earthquake and was subsequently retrofitted for seismic stability. Because of liquefaction triggered in pockets within foundation soils during the Northridge Earthquake lead to the development of longitudinal cracking parallel to the dam axis at the dam crest and along a 20 to 40-m wide strip about 40 m upstream of the toe of the upstream slope of the dam, and displacements in the upstream direction of up to 200 mm. More details on this case history can be found in Bardet and Davis (1996). Limit equilibrium analysis using anisotropic undrained strength indicated that the dam would have been marginally stable for a horizontal seismic coefficient of 0.25. Input soil properties for this analysis are listed in Table 4. The corresponding value of the horizontal seismic coefficient from a conventional isotropic analysis was 0.23. The cross section analysed in this exercise together with the pseudo static slip circles for marginally stable conditions are shown on Figure 10. Both these results would indicate a limited deformation potential in an event with a peak horizontal ground acceleration of 0.32g and are therefore appear to be consistent with observed dam performance. 6. CLOSURE A framework for undrained analysis of embankments has been proposed in this paper that considers inherently anisotropic soil behaviour in an approximate manner. Thirteen case histories documenting undrained distress of embankments were back analysed using the proposed framework. Using the results of these back analyses, correlations were developed between the post and pre
liquefaction shear strength ratios, vu
s σ ′ , and normalized
penetration resistances, 1c
q and ( )601N .
Comparison of the correlations for post liquefaction
vus σ ′ with the corresponding values at phase
transformation obtained from laboratory testing of frozen samples indicate that the undrained shear strengths estimated from back analyses of deformed geometries are in approximate agreement with the lower-bound values of
vus σ ′ at phase transformation.
To validate the proposed anisotropic procedure for undrained stability analysis, four published case histories were analysed using the undrained shear strengths estimated from anisotropic back analyses. In two of these case histories, the embankments performed satisfactorily under static and seismic undrained loading, while the other two embankments underwent flow failure under static and seismic conditions. The results of limit equilibrium analyses of all the three embankments were found to be in agreement observed performance. Use of undrained shear strengths estimated from conventional isotropic back analysis to assess undrained stability of embankments, on the other hand, indicated a likelihood of instability in all the four instances. References Andresen, A. and Bjerrum, L. 1968. Slides in
subaqueous slopes in loose sand and silt. Norwegian Geotech. Institute Publication No. 81, 1-9.
Bardet, J.P., and Davis, C.A. 1996. Performance of San Fernando Dams during 1994 Northridge Earthquake. J. of Geotech. and Geoenviron. Engrg., 122, 554-564.
Byrne, P. M., Puebla, H., Chan, D.H., Soroush, A., Morgenstern, N.R., Cathro, D.C., Gu, W.H., Phillips, R., Robertson, P. K., Hoffmann, B.A., Wride (Fear), C.E., Sego, D.C., Plewes, H.D., List, B.R., and Tan, S. 2000. CANLEX full-scale experiment and modelling. Can. Geotech. J., 37, 543-562.
Casagrande, A. 1976. Liquefaction and cyclic deformation of sands: a critical review. Harvard Soil Mechanics Series No. 88, Harvard Univ., Cambridge, Massachusetts.
Figure 9. Cross-section of Lower San Fernando Dam
1233
Sea to Sky Geotechnique 2006
Davies, M.P., Dawson, B.B., and Chin, B.G. 1998. Static liquefaction slump of mine tailings – A case history. Proc., 51st Can. Geotech. Conf., Edmonton.
Hanzawa, H. 1980. Undrained strength and stability analysis for a quick sand. Soils and Found., 20(2), 17-29.
Hazen, A. 1918. A study of the slip in the Calaveras Dam. Engrg. News Record, 81, 1158-1164.
Hryciw, R.D., Vitton, S., and Thomann, T.G. 1990. Liquefaction and flow failure during seismic exploration. J. of Geotech. Engrg., 116, 1881-1899.
Hynes-Griffin, M.E., and Franklin, A.G. 1984. Rationalizing the seismic coefficient method. Miscellaneous Paper GL-84-13, US Army Corps of Engineers Waterways Experiment Station, Vicksburg, Mississippi.
Interactive Software Designs Inc. 1994. XSTABL: an integrated slope stability analysis program for personal computers. Reference Manual.
Konrad, J.M., and Watts, B.D. 1995. Undrained shear strength for liquefction flow failure analysis. Can. Geotech. J., 33, 784-794.
Koppejan, A.W., van Wamelen, B.M., and Weinberg, L.J.H. 1948. Coastal flow slides in the Dutch province of Zeeland. Proc., 2nd Int. Conf. on Soil Mech. and Found. Engrg., Rotterdam, The Netherlands, 89-96.
Kuerbis, R., and Vaid, Y.P. 1989. Undrained behaviour of clean and silty sands. Proc., Discussion session on influence of local conditions on seismic response, 12th Int. Conf. on Soil Mech. and Found. Engrg., Rio de Janeiro, 91-100.
Miura, S., and Toki, S. 1982. A sample preparation method and its effect on static and cyclic deformation strength properties of sand. Soils and Found., 22(1), 61-77.
Olson, S.M., and Stark, T.D. 2000. Static liquefaction flow failure of the North Dike of Wachusett Dam. J. of Geotech. and Geoenviron. Engrg., 126, 1184-1193.
Olson, S.M., and Stark, T.D. 2003. Yield strength ratio and liquefaction analysis of slopes and embankments. J. of Geotech. and Geoenviron. Engrg., 129, 727-737.
Singh, R., Roy, D., and Jain, S.K. 2005. Analysis of earth dams affected by the 2001 Bhuj Earthquake. Engrg. Geol., 80, 282-291.
Sladen, J.A., D’Hollader, R.D., and Krahn, J. 1985. The liquefaction of sands, a critical collapse surface approach. Can. Geotech. J., 22, 564-578.
Vaid, Y.P., Chung, E.K.F., and Keurbis, R.H. 1990. Stress path and steady state. Can. Geotech. J., 27, 1-7.
Vaid, Y.P., Sivathayalan, S., Eliadorani A.A., and Uthayakumar, M. 1996. Laboratory testing at Univ. of British Columbia. CANLEX Report.
Yashima, A., Oka, F., Konrad, J.M., Uzuoka, R., and Taguchi, Y. 1997. Analysis of a progressive flow failure in an embankment of compacted till. Proceedings, Deformation and Progressive Failure in Geomechanics, 1, 599-604.
Yoshimine, M., Robertson, P.K., and (Fear) Wride, C.E. 1999. Undrained shear strength of clean sands to trigger flow liquefaction. Can. Geotech. J., 36, 891-906.
Yoshimine, M., Ishihara, K., and Vargas, W. 1998. Effects of principal stress direction and intermediate stress on undrained shear behavior of sand. Soils and Found., 38(3), 179-188.
1234
Sea to Sky Geotechnique 2006