ANISOTROPIC PLASTICITY AND FAILURE PREDICTION … · ANISOTROPIC PLASTICITY AND FAILURE PREDICTION...
22
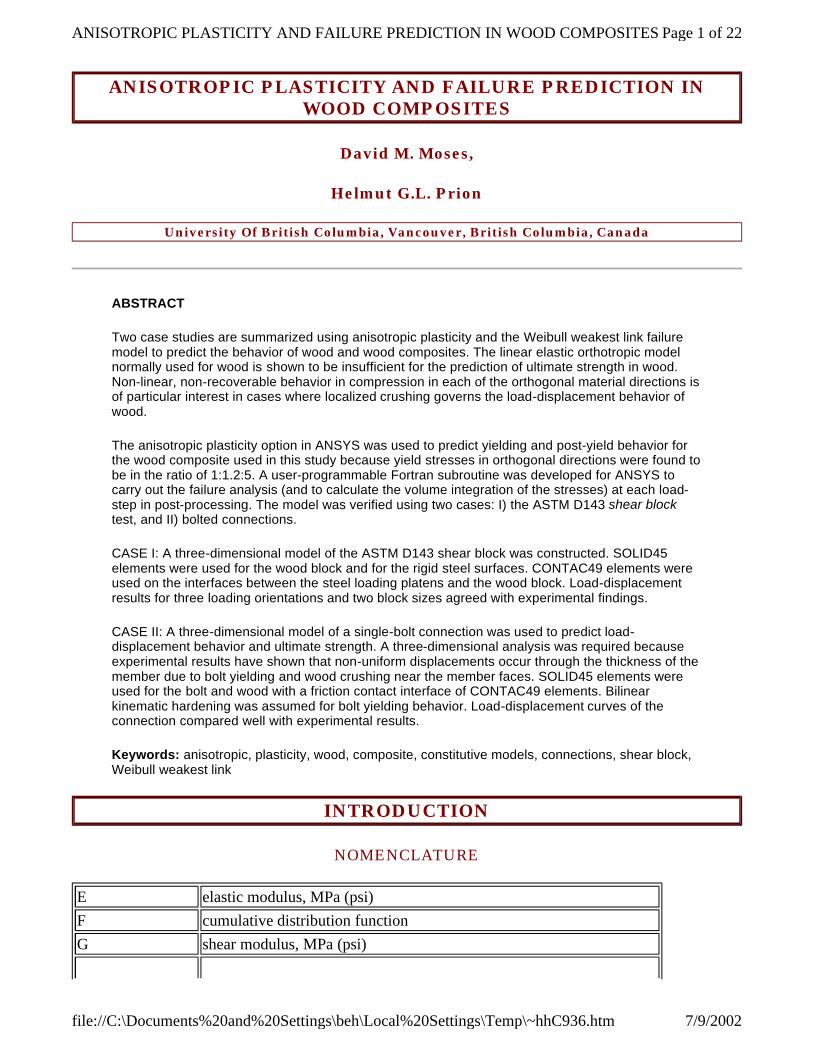
ANISOTROPIC PLASTICITY AND FAILURE PREDICTION IN WOOD COMPOSITES David M. Moses, Helmut G.L. Prion University Of British Columbia, Vancouver, British Columbia, Canada ABSTRACT Two case studies are summarized using anisotropic plasticity and the Weibull weakest link failure model to predict the behavior of wood and wood composites. The linear elastic orthotropic model normally used for wood is shown to be insufficient for the prediction of ultimate strength in wood. Non-linear, non-recoverable behavior in compression in each of the orthogonal material directions is of particular interest in cases where localized crushing governs the load-displacement behavior of wood. The anisotropic plasticity option in ANSYS was used to predict yielding and post-yield behavior for the wood composite used in this study because yield stresses in orthogonal directions were found to be in the ratio of 1:1.2:5. A user-programmable Fortran subroutine was developed for ANSYS to carry out the failure analysis (and to calculate the volume integration of the stresses) at each load- step in post-processing. The model was verified using two cases: I) the ASTM D143 shear block test, and II) bolted connections. CASE I: A three-dimensional model of the ASTM D143 shear block was constructed. SOLID45 elements were used for the wood block and for the rigid steel surfaces. CONTAC49 elements were used on the interfaces between the steel loading platens and the wood block. Load-displacement results for three loading orientations and two block sizes agreed with experimental findings. CASE II: A three-dimensional model of a single-bolt connection was used to predict load- displacement behavior and ultimate strength. A three-dimensional analysis was required because experimental results have shown that non-uniform displacements occur through the thickness of the member due to bolt yielding and wood crushing near the member faces. SOLID45 elements were used for the bolt and wood with a friction contact interface of CONTAC49 elements. Bilinear kinematic hardening was assumed for bolt yielding behavior. Load-displacement curves of the connection compared well with experimental results. Keywords: anisotropic, plasticity, wood, composite, constitutive models, connections, shear block, Weibull weakest link INTRODUCTION NOMENCLATURE E elastic modulus, MPa (psi) F cumulative distribution function G shear modulus, MPa (psi) Page 1 of 22 ANISOTROPIC PLASTICITY AND FAILURE PREDICTION IN WOOD COMPOSITES 7/9/2002 file://C:\Documents%20and%20Settings\beh\Local%20Settings\Temp\~hhC936.htm
Transcript of ANISOTROPIC PLASTICITY AND FAILURE PREDICTION … · ANISOTROPIC PLASTICITY AND FAILURE PREDICTION...
ANISOTROPIC PLASTICITY AND FAILURE PREDICTION IN WOOD COMPOSITES
David M. Moses,
Helmut G.L. Prion
University Of British Columbia, Vancouver, British Columbia, Canada
ABSTRACT
Two case studies are summarized using anisotropic plasticity and the Weibull weakest link failure model to predict the behavior of wood and wood composites. The linear elastic orthotropic model normally used for wood is shown to be insufficient for the prediction of ultimate strength in wood. Non-linear, non-recoverable behavior in compression in each of the orthogonal material directions is of particular interest in cases where localized crushing governs the load-displacement behavior of wood.
The anisotropic plasticity option in ANSYS was used to predict yielding and post-yield behavior for the wood composite used in this study because yield stresses in orthogonal directions were found to be in the ratio of 1:1.2:5. A user-programmable Fortran subroutine was developed for ANSYS to carry out the failure analysis (and to calculate the volume integration of the stresses) at each load-step in post-processing. The model was verified using two cases: I) the ASTM D143 shear block test, and II) bolted connections.
CASE I: A three-dimensional model of the ASTM D143 shear block was constructed. SOLID45 elements were used for the wood block and for the rigid steel surfaces. CONTAC49 elements were used on the interfaces between the steel loading platens and the wood block. Load-displacement results for three loading orientations and two block sizes agreed with experimental findings.
CASE II: A three-dimensional model of a single-bolt connection was used to predict load-displacement behavior and ultimate strength. A three-dimensional analysis was required because experimental results have shown that non-uniform displacements occur through the thickness of the member due to bolt yielding and wood crushing near the member faces. SOLID45 elements were used for the bolt and wood with a friction contact interface of CONTAC49 elements. Bilinear kinematic hardening was assumed for bolt yielding behavior. Load-displacement curves of the connection compared well with experimental results.
Keywords: anisotropic, plasticity, wood, composite, constitutive models, connections, shear block, Weibull weakest link
INTRODUCTION
NOMENCLATURE
E elastic modulus, MPa (psi)F cumulative distribution functionG shear modulus, MPa (psi)
Page 1 of 22ANISOTROPIC PLASTICITY AND FAILURE PREDICTION IN WOOD COMPOSITES
7/9/2002file://C:\Documents%20and%20Settings\beh\Local%20Settings\Temp\~hhC936.htm

Few constitutive models for linear and non-linear stress-strain behavior exist for wood. Finding a suitable material model for wood will allow analysts to predict its behavior in numerous applications in structural engineering without the reliance on extensive empirical tests. Such a model would represent the true stress-strain behavior of wood and lead to predictions of ultimate strength for numerous applications such as the behavior of connections in solid wood and in wood composites. In addition, the development of wood composites will benefit from modeling through the prediction of the effects of modified lay-ups on stress-strain and ultimate strength characteristics.
The focus of this paper is the development and verification of one such model which has been proposed for use with bolted connections in solid lumber and laminated strand lumber (a wood composite panel product). Wood composite panels for structural applications tend to be similar to solid wood in structure but have improved strength properties which are associated with less variability than solid wood. The structure of solid wood is, therefore, the basis for its material models.
I integral function[J] Jacobian
K normalization parameter, MPa2, (psi2)KIC, KIIC fracture toughness, MN/m3/2 (ksiv in)
[M] describes yield surfaceN number of integration points{N} shape functionsP load, kN (lbs)W weighting value for Gauss integrationd diameter, mm (in.)k shape parameter of Weibull distributionl length, mm (in.)m scale parameter of Weibull distributionp probability levelw width, mm (in.)x, y, z material directions in global co-ordinates
ratio of true ultimate stress to assumedcoefficient of frictionstress or normal stress, MPa (psi)shear stress, MPa (psi)
, , normalized local co-ordinates
Subscriptsi, j, r countersx, y, z, q material directions1, 2, ... counters+,- tension, compressionSuperscripts* reference value
Page 2 of 22ANISOTROPIC PLASTICITY AND FAILURE PREDICTION IN WOOD COMPOSITES
7/9/2002file://C:\Documents%20and%20Settings\beh\Local%20Settings\Temp\~hhC936.htm
Wood structure and material behavior
In a tree, cells are oriented with their long axes parallel to the height of the tree. Each year, a layer of wood cells, known as the annual ring, is added directly below the bark. The result is a difference in properties parallel to the long axis, and perpendicular to this axis, thereby making this an anisotropic material. Property differences between the radial and tangential directions (relative to the core of a log) have resulted in wood being classified as a radially orthotropic material especially with respect to individual pieces of lumber cut from a log.
Values of elastic and shear moduli are very different in each of the three orthotropic directions. Douglas fir, for example, has a ratio of elastic moduli in each of the primary directions of roughly 1:1.5:18 where the highest stiffness is in the direction parallel-to-grain. The ratio for shear moduli in each of the primary shear planes is approximately 1:12:15. Large variations in these ratios exist between species. Stress-strain behavior is non-linear in compression due to crushing of cells and separation of fibers. In tension, however, stress-strain is linear until brittle failure occurs. The same is true of shear. Ultimate tension strength can be more than twenty times greater parallel-to-grain than perpendicular-to-grain, whereas compression strength perpendicular-to-grain can be more than three times greater than parallel-to-grain strength. Wood composites can be manufactured to modify these properties through the orientation of fibers and the use of multiple layers.
Laminated Strand Lumber (LSL)
Laminated strand lumber is a composite structural material consisting of oriented Aspen flakes, glued and compressed to form panels up to 90 mm (3 1/2 inches) thick. This material is an attractive alternative to solid sawn lumber because it has stronger properties than solid lumber of the same species as well as less variability. It can be produced from smaller diameter low quality trees thereby reducing our dependence on old growth forests. LSL can be produced to specific final properties by controlling variables related to the stranded lumber, resins, and pressing cycle. As the properties of the material are improved, efficiency in design of structures using LSL is limited only by the capacity of these wood members at their connections to other structural components. This limitation currently results in very conservative building designs that do not utilize the maximum strength capacity of the members. Improvements in this area can only be achieved with a comprehensive stress analysis of the material at its connections with other members.
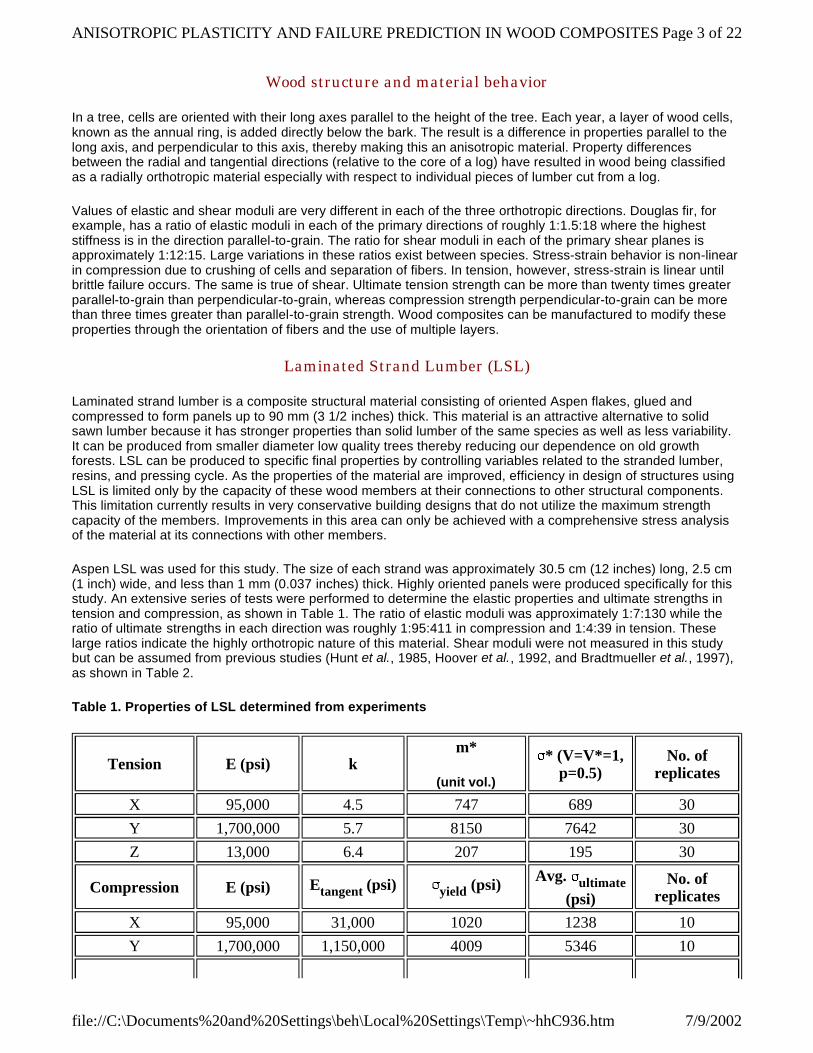
Aspen LSL was used for this study. The size of each strand was approximately 30.5 cm (12 inches) long, 2.5 cm (1 inch) wide, and less than 1 mm (0.037 inches) thick. Highly oriented panels were produced specifically for this study. An extensive series of tests were performed to determine the elastic properties and ultimate strengths in tension and compression, as shown in Table 1. The ratio of elastic moduli was approximately 1:7:130 while the ratio of ultimate strengths in each direction was roughly 1:95:411 in compression and 1:4:39 in tension. These large ratios indicate the highly orthotropic nature of this material. Shear moduli were not measured in this study but can be assumed from previous studies (Hunt et al., 1985, Hoover et al., 1992, and Bradtmueller et al., 1997), as shown in Table 2.
Table 1. Properties of LSL determined from experiments
Tension E (psi) km*
(unit vol.)
* (V=V*=1, p=0.5)
No. of replicates
X 95,000 4.5 747 689 30Y 1,700,000 5.7 8150 7642 30Z 13,000 6.4 207 195 30
Compression E (psi) Etangent (psi) yield (psi) Avg. ultimate (psi)
No. of replicates
X 95,000 31,000 1020 1238 10Y 1,700,000 1,150,000 4009 5346 10
Page 3 of 22ANISOTROPIC PLASTICITY AND FAILURE PREDICTION IN WOOD COMPOSITES
7/9/2002file://C:\Documents%20and%20Settings\beh\Local%20Settings\Temp\~hhC936.htm
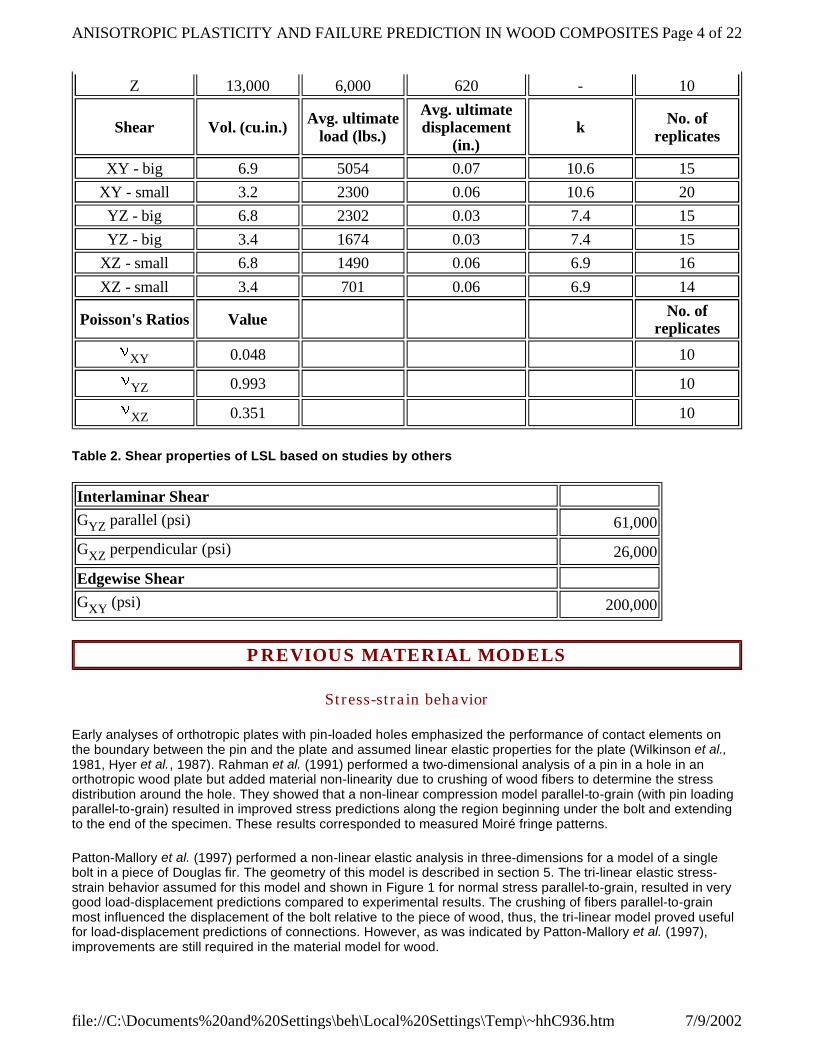
Table 2. Shear properties of LSL based on studies by others
PREVIOUS MATERIAL MODELS
Stress-strain behavior
Early analyses of orthotropic plates with pin-loaded holes emphasized the performance of contact elements on the boundary between the pin and the plate and assumed linear elastic properties for the plate (Wilkinson et al., 1981, Hyer et al., 1987). Rahman et al. (1991) performed a two-dimensional analysis of a pin in a hole in an orthotropic wood plate but added material non-linearity due to crushing of wood fibers to determine the stress distribution around the hole. They showed that a non-linear compression model parallel-to-grain (with pin loading parallel-to-grain) resulted in improved stress predictions along the region beginning under the bolt and extending to the end of the specimen. These results corresponded to measured Moiré fringe patterns.
Patton-Mallory et al. (1997) performed a non-linear elastic analysis in three-dimensions for a model of a single bolt in a piece of Douglas fir. The geometry of this model is described in section 5. The tri-linear elastic stress-strain behavior assumed for this model and shown in Figure 1 for normal stress parallel-to-grain, resulted in very good load-displacement predictions compared to experimental results. The crushing of fibers parallel-to-grain most influenced the displacement of the bolt relative to the piece of wood, thus, the tri-linear model proved useful for load-displacement predictions of connections. However, as was indicated by Patton-Mallory et al. (1997), improvements are still required in the material model for wood.
Z 13,000 6,000 620 - 10
Shear Vol. (cu.in.) Avg. ultimate load (lbs.)
Avg. ultimate displacement
(in.)k No. of
replicates
XY - big 6.9 5054 0.07 10.6 15XY - small 3.2 2300 0.06 10.6 20YZ - big 6.8 2302 0.03 7.4 15YZ - big 3.4 1674 0.03 7.4 15
XZ - small 6.8 1490 0.06 6.9 16XZ - small 3.4 701 0.06 6.9 14
Poisson's Ratios Value No. of replicates
XY 0.048 10
YZ 0.993 10
XZ 0.351 10
Interlaminar Shear GYZ parallel (psi) 61,000
GXZ perpendicular (psi) 26,000
Edgewise Shear GXY (psi) 200,000
Page 4 of 22ANISOTROPIC PLASTICITY AND FAILURE PREDICTION IN WOOD COMPOSITES
7/9/2002file://C:\Documents%20and%20Settings\beh\Local%20Settings\Temp\~hhC936.htm

Two drawbacks were associated with the tri-linear elastic model. Firstly, at high strains, negative terms were found to develop on the main diagonal of the stiffness matrix if similar tri-linear elastic behavior was used in the two other orthotropic material directions in compression. As a result, non-linearity in the shear stress-strain behavior was introduced to improve the numerical stability of the model. Secondly, the prediction of stresses in the perpendicular-to-grain directions was inaccurate, as discussed by Moses and Prion (1999), which meant that ultimate strength of the connection could not be well predicted. Part of the problem with the elastic model was its inability to account for the energy dissipation associated with the non-recoverable deformations due to wood crushing. Plasticity models prevent this form of instability from occurring. For the current study, it was proposed that the behavior in compression be modeled with the anisotropic plasticity model, while tension and shear behavior remain linear elastic, until reaching ultimate failure.
Figure 1. TRI-LINEAR STRESS-STRAIN CURVE FOR COMPRESSION BEHAVIOR PARALLEL-TO-GRAIN
Failure behavior
Wood is brittle in tension and shear. Methods such as fracture mechanics and failure envelopes can be used to predict the point at which brittle failure occurs. Stress based criteria are typically used for wood.
Fracture mechanics in wood can be used to predict ultimate strength in mixed-mode tension/shear stress fields. A crack can start in any direction but will always turn to the direction with the lowest fracture toughness. In wood, this is normally the direction along the grain because the fracture toughness in other directions is approximately ten times greater. There is, however, some question about the accuracy in the determination of the fracture toughness constants KIC and KIIC for mixed-mode failure in wood (Fonselius and Riipola 1992). In addition to difficulties in determining the fracture toughness constants, there is little information available on more complex criteria for three-dimensional mixed-mode stress cases. To simplify the modeling and solution processes, and reduce the number of tests required to determine strength parameters, the theory of fracture mechanics was not selected for the current study.
The Maximum Stress criterion is assumed for the current study. Ultimate strengths in tension and shear are predicted using the Weibull weakest link theory for size effects, while the plasticity model allows for increasing strains in compression beyond the assigned yield stresses. Tensor polynomial criteria such as the Tsai-Wu (Tsai and Wu 1971) criterion can be used to relate ultimate strengths in tension, compression and shear to the current state of stress in two-dimensional models of composites. In three-dimensions, however, the determination of the interaction terms required for this model can be difficult or impossible if all stress combinations are considered.
CURRENT MODEL
Anisotropic Plasticity
The anisotropic plasticity material model has been used to predict failure of non-wood composites in two-dimensional finite element models at the University of British Columbia, Canada (Vaziri 1991). In the current application, the anisotropic plasticity model was applied in three-dimensions using the TB,ANISO option in ANSYS v.5.3. As indicated in the ANSYS Theory Manual (ANSYS 1992), this model is based upon the yield criterion by Hill (1947) for orthotropic materials. Different compression and tension yield stresses in each direction are handled by changes proposed by Shih and Lee (1978) and the work hardening model of Valliappan et al. (1976). An associative flow rule is assumed. A sample stress-strain curve is shown in Figure 2 indicating the yield stress and tangent modulus for one material direction. The two other normal stress-strain curves and three shear
Page 5 of 22ANISOTROPIC PLASTICITY AND FAILURE PREDICTION IN WOOD COMPOSITES
7/9/2002file://C:\Documents%20and%20Settings\beh\Local%20Settings\Temp\~hhC936.htm
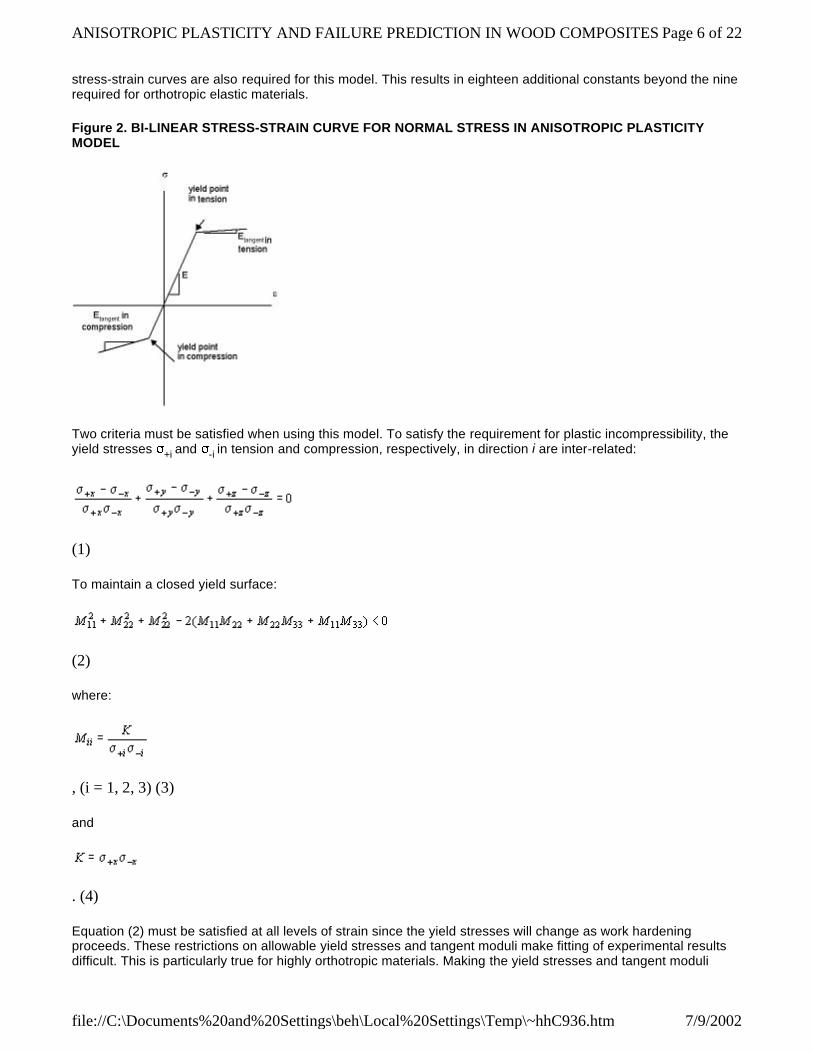
stress-strain curves are also required for this model. This results in eighteen additional constants beyond the nine required for orthotropic elastic materials.
Figure 2. BI-LINEAR STRESS-STRAIN CURVE FOR NORMAL STRESS IN ANISOTROPIC PLASTICITY MODEL
Two criteria must be satisfied when using this model. To satisfy the requirement for plastic incompressibility, the yield stresses +i and -i in tension and compression, respectively, in direction i are inter-related:
(1)
To maintain a closed yield surface:
(2)
where:
, (i = 1, 2, 3) (3)
and
. (4)
Equation (2) must be satisfied at all levels of strain since the yield stresses will change as work hardening proceeds. These restrictions on allowable yield stresses and tangent moduli make fitting of experimental results difficult. This is particularly true for highly orthotropic materials. Making the yield stresses and tangent moduli
Page 6 of 22ANISOTROPIC PLASTICITY AND FAILURE PREDICTION IN WOOD COMPOSITES
7/9/2002file://C:\Documents%20and%20Settings\beh\Local%20Settings\Temp\~hhC936.htm
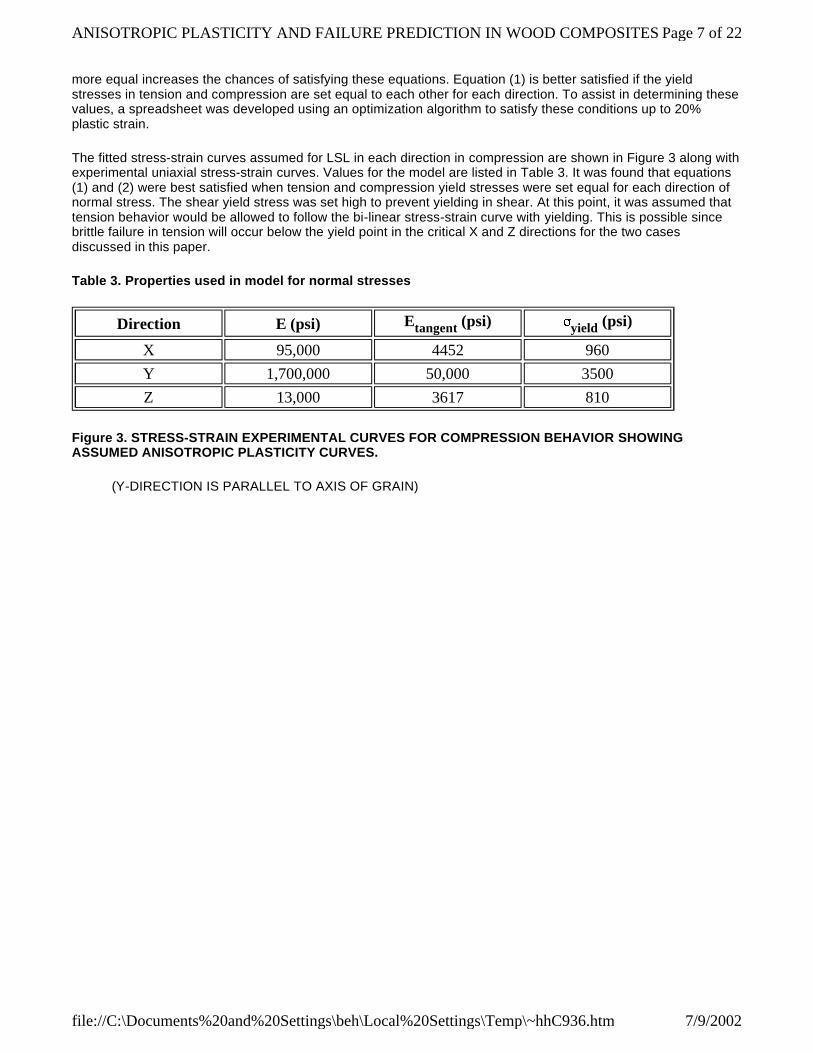
more equal increases the chances of satisfying these equations. Equation (1) is better satisfied if the yield stresses in tension and compression are set equal to each other for each direction. To assist in determining these values, a spreadsheet was developed using an optimization algorithm to satisfy these conditions up to 20% plastic strain.
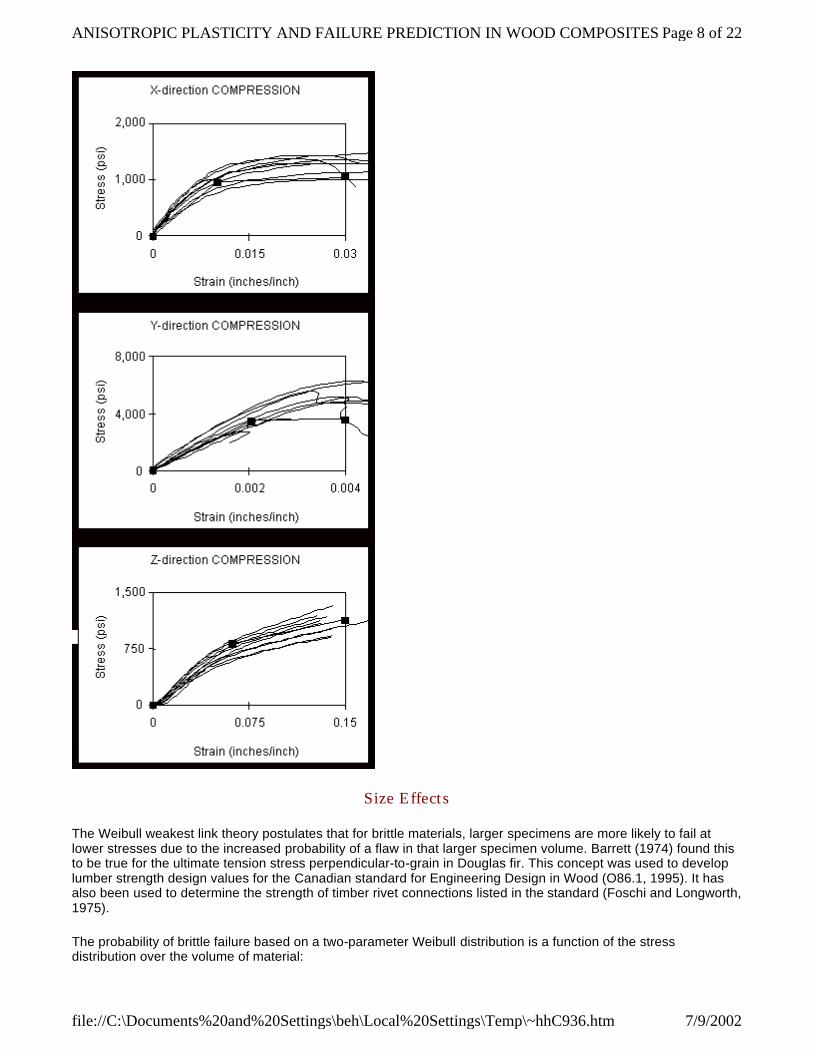
The fitted stress-strain curves assumed for LSL in each direction in compression are shown in Figure 3 along with experimental uniaxial stress-strain curves. Values for the model are listed in Table 3. It was found that equations (1) and (2) were best satisfied when tension and compression yield stresses were set equal for each direction of normal stress. The shear yield stress was set high to prevent yielding in shear. At this point, it was assumed that tension behavior would be allowed to follow the bi-linear stress-strain curve with yielding. This is possible since brittle failure in tension will occur below the yield point in the critical X and Z directions for the two cases discussed in this paper.
Table 3. Properties used in model for normal stresses
Figure 3. STRESS-STRAIN EXPERIMENTAL CURVES FOR COMPRESSION BEHAVIOR SHOWING ASSUMED ANISOTROPIC PLASTICITY CURVES.
(Y-DIRECTION IS PARALLEL TO AXIS OF GRAIN)
Direction E (psi) Etangent (psi) yield (psi)
X 95,000 4452 960Y 1,700,000 50,000 3500Z 13,000 3617 810
Page 7 of 22ANISOTROPIC PLASTICITY AND FAILURE PREDICTION IN WOOD COMPOSITES
7/9/2002file://C:\Documents%20and%20Settings\beh\Local%20Settings\Temp\~hhC936.htm
Size Effects
The Weibull weakest link theory postulates that for brittle materials, larger specimens are more likely to fail at lower stresses due to the increased probability of a flaw in that larger specimen volume. Barrett (1974) found this to be true for the ultimate tension stress perpendicular-to-grain in Douglas fir. This concept was used to develop lumber strength design values for the Canadian standard for Engineering Design in Wood (O86.1, 1995). It has also been used to determine the strength of timber rivet connections listed in the standard (Foschi and Longworth, 1975).
The probability of brittle failure based on a two-parameter Weibull distribution is a function of the stress distribution over the volume of material:
Page 8 of 22ANISOTROPIC PLASTICITY AND FAILURE PREDICTION IN WOOD COMPOSITES
7/9/2002file://C:\Documents%20and%20Settings\beh\Local%20Settings\Temp\~hhC936.htm
(5)
where F is the probability of failure, V* is a reference volume, k is the shape parameter, m is the scale parameter associated with the reference volume, and is the stress (tension or shear, in any given direction or plane, respectively). The reference stress is based on experimental results shown in Table 1.
(6)
is the failure stress for a given probability of failure, p. It can be shown that failure occurs when the reference stress, *, occurring over volume V*, satisfies the following inequality which relates a variable state of stress over an arbitrary volume to the reference stress:
(7)
This form is similar to the Maximum Stress criterion where each stress is treated individually and stress interactions are assumed to have little or no effect. When the stress field is constant over a volume, equation (7) can be simplified to give the failure stresses for a given probability level, p:
(8)
where 1 and 2 are the strengths of specimens of volumes, V1 and V2, respectively.
This theory was implemented in ANSYS with a user-programmable command user01.f to execute the modified userac.f subroutine that calculated stresses in wood in the post-processor. The following algorithm for calculating the volume integral in equation (7) was carried out at each load-step in the post-processor to determine when or if failure occurred. At each load step, this algorithm was applied to each of the three normal tensile stresses and each of the three shear stresses. In this way, the governing mode of failure could be determined.
The volume integral, I:
(9)
must be evaluated for each three-dimensional brick element (SOLID45) using Gaussian integration. Volume, V, in the global co-ordinate system (x,y,z), for each element is defined, in terms of the local (normalized) element co-
ordinate system ( , , ):
Page 9 of 22ANISOTROPIC PLASTICITY AND FAILURE PREDICTION IN WOOD COMPOSITES
7/9/2002file://C:\Documents%20and%20Settings\beh\Local%20Settings\Temp\~hhC936.htm
(10)
The partial derivative of volume, dV:
(11)
where [J] is the Jacobian. Combining equations (9) and (11):
(12)
in local co-ordinates. The determinant of [J] is equal to the volume of the element in global co-ordinates and is calculated from the nodal coordinates and the derivatives of shape functions {N}:
for i = 1, 2,. . ., 8 (13)
For Gaussian integration, (12) is re-written in terms of stresses evaluated at each Gauss point, i, multiplied by the appropriate Gauss weighting values, Wi. From (12) we get the approximate Gauss evaluation of the integral:
(14)
A 2x2x2 (8-point) integration scheme is used for the SOLID45 elements. The stresses at one Gauss point are determined:
(15)
Page 10 of 22ANISOTROPIC PLASTICITY AND FAILURE PREDICTION IN WOOD COMPOSI...
7/9/2002file://C:\Documents%20and%20Settings\beh\Local%20Settings\Temp\~hhC936.htm
Combining (14) and (15):
(16)
Equation (16) is determined for each element and then summed for all elements. The total is equal to the volume integral over the entire model geometry in global co-ordinates. The operation is repeated for each stress component and k value. Accuracy is dependent on the number of integration points, N, and is ensured if the order of the integral is less than 2N-1. The 2x2x2 point scheme can be used for larger values of k provided that the number of elements is increased in regions of high stress gradients.
CASE STUDY I - WOOD SHEAR BLOCKS
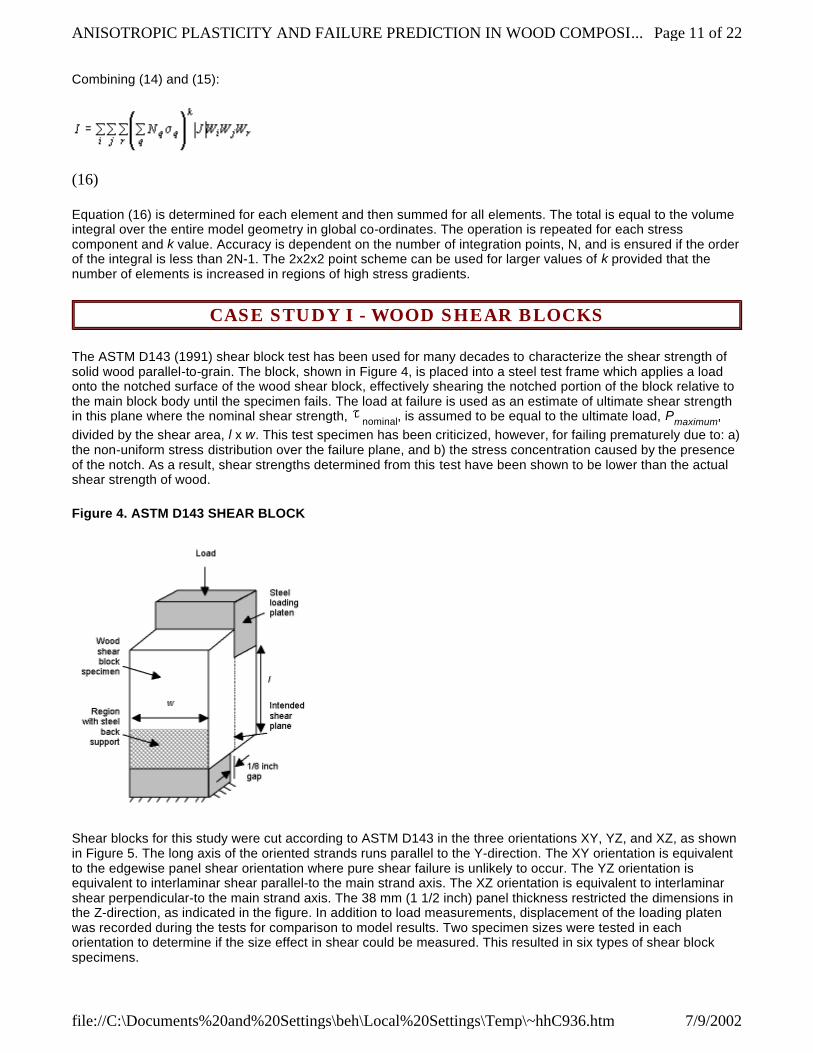
The ASTM D143 (1991) shear block test has been used for many decades to characterize the shear strength of solid wood parallel-to-grain. The block, shown in Figure 4, is placed into a steel test frame which applies a load onto the notched surface of the wood shear block, effectively shearing the notched portion of the block relative to the main block body until the specimen fails. The load at failure is used as an estimate of ultimate shear strength in this plane where the nominal shear strength, nominal, is assumed to be equal to the ultimate load, Pmaximum, divided by the shear area, l x w. This test specimen has been criticized, however, for failing prematurely due to: a) the non-uniform stress distribution over the failure plane, and b) the stress concentration caused by the presence of the notch. As a result, shear strengths determined from this test have been shown to be lower than the actual shear strength of wood.
Figure 4. ASTM D143 SHEAR BLOCK
Shear blocks for this study were cut according to ASTM D143 in the three orientations XY, YZ, and XZ, as shown in Figure 5. The long axis of the oriented strands runs parallel to the Y-direction. The XY orientation is equivalent to the edgewise panel shear orientation where pure shear failure is unlikely to occur. The YZ orientation is equivalent to interlaminar shear parallel-to the main strand axis. The XZ orientation is equivalent to interlaminar shear perpendicular-to the main strand axis. The 38 mm (1 1/2 inch) panel thickness restricted the dimensions in the Z-direction, as indicated in the figure. In addition to load measurements, displacement of the loading platen was recorded during the tests for comparison to model results. Two specimen sizes were tested in each orientation to determine if the size effect in shear could be measured. This resulted in six types of shear block specimens.
Page 11 of 22ANISOTROPIC PLASTICITY AND FAILURE PREDICTION IN WOOD COMPOSI...
7/9/2002file://C:\Documents%20and%20Settings\beh\Local%20Settings\Temp\~hhC936.htm
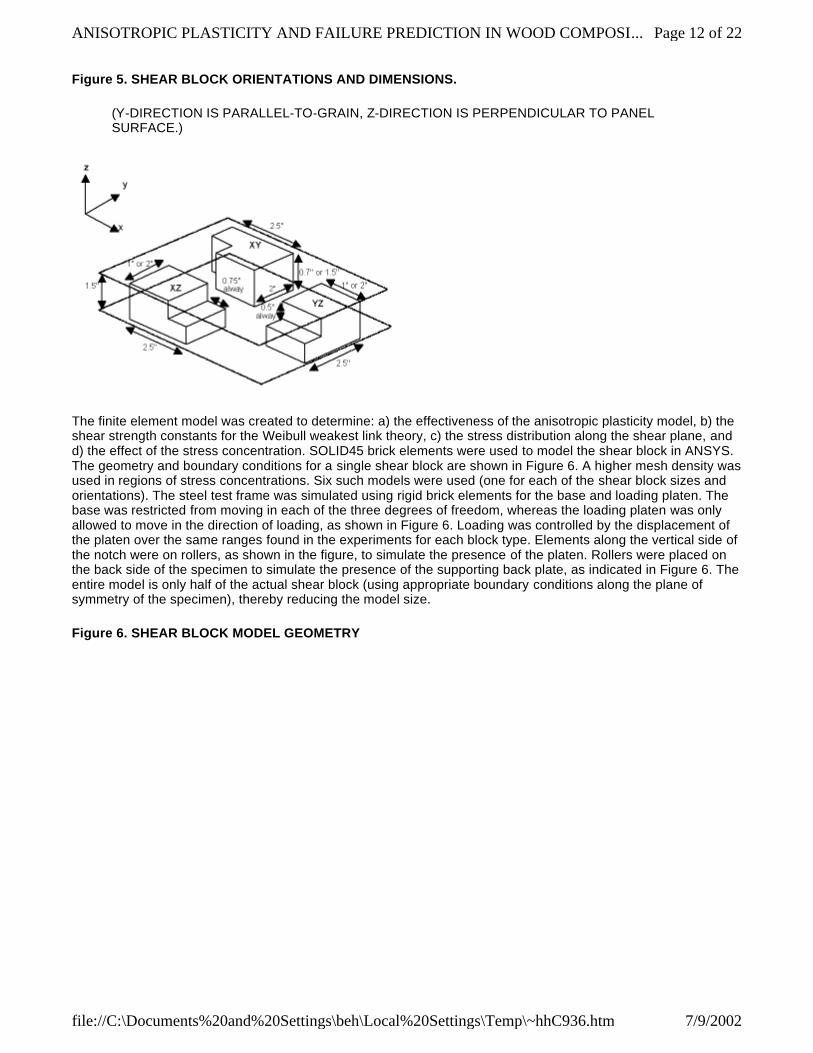
Figure 5. SHEAR BLOCK ORIENTATIONS AND DIMENSIONS.
(Y-DIRECTION IS PARALLEL-TO-GRAIN, Z-DIRECTION IS PERPENDICULAR TO PANEL SURFACE.)
The finite element model was created to determine: a) the effectiveness of the anisotropic plasticity model, b) the shear strength constants for the Weibull weakest link theory, c) the stress distribution along the shear plane, and d) the effect of the stress concentration. SOLID45 brick elements were used to model the shear block in ANSYS. The geometry and boundary conditions for a single shear block are shown in Figure 6. A higher mesh density was used in regions of stress concentrations. Six such models were used (one for each of the shear block sizes and orientations). The steel test frame was simulated using rigid brick elements for the base and loading platen. The base was restricted from moving in each of the three degrees of freedom, whereas the loading platen was only allowed to move in the direction of loading, as shown in Figure 6. Loading was controlled by the displacement of the platen over the same ranges found in the experiments for each block type. Elements along the vertical side of the notch were on rollers, as shown in the figure, to simulate the presence of the platen. Rollers were placed on the back side of the specimen to simulate the presence of the supporting back plate, as indicated in Figure 6. The entire model is only half of the actual shear block (using appropriate boundary conditions along the plane of symmetry of the specimen), thereby reducing the model size.
Figure 6. SHEAR BLOCK MODEL GEOMETRY
Page 12 of 22ANISOTROPIC PLASTICITY AND FAILURE PREDICTION IN WOOD COMPOSI...
7/9/2002file://C:\Documents%20and%20Settings\beh\Local%20Settings\Temp\~hhC936.htm
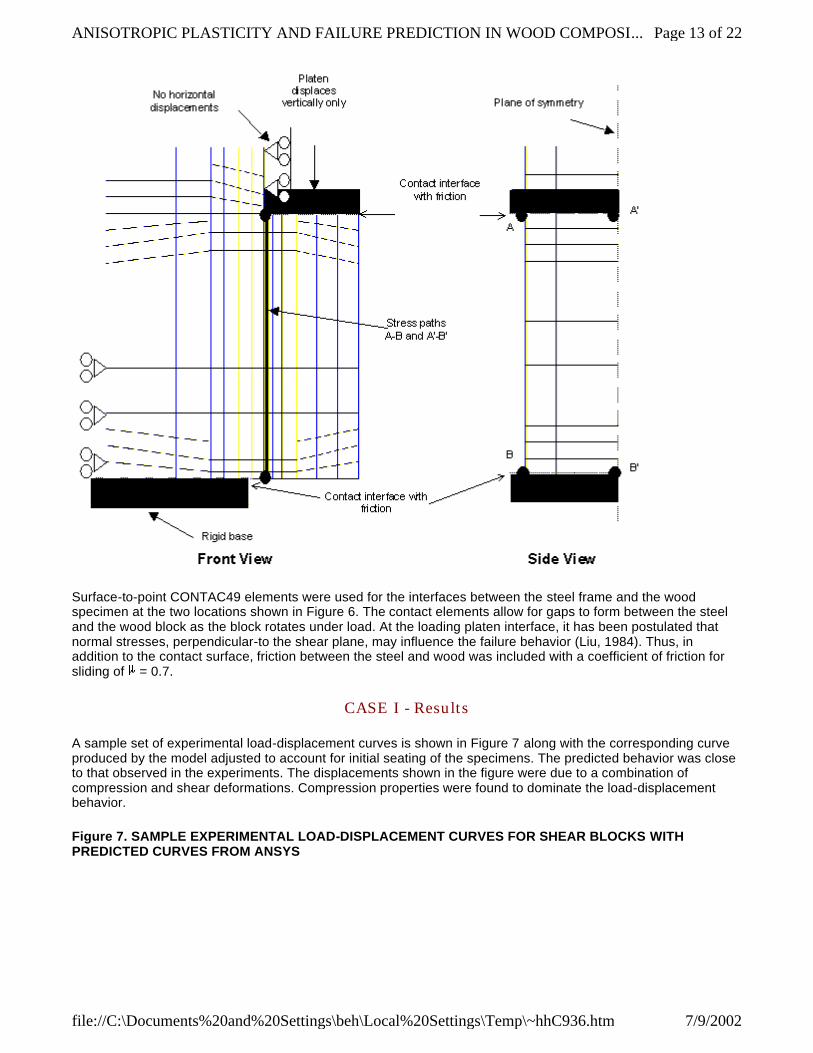
Surface-to-point CONTAC49 elements were used for the interfaces between the steel frame and the wood specimen at the two locations shown in Figure 6. The contact elements allow for gaps to form between the steel and the wood block as the block rotates under load. At the loading platen interface, it has been postulated that normal stresses, perpendicular-to the shear plane, may influence the failure behavior (Liu, 1984). Thus, in addition to the contact surface, friction between the steel and wood was included with a coefficient of friction for sliding of = 0.7.
CASE I - Results
A sample set of experimental load-displacement curves is shown in Figure 7 along with the corresponding curve produced by the model adjusted to account for initial seating of the specimens. The predicted behavior was close to that observed in the experiments. The displacements shown in the figure were due to a combination of compression and shear deformations. Compression properties were found to dominate the load-displacement behavior.
Figure 7. SAMPLE EXPERIMENTAL LOAD-DISPLACEMENT CURVES FOR SHEAR BLOCKS WITH PREDICTED CURVES FROM ANSYS
Page 13 of 22ANISOTROPIC PLASTICITY AND FAILURE PREDICTION IN WOOD COMPOSI...
7/9/2002file://C:\Documents%20and%20Settings\beh\Local%20Settings\Temp\~hhC936.htm
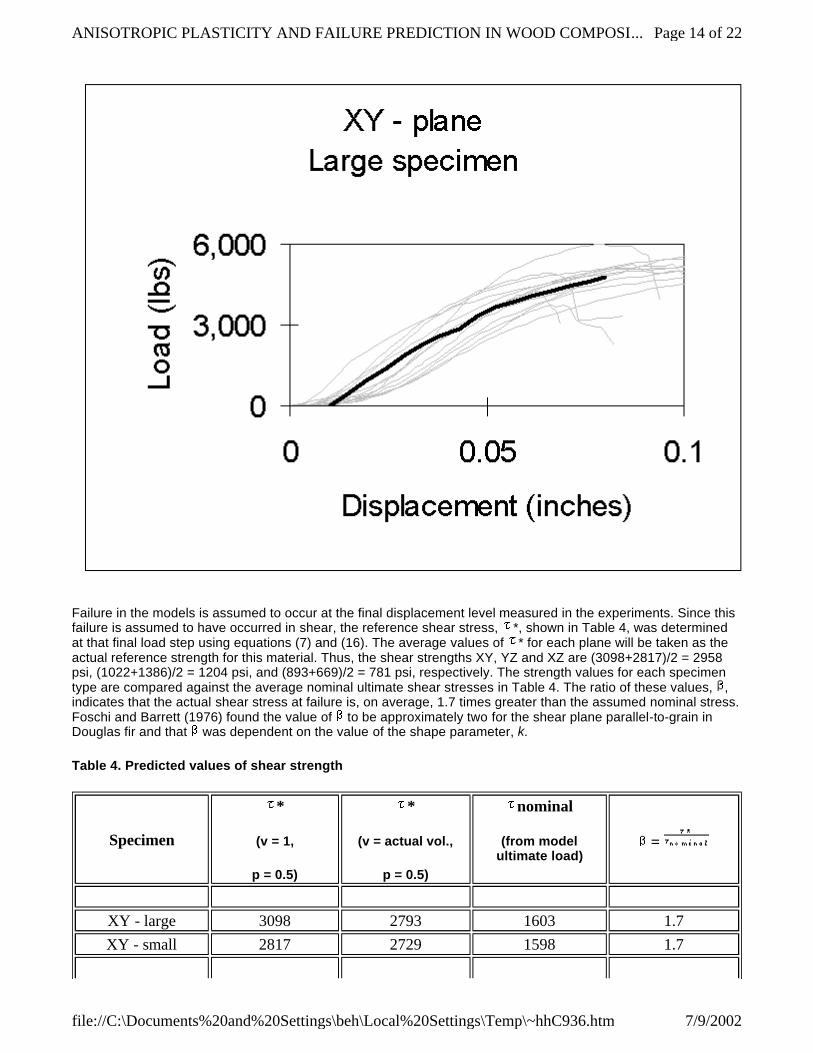
Failure in the models is assumed to occur at the final displacement level measured in the experiments. Since this failure is assumed to have occurred in shear, the reference shear stress, *, shown in Table 4, was determined at that final load step using equations (7) and (16). The average values of * for each plane will be taken as the actual reference strength for this material. Thus, the shear strengths XY, YZ and XZ are (3098+2817)/2 = 2958 psi, (1022+1386)/2 = 1204 psi, and (893+669)/2 = 781 psi, respectively. The strength values for each specimen type are compared against the average nominal ultimate shear stresses in Table 4. The ratio of these values, , indicates that the actual shear stress at failure is, on average, 1.7 times greater than the assumed nominal stress. Foschi and Barrett (1976) found the value of to be approximately two for the shear plane parallel-to-grain in Douglas fir and that was dependent on the value of the shape parameter, k.
Table 4. Predicted values of shear strength
Specimen
*
(v = 1,
p = 0.5)
*
(v = actual vol.,
p = 0.5)
nominal
(from model ultimate load)
=
XY - large 3098 2793 1603 1.7XY - small 2817 2729 1598 1.7
Page 14 of 22ANISOTROPIC PLASTICITY AND FAILURE PREDICTION IN WOOD COMPOSI...
7/9/2002file://C:\Documents%20and%20Settings\beh\Local%20Settings\Temp\~hhC936.htm
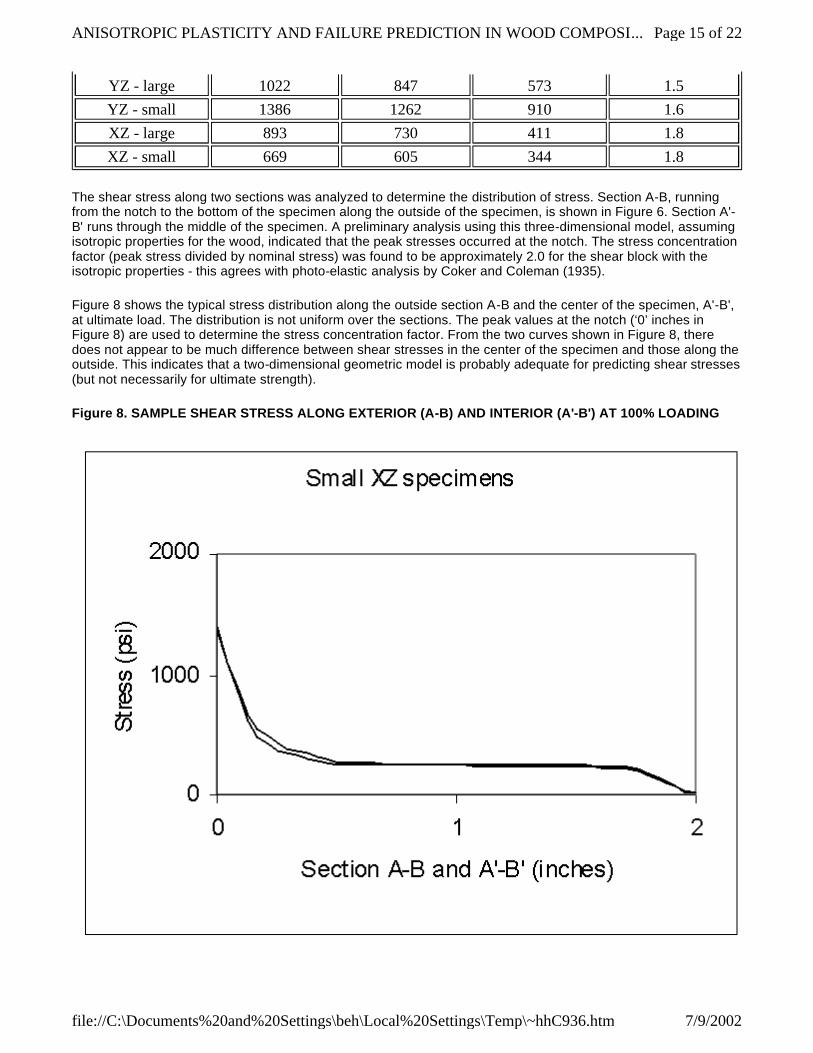
The shear stress along two sections was analyzed to determine the distribution of stress. Section A-B, running from the notch to the bottom of the specimen along the outside of the specimen, is shown in Figure 6. Section A'-B' runs through the middle of the specimen. A preliminary analysis using this three-dimensional model, assuming isotropic properties for the wood, indicated that the peak stresses occurred at the notch. The stress concentration factor (peak stress divided by nominal stress) was found to be approximately 2.0 for the shear block with the isotropic properties - this agrees with photo-elastic analysis by Coker and Coleman (1935).
Figure 8 shows the typical stress distribution along the outside section A-B and the center of the specimen, A'-B', at ultimate load. The distribution is not uniform over the sections. The peak values at the notch (‘0’ inches in Figure 8) are used to determine the stress concentration factor. From the two curves shown in Figure 8, there does not appear to be much difference between shear stresses in the center of the specimen and those along the outside. This indicates that a two-dimensional geometric model is probably adequate for predicting shear stresses (but not necessarily for ultimate strength).
Figure 8. SAMPLE SHEAR STRESS ALONG EXTERIOR (A-B) AND INTERIOR (A'-B') AT 100% LOADING
YZ - large 1022 847 573 1.5YZ - small 1386 1262 910 1.6XZ - large 893 730 411 1.8XZ - small 669 605 344 1.8
Page 15 of 22ANISOTROPIC PLASTICITY AND FAILURE PREDICTION IN WOOD COMPOSI...
7/9/2002file://C:\Documents%20and%20Settings\beh\Local%20Settings\Temp\~hhC936.htm
Using the anisotropic plasticity material model, the stress concentration factor was at least 2.0 (roughly) as indicated in Table 5. The difference in values between the three planes may, in part, be attributed to assumed values of the shear moduli, given in Table 2. Cramer et al. (1984) indicated that including the effects of crushing through a non-linear compression stress model would result in stress concentration factors lower than their calculated value of 2.36 due to the release of strain energy through ductile behavior. This is not always the case as shown in Table 5.
Table 5. Stress concentration factors for shear blocks at ultimate load
Note: values are average peaks between sections A-B and A'-B'.
It was previously mentioned that a two-dimensional model would be sufficient to determine the stress distribution. The current three-dimensional model can be used, however, to determine if brittle failure occurred in tension in the X, Y or Z directions. Using the reference stress values determined from the tension tests (shown in Table 1) at p = 0.5, it was found that delamination failure (tension in the Z-direction) occurred at roughly 40% of the ultimate displacement as shown in Table 6. The specimen could still carry load, as was observed in experiments, but the analysis indicated that the tensile stress concentration in the region of the notch would produce delamination.
Table 6. Predicted ultimate load due to shear or tension failure
Tension failure due to delamination in Z-direction indicated by (Z) and tension failure perpendicular-to-grain indicated by (X)
CASE STUDY II - SINGLE-BOLT CONNECTION
The performance of connections in timber is dependent on many factors including: bolt size, end distance, edge distance, member thickness, species, hole diameter, direction of loading, and bolt yield stress. Only some of these parameters have been included in early models of connections in wood. A one-dimensional finite element model of nails and/or rivets in timber was developed using cubic polynomial displacement functions and beam
Specimen Peak stress (see Figure 8) Stress concentration factor
XY - large 3531 2.2XY - small 2867 1.8YZ - large 1884 3.3YZ - small 2446 2.7XZ - large 1297 3.2XZ - small 1392 4.0
Specimen Max. Load (lbs.) Max. load due to tension failure in X
or Z (lbs.)
Tension load/shear load
XY - large 4808 1850 (Z) 0.38XY - small 2237 1200 (Z) 0.54YZ - large 2292 830 (Z) 0.36YZ - small 1820 830 (Z) 0.46XZ - large 1642 460 (X & Z) 0.28XZ - small 688 260 (X & Z) 0.38
Page 16 of 22ANISOTROPIC PLASTICITY AND FAILURE PREDICTION IN WOOD COMPOSI...
7/9/2002file://C:\Documents%20and%20Settings\beh\Local%20Settings\Temp\~hhC936.htm
elements (Foschi, 1974, Foschi and Longworth, 1975). Wood behavior in compression was included in this model through a non-linear elastic foundation with the beam elements, resulting in non-linear load-displacement response curves for the head of the nail. Ultimate strength was predicted using the Weibull weakest link theory. Results from Foschi and Longworth (1975) currently form the basis of the timber rivet design formulae in the Canadian standard for Engineering Design in Wood (O86.1, 1995).
The two-dimensional studies discussed in section 2.1 showed that a non-linear model for compression parallel-to-grain improved stress predictions. The two-dimensional model is, however, limited to the study of relatively thin members. This restricts the analysis to only simple cases. Since the prediction of failure is dependent on accurate predictions of stress throughout the entire wood member, particularly in locations where stress concentrations exist, and in instances where member aspect ratio cause deformations to vary throughout the member thickness, the two-dimensional model will not suffice (Patton-Mallory et al., 1997).
Patton-Mallory et al. (1997) developed a three-dimensional finite element model of a single-bolt connection, in solid sawn Douglas fir, similar to the one shown in Figure 9. Solid brick elements were used for the steel bolt and the wood. A contact interface was placed between the bolt and wood and assumed to be frictionless. One-quarter of the geometry was modeled due to symmetry. The geometry of the model could be modified for changes in end distance, edge distance, member thickness, bolt diameter, hole clearance, and support location. No side members were included in the model to isolate the behavior of the connector. Tri-linear elastic stress-strain behavior was assumed for the wood in compression parallel-to-grain and in shear, with an elastic-perfectly plastic steel pin. Linear elastic properties were assumed for all other stresses, including all tensile normal stresses. As mentioned in section 2.1, a number of drawbacks exist with this model. However, this was the first numerical model to indicate likely failure modes in three-dimensions for wood. Patton-Mallory et al. (1997) recommended that improvements to the material model (non-linear constitutive behavior and failure prediction) will result in improved stress calculations leading to better calculations of ultimate connection load.
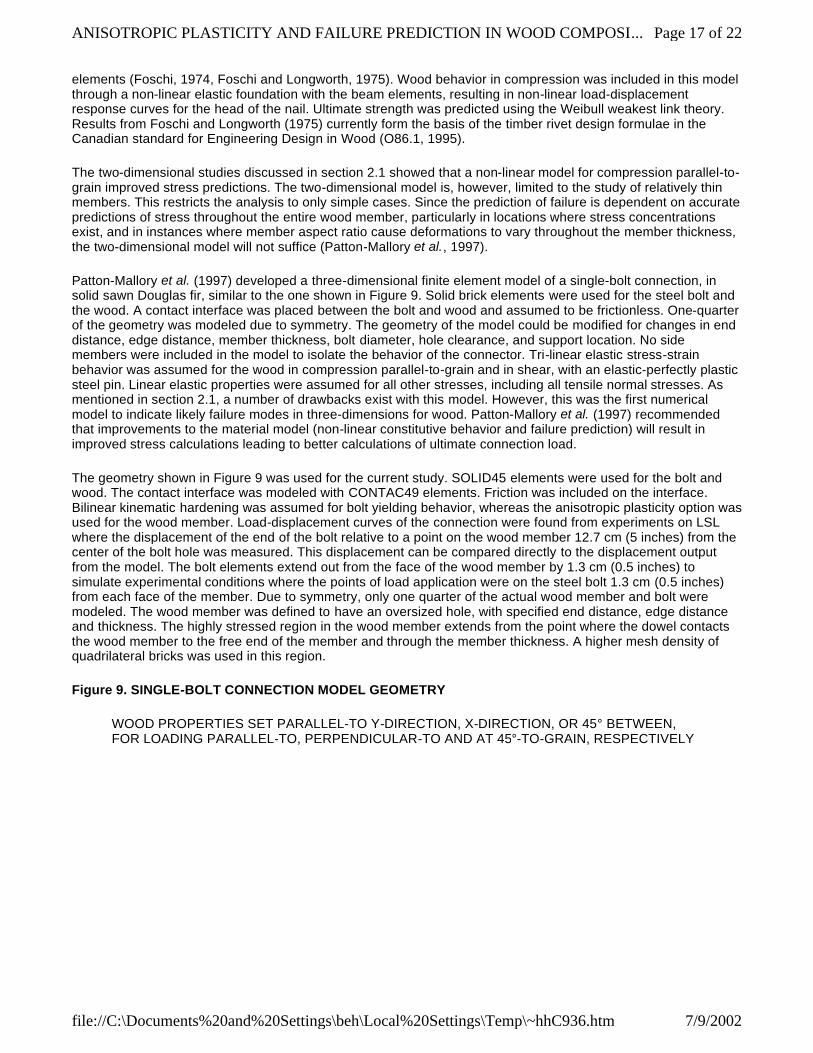
The geometry shown in Figure 9 was used for the current study. SOLID45 elements were used for the bolt and wood. The contact interface was modeled with CONTAC49 elements. Friction was included on the interface. Bilinear kinematic hardening was assumed for bolt yielding behavior, whereas the anisotropic plasticity option was used for the wood member. Load-displacement curves of the connection were found from experiments on LSL where the displacement of the end of the bolt relative to a point on the wood member 12.7 cm (5 inches) from the center of the bolt hole was measured. This displacement can be compared directly to the displacement output from the model. The bolt elements extend out from the face of the wood member by 1.3 cm (0.5 inches) to simulate experimental conditions where the points of load application were on the steel bolt 1.3 cm (0.5 inches) from each face of the member. Due to symmetry, only one quarter of the actual wood member and bolt were modeled. The wood member was defined to have an oversized hole, with specified end distance, edge distance and thickness. The highly stressed region in the wood member extends from the point where the dowel contacts the wood member to the free end of the member and through the member thickness. A higher mesh density of quadrilateral bricks was used in this region.
Figure 9. SINGLE-BOLT CONNECTION MODEL GEOMETRY
WOOD PROPERTIES SET PARALLEL-TO Y-DIRECTION, X-DIRECTION, OR 45° BETWEEN, FOR LOADING PARALLEL-TO, PERPENDICULAR-TO AND AT 45°-TO-GRAIN, RESPECTIVELY
Page 17 of 22ANISOTROPIC PLASTICITY AND FAILURE PREDICTION IN WOOD COMPOSI...
7/9/2002file://C:\Documents%20and%20Settings\beh\Local%20Settings\Temp\~hhC936.htm
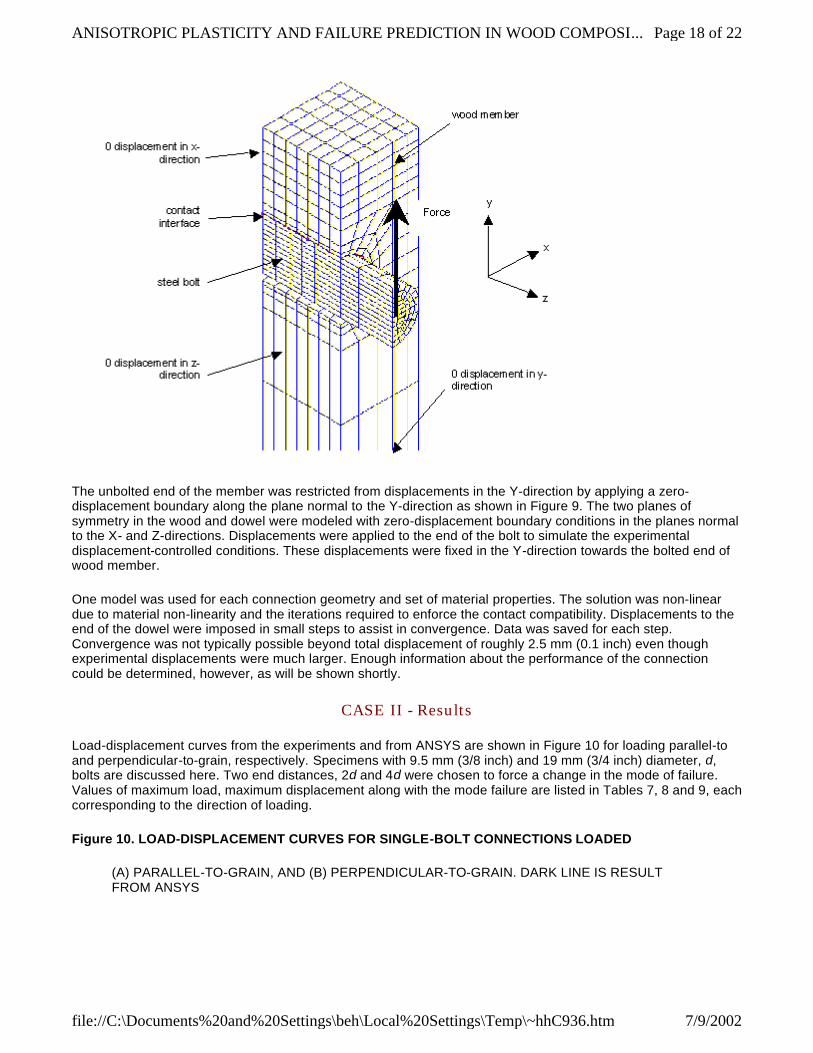
The unbolted end of the member was restricted from displacements in the Y-direction by applying a zero-displacement boundary along the plane normal to the Y-direction as shown in Figure 9. The two planes of symmetry in the wood and dowel were modeled with zero-displacement boundary conditions in the planes normal to the X- and Z-directions. Displacements were applied to the end of the bolt to simulate the experimental displacement-controlled conditions. These displacements were fixed in the Y-direction towards the bolted end of wood member.
One model was used for each connection geometry and set of material properties. The solution was non-linear due to material non-linearity and the iterations required to enforce the contact compatibility. Displacements to the end of the dowel were imposed in small steps to assist in convergence. Data was saved for each step. Convergence was not typically possible beyond total displacement of roughly 2.5 mm (0.1 inch) even though experimental displacements were much larger. Enough information about the performance of the connection could be determined, however, as will be shown shortly.
CASE II - Results
Load-displacement curves from the experiments and from ANSYS are shown in Figure 10 for loading parallel-to and perpendicular-to-grain, respectively. Specimens with 9.5 mm (3/8 inch) and 19 mm (3/4 inch) diameter, d, bolts are discussed here. Two end distances, 2d and 4d were chosen to force a change in the mode of failure. Values of maximum load, maximum displacement along with the mode failure are listed in Tables 7, 8 and 9, each corresponding to the direction of loading.
Figure 10. LOAD-DISPLACEMENT CURVES FOR SINGLE-BOLT CONNECTIONS LOADED
(A) PARALLEL-TO-GRAIN, AND (B) PERPENDICULAR-TO-GRAIN. DARK LINE IS RESULT FROM ANSYS
Page 18 of 22ANISOTROPIC PLASTICITY AND FAILURE PREDICTION IN WOOD COMPOSI...
7/9/2002file://C:\Documents%20and%20Settings\beh\Local%20Settings\Temp\~hhC936.htm
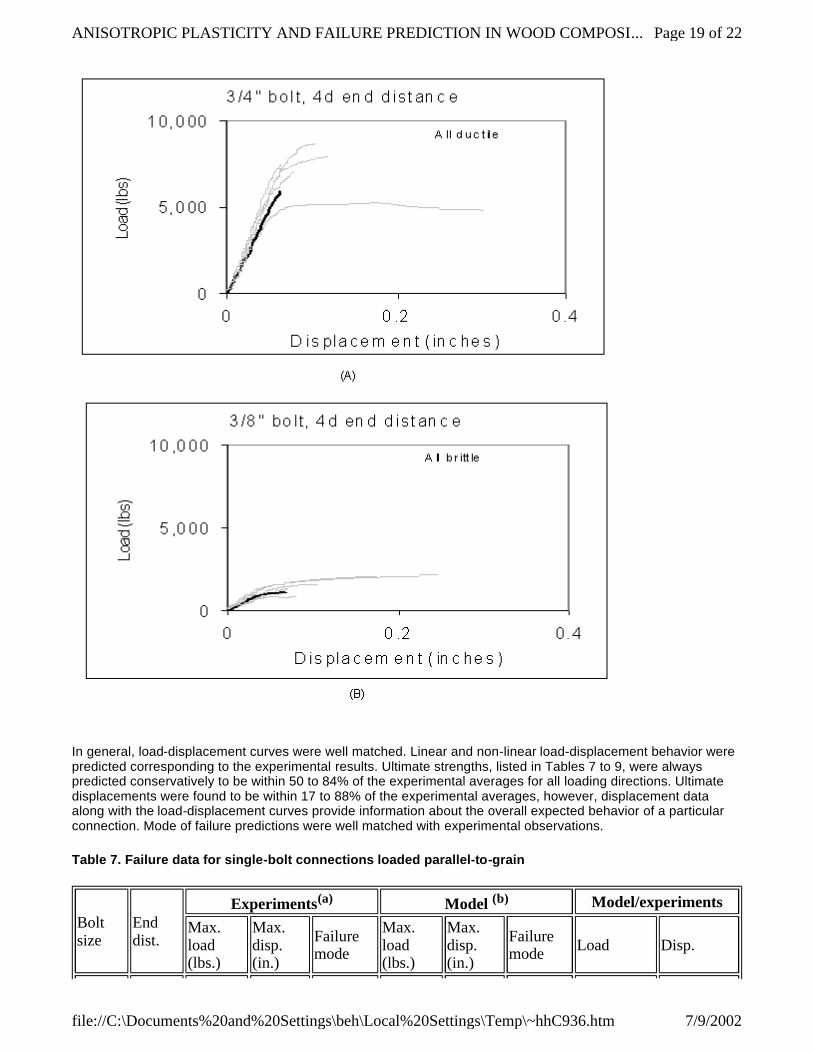
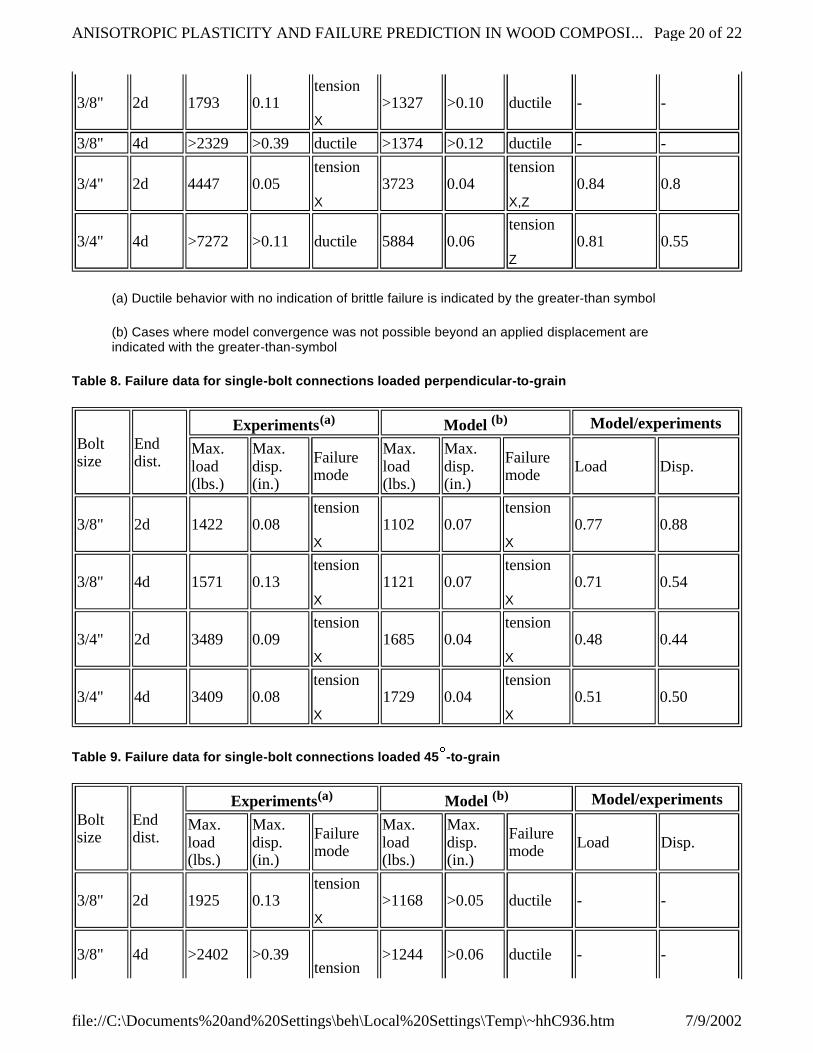
In general, load-displacement curves were well matched. Linear and non-linear load-displacement behavior were predicted corresponding to the experimental results. Ultimate strengths, listed in Tables 7 to 9, were always predicted conservatively to be within 50 to 84% of the experimental averages for all loading directions. Ultimate displacements were found to be within 17 to 88% of the experimental averages, however, displacement data along with the load-displacement curves provide information about the overall expected behavior of a particular connection. Mode of failure predictions were well matched with experimental observations.
Table 7. Failure data for single-bolt connections loaded parallel-to-grain
Bolt size
End dist.
Experiments(a) Model (b) Model/experiments
Max. load (lbs.)
Max. disp. (in.)
Failure mode
Max. load (lbs.)
Max. disp. (in.)
Failure mode Load Disp.
Page 19 of 22ANISOTROPIC PLASTICITY AND FAILURE PREDICTION IN WOOD COMPOSI...
7/9/2002file://C:\Documents%20and%20Settings\beh\Local%20Settings\Temp\~hhC936.htm
(a) Ductile behavior with no indication of brittle failure is indicated by the greater-than symbol
(b) Cases where model convergence was not possible beyond an applied displacement are indicated with the greater-than-symbol
Table 8. Failure data for single-bolt connections loaded perpendicular-to-grain
Table 9. Failure data for single-bolt connections loaded 45 -to-grain
3/8" 2d 1793 0.11tension
X >1327 >0.10 ductile - -
3/8" 4d >2329 >0.39 ductile >1374 >0.12 ductile - -
3/4" 2d 4447 0.05tension
X 3723 0.04
tension
X,Z 0.84 0.8
3/4" 4d >7272 >0.11 ductile 5884 0.06tension
Z 0.81 0.55
Bolt size
End dist.
Experiments(a) Model (b) Model/experiments
Max. load (lbs.)
Max. disp. (in.)
Failure mode
Max. load (lbs.)
Max. disp. (in.)
Failure mode Load Disp.
3/8" 2d 1422 0.08tension
X 1102 0.07
tension
X 0.77 0.88
3/8" 4d 1571 0.13tension
X 1121 0.07
tension
X 0.71 0.54
3/4" 2d 3489 0.09tension
X 1685 0.04
tension
X 0.48 0.44
3/4" 4d 3409 0.08tension
X 1729 0.04
tension
X 0.51 0.50
Bolt size
End dist.
Experiments(a) Model (b) Model/experiments
Max. load (lbs.)
Max. disp. (in.)
Failure mode
Max. load (lbs.)
Max. disp. (in.)
Failure mode Load Disp.
3/8" 2d 1925 0.13tension
X >1168 >0.05 ductile - -
3/8" 4d >2402 >0.39tension
>1244 >0.06 ductile - -
Page 20 of 22ANISOTROPIC PLASTICITY AND FAILURE PREDICTION IN WOOD COMPOSI...
7/9/2002file://C:\Documents%20and%20Settings\beh\Local%20Settings\Temp\~hhC936.htm
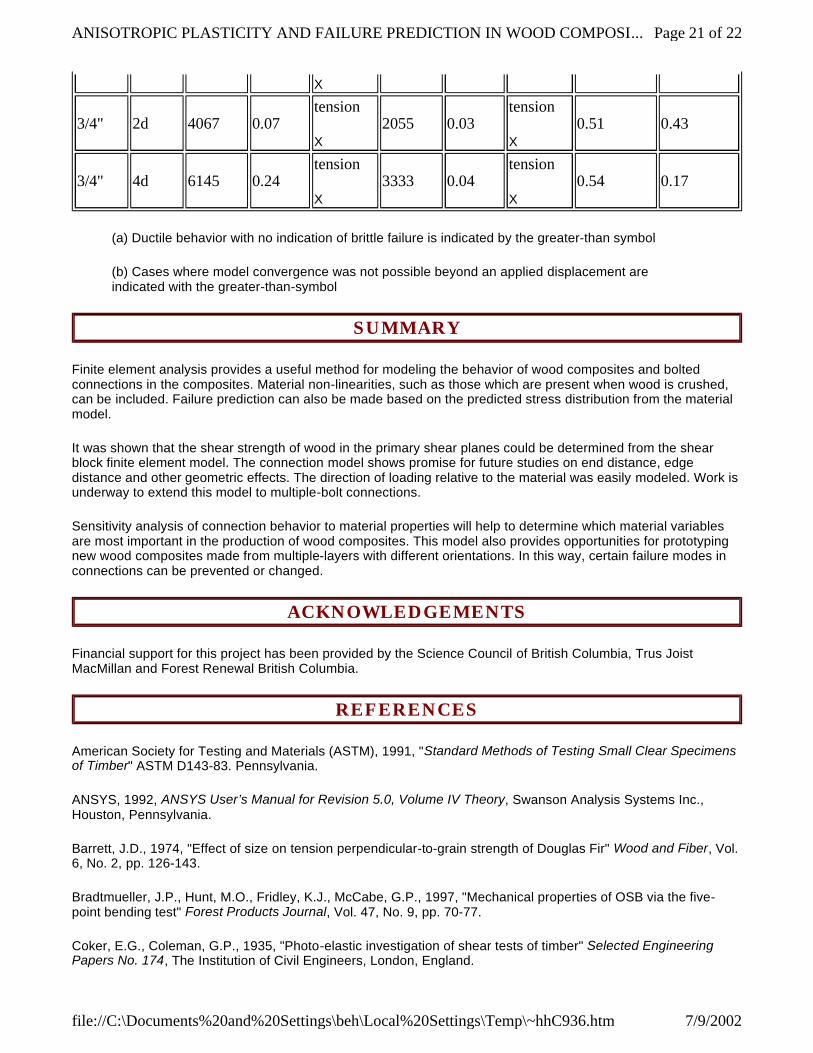
(a) Ductile behavior with no indication of brittle failure is indicated by the greater-than symbol
(b) Cases where model convergence was not possible beyond an applied displacement are indicated with the greater-than-symbol
SUMMARY
Finite element analysis provides a useful method for modeling the behavior of wood composites and bolted connections in the composites. Material non-linearities, such as those which are present when wood is crushed, can be included. Failure prediction can also be made based on the predicted stress distribution from the material model.
It was shown that the shear strength of wood in the primary shear planes could be determined from the shear block finite element model. The connection model shows promise for future studies on end distance, edge distance and other geometric effects. The direction of loading relative to the material was easily modeled. Work is underway to extend this model to multiple-bolt connections.
Sensitivity analysis of connection behavior to material properties will help to determine which material variables are most important in the production of wood composites. This model also provides opportunities for prototyping new wood composites made from multiple-layers with different orientations. In this way, certain failure modes in connections can be prevented or changed.
ACKNOWLEDGEMENTS
Financial support for this project has been provided by the Science Council of British Columbia, Trus Joist MacMillan and Forest Renewal British Columbia.
REFERENCES
American Society for Testing and Materials (ASTM), 1991, "Standard Methods of Testing Small Clear Specimens of Timber" ASTM D143-83. Pennsylvania.
ANSYS, 1992, ANSYS User’s Manual for Revision 5.0, Volume IV Theory, Swanson Analysis Systems Inc., Houston, Pennsylvania.
Barrett, J.D., 1974, "Effect of size on tension perpendicular-to-grain strength of Douglas Fir" Wood and Fiber, Vol. 6, No. 2, pp. 126-143.
Bradtmueller, J.P., Hunt, M.O., Fridley, K.J., McCabe, G.P., 1997, "Mechanical properties of OSB via the five-point bending test" Forest Products Journal, Vol. 47, No. 9, pp. 70-77.
Coker, E.G., Coleman, G.P., 1935, "Photo-elastic investigation of shear tests of timber" Selected Engineering Papers No. 174, The Institution of Civil Engineers, London, England.
X
3/4" 2d 4067 0.07tension
X 2055 0.03
tension
X 0.51 0.43
3/4" 4d 6145 0.24tension
X 3333 0.04
tension
X 0.54 0.17
Page 21 of 22ANISOTROPIC PLASTICITY AND FAILURE PREDICTION IN WOOD COMPOSI...
7/9/2002file://C:\Documents%20and%20Settings\beh\Local%20Settings\Temp\~hhC936.htm
Cramer, S.M., Goodman, J.R., Bodig, J., Smith, F.W., 1984, "Failure modeling of wood structural members" Structural Res. No. 51, Civil Engineering Department, Colorado State University, Fort Collins, Colorado.
Fonselius, M., Riipola, K., 1992, "Determination of fracture toughness for wood" Journal of Structural Engineering, ASCE, Vol. 118, No. 7, pp. 1727-1740.
Foschi, R.O., 1974 "Load-Slip Characteristics of Nails" Wood Science, Vol. 7, No. 1, pp. 69-76.
1976, "Longitudinal shear strength of Douglas-fir" Canadian Journal of Civil Engineering, Vol. 3, No. 2, pp. 198-208.
Foschi, R.O., Longworth, J., 1975, "Analysis and design of griplam nailed connections" Journal of the Structural Division, ASCE, Vol. 101, ST12, December, pp. 2537-2555.
Hill, R., 1947, "A theory of the yielding and plastic flow of anisotropic metals" Proceedings of the Royal Society Series A, Vol. 193, pp. 281-297.
Hoover, W.L., Hunt, M.O., Lattanzi, R.C., Bateman, J.H., Youngquist, J.A., 1992, "Modelling mechanical properties of single-layer, aligned, mixed-hardwood strand panels" Forest Products Journal, Vol. 42, No. 5, pp. 12-18.
Hunt, M.O., Hoover, W.L., Fergus, D.A., 1985, "Thick aspen structural flakeboard" Forest Products Journal, Vol. 35, No. 4, pp. 33-39.
Hyer, M.W., Klang, E.C., Cooper, D.E., 1987, "The effects of pin elasticity, clearance and friction on the stresses in a pin-loaded orthotropic plate" Journal of Composite Materials, Vol. 21, pp. 190-206.
Liu, J.Y., 1984, "Evaluation of the tensor polynomial strength theory for wood" Journal of Composite Materials, Vol. 18, pp. 216-226.
Moses, D.M., Prion, H.G.L., 1999, "Bolted connections in structural composite lumber: anisotropic plasticity model" Proceedings of the Pacific Timber Engineering Conference, Rotorua, New Zealand, Vol. 2, pp. 92-99.
O86.1, 1995, Engineering Design in Wood (Limit States Design), Canadian Standards Association, Rexdale, Ontario, pp. 191.
Patton-Mallory, M., Cramer, S.M., Smith, F.W., Pellicane, P.J., 1997, "Nonlinear material models for analysis of bolted wood connections" Journal of Structural Engineering, Vol. 123, No. 8, pp. 1063-1070.
Rahman, M.U., Chiang, Y.J., Rowlands, R.E., 1991, "Stress and failure analysis of double-bolted joints in Douglas Fir and Sitka Spruce" Wood and Fiber Science, Vol. 23, No. 4, pp. 567-589.
Shih, C.F., Lee, D., 1978, "Further developments in anisotropic plasticity" Transactions of the ASME, Journal of Engineering Materials and Technology, July 1978, Vol. 100, pp. 294-302.
Tsai, S.W., Wu, E.M., 1971, "A general theory of strength for anisotropic materials" Journal of Composite Materials, Vol. 5, pp. 58-80.
Valliappan, S., Boonlaulohr, P., Lee, I.K., 1976, "Non-linear analysis for anisotropic materials" International Journal for Numerical Methods in Engineering, Vol. 10, pp. 597-606.
Vaziri, R., Olson, M.D., Anderson, D.L., 1991, "A plasticity-based constitutive model for fibre-reinforced composite laminates" Journal of Composite Materials, Vol. 25, May, pp. 512-535.
Wilkinson, T.L., Rowlands, R.E., Cook, R.D., 1981, "An incremental finite-element determination of stresses around loaded holes in wood plates" Computers & Structures, Vol. 14, No. 1, pp. 123-128.
Page 22 of 22ANISOTROPIC PLASTICITY AND FAILURE PREDICTION IN WOOD COMPOSI...
7/9/2002file://C:\Documents%20and%20Settings\beh\Local%20Settings\Temp\~hhC936.htm