Anirvan Banerji and Lakshman Achuthan Yo... · Banerji and Achuthan 44...
20
Challenge/September–October 2012 39 Challenge, vol. 55, no. 5, September/October 2012, pp. 39–58. © 2012 M.E. Sharpe, Inc. All rights reserved. Permissions: www.copyright.com ISSN 0577-5132 (print)/ISSN 1558-1489 (online) DOI: 10.2753/0577-5132550502 The Yo-Yo Years More Recessions in the West and Volatility for the Rest Anirvan Banerji and Lakshman Achuthan Is the current recession disguising a longer-term trend toward slower yet more volatile economic growth? The authors believe that it is, with profound implications for government policies. B Y THE LATE 1990S, with the United States experiencing an unusu- ally long economic expansion, there was a growing sense that there had been a permanent change in business cycle dynam- ics. This line of thinking became popular enough that, during the latter part of the expansion, an article titled “The End of the Business Cycle?” was published in Foreign Affairs (Weber 1997). The premise of the paper was that “in advanced industrial economies the waves of the business cycle may be becoming more like ripples.” A couple of years later, in seeming confirmation of this thesis, the expansion matched in duration the longest in U.S. history. Some economists wanted to understand whether there had been a fundamental change in the cycle and, if so, why. Among the first to formally investigate this question were Kim and Nelson (1999) and McConnell and Perez-Quiros (2000), whose work led to a widespread recognition of the “Great Moderation” that chairman of the Federal Re- serve Ben Bernanke hailed in a subsequent speech (Bernanke 2004). ANIRVAN BANERJI is chief research officer at the Economic Cycle Research Institute (ECRI). LAKSHMAN ACHUTHAN is chief operations officer at ECRI.
Transcript of Anirvan Banerji and Lakshman Achuthan Yo... · Banerji and Achuthan 44...

The Yo-Yo Years
Challenge/September–October 2012 39
Challenge, vol. 55, no. 5, September/October 2012, pp. 39–58.© 2012 M.E. Sharpe, Inc. All rights reserved. Permissions: www.copyright.comISSN 0577-5132 (print)/ISSN 1558-1489 (online)DOI: 10.2753/0577-5132550502
The Yo-Yo YearsMore Recessions in the West and Volatility for the Rest
Anirvan Banerji and Lakshman Achuthan
Is the current recession disguising a longer-term trend toward slower yet more volatile economic growth? The authors believe that it is, with profound implications for government policies.
By the late 1990s, with the United States experiencing an unusu-ally long economic expansion, there was a growing sense that there had been a permanent change in business cycle dynam-
ics. This line of thinking became popular enough that, during the latter part of the expansion, an article titled “The End of the Business Cycle?” was published in Foreign Affairs (Weber 1997). The premise of the paper was that “in advanced industrial economies the waves of the business cycle may be becoming more like ripples.” A couple of years later, in seeming confirmation of this thesis, the expansion matched in duration the longest in U.S. history.
Some economists wanted to understand whether there had been a fundamental change in the cycle and, if so, why. Among the first to formally investigate this question were Kim and Nelson (1999) and McConnell and Perez-Quiros (2000), whose work led to a widespread recognition of the “Great Moderation” that chairman of the Federal Re-serve Ben Bernanke hailed in a subsequent speech (Bernanke 2004).
AnirvAn BAnerji is chief research officer at the Economic Cycle Research Institute (ECRI). LAkshmAn AchuthAn is chief operations officer at ECRI.

Banerji and Achuthan
40 Challenge/September–October 2012
Four years later, however, the economy had entered what would come to be known as the “Great Recession.” Although a few suspected that the economy was already in trouble, many more were sanguine. In June 2008, six months into the recession, Bernanke presented a relatively upbeat assessment of the state of the economy. In his words, “although activity during the current quarter is likely to be weak, the risk that the economy has entered a substantial downturn appears to have diminished over the past month or so” (Bernanke 2008). Accord-ingly, his speech focused on the risk of inflation, not recession.
Indeed, a couple of months later, and two weeks before the Leh-man Brothers debacle on August 28, 2008, the latest reports not only showed that growth in the gross domestic product (GDP) had been positive in the first quarter but also revised the second quarter up from 1.9 percent to 3.3 percent. On the surface it seemed that, if any-thing, Bernanke had been conservative in his “nowcasting,” and the Dow Jones Industrial Average rose 212 points that day. Apparently, the Great Moderation was protecting the U.S. economy from economic contraction.
But that same month at the Economic Cycle Research Institute (ECRI), we were homing in on an ominous pattern in U.S. economic growth (ECRI 2008), which the New York Times highlighted (Norris 2008) at the time. Our work had uncovered a long-term pattern of falling growth in GDP and jobs during successive expansions, which then led us to the conclusion that we were entering an era of more frequent recessions than anyone was used to. Further research shows that these cyclical patterns also hold for much of Europe—a finding that has deeply troubling implications for years to come.
A Stylized View
To start with, we consider the business cycle in the abstract, as shown in Figure 1. The gray wavy line shows economic growth cycling up and down like a sine curve. Every time it dips below zero, the economy experiences negative growth, marked by the dark-shaded areas, which are recessions. The dotted lines in Figures 1, 2, and 3 represent the

The Yo-Yo Years
Challenge/September–October 2012 41
long-term trend growth rate, with economic growth cycling above and below. The long-term trend growth rate, hereafter called “trend growth,” is the average rate of growth of the economy over a long period.
Let us suppose that all these conditions remain the same except that trend growth is shifted upward. Now economic growth (gray wavy line, Figure 2) dips below zero less often, resulting in less frequent and milder recessions. This is evident today in some of the emerging markets that have strong trend growth.
Now, suppose that, with Figure 1 as the starting point, this time trend growth is kept unchanged, but instead the cycle volatility is tamped down, resulting in smoother, tamer business cycles. Again, economic growth (gray wavy line, Figure 3) dips below zero less often, resulting in less frequent and milder recessions.
Thus, there are two fundamental paths toward less frequent reces-sions: raise long-term trend growth or dampen cycle volatility. The
Figure 1. A Stylized View of Recession
Figure 2. A Stylized View of Recession: Higher Trend Growth
Banerji and Achuthan
42 Challenge/September–October 2012
latter is what happened in the United States from the mid-1980s through 2007—the so-called Great Moderation of the business cycle, during which the U.S. economy enjoyed long expansions. Now we turn from stylized concepts to the real world.
The U.S. Experience
In the summer of 2008, in the run-up to the collapse of Lehman Brothers, ECRI’s research showed that U.S. GDP and jobs during each business cycle expansion in the past half-century exhibited a com-pelling pattern of growth stair-stepping down, in which both GDP and job growth were weaker and weaker in successive expansions starting in the 1970s (Figure 4). Absent any compelling rationale for that long-standing pattern to reverse itself, we concluded that a weak expansion would follow the ongoing recession (ECRI 2008). Of course, a couple of weeks later Lehman Brothers collapsed, precipitating a financial crisis.
It is now common knowledge that, after financial crises, econo-mies generally experience many years of weak growth because of the extended period of deleveraging that follows (Reinhardt and Rogoff 2009). However, such a perspective, while no doubt relevant, is likely to camouflage the well-established pattern of weakening economic growth that practically guaranteed a weak recovery in any event. As it happens, we now have that pattern of weakening economic growth reinforced by deleveraging.
But the economy must contend with much more than weak growth.
Figure 3. A Stylized View of Recession: Lower Cyclical Volatility

The Yo-Yo Years
Challenge/September–October 2012 43
As Figure 5 illustrates, volatility in economic cycles has now increased sharply to multidecade highs after staying muted from the mid-1980s through 2007, based on the three-year standard deviation of ECRI’s U.S. Coincident Index, a comprehensive indicator of economic activ-ity that includes the broad measures of output, employment, income, and sales.
As seen in Figures 1 to 3, the combination of these two patterns—weaker growth during successive expansions and higher cyclical volatility—virtually dictate more frequent recessions. Rather than the higher trend growth that tends to reduce the incidence of recessions, we have the reverse—a pattern of lower and lower trend growth during expansions that has now persisted for decades. And instead of lower cyclical volatility, we have a recent upturn to multidecade highs.
Starting in the early 1980s, the U.S. economy experienced three relatively long back-to-back economic expansions—lasting more than eight years, exactly ten years, and more than six years, respectively—that have resulted in a popular presumption that long expansions are normal. But, as discussed, we now have extraordinarily low trend growth, while the Great Moderation of business cycle volatility is history.
If so, more frequent recessions should not come as a surprise nor
Figure 4. Trend Growth (%) in Output and Employment During U.S. Expansions
Sources: U.S. Bureau of Economic Analysis, U.S. Bureau of Labor Statistics, and ECRI.
Employment
GDP
-1
0
1
2
3
4
5
6
7
61-69 70-73 75-80 80-81 82-90 91-01 01-0709-11
Employment GDP

Banerji and Achuthan
44 Challenge/September–October 2012
should they be considered unusual. For example, from 1969 to 1982, the United States had four recessions in less than thirteen years. Going back a bit further, from 1799 to 1929, almost 90 percent of expansions lasted three years or less. In other words, from a longer-term histori-cal perspective, the likely brevity of economic expansions during the current decade should be viewed as far from anomalous.
The European Predicament
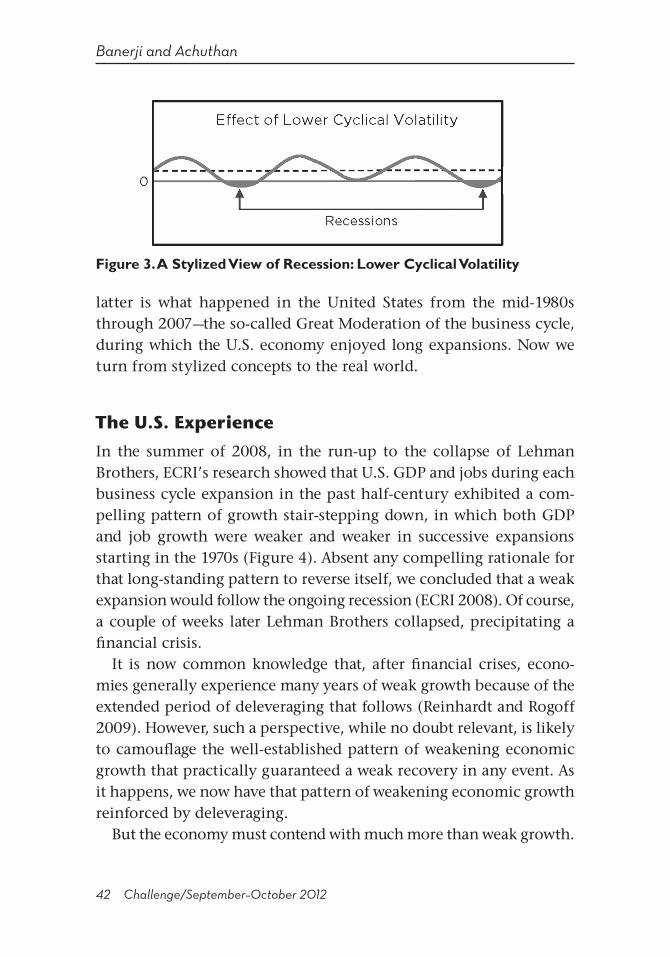
The United States is hardly alone in this respect. Similar patterns are evident for the UK, where, over the course of successive economic expansions, trend growth in GDP has abated even more than in the United States, while trend growth in jobs essentially collapsed to a negative reading during the latest economic expansion (Figure 6). Meanwhile, cyclical volatility is hovering around two-decade highs (Figure 7). In that context, it is not surprising that the UK seems to have slid into another recession in 2011, only a couple of years after the end of the previous recession.
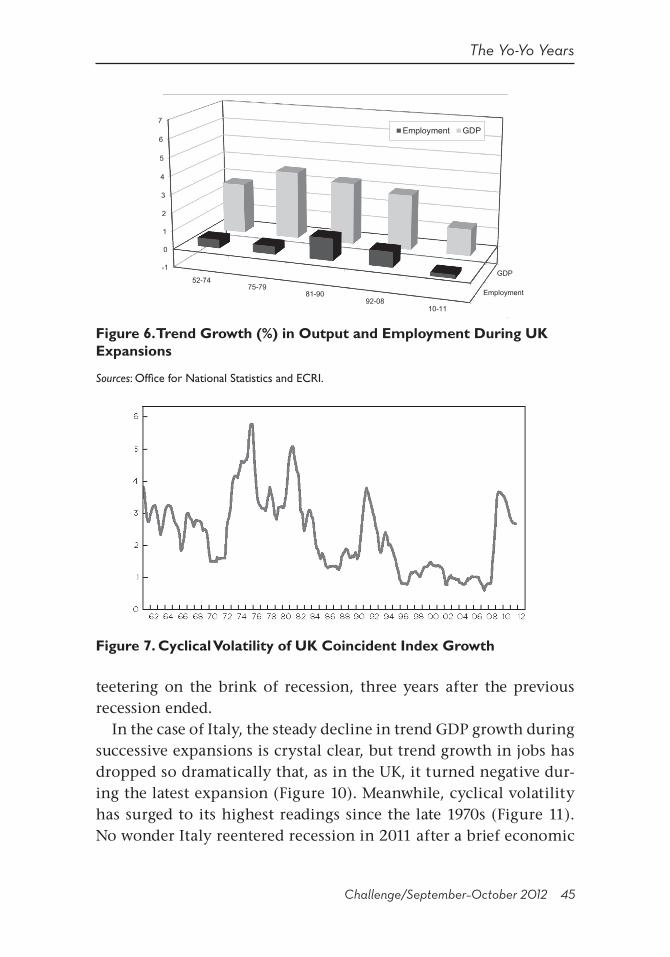
Let us now turn to France and Italy. In fact, France has also been seeing falling trend growth in GDP during recent expansions (Figure 8), while cyclical volatility has risen to its highest readings in about three decades (Figure 9). At the time of writing, France seems to be
Figure 5. Cyclical Volatility of U.S. Coincident Index Growth
The Yo-Yo Years
Challenge/September–October 2012 45
teetering on the brink of recession, three years after the previous recession ended.
In the case of Italy, the steady decline in trend GDP growth during successive expansions is crystal clear, but trend growth in jobs has dropped so dramatically that, as in the UK, it turned negative dur-ing the latest expansion (Figure 10). Meanwhile, cyclical volatility has surged to its highest readings since the late 1970s (Figure 11). No wonder Italy reentered recession in 2011 after a brief economic
Figure 6. Trend Growth (%) in Output and Employment During UK Expansions
Sources: Office for National Statistics and ECRI.
Figure 7. Cyclical Volatility of UK Coincident Index Growth
Employment
GDP-1
0
1
2
3
4
5
6
7
52-7475-79
81-9092-08
10-11
Employment GDP
Banerji and Achuthan
46 Challenge/September–October 2012
expansion. Spain has the same challenge but even more so (not shown in the figures).
In Germany (not shown in the figures), however, we do not see a similar pattern of falling growth during successive expansions, though it does show a similar spike in cyclical volatility. Part of the explanation may lie in the 2003–4 Hartz reforms of the labor market that brought about structural changes to reverse the earlier pattern of falling trend growth.
In any case, such isolated exceptions notwithstanding, the pattern
Figure 8. Trend Growth (%) in Output and Employment During French Expansions
Sources: Institut National de la Statistique et des Etudes Economiques, ECRI.
Figure 9. Cyclical Volatility of French Coincident Index Growth
Employment
GDP
-1
0
1
2
3
4
5
6
7
59-74 75-79 80-82 84-9293-02
03-0809-11
Employment GDP

The Yo-Yo Years
Challenge/September–October 2012 47
Figure 10. Trend Growth (%) in Output and Employment During Italian Expansions
Sources: Instituto Nazionale di Statistica and ECRI.
Figure 11. Cyclical Volatility of Italian Coincident Index Growth
of falling trend growth alongside increased cyclical volatility leads inexorably to a grim conclusion: This combination virtually ensures more frequent recessions. This dynamic highlights a key challenge that most major developed countries are likely to face in the next five to ten years.
With regard to Europe, it is increasingly obvious to policymakers that austerity alone cannot put Greece, or even Spain, in a tenable fiscal position any time soon because their growth prospects are so
Employment
GDP-1
0
1
2
3
4
5
6
7
65-7071-74
75-8083-92
93-0710-11
Employment GDP

Banerji and Achuthan
48 Challenge/September–October 2012
horrible. But these figures show that even for Italy, France, and the UK, longer-term growth prospects are dismal.
Essentially, for these European economies, modest growth is likely during expansions, punctuated by frequent recessions with negative growth—all averaging out to an anemic overall trend growth. Yet the standard forecasts—for example, those from the International Mon-etary Fund (IMF)—used in fiscal projections indicate average real GDP growth in the range of 1.25 percent to 2 percent in the next few years (IMF 2012).
There is simply no way to square these assumptions with the growth prospects just discussed without radical structural changes that result in a quick reversal in these patterns of multidecade declines in the pace of growth. This raises serious questions about the idea that Europe can muddle through by keeping markets afloat on a sea of liquidity until growth picks up in a few years.
In reality, the United States is not so different, and it faces the same chronic growth challenges—essentially slow growth punctuated by more frequent recessions. It is remarkable, in that context, that the Congressional Budget Office currently assumes that real GDP growth will average 4.4 percent in 2014–16 (Congressional Budget Office 2012), compared with 1.7 percent since the beginning of the twenty-first century.
The foregoing analysis is about developed economies, but what about cyclical dynamics in developing countries? As we shall see, they are unlikely to escape unscathed by these developments in the West. Incidentally, a pattern of falling trend growth (not shown) was seen in the lead-up to Japan’s “lost decade,” which began in the early 1990s. Since then Japan has had much more frequent recessions, alternating with weak economic expansions.
The Lash of the Bullwhip
The idea of “decoupling” among international economies is often invoked by analysts as a rationale for one part of the world to avoid weakness elsewhere. But in the past two decades, a key driver of the

The Yo-Yo Years
Challenge/September–October 2012 49
greater coupling of economic cycles had been the increasing interde-pendence of world economies, with more openness in the flows of capital and trade—especially merchandise trade.
Indeed, the export dependence of most economies has risen dra-matically in this period, according to data from the Organization for Economic Cooperation and Development (OECD) and various national statistical agencies, as analyzed by ECRI (2012a). In fact, export-to-GDP ratios have increased sharply since the early 1990s in all countries, which indicates the intensification of global integration through trade. Unless otherwise indicated in the following discussion, the rise in export-to-GDP ratios occurred between the early 1990s and the latest period for which data are available.
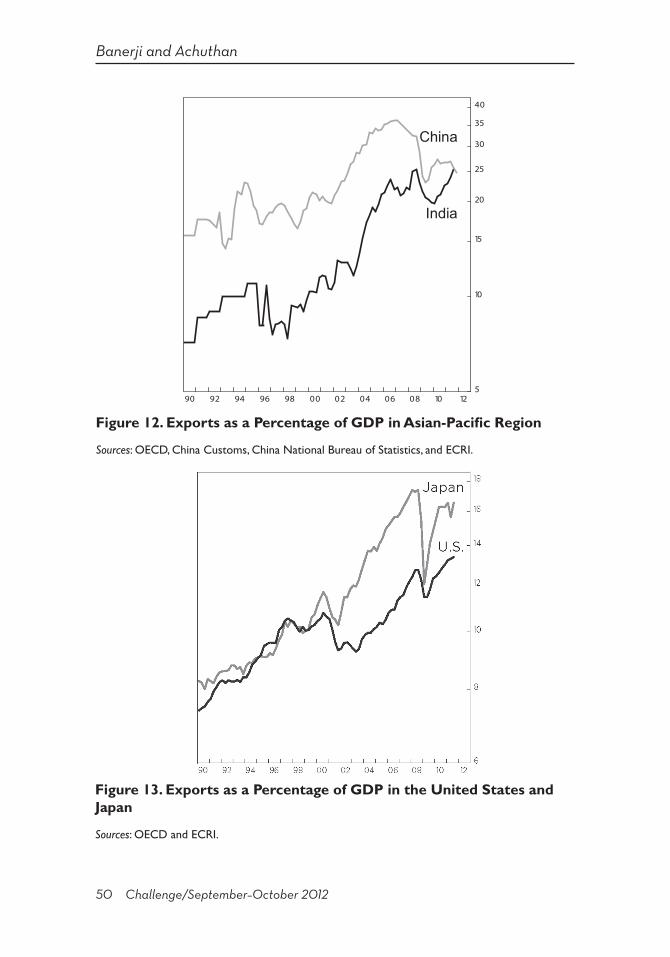
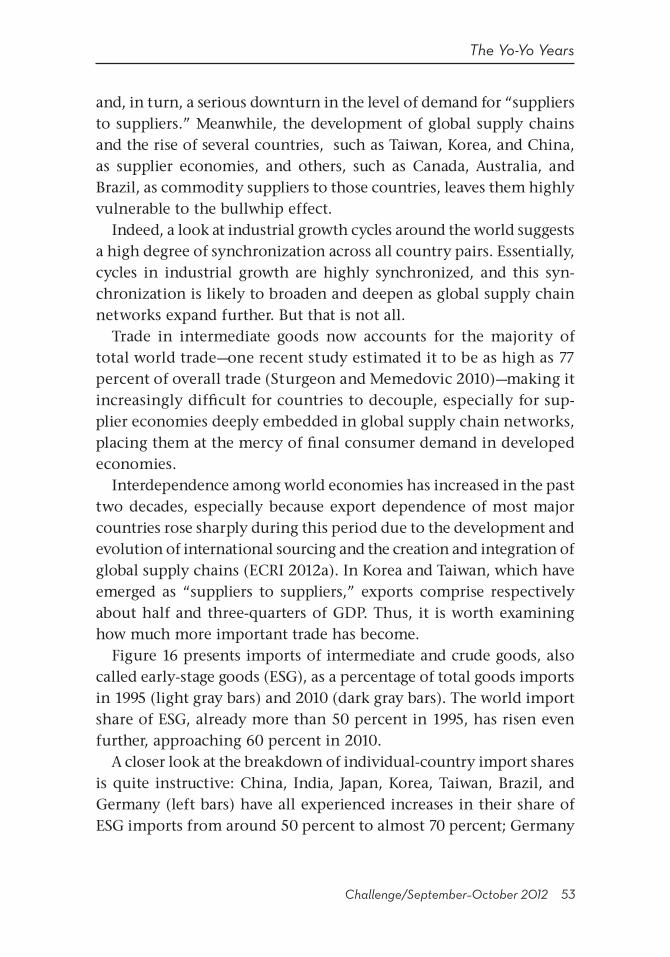
The Asia-Pacific region is a case in point. In China, the share of exports relative to GDP had doubled by about 2007 before gradually easing, but exports still account for about a quarter of Chinese GDP. This ratio has more than tripled in India (Figure 12). It has also more than tripled in South Korea and grew to roughly 75 percent from 42 percent in Taiwan (not shown in the figures). The ratio roughly doubled even in Japan (Figure 13).
In the Americas, Canadian exports increased from 25 percent of GDP in the early 1990s to 45 percent in 2000, before falling back to around 34 percent (not shown in the figures). At the same time, the ratio of Mexican exports to GDP tripled (not shown in the figures). Even the United States, which is not known as an export-oriented economy, participated fully in this move toward higher export de-pendence, with the ratio of exports to GDP almost doubling from 7 percent in 1990 to nearly 14 percent (Figure 13).
Meanwhile, in the eurozone, exports as a share of GDP increased to 44 percent in 2011 from 26 percent in 1995 (Figure 14). In the UK, the ratio increased from 19 percent in 1990 to 30 percent at present (Figure 14).
The implications of this increased interdependence based on trade linkages are magnified by the workings of the bullwhip effect—a phe-nomenon that has long been important in the transmission of cycles but has become even more important in recent years.
Banerji and Achuthan
50 Challenge/September–October 2012
Figure 12. Exports as a Percentage of GDP in Asian-Pacific Region
Sources: OECD, China Customs, China National Bureau of Statistics, and ECRI.
Figure 13. Exports as a Percentage of GDP in the United States and Japan
Sources: OECD and ECRI.
5
10
15
20
25
30
35
40
90 92 94 96 98 00 02 04 06 08 10 12
China
India

The Yo-Yo Years
Challenge/September–October 2012 51
The conventional view is correct that developing countries have become a key driver of long-term secular global growth. However, in cyclical terms, developing countries are particularly subject to the bullwhip effect, in which small fluctuations in the growth of consumer demand are amplified up the supply chain into big swings in demand as one moves away from the consumer. In effect, smaller shifts in end-consumer demand growth translate into larger fluctua-tions in intermediate goods demand, and even bigger ones in input material demand, especially in raw material prices.
A study of the shoe, leather, and hides sequence by Ruth Mack (1956) illustrates how shifts in demand ripple through supply chains to produce cyclical swings (Figure 15). During periods of growth, shoe manufacturers anticipate rising demand, but if demand growth slows, that is, there is a slower increase in demand for shoes, shoe manufacturers will be stuck with excess shoe and leather inventory. Thus, new orders for leather have to be reduced significantly.
In turn, the leather manufacturer, stuck with an even larger excess
Figure 14. Exports as a Percentage of GDP in Europe
Sources: OECD and ECRI.
18
23
28
33
38
43
48
90 92 94 96 98 00 02 04 06 08 10 12
Eurozone
U.K.

Banerji and Achuthan
52 Challenge/September–October 2012
inventory, reduces orders for hides. Hides producers end up experi-encing an even more precipitous drop in demand than the leather manufacturer does.
This amplification of cycles in the supply chain has a direct im-pact on prices. After all, slaughterhouses will not stop slaughtering cattle because the demand for hides has plummeted, as hides are a by-product of meat production. Therefore, prices for hides start to plunge. Just as for hides, the prices of crude oil, silicon chips, steel, or copper plunge when consumer demand growth eases, because their supply cannot be reduced quickly.
Mack’s study showed how small shifts in demand growth at the consumer level are amplified up the supply chain. This magnification of demand fluctuations is called the bullwhip effect because a little flick of the wrist produces a big arc at the end of the whip.
Thus, even a modest decline in consumer spending growth in de-veloped countries like the United States and those in Europe can help trigger a significant downturn in the level of demand from suppliers
Figure 15. Shoe-Leather-Hide Sequence: The Bullwhip Effect
Supplier Demand:Level Falls
Consumer Demand:Growth Slows
Supplier-to-Supplier
Demand:Level
Plunges
The Yo-Yo Years
Challenge/September–October 2012 53
and, in turn, a serious downturn in the level of demand for “suppliers to suppliers.” Meanwhile, the development of global supply chains and the rise of several countries, such as Taiwan, Korea, and China, as supplier economies, and others, such as Canada, Australia, and Brazil, as commodity suppliers to those countries, leaves them highly vulnerable to the bullwhip effect.
Indeed, a look at industrial growth cycles around the world suggests a high degree of synchronization across all country pairs. Essentially, cycles in industrial growth are highly synchronized, and this syn-chronization is likely to broaden and deepen as global supply chain networks expand further. But that is not all.
Trade in intermediate goods now accounts for the majority of total world trade—one recent study estimated it to be as high as 77 percent of overall trade (Sturgeon and Memedovic 2010)—making it increasingly difficult for countries to decouple, especially for sup-plier economies deeply embedded in global supply chain networks, placing them at the mercy of final consumer demand in developed economies.
Interdependence among world economies has increased in the past two decades, especially because export dependence of most major countries rose sharply during this period due to the development and evolution of international sourcing and the creation and integration of global supply chains (ECRI 2012a). In Korea and Taiwan, which have emerged as “suppliers to suppliers,” exports comprise respectively about half and three-quarters of GDP. Thus, it is worth examining how much more important trade has become.
Figure 16 presents imports of intermediate and crude goods, also called early-stage goods (ESG), as a percentage of total goods imports in 1995 (light gray bars) and 2010 (dark gray bars). The world import share of ESG, already more than 50 percent in 1995, has risen even further, approaching 60 percent in 2010.
A closer look at the breakdown of individual-country import shares is quite instructive: China, India, Japan, Korea, Taiwan, Brazil, and Germany (left bars) have all experienced increases in their share of ESG imports from around 50 percent to almost 70 percent; Germany

Banerji and Achuthan
54 Challenge/September–October 2012
and China registered the largest increases, and Germany’s increase was almost double that of China.
The rising export dependence of these countries, accompanied by growing involvement in global supply networks, makes it increas-ingly difficult for economies to decouple, especially for suppliers of early-stage goods that are embedded farther up the supply chain and farther away from the final consumer.
This makes them highly vulnerable to the bullwhip effect and at the mercy of cyclical fluctuations in end-user demand growth. But these fluctuations flow largely from developed economies, which have entered an era of more frequent recessions that involve larger fluctuations in consumer demand growth.
This adds up to the “yo-yo years” for growth in both the developed and developing economies.
The Perfect Storm
It may be instructive to review the key sequences of events that have culminated in the current predicament of the global economy. They include demographic factors as well as the impact of globalization
Figure 16. Early-Stage Goods Share of Total Imports
Sources: United Nations Commodity Trade Statistics Database and ECRI.
0%
10%
20%
30%
40%
50%
60%
70%
80%
BR, GE, CN, IN, JA,KO, TW
Other Eight Countries Total
1995 2010
China, India, Japan, Korea, Taiwan, Brazil,
Germany
U.S., Canada, France, U.K., Italy, Spain, Switzerland,
Sweden
World Total

The Yo-Yo Years
Challenge/September–October 2012 55
and technological progress on developed and developing countries. However, the implications of the yo-yo years are ominous indeed, especially for the majority of developed economies.
Why did economic growth begin slowing in recent decades in most of the developed world? We do not have a full understanding of the causes, but many different factors may have played a role. Of course, it was difficult to maintain the sustained surge in growth after the conclusion of World War II for more than two to three decades, especially after the spikes in energy prices in the 1970s and early 1980s. Although oil prices have fluctuated since that time, they have never returned to their earlier lows. Also, a major factor behind the slowdown in growth—certainly in the United States—may be demo-graphic in nature (Stock and Watson 2012), especially as it relates to job growth.
Indeed, job growth has been quite disappointing in recent economic recoveries. To the extent that this is due to the end of the historic increase in female labor force participation between the 1960s and 1990s and the decline in male labor force participation due to the aging of the baby boom generation, “these demographic factors point towards a further decline in trend growth of employment and hours in the coming decades,” according to Stock and Watson.
The rise in youth unemployment around the world is another aspect of this problem. It is certainly true of the United States, where another major issue has been the huge increase in long-term unemployment. We have found intriguing evidence that these changes occurred not around the time of the Great Recession but as far back as a quarter of a century ago, when there was a decisive shift in cyclical behavior (ECRI 2012b). These changes may be related to the rise of globaliza-tion and the role of technology in eliminating entire classes of jobs starting in the late 1980s and continuing to the present.
As we have discussed, the confluence of the patterns of slowing trend growth and much higher cyclical volatility is likely to result in more frequent recessions. Structural factors aside, it generally takes long expansions to significantly reduce both long-term unemployment and youth unemployment. Therefore, shorter economic expansions

Banerji and Achuthan
56 Challenge/September–October 2012
imply that both long-term joblessness and youth unemployment will cycle around high levels, rising from already elevated readings near recessions. This prospect has profound cyclical implications.
The budgetary implications are also grim. Not only are the current fiscal projections in both the United States and Europe rendered hope-lessly unrealistic by the likelihood of much lower average growth rates for the medium to long term than anyone has predicted, but the need for social support for the long-term unemployed as well as youth in that time frame may be much greater than most believe, especially if much of the demographic cohort expected to bear the burden of the current generation’s fiscal profligacy is idled by these developments.
Of course, more frequent recessions also mean that, thanks to the bullwhip effect, developing countries that have adopted the path of export-led growth are going to be increasingly whipsawed by these more frequent ups and downs in developed market demand. If so, the cyclical swings in developing countries may become much larger than presumed by many who are entranced by their longer-term growth prospects, including investors. Indeed, more frequent recessions spell the death of the old “buy-and-hold” philosophy of equity investing for all but those with strong stomachs.
In sum, it may be a mistake to look at the current economic situation as a departure from a more benign state of normality to which we should return in the next few years, if only the “right” policy mix is chosen. Rather, we need to understand that we are now in the yo-yo years and that therefore we need to make different assumptions about what to expect in the years ahead, regardless of what policymakers decide to do.
For Further Reading
Bernanke, Ben S. 2004. “The Great Moderation.” Remarks delivered at meetings of the Eastern Economic Association. Washington, DC, February 20. www.feder-alreserve.gov/BOARDDOCS/SPEECHES/2004/20040220/default.htm.
———. 2008. “Outstanding Issues in the Analysis of Inflation.” Speech delivered at the Federal Reserve Bank of Boston’s 52nd Annual Economic Conference, Chatham, MA, June 9. www.federalreserve.gov/newsevents/speech/bernan-ke20080609a.htm.

The Yo-Yo Years
Challenge/September–October 2012 57
China Customs. Merchandise exports statistics, via Haver Analytics. www.haverse-lect.com, accessed January 2012.
China National Bureau of Statistics. Gross domestic product statistics, via Haver Analytics. www.haverselect.com, accessed January 2012.
Congressional Budget Office. 2012. The Budget and Economic Outlook: Fiscal Years 2012 to 2022. www.cbo.gov/sites/default/files/cbofiles/attachments/01–31–2012_Outlook.pdf.
Deutsche Bundesbank. Macroeconomic Time-Series Database: Employees and La-bour Market. Employment in Germany. www.bundesbank.de/Navigation/EN/Statistics/Time_series_databases/Macro_economic_time_series/its_list_node.html?listId=www_s311_b40209d/, accessed July 2012.
———. Macro-Economic Time Series Database: National Accounts. Gross Domestic Product. www.bundesbank.de/Navigation/EN/Statistics/Time_series_databases/Macro_economic_time_series/its_list_node.html?listId=www_s311_b40201/, accessed July 2012.
Economic Cycle Research Institute. 2008. U.S. Cyclical Outlook 13, no. 8 (August): 3.———. 2012a. International Cyclical Outlook 17, no. 1 (January): 5–10. ———. 2012b. U.S. Cyclical Outlook 17, no. 7 (July): 6–10.International Monetary Fund. 2012. World Economic Outlook (April). Institut National de la Statistique et des Etudes Economiques. “Labour Market,
Employment, Unemployment. Quarterly Salaried Headcount.” www.insee.fr/en/bases-de-donnees/bsweb/serie.asp?idbank=1577240/, accessed July 2012.
———. “Quarterly National Accounts. Gross Domestic Product.” www.bdm.insee.fr/bdm2/affichageSeries.action?idbank=001615899&page=tableau&codeGroupe=1310&recherche=criteres/, accessed July 2012.
Instituto Nazionale di Statistica. Gross domestic product and employment data. http://dati.istat.it/, accessed July 2012.
Kim, Chang-Jin, and Charles Nelson. 1999. “Has the U.S. Economy Become More Stable? A Bayesian Approach Based on a Markov-Switching Model of the Busi-ness Cycle.” Review of Economics and Statistics 81: 608–16.
Mack, Ruth P. 1956. Consumption and Business Fluctuations: A Case Study of the Shoe, Leather, Hide Sequence. New York: National Bureau of Economic Research.
McConnell, Margaret, and Gabriel Perez-Quiros. 2000. “Output Fluctuations in the United States: What Has Changed Since the Early 1980s?” American Economic Review 90: 1464–76.
Norris, Floyd. 2008. “Shallow Recessions, Shallow Recoveries.” New York Times, August 29.
Office for National Statistics. “United Kingdom Economic Accounts: National Ac-counts Aggregates.” Table A1: Gross Domestic Product. www.ons.gov.uk/ons/datasets-and-tables/data-selector.html?cdid=ABMI&dataset=ukea&table-id=A1/, accessed July 2012.
Office for National Statistics. “Labour Market Statistics: Workforce Jobs.” Table 5: Total workforce jobs. www.ons.gov.uk/ons/datasets-and-tables/data-selector.html?dataset=lms/, accessed July 2012.
Organization for Economic Cooperation and Development. Gross domestic prod-

Banerji and Achuthan
58 Challenge/September–October 2012
uct and international trade statistics. OECD.StatExtracts. http://stats.oecd.org, accessed January 2012.
Reinhart, Carmen M., and Kenneth S. Rogoff. 2009. This Time Is Different: Eight Centuries of Financial Folly. Princeton: Princeton University Press.
Stock, James H., and Mark W. Watson. 2012. “Disentangling the Channels of the 2007–2009 Recession.” Paper presented at the Brookings Panel on Economic Activity, March 22–23. www.brookings.edu/~/media/Files/Programs/ES/BPEA/2012_spring_bpea_papers/2012_spring_BPEA_stockwatson.pdf.
Sturgeon, Timothy J., and Memedovic, Olga. 2010. “Mapping Global Value Chains: Intermediate Goods Trade and Structural Change in the World Economy.” De-velopment Policy and Strategic Research Branch, working paper 05/2010. United Nations Industrial Development Organization, Vienna, Austria.
United Nations. “Commodity Trade Statistics Database.” http://comtrade.un.org/db/mr/rfCommoditiesList.aspx, accessed January 2012.
United States Bureau of Economic Analysis. “National Income and Product Accounts, Gross Domestic Product.” Table 1.1.6. www.bea.gov, accessed July 2012.
United States Bureau of Labor Statistics. “Current Employment Statistics.” www.bls.gov/data/#employment/, accessed July 2012.
Weber, Steven. 1997. “The End of the Business Cycle?” Foreign Affairs 76, no. 4 (July/August): 65–82.
To order reprints, call 1-800-352-2210; outside the United States, call 717-632-3535.

![The implications of Comcare v Banerji [2019] HCA 23 for ... · Banerji and Comcare (Compensation) [2018] AATA 892 • Section 5A(1) of the Safety, Rehabilitation and Compensation](https://static.fdocuments.in/doc/165x107/607ead0fd55dbe068216af95/the-implications-of-comcare-v-banerji-2019-hca-23-for-banerji-and-comcare.jpg)