Animation in the winchester graphics system
4
Animation in the Winchester Graphics System Stephen Todd and John Gillett IBM UK Scientific Centre, Athelstan House, Winchester, UK The Winchester Graphics System provides a facility for animation of molecular dynamics data. it features simple user setup of various picture types and realtime user control of speed and viewpoint during the animation. The system operates by preparing frames in d~play list format on a mainframe and storing them in mainframe virtual storage. During the animation the frames are sent at a user controlled rate of up to 30 framesjs via a minicomputer to a display system. The minicomputer also monitors user control devices to prepare viewpoint tra~formatio~. These viewpoint transformation are applied by the display system. The user setup of different pictures is simplified by a powerful relational database and by ease of adding new application programs. The realtime display relies on substantial mainframe memory, and a high bandwidth path to the display system. We have applied the system to a simulation of the dynamics of avian-pancreatic-po~ype~tide. Stick diagrams, surface plots and distance matrices have been used. Keywords: an~ma~on, Winchester Graphics System, molecular dynamics received 18 April 1983 There is growing interest in Molecular Dynamics, initiated by work by Karplus et al. lP2. An obvious tool to assist researchers in this area is an animated graphic display of the motions of a molecule. Several people have implemented systems that support this. One of the earliest was by Feldmann and Levitt3. They produced a film of the molecular dynamics of the bovine pancreatic trypsin inhibitor. This demonstrated the power of animation as a tool for the researcher, but the viewer had no control over what he saw. There have since been several systems4*6 which gave the user some control in setting up an animation. An example is that of Wodak et aL6, which streams data from a minicomputer disc to a display system while maintaining user viewpoint control. We describe in this paper the implementation of animation on the WGS (Winchester Graphics System). The work was carried out to assist I Haneef of Birkbeck College, University of London, UK, in an investigation of a simulation of the dynamics of avian-pancreatic- polypeptide. The implementation is general purpose; we are considering its use in robot simulation. (The requirements of our animation were two: ease of setting up different picture types (eg mainchain, virtual bond); and full viewpoint control (pan, rotate and zoom) in realtime during the animation.) We divide the problem into two parts: l generation l display During generation, we prepare a series of 3D ‘frames’ on the mainframe in display system format. These are stored in mainframe (virtual) memory. During display, these frames are transmitted from the mainframe (IBM 3031) through a control minicomputer (IBM Series/l) to the display system (Vector General 3303). At the same time, the minicomputer monitors the control devices (currently 3D joystick and tablet) and generates transform control data which it sends to the display system in the same way as for a non-animated picture. This approach relies heavily on the high bandwidth available on the path from mainframe to minicomputer to display system. The rest of this paper is in four parts. First we give a background to the WCS, its software and hardware. The implementation of animation is then described. In the next part is discussed our applications of animation. We end with a summary. WINCHESTER GRAPHICS SYSTEM The WGS is designed to simplify the implementation of graphics applications. Most of our applications so far have been in the molecular sciences. We give here an overview of WGS, in two sections: software and hardware. In each section we emphasize the features important to our animation work. WGS Software The WGS is in four parts: driver application programs data handler graphics subsystems (see Figure 1) The driver is the basic system skeleton. It handles user commands, passing each to the appropriate subsystem. It also permits the dynamic linking of additional programs into the system. Application programs may be written in simple PL/I or in an interpretive macro executive language7* . PL/I is suitable for programs that handle data explicitly, macros for higher level programs that interact with users and invoke combinations of lower level programs. Volume 1 Number 2 June 1983 0263-7855/83/020039-04$03.00@ 1983 Butter-worth & Co (Publishers) Ltd 39
-
Upload
stephen-todd -
Category
Documents
-
view
214 -
download
2
Transcript of Animation in the winchester graphics system

Animation in the Winchester Graphics System Stephen Todd and John Gillett
IBM UK Scientific Centre, Athelstan House, Winchester, UK
The Winchester Graphics System provides a facility for animation of molecular dynamics data. it features simple user setup of various picture types and realtime user control of speed and viewpoint during the animation.
The system operates by preparing frames in d~play list format on a mainframe and storing them in mainframe virtual storage. During the animation the frames are sent at a user controlled rate of up to 30 framesjs via a minicomputer to a display system. The minicomputer also monitors user control devices to prepare viewpoint tra~formatio~. These viewpoint transformation are applied by the display system.
The user setup of different pictures is simplified by a powerful relational database and by ease of adding new application programs. The realtime display relies on substantial mainframe memory, and a high bandwidth path to the display system.
We have applied the system to a simulation of the dynamics of avian-pancreatic-po~ype~tide. Stick diagrams, surface plots and distance matrices have been used.
Keywords: an~ma~on, Winchester Graphics System, molecular dynamics
received 18 April 1983
There is growing interest in Molecular Dynamics, initiated by work by Karplus et al. lP2. An obvious tool to assist researchers in this area is an animated graphic display of the motions of a molecule. Several people have implemented systems that support this. One of the earliest was by Feldmann and Levitt3. They produced a film of the molecular dynamics of the bovine pancreatic trypsin inhibitor. This demonstrated the power of animation as a tool for the researcher, but the viewer had no control over what he saw. There have since been several systems4*6 which gave the user some control in setting up an animation. An example is that of Wodak et aL6, which streams data from a minicomputer disc to a display system while maintaining user viewpoint control.
We describe in this paper the implementation of animation on the WGS (Winchester Graphics System). The work was carried out to assist I Haneef of Birkbeck College, University of London, UK, in an investigation of a simulation of the dynamics of avian-pancreatic- polypeptide. The implementation is general purpose; we are considering its use in robot simulation. (The requirements of our animation were two: ease of setting up different picture types (eg mainchain, virtual bond); and full viewpoint control (pan, rotate and zoom) in realtime during the animation.)
We divide the problem into two parts:
l generation l display
During generation, we prepare a series of 3D ‘frames’ on the mainframe in display system format. These are stored in mainframe (virtual) memory. During display, these frames are transmitted from the mainframe (IBM 3031) through a control minicomputer (IBM Series/l) to the display system (Vector General 3303). At the same time, the minicomputer monitors the control devices (currently 3D joystick and tablet) and generates transform control data which it sends to the display system in the same way as for a non-animated picture. This approach relies heavily on the high bandwidth available on the path from mainframe to minicomputer to display system.
The rest of this paper is in four parts. First we give a background to the WCS, its software and hardware. The implementation of animation is then described. In the next part is discussed our applications of animation. We end with a summary.
WINCHESTER GRAPHICS SYSTEM
The WGS is designed to simplify the implementation of graphics applications. Most of our applications so far have been in the molecular sciences. We give here an overview of WGS, in two sections: software and hardware. In each section we emphasize the features important to our animation work.
WGS Software
The WGS is in four parts:
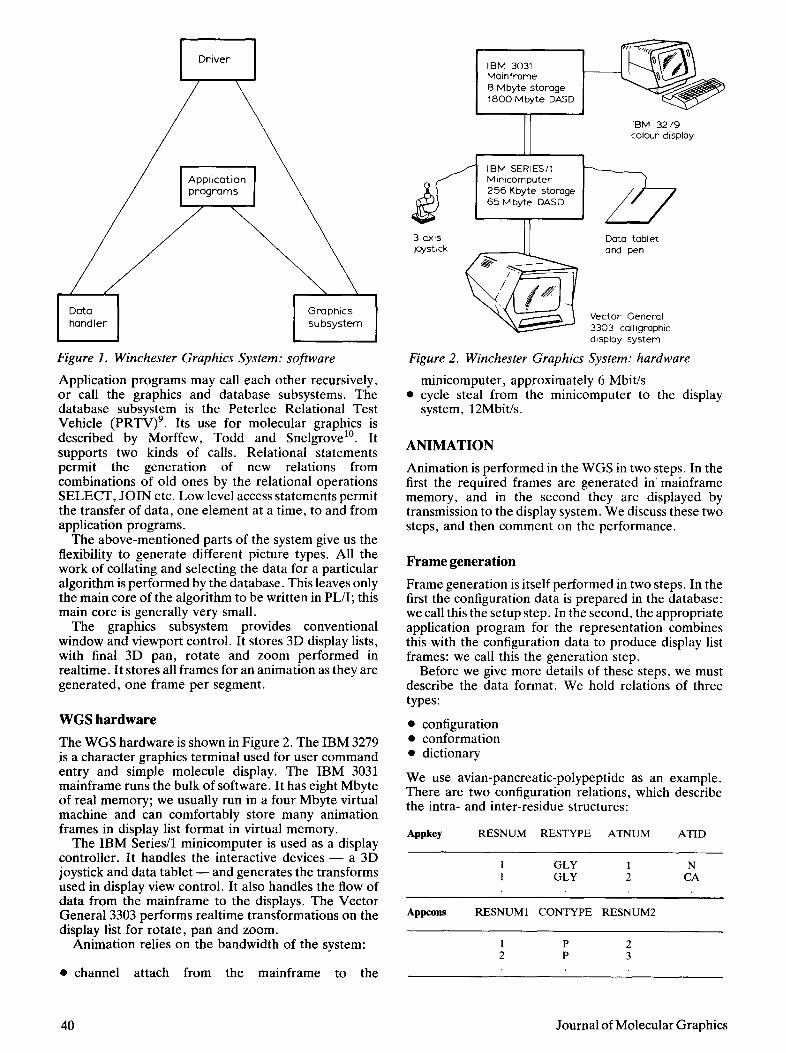
driver application programs data handler graphics subsystems (see Figure 1)
The driver is the basic system skeleton. It handles user commands, passing each to the appropriate subsystem. It also permits the dynamic linking of additional programs into the system.
Application programs may be written in simple PL/I or in an interpretive macro executive language7* . PL/I is suitable for programs that handle data explicitly, macros for higher level programs that interact with users and invoke combinations of lower level programs.
Volume 1 Number 2 June 1983 0263-7855/83/020039-04$03.00@ 1983 Butter-worth & Co (Publishers) Ltd 39
I Driver I
Figure 1. Winchester Graphics System: software
Application programs may call each other recursively, or call the graphics and database subsystems. The database subsystem is the Peterlee Relational Test Vehicle (PRTV)9. Its use for molecular graphics is described by Morffew, Todd and Snelgrove”. It supports two kinds of calls. Relational statements permit the generation of new relations from combinations of old ones by the relational operations SELECT, JOIN etc. Low level access statements permit the transfer of data, one element at a time, to and from application programs.
The above-mentioned parts of the system give us the flexibility to generate different picture types. All the work of collating and selecting the data for a particular algorithm is performed by the database. This leaves only the main core of the algorithm to be written in PL/I; this main core is generally very small.
The graphics subsystem provides conventional window and viewport control. It stores 3D display lists, with final 3D pan, rotate and zoom performed in realtime. It stores all frames for an animation as they are generated, one frame per segment.
WGS hardware
The WGS hardware is shown in Figure 2. The IBM 3279 is a character graphics terminal used for user command entry and simple molecule display. The IBM 3031 mainframe runs the bulk of software. It has eight Mbyte of real memory; we usually run in a four Mbyte virtual machine and can comfortably store many animation frames in display list format in virtual memory.
The IBM Series/l minicomputer is used as a display controller. It handles the interactive devices - a 3D joystick and data tablet - and generates the transforms used in display view control. It also handles the flow of data from the mainframe to the displays. The Vector General 3303 performs realtime transformations on the display list for rotate, pan and zoom.
Animation relies on the bandwidth of the system:
l channel attach from the mainframe to the
8 Mbyte storage 1800 Mbyte DASD
IBM 3279 colour dlsploy
IBM SERIES/l Mlrxcomputer 256 Kbyte stomge 65 Mbyte DAS D
3 CIXIS Data tablet joystIck and pen
Vector General 3303 calligraphic display system
Figure 2. Winchester Graphics System: hardware
minicomputer, approximately 6 Mbit/s l cycle steal from the minicomputer to the display
system, 12Mbit/s.
ANIMATION
Animation is performed in the WGS in two steps. In the first the required frames are generated in’ mainframe memory, and in the second they are displayed by transmission to the display system. We discuss these two steps, and then comment on the performance.
Frame generation
Frame generation is itself performed in two steps. In the first the configuration data is prepared in the database: we call this the setup step. In the second, the appropriate application program for the representation combines this with the configuration data to produce display list frames: we call this the generation step.
Before we give more details of these steps, we must describe the data format. We hold relations of three types:
l configuration 0 conformation l dictionary
We use avian-pancreatic-polypeptide as an example. There are two configuration relations, which describe the intra- and inter-residue structures:
4vkey RESNUM RESTYPE ATNUM ATID
1 GLY 1 N 1 GLY 2 CA
APWO- RESNUMl CONTYPE RESNUM2
1 P 2 2 P 3
40 Journal of Molecular Graphics

There is one conformation relation, which gives atom positions for each atom in each frame.
APPW FRAME ATNUM X Y Z
1 1 2.29 22.91 17.09 1 2 0.91 22.90 17.59
There are two dictionary relations, which are not specific to avian-pancreatic-polypeptide. One describes atoms. Another describes connections between pairs of atoms: these connections include inter- and intra-residue connections, and bond and non-bond (eg. virtual bond) connections. Classes ATCL VDWRAD COLOUR
C 1.7 GREEN N 1.6 BLUE
Lii CONTYPE ATIDl ATID LENGTH LINKTYPE
ALA C CA 1.52 BOND DISULPHIDE SG SG 2.04 BOND
PEPTIDE CA CA 3.80 VIRTBOND
We now return to describe the setup step. This is performed in the database, to produce tables of atom numbers and associated data that will be used by the generation step. For example, to produce a conventional virtual bond representation we require a single table that holds pairs of atom numbers for adjacent CA atoms. To produce a full bond view, the table must contain atom number pairs for all bonded atoms. To label the CA atoms, or to produce a distance matrixi’, we require a single column table containing a list of atom numbers.
For more information on these relations, together with examples of how the above kinds of operations are carried out by the database, see Morffew, Todd and Snelgrove . lo None of the above operations require more than six relational operations.
For the frame generation step, the animation software collects these tables into PWI arrays. It then reads the configuration relation, collecting atom position data, one frame at a time, into other arrays. For each frame, the application code is called to generate the display list for that frame. This is a simple matter for most representations - equivalent to the program for static use with the advantage that properly selected and collated data is already to hand. The display list for each frame is stored as a segment by the graphics system. Where differences between frames are necessary, the
Display B> MaInframe f-User terminal fmmeYs
UT Minicomputer +-Joystick and tablet
UT Display system
High bandwidth =>
Control information *
Figure 3. Data flow for animation
animation software remembers the coordinate values for the previous frame as well as for the current. In this case, there is one fewer display list frame than there are input data frames.
A list of the representations we have animated and their application programs is included in the section on application. This subsection has shown how the power of the database and ease of writing application programs makes simple the generation of different represen- tations for animation.
Frame display Frame display is the realtime transmission of the pregenerated display list frames from virtual memory in the mainframe via the minicomputer to the display system (see Figure 3).
Frame display is controlled from a small program on the mainframe. This program consists of a loop which picks a frame segment from main memory and sends it over the channel to the minicomputer. It then waits for a timing acknowledgement from the minicomputer that indicates the frame has been displayed for the required number of refresh cycles.
This main display program has two ways to control speed and direction. One of these is the frame number increment. This may be set for .forward (+ l), freeze frame (0) and backwards (- 1). It may be set for control of fast play double speed (2), triple speed (3) and so on. When the end of frames is reached, the controller may restart, replay backwards or stop.
The second method of control sets the number of display system refresh cycles animation frame. Thus the animation may be played at half speed (2), one-third speed (3) and so on. A value of -1 is used to indicate ‘STOP’; return of the control program to WGS and end of animation display. The user currently operates these controls from program function keys on the mainframe terminal, which are set to store values asynchronously into mainframe storage. These values are monitored by the control program. We intend to permit speed and direction control from the tablet by passing tablet data from the minicomputer to the mainframe with each ‘frame ready’ acknowledgement. The pen will be used as a speed control or as a direct frame number control. This will affect the user interface, but not the internal control mechanisms. The minicomputer acts as a device controller. It accepts data from the mainframe and passes it on to the display system. It monitors the input devices (pen and three dimensional joystick), computes viewport transforms from them and transmits them to the display system. It accepts refresh synchrony interrupts from the display system, counts them, and sends a frame complete acknowledge to the mainframe after the appropriate number.
The display system performs its normal 3D pan, rotate and zoom to the display lists to make the final part of the realtime animation systems.
Performance
Frame generation performance depends on the type of representation, but takes of the order of 1 s/frame for a full band view of avian-pancreatic-peptide, or for a distance matrix of the alpha-carbon atoms of avian- pancreatic-polypeptide .
Our realtime animation is limited by bandwidth. For
Volume 1 Number 2 June 1983

30 frames/s we may have display lists of about 20000 bytes, or 2000 unoptimized vectors. Longer display lists may be used at a slower frame rate by permitting multiple refresh cycles per frame. Even when the faster rates are available, we find users generally choose 5-10 frames/s.
The channel from the mainframe to the minicomputer is not shared by any other high bandwidth device, so this presents no problem. We use a maximum of 30 per cent of the mainframe CPU when running at full speed of one frame per refresh cycle (30 frames/s). Virtual storage use is dependent on the size and number of frames. For example, in one Mbyte of virtual storage we may store 50 frames of 2000 vectors, or 200 frames for a full bond representation of the avian-pancreatic-polypeptide monomer.
When the mainframe - which is typically supporting 40 other users at equal priority - delays scheduling us due to CPU or paging contention, the effect is a temporarily frozen frame and a jerky animation. During prime shift this effect is noticeable, but not usually bad enough to reduce the value of the system to the research scientist. Out of prime shift, almost all animations run very smoothly.
APPLICATIONS OF ANIMATION
All the applications we have implemented so far are in the display and analysis of the dynamics of avian- pancreatic-polypeptide’2. We have 128 frames stored in the database. The aim here is to give an idea of the value of animation. Chemical conclusions will be presented elsewhere by I Haneef13.
The three obvious representations to use are full bond, mainchain and virtual bond. It is very difficult to see interesting features with the full bond representation: high frequency motions of sidechains, especially flapping tyrosines, distract the attention. Both the less cluttered mainchain and virtual bond representations give a clear idea of certain motions, especially the waggle of polyproline helix. We had hoped to see changes of surface detail with animated van der Waal and extended van der Waal surface plots. The current level of software does not produce such long display lists smoothly enough for these representations to be valuable when animated.
Animations of abstractions from the data have proved very interesting. Animated distance and difference distance matrices are reported by Morffew in this issue”. Haneef is working on animations of Taylor’s inertial equivalent cylinders14, and representations to emphasize the flow of energy.
It is clear that animation is a useful tool, and that realtime speed and view control greatly enhance its value.
CONCLUSIONS
We have described how animation is performed in the WGS. Frames are prepared and stored in the main memory of the mainframe. These are then transmitted via a minicomputer to the display system at a user controlled rate up to 30 frames/s. The minicomputer also monitors input devices to permit dynamic viewpoint control.
A wide range of pictures may be generated, helped by a powerful database for data selection and collation, and by a convenient program development environment. The controlled animation from these generated frames relies on a large mainframe memory and on high bandwidth from the mainframe to the display.
We believe that controlled animation will be a very powerful visual tool in molecular dynamics research.
ACKNOWLEDGEMENTS
We wish to thank A J Morffew, I Haneef, T R Heywood and D Puckering for help with the work described here and with writing this paper.
REFERENCES
1 McCammon, J A, Wolynes, P G and Karplus, M Biochemistry No 18 (1970) pp 927-942
2 Kaqlus, M and McCammon, J A Crit. Rev. Biochem. No 9 (1981) pp 293-349
3 Feldmann, R J and Levitt, M ‘Molecular dynamics of bovine pancreatic trypsin inhibitor’ (1980)
4 Olson, A J in Sayre, D (ed) Computational crystallography Clarendon Press, UK (1981) pp 326-336
5 Egan, J T, Hart, J, Burt, S K and MacElroy, R D Computers and graphics Vo16 No 4 (1982) pp 177-199
6 Wodak, S et al. Private communication 7 IBM Virtual Machine System Product EXEC 2 Reference SC24-
5219 8 Cowlishaw, M F Proc. SHARE 56 Conf. (1981) 9 Todd, S J P IBM Syst. J. (1976) Vol 15 No 4
10 Morffew, A J, Todd, S J P and Snelgrove, M J Comput. and Chern. Vol 7 No 1 (1983) pp 9-16
11 Mot-flew, A J J. Molecular Graphics Vol 1 No 2 (1983) 12 Wood, S P, Pitts, J E, Blundell, T L, Tickle, I J and Jenkii, J A
Eur. J. Biochem. No 78 (1977) pp l&127 13 Haneef, I in preparation 14 Taylor, W, Thornton, J M and TumeU, W G J. Molecular
Graphics Vol 1 No 2 (1983)
42 Journal of Molecular Graphics