Anheuser-Busch 48 / 49 InBev 2013 7/ · ações) of Ambev with Ambev S.A., a non-reporting...
107
Financial Report 7/ Contents 50 Management Report 71 Statement of the Board of Directors 72 Independent Auditors’ Report 75 Consolidated Financial Statements 150 Information to our Shareholders 152 Excerpt from the AB InBev NV Separate (Non-Consolidated) Financial Statements Prepared in Accordance with Belgian GAAP 154 Glossary 48 / 49 Anheuser-Busch InBev Annual Report 2013
-
Upload
nguyenkhue -
Category
Documents
-
view
216 -
download
0
Transcript of Anheuser-Busch 48 / 49 InBev 2013 7/ · ações) of Ambev with Ambev S.A., a non-reporting...

Financial Report
7/Contents
50 Management Report 71 Statement of the Board of Directors 72 Independent Auditors’ Report 75 Consolidated Financial Statements 150 Information to our Shareholders 152 Excerpt from the AB InBev NV
Separate (Non-Consolidated) Financial Statements Prepared in Accordance with Belgian GAAP
154 Glossary
48 / 49Anheuser-Busch InBev
Annual Report 2013
7/ Financial Report
Management ReportAnheuser-Busch InBev is a publicly traded company (Euronext: ABI) based in Leuven, Belgium, with American Depositary Receipts on the New York Stock Exchange (NYSE: BUD). It is the leading global brewer, one of the world’s top five consumer products companies and recognized as first in the beverage industry on FORTUNE Magazine’s “World’s Most Admired” companies list. Beer, the original social network, has been bringing people together for thousands of years and the company’s portfolio of well over 200 beer brands continues to forge strong connections with consumers. This includes global brands Budweiser®, Corona® and Stella Artois®; international brands Beck’s®, Leffe® and Hoegaarden®; and local champions Bud Light®, Skol®, Brahma®, Antarctica®, Quilmes®, Victoria®, Modelo Especial® Michelob Ultra®, Harbin®, Sedrin®, Klinskoye®, Sibirskaya Korona®, Chernigivske®, and Jupiler®. Anheuser-Busch InBev’s dedication to heritage and quality originates from the Den Hoorn brewery in Leuven, Belgium dating back to 1366 and the pioneering spirit of the Anheuser & Co brewery, with origins in St. Louis, USA since 1852. Geographically diversified with a balanced exposure to developed and developing markets, Anheuser Busch InBev leverages the collective strengths of its more than 150 000 employees based in 24 countries worldwide. In 2013, AB InBev realized 43.2 billion US dollar revenue. The company strives to be the Best Beer Company in a Better World.
The following management report should be read in conjunction with Anheuser-Busch InBev’s audited consolidated financial statements.
In the rest of this document we refer to Anheuser-Busch InBev as “AB InBev” or “the company”.
AB INBEV AND GRUPO MODELO COMBINATION On 4 June 2013, AB InBev announced the completion of its combination with Grupo Modelo in a transaction valued at 20.1 billion US dollar.
The combination was a natural next step given AB InBev’s economic stake of more than 50% in Grupo Modelo prior to the transaction and the successful long-term partnership between the two companies. The combined company benefits from the significant growth potential that Modelo brands such as Corona have globally outside of the US, as well as locally in Mexico, where there will also be opportunities to introduce AB InBev brands through Modelo’s distribution network. The combined company leads the global beer industry with roughly 400 million hectoliters of beer volume annually.
The combination was completed through a series of steps that simplified Grupo Modelo’s corporate structure, followed by an all-cash tender offer by AB InBev for all outstanding Grupo Modelo shares that it did not own at that time for 9.15 US dollar per share. By 4 June 2013 and following the settlement of the tender offer, AB InBev owned approximately 95% of Grupo Modelo’s outstanding shares. AB InBev established and funded a Trust to accept further tender of shares by Grupo Modelo shareholders at a price of 9.15 US dollar per share over a period of up to 25 months from the completion of the combination. As of 31 December 2013, AB InBev owned approximately 96% of Grupo Modelo’s outstanding shares.
Grupo Modelo’s results are fully consolidated in AB InBev’s result as from 4 June 2013. On 7 June 2013, in a transaction related to the combination of AB InBev and Grupo Modelo, Grupo Modelo completed the sale of its US business to Constellation Brands, Inc. for approximately 4.75 billion US dollar, in aggregate, subject to a post-closing adjustment. The transaction included the sale of Grupo Modelo’s Piedras Negras brewery, Grupo Modelo’s 50% stake in Crown Imports and perpetual rights to certain of Grupo Modelo’s brands in the US.
In a transaction related to the combination with Grupo Modelo, select Grupo Modelo shareholders committed, upon tender of their shares, to acquire the equivalent of approximately 23.1 million AB InBev shares, to be delivered within five years via a deferred share instrument, for a consideration of approximately 1.5 billion US dollar. This investment occurred on 5 June 2013.
In June 2013, AB InBev fully repaid the portion of the 14.0 billion US dollar 2012 Facilities Agreement that was drawn for the combination with Grupo Modelo and terminated the 14.0 billion US dollar 2012 Facilities Agreement.
Given the transformational nature of the transaction with Grupo Modelo, and to facilitate the understanding of AB InBev’s underlying performance, AB InBev has updated its 2012 segment reporting for purposes of result announcement and internal review by senior management. This presentation (referred to as the “2012 Reference base”) includes, for comparative purposes, the results of the Grupo Modelo business as if the combination had taken place on 4 June 2012.
AMBEV STOCK SWAP MERGER On 7 December 2012, Companhia de Bebidas das Américas – Ambev (“Ambev”), a majority-owned subsidiary of AB InBev, announced its intention to propose for deliberation by its shareholders, at an extraordinary general shareholders’ meeting, a corporate restructuring to combine Ambev’s dual-class capital structure comprised of voting common and non-voting preferred shares into a new, single-class capital structure comprised exclusively of voting common shares. The purpose of the proposed corporate restructuring was to simplify Ambev’s corporate structure and improve its corporate governance with a view to increasing liquidity to all Ambev shareholders, eliminating certain administrative, financial and other costs and providing more flexibility for management of Ambev’s capital structure.

50 / 51Anheuser-Busch InBev
Annual Report 2013
The extraordinary general shareholders’ meeting was held on 30 July 2013, and the proposed corporate restructuring was approved. The restructuring was implemented on 2 January 2014 by means of a stock swap merger under the Brazilian Corporate Law (incorporação de ações) of Ambev with Ambev S.A., a non-reporting Brazilian corporation prior to the merger (the “Ambev Stock Swap Merger”).
On 31 December 2013, AB InBev owned, indirectly, 100% of the shares of Ambev S.A. and Ambev S.A. was the direct controlling shareholder of Ambev, holding 74.0% and 46.3% of the Ambev common shares and preferred shares, respectively. As a result thereof, AB InBev had a 61.9% indirect economic interest in Ambev and 74.0% indirect voting interest in Ambev at that date.
On 2 January 2014, per the terms of the Ambev Stock Swap Merger, all the issued and outstanding shares of Ambev not held by Ambev S.A. were exchanged for newly-issued common shares of Ambev S.A. Upon consummation, Ambev became a wholly-owned subsidiary of Ambev S.A. AB InBev retains an unchanged indirect 61.9% economic interest in Ambev and its indirect voting interest in Ambev was reduced to 61.9%.
ORIENTAL BREWERY ACQUISITIONOn 20 January 2014, AB InBev announced that it had entered into an agreement to reacquire Oriental Brewery (“OB”), the leading brewery in South Korea, from KKR and Afinity for 5.8 billion US dollar.
This agreement returns OB to the AB InBev portfolio, after AB InBev sold the company in July 2009, following the combination of InBev and Anheuser-Busch, in support of the company’s deleveraging commitment. AB InBev will reacquire OB earlier than July 2014, as it was originally entitled to under the 2009 transaction. As a result of an agreement entered into with KKR and Affinity in 2009, AB InBev will also receive approximately 320m US dollar in cash at closing from this transaction, subject to closing adjustments according to the terms of the transaction.
The re-integration of OB into AB InBev’s global platform is expected to generate benefits from a variety of sources, including maximizing OB and AB InBev’s portfolios of leading beer brands to drive premium growth and realizing improved efficiencies from sharing best practices between OB and AB InBev. AB InBev’s global platform also offers opportunities to export OB brands more widely.
The transaction is subject to regulatory approval in South Korea as well as other customary closing conditions, and is expected to close in the first half of 2014.

7/ Financial Report
Selected Financial Figures
To facilitate the understanding of AB InBev’s underlying performance, the comments in this management report, unless otherwise indicated, are based on organic and normalized numbers. “Organic” means the financials are analyzed eliminating the impact of changes in currencies on translation of foreign operations, and scopes. Scopes represent the impact of acquisitions and divestitures, the start-up or termination of activities or the transfer of activities between segments, curtailment gains and losses and year-over-year changes in accounting estimates and other assumptions that management does not consider part of the underlying performance of the business.
To facilitate the understanding of AB InBev’s underlying performance the company is presenting in this management report the 2012 consolidated volumes and results up to Normalized EBIT on a 2012 Reference base and as such these financials are included in the organic growth calculation. The 2012 Reference base includes, for comparative purposes, the results of the Grupo Modelo business as if the combination had taken place on 4 June 2012. The 2012 Reference base also reflects the effects of retrospective application on the revised IAS 19 - Employee Benefits (see Note 3 Summary of significant accounting policies) and the transfer of management responsibility for Ecuador and Peru to the Zone Latin America South. These countries were previously reported within the Zone Latin America North, thus with no impact at the consolidated level.
The tables in this management report provide the segment information per zone for the period ended 31 December 2013 and 2012 in the format up to Normalized EBIT level that is used by management to monitor performance. The differences between the 2012 Reference base and the 2012 income statement as Reported represent the effect of the combination with Grupo Modelo and the changes resulting from revised IAS19 - Employee Benefits. The profit, cash flow and balance sheet are presented as Reported in 2012, adjusted to reflect the effects of retrospective application on the revised IAS 19 Employee Benefits (see Note 3 Summary of significant accounting policies).
Whenever used in this report, the term “normalized” refers to performance measures (EBITDA, EBIT, Profit, EPS, effective tax rate) before non-recurring items. Non-recurring items are either income or expenses which do not occur regularly as part of the normal activities of the company. They are presented separately because they are important for the understanding of the underlying sustainable performance of the company due to their size or nature. Normalized measures are additional measures used by management, and should not replace the measures determined in accordance with IFRS as an indicator of the company’s performance, but rather should be used in conjunction with the most directly comparable IFRS measures.
The tables below set out the components of AB InBev’s operating income and operating expenses, as well as the key cash flow figures.
20122012 Reference
MillionUSdollar 2013 % Reported1 % base %
Revenue2 43195 100% 39758 100% 42927 100%Cost of sales (17 594) 41% (16 422) 41% (17 754) 41%
Grossprofit 25601 59% 23336 59% 25173 59%Distribution expenses (4 061) 9% (3 787) 10% (4 082) 10%Sales and marketing expenses (5 958) 14% (5 254) 13% (5 803) 14%Administrative expenses (2 539) 6% (2 200) 6% (2 544) 6%Other operating income/(expenses) 1 160 3% 684 2% 793 2%
Normalizedprofitfromoperations(NormalizedEBIT) 14203 33% 12779 32% 13537 32%Non-recurring items 6 240 14% (32) – 111 –
Profitfromoperations(EBIT) 20443 47% 12747 32% 13648 32%
Depreciation,amortizationandimpairment 2985 7% 2746 7% 2943 7%NormalizedEBITDA 17188 40% 15525 39% 16480 38%EBITDA 23428 54% 15493 39% 16590 39%
NormalizedprofitattributabletoequityholdersofABInBev 7936 18% 7201 18% 7271 17%ProfitattributabletoequityholdersofAB InBev 14394 33% 7160 18% 7374 17%
12012 as Reported, adjusted to reflect the effects of retrospective application on the revised IAS 19 Employee Benefits (see Note 3 Summary of significant accounting policies).2Turnover less excise taxes. In many jurisdictions, excise taxes make up a large proportion of the cost of beer charged to the company’s customers.

52 / 53Anheuser-Busch InBev
Annual Report 2013
MillionUSdollar 2013 20121
Operating activitiesProfit 16 518 9 325Revaluation of initial investment in Grupo Modelo (6 415) –Interest, taxes and non-cash items included in profit 7 135 6 403
Cashflowfromoperatingactivitiesbeforechangesinworkingcapitalanduseofprovisions 17238 15728Change in working capital 866 1 099Pension contributions and use of provisions (653) (621)Interest and taxes (paid)/received (4 193) (3 658)Dividends received 606 720
Cashflowfromoperatingactivities 13864 13268
Investing activitiesNet capex (3 612) (3 089)Acquisition and sale of subsidiaries, net of cash acquired/disposed of (17 397) (1 412)Proceeds from the sale of/(investments in) short-term debt securities 6 707 (6 702)Proceeds from the sale of assets held for sale 4 002 (3)Other 19 (135)
Cashflowfrominvestingactivities (10281) (11341)
Financing activitiesDividends paid (6 253) (3 632)Net (payments on)/proceeds from borrowings 4 458 3 649Net proceeds from the issue of share capital 73 102Cash received for deferred shares instrument 1 500 –Other (including net finance cost other than interest) 563 43
Cashflowfromfinancingactivities 341 162
Netincrease/(decrease)incashandcashequivalents 3924 2089
12012 as Reported, adjusted to reflect the effects of retrospective application on the revised IAS 19 Employee Benefits (see Note 3 Summary of significant accounting policies).

7/ Financial Report
Financial Performance
The tables in this management report provide the segment information per zone for the period ended 31 December 2013 and 2012 in the format up to Normalized EBIT level that is used by management to monitor performance. To facilitate the understanding of AB InBev’s underlying performance the company is presenting in this management report the 2012 consolidated volumes and results up to Normalized EBIT on a 2012 Reference base and as such these financials are included in the organic growth calculation.
The profit, cash flow and balance sheet are presented as Reported in 2012, adjusted to reflect the effects of retrospective application on the revised IAS 19 Employee Benefits (see Note 3 Summary of significant accounting policies).
Both from an accounting and managerial perspective, AB InBev is organized along eight business segments, which includes the Global Export and Holding business as the eighth segment. Upon the combination with Grupo Modelo, the Grupo Modelo businesses are reported according to their geographical presence in the following segments: the Mexico beer and packaging businesses are reported in the new Zone Mexico, the Spanish business is reported in the Zone Western Europe and the Export business is reported in the Global Export and Holding Companies segment.
The tables below provide a summary of the performance of AB InBev (in million US dollar, except volumes in thousand hectoliters) and the related comments are based on organic numbers.
2012Reference Currency Organic Organic
AB INBEVWORLDWIDE base Scope1 translation growth 2013 growth%
Volumes (thousand hectoliters) 430 821 3 770 – (8 652) 425 939 (2.0)%Revenue 42 927 212 (1 373) 1 428 43 195 3.3%Cost of sales (17 754) (105) 429 (165) (17 594) (0.9)%Gross profit 25 173 108 (943) 1 263 25 601 5.0%Distribution expenses (4 082) 9 173 (160) (4 061) (3.9)%Sales and marketing expenses (5 803) (19) 123 (259) (5 958) (4.5)%Administrative expenses (2 544) (5) 47 (37) (2 539) (1.5)%Other operating income/(expenses) 793 – (82) 450 1 160 56.8%Normalized EBIT 13 537 92 (682) 1 256 14 203 9.3%Normalized EBITDA 16 480 122 (753) 1 340 17 188 8.1%Normalized EBITDA margin 38.4% 39.8% 179 bps
In 2013 AB InBev delivered EBITDA growth of 8.1%, while its EBITDA margin increased 179 bps, reaching 39.8%.
Consolidated volumes decreased 2.0%, with own beer volumes decreasing 2.0% and non-beer volumes decreasing 2.2%. Focus Brands volumes declined by 0.9%, driven by challenging macro-economic conditions in a number of the company’s markets. The company’s global brands grew by 4.7% in 2013, led by growth in Budweiser and Corona.
Consolidated revenue grew 3.3% to 43 195m US dollar, with revenue per hectoliter growth of 5.8% on a constant geographic basis (i.e. eliminating the impact of faster growth in countries with lower revenue per hectoliter), resulting from favorable brand mix and revenue management best practices.
Consolidated Cost of Sales (CoS) increased 0.9%. On a constant geographic basis, CoS per hectoliter increased 4.3%.
1See Glossary.

54 / 55Anheuser-Busch InBev
Annual Report 2013
Volumes
The table below summarizes the volume evolution per zone and the related comments are based on organic numbers. Volumes include not only brands that AB InBev owns or licenses, but also third party brands that the company brews as a subcontractor and third party products that it sells through AB InBev’s distribution network, particularly in Western Europe. Volumes sold by the Global Export business are shown separately.
2012Reference Organic Organic
Thousandhectoliters base Scope growth 2013 growth%
North America 125 139 275 (3 299) 122 116 (2.6)%Mexico 23 038 – (672) 22 366 (2.9)%Latin America North 122 382 795 (4 049) 119 128 (3.3)%Latin America South 38 097 – (1 179) 36 918 (3.1)%Western Europe 29 634 – (1 249) 28 385 (4.2)%Central and Eastern Europe 22 785 – (3 600) 19 185 (15.8)%Asia Pacific 57 667 2 923 5 197 65 787 9.0%Global Export and Holding Companies 12 079 (223) 198 12 054 1.7%
ABInBevWorldwide 430821 3770 (8652) 425939 (2.0)%
North America total volumes decreased 2.6%. The company estimates that industry beer sales-to-retailers adjusted for the number of selling days declined by 1.8%. The company’s shipment volumes in the United States declined 2.7% and domestic United States beer sales-to-retailers adjusted for the number of selling days declined by 2.9%. The decline is mainly due to pressure on consumer disposable income. The company estimates its U.S. market share declined, mainly due to the mix shift to the high end, where the company under index versus the industry. The company estimates that Budweiser and Bud Light families lost market share, despite strong performances from line extensions. The company estimates that the Rita’s family, Budweiser Black Crown, Michelob Ultra, Shock Top, Stella Artois and other company’s high end brands gained market share in 2013.
In Canada, beer volumes decreased by 2.3% due to industry decline as a result of higher taxes and pressure on consumer disposable income. The company estimates that its market share was down, with a strong performance by Bud Light which grew both volume and share.
Mexico total volumes declined 2.9%, with company’s own volumes down 2.0% for the full 12 months of 2013, as the Mexican beer industry volumes were impacted by a soft economy and severe weather in September 2013. The announcement of direct and indirect tax increases, with effect from the beginning of 2014, also had a negative impact on consumer confidence towards the end of the year. The company estimates that market share was 58.4%, an improvement from historical levels of 58.0%. The Corona family and Bud Light both performed well during 2013.
Latin America North volumes decreased 3.3%, with beer volumes and soft drinks down 3.9% and 1.7%, respectively. In Brazil, beer volumes declined by 4.3%. The beer industry faced a challenging year, driven mainly by poor weather and high food inflation putting pressure on consumer disposable income. The company estimates that Brazil beer industry volumes declined by 3.5% in 2013. The company estimates that its market share declined in 2013, ending the year with an average estimated market share of 67.9%, while premium brands continued to grow ahead of the rest of the company’s portfolio.
Latin America South total volumes decreased 3.1%, with beer and non-beer volumes declining 2.8% and 3.5%, respectively. In Argentina, beer volumes decreased by 1.9%, as a result of a difficult economic environment in 2013 with high inflationary pressure. However, the company estimates that strong performances of Stella Artois and Brahma led to continued market share growth.
Western Europe own beer volumes declined 4.3%, while total volumes declined 4.2%. Own beer volumes in Belgium declined 3.0%, mainly driven by a weak weather-related industry performance in the first half of the year. In Germany, own beer volumes decreased 7.1%, as a result of a weak industry and market share decline due to a challenging pricing environment. In the United Kingdom, own product volumes declined 3.0%.
Central and Eastern Europe volumes decreased 15.8%. In Russia, beer volumes declined 13.6%, driven by industry weakness following significant regulatory changes, and market share loss in the value segment in line with the company’s premiumization strategy.
In Ukraine, beer volumes declined 18.9%, impacted by a volume decline of 41.3% during the fourth quarter 2013, with the instability in the country significantly impacting beer consumption.
AsiaPacific volumes grew by 9.0%. In China, beer volumes grew by 8.9%, driven by estimated industry growth and market share gains, as a result of strong organic volume growth driven by the company’s Focus Brands strategy, and geographic expansion.
7/ Financial Report
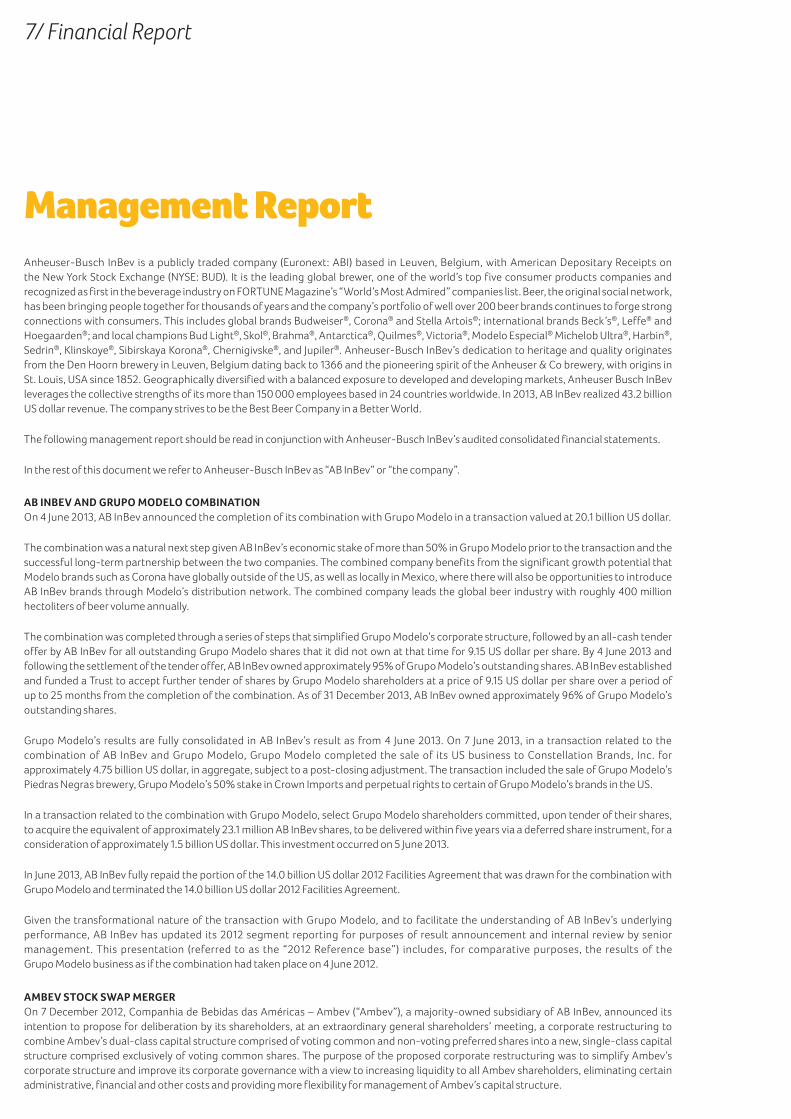
Operating activities by zone
The tables below provide a summary of the performance of each geographical zone (in million US dollar, except volumes in thousand hectoliters) and the related comments are based on organic numbers.
2012Reference Currency Organic Organic
AB INBEVWORLDWIDE base Scope translation growth 2013 growth%
Volumes 430 821 3 770 – (8 652) 425 939 (2.0)%Revenue 42 927 212 (1 373) 1 428 43 195 3.3%Cost of sales (17 754) (105) 429 (165) (17 594) (0.9)%Gross profit 25 173 108 (943) 1 263 25 601 5.0%Distribution expenses (4 082) 9 173 (160) (4 061) (3.9)%Sales and marketing expenses (5 803) (19) 123 (259) (5 958) (4.5)%Administrative expenses (2 544) (5) 47 (37) (2 539) (1.5)%Other operating income/(expenses) 793 – (82) 450 1 160 56.8%Normalized EBIT 13 537 92 (682) 1 256 14 203 9.3%Normalized EBITDA 16 480 122 (753) 1 340 17 188 8.1%Normalized EBITDA margin 38.4% 39.8% 179 bps
2012Reference Currency Organic Organic
NORTH AMERICA base Scope translation growth 2013 growth%
Volumes 125 139 275 – (3 299) 122 116 (2.6)%Revenue 16 028 6 (58) 48 16 023 0.3%Cost of sales (6 615) (17) 13 100 (6 519) 1.5%Gross profit 9 412 (11) (45) 148 9 504 1.6%Distribution expenses (1 319) 23 10 51 (1 235) 3.9%Sales and marketing expenses (1 794) (22) 7 (99) (1 908) (5.5)%Administrative expenses (452) – 2 (47) (497) (10.5)%Other operating income/(expenses) 64 – – 3 67 5.1%Normalized EBIT 5 911 (10) (25) 56 5 932 0.9%Normalized EBITDA 6 735 (10) (28) 30 6 728 0.4%Normalized EBITDA margin 42.0% 42.0% 6 bps
2012Reference Currency Organic Organic
MEXICO base Scope translation growth 2013 growth%
Volumes 23 038 – – (672) 22 366 (2.9)%Revenue 2 616 – 76 76 2 769 2.9%Cost of sales (1 014) 12 (24) 157 (869) 15.5%Gross profit 1 602 12 52 233 1 900 14.6%Distribution expenses (270) 9 (7) 36 (232) 13.3%Sales and marketing expenses (515) 13 (14) 31 (484) 6.1%Administrative expenses (338) 15 (7) 96 (234) 28.4%Other operating income/(expenses) 102 1 3 (2) 104 (1.8)%Normalized EBIT 582 50 28 395 1 054 67.9%Normalized EBITDA 777 50 34 420 1 281 54.0%Normalized EBITDA margin 29.7% 46.3% 1 475 bps

56 / 57Anheuser-Busch InBev
Annual Report 2013
2012Reference Currency Organic Organic
LATIN AMERICA NORTH base Scope translation growth 2013 growth%
Volumes 122 382 795 – (4 049) 119 128 (3.3)%Revenue 11 268 131 (1 130) 608 10 877 5.4%Cost of sales (3 519) (49) 358 (283) (3 494) (8.0)%Gross profit 7 748 82 (772) 325 7 383 4.2%Distribution expenses (1 277) (14) 139 (186) (1 338) (14.6)%Sales and marketing expenses (1 204) (14) 118 (45) (1 145) (3.7)%Administrative expenses (612) (7) 60 (30) (589) (4.9)%Other operating income/(expenses) 426 (2) (87) 470 807 –Normalized EBIT 5 081 45 (542) 534 5 118 10.5%Normalized EBITDA 5 787 60 (614) 585 5 819 10.1%Normalized EBITDA margin 51.4% 53.5% 230 bps
2012Reference Currency Organic Organic
LATIN AMERICA SOUTH base Scope translation growth 2013 growth%
Volumes 38 097 – – (1 179) 36 918 (3.1)%Revenue 3 209 – (392) 451 3 269 14.1%Cost of sales (1 244) – 144 (85) (1 185) (6.8)%Gross profit 1 966 – (248) 367 2 084 18.7%Distribution expenses (296) – 43 (56) (309) (18.9)%Sales and marketing expenses (336) – 40 (49) (346) (14.7)%Administrative expenses (108) – 10 (13) (112) (12.4)%Other operating income/(expenses) 4 – (1) (8) (5) –Normalized EBIT 1 228 – (157) 239 1 311 19.5%Normalized EBITDA 1 419 – (175) 247 1 491 17.4%
Normalized EBITDA margin 44.2% 45.6% 130 bps
2012Reference Currency Organic Organic
WESTERN EUROPE base Scope translation growth 2013 growth%
Volumes 29 634 – – (1 249) 28 385 (4.2)%Revenue 3 650 – 56 (85) 3 620 (2.3)%Cost of sales (1 555) – (20) 30 (1 544) 2.0%Gross profit 2 095 – 36 (55) 2 076 (2.6)%Distribution expenses (369) – (7) 11 (364) 3.1%Sales and marketing expenses (663) – (11) 1 (673) 0.1%Administrative expenses (259) – (5) – (264) 0.1%Other operating income/(expenses) 24 – – 3 27 14.2%Normalized EBIT 827 – 14 (39) 801 (4.8)%Normalized EBITDA 1 163 – 20 (58) 1 125 (5.0)%Normalized EBITDA margin 31.9% 31.1% (86) bps
2012Reference Currency Organic Organic
CENTRAL AND EASTERN EUROPE base Scope translation growth 2013 growth%
Volumes 22 785 – – (3 600) 19 185 (15.8)%Revenue 1 668 – (25) (198) 1 445 (11.9)%Cost of sales (914) – 12 125 (776) 13.7%Gross profit 754 – (12) (73) 669 (9.6)%Distribution expenses (184) – 3 35 (146) 19.1%Sales and marketing expenses (400) – 7 15 (378) 3.8%Administrative expenses (113) – 2 14 (98) 12.4%Other operating income/(expenses) 5 – – (2) 3 (36.2)%Normalized EBIT 62 – (1) (10) 51 (16.2)%Normalized EBITDA 257 – (4) (28) 225 (11.1)%Normalized EBITDA margin 15.4% 15.5% 14 bps

7/ Financial Report
2012Reference Currency Organic Organic
ASIA PACIFIC base Scope translation growth 2013 growth%
Volumes 57 667 2 923 – 5 197 65 787 9.0%Revenue 2 690 102 79 483 3 354 17.9%Cost of sales (1 565) (64) (43) (213) (1 885) (13.6)%Gross profit 1 125 38 36 270 1 469 24.0%Distribution expenses (235) (13) (7) (47) (302) (19.8)%Sales and marketing expenses (670) (15) (20) (127) (833) (18.9)%Administrative expenses (274) (12) (7) (23) (317) (8.3)%Other operating income/(expenses) 121 1 3 (16) 109 (12.9)%Normalized EBIT 67 (2) 4 58 127 86.3%Normalized EBITDA 396 13 14 124 546 31.5%Normalized EBITDA margin 14.7% 16.3% 169 bps
2012Reference Currency Organic Organic
GLOBAL EXPORT AND HOLDING COMPANIES base Scope translation growth 2013 growth%
Volumes 12 079 (223) – 198 12 054 1.7%Revenue 1 798 (26) 22 45 1 839 2.5%Cost of sales (1 328) 12 (10) 3 (1 323) 0.2%Gross profit 471 (13) 11 48 516 10.4%Distribution expenses (132) 4 (2) (5) (135) (3.9)%Sales and marketing expenses (220) 19 (4) 14 (191) 6.9%Administrative expenses (386) – (8) (34) (429) (8.9)%Other operating income/(expenses) 47 – 1 1 48 1.7%Normalized EBIT (221) 9 (3) 23 (191) 10.9%
Normalized EBITDA (54) 9 – 20 (25) 44.0%
Revenue
Consolidated revenue grew 3.3% to 43 195m US dollar, with revenue per hectoliter growth of 5.8% on a constant geographic basis (i.e. eliminating the impact of faster growth in countries with lower revenue per hectoliter), resulting from favorable brand mix and revenue management best practices.
Cost of Sales
Cost of Sales (CoS) increased 0.9%. On a constant geographic basis, CoS per hectoliter increased 4.3%, driven by higher commodity costs and the transactional impact of foreign exchange in Brazil, partially offset by cost synergies from the implementation of best practices and procurement initiatives in Mexico.
Operating expenses
Total operating expenses increased 0.1% in 2013:• Distribution expenses increased 3.9% in 2013, with lower distribution expenses in the United States and the capture of cost
synergies in Mexico, offset by increased own distribution in Brazil, higher labor and transportation expenses in Argentina, and geographic expansion in China.
• Sales andmarketing expenses increased 4.5% in 2013, with higher investments behind AB InBev brands and innovations. • Administrative expenses increased by 1.5%. • Other operating income was 1 160m US dollar in 2013 compared to 793m US dollar in 2012, mainly due to government incentives
linked to the company’s investments in Brazil, and a one-time gain in Brazil of 143m US dollar, recorded in the fourth quarter 2013, related to the recovery of restricted funds.
Normalized profit from operations before depreciation and amortization (Normalized EBITDA)
Normalized EBITDA increased 4.3% in nominal terms and increased 8.1% organically to 17 188m US dollar, with an EBITDA margin of 39.8%, an organic growth of 179 bps.• North America EBITDA increased 0.4% to 6 728m US dollar, with a margin expansion of 6 bps to 42.0%, as a result of revenue per hl growth
and lower distribution expenses offset by higher sales and marketing investments, as well as higher administrative expenses related to variable compensation accruals.

58 / 59Anheuser-Busch InBev
Annual Report 2013
• Mexico EBITDA grew by 54.0% to 1 281m USD, with an EBITDA margin enhancement of 1 475 bps to 46.3%, reflecting the capture of costs synergies from the implementation of manufacturing best practices, procurement initiatives and overhead reductions.
• Latin America North EBITDA rose 10.1% to 5 819m US dollar, with margin expansion of 230 bps to 53.5%, with revenue per hectoliter growth and a one-time gain, recorded in other operating income, related to the recovery of restricted funds, partially offset by higher CoS linked to unfavorable foreign exchange transaction impact, unfavorable package mix and higher depreciation, as well as higher distribution expenses.
• Latin America South EBITDA grew 17.4% to 1 491m US dollar, with margin growth of 130 bps to 45.6%, driven by revenue growth partially offset by high cost inflation.
• Western Europe EBITDA decreased 5.0% to 1 125m US dollar with margin contraction of 86 bps to 31.1%, mainly due to volume decline. • Central and Eastern Europe EBITDA decreased 11.1% to 225m US dollar with margin growth of 14 bps to 15.5%, due to the weak industry
performance during the year.• Asia Pacific EBITDA grew 31.5% to 546m US dollar, mainly driven by revenue per hectoliter growth and improved operating leverage.• Global Export and Holding Companies reported EBITDA of (25)m US dollar in 2013 (2012: (54)m US dollar).
Reconciliation between Normalized EBITDA and profit attributable to equity holders
Normalized EBITDA and EBIT are measures utilized by AB InBev to demonstrate the company’s underlying performance.
Normalized EBITDA is calculated excluding the following effects from profit attributable to equity holders of AB InBev: (i) Non-controlling interest, (ii) Income tax expense, (iii) Share of results of associates, (iv) Net finance cost, (v) Non-recurring net finance cost, (vi) Non-recurring items above EBIT (including non-recurring impairment) and (vii) Depreciation, amortization and impairment.
Normalized EBITDA and EBIT are not accounting measures under IFRS accounting and should not be considered as an alternative to Profit attributable to equity holders as a measure of operational performance or as an alternative to cash flow as a measure of liquidity. Normalized EBITDA and EBIT do not have a standard calculation method and AB InBev’s definition of normalized EBITDA and EBIT may not be comparable to that of other companies.
MillionUSdollar Notes 2013 20121
ProfitattributabletoequityholdersofABInBev 14394 7160Non-controlling interest 2 124 2 165Profit 16518 9325Income tax expense 12 2 016 1 680Share of result of associates 16 (294) (624)Non-recurring net finance cost 11 (283) 18Net finance cost 11 2 486 2 348Non-recurring items above EBIT (including non-recurring impairment) 8 (6 240) 32NormalizedEBIT 14203 12779Depreciation, amortization and impairment 2 985 2 746NormalizedEBITDA 17188 15525
Non-recurring items are either income or expenses which do not occur regularly as part of the normal activities of the company. They are presented separately because they are important for the understanding of the underlying sustainable performance of the company due to their size or nature. Details on the nature of the non-recurring items are disclosed in Note 8 Non-recurring items.
Impact of foreign currencies
Foreign currency exchange rates have a significant impact on AB InBev’s financial statements. The following table sets forth the percentage of its revenue realized by currency for the years ended 31 December 2013 and 2012:
20122013 Referencebase
US dollar 35.3% 35.4%Brazilian real 23.8% 25.1%Mexican peso 7.9% 7.5%Chinese yuan 7.7% 6.2%Euro 6.4% 6.5%Canadian dollar 4.6% 4.8%Argentinean peso 4.6% 4.5%Russian ruble 2.4% 2.7%
Other 7.3% 7.3%
12012 as Reported, adjusted to reflect the effects of retrospective application on the revised IAS 19 Employee Benefits (see Note 3 Summary of significant accounting policies).

7/ Financial Report
The following table sets forth the percentage of its normalized EBITDA realized by currency for the periods ended 31 December 2013 and 2012:
20122013 Referencebase
US dollar 34.8% 35.7%Brazilian real 32.8% 34.4%Mexican peso 8.7% 5.9%Argentinean peso 5.1% 5.0%Canadian dollar 4.9% 5.4%Euro 3.5% 4.0%Chinese yuan 3.3% 2.4%Russian ruble 0.9% 0.9%Other 6.0% 6.3%
In 2013, the fluctuation of the foreign currency rates had a negative translation impact of (1 373)m US dollar on AB InBev’s revenue (2012: negative impact of (2 421)m US dollar on a reported basis), of (753)m US dollar on its normalized EBITDA (2012: negative impact of (1 176)m US dollar on a reported basis) and of (682)m US dollar on its normalized EBIT (2012: negative impact of (1 015)m US dollar on a reported basis).
AB InBev’s profit (after tax) has been negatively affected by the fluctuation of foreign currencies for (389)m US dollar (2012: negative impact of (950)m US dollar on a reported basis), while the negative translation impact on its EPS base (profit attributable to equity holders of AB InBev) was (167)m US dollar or (0.10) US dollar per share (2012: negative impact of (648)m US dollar or (0.40) US dollar per share on a reported basis).
The impact of the fluctuation of the foreign currencies on AB InBev’s net debt amounted to 606m US dollar (increase of net debt) in 2013, as compared to an impact of 494m US dollar (increase of net debt) in 2012. The impact of the fluctuation of the foreign currencies on the equity attributable to the equity holders of AB InBev amounted to (3 109)m US dollar (decrease of equity), as compared to an impact of (271)m US dollar (decrease of equity) in 2012 on a reported basis.
Profit
Normalized profit attributable to equity holders of AB InBev was 7 936m US dollar (normalized EPS 4.91 US dollar) in 2013, compared to 7 201m US dollar1 (normalized EPS 4.50 US dollar1) in 2012 - see Note 23 Changes in equity and earnings per share for more details. Profit attributable to equity holders of AB InBev for 2013 was 14 394m US dollar, compared to 7 160m US dollar1 for 2012 and includes the following impacts: • Net finance costs (excluding non-recurring net finance costs): 2 486m US dollar in 2013 compares to 2 348m US dollar1 in 2012. Other financial
results for 2013 of (251)m US dollar includes 456m US dollar gains from derivatives related to the hedging of the company’s share-based payment programs. In 2012, other financial results of (116)m US dollar included a gain of 372m US dollar from such derivative contracts. These gains are offset by negative currency results and the payment of bank fees and taxes in the normal course of business.
• Non-recurring net finance costs: 283m US dollar 2013 compared to (18) m US dollar in 2012. Non-recurring net finance costs include (101)m US dollar commitment and utilization fees incurred for the 2012 Facility agreement entered into to fund the Grupo Modelo combination. These costs were offset by mark-to market adjustments on derivative instruments entered into to hedge the deferred share instrument issued in a transaction related to the combination with Grupo Modelo. By 31 December 2013, 100% of the deferred share instrument had been hedged at an average price of approximately 68 euro per share resulting in a mark-to-market gain of 384m US dollar.
• Share of result of associates: 294m US dollar in 2013 compared to 624m US dollar in 2012 mainly attributable to the results of Grupo Modelo up to the closing of the combination on 4 June 2013.
• Income tax expense: 2 016m US dollar with an effective tax rate of 11.1% in 2013 compares with 1 680m US dollar1 with an effective tax rate of 16.2%1 in 2012. The decrease in the effective tax rate mainly results from the non-taxable nature of the non-recurring gain related to the fair value adjustment on the initial investment held in Grupo Modelo, non-taxable gains from certain derivatives related to the hedging of share-based payment programs, a shift in profit mix to countries with lower marginal tax rates, including the combination with Grupo Modelo, as well as incremental tax benefits. Excluding the effect of non-recurring items, the normalized effective tax rate was 16.6% in 2013 versus 16.1% in 2012.
• Profit attributable to non-controlling interest: 2 124m US dollar in 2013, a small decrease from 2 165m US dollar1 in 2012, as an improved operating performance in Ambev was offset by currency translation effects.
12012 as Reported, adjusted to reflect the effects of retrospective application on the revised IAS 19 Employee Benefits (see Note 3 Summary of significant accounting policies).

60 / 61Anheuser-Busch InBev
Annual Report 2013
Liquidity Position and Capital Resources
Cash Flows
MillionUSdollar 2013 2012
Cash flow from operating activities 13 864 13 268Cash flow from investing activities (10 281) (11 341)Cash flow from financing activities 341 162
Netincrease/(decrease)incashandcashequivalents 3924 2089
Cash flows from operating activities
MillionUSdollar 2013 20121
Profit 16 518 9 325Revaluation of initial investment in Grupo Modelo (6 415) –Interest, taxes and non-cash items included in profit 7 135 6 403
Cashflowfromoperatingactivitiesbeforechangesinworkingcapitalanduseofprovisions 17238 15728
Change in working capital 866 1 099Pension contributions and use of provisions (653) (621)Interest and taxes (paid)/received (4 193) (3 658)Dividends received 606 720
Cashflowfromoperatingactivities 13864 13268
AB InBev’s cash flow from operating activities reached 13 864m US dollar in 2013 compared to 13 268m US dollar in 2012. The increase mainly results from higher profit generated in 2013. The combination with Grupo Modelo resulted in approximately 400m US dollar working capital improvements by the end of 2013, from the 500m US dollar cash flow synergies expected in the first two years after the closing of the transaction and previously announced.
Cashflowfrominvestingactivities
MillionUSdollar 2013 2012
Net capex (3 612) (3 089)Acquisition and sale of subsidiaries, net of cash acquired/disposed of (17 397) (1 412)Proceeds from the sale of/(investments in) short-term debt securities 6 707 (6 702)Proceeds from the sale of assets held for sale 4 002 (3)Other 19 (135)
Cashflowfrominvestingactivities (10281) (11341)
Net cash used in investing activities was 10 281m US dollar in 2013 as compared to 11 341m US dollar in 2012. The evolution of the cash used in investment activities in 2013 is mainly explained by the combination with Grupo Modelo and the sale by Grupo Modelo of its US business to Constellation Brands. See also Note 6 Acquisitions and disposals of subsidiaries.
During 2012, AB InBev raised a series of bonds and accumulated liquidity to support the combination with Grupo Modelo. The excess liquidity was mainly invested in short-term debt securities and short-term US Treasury Bills pending the closing of the Modelo acquisition. The 2012 net cash used in investing activities is further explained by the acquisition of Cervecería Nacional Dominicana S.A. in Dominican Republic in May 2012 - see also Note 6 Acquisitions and disposals of subsidiaries.
AB InBev’s net capital expenditures amounted to 3 612m US dollar in 2013 and 3 089m US dollar in 2012. Out of the total capital expenditures of 2013 approximately 57% was used to improve the company’s production facilities while 34% was used for logistics and commercial investments. Approximately 9% was used for improving administrative capabilities and purchase of hardware and software.
12012 as Reported, adjusted to reflect the effects of retrospective application on the revised IAS 19 Employee Benefits (see Note 3 Summary of significant accounting policies).

7/ Financial Report
Cashflowfromfinancingactivities
MillionUSdollar 2013 2012
Dividends paid (6 253) (3 632)Net (payments on)/proceeds from borrowings 4 458 3 649Net proceeds from the issue of share capital 73 102Cash received for deferred shares instrument 1 500 –Other (including net finance (cost)/income other than interest) 563 43
Cashflowfromfinancingactivities 341 162
The cash inflow from AB InBev’s f inancing activities amounted to 341m US dollar in 2013, as compared to a cash inflow of 162m US dollar in 2012. The 2013 cash flow from financing activities reflects the funding of the combination with Grupo Modelo, higher dividend payments as compared to 2012 and the cash proceeds from the deferred share instruments issued in a transaction related to the combination with Grupo Modelo.
During 2012, in order to support the Modelo acquisition, AB InBev raised a series of bonds. The excess liquidity resulting from these bonds was mainly invested in short-term debt securities and short-term US Treasury Bills pending the closing of the Modelo acquisition.
AB InBev’s cash, cash equivalents and short-term investments in debt securities less bank overdrafts as of 31 December 2013 amounted to 9 956m US dollar. As of 31 December 2013, the company had total liquidity of 17 956m US dollar, which consisted of 8.0 billion US dollar available under committed long-term credit facilities and 9 956m US dollar of cash, cash equivalents and short-term investments in debt securities less bank overdrafts. Although the company may borrow such amounts to meet its liquidity needs, the company principally relies on cash flows from operating activities to fund the company’s continuing operation. AB InBev financed the Grupo Modelo combination with funds drawn under the 2012 Facilities Agreement and cash, cash equivalents and short-term investment in debt securities the company had accumulated pending the closing of the Grupo Modelo transaction. In June 2013, AB InBev fully repaid the portion of the 2012 Facilities Agreement that was drawn for the combination and terminated the 2012 Facilities Agreement.
Capital resources and equity
AB InBev’s net debt increased to 38 831m US dollar as at 31 December 2013, from 30 114m US dollar as at 31 December 2012.
Net debt is defined as non-current and current interest-bearing loans and borrowings and bank overdrafts minus debt securities and cash. Net debt is a financial performance indicator that is used by AB InBev’s management to highlight changes in the company’s overall liquidity position. The company believes that net debt is meaningful for investors as it is one of the primary measures AB InBev’s management uses when evaluating its progress towards deleveraging.
Apart from operating results net of capital expenditures, the net debt is mainly impacted by the payment associated with the Modelo combination net of the cash acquired and the proceeds from the sales to Constellation (13.0 billion US dollar), the proceeds from the deferred share instruments (1.5 billion US dollar), dividend payments to shareholders of AB InBev and Ambev (6.3 billion US dollar), the payment of interests and taxes (4.2 billion US dollar) and the impact of changes in foreign exchange rates (606m US dollar increase of net debt).
Net debt to normalized EBITDA increased from 1.94x on a reported basis for the 12-month period ending 31 December 2012 to 2.26x on a reported basis for the 12-month period ending 31 December 2013 (January 2013 - December 2013 as Reported) and 2.16x on an amended basis for the 12-month period ending 31 December 2013, incorporating the Reference base EBITDA of the Grupo Modelo combination from 1 January 2013 until December 2013.
Consolidated equity attributable to equity holders of AB InBev as at 31 December 2013 was 50 365m US dollar, compared to 41 154m US dollar1 as at 31 December 2012. The combined effect of the weakening of mainly the closing rates of the Brazilian real and the Argentinean peso, the Mexican peso and the Russian ruble and the strengthening of mainly the closing rates of the euro, the pound sterling and the Chinese yuan resulted in a foreign exchange translation adjustment of (3 109)m US dollar. Further details on equity movements can be found in the consolidated statement of changes in equity.
Further details on interest-bearing loans and borrowings, repayment schedules and liquidity risk, are disclosed in Note 24 Interest-bearing loans and borrowings and Note 29 Risks arising from financial instruments.
12012 as Reported, adjusted to reflect the effects of retrospective application on the revised IAS 19 Employee Benefits (see Note 3 Summary of significant accounting policies).

62 / 63Anheuser-Busch InBev
Annual Report 2013
Research and Development
Given its focus on innovation, AB InBev places a high value on research and development. In 2013 AB InBev spent 185m US dollar in research and development (2012: 182m US dollar). Part of this was spent in the area of market research, but the majority is related to innovation in the areas of process optimization and product development.
Research and development in process optimization is primarily aimed at capacity increase (plant debottlenecking and addressing volume issues, while minimizing capital expenditure), quality improvement and cost management. Newly developed processes, materials and/or equipment are documented in best practices and shared across business zones. Current projects range from malting to bottling of finished products.
Research and development in product innovation covers liquid, packaging and draft innovation. Product innovation consists of breakthrough innovation, incremental innovation and renovation (that is, implementation of existing technology). The main goal for the innovation process is to provide consumers with better products and experiences. This implies launching new liquid, new packaging and new draught products that deliver better performance both for the consumer and in terms of financial results, by increasing AB InBev’s competitiveness in the relevant markets. With consumers comparing products and experiences offered across very different drink categories and the offering of beverages increasing, AB InBev’s research and development efforts also require an understanding of the strengths and weaknesses of other drink categories, spotting opportunities for beer and developing consumer solutions (products) that better address consumer need and deliver better experience. This requires understanding consumer emotions and expectations. Sensory experience, premiumization, convenience, sustainability and design are all central to AB InBev’s research and development efforts.
Knowledge management and learning is also an integral part of research and development. AB InBev seeks to continuously increase its knowledge through collaborations with universities and other industries.
AB InBev’s research and development team is briefed annually on the company’s and the business zones’ priorities and approves concepts which are subsequently prioritized for development. Launch time, depending on complexity and prioritization, usually falls within the next calendar year.
The Global Innovation and Technology Center (“GITeC”), located in Leuven, accommodates the Packaging, Product, Process Development teams and facilities such as Labs, Experimental Brewery and the European Central Lab, which also includes Sensory Analysis. In addition to GITeC, AB InBev also has Product, Packaging and Process development teams located in each of the seven AB InBev geographic regions focusing on the short-term needs of such regions.
RisksandUncertainties
Under the explicit understanding that this is not an exhaustive list, AB InBev’s major risk factors and uncertainties are listed below. There may be additional risks which AB InBev is unaware of. There may also be risks AB InBev now believes to be immaterial, but which could turn out to have a material adverse effect. Moreover, if and to the extent that any of the risks described below materialize, they may occur in combination with other risks which would compound the adverse effect of such risks. The sequence in which the risk factors are presented below is not indicative of their likelihood of occurrence or of the potential magnitude of their financial consequence.
Risks relating to AB InBev and the beer and beverage industry
AB InBev relies on the reputation of its brands and its success depends on its ability to maintain and enhance the image and reputation of its existing products and to develop a favorable image and reputation for new products. An event, or series of events, that materially damages the reputation of one or more of AB InBev’s brands could have an adverse effect on the value of that brand and subsequent revenues from that brand or business. Further, any restrictions on the permissible advertising style, media and messages used or the introduction of similar restrictions may constraint AB InBev’s brand building potential and thus reduce the value of its brands and related revenues.
AB InBev may not be able to protect its current and future brands and products and defend its intellectual property rights, including trademarks, patents, domain names, trade secrets and know-how, which could have a material adverse effect on its business, results of operations, cash flows or financial condition, and in particular, on AB InBev’s ability to develop its business.
Certain of AB InBev’s operations depend on independent distributors’ or wholesalers’ efforts to sell AB InBev’s products and there can be no assurance that such distributors will not give priority to AB InBev’s competitors. Further, any inability of AB InBev to replace unproductive or inefficient distributors or any limitations imposed on AB InBev to purchase or own any interest in distributors or wholesalers as a result

7/ Financial Report
of contractual restrictions, regulatory changes, changes in legislation or the interpretations of legislation by regulators or courts could adversely impact AB InBev’s business, results of operations and financial condition.
Changes in the availability or price of raw materials, commodities, energy and water could have an adverse effect on AB InBev’s results of operations to the extent that AB InBev fails to adequately manage the risks inherent in such volatility, including if AB InBev’s hedging and derivative arrangements do not effectively or completely hedge changes in commodity prices.
AB InBev relies on key third parties, including key suppliers for a range of raw materials for beer and soft drinks, and for packaging material. The termination of or material change to arrangements with certain key suppliers or the failure of a key supplier to meet its contractual obligations could have a material impact on AB InBev’s production, distribution and sale of beer and soft drinks and have a material adverse effect on AB InBev’s business, results of operations, cash flows or financial condition. In addition, a number of key brand names are both licensed to third-party brewers and used by companies over which AB InBev does not have control. Although AB InBev monitors brewing quality to ensure its high standards, to the extent that one of these key brand names or joint ventures, investments in companies in which AB InBev does not own a controlling interest and AB InBev’s licensees are subject to negative publicity, it could have a material adverse effect on AB InBev’s business, results of operations, cash flows or financial condition.
Competition in its various markets and increased purchasing power of players in AB InBev’s distribution channels, could cause AB InBev to reduce pricing, increase capital investment, increase marketing and other expenditures, prevent AB InBev from increasing prices to recover higher cost and thereby cause AB InBev to reduce margins or lose market share. Any dilution of AB InBev’s brands as a result of competitive trends could also lead to a significant erosion of AB InBev’s profitability. Any of the foregoing could have a material adverse effect on AB InBev’s business, financial condition and results of operations. Also, innovation faces inherent risks, and the new products AB InBev introduces may not be successful, while competitors may be able to respond quicker to the emerging trends, such as the increasing consumer preference for “craft beers” produced by smaller microbreweries.
The continued consolidation of retailers in markets in which AB InBev operates could result in reduced profitability for the beer industry as a whole and indirectly adversely affect AB InBev’s financial results.
AB InBev could incur significant costs as a result of compliance with, and/or violations of or liabilities under, various regulations that govern AB InBev’s operations or the operations of its licensed third parties. Also, public concern about beer and soft drink consumption and any resulting restrictions may cause the social acceptability of beer and soft drink to decline significantly and consumption trends to shift away from these products, which would have a material adverse effect on AB InBev’s business, financial condition and results of operations.
AB InBev’s operations are subject to environmental regulations, which could expose it to significant compliance costs and litigation relating to environmental issues.
Antitrust and competition laws and changes in such laws or in the interpretation and enforcement thereof as well as being subject to regulatory scrutiny, could affect AB InBev’s business or the businesses of its subsidiaries.
In recent years, there has been an increased public and political attention directed at the alcoholic beverage and food and soft drinks industries, as a result health care concerns related to the harmful use of alcohol (including drunk driving, excessive, abusive and underage drinking) and to health concerns such as diabetes and obesity related to the overconsumption of food and soft-drinks. Negative publicity regarding AB InBev’s products and brands or publication of studies indicating a significant risk in using AB InBev’s products generally or changes in consumer perceptions in relation to AB InBev’s products could adversely affect the sale and consumption of AB InBev’s products and could harm its business, results of operations, cash flows or financial condition.
Demand for AB InBev’s products may be adversely affected by changes in consumer preferences and tastes. Consumer preferences and tastes can change in unpredictable ways. Failure by AB InBev to anticipate or respond adequately to changes in consumer preferences and tastes or to developments in new forms of media and marketing could adversely impact AB InBev’s business, results of operations and financial condition.
The beer and beverage industry may be subject to adverse changes in taxation, which makes up a large proportion of the cost of beer charged to consumers in many jurisdictions. Increases in excise and other indirect taxes applicable to AB InBev’s products tend to adversely affect AB InBev’s revenue or margins both by reducing overall consumption and by encouraging consumers to switch to other categories of beverages. Also, minimum pricing is another form of fiscal regulation that can affect AB InBev’s profitability. Furthermore, AB InBev may be subject to increased taxation by national, local or foreign authorities or higher corporate income tax rates or to new or modified taxation regulations and requirements. An increase in beer excise taxes or other taxes could adversely affect the financial results of AB InBev as well as its results of operations.

64 / 65Anheuser-Busch InBev
Annual Report 2013
Seasonal consumption cycles and adverse weather conditions in the markets in which AB InBev operates may result in fluctuations in demand for AB InBev’s products and therefore may have an adverse impact on AB InBev’s business, results of operations and financial condition.
Climate change, or legal, regulatory or market measures to address climate change could have a long-term, material adverse impact on AB InBev’s business and results of operations. Further, water scarcity or poor water quality may affect AB InBev by increasing production costs and capacity constraints, which could adversely affect AB InBev’s business and results of operations.
A substantial portion of AB InBev’s operations are carried out in emerging European, Asian and Latin American markets. AB InBev’s operations and equity investments in these markets are subject to the customary risks of operating in developing countries, which include, amongst others, political insurrection, external interference, financial risks, changes in government policy, political and economic changes, changes in the relations between the countries, actions of governmental authorities affecting trade and foreign investment, regulations on repatriation of funds, interpretation and application of local laws and regulations, enforceability of intellectual property and contract rights, local labor conditions and regulations, potential political and economic uncertainty, application of exchange controls, nationalization or expropriation, crime and lack of law enforcement as well as financial risks, which include risk of liquidity, inflation, devaluation, price volatility, currency convertibility and country default. Such emerging market risks could adversely impact AB InBev’s business, results of operations and financial condition.
Economic and political events in Argentina may adversely affect the company’s Argentinean operations. The political instability, fluctuations in the economy, governmental actions concerning the economy of Argentina, the devaluation of the Argentine peso, inflation and deteriorating macroeconomic conditions in Argentina could indeed have, and may continue to have, a material adverse effect on AB InBev’s Latin America South operations, their financial condition and their results. Also, if the economic or political situation in Argentina deteriorates, AB InBev Latin America South operations may be subject to additional restrictions under a new Argentinean foreign exchange, export repatriation or expropriation regime that could adversely affect AB InBev’s liquidity and operations, and its ability to access such funds from Argentina.
If any of AB InBev’s products is defective or found to contain contaminants, AB InBev may, despite of it having certain product liability insurance policies in place, be subject to product recalls or other liabilities, which could adversely impact its business, reputation, prospects, results of operations and financial condition.
AB InBev may not be able to obtain the necessary funding for its future capital or refinancing needs and it faces financial risks due to its level of debt and uncertain market conditions. AB InBev may be required to raise additional funds for AB InBev’s future capital needs or refinance its current indebtedness through public or private financing, strategic relationships or other arrangements and there can be no assurance that the funding, if needed, will be available on attractive terms, or at all. AB InBev has incurred substantial indebtedness by entering into several senior credit facilities and accessing the bond markets from time to time based on its financial needs. The portion of AB InBev’s consolidated balance sheet represented by debt will remain significantly higher as compared to its historical position. AB InBev’s increased level of debt could have significant adverse consequences on AB InBev, including (i) increasing its vulnerability to general adverse economic and industry conditions, (ii) limiting its flexibility in planning for, or reacting to, changes in its business and the industry in which AB InBev operates; (iii) impairing its ability to obtain additional financing in the future, (iv) requiring AB InBev to issue additional equity (potentially under unfavorable market conditions), and (v) placing AB InBev at a competitive disadvantage compared to its competitors that have less debt. AB InBev’s ability to repay and renegotiate its outstanding indebtedness will be dependent upon market conditions. Unfavorable conditions, including recent significant price volatility and liquidity disruptions in the global credit markets, as well as downward pressure on credit capacity for certain issuers without regard to those issuers’ underlying financial strength, could increase costs beyond what is currently anticipated. Such costs could have a material adverse impact on AB InBev’s cash flows, results of operations or both. Further, AB InBev reduced the amount of dividends it paid past years and may continue to restrict the amount of dividends it will pay as a result of AB InBev’s level of debt and its strategy to give priority to deleveraging. Also, a credit rating downgrade could have a material adverse effect on AB InBev’s ability to finance its ongoing operations or to refinance its existing indebtedness. In addition, a failure of AB InBev to refinance all or a substantial amount of its debt obligations when they become due, or more generally a failure to raise additional equity capital or debt financing or to realize proceeds from asset sales when needed would have a material adverse effect on its financial condition and results of operations.
AB InBev’s results could be negatively affected by increasing interest rates. Although AB InBev enters into interest rate swap agreements to manage its interest rate risk and also enters into cross-currency interest rate swap agreements to manage both its foreign currency risk and interest-rate risk on interest-bearing financial liabilities, there can be no assurance that such instruments will be successful in reducing the risks inherent in exposures to interest rate fluctuations.
AB InBev’s results of operations are affected by fluctuations in exchange rates. Any change in exchange rates between AB InBev’s operating companies’ functional currencies and the US dollar will affect its consolidated income statement and balance sheet when the results of those operating companies are translated into US dollar for reporting purposes. Also, there can be no assurance that the policies in place to manage commodity price and foreign currency risks to protect AB InBev’s exposure will be able to successfully hedge against the effects of such

7/ Financial Report
foreign exchange exposure, especially over the long-term. Further, financial instruments to mitigate currency risk and any other efforts taken to better match the effective currencies of AB InBev’s liabilities to its cash flows could result in increased costs.
The ability of AB InBev’s subsidiaries to distribute cash upstream may be subject to various conditions and limitations. The inability to obtain sufficient cash flows from its domestic and foreign subsidiaries and affiliated companies could adversely impact AB InBev’s ability to pay dividends and otherwise negatively impact its business, results of operations and financial condition.
Failure to generate significant cost savings and margin improvement through initiatives for improving operational efficiencies could adversely affect AB InBev’s profitability and AB InBev’s ability to achieve its financial goals.
AB InBev may not be able to successfully carry out further acquisitions and business integrations or restructuring. AB InBev cannot make further acquisitions unless it can identify suitable candidates and agree on terms with them. AB InBev may not be able to successfully complete such transactions. In addition, such transactions may involve the assumption of certain liabilities, which may have a potential impact on AB InBev’s financial risk profile. Further, the price AB InBev may pay in any future acquisition may prove to be too high as a result of various factors.
The combination with Grupo Modelo has exposed AB InBev to risks related to significant costs related to the combination and potential difficulties in integration of Grupo Modelo into AB InBev’s existing operations and the extraction of synergies from the transaction. Since AB InBev has financed the Modelo combination with a senior credit facility and via unsecured bonds, AB InBev has incurred an increased level of debt. AB InBev’s ability to repay its outstanding indebtedness will depend upon market conditions, and unfavorable conditions could increase costs beyond what is anticipated. Such costs could have a material adverse impact on cash flows or AB InBev’s results of operations or both. In addition, an inability to refinance all or a substantial amount of these debt obligations when they become due would have a material adverse effect on AB InBev’s financial condition and results of operations. Also, ratings agencies may downgrade AB InBev’s credit ratings below their current levels as a result of the Modelo combination and the incurrence of the related financial indebtedness. Any credit rating downgrade could materially adversely affect AB InBev’s ability to finance its ongoing operations, and to refinance the debt incurred to fund the Modelo combination including by increasing its cost of borrowing, significantly harm its financial condition, results of operations and profitability, including its ability to refinance its other existing indebtedness. Finally, although the estimated expense savings, revenue synergies, anticipated business growth opportunities, cost savings, increased profits, synergies and other benefits contemplated by the Modelo combination are significant, there can be no assurance that the Modelo combination will realize these benefits in the time expected or at all. Any failures, material delays or unexpected costs of the integration process could therefore have a material adverse effect on AB InBev business, results of operations and financial condition.
If the business of AB InBev does not develop as expected, impairment charges on goodwill or other intangible assets may be incurred in the future which could be significant and which could have an adverse effect on AB InBev’s results of operations and financial condition.
Although AB InBev’s operations in Cuba are quantitatively immaterial, its overall business reputation may suffer or it may face additional regulatory scrutiny as a result of its activities in Cuba based on Cuba’s identification as a state sponsor of terrorism and target of US economic and trade sanctions. If investors decide to liquidate or otherwise divest their investments in companies that have operations of any magnitude in Cuba, the market in and value of AB InBev’s securities could be adversely impacted. In addition, US legislation known as the “Helms-Burton Act” authorizes private lawsuits for damages against anyone who traffics in property confiscated without compensation by the Government of Cuba from persons who at the time were, or have since become, nationals of the United States. Although this section of the Helms-Burton Act is currently suspended, claims accrue notwithstanding the suspension and may be asserted if the suspension is discontinued. AB InBev has received notice of a claim purporting to be made under the Helms-Burton Act. AB InBev is currently unable to express a view as to the validity of such claims, or as to the standing of the claimants to pursue them.
AB InBev may not be able to recruit or retain key personnel and successfully manage them, which could disrupt AB InBev’s business and have an unfavorable material effect on AB InBev’s financial position, its income from operations and its competitive position.
Further, AB InBev may be exposed to labor strikes, disputes and work stoppages or slowdown, within its operations or those of its suppliers, or an interruption or shortage of raw materials for any other reason that could lead to a negative impact on AB InBev’s costs, earnings, financial condition, production level and ability to operate its business. AB InBev’s production may also be affected by work stoppages or slowdowns that affect its suppliers, distributors and retail delivery/logistics providers as a result of disputes under existing collective labor agreements with labor unions, in connection with negotiations of new collective labor agreements, as a result of supplier financial distress, or for other reasons. A work stoppage or slowdown at AB InBev’s facilities could interrupt the transport of raw materials from its suppliers or the transport of its products to its customers. Such disruptions could put a strain on AB InBev’s relationships with suppliers and clients and may have lasting effects on its business even after the disputes with its labor force have been resolved, including as a result of negative publicity.

66 / 67Anheuser-Busch InBev
Annual Report 2013
AB InBev relies on information technology systems to process, transmit, and store electronic information. Although AB InBev takes various actions to minimize potential technology disruptions, such disruptions could impact AB InBev’s business. For example, if outside parties gained access to AB InBev’s confidential data or strategic information and appropriated such information or made such information public, this could harm AB InBev’s reputation or its competitive advantage. More generally, technology disruptions could have a material adverse effect on AB InBev’s business, results of operations, cash flows or financial condition.
AB InBev’s business and operating results could be negatively impacted by social, technical, natural, physical or other disasters.
AB InBev maintains insurance policies to cover various risks and also uses self-insurance in certain areas. Should an uninsured loss (self-insured risks) or a loss in excess of insured limits occur, this could adversely impact AB InBev’s business, results of operations and financial condition.
AB InBev is exposed to the risk of a global recession or a recession in one or more of its key markets, and to credit and capital market volatility and economic financial crisis, such as for example recent concerns regarding the level of U.S. federal debt, which could result in lower revenue and reduced profit, as beer consumption in many of the jurisdictions in which AB InBev operates is closely linked to general economic conditions and changes in disposable income. A continuation or worsening of the levels of market disruption and volatility seen in the recent past could have an adverse effect on AB InBev’s ability to access capital, on its business, results of operations and financial condition, and on the market price of its shares and ADSs.
AB InBev operates its business and markets its products in certain countries that are less developed, have less stability in legal systems and financial markets, and are potentially more corrupt business environments than Europe and the United States, and therefore present greater political, economic and operational risks. Although AB InBev is committed to conducting business in a legal and ethical manner in compliance with local and international statutory requirements and standards applicable to its business, there is a risk that the employees or representatives of AB InBev’s subsidiaries, affiliates, associates, joint ventures/operations or other business interests may take actions that violate applicable laws and regulations that generally prohibit the making of improper payments to foreign government officials for the purpose of obtaining or keeping business, including laws relating to the 1997 OECD Convention on Combating Bribery of Foreign Public Officials in International Business Transactions such as the U.S. Foreign Corrupt Practices Act and the U.K. Bribery Act.
The audit report included in AB InBev’s annual report is prepared by an auditor who is not inspected by the US Public Company Accounting Oversight Board (PCAOB), This lack of PCAOB inspections in Belgium prevents the PCAOB from regularly evaluating audits and quality control procedures of any auditors operating in Belgium, including AB InBev’s auditors. As a result, US and other investors may be deprived of the benefits of PCAOB inspections.
AB InBev is now, and may in the future be, a party to legal proceedings and claims, including collective suits (class actions), and significant damages may be asserted against it. Given the inherent uncertainty of litigation, it is possible that AB InBev might incur liabilities as a consequence of the proceedings and claims brought against it, including those that are not currently believed by it to be reasonably possible, which could have a material adverse effect on AB InBev’s business, results of operations, cash flows or financial position. Important contingencies are disclosed in Note 32 Contingencies of the consolidated financial statements.
Risks Arising from Financial Instruments
Note 29 of the 2013 consolidated financial statements on Risks arising from financial instruments contains detailed information on the company’s exposures to financial risks and its risk management policies.
EventsaftertheBalance Sheet Date
Please refer to Note 34 Events after the balance sheet date of the consolidated financial statements.
Corporate Governance
For information with respect to Corporate Governance, please refer to the Corporate Governance section, which forms an integral part of AB InBev’s annual report.

7/ Financial Report
Adjustedsegmentinformation
Given the transformational nature of the transaction with Grupo Modelo, and to facilitate the understanding of AB InBev’s underlying performance, AB InBev has updated its 2012 and 2013 segment reporting for purposes of result announcement and internal review by senior management. This presentation (referred to as the “2012 and 2013 Reference Base”) includes, for comparative purposes, the results of the Grupo Modelo business as if the combination had taken place on 4 June 2012. Accordingly, the 2013 Reference base presented below includes 12 months of the Grupo Modelo combination.
The 2013 Reference Base further reflects the combination, effective 1 January 2014, of AB InBev’s Western Europe and Central & Eastern Europe Zones into a single Europe Zone, the transfer of responsibility from Global Export and Holding Companies to the Europe zone of the company’s Spanish operations, and the export of Corona to a number of European countries and the transfer of management responsibility for Cuba to the Zone Latin America North.
The Grupo Modelo operations are reported according to their geographical presence in the following segments: the Mexico beer and packaging businesses are reported in the new Zone Mexico, the Spanish business is reported in the Zone Europe and the Export business is reported in the Global Export and Holding Companies segment.
1Q2013 2Q2013 3Q2013 4Q2013 2013AB INBEVWORLDWIDE Referencebase Referencebase Referencebase Referencebase Reference base
Volumes 100 922 114 758 119 664 110 442 445 786 Revenue 10422 11653 11712 11696 45483Cost of sales (4 447) (4 883) (4 750) (4 475) (18 555)Grossprofit 5975 6770 6962 7221 26928Distribution expenses (1 069) (1 096) (1 076) (1 045) (4 286)Sales & marketing expenses (1 496) (1 756) (1 610) (1 476) (6 338)Administrative expenses (612) (692) (662) (800) (2 766)Other operating income/(expenses) 250 261 289 462 1 262 Normalized EBIT 3 048 3 488 3 904 4 361 14 800 NormalizedEBITDA 3821 4268 4659 5194 17943Normalized EBITDA margin 36.7% 36.6% 39.8% 44.4% 39.4%
1Q2013 2Q2013 3Q2013 4Q2013 2013NORTH AMERICA Referencebase Referencebase Referencebase Referencebase Referencebase
Volumes 28 356 32 368 33 243 28 148 122 116 Revenue 3683 4279 4343 3717 16023Cost of sales (1 534) (1 732) (1 742) (1 510) (6 519)Grossprofit 2149 2547 2601 2207 9504Distribution expenses (314) (321) (323) (276) (1 235)Sales & marketing expenses (444) (481) (513) (470) (1 908)Administrative expenses (118) (113) (121) (144) (497)Other operating income/(expenses) 15 16 20 16 67 Normalized EBIT 1 288 1 648 1 664 1 332 5 932 NormalizedEBITDA 1480 1840 1858 1549 6728Normalized EBITDA margin 40.2% 43.0% 42.8% 41.7% 42.0%
1Q2013 2Q2013 3Q2013 4Q2013 2013MEXICO Referencebase Referencebase Referencebase Referencebase Referencebase
Volumes 8 835 10 306 9 311 9 733 38 185 Revenue 1049 1286 1150 1183 4669Cost of sales (400) (453) (354) (362) (1 570)Grossprofit 649 833 796 821 3099Distribution expenses (121) (128) (105) (90) (443)Sales & marketing expenses (208) (224) (192) (220) (844)Administrative expenses (118) (139) (112) (84) (455)Other operating income/(expenses) 54 50 53 43 200 Normalized EBIT 256 392 440 470 1 557 NormalizedEBITDA 349 487 533 571 1940Normalized EBITDA margin 33.3% 37.9% 46.3% 48.2% 41.5%

68 / 69Anheuser-Busch InBev
Annual Report 2013
1Q2013 2Q2013 3Q2013 4Q2013 2013LATIN AMERICA NORTH Referencebase Referencebase Referencebase Referencebase Referencebase
Volumes 28 573 27 251 28 830 35 773 120 427 Revenue 2635 2483 2464 3428 11010Cost of sales (907) (855) (810) (1 005) (3 576)Grossprofit 1728 1628 1655 2423 7434Distribution expenses (348) (325) (314) (365) (1 351)Sales & marketing expenses (312) (385) (257) (194) (1 147)Administrative expenses (124) (142) (114) (212) (591)Other operating income/(expenses) 160 142 174 331 807 Normalized EBIT 1 105 919 1 144 1 984 5 151 NormalizedEBITDA 1294 1109 1306 2150 5858Normalized EBITDA margin 49.1% 44.7% 53.0% 62.7% 53.2%
1Q2013 2Q2013 3Q2013 4Q2013 2013LATIN AMERICA SOUTH Referencebase Referencebase Referencebase Referencebase Referencebase
Volumes 9 825 7 548 8 167 11 378 36 918 Revenue 871 649 706 1042 3269Cost of sales (315) (279) (278) (312) (1 185)Grossprofit 556 370 428 730 2084Distribution expenses (85) (67) (73) (85) (309)Sales & marketing expenses (94) (85) (75) (91) (346)Administrative expenses (24) (28) (27) (33) (112)Other operating income/(expenses) (4) (6) 0 4 (5)Normalized EBIT 349 185 252 525 1 311 NormalizedEBITDA 396 233 301 562 1491Normalized EBITDA margin 45.4% 35.8% 42.6% 53.9% 45.6%
1Q2013 2Q2013 3Q2013 4Q2013 2013EUROPE Referencebase Referencebase Referencebase Referencebase Referencebase
Volumes 9 227 14 133 13 119 10 551 47 030 Revenue 975 1440 1391 1215 5021Cost of sales (480) (633) (608) (552) (2 272)Grossprofit 496 807 783 663 2749Distribution expenses (112) (140) (133) (118) (503)Sales & marketing expenses (231) (298) (284) (252) (1 066)Administrative expenses (84) (83) (81) (116) (364)Other operating income/(expenses) 3 7 10 12 32 Normalized EBIT 72 293 295 189 849 NormalizedEBITDA 190 415 416 320 1341Normalized EBITDA margin 19.4% 28.8% 29.9% 26.3% 26.7%
1Q2013 2Q2013 3Q2013 4Q2013 2013ASIA PACIFIC Referencebase Referencebase Referencebase Referencebase Referencebase
Volumes 12 614 18 907 23 022 11 244 65 787 Revenue 703 916 1100 635 3354Cost of sales (418) (498) (565) (403) (1 885)Grossprofit 284 418 535 232 1469Distribution expenses (58) (79) (92) (73) (302)Sales & marketing expenses (158) (232) (243) (199) (833)Administrative expenses (64) (82) (90) (82) (317)Other operating income/(expenses) 10 38 20 41 109 Normalized EBIT 14 64 130 (81) 127 NormalizedEBITDA 113 157 227 50 546Normalized EBITDA margin 16.1% 17.1% 20.6% 7.8% 16.3%

7/ Financial Report
1Q2013 2Q2013 3Q2013 4Q2013 2013GLOBAL EXPORT AND HOLDING COMPANIES Referencebase Referencebase Referencebase Referencebase Referencebase
Volumes 3 490 4 246 3 972 3 615 15 323 Revenue 505 599 558 475 2138Cost of sales (393) (432) (393) (331) (1 549)Grossprofit 112 167 165 144 589Distribution expenses (31) (38) (36) (38) (143)Sales & marketing expenses (49) (49) (46) (50) (194)Administrative expenses (80) (105) (116) (129) (430)Other operating income/(expenses) 12 13 13 14 52 Normalized EBIT (35) (12) (20) (58) (126)NormalizedEBITDA 0 26 20 (7) 40

70 / 71Anheuser-Busch InBev
Annual Report 2013
Statement of the Board of DirectorsThe Board of Directors of AB InBev SA/NV certifies, on behalf and for the account of the company, that, to their knowledge, (a) the financial statements which have been prepared in accordance with International Financial Reporting Standards give a true and fair view of the assets, liabilities, financial position and profit or loss of the company and the entities included in the consolidation as a whole and (b) the management report includes a fair review of the development and performance of the business and the position of the company and the entities included in the consolidation as a whole, together with a description of the principal risks and uncertainties they face.

7/ Financial Report
Independent Auditors’ Report
72 / 73Anheuser-Busch InBev
Annual Report 2013
22

7/ Financial Report
23

74 / 75Anheuser-Busch InBev
Annual Report 2013
Consolidated Financial StatementsConsolidated Income StatementFortheyearended31DecemberMillionUSdollar,exceptearningspersharesinUSdollar Notes 2013 20121
Revenue 43195 39758Cost of sales (17 594) (16 422)
Grossprofit 25601 23336Distribution expenses (4 061) (3 787)Sales and marketing expenses (5 958) (5 254)Administrative expenses (2 539) (2 200)Other operating income/(expenses) 7 1 160 684
Profitfromoperationsbeforenon-recurringitems 14203 12779Restructuring (including impairment losses) 8 (118) (36)Business and asset disposal (including impairment losses) 8 30 58Acquisition costs business combinations 8 (82) (54)Fair value adjustments 8 6 410 -
Profitfromoperations 20443 12747Finance cost 11 (3 047) (2 692)Finance income 11 561 344Non-recurring net finance cost 8 283 (18)
Netfinancecost (2203) (2366)Share of result of associates 16 294 624
Profitbeforetax 18534 11005Income tax expense 12 (2 016) (1 680)
Profit 16518 9325
Attributable to:Equity holders of AB InBev 14 394 7 160Non-controlling interest 2 124 2 165
Basic earnings per share 23 8.90 4.48Diluted earnings per share 23 8.72 4.40
Basic earnings per share before non-recurring items2 23 4.91 4.50Diluted earnings per share before non-recurring items2 23 4.81 4.42
The accompanying notes are an integral part of these consolidated financial statements.
12012 as Reported, adjusted to reflect the effects of retrospective application on the revised IAS 19 Employee Benefits (see Note 3 Summary of significant accounting policies).2Basic earnings per share and diluted earnings per share before non-recurring items are not defined metrics in IFRS. Refer to Note 23 Changes in equity and earnings per sharefor more details.

7/ Financial Report
ConsolidatedStatementofComprehensiveIncomeFortheyearended31DecemberMillionUSdollar 2013 20121
Profit 16518 9325Othercomprehensiveincome:Itemsthatwillnotbereclassifiedtoprofitorloss:Re-measurements of post-employment benefits 503 (270)
503 (270)Othercomprehensiveincome:Itemsthatmaybereclassifiedsubsequentlytoprofitorloss:Translation reserves (gains/(losses))
Exchange differences on translation of foreign operations (3 500) (764)Effective portion of changes in fair value of net investment hedges (66) (104)
Cash flow hedges Recognized in equity 579 123Removed from equity and included in profit or loss (36) (6)
Share of other comprehensive results of associates (67) 475(3 090) (276)
Othercomprehensiveincome,netoftax (2587) (546)
Totalcomprehensiveincome 13931 8779Attributable to:
Equity holders of AB InBev 12285 6724Non-controlling interest 1646 2055
The accompanying notes are an integral part of these consolidated financial statements.12012 as Reported, adjusted to reflect the effects of retrospective application on the revised IAS 19 Employee Benefits (see Note 3 Summary of significant accounting policies).

76 / 77Anheuser-Busch InBev
Annual Report 2013
ConsolidatedStatementofFinancialPositionAsat 31December 31December 1JanuaryMillionUSdollar Notes 2013 20121 20121
AssetsNon-current assetsProperty, plant and equipment 13 20 889 16 461 16 022Goodwill 14 69 927 51 766 51 302Intangible assets 15 29 338 24 371 23 818Investments in associates 16 187 7 090 6 696Investment securities 17 193 256 244Deferred tax assets 18 1 180 807 673Employee benefits 25 10 12 10Trade and other receivables 20 1 252 1 228 1 339
122976 101991 100104Current assets Investment securities 17 123 6 827 103Inventories 19 2 950 2 500 2 466Income tax receivable 332 195 312Trade and other receivables 20 5 362 4 023 4 121Cash and cash equivalents 21 9 839 7 051 5 320Assets held for sale 22 84 34 1
18690 20630 12323
Totalassets 141666 122621 112427
Equity and LiabilitiesEquityIssued capital 23 1 735 1 734 1 734Share premium 17 608 17 574 17 557Reserves 18 327 469Retained earnings 31 004 21 519 17 744
EquityattributabletoequityholdersofABInBev 50365 41154 37504Non-controlling interest 4 943 4 299 3 552
55308 45453 41056
Non-current liabilitiesInterest-bearing loans and borrowings 24 41 274 38 951 34 598Employee benefits 25 2 862 3 687 3 428Deferred tax liabilities 18 12 841 11 168 11 279Trade and other payables 28 3 222 2 313 1 548Provisions 27 532 641 874
60731 56760 51727
Current liabilitiesBank overdrafts 21 6 – 8Interest-bearing loans and borrowings 24 7 846 5 390 5 559Income tax payable 1 105 543 499Trade and other payables 28 16 474 14 295 13 337Provisions 27 196 180 241
25627 20408 19644
Totalequityandliabilities 141666 122621 112427
The accompanying notes are an integral part of these consolidated financial statements. 1As Reported, adjusted to reflect the effects of retrospective application on the revised IAS 19 Employee Benefits (see Note 3 Summary of significant accounting policies).

7/ Financial Report
ConsolidatedStatementofChangesinEquity
Share- based
Issued Share Treasury paymentMillion US dollar capital premium shares reserves
Asper1January2012 1734 17557 (1137) 536Profit – – – –Other comprehensive income Exchangedifferencesontranslationofforeignoperations(gains/(losses)) – – – – Cashflowhedges – – – – Re-measurementsofpost-employmentbenefits – – – – Shareofothercomprehensiveresultsofassociates – – – –Totalcomprehensiveincome – – – –Sharesissued – 17 – –Dividends – – – –Treasuryshares – – 137 –Share-basedpayments – – – 157Scopeandotherchanges – – – –
Asper31December2012 1734 17574 (1000) 693
Share- based
Issued Share Treasury paymentMillion US dollar capital premium shares reserves
Asper1January2013 1734 17574 (1000) 693Profit – – – –Other comprehensive income Exchangedifferencesontranslationofforeignoperations(gains/(losses)) – – – – Cashflowhedges – – – – Re-measurementsofpost-employmentbenefits – – – – Shareofothercomprehensiveresultsofassociates – – – –Totalcomprehensiveincome – – – –Sharesissued 1 34 – –Dividends – – – –Treasuryshares – – 126 –Share-basedpayments – – – 192Scopeandotherchanges – – – –
Asper31December2013 1735 17608 (874) 885
The accompanying notes are an integral part of these consolidated financial statements. 1As Reported, adjusted to reflect the effects of retrospective application on the revised IAS 19 Employee Benefits (see Note 3 Summary of significant accounting policies).

78 / 79Anheuser-Busch InBev
Annual Report 2013
AttributabletoequityholdersofABInBev1
Re-measurementsofpost- Deferred Non-
Translation Hedging employment share Retained controlling Totalreserves reserves benefits instrument earnings Total interest equity
2418 (188) (1160) – 17744 37504 3552 41056– – – – 7160 7160 2165 9325
(746) – – – – (746) (122) (868)– 109 – – – 109 8 117– – (274) – – (274) 4 (270)
475 – – – – 475 – 475(271) 109 (274) – 7160 6724 2055 8779
– – – – – 17 – 17– – – – (2705) (2705) (1406) (4111)– – – – (56) 81 (7) 74– – – – – 157 18 175– – – – (624) (624) 87 (537)
2147 (79) (1434) – 21519 41154 4299 45453
AttributabletoequityholdersofABInBev1
Re-measurementsofpost- Deferred Non-
Translation Hedging employment share Retained controlling Totalreserves reserves benefits instrument earnings Total interest equity
2147 (79) (1434) – 21519 41154 4299 45453– – – – 14394 14394 2124 16518
(3042) – – – – (3042) (524) (3566)– 534 – – – 534 9 543– – 466 – – 466 37 503
(67) – – – – (67) – (67)(3109) 534 466 – 14394 12285 1646 13931
– – – 1500 – 1535 – 1535– – – (18) (4788) (4806) (1019) (5825)– – – – – 126 – 126– – – – – 192 23 215– – – – (121) (121) (6) (127)
(962) 455 (968) 1482 31004 50365 4943 55308

7/ Financial Report
ConsolidatedCashFlowStatementFortheyearended31DecemberMillionUSdollar Notes 2013 20121
Operating ActivitiesProfit 16 518 9 325Depreciation, amortization and impairment 10 2 985 2 747Impairment losses on receivables, inventories and other assets 91 106Additions/(reversals) in provisions and employee benefits 109 (14)Net finance cost 11 2 203 2 366Loss/(gain) on sale of property, plant and equipment and intangible assets (25) (68)Loss/(gain) on sale of subsidiaries, associates and assets held for sale (85) (19)Revaluation of initial investment in Grupo Modelo 6 (6 415) –Equity-settled share-based payment expense 26 240 201Income tax expense 12 2 016 1 680Other non-cash items included in the profit (105) 28Share of result of associates 16 (294) (624)
Cashflowfromoperatingactivitiesbeforechangesinworkingcapital 17238 15728anduseofprovisionsDecrease/(increase) in trade and other receivables (25) (102)Decrease/(increase) in inventories (129) (130)Increase/(decrease) in trade and other payables 1 020 1 331Pension contributions and use of provisions (653) (621)
Cashgeneratedfromoperations 17451 16206Interest paid (2 214) (1 978)Interest received 297 112Dividends received 606 720Income tax paid (2 276) (1 792)
Cashflowfromoperatingactivities 13864 13268Investing ActivitiesProceeds from sale of property, plant and equipment and of intangible assets 257 175Sale of subsidiaries, net of cash disposed of 6 42 33Acquisition of subsidiaries, net of cash acquired 6 (17 439) (1 445)Purchase of non-controlling interest 23 (99) (110)Acquisition of property, plant and equipment and of intangible assets 13/15 (3 869) (3 264)Proceeds from the sale of assets held for sale 4 002 (3)Net proceeds from sale/(acquisition) of investment in short-term debt securities 17 6 707 (6 702)Net proceeds from sale/(acquisition) of other assets (13) (39)Net repayments/(payments) of loans granted 131 14
Cashflowfrominvestingactivities (10281) (11341)Financing ActivitiesNet proceeds from the issue of share capital 23 73 102Proceeds from borrowings 22 464 18 463Payments on borrowings (18 006) (14 814)Cash received for deferred shares instrument 1 500 –Cash net finance (cost)/income other than interests 563 43Dividends paid (6 253) (3 632)
Cashflowfromfinancingactivities 341 162
Netincrease/(decrease)incashandcashequivalents 3924 2089
Cash and cash equivalents less bank overdrafts at beginning of year 7 051 5 312Effect of exchange rate fluctuations (1 142) (350)
Cashandcashequivalentslessbankoverdraftsatendofperiod 21 9833 7051
The accompanying notes are an integral part of these consolidated financial statements.12012 as Reported, adjusted to reflect the effects of retrospective application on the revised IAS 19 Employee Benefits (see Note 3 Summary of significant accounting policies).

80 / 81Anheuser-Busch InBev
Annual Report 2013
Notes to the Consolidated Financial Statements
1 Corporate information2 Statement of compliance3 Summary of significant accounting policies4 Use of estimates and judgments5 Segment reporting6 Acquisitions and disposals of subsidiaries7 Other operating income/(expenses)8 Non-recurring items9 Payroll and related benefits
10 Additional information on operating expenses by nature11 Finance cost and income12 Income taxes13 Property, plant and equipment14 Goodwill15 Intangible assets16 Investment in associates17 Investment securities18 Deferred tax assets and liabilities19 Inventories20 Trade and other receivables21 Cash and cash equivalents22 Assets and liabilities held for sale23 Changes in equity and earnings per share24 Interest-bearing loans and borrowings25 Employee benefits26 Share-based payments27 Provisions28 Trade and other payables29 Risks arising from financial instruments30 Operating leases31 Collateral and contractual commitments for the acquisition of property, plant and equipment, loans to customers and other32 Contingencies33 Related parties34 Events after the balance sheet date35 AB InBev companies

7/ Financial Report
1. Corporate Information
Anheuser-Busch InBev is a publicly traded company (Euronext: ABI) based in Leuven, Belgium, with American Depositary Receipts on the New York Stock Exchange (NYSE: BUD). It is the leading global brewer, one of the world’s top five consumer products companies and recognized as first in the beverage industry on FORTUNE Magazine’s “World’s Most Admired” companies list. Beer, the original social network, has been bringing people together for thousands of years and the company’s portfolio of well over 200 beer brands continues to forge strong connections with consumers. This includes global brands Budweiser®, Corona® and Stella Artois®; international brands Beck’s®, Leffe® and Hoegaarden®; and local champions Bud Light®, Skol®, Brahma®, Antarctica®, Quilmes®, Victoria®, Modelo Especial® Michelob Ultra®, Harbin®, Sedrin®, Klinskoye®, Sibirskaya Korona®, Chernigivske®, and Jupiler®. Anheuser-Busch InBev’s dedication to heritage and quality originates from the Den Hoorn brewery in Leuven, Belgium dating back to 1366 and the pioneering spirit of the Anheuser & Co brewery, with origins in St. Louis, USA since 1852. Geographically diversified with a balanced exposure to developed and developing markets, Anheuser Busch InBev leverages the collective strengths of its more than 150 000 employees based in 24 countries worldwide. In 2013, AB InBev realized 43.2 billion US dollar revenue. The company strives to be the Best Beer Company in a Better World.
The consolidated financial statements of the company for the year ended 31 December 2013 comprise the company and its subsidiaries (together referred to as “AB InBev” or the “company”) and the company’s interest in associates and jointly controlled entities.
The financial statements were authorized for issue by the Board of Directors on 25 February 2014.
2. Statement of Compliance
The consolidated financial statements are prepared in accordance with International Financial Reporting Standards as issued by the International Accounting Standards Board (“IASB”) and in conformity with IFRS as adopted by the European Union up to 31 December 2013 (collectively “IFRS”). AB InBev did not apply any European carve-outs from IFRS. AB InBev has not applied early any new IFRS requirements that are not yet effective in 2013.
3. Summary of Significant Accounting Policies
The accounting policies set out below have been applied consistently to all periods presented in these consolidated financial statements by the company and its subsidiaries.
(A)BasisofpreparationandmeasurementDepending on the applicable IFRS requirements, the measurement basis used in preparing the financial statements is cost, net realizable value, fair value or recoverable amount. Whenever IFRS provides an option between cost and another measurement basis (e.g. systematic re-measurement), the cost approach is applied.
(B)Functional and presentation currencyUnless otherwise specified, all financial information included in these financial statements have been stated in US dollar and has been rounded to the nearest million. The functional currency of the parent company is the euro.
(C)UseofestimatesandjudgmentsThe preparation of financial statements in conformity with IFRS requires management to make judgments, estimates and assumptions that affect the application of policies and reported amounts of assets and liabilities, income and expenses. The estimates and associated assumptions are based on historical experience and various other factors that are believed to be reasonable under the circumstances, the results of which form the basis of making the judgments about carrying values of assets and liabilities that are not readily apparent from other sources. Actual results may differ from these estimates.
The estimates and underlying assumptions are reviewed on an ongoing basis. Revisions to accounting estimates are recognized in the period in which the estimate is revised if the revision affects only that period or in the period of the revision and future periods if the revision affects both current and future periods.

82 / 83Anheuser-Busch InBev
Annual Report 2013
(D)PrinciplesofconsolidationSubsidiaries are those entities controlled by AB InBev. AB InBev controls an entity when it is exposed to, or has rights to, variable returns from its involvement with the entity and has the ability to affect those returns through its power over the entity. In assessing control, potential voting rights are taken into account. Control is presumed to exist where AB InBev owns, directly or indirectly, more than one half of the voting rights (which does not always equate to economic ownership), unless it can be demonstrated that such ownership does not constitute control. The financial statements of subsidiaries are included in the consolidated financial statements from the date that control commences until the date that control ceases. Total comprehensive income of subsidiaries is attributed to the owners of the company and to the non-controlling interests even if this results in the non-controlling interests having a deficit balance.
Associates are undertakings in which AB InBev has significant influence over the financial and operating policies, but which it does not control. This is generally evidenced by ownership of between 20% and 50% of the voting rights. A joint venture is an arrangement in which AB InBev has joint control, whereby AB InBev has rights to the net assets of the arrangement, rather than rights to its assets and obligations for its liabilities. Associates and joint ventures are accounted for by the equity method of accounting, from the date that significant influence or joint control commences until the date that significant influence or joint control ceases. When AB InBev’s share of losses exceeds the carrying amount of the associate or joint venture, the carrying amount is reduced to nil and recognition of further losses is discontinued except to the extent that AB InBev has incurred legal or constructive obligations on behalf of the associate or joint venture.
Joint operations arise when AB InBev has rights to the assets and obligations to the liabilities of a joint arrangement. AB InBev accounts for its share of the assets, liabilities, revenues and expenses as from the moment joint operation commences until the date that joint operation ceases.
The financial statements of the company’s subsidiaries, joint ventures, joint operations and associates are prepared for the same reporting year as the parent company, using consistent accounting policies. In exceptional cases when the financial statements of a subsidiary, joint venture, joint operation or associate are prepared as of a different date from that of AB InBev (e.g. Modelo prior to the AB InBev and Grupo Modelo combination), adjustments are made for the effects of significant transactions or events that occur between that date and the date of AB InBev’s financial statements. In such cases, the difference between the end of the reporting period of these subsidiaries, joint ventures, joint operations or associates from AB InBev’s reporting period is no more than three months.
All intercompany transactions, balances and unrealized gains and losses on transactions between group companies have been eliminated. Unrealized gains arising from transactions with joint ventures, joint operations and associates are eliminated to the extent of AB InBev’s interest in the entity. Unrealized losses are eliminated in the same way as unrealized gains, but only to the extent that there is no evidence of impairment.
A listing of the company’s most important subsidiaries, joint ventures, joint operations and associates is set out in Note 35 AB InBev companies.
(E)SummaryofchangesinaccountingpoliciesIFRSswitheffectiveapplicationforannualperiodsbeginningon1stJanuary2013:
IFRS 10 Consolidated Financial Statements, which provides a single consolidation model that identifies control as the basis for consolidation for all types of entities.
IFRS 11 Joint Arrangements, which establishes principles for the financial reporting by parties to a joint arrangement and replaces the proportionate consolidation method by the equity method.
IFRS 12 Disclosure of Interests in Other Entities, which combines, enhances and replaces the disclosure requirements for subsidiaries, joint arrangements, associates and unconsolidated structured entities.
IFRS 13 Fair Value Measurement, which does not establish new requirements for when fair value is required but provides a single source of guidance on how fair value is measured.
IAS 19 Employee Benefits (Revised 2011):
The amendments that caused the most significant impacts in the company’s financial statements include:• Expected returns on plan assets are no longer recognized in profit or loss. Expected returns are replaced by recording interest income in
profit or loss. This interest is calculated using the discount rate used to measure the pension obligation.• Unvested past service costs can no longer be deferred and recognized over the future vesting period. Instead, all past service costs
are recognized at the earlier of when the amendment/curtailment occurs or when the company recognizes related restructuring or termination costs.

7/ Financial Report
Except for IAS 19 (Revised 2011), the standards above did not have a significant impact on AB InBev’s consolidated financial statements upon initial application.
IAS 19 (Revised 2011) requires retrospective application. Accordingly, the comparative figures in AB InBev’s consolidated financial statements have been adjusted as if IAS 19 (Revised 2011) had always applied.
Similar to the 2012 version of IAS 19, IAS 19 (Revised 2011) does not specify where in profit or loss an entity should present the net interest on net defined benefit liabilities. As a consequence, the company has determined that, upon initial application of IAS 19 (Revised 2011), the net interest component would be presented as part of the company’s net finance cost. This change in presentation is in line with IAS 1, which permits entities to provide disaggregated information in the performance statements.
With the retrospective application of IAS 19 (Revised 2011) and the decision of the company to present the net interest component as part of the company’s net f inance cost as described above, the 2012 full year adjusted total pre-tax pension expense is 146m US dollar higher than previously reported, with profits from operations and net finance costs higher by 14m US dollar and 160m US dollar, respectively. The impact is mainly caused by the change in the calculation of returns on assets mentioned above. The impact of the retrospective application of IAS 19 (Revised 2011) on the net benefit obligation was a decrease in the liability by 12m US dollar as at 31 December 2012 and as at 1st January 2012.
The adjusted figures upon implementation of IAS 19 (Revised 2011) and the previously reported figures are demonstrated below:
Consolidated Income Statement
Fortheperiodended 31December2012 31December2012MillionUSdollar (adjusted) (reported)
Revenue 39758 39758Cost of sales (16 422) (16 447)Distribution expenses (3 787) (3 785)Sales and marketing expenses (5 254) (5 258)Administrative expenses (2 200) (2 187)Other operating income/(expenses) 684 684
Normalizedprofitfromoperations(EBIT) 12779 12765Non-recurring items above EBIT (32) (32)
Profitfromoperations(EBIT) 12747 12733Net finance cost (2 366) (2 206)Share of result of associates 624 624
Profitbeforetax 11005 11151Income tax expense (1 680) (1 717)
Profit 9325 9434
Consolidated Statement of Financial Position
Asat 31December2012 31December2012 1stJanuary2012MillionUSdollar (adjusted) (reported) (adjusted)
Equity 45453 45441 41056Non-currentliabilities 56760 56772 51727Employee benefits 3 687 3 699 3 428
A number of other new standards, amendment to standards and new interpretations became mandatory for the first time for the financial year beginning 1 January 2013, and have not been listed in these consolidated financial statements because of either their non-applicability to or their immateriality to AB InBev’s consolidated financial statements.

84 / 85Anheuser-Busch InBev
Annual Report 2013
(F)Foreign currenciesForeigncurrencytransactions Foreign currency transactions are accounted for at exchange rates prevailing at the date of the transactions. Monetary assets and liabilities denominated in foreign currencies are translated at the balance sheet date rate. Gains and losses resulting from the settlement of foreign currency transactions and from the translation of monetary assets and liabilities denominated in foreign currencies are recognized in the income statement. Non-monetary assets and liabilities denominated in foreign currencies are translated at the foreign exchange rate prevailing at the date of the transaction. Non-monetary assets and liabilities denominated in foreign currencies that are stated at fair value are translated to US dollar at foreign exchange rates ruling at the dates the fair value was determined.
Translation of the results and financial position of foreign operations Assets and liabilities of foreign operations are translated to US dollar at foreign exchange rates prevailing at the balance sheet date. Income statements of foreign operations, excluding foreign entities in hyperinflationary economies, are translated to US dollar at exchange rates for the year approximating the foreign exchange rates prevailing at the dates of the transactions. The components of shareholders’ equity are translated at historical rates. Exchange differences arising from the translation of shareholders’ equity to US dollar at period-end exchange rates are taken to other comprehensive income (translation reserves).
In hyperinflationary economies, re-measurement of the local currency denominated non-monetary assets, liabilities, income statement accounts as well as equity accounts is made by applying a general price index. These re-measured accounts are used for conversion into US dollar at the closing exchange rate. AB InBev did not operate in hyperinflationary economies in 2012 and 2013.
Exchange rates The most important exchange rates that have been used in preparing the financial statements are:
Closing rate Average rate
1USdollarequals: 2013 2012 2013 2012
Argentinean peso 6.518027 4.917311 5.446585 4.544242Brazilian real 2.342604 2.043500 2.157419 1.947644Canadian dollar 1.063810 0.995679 1.030040 1.000770Chinese yuan 6.054043 6.230640 6.155014 6.312949Euro 0.725111 0.757920 0.755485 0.775893Mexican Peso 13.084394 13.024470 12.836159 13.234397Pound sterling 0.604525 0.618538 0.640409 0.629801Russian ruble 32.729000 30.372685 31.859528 31.116623Ukrainian hryvnia 7.993022 7.992997 7.993027 7.991152
(G) Intangible AssetsResearch and development Expenditure on research activities, undertaken with the prospect of gaining new scientific or technical knowledge and understanding, is recognized in the income statement as an expense as incurred.
Expenditure on development activities, whereby research findings are applied to a plan or design for the production of new or substantially improved products and processes, is capitalized if the product or process is technically and commercially feasible, future economic benefits are probable and the company has sufficient resources to complete development. The expenditure capitalized includes the cost of materials, direct labor and an appropriate proportion of overheads. Other development expenditure is recognized in the income statement as an expense as incurred. Capitalized development expenditure is stated at cost less accumulated amortization (see below) and impairment losses (refer accounting policy P).
Amortization related to research and development intangible assets is included within the cost of sales if production related and in sales and marketing if related to commercial activities.
Borrowing costs directly attributable to the acquisition, construction or production of qualifying assets are capitalized as part of the cost of such assets.
Supply and distribution rights A supply right is the right for AB InBev to supply a customer and the commitment by the customer to purchase from AB InBev. A distribution right is the right to sell specified products in a certain territory.
Acquired customer relationships in a business combination are initially recognized at fair value as supply rights to the extent that they arise from contractual rights. If the IFRS recognition criteria are not met, these relationships are subsumed under goodwill.
Acquired distribution rights are measured initially at cost or fair value when obtained through a business combination.
Amortization related to supply and distribution rights is included within sales and marketing expenses.

7/ Financial Report
Brands If part of the consideration paid in a business combination relates to trademarks, trade names, formulas, recipes or technological expertise these intangible assets are considered as a group of complementary assets that is referred to as a brand for which one fair value is determined. Expenditure on internally generated brands is expensed as incurred.
Software Purchased software is measured at cost less accumulated amortization. Expenditure on internally developed software is capitalized when the expenditure qualifies as development activities; otherwise, it is recognized in the income statement when incurred.
Amortization related to software is included in cost of sales, distribution expenses, sales and marketing expenses or administrative expenses based on the activity the software supports.
Other intangibleassets Other intangible assets, acquired by the company, are recognized at cost less accumulated amortization and impairment losses.
Other intangible assets also include multi-year sponsorship rights acquired by the company. These are initially recognized at the present value of the future payments and subsequently measured at cost less accumulated amortization and impairment losses.
Subsequentexpenditure Subsequent expenditure on capitalized intangible assets is capitalized only when it increases the future economic benefits embodied in the specific asset to which it relates. All other expenditures are expensed as incurred.
Amortization Intangible assets with a finite life are amortized using the straight-line method over their estimated useful lives. Licenses, brewing, supply and distribution rights are amortized over the period in which the rights exist. Brands are considered to have an indefinite life unless plans exist to discontinue the brand. Discontinuance of a brand can be either through sale or termination of marketing support. When AB InBev purchases distribution rights for its own products the life of these rights is considered indefinite, unless the company has a plan to discontinue the related brand or distribution. Software and capitalized development cost related to technology are amortized over 3 to 5 years.
Brands are deemed intangible assets with indefinite useful lives and, therefore, are not amortized but tested for impairment on an annual basis (refer accounting policy P).
Gains and losses on sale Net gains on sale of intangible assets are presented in the income statement as other operating income. Net losses on sale are included as other operating expenses. Net gains and losses are recognized in the income statement when the significant risks and rewards of ownership have been transferred to the buyer, recovery of the consideration is probable, the associated costs can be estimated reliably, and there is no continuing managerial involvement with the intangible assets.
(H)BusinesscombinationsThe company applies the purchase method of accounting to account for acquisitions of businesses. The cost of an acquisition is measured as the aggregate of the fair values at the date of exchange of the assets given, liabilities incurred and equity instruments issued. Identifiable assets, liabilities and contingent liabilities acquired or assumed are measured separately at their fair value as of the acquisition date. The excess of the cost of the acquisition over the company’s interest in the fair value of the identifiable net assets acquired is recorded as goodwill.
The allocation of fair values to the identifiable assets acquired and liabilities assumed is based on various assumptions requiring management judgment.
Acquisition-related costs are expensed as incurred.
If the business combination is achieved in stages, the acquisition date carrying value of AB InBev’s previously held interest in the acquiree is re-measured to fair value at the acquisition date; any gains or losses arising from such re-measurement are recognized in profit or loss.
(I) GoodwillGoodwill is determined as the excess of the consideration paid over AB InBev’s interest in the net fair value of the identifiable assets, liabilities and contingent liabilities of the acquired subsidiary, jointly controlled entity or associate recognized at the date of acquisition. All business combinations are accounted for by applying the purchase method. Business combinations entered into before 31 March 2004, were accounted for in accordance with IAS 22 Business Combinations. This means that acquired intangibles such as brands were subsumed under goodwill for those transactions. Effective 1 January 2010, when AB InBev acquires non-controlling interests any difference between the cost of acquisition and the non-controlling interest’s share of net assets acquired is accounted for as an equity transaction in accordance with IAS 27 Consolidated and Separate Financial Statements.

86 / 87Anheuser-Busch InBev
Annual Report 2013
In conformity with IFRS 3 Business Combinations, goodwill is stated at cost and not amortized but tested for impairment on an annual basis and whenever there is an indicator that the cash generating unit to which goodwill has been allocated, may be impaired (refer accounting policy P).
Goodwill is expressed in the currency of the subsidiary or jointly controlled entity to which it relates and is translated to US dollar using the year-end exchange rate.
In respect of associates and joint ventures, the carrying amount of goodwill is included in the carrying amount of the investment in the associate.
If AB InBev’s interest in the net fair value of the identifiable assets, liabilities and contingent liabilities recognized exceeds the cost of the business combination such excess is recognized immediately in the income statement as required by IFRS 3 Business Combinations.
Expenditure on internally generated goodwill is expensed as incurred.
( J) Property,PlantandEquipmentProperty, plant and equipment is measured at cost less accumulated depreciation and impairment losses (refer accounting policy P). Cost includes the purchase price and any costs directly attributable to bringing the asset to the location and condition necessary for it to be capable of operating in the manner intended by management (e.g. nonrefundable tax and transport cost). The cost of a self-constructed asset is determined using the same principles as for an acquired asset. The depreciation methods, residual value, as well as the useful lives are reassessed and adjusted if appropriate, annually.
Borrowing costs directly attributable to the acquisition, construction or production of qualifying assets are capitalized as part of the cost of such assets.
Subsequentexpenditure The company recognizes in the carrying amount of an item of property, plant and equipment the cost of replacing part of such an item when that cost is incurred if it is probable that the future economic benefits embodied with the item will flow to the company and the cost of the item can be measured reliably. All other costs are expensed as incurred.
Depreciation The depreciable amount is the cost of an asset less its residual value. Residual values, if not insignificant, are reassessed annually. Depreciation is calculated from the date the asset is available for use, using the straight-line method over the estimated useful lives of the assets.
The estimated useful lives are defined in terms of the asset’s expected utility to the company and can vary from one geographical area to another. On average the estimated useful lives are as follows:
Industrial buildings – other real estate properties 20 – 33 yearsProduction plant and equipment: Production equipment 10 – 15 years Storage, packaging and handling equipment 5 – 7 yearsReturnable packaging: Kegs 2 – 10 years Crates 2 – 10 years Bottles 2 – 5 yearsPoint of sale furniture and equipment 5 yearsVehicles 5 yearsInformation processing equipment 3 – 5 years
Where parts of an item of property, plant and equipment have different useful lives, they are accounted for as separate items of property, plant and equipment.
Land is not depreciated as it is deemed to have an indefinite life.
Gains and losses on sale Net gains on sale of items of property, plant and equipment are presented in the income statement as other operating income. Net losses on sale are presented as other operating expenses. Net gains and losses are recognized in the income statement when the significant risks and rewards of ownership have been transferred to the buyer, recovery of the consideration is probable, the associated costs can be estimated reliably, and there is no continuing managerial involvement with the property, plant and equipment.

7/ Financial Report
(K)AccountingforLeasesLeases of property, plant and equipment where the company assumes substantially all the risks and rewards of ownership are classified as finance leases. Finance leases are recognized as assets and liabilities (interest-bearing loans and borrowings) at amounts equal to the lower of the fair value of the leased property and the present value of the minimum lease payments at inception of the lease. Amortization and impairment testing for depreciable leased assets is the same as for depreciable assets that are owned (refer accounting policies J and P).
Lease payments are apportioned between the outstanding liability and finance charges so as to achieve a constant periodic rate of interest on the remaining balance of the liability.
Leases of assets under which all the risks and rewards of ownership are substantially retained by the lessor are classified as operating leases. Payments made under operating leases are charged to the income statement on a straight-line basis over the term of the lease.
When an operating lease is terminated before the lease period has expired, any payment required to be made to the lessor by way of penalty is recognized as an expense in the period in which termination takes place.
(L)InvestmentsAll investments are accounted for at trade date.
Investmentsinequitysecurities Investments in equity securities are undertakings in which AB InBev does not have significant influence or control. This is generally evidenced by ownership of less than 20% of the voting rights. Such investments are designated as available-for-sale financial assets which are at initial recognition measured at fair value unless the fair value cannot be reliably determined in which case they are measured at cost. Subsequent changes in fair value, except those related to impairment losses which are recognized in the income statement, are recognized directly in other comprehensive income.
On disposal of an investment, the cumulative gain or loss previously recognized directly in other comprehensive income is recognized in profit or loss.
Investmentsindebtsecurities Investments in debt securities classified as trading or as being available-for-sale are carried at fair value, with any resulting gain or loss respectively recognized in the income statement or directly in other comprehensive income. Fair value of these investments is determined as the quoted bid price at the balance sheet date. Impairment charges and foreign exchange gains and losses are recognized in the income statement.
Investments in debt securities classified as held to maturity are measured at amortized cost.
In general, investments in debt securities with maturities of more than three months when acquired and remaining maturities of less than one year are classified as short-term investments. Investments with maturities beyond one year may be classified as short-term based on their highly liquid nature and because such marketable securities represent the investment of cash that is available for current operations.
Other investments Other investments held by the company are classified as available-for-sale and are carried at fair value, with any resulting gain or loss recognized directly in other comprehensive income. Impairment charges are recognized in the income statement.
(M)InventoriesInventories are valued at the lower of cost and net realizable value. Cost includes expenditure incurred in acquiring the inventories and bringing them to their existing location and condition. The weighted average method is used in assigning the cost of inventories.
The cost of finished products and work in progress comprises raw materials, other production materials, direct labor, other direct cost and an allocation of fixed and variable overhead based on normal operating capacity. Net realizable value is the estimated selling price in the ordinary course of business, less the estimated completion and selling costs.
Inventories are written down on a case-by-case basis if the anticipated net realizable value declines below the carrying amount of the inventories. The calculation of the net realizable value takes into consideration specific characteristics of each inventory category, such as expiration date, remaining shelf life, slow-moving indicators, amongst others.
(N)TradeandotherReceivablesTrade and other receivables are carried at amortized cost less impairment losses. An estimate is made for doubtful receivables based on a review of all outstanding amounts at the balance sheet date.
An allowance for impairment of trade and other receivables is established if the collection of a receivable becomes doubtful. Such receivable becomes doubtful when there is objective evidence that the company will not be able to collect all amounts due according to the original

88 / 89Anheuser-Busch InBev
Annual Report 2013
terms of the receivables. Significant financial difficulties of the debtor, probability that the debtor will enter into bankruptcy or financial reorganization, and default or delinquency in payments are considered indicators that the receivable is impaired. The amount of the allowance is the difference between the asset’s carrying amount and the present value of the estimated future cash flows. An impairment loss is recognized in the income statement, as are subsequent recoveries of previous impairments.
(O)CashandcashequivalentsCash and cash equivalents include all cash balances and short-term highly liquid investments with a maturity of three months or less from the date of acquisition that are readily convertible into cash. They are stated at face value, which approximates their fair value. For the purpose of the cash flow statement, cash and cash equivalents are presented net of bank overdrafts.
(P)ImpairmentThe carrying amounts of financial assets, property, plant and equipment, goodwill and intangible assets are reviewed at each balance sheet date to determine whether there is any indication of impairment. If any such indication exists, the asset’s recoverable amount is estimated. In addition, goodwill, intangible assets that are not yet available for use and intangibles with an indefinite useful life are tested for impairment annually at the business unit level (that is one level below a reporting segment). An impairment loss is recognized whenever the carrying amount of an asset or the related cash-generating unit exceeds its recoverable amount. Impairment losses are recognized in the income statement.
Calculationofrecoverableamount The recoverable amount of the company’s investments in unquoted debt securities is calculated as the present value of expected future cash flows, discounted at the debt securities’ original effective interest rate. For equity investments classified as available for sale and quoted debt securities the recoverable amount is their fair value.
The recoverable amount of other assets is determined as the higher of their fair value less costs to sell and value in use. For an asset that does not generate largely independent cash inflows, the recoverable amount is determined for the cash-generating unit to which the asset belongs. The recoverable amount of the cash generating units to which the goodwill and the intangible assets with indefinite useful life belong is based on discounted future cash flows using a discount rate that reflects current market assessments of the time value of money and the risks specific to the asset. These calculations are corroborated by valuation multiples, quoted share prices for publicly traded subsidiaries or other available fair value indicators.
Impairment losses recognized in respect of cash-generating units are allocated first to reduce the carrying amount of any goodwill allocated to the units and then to reduce the carrying amount of the other assets in the unit on a pro rata basis.
Reversalofimpairmentlosses Non-financial assets other than goodwill and equity investments classified as held for sale that suffered an impairment are reviewed for possible reversal of the impairment at each reporting date. An impairment loss is reversed only to the extent that the asset’s carrying amount does not exceed the carrying amount that would have been determined, net of depreciation or amortization, if no impairment loss had been recognized.
(Q)SharecapitalRepurchaseofsharecapital When AB InBev buys back its own shares, the amount of the consideration paid, including directly attributable costs, is recognized as a deduction from equity under treasury shares.
Dividends Dividends are recognized in the consolidated financial statements on the date that the dividends are declared unless minimum statutory dividends are required by local legislation or the bylaws of the company’s subsidiaries. In such instances, statutory minimum dividends are recognized as a liability.
Share issuance costs Incremental costs directly attributable to the issue of new shares or options are shown in equity as a deduction, net of tax, from the proceeds.
(R)ProvisionsProvisions are recognized when (i) the company has a present legal or constructive obligation as a result of past events, (ii) it is probable that an outflow of resources embodying economic benefits will be required to settle the obligation, and (iii) a reliable estimate of the amount of the obligation can be made. Provisions are determined by discounting the expected future cash flows at a pre-tax rate that reflects current market assessments of the time value of money and, where appropriate, the risks specific to the liability.
Restructuring A provision for restructuring is recognized when the company has approved a detailed and formal restructuring plan, and the restructuring has either commenced or has been announced publicly. Costs relating to the ongoing activities of the company are not provided for. The provision includes the benefit commitments in connection with early retirement and redundancy schemes.

7/ Financial Report
Onerous contracts A provision for onerous contracts is recognized when the expected benefits to be derived by the company from a contract are lower than the unavoidable cost of meeting its obligations under the contract. Such provision is measured at the present value of the lower of the expected cost of terminating the contract and the expected net cost of continuing with the contract.
Disputes and litigations A provision for disputes and litigation is recognized when it is more likely than not that the company will be required to make future payments as a result of past events, such items may include but are not limited to, several claims, suits and actions both initiated by third parties and initiated by AB InBev relating to antitrust laws, violations of distribution and license agreements, environmental matters, employment related disputes, claims from tax authorities, and alcohol industry litigation matters.
(S)EmployeebenefitsPost-employmentbenefits Post-employment benefits include pensions, post-employment life insurance and post-employment medical benefits. The company operates a number of defined benefit and defined contribution plans throughout the world, the assets of which are generally held in separate trustee-managed funds. The pension plans are generally funded by payments from employees and the company, and, for defined benefit plans taking account of the recommendations of independent actuaries. AB InBev maintains funded and unfunded pension plans.
a)Definedcontributionplans Contributions to defined contribution plans are recognized as an expense in the income statement when incurred. A defined contribution plan is a pension plan under which AB InBev pays fixed contributions into a fund. AB InBev has no legal or constructive obligations to pay further contributions if the fund does not hold sufficient assets to pay all employees the benefits relating to employee service in the current and prior periods.
b)Definedbenefitplans A defined benefit plan is a pension plan that is not a defined contribution plan. Typically defined benefit plans define an amount of pension benefit that an employee will receive on retirement, usually dependent on one or more factors such as age, years of service and compensation. For defined benefit plans, the pension expenses are assessed separately for each plan using the projected unit credit method. The projected unit credit method considers each period of service as giving rise to an additional unit of benefit entitlement. Under this method, the cost of providing pensions is charged to the income statement so as to spread the regular cost over the service lives of employees in accordance with the advice of qualified actuaries who carry out a full valuation of the plans at least every three years. The amounts charged to the income statement include current service cost, net interest cost (income), past service costs and the effect of any curtailments or settlements. Past service costs are recognized at the earlier of when the amendment / curtailment occurs or when the company recognizes related restructuring or termination costs. The pension obligations recognized in the balance sheet are measured at the present value of the estimated future cash outflows using interest rates based on high quality corporate bond yields, which have terms to maturity approximating the terms of the related liability, less the fair value of any plan assets. Re-measurements, comprising of actuarial gains and losses, the effect of the asset ceiling (excluding net interest) and the return on plan assets (excluding net interest) are recognized in full in the period in which they occur in the statement of comprehensive income. Re-measurements are not reclassified to profit or loss in subsequent periods.
Where the calculated amount of a defined benefit liability is negative (an asset), AB InBev recognizes such pension asset to the extent that economic benefits are available to AB InBev either from refunds or reductions in future contributions.
Otherpost-employmentobligations Some AB InBev companies provide post-employment medical benefits to their retirees. The entitlement to these benefits is usually based on the employee remaining in service up to retirement age. The expected costs of these benefits are accrued over the period of employment, using an accounting methodology similar to that for defined benefit pension plans.
Terminationbenefits Termination benefits are recognized as an expense at the earlier when the company is demonstrably committed, without realistic possibility of withdrawal, to a formal detailed plan to terminate employment before the normal retirement date and when the company recognizes costs for a restructuring. Termination benefits for voluntary redundancies are recognized if the company has made an offer encouraging voluntary redundancy, it is probable that the offer will be accepted, and the number of acceptances can be estimated reliably.
Bonuses Bonuses received by company employees and management are based on pre-defined company and individual target achievement. The estimated amount of the bonus is recognized as an expense in the period the bonus is earned. To the extent that bonuses are settled in shares of the company, they are accounted for as share-based payments.
(T)Share-basedpaymentsDifferent share and share option programs allow company senior management and members of the board to acquire shares of the company and some of its affiliates. AB InBev adopted IFRS 2 Share-based Payment on 1 January 2005 to all awards granted after 7 November 2002 that had not yet vested at 1 January 2005. The fair value of the share options is estimated at grant date, using an option pricing model that is most appropriate for the respective option. Based on the expected number of options that will vest, the fair value

90 / 91Anheuser-Busch InBev
Annual Report 2013
of the options granted is expensed over the vesting period. When the options are exercised, equity is increased by the amount of the proceeds received.
(U)Interest-bearingloansandborrowingsInterest-bearing loans and borrowings are recognized initially at fair value, less attributable transaction costs. Subsequent to initial recognition, interest-bearing loans and borrowings are stated at amortized cost with any difference between the initial amount and the maturity amount being recognized in the income statement (in accretion expense) over the expected life of the instrument on an effective interest rate basis.
(V)TradeandOtherPayablesTrade and other payables are recognized initially at fair value and subsequently measured at amortized cost using the effective interest method.
(W)IncomeTaxIncome tax on the profit for the year comprises current and deferred tax. Income tax is recognized in the income statement except to the extent that it relates to items recognized directly in equity, in which case the tax effect is also recognized directly in equity.
Current tax is the expected tax payable on the taxable income for the year, using tax rates enacted, or substantively enacted, at the balance sheet date, and any adjustment to tax payable in respect of previous years.
In accordance with IAS 12 Income Taxes deferred taxes are provided using the so-called balance sheet liability method. This means that, for all taxable and deductible differences between the tax bases of assets and liabilities and their carrying amounts in the balance sheet a deferred tax liability or asset is recognized. Under this method a provision for deferred taxes is also made for differences between the fair values of assets and liabilities acquired in a business combination and their tax base. IAS 12 prescribes that no deferred taxes are recognized i) on initial recognition of goodwill, ii) at the initial recognition of assets or liabilities in a transaction that is not a business combination and affects neither accounting nor taxable profit and iii) on differences relating to investments in subsidiaries to the extent that they will probably not reverse in the foreseeable future. The amount of deferred tax provided is based on the expected manner of realization or settlement of the carrying amount of assets and liabilities, using currently or substantively enacted tax rates.
Deferred tax assets and liabilities are offset if there is a legally enforceable right to offset current tax liabilities and assets, and they relate to income taxes levied by the same tax authority on the same taxable entity, or on different taxable entities which intend either to settle current tax liabilities and assets on a net basis, or to realize the assets and settle the liabilities simultaneously.
The company recognizes deferred tax assets, including assets arising from losses carried forward, to the extent that future probable taxable profit will be available against which the deferred tax asset can be utilized. A deferred tax asset is reduced to the extent that it is no longer probable that the related tax benefit will be realized.
Tax claims are recorded within provisions on the balance sheet (refer accounting policy R).
(X)IncomerecognitionIncome is recognized when it is probable that the economic benefits associated with the transaction will flow to the company and the income can be measured reliably.
Goods sold In relation to the sale of beverages and packaging, revenue is recognized when the significant risks and rewards of ownership have been transferred to the buyer, and no significant uncertainties remain regarding recovery of the consideration due, associated costs or the possible return of goods, and there is no continuing management involvement with the goods. Revenue from the sale of goods is measured at the fair value of the consideration received or receivable, net of returns and allowances, trade discounts, volume rebates, discounts for cash payments and excise taxes.
Rentaland royalty income Rental income is recognized under other operating income on a straight-line basis over the term of the lease. Royalties arising from the use by others of the company’s resources are recognized in other operating income on an accrual basis in accordance with the substance of the relevant agreement.
Government grants A government grant is recognized in the balance sheet initially as deferred income when there is reasonable assurance that it will be received and that the company will comply with the conditions attached to it. Grants that compensate the company for expenses incurred are recognized as other operating income on a systematic basis in the same periods in which the expenses are incurred. Grants that compensate the company for the acquisition of an asset are presented by deducting them from the acquisition cost of the related asset in accordance with IAS 20 Accounting for Government Grants and Disclosure of Government Assistance.

7/ Financial Report
Finance income Finance income comprises interest received or receivable on funds invested, dividend income, foreign exchange gains, losses on currency hedging instruments offsetting currency gains, gains on hedging instruments that are not part of a hedge accounting relationship, gains on financial assets classified as trading as well as any gains from hedge ineffectiveness (refer accounting policy Z).
Interest income is recognized as it accrues (taking into account the effective yield on the asset) unless collectability is in doubt.
Dividend income Dividend income is recognized in the income statement on the date that the dividend is declared.
(Y)ExpensesFinance costs Finance costs comprise interest payable on borrowings, calculated using the effective interest rate method, foreign exchange losses, gains on currency hedging instruments offsetting currency losses, results on interest rate hedging instruments, losses on hedging instruments that are not part of a hedge accounting relationship, losses on financial assets classified as trading, impairment losses on available-for-sale financial assets as well as any losses from hedge ineffectiveness (refer accounting policy Z).
All interest costs incurred in connection with borrowings or financial transactions are expensed as incurred as part of finance costs. Any difference between the initial amount and the maturity amount of interest bearing loans and borrowings, such as transaction costs and fair value adjustments, are recognized in the income statement (in accretion expense) over the expected life of the instrument on an effective interest rate basis (refer accounting policy U). The interest expense component of finance lease payments is also recognized in the income statement using the effective interest rate method.
Researchanddevelopment,advertisingandpromotionalcostsandsystemsdevelopmentcosts Research, advertising and promotional costs are expensed in the year in which these costs are incurred. Development costs and systems development costs are expensed in the year in which these costs are incurred if they do not meet the criteria for capitalization (refer accounting policy G).
Purchasing, receivingandwarehousingcosts Purchasing and receiving costs are included in the cost of sales, as well as the costs of storing and moving raw materials and packaging materials. The costs of storing finished products at the brewery as well as costs incurred for subsequent storage in distribution centers are included within distribution expenses.
(Z)DerivativefinancialinstrumentsAB InBev uses derivative financial instruments to mitigate the transactional impact of foreign currencies, interest rates, equity prices and commodity prices on the company’s performance. AB InBev’s financial risk management policy prohibits the use of derivative financial instruments for trading purposes and the company does therefore not hold or issue any such instruments for such purposes. Derivative financial instruments that are economic hedges but that do not meet the strict IAS 39 Financial Instruments: Recognition and Measurement hedge accounting rules, however, are accounted for as financial assets or liabilities at fair value through profit or loss.
Derivative financial instruments are recognized initially at fair value. Fair value is the price that would be received to sell an asset or paid to transfer a liability in an orderly transaction between market participants at the measurement date. The fair value of derivative financial instruments is either the quoted market price or is calculated using pricing models taking into account current market rates. These pricing models also take into account the current creditworthiness of the counterparties.
Subsequent to initial recognition, derivative financial instruments are re-measured to their fair value at balance sheet date. Depending on whether cash flow or net investment hedge accounting is applied or not, any gain or loss is either recognized directly in other comprehensive income or in the income statement.
Cash flow, fair value or net investment hedge accounting is applied to all hedges that qualify for hedge accounting when the required hedge documentation is in place and when the hedge relation is determined to be effective.
Cashflowhedgeaccounting When a derivative financial instrument hedges the variability in cash flows of a recognized asset or liability, the foreign currency risk of a firm commitment or a highly probable forecasted transaction, the effective part of any resulting gain or loss on the derivative financial instrument is recognized directly in other comprehensive income (hedging reserves). When the firm commitment in foreign currency or the forecasted transaction results in the recognition of a non-financial asset or a non-financial liability, the cumulative gain or loss is removed from other comprehensive income and included in the initial measurement of the asset or liability. When the hedge relates to financial assets or liabilities, the cumulative gain or loss on the hedging instrument is reclassified from other comprehensive income into the income statement in the same period during which the hedged risk affects the income statement (e.g. when the variable interest expense is recognized). The ineffective part of any gain or loss is recognized immediately in the income statement.

92 / 93Anheuser-Busch InBev
Annual Report 2013
When a hedging instrument or hedge relationship is terminated but the hedged transaction is still expected to occur, the cumulative gain or loss (at that point) remains in equity and is reclassified in accordance with the above policy when the hedged transaction occurs. If the hedged transaction is no longer probable, the cumulative gain or loss recognized in other comprehensive income is reclassified into the income statement immediately.
Fair value hedge accounting When a derivative financial instrument hedges the variability in fair value of a recognized asset or liability, any resulting gain or loss on the hedging instrument is recognized in the income statement. The hedged item is also stated at fair value in respect of the risk being hedged, with any gain or loss being recognized in the income statement.
Net investment hedge accounting When a foreign currency liability hedges a net investment in a foreign operation, exchange differences arising on the translation of the liability to the functional currency are recognized directly in other comprehensive income (translation reserves).
When a derivative financial instrument hedges a net investment in a foreign operation, the portion of the gain or the loss on the hedging instrument that is determined to be an effective hedge is recognized directly in other comprehensive income (translation reserves), while the ineffective portion is reported in the income statement.
Investments in equity instruments or derivatives linked to and to be settled by delivery of an equity instrument are stated at cost when such equity instrument does not have a quoted market price in an active market and for which other methods of reasonably estimating fair value are clearly inappropriate or unworkable.
Offsettingderivativeassetswithderivative liabilities A derivative asset and a derivative liability shall be offset and the net amount presented in the statement of financial position when, and only when, the company has a currently legally enforceable right to set off the recognized amounts; and intends either to settle on a net basis, or to realize the asset and settle the liability simultaneously.
(AA)SegmentreportingOperating segments are components of the company’s business activities about which separate financial information is available that is evaluated regularly by management.
AB InBev’s operating segment reporting format is geographical because the company’s risks and rates of return are affected predominantly by the fact that AB InBev operates in different geographical areas. The company’s management structure and internal reporting system to the Board of Directors is set up accordingly. A geographical segment is a distinguishable component of the company that is engaged in providing products or services within a particular economic environment, which is subject to risks and returns that are different from those of other segments. In accordance with IFRS 8 Operating segments AB InBev’s reportable geographical segments were determined as North America, Mexico, Latin America North, Latin America South, Western Europe, Central and Eastern Europe, Asia Pacific and Global Export and Holding Companies. The company’s assets are predominantly located in the same geographical areas as its customers.
Segment results, assets and liabilities include items directly attributable to a segment as well as those that can be allocated on a reasonable basis. Unallocated assets comprise interest bearing loans granted, investment securities, deferred tax assets, income taxes receivable, cash and cash equivalent and derivative assets. Unallocated liabilities comprise equity and non-controlling interest, interest bearing loans, deferred tax liabilities, bank overdrafts, income taxes payable and derivative liabilities.
Segment capital expenditure is the total cost incurred during the period to acquire property, plant and equipment, and intangible assets other than goodwill.
(BB)Non-recurringitemsNon-recurring items are those that in management’s judgment need to be disclosed by virtue of their size or incidence. Such items are disclosed on the face of the consolidated income statement or separately disclosed in the notes to the financial statements. Transactions which may give rise to non-recurring items are principally restructuring activities, impairments, gains or losses on disposal of investments and the effect of the accelerated repayment of certain debt facilities.
(CC)Discontinuedoperationsandnon-currentassetsheldforsaleA discontinued operation is a component of the company that either has been disposed of or is classified as held for sale and represents a separate major line of business or geographical area of operations and is part of a single coordinated plan to dispose of or is a subsidiary acquired exclusively with a view to resale.

7/ Financial Report
AB InBev classifies a non-current asset (or disposal group) as held for sale if its carrying amount will be recovered principally through a sale transaction rather than through continuing use if all of the conditions of IFRS 5 are met. A disposal group is defined as a group of assets to be disposed of, by sale or otherwise, together as a group in a single transaction, and liabilities directly associated with those assets that will be transferred. Immediately before classification as held for sale, the company measures the carrying amount of the asset (or all the assets and liabilities in the disposal group) in accordance with applicable IFRS. Then, on initial classification as held for sale, non-current assets and disposal groups are recognized at the lower of carrying amount and fair value less costs to sell. Impairment losses on initial classification as held for sale are included in profit or loss. The same applies to gains and losses on subsequent re-measurement. Non-current assets classified as held for sale are no longer depreciated or amortized.
(DD)RecentlyissuedIFRSTo the extent that new IFRS requirements are expected to be applicable in the future, they have been summarized hereafter. For the year ended 31 December 2013, they have not been applied in preparing these consolidated financial statements.
IFRS 9 Financial Instruments:IFRS 9 is the standard issued as part of a wider project to replace IAS 39. IFRS 9 retains but simplifies the mixed measurement model and established two primary measurement categories for financial assets: amortized cost and fair value. The basis of classification depends on the entity’s business model and the contractual cash flow characteristics of the financial asset. IFRS 9 also introduces a new hedge accounting model, together with corresponding disclosures about risk management for those companies applying hedge accounting. Because the impairment phase of the IFRS 9 project has not yet been completed, the IASB decided that the mandatory effective date should be decided upon when the entire IFRS 9 project is closer to completion.
Other standards, interpretations and amendments to standards A number of other amendments to standards are effective for annual periods beginning after 1 January 2013, and have not been listed above because of either their non-applicability to or their immateriality to AB InBev’s consolidated financial statements.
4. Use of Estimates and Judgments
The preparation of financial statements in conformity with IFRS requires management to make judgments, estimates and assumptions that affect the application of policies and reported amounts of assets and liabilities, income and expenses. The estimates and associated assumptions are based on historical experience and various other factors that are believed to be reasonable under the circumstances, the results of which form the basis of making the judgments about carrying values of assets and liabilities that are not readily apparent from other sources. Actual results may differ from these estimates.
The estimates and underlying assumptions are reviewed on an ongoing basis. Revisions to accounting estimates are recognized in the period in which the estimate is revised if the revision affects only that period or in the period of the revision and future periods if the revision affects both current and future periods.
Although each of its significant accounting policies reflects judgments, assessments or estimates, AB InBev believes that the following accounting policies reflect the most critical judgments, estimates and assumptions that are important to its business operations and the understanding of its results: business combinations, intangible assets, goodwill, impairment, provisions, share-based payments, employee benefits and accounting for current and deferred tax.
The fair values of acquired identifiable intangibles are based on an assessment of future cash flows. Impairment analyses of goodwill and indefinite-lived intangible assets are performed annually and whenever a triggering event has occurred, in order to determine whether the carrying value exceeds the recoverable amount. These calculations are based on estimates of future cash flows.
The company uses its judgment to select a variety of methods including the discounted cash flow method and option valuation models and makes assumptions about the fair value of financial instruments that are mainly based on market conditions existing at each balance sheet date.
Actuarial assumptions are established to anticipate future events and are used in calculating pension and other long-term employee benefit expense and liability. These factors include assumptions with respect to interest rates, rates of increase in health care costs, rates of future compensation increases, turnover rates, and life expectancy.

94 / 95Anheuser-Busch InBev
Annual Report 2013
The company is subject to income tax in numerous jurisdictions. Significant judgment is required in determining the worldwide provision for income tax. There are some transactions and calculations for which the ultimate tax determination is uncertain. Some subsidiaries within the group are involved in tax audits and local enquiries usually in relation to prior years. Investigations and negotiations with local tax authorities are ongoing in various jurisdictions at the balance sheet date and, by their nature, these can take considerable time to conclude. In assessing the amount of any income tax provisions to be recognized in the financial statements, estimation is made of the expected successful settlement of these matters. Estimates of interest and penalties on tax liabilities are also recorded. Where the final outcome of these matters is different from the amounts that were initially recorded, such differences will impact the current and deferred income tax assets and liabilities in the period such determination is made.
Judgments made by management in the application of IFRS that have a significant effect on the financial statements and estimates with a significant risk of material adjustment in the next year are further discussed in the relevant notes hereafter.
In preparing these consolidated financial statements, the significant judgments made by management in applying the company’s accounting policies and the key sources of estimating uncertainty mainly related to the valuation of the individual assets acquired and liabilities assumed as part of the allocation of the Grupo Modelo purchase price. The company is in the process of finalizing the allocation of the purchase price to the individual assets acquired and liabilities assumed in compliance with IFRS 3. Following the AB InBev and Grupo Modelo combination, AB InBev is fully consolidating Grupo Modelo in the AB InBev consolidated financial statements as of 4 June 2013. Detail is provided in Note 6 – Acquisitions and disposals of Subsidiaries of these consolidated financial statements.
5. Segment Reporting
Segment information is presented by geographical segments, consistent with the information that is available and evaluated regularly by the chief operating decision maker. AB InBev operates its business through eight zones. Regional and operating company management is responsible for managing performance, underlying risks, and effectiveness of operations. Internally, AB InBev’s management uses performance indicators such as normalized profit from operations (normalized EBIT) and normalized EBITDA as measures of segment performance and to make decisions regarding allocation of resources. These measures are reconciled to segment profit in the tables presented (figures may not add up due to rounding).
AB InBev has updated its 2012 segment reporting for purposes of internal review by senior management. This presentation (further referred to as the “2012 Reference base”) includes Grupo Modelo’s results as from 4 June 2012, for comparative purposes. The 2012 Reference base also reflects the effects of retrospective application on the revised IAS 19 - Employee Benefits (see Note 3 Summary of significant accounting policies) and the transfer of management responsibility for Ecuador and Peru to the Zone Latin America South. These countries were previously reported within the Zone Latin America North, thus with no impact at the consolidated level. The tables below provide the segment information per zone for the twelve-month period ended 31 December 2012 and 2013 in the format that is used by management to monitor performance. The differences between the 2012 Reference base and the 2012 audited income statement as Reported represent the effect of the combination with Grupo Modelo.

7/ Financial Report
All figures in the table below are stated in million US dollar, except volume (million hls) and full time equivalents (FTE in units).
SEGMENT REPORTING (2012 REFERENCE BASE) – NON-AUDITED
NorthAmerica Mexico LatinAmericaNorth
2012 2012 2012 Reference Reference Reference
2013 base 2013 base 2013 base
Volume 122 125 22 23 119 122Revenue 16023 16028 2769 2616 10877 11268Costofsales (6519) (6615) (869) (1014) (3494) (3519)Distributionexpenses (1235) (1319) (232) (270) (1338) (1277)Salesandmarketingexpenses (1908) (1794) (484) (515) (1145) (1204)Administrativeexpenses (497) (452) (234) (338) (589) (612)Otheroperatingincome/(expenses) 67 64 104 102 807 426Normalizedprofitfromoperations(EBIT) 5932 5911 1054 582 5118 5081Depreciation,amortizationandimpairment (796) (824) (227) (196) (701) (706)NormalizedEBITDA 6728 6735 1281 777 5819 5787
NormalizedEBITDAmarginin% 42.0% 42.0% 46.3% 29.7% 53.5% 51.4%
SEGMENT REPORTING (2012 REPORTED)
NorthAmerica Mexico LatinAmericaNorth
2013 20121 2013 20121 2013 20121
Volume 122 125 22 – 119 122Revenue 16023 16028 2769 – 10877 11268Costofsales (6519) (6615) (869) – (3494) (3519)Distributionexpenses (1235) (1319) (232) – (1338) (1277)Salesandmarketingexpenses (1908) (1794) (484) – (1145) (1204)Administrativeexpenses (497) (452) (234) – (589) (612)Otheroperatingincome/(expenses) 67 64 104 – 807 426Normalizedprofitfromoperations(EBIT) 5932 5911 1054 – 5118 5081Non-recurringitems(referNote8) (5) 47 (54) – (6) (26)Profitfromoperations(EBIT) 5927 5958 1000 – 5112 5055Netfinance(cost)/income (494) (565) (1059) – (418) (371)Shareofresultofassociates 278 624 11 – 5 –Profit/(loss)beforetax 5710 6017 (47) – 4698 4684Incometaxexpense (1216) (1386) (112) – (386) (490)Profit/(loss) 4495 4631 (159) – 4312 4194
NormalizedEBITDA 6728 6735 1281 – 5819 5787Non-recurringitems(includingimpairment) (5) 47 (54) – (6) (26)Depreciation,amortizationandimpairment (796) (824) (226) – (702) (706)Netfinance(cost)/income (494) (565) (1059) – (418) (371)Shareofresultsofassociates 278 624 11 – 5 –
Incometaxexpense (1216) (1386) (112) – (386) (490)Profit/(loss) 4495 4631 (159) – 4312 4194NormalizedEBITDAmargin% 42.0% 42.0% 46.3% – 53.5% 51.4%
Segmentassets 64639 72845 30259 – 17436 18268Intersegmentelimination Non-segmentedassets TotalassetsSegmentliabilities 6690 8292 3653 – 5675 7228Intersegmentelimination Non-segmented itemsTotalequityandliabilitiesGrosscapex 588 449 202 – 1411 1225Additionto/(reversalof)provisions 8 13 (1) – 188 134FTE 16852 17136 34203 – 37722 3565312012 as Reported, adjusted to reflect the effects of retrospective application on the revised IAS 19 Employee Benefits (see Note 3 Summary of significant accounting policies).

96 / 97Anheuser-Busch InBev
Annual Report 2013
CentralandEastern Globalexportand EffectofLatinAmericaSouth WesternEurope Europe AsiaPacific HoldingCompanies acquisition Consolidated
2012 2012 2012 2012 2012 2012 Reference Reference Reference Reference Reference Bridgeto 2012
2013 base 2013 base 2013 base 2013 base 2013 base 2013 Reported 2013 Reported1
37 38 28 30 19 23 66 58 12 12 (28) 426 4033269 3209 3620 3650 1445 1668 3354 2690 1839 1798 (3169) 43195 39758(1185) (1244) (1544) (1555) (776) (914) (1885) (1565) (1323) (1328) 1332 (17594) (16422)(309) (296) (364) (369) (146) (184) (302) (235) (135) (132) 295 (4061) (3787)(346) (336) (673) (663) (378) (400) (833) (670) (191) (220) 549 (5958) (5254)(112) (108) (264) (259) (98) (113) (317) (274) (429) (386) 345 (2539) (2200)(5) 4 27 24 3 5 109 121 48 47 (109) 1160 684
1311 1228 801 827 51 62 127 67 (191) (221) (758) 14203 12779(180) (191) (324) (336) (174) (195) (419) (329) (165) (166) 197 (2985) (2746)1491 1419 1125 1163 225 257 546 396 (25) (54) (955) 17188 15525
45.6% 44.2% 31.1% 31.9% 15.6% 15.4% 16.3% 14.7% 39.8% 39.0%
CentralandEastern GlobalexportandLatinAmericaSouth WesternEurope Europe AsiaPacific HoldingCompanies Consolidated
2013 20121 2013 20121 2013 20121 2013 20121 2013 20121 2013 20121
37 38 28 30 19 23 66 58 12 7 426 4033269 3209 3620 3625 1445 1668 3354 2690 1839 1270 43195 39758(1185) (1244) (1544) (1550) (776) (914) (1885) (1565) (1323) (1015) (17594) (16422)(309) (296) (364) (364) (146) (184) (302) (235) (135) (111) (4061) (3787)(346) (336) (673) (650) (378) (400) (833) (670) (191) (200) (5958) (5254)(112) (108) (264) (257) (98) (113) (317) (274) (429) (382) (2539) (2200)(5) 4 27 24 3 5 109 121 48 40 1160 684
1311 1228 801 828 51 62 127 67 (191) (398) 14203 12779(5) – (32) (2) (5) (5) (26) 2 6372 (47) 6240 (32)
1306 1228 770 825 46 57 101 69 6181 (445) 20443 12747(317) (60) (589) (378) (82) (117) 8 – 749 (877) (2203) (2366)
– – 1 – – – – – – 294 624989 1169 181 448 (37) (60) 109 69 6930 (1322) 18534 11005(457) (340) 14 (138) 13 (13) (53) (53) 181 740 (2016) (1680)532 828 195 310 (24) (73) 56 16 7112 (582) 16518 9325
1491 1419 1125 1163 225 257 546 396 (25) (231) 17188 15525(5) – (32) (2) (5) (5) (26) 2 6372 (47) 6240 (32)
(180) (191) (323) (336) (175) (195) (419) (329) (165) (167) (2985) (2746)(317) (60) (589) (378) (82) (117) 8 – 749 (877) (2203) (2366)
– – – 1 – – – – – – 294 624
(457) (340) 14 (138) 13 (13) (53) (53) 181 740 (2016) (1680)532 828 195 310 (24) (73) 56 16 7112 (582) 16518 9325
45.6% 44.2% 31.1% 32.1% 15.5% 15.4% 16.3% 14.7% – – 39.8% 39.0%
3483 4335 6557 5939 1908 2153 6246 5028 4242 3865 134769 112432 (5171) (5557) 12068 15746 141666 122621
1228 1782 4402 3751 517 578 2996 2467 3133 2242 28293 26341 (5171) (5557)
118544 101837 141666 122621
299 287 307 295 131 127 817 786 84 143 3839 33121 3 33 3 (2) 1 11 (2) (19) (208) 219 (57)
10482 10924 7764 8066 7948 9510 37680 34455 1936 1888 154587 117632

7/ Financial Report
Net revenue from the beer business amounted to 39 080m US dollar while the net revenue from the non-beer business (soft drinks and other business) accounted for 4 115m US dollar.
Net revenue from external customers attributable to AB InBev’s country of domicile (Belgium) and non-current assets located in the country of domicile represented 880m US dollar and 1 304m US dollar, respectively.
6. Acquisitions and disposals of subsidiaries
The table below summarizes the impact of acquisitions on the Statement of financial position of AB InBev for 31 December 2013 and 2012:
2013 2012 2013 2012Million US dollar Acquisitions Acquisitions Disposals Disposals
Non-current assetsProperty, plant and equipment 4 818 382 – (11)Intangible assets 5 068 540 – –Investment in subsidiaries 44 – – –Investment in associates 75 – – –Investment securities 19 – – –Deferred tax assets 14 – – –Trade and other receivables 65 312 – –
Current assetsInventories 605 39 – (4)Income tax receivable 1 5 – –Trade and other receivables 676 48 – –Cash and cash equivalents 2 674 29 – (6)Assets held for sale 5 385 2 – –
Non-controlling interests (11) – – –
Non-current liabilitiesInterest-bearing loans and borrowings – (229) – –Trade and other payables (566) (10) – –Employee benefits (256) (11) – –Provisions (21) (21) – –Deferred tax liabilities (1 157) (145) – –
Current liabilitiesInterest-bearing loans and borrowings (68) (45) – –Income tax payable (1 502) – – –Trade and other payables (1 258) (59) – 4Provision (17) – – –
Netidentifiableassetsandliabilities 14588 837 – (17)Goodwill on acquisitions 19 988 1 113 – –Loss/(gain) on disposal – – (42) (22)Acquisition-date fair value of the previously held equity interest (12 946) – – –Shareholdings increases (11) – – –Decrease/(increase) on non-controlling interests on shareholdings increases – (334) – –Consideration to be paid (1 509) (2) – –Net cash paid on prior years acquisitions 3 14 – –Non-cash consideration – (154) – –
Considerationpaid/(received),satisfiedincash 20113 1474 (42) (39)Cash (acquired)/ disposed of (2 674) (29) – 6
Netcashoutflow/(inflow) 17439 1445 (42) (33)

98 / 99Anheuser-Busch InBev
Annual Report 2013
2013AcquisitionsThe following transactions took place in 2013:
CombinationwithGrupoModelo
On 4 June 2013, AB InBev completed the combination with Grupo Modelo pursuant to the Transaction agreement between AB InBev and Grupo Modelo S.A.B de CV announced on 29 June 2012. This agreement was a natural next step, given AB InBev’s economic stake of more than 50% in Grupo Modelo, prior to the transaction and the successful long-term partnership between the two companies. The combined company will lead the beer industry with roughly 400m hectoliters of beer volume annually.
The combination was completed through a series of steps that simplif ied Grupo Modelo’s corporate structure, followed by an all-cash tender offer by AB InBev for all outstanding Grupo Modelo shares that it did not own at that time for 9.15 US dollar per share, in a transaction value at 20.1 billion US dollar. By 4 June 2013 and following the settlement of the tender offer AB InBev owned approximately 95% of Grupo Modelo’s outstanding shares. On 4 June 2013, AB InBev established and funded a Trust that will accept further tender of shares by Grupo Modelo shareholders at a price of 9.15 US dollar per share over a period of up to 25 months, during which time Grupo Modelo will continue to be quoted on the Mexican stock exchange. As of 31 December 2013, AB InBev owned approximately 96% of Grupo Modelo’s outstanding shares and 1.5 billion US dollar is deposited with the Trust and are reported in these audited financial statements as restricted cash. AB InBev recognized a liability for the Grupo Modelo shares it did not acquire by 31 December 2013 (see also Note 21 Cash and cash equivalents and Note 28 Trade and other payables).
AB InBev financed the transactions with funds drawn under the 2012 Facilities Agreement and cash, cash equivalents and short term investment in debt securities the company had accumulated pending the closing of the Grupo Modelo transaction. In June 2013, AB InBev fully repaid the portion of the 2012 Facilities Agreement that was drawn for the combination and terminated the 2012 Facilities Agreement (see also Note 17 Investment securities, Note 21 Cash and cash equivalents and Note 24 Interest bearing loans and borrowings).
Transaction costs for the combination approximated 0.1 billion US dollar and were reported as incurred in the non-recurring expenses in 2012 and 2013.
On 23 April 2013, as part of a Grupo Modelo pre-closing corporate structure reorganization, AB InBev performed a capital increase in Grupo Modelo. The 959m US dollar capital contribution increased the cash at closing held by Grupo Modelo without impact on the net purchase consideration.
For business combinations achieved in stages, IFRS requires that any previously held interest of an acquirer in an acquiree is adjusted to its fair value as of the acquisition date with any resulting gain (or loss) reported in the consolidated income statement. IFRS also requires that any amounts previously recognized in the consolidated statement of other comprehensive income (“OCI”) related to such investment be recycled to the consolidated income statement, as if such investment was sold. AB InBev has estimated the fair value of the initial 50.34% economic interest it held directly and indirectly in Grupo Modelo at 12.9 billion US dollar and has recycled 199m US dollar from OCI to the consolidated income statement, resulting in a net non-recurring, non-cash gain of 6.4 billion US dollar (see also Note 8 Non-recurring items).
The company is in the process of finalizing the allocation of the purchase price to the individual assets acquired and liabilities assumed in compliance with IFRS 3. The provisional allocation of the purchase price included in the balance sheet and detailed in the table below is based on the current best estimates of AB InBev’s management with input from independent third parties. The completion of the purchase price allocation may result in further adjustment to the carrying value of Grupo Modelo’s recorded assets and liabilities and the determination of any residual amount that will be allocated to goodwill.

7/ Financial Report
The following table presents the provisional allocation of purchase price to the Grupo Modelo business:
BeforePurchase PurchasePrice AfterPurchaseMillion US dollar Price Allocation Allocation Price Allocation
Non-current assetsProperty, plant and equipment 4 609 99 4 708Goodwill 796 (796) –Intangible assets 458 4 454 4 912Investment in associates 79 (4) 75Investment securities 19 – 19Trade and other receivables 65 – 65
Current assetsInventories 630 (41) 589Trade and other receivables 617 (11) 606Income tax receivable 91 (91) –Assets held for sale 909 4 476 5 385Cash and cash equivalent 2 610 – 2 610
Non-current liabilitiesEmployee benefits (256) – (256)Provisions (1) (20) (21)Trade and other payables (77) (489) (566)Deferred tax liabilities (418) (714) (1 132)
Current liabilitiesInterest-bearing loans and borrowings (67) – (67)Income tax payable – (1 468) (1 468)Trade and other payables (845) (182) (1 027)Provisions (16) – (16)
Netidentifiedassetsandliabilities 9203 5214 14417
Goodwill on acquisition 19 592
Netassetsacquired 34008
Cash consideration (including Trust) 20 103Acquisition-date fair value of the previously held equity interest 12 946Equity increase 23 April 2013 959
Totalgrosspurchaseconsideration 34008
Cash and cash equivalent acquired (2 610)
Totalnetpurchaseconsideration 31398
The transaction resulted in 19.6 billion US dollar of goodwill provisionally allocated primarily to the Mexico business. The factors that contributed to the recognition of goodwill include the acquisition of an assembled workforce and the premiums paid for cost synergies expected to be achieved in Grupo Modelo. Management’s assessment of the future economic benefits supporting recognition of this goodwill is in part based on expected savings through the implementation of AB InBev best practices such as, among others, a zero based budgeting program and initiatives that are expected to bring greater efficiency and standardization, generate cost savings and maximize purchasing power. Goodwill also arises due to the recognition of deferred tax liabilities in relation to the preliminary fair value adjustments on acquired intangible assets for which the amortization does not qualify as a tax deductible expense. None of the goodwill recognized is deductible for tax purposes.
The valuation of the property, plant and equipment, intangible assets, investment in associates, interest bearing loans and borrowings and employee benefits and other assets and liabilities are based on the current best estimates of AB InBev’s management, with input from independent third parties.
The majority of the intangible asset valuation relates to brands with indefinite life. The valuation of the brands with indefinite life is based on a series of factors, including the brand history, the operating plan and the countries in which the brands are sold. The intangibles with an indefinite life mainly include the Corona brand family, the Modelo brand family and the Victoria brand family and have been fair valued for a total amount of 4.5 billion US dollar.
A deferred tax liability has been accrued on most fair value adjustments considering a tax rate of 30%.

100 / 101Anheuser-Busch InBev
Annual Report 2013
On 7 June 2013, in a transaction related to the combination of AB InBev and Grupo Modelo, Grupo Modelo completed the sale of its US business to Constellation Brands, Inc. (“Constellation”). The transaction included the sale of Grupo Modelo’s 50% stake in Crown Imports for a total consideration of 1.845 billion US dollar and the sale of the Grupo Modelo’s Piedras Negras brewery and perpetual rights to Grupo Modelo’s brands distributed by Crown in the US for 2.9 billion US dollar, subject to a post-closing adjustment estimated at 558m US dollar and collectable in 2014. These assets were recognized as assets held for sale at their after tax net realizable value in the opening balance sheet. AB InBev recognized a receivable for the post-closing adjustment by 31 December 2013 (see also Note 20 Trade and other receivables).
AB InBev and Constellation have established a three-year transition services agreement to ensure the smooth transition of the operations of the Piedras Negras brewery. A temporary supply agreement has also been negotiated as part of the acquisition agreements whereby Constellation can purchase inventory from AB InBev under a specified pricing until the Piedras Negras brewery business acquires the necessary capacity to fulfill 100 percent of the US demand. As part of the opening balance sheet AB InBev recognized a liability of 289m US dollar for prepaid discounts related to the temporary supply agreement. The prepaid discount will be amortized in the consolidated income statement in line with volumes sold to Constellation. As of 4 June 2013, the completion date of the transaction, Grupo Modelo contributed 3 340m US dollar to the revenue and 600m US dollar to the profit of AB InBev. If the acquisition date had been 1 January 2013 it is estimated that AB InBev’s unaudited combined revenue, profit from operations and profit would have been higher by 2.4 billion US dollar, 0.6 billion US dollar, and 0.5 billion US dollar respectively. The unaudited combined data includes certain purchase accounting adjustments such as the estimated changes in depreciations and amortization expenses on acquired tangible and intangible assets. However, the unaudited combined results do not include any anticipated cost savings or other effects of the planned integration of Grupo Modelo. Accordingly, such amounts are not necessarily indicative of the results if the combination had occurred on 1 January 2013 or that may result in the future.
Otheracquisitions On 27 April 2013, AB InBev completed a transaction to acquire four breweries in China with a total capacity of approximately 9 million hectoliters. The aggregate purchase price was approximately 439m USD. The acquired business had an immaterial impact on profit in 2013. The company is in the process of finalizing the allocation of the purchase price to the individual assets acquired and liabilities assumed in compliance with IFRS 3.
During 2013, AB InBev acquired different distributors in Brazil and in the US for a total consideration of 90m US dollar. The acquired businesses had an immaterial impact on profit in 2013. The company is in the process of finalizing the allocation of the purchase price to the individual assets acquired and liabilities assumed in compliance with IFRS 3.
During 2013, Ambev acquired an additional stake in Cervecería Nacional Dominicana S.A. (“CND”) for a total consideration of 22m US dollar, as part of the 2012 transaction in which Ambev acquired a controlling interest in CND. As at 31 December 2013 Ambev owned a total indirect interest of 55.0% in CND.
During 2013, AB InBev paid 3.0m US dollar to former Anheuser-Busch shareholders (14m US dollar in 2012). By 31 December 2013, 8m US dollar consideration remains payable to former Anheuser-Busch shareholders whom did not yet claim the proceeds. This payable is recognized as a deferred consideration on acquisitions.
2012AcquisitionsOn 11 May 2012, AB InBev announced that Ambev and E. León Jimenes S.A. (“ELJ”), which owned 83.5% of Cervecería Nacional Dominicana S.A. (“CND”), closed a transaction to form a strategic alliance to create the leading beverage company in the Caribbean through the combination of their businesses in the region. Ambev’s initial indirect interest in CND was acquired through a cash payment of 1 025m US dollar and the contribution of Ambev Dominicana. Separately, Ambev Brazil acquired an additional stake in CND of 9.3%, which was owned by Heineken N.V., for 237m US dollar at the closing date. During September, as part of the same transaction, Ambev acquired an additional stake from other minority holders, through a cash payment of 24m US dollar.
In the US, the company acquired Western Beverage LLC in Eugene, Oregon and K&L Distributors, Inc. in Renton, Washington, both major wholesalers in those territories. Furthermore, Ambev acquired all the shares issued by the company Lachaise Aromas e Participações Ltda., whose main corporate purpose is the production of flavorings, a necessary component in the production of concentrates.
2013DisposalsDuring 2013, AB InBev collected 42m US dollar proceeds from prior years’ sale of the Central European operations to CVC Capital Partners.

7/ Financial Report
2012 DisposalsOn 1 July 2012, AB InBev sold its investment in the company Eagle Brands Wedco in Miami, Florida, US for a total gross consideration of 39m US dollar. As a result of the sale, AB InBev recorded a non-recurring gain of 22m US dollar – see Note 8 Non-recurring items.
7. Other Operating Income/(expenses)
MillionUSdollar 2013 2012
Government grants 614 469License income 125 111Net (additions to)/reversals of provisions (31) (15)Net gain on disposal of property, plant and equipment, intangible assets and assets held for sale 32 38Net rental and other operating income 420 81
1160 684Research expenses as incurred 185 182
The government grants relate primarily to fiscal incentives given by certain Brazilian states and Chinese provinces, based on the company’s operations and developments in those regions.
Net rental and other operating income increased from 81m US dollar in 2012 to 420m US dollar in 2013. This increase results from the combination with Grupo Modelo, the positive outcome of a series of claims and the recognition of receivables related to indirect taxes and 143m US dollar one time gain related to recovery of restricted funds.
In 2013, the company expensed 185m US dollar in research, compared to 182m US dollar in 2012. Part of this was expensed in the area of market research, but the majority is related to innovation in the areas of process optimization especially as it pertains to capacity, new product developments and packaging initiatives.
8. Non-Recurring Items
IAS 1 Presentation of financial statements requires material items of income and expense to be disclosed separately. Non-recurring items are items, which in management’s judgment, need to be disclosed by virtue of their size or incidence in order for the user to obtain a proper understanding of the financial information. The company considers these items to be of significance in nature, and accordingly, management has excluded these from their segment measure of performance as noted in Note 5 Segment Reporting.
The non-recurring items included in the income statement are as follows:
MillionUSdollar 2013 2012
Restructuring (including impairment losses) (118) (36)Fair value adjustments 6 410 –Acquisition costs business combinations (82) (54)Business and asset disposal (including impairment losses) 30 58
Impactonprofitfromoperations 6240 (32)Non-recurring net finance cost 283 (18)Non-recurring taxes (70) (1)Non-recurring non-controlling interest 5 10
NetimpactonprofitattributabletoequityholdersofABInBev 6458 (41)
The non-recurring restructuring charges for 2013 total (118)m US dollar. These charges primarily relate to the integration of Grupo Modelo, the integration of Cervecería Nacional Dominicana S.A. and to organizational alignments in China, Europe, North America, and Latin America. These changes aim to eliminate overlap or duplicated processes, taking into account the right match of employee profiles with the new organizational requirements. The 2012 non-recurring restructuring charges total (36)m US dollar. These charges primarily relate to organizational alignments in North America and Europe and to the integration of Cervecería Nacional Dominicana S.A. These one-time expenses, as a result of the series of decisions, provide the company with a lower cost base in addition to a stronger focus on AB InBev’s core activities, quicker decision-making and improvements to efficiency, service and quality.

102 / 103Anheuser-Busch InBev
Annual Report 2013
Fair value adjustments recognized in 2013 for a total of 6 410m US dollar, mainly relate to 6 415m US dollar exceptional, non-cash impact of revaluing the initial investment held in Grupo Modelo and the recycling to the consolidated income statement of amounts related to the investment, previously recognized in the consolidated statement of comprehensive income in line with IFRS 3 – see also Note 6 Acquisitions and disposals of subsidiaries.
Acquisition costs of business combinations amount to (82)m US dollar for the year ended 31 December 2013 relate to cost incurred for the combination with Grupo Modelo and the acquisition of four breweries in China on 27 April 2013. The 2012 acquisition costs of business combinations amount to (54)m US dollar for 2012 relate to the cost incurred for the combination with Grupo Modelo and the acquisition of Cervecería Nacional Dominicana - see also Note 6 Acquisitions and disposals of subsidiaries.
The business and asset disposals (including impairment losses) resulted in a net gain of 30m US dollar in 2013 mainly attributable to the additional proceeds from the sale of the Central European operations to CVC Capital Partners and a net gain of 58m US dollar in 2012 mainly attributable to the sale of non-core assets in the United States.
The company also incurred non-recurring net f inance income of 283m US dollar for the year ended 31 December 2013 versus (18)m US dollar for the year ended 31 December 2012 – see also Note 11 Finance cost and income.
All the above amounts are before income taxes. The 2013 and 2012 non-recurring items as at 31 December increased income taxes by (70)m US dollar and increased income taxes by (1)m US dollar respectively.
Non-controlling interest on the non-recurring items amounts to 5m US dollar in 2013 versus 11m US dollar in 2012.
9. Payroll and Related Benefits
MillionUSdollar 2013 2012
Wages and salaries (4 137) (3 199)Social security contributions (722) (607)Other personnel cost (807) (680)Pension expense for defined benefit plans (141) (86)Share-based payment expense (243) (201)Contributions to defined contribution plans (117) (41)
(6167) (4814)Number of full time equivalents (FTE) 154 587 117 632
The number of full time equivalents can be split as follows:
2013 2012
AB InBev NV (parent company) 184 319Other subsidiaries 152 441 115 343Proportionally consolidated entities 1 962 1 970
154587 117632
Note 5 Segment reporting contains the split of the FTE by geographical segment.
10. Additional Information on Operating Expenses by Nature
Depreciation, amortization and impairment charges are included in the following line items of the 2013 income statement:
Depreciation and Amortization and impairment of property, impairment of Impairment
MillionUSdollar plantandequipment intangibleassets ofgoodwill
Cost of sales 2 123 10 –Distribution expenses 117 1 –Sales and marketing expenses 253 194 –Administrative expenses 146 132 –Other operating expenses 2 7 –Non-recurring items – – –
2641 344 –

7/ Financial Report
Depreciation, amortization and impairment charges were included in the following line items of the 2012 income statement:
Depreciation and Amortization and impairment of property, impairment of Impairment
MillionUSdollar plantandequipment intangibleassets ofgoodwill
Cost of sales 2 005 5 –Distribution expenses 105 1 –Sales and marketing expenses 220 173 –Administrative expenses 133 105 –Other operating expenses – – –Non-recurring items – – –
2463 284 –
The depreciation, amortization and impairment of property, plant and equipment included a full-cost reallocation of 4m US dollar in 2013 from the aggregate depreciation, amortization and impairment expense to cost of goods sold. In 2012 this reallocation was immaterial.
11. Finance Cost and Income
Recognizedinprofitorloss
Finance costs
MillionUSdollar 2013 20121
Interest expense (2 043) (2 065)Capitalization of borrowing costs 38 57 Net interest on net defined benefit liabilities (156) (160)Accretion expense (360) (270)Net foreign exchange losses (net of the effect of foreign exchange derivative instruments) (295) (103)Tax on financial transactions (47) (59)Other financial costs, including bank fees (184) (92)
(3047) (2692)
Non-recurring finance costs (101) (18)
(3148) (2710)
Finance costs, excluding non-recurring items, increased by 355m US dollar from prior year mainly as a result of higher accretion expenses, net foreign exchange losses and other financial costs.
Borrowing costs capitalized relate to the capitalization of interest expenses directly attributable to the acquisition and construction of qualifying assets mainly in Brazil. Interests are capitalized at a borrowing rate ranging between 6% and 12%.
Following the acquisition of the remaining stake in Grupo Modelo, AB InBev recognized a non-recurring expense of 101m US dollar in 2013 mainly composed of utilization fees and accelerated accretion expenses related to the 2012 Facilities Agreement. The accelerated accretion follows the repayment and termination of the 2012 Facilities Agreement in June 2013. See also Note 24 Interest-bearing loans and borrowings.
Interest expense is presented net of the effect of interest rate derivative instruments hedging AB InBev’s interest rate risk – see also Note 29 Risks arising from financial instruments.
Finance income
MillionUSdollar 2013 20121
Interest income 286 206Net gains on hedging instruments that are not part of a hedge accounting relationship 186 108 Net gains from hedge ineffectiveness – 13 Other financial income 89 17
561 344
Non-recurring finance income 384 –
945 344
12012 as Reported, adjusted to reflect the effects of retrospective application on the revised IAS 19 Employee Benefits (see Note 3 Summary of significant accounting policies).

104 / 105Anheuser-Busch InBev
Annual Report 2013
In 2013, AB InBev incurred 186m US dollar of net gains on hedging instruments that are not part of a hedge accounting relationship arising mainly from positive results on derivative contracts entered into to hedge risks associated with different share based payment programs, partially offset by costs of currency hedges.
Non-recurring finance income was 384m US dollar resulting from mark-to market adjustments on derivative instruments entered into to hedge the deferred share instrument issued in a transaction related to the combination with Grupo Modelo. By 31 December 2013, 100% of the deferred share instrument had been hedged at an average price of approximately 68 euro per share. See also Note 23 Changes in equity and earnings per share.
No interest income was recognized on impaired financial assets.
The interest income stems from the following financial assets:
MillionUSdollar 2013 2012
Cash and cash equivalents 209 132Investment debt securities held for trading 21 41Loans to customers 2 3Other loans and receivables 54 30
286 206
The interest income on other loans and receivables includes the interest accrued on cash deposits given as guarantees for certain legal proceedings pending resolution.
For further information on instruments hedging AB InBev’s foreign exchange risk see Note 29 Risks arising from financial instruments.
12. Income Taxes
Income taxes recognized in the income statement can be detailed as follows:
MillionUSdollar 2013 20121
Current tax expense Current year (2 130) (2 125)(Underprovided)/overprovided in prior years 132 242
(1998) (1883)Deferredtax(expense)/incomeOrigination and reversal of temporary differences (174) 267(Utilization)/recognition of deferred tax assets on tax losses 153 (64)Recognition of previously unrecognized tax losses 3 –
(18) 203
Totalincometaxexpenseintheincomestatement (2016) (1680)
12012 as Reported, adjusted to reflect the effects of retrospective application on the revised IAS 19 Employee Benefits (see Note 3 Summary of significant accounting policies).

7/ Financial Report
The reconciliation of the effective tax rate with the aggregated weighted nominal tax rate can be summarized as follows:
MillionUSdollar 2013 20121
Profit before tax 18 534 11 005Deduct share of result of associates 294 624
Profitbeforetaxandbeforeshareofresultofassociates 18240 10381AdjustmentsontaxablebasisExpenses not deductible for tax purposes 801 241Taxable intercompany dividends 135 394Non-taxable financial and other income (8 543) (717)
10633 10299
Aggregatedweightednominaltaxrate 33.3% 32.8%Tax at aggregated weighted nominal tax rate (3 545) (3 379)
Adjustments on tax expense Utilization of tax losses not previously recognized 16 131Recognition of deferred taxes assets on previous years’ tax losses 3 –Write-down of deferred tax assets on tax losses and current year losses for which no deferred tax asset is recognized (74) (129)(Underprovided)/overprovided in prior years 132 242Tax savings from tax credits and special tax status 1 620 1 274Change in tax rate 116 (18)Withholding taxes (425) (143)Other tax adjustments 141 342
(2016) (1680)Effectivetaxrate 11.1% 16.2%
The total income tax expense amounts to 2 016m US dollar in 2013 compared to 1 680m US dollar in 2012. The effective tax rate decreased from 16.2% to 11.1% from 2012 to 2013. The decrease of the effective tax rate mainly results from the non-taxable nature of the non-recurring gain related to the fair value adjustment on the initial investment held in Grupo Modelo (see also Note 6 Acquisitions and disposals of subsidiaries and Note 8 Non-recurring items), non-taxable gains from certain derivatives related to the hedging of share-based payment programs, changes of profit mix to countries with lower marginal tax rates, as well as incremental income tax benefits. This decrease was partially offset by the combination with Grupo Modelo, which has a nominal tax rate of 30%.
The normalized effective tax rate in 2013 is 16.6% (2012: 16.1%). Normalized effective tax rate is not an accounting measure under IFRS accounting and should not be considered as an alternative to the effective tax rate. Normalized effective tax rate method does not have a standard calculation method and AB InBev’s definition of normalized effective rate may not be comparable to other companies.
Income taxes were directly recognized in other comprehensive income as follows:
MillionUSdollar 2013 2012
Incometax(losses)/gainsRe-measurements of post-employment benefits (289) 140Cash flow hedges (12) (37)Net investment hedges 8 68
12012 as Reported, adjusted to reflect the effects of retrospective application on the revised IAS 19 Employee Benefits (see Note 3 Summary of significant accounting policies).

106 / 107Anheuser-Busch InBev
Annual Report 2013
13. Property, Plant and Equipment
2013 2012
Land and Plant and Fixtures Under Million US dollar buildings equipment and fittings construction Total Total
AcquisitioncostBalanceatendofpreviousyear 8173 19988 3328 1619 33108 31357Effect of movements in foreign exchange (297) (801) (142) (119) (1 359) (450)Acquisitions 21 476 164 2 862 3 523 3 032 Acquisitions through business combinations 1 771 2 078 483 486 4 818 384 Disposals (142) (1 150) (409) 4 (1 697) (1 043)Disposals through the sale of subsidiaries – – – – – (17)Transfer (to)/from other asset categories and other movements 442 1 823 236 (2 787) (286) (155)
Balanceatendoftheperiod 9968 22414 3660 2065 38107 33108
Depreciation and impairment lossesBalanceatendofpreviousyear (2616) (11510) (2518) (3) (16647) (15335)Effect of movements in foreign exchange 64 402 84 (1) 549 156 Disposals 74 1 056 340 – 1 470 906 Disposals through the sale of subsidiaries – – – – – 4 Depreciation (358) (1 866) (343) – (2 567) (2 401)Impairment losses (4) (61) (4) (1) (70) (62)Transfer to/(from) other asset categories and other movements 16 32 (3) 2 47 85
Balanceatendoftheperiod (2824) (11947) (2444) (3) (17218) (16647)
Carrying amountat31December2012 5557 8478 810 1616 16461 16461at31December2013 7144 10467 1216 2062 20889 –
The transfer (to)/from other asset categories and other movements mainly relates to transfers from assets under construction to their respective asset categories, to contributions of assets to pension plans and to the separate presentation in the balance sheet of property, plant and equipment held for sale in accordance with IFRS 5 Non-current assets held for sale and discontinued operations.
The carrying amount of property, plant and equipment subject to restrictions on title amounts to 84m US dollar.
Contractual commitments to purchase property, plant and equipment amounted to 591m US dollar as at 31 December 2013 compared to 415m US dollar as at 31 December 2012. The increase results from projects mainly in Brazil and China.
14. Goodwill
MillionUSdollar 2013 2012
AcquisitioncostBalanceatendofpreviousyear 51773 51309Effect of movements in foreign exchange (1 799) (643)Purchases of non-controlling interest (29) (6)Acquisitions through business combinations 19 988 1 113
Balanceatendofyear 69933 51773
Impairment lossesBalanceatendofpreviousyear (7) (7)Impairment losses – –
Balanceatendofyear (7) (7)
Carryingamountat31December2012 51766 51766at31December2013 69927 –

7/ Financial Report
Current year acquisitions through business combinations primarily reflect the Modelo combination. This transaction resulted in the recognition of goodwill of 19 592m US dollar. The other business combinations that took place in 2013 resulted in goodwill recognition of 380m US dollar following the acquisition of four breweries in China, different distributors in Brazil and a wholesaler in the United States. The contingent consideration from the purchase of Cervecería Nacional Dominicana S.A. also led to the recognition of an additional goodwill of 16m US dollar.
The business combination that resulted in the recognition of goodwill in 2012 were the acquisition of Cervecería Nacional Dominicana S.A. in Dominican Republic in May 2012, the acquisition of 2 distributors in the United States and the acquisition of 2 companies by Ambev in Brazil – see also Note 6 Acquisitions and disposals of subsidiaries.
The carrying amount of goodwill was allocated to the different business unit levels as follows:
MillionUSdollarBusinessunit 2013 2012
USA 32 654 32 654Mexico 19 171 –Brazil 7 669 8 743China 2 317 1 925Canada 1 945 2 078Germany/Italy/Switzerland/Austria 1 535 1 469Argentina and other Hispanic Latin America countries 1 181 1 345Dominican Republic 1 037 1 089Russia/Ukraine 960 1 057Global Export/Spain 731 698UK/Ireland 624 609Belgium/Netherlands/France/Luxemburg 103 99
69927 51766
AB InBev completed its annual impairment test for goodwill and concluded, based on the assumptions described below, that no impairment charge was warranted. The company cannot predict whether an event that triggers impairment will occur, when it will occur or how it will affect the asset values reported. AB InBev believes that all of its estimates are reasonable: they are consistent with the internal reporting and reflect management’s best estimates. However, inherent uncertainties exist that management may not be able to control. During its valuation, the company ran sensitivity analysis for key assumptions including the weighted average cost of capital and the terminal growth rate, in particular for the valuations of the US, Brazil and Mexico, countries that show the highest goodwill. While a change in the estimates used could have a material impact on the calculation of the fair values and trigger an impairment charge, the company, based on sensitivity analysis performed around the base case assumptions is not aware of any reasonably possible change in a key assumption used that would cause a business unit’s carrying amount to exceed its recoverable amount.
Goodwill impairment testing relies on a number of critical judgments, estimates and assumptions. Goodwill, which accounted for approximately 49% of AB InBev’s total assets as at 31 December 2013, is tested for impairment at the business unit level (that is one level below the reporting segments). The business unit level is the lowest level at which goodwill is monitored for internal management purposes. Whenever a business combination occurs, goodwill is allocated as from the acquisition date, to each of AB InBev’s business units that are expected to benefit from the synergies of the combination.
AB InBev impairment testing methodology is in accordance with IAS 36, in which a fair-value-less-cost-to-sell and value in use approaches are taken into consideration. This consists in applying a discounted free cash flow approach based on acquisition valuation models for its major business units and the business units showing a high invested capital to EBITDA multiple, and valuation multiples for its other business units.
The key judgments, estimates and assumptions used in the discounted free cash flow calculations are as follows:• The first year of the model is based on management’s best estimate of the free cash flow outlook for the current year;• In the second to fourth years of the model, free cash flows are based on AB InBev’s strategic plan as approved by key management.
AB InBev’s strategic plan is prepared per country and is based on external sources in respect of macro-economic assumptions, industry, inflation and foreign exchange rates, past experience and identified initiatives in terms of market share, revenue, variable and fixed cost, capital expenditure and working capital assumptions;
• For the subsequent six years of the model, data from the strategic plan is extrapolated generally using simplified assumptions such as constant volumes and variable cost per hectoliter and fixed cost linked to inflation, as obtained from external sources;
• Cash flows after the first ten-year period are extrapolated generally using expected annual long-term consumer price indices (CPI), based on external sources, in order to calculate the terminal value, considering sensitivities on this metric. For the three main cash generating units, the terminal growth rate applied ranged between 0.0% and 2.3% for the US; 0.0% and 3.3% for Brazil and 0.0% and 2.6% for Mexico;

108 / 109Anheuser-Busch InBev
Annual Report 2013
• Projections are made in the functional currency of the business unit and discounted at the unit’s weighted average cost of capital (WACC), considering sensitivities on this metric. The WACC ranged primarily between 7% and 30% in US dollar nominal terms for goodwill impairment testing conducted for 2013. For the three main cash generating units, the WACC applied in US dollar nominal terms ranged between 7% and 9% for the US, 9% and 11% for Brazil, and 8% and 10% for Mexico.
• Cost to sell is assumed to reach 2% of the entity value based on historical precedents.
The above calculations are corroborated by valuation multiples, quoted share prices for publicly-traded subsidiaries or other available fair value indicators.
Although AB InBev believes that its judgments, assumptions and estimates are appropriate, actual results may differ from these estimates under different assumptions or conditions.
15. Intangible Assets
2013 2012
CommercialMillion US dollar Brands intangibles Software Other Total Total
Acquisition costBalanceatendofpreviousyear 22124 2421 979 344 25868 25073Effect of movements in foreign exchange (220) (6) (20) 6 (240) (33)Acquisitions through business combinations 4 564 303 170 31 5 068 540 Acquisitions and expenditures 2 128 300 113 543 281 Disposals – (39) (242) (5) (286) (30)Transfer (to)/from other asset categories and other movements 21 (25) 153 29 178 37
Balanceatendofperiod 26491 2782 1340 518 31131 25868Amortization and impairment lossesBalanceatendofpreviousyear – (682) (768) (47) (1497) (1255)Effect of movements in foreign exchange – 7 10 (1) 16 8 Amortization – (190) (125) (19) (334) (284)Impairment losses – (3) (7) – (10) –Disposals – 36 12 4 52 29 Transfer to/(from) other asset categories and other movements – 2 (24) 2 (20) 5
Balanceatendofperiod – (830) (902) (61) (1793) (1497)Carrying valueat31December2012 22124 1739 211 297 24371 24371at31December2013 26491 1952 438 457 29338 –
Current year acquisitions through business combinations primarily reflect the Modelo combination which resulted in the recognition of brands and commercial intangibles with an indefinite life of 4 698m US dollar and intangible assets with a finite life of 214m US dollar, which primarily consists of software and distribution agreements. These are being amortized over the term of the associated contracts ranging from 5 to 20 years.
AB InBev is the owner of some of the world’s most valuable brands in the beer industry. As a result, brands and certain distribution rights are expected to generate positive cash flows for as long as the company owns the brands and distribution rights. Given AB InBev’s more than 600-year history, brands and certain distribution rights have been assigned indefinite lives.
Acquisitions and expenditures of commercial intangibles mainly represent supply and distribution rights, exclusive multi-year sponsorship rights and other commercial intangibles.
Intangible assets with indefinite useful lives are comprised primarily of brands and certain distribution rights that AB InBev purchases for its own products, and are tested for impairment during the fourth quarter of the year or whenever a triggering event has occurred. As of 31 December 2013, the carrying amount of the intangible assets amounted to 29 338m US dollar (31 December 2012: 24 371m US dollar) of which 27 593m US dollar was assigned an indefinite useful life (31 December 2012: 22 984m US dollar) and 1 745m US dollar a finite life (31 December 2012: 1 387m US dollar).

7/ Financial Report
The carrying amount of intangible assets with indefinite useful lives was allocated to the different countries as follows:
MillionUSdollarCountry 2013 2012
USA 21 414 21 340Mexico 4 608 –Dominican Republic 399 425Argentina 220 292China 330 280Paraguay 187 201Bolivia 171 171UK 111 108Uruguay 47 52Canada 38 40Russia 25 27Chile 24 26Germany 19 19Brazil – 3
27593 22984
Intangible assets with indefinite useful lives have been tested for impairment using the same methodology and assumptions as disclosed in Note 14 Goodwill. Based on the assumptions described in that note, AB InBev concluded that no impairment charge is warranted. While a change in the estimates used could have a material impact on the calculation of the fair values and trigger an impairment charge, the company is not aware of any reasonable possible change in a key assumption used that would cause a business unit’s carrying amount to exceed its recoverable amount.
16. Investment in Associates
MillionUSdollar 2013 2012
Balanceatendofpreviousyear 7090 6696Effect of movements in foreign exchange 123 485Acquisition through business combination 75 –Share of results of associates 294 624Dividends (604) (719)Transfer to other categories (6 793) –Other movements 2 4
Balanceatendoftheperiod 187 7090
Following the AB InBev and Grupo Modelo combination, AB InBev is fully consolidating Grupo Modelo in the AB InBev consolidated financial statements as of 4 June 2013, which resulted in the derecognition of the investment in associates previously held in Grupo Modelo at the same date. In line with IFRS 3, the initial stake in Grupo Modelo was re-valued at its deemed fair value at the acquisition date, resulting in a non-recurring, non-cash gain reported in the consolidated income statement – see also Note 6 Acquisitions and disposals of subsidiaries and Note 8 Non-recurring items.
17. Investment Securities
MillionUSdollar 2013 2012
Non-current investmentsInvestments in unquoted companies – available for sale 170 231Debt securities held to maturity 23 25
193 256Current investments Debt securities available for sale – 91Debt securities held for trading 123 6 736
123 6827

110 / 111Anheuser-Busch InBev
Annual Report 2013
AB InBev raised a series of bonds in 2012 and in the first quarter of 2013 to support the Modelo combination. The excess liquidity resulting from these bonds was mainly invested in short-term; highly liquid, debt securities and US Treasury Bills pending the closing of the Modelo combination which occurred on 4 June 2013.
As of 31 December 2013, current debt securities of 123m US dollar mainly represented investments in Brazilian real denominated government debt securities. The company’s investments in such short-term debt securities are primarily to facilitate liquidity and for capital preservation.
AB InBev’s exposure to equity price risk is disclosed in Note 29 Risks arising from financial instruments. The equity securities available for sale consist mainly of investments in unquoted companies and are measured at cost as their fair value cannot be reliably determined.
18. Deferred Tax Assets and Liabilities
The amount of deferred tax assets and liabilities by type of temporary difference can be detailed as follows:
2013
Million US dollar Assets Liabilities Net
Property, plant and equipment 490 (2 879) (2 389)Intangible assets 234 (9 812) (9 578)Goodwill 37 (18) 19 Inventories 101 (91) 10 Investment in associates – (1 280) (1 280)Trade and other receivables 81 (47) 34 Interest-bearing loans and borrowings 90 (517) (427)Employee benefits 885 (35) 850 Provisions 286 (24) 262 Derivatives 57 (10) 47 Other items 1 060 (663) 397 Loss carry forwards 394 – 394
Grossdeferredtaxassets/(liabilities) 3715 (15376) (11661)Nettingbytaxableentity (2535) 2535 –
Netdeferredtaxassets/(liabilities) 1180 (12841) (11661)
20121
MillionUSdollar Assets Liabilities Net
Property, plant and equipment 452 (2 538) (2 086)Intangible assets 179 (8 547) (8 368)Goodwill 51 (14) 37Inventories 81 (87) (6)Investment in associates 4 (1 319) (1 315)Trade and other receivables 51 (3) 48Interest-bearing loans and borrowings 150 (491) (341)Employee benefits 1 320 (14) 1 306Provisions 291 (21) 270Derivatives 214 (40) 174Other items 100 (422) (322)Loss carry forwards 242 – 242
Grossdeferredtaxassets/(liabilities) 3135 (13496) (10361)Nettingbytaxableentity (2328) 2328 –
Netdeferredtaxassets/(liabilities) 807 (11168) (10361)
12012 as Reported, adjusted to reflect the effects of retrospective application on the revised IAS 19 Employee Benefits (see Note 3 Summary of significant accounting policies).

7/ Financial Report
The change in net deferred taxes recorded in the consolidated statement of financial position can be detailed as follows:
MillionUSdollar 2013 20121
Balanceat1January (10361) (10606)Recognized in profit or loss (18) 203Recognized in other comprehensive income (293) 171Acquisitions through business combinations (1 143) (145)Other movements 154 16
Balanceat31December (11661) (10361)
Net deferred tax assets and liabilities increased from prior year mainly due to deferred tax liabilities associated with the Modelo combination.
Most of the temporary differences are related to the fair value adjustment on intangible assets with indefinite useful lives and property, plant and equipment acquired in a business combination. The realization of such temporary differences is unlikely to revert within 12 months.
On 31 December 2013, a deferred tax liability of 41m US dollar (2012: 31m US dollar) relating to investment in subsidiaries has not been recognized because management believes that this liability will not be incurred in the foreseeable future.
Tax losses carried forward and deductible temporary differences on which no deferred tax asset is recognized amount to 2 282m US dollar (2012: 2 366m US dollar). 718m US dollar of these tax losses and deductible temporary differences do not have an expiration date, 111m US dollar, 117m US dollar and 116m US dollar expire within respectively 1, 2 and 3 years, while 1 220m US dollar have an expiration date of more than 3 years. Deferred tax assets have not been recognized on these items because it is not probable that future taxable profits will be available against which these tax losses and deductible temporary differences can be utilized and the company has no tax planning strategy currently in place to utilize these tax losses and deductible temporary differences.
19. Inventories
MillionUSdollar 2013 2012
Prepayments 78 39Raw materials and consumables 1 717 1 508Work in progress 326 267Finished goods 761 656Goods purchased for resale 68 30
2950 2500InventoriesotherthanworkinprogressInventories stated at net realizable value 29 –Carrying amount of inventories subject to collateral – –
The cost of inventories recognized as an expense in 2013 amounts to 17 594m US dollar, included in cost of sales. Last year, this expense amounted to 16 422m US dollar.
Impairment losses on inventories recognized in 2013 amount to 59m US dollar (2012: 66m US dollar).
20. Trade and Other Receivables
Non-current trade and other receivables
MillionUSdollar 2013 2012
Cash deposits for guarantees 240 272 Loans to customers 65 21 Deferred collection on disposals 37 38 Tax receivable, other than income tax 198 177 Derivatives 120 241 Trade and other receivables 592 479
1252 1228
12012 as Reported, adjusted to reflect the effects of retrospective application on the revised IAS 19 Employee Benefits (see Note 3 Summary of significant accounting policies).

112 / 113Anheuser-Busch InBev
Annual Report 2013
For the nature of cash deposits for guarantees see Note 31 Collateral and contractual commitments for the acquisition of property, plant and equipment, loans to customers and other.
Current trade and other receivables
MillionUSdollar 2013 2012
Trade receivables and accrued income 2 935 2 736 Interest receivable 38 67 Tax receivable, other than income tax 429 283 Derivatives 607 398 Loans to customers 50 9 Prepaid expenses 616 453 Other receivables 687 77
5362 4023
As of 31 December 2013, AB InBev recognized a receivable of 558m US dollar, collectable in 2014, related to the post-closing adjustment of the sale of the US business to Constellation (see also Note 6 Acquisitions and disposals of subsidiaries).
The fair value of trade and other receivables, excluding derivatives, equals their carrying amounts as the impact of discounting is not significant.
The ageing of the current trade receivables and accrued income, interest receivable, other receivables and current and non-current loans to customers can be detailed as follows for 2013 and 2012 respectively:
Ofwhichnotimpairedasofthereportingdateandpastdue
Of which:neither
Netcarrying impairednoramountasof pastdueon31December, thereporting Lessthan Between30 Between60 Morethan
2013 date 30days and59days and89days 90days
Trade receivables and accrued income 2 935 2 738 139 24 11 23Loans to customers 115 105 – 1 1 8Interest receivable 38 38 – – – –Other receivables 687 687 – – – –
3775 3568 139 25 12 31
Ofwhichnotimpairedasofthereportingdateandpastdue
Of which:Netcarrying neitheramountasof impairednor31December, pastdueonthe Lessthan Between30 Between60 Morethan
2012 reportingdate 30days and59days and89days 90days
Trade receivables and accrued income 2 736 2 588 107 23 14 4Loans to customers 30 29 – – – 1Interest receivable 67 67 – – – –Other receivables 77 77 – – – –
2910 2761 107 23 14 5
In accordance with IFRS 7 Financial Instruments: Disclosures the above analysis of the age of financial assets that are past due as at the reporting date but not impaired, also includes the non-current part of loans to customers. Past due amounts were not impaired when collection is still considered likely, for instance because the amounts can be recovered from the tax authorities or AB InBev has sufficient collateral. Impairment losses on trade and other receivables recognized in 2013 amount to 85m US dollar (2012: 40m US dollar).
AB InBev’s exposure to credit, currency and interest rate risks is disclosed in Note 29 Risks arising from financial instruments.

7/ Financial Report
21. Cash and Cash Equivalents
MillionUSdollar 2013 2012
Short-term bank deposits 7 109 2 741 US Treasury Bills – 1 000 Cash and bank accounts 2 730 3 310
Cashandcashequivalents 9839 7051Bankoverdrafts (6) –
9833 7051
AB InBev raised a series of bonds in 2012 and in the first quarter of 2013 to support the Modelo combination. The excess liquidity resulting from these bonds was mainly invested in short-term debt, highly liquid, securities and US Treasury Bills pending the closing of the Modelo combination which occurred on 4 June 2013. See also note 17 Investment securities and note 24 Interest-bearing loans and borrowings.
The cash outstanding per 31 December 2013 includes restricted cash for an amount of 1 512m US dollar. This restricted cash includes 1 504m US dollar deposited with a Trust established and funded on 4 June 2013, following the closing of the AB InBev and Grupo Modelo combination. The Trust will accept further tender of shares by Grupo Modelo shareholders at a price of 9.15 US dollar per share over a period of up to 25 months. AB InBev set up a liability for the Grupo Modelo shares it did not acquire by 31 December 2013 – see also Note 28 Trade and other payables.
The restricted cash also includes 8m US dollar for the outstanding consideration payable to former Anheuser-Busch shareholders who did not yet claim the proceeds from the 2008 Anheuser-Busch combination (the related payable is recognized as a deferred consideration on acquisition).
22. Assets and Liabilities held for Sale
Assets Liabilities
MillionUSdollar 2013 2012 2013 2012
Balanceattheendofpreviousyear 34 1 – –Effect of movements in foreign exchange (4) 1 – –Addition through business combination 5 385 2 – –Disposals (4 844) (6) – 1Impairment loss – – – –Transfers from other asset categories (487) 36 – (1)
Balanceatendofyear 84 34 – –
The 2013 additions and disposals of assets held for sale are explained by the combination with Grupo Modelo and the sale by Grupo Modelo of its US business to Constellation Brands. See also Note 6 Acquisitions and disposals of subsidiaries.
23. Changes in Equity and Earnings per Share
Statement of capitalThe tables below summarize the changes in issued capital and treasury shares during the year:
Issued capital
Issued capital Million shares Million US dollar
At the end of the previous year 1 607 1 734Changes during the year 1 1
1608 1735
Result on the useTreasurysharesoftreasuryshares
Treasuryshares Millionshares MillionUSdollar MillionUSdollar
At the end of the previous year 4.7 (241) (759)Changes during the year (3.1) 144 (18)
1.6 (97) (777)

114 / 115Anheuser-Busch InBev
Annual Report 2013
As at 31 December 2013, the total issued capital of 1 735m US dollar is represented by 1 607 844 590 shares without face value, of which 386 932 946 registered shares, 16 574 bearer shares and 1 220 895 070 dematerialized shares. For a total amount of capital of 1.6m US dollar (1.2m euro), there are still 1 499 587 of subscription rights outstanding corresponding with a maximum of 1 499 587 shares to be issued. The total of authorized, un-issued capital amounts to 51m US dollar (37m euro).
The holders of ordinary shares are entitled to receive dividends as declared from time to time and are entitled to one vote per share at meetings of the company. In respect of the company’s shares that are held by AB InBev, rights are suspended.
The shareholders’ structure based on the notifications made to the company pursuant to the Belgian Law of 02 May 2007 on the disclosure of significant shareholdings in listed companies is included in the Corporate Governance section of AB InBev’s annual report.
Capital contributions in subsidiaries, mainly in the zone Latin America North, subscribed by non-controlling interest amounted to 38.4m US dollar in 2013.
ChangesinownershipinterestsIn compliance with IAS 27, the acquisition of additional shares in a subsidiary is accounted for as an equity transaction with owners.
During 2013, AB InBev purchased non-controlling interests in subsidiaries for a total consideration of 72m US dollar. As the related subsidiaries were already fully consolidated, the purchases did not impact AB InBev’s profit, but reduced the non controlling interests and thus impacted the profit attributable to equity holders of AB InBev.
Reportaccordingtoarticle624ofthebelgiancompaniescode-purchaseofownsharesDuring the year 2013, AB InBev did not purchase any of its shares.
During 2013, the company proceeded with the following sale transactions:• 132 311 shares were sold to members of the Ambev senior management who were transferred to AB InBev. The sale occurred according to
a share exchange program at a price reduced with 16.66 % compared to the market price, in order to encourage management mobility;• 222 630 shares were granted to executives of the group according to the company’s executive remuneration policy;• 528 037 shares were granted to executives of the company in exchange for unvested options, in order to maintain consistency of granted
benefits and encourage management mobility, in particular for the benefit of executives moving to the United States. The shares are subject to a lock-up period until 31 December 2018;
• Finally, 2 214 368 shares were sold, as a result of the exercise of options granted to employees of the group.
At the end of the period, the group owned 1 618 802 own shares of which 1 093 369 were held directly by AB InBev.
The par value of the shares is 0.77 euro. As a consequence, the shares that were sold during the year 2013 represent 3 289 090 US dollar (2 384 956 euro) of the subscribed capital and the shares that the company still owned at the end of 2013 represent 1 719 017 US dollar (1 246 478 euro) of the subscribed capital.
DividendsOn 30 October 2013, an interim dividend of 0.60 euro per share or approximately 963m euro was approved by the Board of Directors. This dividend was paid out on 18 November 2013. On 25 February 2014, in addition to the interim dividend paid on 18 November 2013, a dividend of 1.45 euro per share or approximately 2 322m euro was proposed by the Board of Directors, reflecting a total dividend payment for 2013 fiscal year of 2.05 euro per share or approximately 3 285m euro.
In accordance with the IAS 10 Events after the balance sheet date, the February 2014 dividend has not been recorded in the 2013 financial statements.
On 24 April 2013, a dividend of 1.70 euro per share or approximately 2 725m euro was approved at the shareholders meeting. This dividend was paid out on 2 May 2013.
On 25 April 2012, a dividend of 1.20 euro per share or approximately 1 920m euro was approved at the shareholders meeting. This dividend was paid out on 3 May 2012.
Translation reservesThe translation reserves comprise all foreign currency exchange differences arising from the translation of the financial statements of foreign operations. The translation reserves also comprise the portion of the gain or loss on the foreign currency liabilities and on the derivative financial instruments determined to be effective net investment hedges in conformity with IAS 39 Financial Instruments: Recognition and Measurement hedge accounting rules.
Hedging reservesThe hedging reserves comprise the effective portion of the cumulative net change in the fair value of cash flow hedges to the extent the hedged risk has not yet impacted profit or loss – see also Note 29 Risks arising from financial instruments.

7/ Financial Report
Transfers from subsidiariesThe amount of dividends payable to AB InBev by its operating subsidiaries is subject to, among other restrictions, general limitations imposed by the corporate laws, capital transfer restrictions and exchange control restrictions of the respective jurisdictions where those subsidiaries are organized and operate. Capital transfer restrictions are also common in certain emerging market countries, and may affect AB InBev’s flexibility in implementing a capital structure it believes to be efficient. Dividends paid to AB InBev by certain of its subsidiaries are also subject to withholding taxes. Withholding tax, if applicable, generally does not exceed 10%.
Deferred share instrumentIn a transaction related to the combination with Grupo Modelo, select Grupo Modelo shareholders committed, upon tender of their Grupo Modelo shares, to acquire 23 076 923 AB InBev shares to be delivered within 5 years for consideration of approximately 1.5 billion US dollar. The consideration was paid on 5 June 2013. Pending the delivery of the AB InBev shares, AB InBev will pay a coupon on each undelivered AB InBev share, so that the Deferred Share Instrument holders are compensated on an after tax basis, for dividends they would have received had the AB InBev shares been delivered to them prior to the record date for such dividend.
The deferred share instrument is classified as an equity instrument, in line with the IAS 32, as the number of shares and consideration received are fixed. The coupon to compensate for the dividend equivalent is reported through equity. On 18 November 2013, the company paid a coupon of 0.60 euro per share or approximately 18m US dollar.
AB InBev included the weighted average number of shares promised via the deferred share instruments as of 5 June 2013 in the calculation of the basic and diluted earnings per shares.
Earnings per shareThe calculation of basic earnings per share is based on the profit attributable to equity holders of AB InBev of 14 394m US dollar (2012: 7 160m US dollar) and a weighted average number of ordinary shares (including deferred share instruments) outstanding during the year, calculated as follows:
Millionshares 2013 2012
Issued ordinary shares at 1 January, net of treasury shares 1 602 1 598Effect of shares issued and share buyback programs 2 2Effect of undelivered shares under the deferred share instrument 13 –
Weightedaveragenumberofordinarysharesat31December 1617 1600
The calculation of diluted earnings per share is based on the profit attributable to equity holders of AB InBev of 14 394m US dollar (2012: 7 160m US dollar) and a weighted average number of ordinary shares (diluted) outstanding (including deferred share instruments) during the year, calculated as follows:
Millionshares 2013 2012
Weighted average number of ordinary shares at 31 December 1 604 1 600Effect of undelivered shares under the deferred share instrument 13 –Effect of share options, warrants and restricted stock units 33 28
Weightedaveragenumberofordinaryshares(diluted)at31December 1650 1628
The calculation of earnings per share before non-recurring items is based on the profit after tax and before non-recurring items, attributable to equity holders of AB InBev. A reconciliation of profit before non-recurring items, attributable to equity holders of AB InBev to profit attributable to equity holders of AB InBev is calculated as follows:
MillionUSdollar 2013 20121
Profit before non-recurring items, attributable to equity holders of AB InBev 7 936 7 201Non-recurring items, after taxes, attributable to equity holders of AB InBev (refer Note 8) 6 175 (23)Non-recurring finance cost, after taxes, attributable to equity holders of AB InBev (refer Note 8) 283 (18)
ProfitattributabletoequityholdersofAB InBev 14394 7160
12012 as Reported, adjusted to reflect the effects of retrospective application on the revised IAS 19 Employee Benefits (see Note 3 Summary of significant accounting policies).

116 / 117Anheuser-Busch InBev
Annual Report 2013
The table below sets out the EPS calculation:
MillionUSdollar 2013 20121
Profit attributable to equity holders of AB InBev 14 394 7 160Weighted average number of ordinary shares 1 617 1 600BasicEPS 8.90 4.48
Profit before non-recurring items, attributable to equity holders of AB InBev 7 936 7 201Weighted average number of ordinary shares 1 617 1 600EPSbeforenon-recurringitems 4.91 4.50
Profit attributable to equity holders of AB InBev 14 394 7 160Weighted average number of ordinary shares (diluted) 1 650 1 628DilutedEPS 8.72 4.40
Profit before non-recurring items, attributable to equity holders of AB InBev 7 936 7 201Weighted average number of ordinary shares (diluted) 1 650 1 628DilutedEPSbeforenon-recurringitems 4.81 4.42
The average market value of the company’s shares for purposes of calculating the dilutive effect of share options and restricted stock units was based on quoted market prices for the period that the options and restricted stock units were outstanding. 8.9m share options were anti-dilutive and not included in the calculation of the dilutive effect as at 31 December 2013.
24. Interest-Bearing Loans and Borrowings
This note provides information about the company’s interest-bearing loans and borrowings. For more information about the company’s exposure to interest rate and foreign currency risk, refer to Note 29 Risks arising from financial instruments.
Non-current liabilities
MillionUSdollar 2013 2012
Secured bank loans 192 119Unsecured bank loans 349 627Unsecured bond issues 40 526 37 988Unsecured other loans 75 79Finance lease liabilities 132 138
41274 38951
Current liabilities
MillionUSdollar 2013 2012
Secured bank loans 94 32Commercial papers 2 065 2 088Unsecured bank loans 345 413Unsecured bond issues 5 327 2 840Secured other loans – 5Unsecured other loans 12 9Finance lease liabilities 3 3
7846 5390
The current and non-current interest-bearing loans and borrowings amount to 49.1 billion US dollar as of 31 December 2013, compared to 44.3 billion US dollar as of 31 December 2012.
In connection with the announcement on 29 June 2012 of the acquisition of the remaining stake in Grupo Modelo that it did not already own, AB InBev entered into a 14.0 billion US dollar long-term bank financing, dated as of 20 June 2012. The new financing consisted of a 14.0 billion US dollar facilities agreement (“2012 Facilities Agreement”) comprising of “Facility A”, a term facility with a maximum maturity
12012 as Reported, adjusted to reflect the effects of retrospective application on the revised IAS 19 Employee Benefits (see Note 3 Summary of significant accounting policies).

7/ Financial Report
of two years from the funding date for up to 6.0 billion US dollar principal amount and “Facility B” a three-year term facility for up to 8.0 billion US dollar principal amount bearing interest at a floating rate equal to LIBOR, plus margins. In November 2012, the US principal amount of “Facility A” was reduced to 5.1 billion US dollar, following a voluntary cancellation option under the 2012 Facilities Agreement and on 31 May 2013, the company opted to cancel the remaining commitments under “Facility A”. On 3 June 2013, the company drew down 8.0 billion US dollar under “Facility B” to finance the Modelo combination. In June 2013, AB InBev fully repaid the portion of the 2012 Facilities Agreement that was drawn for the combination and terminated the 2012 Facilities Agreement. As of 31 December 2013, no amount remains outstanding under the 2012 Facilities Agreement.
Furthermore, AB InBev raised the following bonds to support the Modelo combination:• On 17 January 2013, Anheuser-Busch InBev Finance Inc., a subsidiary of AB InBev, issued 4.0 billion US dollar aggregated principal amount
of bonds, consisting of 1.0 billion US dollar aggregated principal amount of fixed rate notes due 2016, 1.0 billion US dollar aggregated principal amount of fixed rate notes due 2018, 1.25 billion US dollar aggregated principal amount of fixed rate notes due 2023 and 0.75 billion US dollar aggregated principal amount of fixed rate notes due 2043. The notes will bear interest at an annual rate of 0.800% for the 2016 notes, 1.250% for the 2018 notes, 2.625% for the 2023 notes and 4.000% for the 2043 notes.
• On 23 January 2013, AB InBev issued 500m euro aggregate principal amount of fixed rate notes due in 2033 and bearing interest at an annual rate of 3.250%.
• On 25 January 2013, Anheuser-Busch InBev Finance Inc., a subsidiary of AB InBev, issued a private offering of notes in an aggregated principal amount of 1.2 billion Canadian dollar, consisting of 0.6 billion Canadian dollar aggregated principal amount of fixed rate notes due 2018 and 0.6 billion Canadian dollar aggregated principal amount of fixed rate notes due 2023. The notes will bear interest at an annual rate of 2.375% for the 2018 notes and 3.375% for the 2023 notes.
In addition to the above, on 24 September 2013, AB InBev issued 750m euro aggregate principal amount of fixed rate notes due in 2020 bearing interest at an annual rate of 2.250% and 500m pound sterling aggregate principal amount of fixed rate notes due in 2025 bearing interest at an annual rate of 4.000%. The use of the proceeds of such issuance was for general corporate purposes.
Effective 20 August 2013, AB InBev amended the terms of the 8.0 billion US dollar 5-year 2010 Senior Facilities, originally entered into in February 2010 and subsequently amended to extend the maturity until July 2016. The August 2013 amendment provides an extension of 7.2 billion US dollar of the 5-year revolving credit facility to a revised maturity of July 2018. As of 31 December 2013, there are no amounts drawn under the 8.0 billion US dollar 2010 Senior Facilities.
During 2013, AB InBev early redeemed 22m US dollar aggregate principal amount of Anheuser-Busch fixed rate notes with maturities in 2034 and 2041.
Commercial papers amount to 2.1 billion US dollar as of 31 December 2013 and include programs in US dollar and euro with a total authorized issuance up to 3.0 billion US dollar and 1.0 billion euro, respectively.
AB InBev is in compliance with all its debt covenants as of 31 December 2013. The 2012 Facilities Agreement and the 2010 Senior Facilities do not include restrictive financial covenants.
Termsanddebtrepaymentscheduleat31december2013 MorethanMillionUSdollar Total 1yearorless 1-2years 2-3years 3-5years 5years
Secured bank loans 286 94 81 46 30 35Commercial papers 2 065 2 065 – – – –Unsecured bank loans 694 345 170 142 37 –Unsecured bond issues 45 853 5 327 4 587 2 465 8 677 24 797Unsecured other loans 87 12 22 15 10 28Finance lease liabilities 135 3 3 4 7 118
49120 7846 4863 2672 8761 24978

118 / 119Anheuser-Busch InBev
Annual Report 2013
Termsanddebtrepaymentscheduleat31december2012 MorethanMillionUSdollar Total 1yearorless 1-2years 2-3years 3-5years 5years
Secured bank loans 151 32 48 23 26 22Commercial papers 2 088 2 088 – – – –Unsecured bank loans 1 040 413 264 207 150 6Unsecured bond issues 40 828 2 840 5 318 4 679 6 879 21 112Secured other loans 5 5 – – – –Unsecured other loans 88 9 12 12 11 44Finance lease liabilities 141 3 3 4 9 122
44341 5390 5645 4925 7075 21306
Financeleaseliabilities 2013 2013 2013 2012 2012 2012MillionUSdollar Payments Interests Principal Payments Interests Principal
Less than one year 14 11 3 14 11 3Between one and two years 14 11 3 14 11 3Between two and three years 13 10 3 16 11 5Between three and five years 28 20 8 29 21 8More than 5 years 186 68 118 201 79 122
255 120 135 274 133 141
Net debt is defined as non-current and current interest-bearing loans and borrowings and bank overdrafts minus debt securities and cash. Net debt is a financial performance indicator that is used by AB InBev’s management to highlight changes in the company’s overall liquidity position. The company believes that net debt is meaningful for investors as it is one of the primary measures AB InBev’s management uses when evaluating its progress towards deleveraging.
AB InBev’s net debt increased to 38.8 billion US dollar as of 31 December 2013, from 30.1 billion US dollar as of 31 December 2012. Apart from operating results net of capital expenditures, the net debt is mainly impacted by the payment associated with the Modelo combination net of the cash acquired and the proceeds from the sales to Constellation (13.0 billion US dollar), the proceeds from the deferred share instruments (1.5 billion US dollar), dividend payments to shareholders of AB InBev and Ambev (6.3 billion US dollar), the payment of interests and taxes (4.2 billion US dollar) and the impact of changes in foreign exchange rates (606m US dollar increase of net debt). – See also note 6 – Acquisitions and disposals of subsidiaries.
The following table provides a reconciliation of AB InBev’s net debt as of the dates indicated:
MillionUSdollar 2013 2012
Non-current interest-bearing loans and borrowings 41 274 38 951Current interest-bearing loans and borrowings 7 846 5 390
49120 44341Bank overdrafts 6 –Cash and cash equivalents (9 839) (7 051)Interest bearing loans granted (included within Trade and other receivables) (310) (324)Debt securities (included within Investment securities) (146) (6 852)
Netdebt 38831 30114
25. Employee Benefits
AB InBev sponsors various post-employment benefit plans world-wide. These include pension plans, both defined contribution plans, and defined benefit plans, and other post-employment benefits (OPEB). In accordance with IAS 19 Employee Benefits post-employment benefit plans are classified as either defined contribution plans or defined benefit plans.

7/ Financial Report
Defined contribution plansFor defined contribution plans, AB InBev pays contributions to publicly or privately administered pension funds or insurance contracts. Once the contributions have been paid, the group has no further payment obligation. The regular contribution expenses constitute an expense for the year in which they are due. For 2013, benefits paid for defined contribution plans for the company amounted to 117m US dollar compared to 41m US dollar for 2012.
Defined benefit plansDuring 2013, the company contributed to 67 defined benefit plans, of which 51 are retirement plans and 16 are medical cost plans. Most plans provide benefits related to pay and years of service. The Belgian, Dominican Republic, Canadian, Mexican, UK and US plans are partially funded. When plan assets are funded, the assets are held in legally separate funds set up in accordance with applicable legal requirements and common practice in each country. The medical cost plans in Canada, US, and Brazil provide medical benefits to employees and their families after retirement. Many of the defined benefit plans are closed to new entrants.
The present value of funded obligations includes a 201m US dollar liability related to two medical plans, for which the benefits are provided through the Fundação Antonio Helena Zerrenner (“FAHZ”). The FAHZ is a legally distinct entity which provides medical, dental, educational and social assistance to current and retired employees of Ambev. On 31 December 2013, the actuarial liabilities related to the benefits provided by the FAHZ are fully offset by an equivalent amount of assets existing in the fund. The net liability recognized in the balance sheet is nil.
The employee benefit net liability amounts to 2 852m US dollar as of 31 December 2013 compared to 3 675m US dollar as of 31 December 2012. In 2013, the fair value of the plan assets value increased by 672m US dollar and the defined benefit obligations increased by 19m US dollar. The decrease in the employee benefit net liability is mainly driven by favorable changes in discount rates (mainly in the US, Canada and Brazil) and positive asset returns (mainly in the US, Canada and UK), partially offset by unfavorable mortality assumptions changes in Canada and employee benefit liabilities associated with the Modelo combination.
The company’s net liability for post-employment and long-term employee benefit plans comprises the following at 31 December:
MillionUSdollar 2013 20121
Present value of funded obligations (7 939) (7 812)Fair value of plan assets 6 376 5 704
Presentvalueofnetobligationsforfundedplans (1563) (2108)Present value of unfunded obligations (1 134) (1 243)
Presentvalueofnetobligations (2697) (3351)Unrecognized asset (137) (307)
Netliability (2834) (3658)Other long term employee benefits (18) (17)
Totalemployeebenefits (2852) (3675)Employeebenefitsamountsinthebalancesheet:Liabilities (2 862) (3 687)Assets 10 12
Netliability (2852) (3675)
12012 as Reported, adjusted to reflect the effects of retrospective application on the revised IAS 19 Employee Benefits (see Note 3 Summary of significant accounting policies).
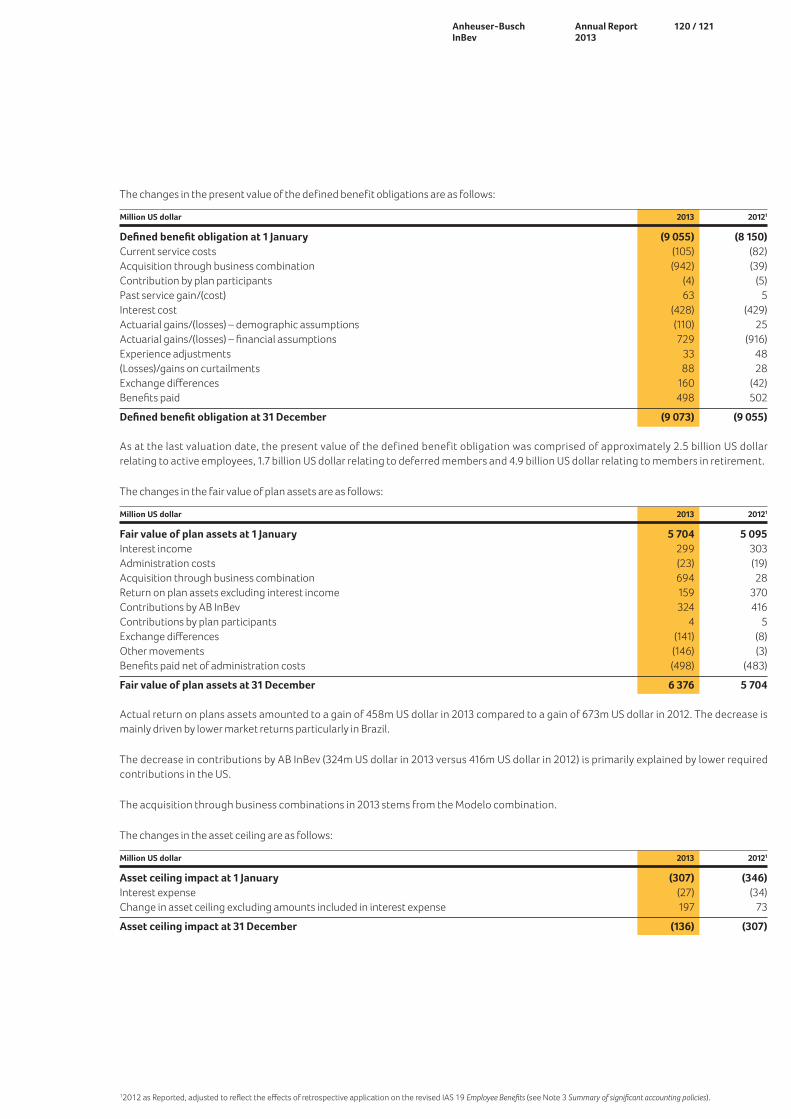
120 / 121Anheuser-Busch InBev
Annual Report 2013
The changes in the present value of the defined benefit obligations are as follows:
MillionUSdollar 2013 20121
Definedbenefitobligationat1January (9055) (8150)Current service costs (105) (82)Acquisition through business combination (942) (39)Contribution by plan participants (4) (5)Past service gain/(cost) 63 5Interest cost (428) (429)Actuarial gains/(losses) – demographic assumptions (110) 25Actuarial gains/(losses) – financial assumptions 729 (916)Experience adjustments 33 48(Losses)/gains on curtailments 88 28Exchange differences 160 (42)Benefits paid 498 502
Definedbenefitobligationat31December (9073) (9055)
As at the last valuation date, the present value of the defined benefit obligation was comprised of approximately 2.5 billion US dollar relating to active employees, 1.7 billion US dollar relating to deferred members and 4.9 billion US dollar relating to members in retirement.
The changes in the fair value of plan assets are as follows:
MillionUSdollar 2013 20121
Fairvalueofplanassetsat1January 5704 5095Interest income 299 303Administration costs (23) (19)Acquisition through business combination 694 28Return on plan assets excluding interest income 159 370Contributions by AB InBev 324 416Contributions by plan participants 4 5Exchange differences (141) (8)Other movements (146) (3)Benefits paid net of administration costs (498) (483)
Fairvalueofplanassetsat31December 6376 5704
Actual return on plans assets amounted to a gain of 458m US dollar in 2013 compared to a gain of 673m US dollar in 2012. The decrease is mainly driven by lower market returns particularly in Brazil.
The decrease in contributions by AB InBev (324m US dollar in 2013 versus 416m US dollar in 2012) is primarily explained by lower required contributions in the US.
The acquisition through business combinations in 2013 stems from the Modelo combination.
The changes in the asset ceiling are as follows:
MillionUSdollar 2013 20121
Assetceilingimpactat1January (307) (346)Interest expense (27) (34)Change in asset ceiling excluding amounts included in interest expense 197 73
Assetceilingimpactat31December (136) (307)
12012 as Reported, adjusted to reflect the effects of retrospective application on the revised IAS 19 Employee Benefits (see Note 3 Summary of significant accounting policies).

7/ Financial Report
The expense recognized in the income statement with regard to defined benefit plans can be detailed as follows:
MillionUSdollar 2013 20121
Current service costs (105) (82)Administration costs (23) (19)Past service cost 63 –(Losses)/gains on settlements or curtailments 88 29
Profitfromoperations 23 (72)Finance cost (156) (160)
Totalemployeebenefitexpense (132) (232)
As part of the Modelo integration into AB InBev, a curtailment has been recognized following the amendment of certain pension benefits. The effects of these changes are being recorded through the income statement and led to an additional income amount of 130m US dollar being recognized in 2013. This income amount has been partially offset by the increase in expense relating to the inclusion of Modelo’s benefit obligations as from 4 June 2013.
The employee benefit expense is included in the following line items of the income statement:
MillionUSdollar 2013 20121
Cost of sales (56) (62)Distribution expenses (3) (13)Sales and marketing expenses (8) 5Administrative expenses 9 (1)Other operating (expense)/income 2 –Non-recurring items 80 (1)Finance Cost (156) (160)
(132) (232)
Weighted average assumptions used in computing the benefit obligations at the balance sheet date are as follows:
2013
United States Canada Mexico Brazil United Kingdom AB InBev
Discount rate 4.9% 4.9% 7.8% 11.3% 4.6% 5.4%Price inflation – 2.0% 3.5% 4.5% 3.4% 2.7%Future salary increases 2.0% 1.3% – 7.7% 3.4% 3.3%Future pension increases – – 3.5% – 3.1% 2.7%Medical cost trend rate 8.1%-5.0% 4.2%-4.5% – 8.2% – 7.6%-5.8%Life expectation for a 65 year old male 83 85 83 85 87 84
Life expectation for a 65 year old female 85 87 83 88 89 87
2012
United States Canada Mexico Brazil United Kingdom AB InBev
Discount rate 4.0% 4.2% – 9.2% 4.7% 4.5%Price inflation – 2.0% – 4.5% 2.8% 2.6%Future salary increases 2.0% 1.3% – 7.7% 2.8% 3.2%Future pension increases – 2.0% – – 2.7% 2.5%Medical cost trend rate 7.3%-5.0% 5.5%-4.5% – 8.2% – 7.4%-6.0%Life expectation for a 65 year old male 83 84 – 85 86 84
Life expectation for a 65 year old female 85 87 – 88 88 87
Through its defined benefit pension plans and post-employment medical plans, the company is exposed to a number of risks, the most significant are detailed below:
Asset volatilityThe plan liabilities are calculated using a discount rate set with reference to high quality corporate yields; if plan assets underperform this yield, the company’s net defined benefit obligation may increase. Most of the company’s funded plans hold a significant proportion of equities, which are expected to outperform corporate bonds in the long-term while providing volatility and risk in the short-term.
12012 as Reported, adjusted to reflect the effects of retrospective application on the revised IAS 19 Employee Benefits (see Note 3 Summary of significant accounting policies).

122 / 123Anheuser-Busch InBev
Annual Report 2013
As the plans mature, the company usually reduces the level of investment risk by investing more in assets that better match the liabilities. However, the company believes that due to the long-term nature of the plan liabilities, a level of continuing equity investment is an appropriate element of the company’s long-term strategy to manage the plans efficiently.
Changes in bond yieldsA decrease in corporate bond yields will increase plan liabilities, although this will be partially offset by an increase in the value of the plans’ bond holdings.
Inflation riskSome of the company’s pension obligations (i.e. United Kingdom) are linked to inflation, and higher inflation will lead to higher liabilities. The majority of the plan’s assets are either unaffected by or loosely correlated with inflation, meaning that an increase in inflation could potentially increase the company’s net benefit obligation.
Life expectancyThe majority of the plans’ obligations are to provide benefits for the life of the member, so increases in life expectancy will result in an increase in the plans’ liabilities.
In case of funded plans, the company ensures that the investment positions are managed within an asset-liability matching (ALM) framework that has been developed to achieve long-term investments that are in line with the obligations under the pension schemes. Within this framework, the company’s ALM objective is to match assets to the pension obligations by investing in long-term fixed interest securities with maturities that match the benefit payments as they fall due and in the appropriate currency. The company actively monitors how the duration and the expected yield of the investments are matching the expected cash outflows arising from the pension obligation. The company has not changed the processes used to manage its risks from previous periods.
The weighted average duration of the defined benefit obligation is 13.9 years (2012: 13.5 years).
The sensitivity of the defined benefit obligation to changes in the weighted principal assumptions is:
2013
Change in Increase in Decrease inMillion US dollar assumption assumption assumption
Discount rate 0.50% (577) 629Future salary increase 0.50% 25 (22)Medical cost trend rate 1.00% 65 (61)Longevity One year 221 (226)
The above are purely hypothetical changes in individual assumptions holding all other assumptions constant: economic conditions and changes therein will often affect multiple assumptions at the same time and the effects of changes in key assumptions are not linear. Therefore, the above information is not necessarily a reasonable representation of future results.
The fair value of plan assets at 31 December consists of the following:
2013 2012
Quoted Unquoted Total Quoted Unquoted Total
Government bonds 27% – 27% 28% – 28%Corporate bonds 27% – 27% 24% – 24%Equity instruments 40% – 40% 44% – 44%Property – 3% 3% – 3% 3%Insurance contracts and others 3% – 3% 1% – 1%
97% 3% 100% 97% 3% 100%
AB InBev expects to contribute approximately 270m US dollar for its funded defined benefit plans and 84m US dollar in benefit payments to its unfunded defined benefit plans and post-retirement medical plans in 2014.

7/ Financial Report
26. Share-Based Payments1
Different share and share option programs allow company senior management and members of the Board of Directors to receive or acquire shares of AB InBev or Ambev. AB InBev has three primary share-based compensation plans, the long-term incentive warrant plan (“LTI Warrant Plan”), established in 1999, the share-based compensation plan (“Share-Based Compensation Plan”), established in 2006 and amended as from 2010, and the long-term incentive stock-option plan (“LTI stock-option Plan”), established in 2009. For all option plans, the fair value of share-based payment compensation is estimated at grant date, using a binomial Hull model, modified to reflect the IFRS 2 Share-based Paymentrequirement that assumptions about forfeiture before the end of the vesting period cannot impact the fair value of the option.
Share-based payment transactions resulted in a total expense of 243m US dollar for the year 2013 (including the variable compensation expense settled in shares), as compared to 201m US dollar for the year 2012.
Ab inbev share-based payment programs
Share-Based Compensation PlanAs from 1 January 2010, the structure of the Share-Based Compensation Plan for certain executives, including the executive board of management and other senior management in the general headquarters, has been modified. From 1 January 2011, the new plan structure applies to all other senior management. Under this plan, the executive board of management and other senior employees will receive their bonus in cash but have the choice to invest some or all of the value of their bonus in AB InBev shares with a five-year vesting period, referred to as bonus shares. The company will match such voluntary investment by granting three matching shares for each bonus share voluntarily invested in, up to a limited total percentage of each participant’s bonus. The matching shares are granted in the form of restricted stock units which have a five-year vesting period. Additionally, the holders of the restricted stock units may be entitled to receive from AB InBev additional restricted stock units equal to the dividends declared since the restricted stock units were granted.
During 2013, AB InBev issued 0.8m of matching restricted stock units according to the new Share-Based Compensation Plan, as described above, in relation to the 2012 bonus. These matching restricted stock units are valued at the share price of the day of grant, representing a fair value of approximately 78m US dollar, and cliff vest after five years. During 2012, AB InBev issued 0.7m of matching restricted stock units according to the new Share-Based Compensation Plan, with an estimated fair value of approximately 46m US dollar, in relation to the 2011 bonus.
LTI Warrant Plan The company has issued warrants, or rights to subscribe for newly issued shares, under the LTI plan for the benefit of directors and, until 2006, members of the executive board of management and other senior employees. Since 2007, members of the executive board of management and other employees are no longer eligible to receive warrants under the LTI Warrant Plan, but instead receive a portion of their compensation in the form of shares and options granted under the Share-Based Compensation Plan and the LTI Stock-option Plan. Each LTI warrant gives its holder the right to subscribe for one newly issued share. The exercise price of LTI warrants is equal to the average price of the company’s shares on the regulated market of Euronext Brussels during the 30 days preceding their issue date. LTI warrants granted in the years prior to 2007 (except for 2003) have a duration of ten years; LTI warrants granted as from 2007 (and in 2003) have a duration of five years. LTI warrants are subject to a vesting period ranging from one to three years.
During 2013, 0.2m warrants were granted to members of the Board of Directors. These warrants vest in equal annual installments over a three-year period (one third on 1 January of 2015, one third on 1 January 2016 and one third on 1 January 2017) and represent a fair value of approximately 3m US dollar. During 2012, 0.2m warrants with a fair value of approximately 2.5m US dollar were granted under this plan.
LTIStock-optionPlanAs from 1 July 2009, senior employees are eligible for an annual long-term incentive to be paid out in LTI stock options (or, in future, similar share-based instruments), depending on management’s assessment of the employee’s performance and future potential.
In December 2013 AB InBev issued 4.1m LTI stock options with an estimated fair value of 93m US dollar, whereby 1.2m options relate to American Depositary Shares (ADSs) and 2.9m options to AB InBev shares. In November 2012 AB InBev issued 4.4m LTI stock options with an estimated fair value of 86m US dollar, whereby 1.2m options relate to American Depositary Shares (ADSs) and 3.2m options to AB InBev shares.
Other GrantsAs from 2010 AB InBev has in place three specific long-term restricted stock unit programs. One program allows for the offer of restricted stock units to certain employees in certain specific circumstances, whereby grants are made at the discretion of the CEO, e.g.
1Amounts have been converted to US dollar at the average rate of the period.

124 / 125Anheuser-Busch InBev
Annual Report 2013
to compensate for assignments of expatriates in countries with difficult living conditions. The restricted stock units vest after five years and in case of termination of service before the vesting date, special forfeiture rules apply. In 2013, 0.4m restricted stock units with an estimated fair value of 36m US dollar were granted under this program to a selected number of employees. In 2012, 0.1m restricted stock units with an estimated fair value of 1m US dollar were granted under this program.
A second program allows for the exceptional offer of restricted stock units to certain employees at the discretion of the Remuneration Committee of AB InBev as a long-term retention incentive for key employees of the company. Employees eligible to receive a grant under this program receive two series of restricted stock units, the first half of the restricted stock units vesting after five years, the second half after ten years. In case of termination of service before the vesting date, special forfeiture rules apply. In December 2013 0.4m restricted stock units with an estimated fair value of 34m US dollar were granted under this program to a selected number of employees. In December 2012 0.3m restricted stock units with an estimated fair value of 23m US dollar were granted under this program.
A third program allows certain employees to purchase company shares at a discount aimed as a long-term retention incentive for (i) high-potential employees of the company, who are at a mid-manager level (“People bet share purchase program”) or (ii) for newly hired employees. The voluntary investment in company shares leads to the grant of 3 matching shares for each share invested. The discount and matching shares are granted in the form of restricted stock units which vest after 5 years. In case of termination before the vesting date, special forfeiture rules apply. In 2013, the company’s employees purchased shares under this program for the equivalent of 0.5m US dollar. In 2012, the company’s employees purchased shares under this program for the equivalent of 0.2m US dollar.
In order to maintain consistency of benefits granted to executives and to encourage international mobility of executives, an options exchange program has been executed whereby unvested options are exchanged against restricted shares that remain locked-up until 31 December 2018. In 2013, 0.6m unvested options were exchanged against 0.5m restricted shares. In 2012, 0.6m unvested options were exchanged against 0.5m restricted shares. Furthermore, certain options granted have been modified whereby the dividend protected feature of these options have been cancelled and compensated by the issuance of new additional options. In 2013 0.6m new options were issued, representing the economic value of the dividend protection feature. In 2012 no new options were issued. As there was no change between the fair value of the original award immediately before the modification and the fair value of the modified award immediately after the modification, no additional expense was recorded as a result of the modification.
For further information on share-based payment grants of previous years, please refer to Note 25 Share-based payments of the 2012 consolidated financial statements.
The weighted average fair value of the options and assumptions used in applying the AB InBev option pricing model for the 2013 grants of awards described above are as follows:
AmountsinUSdollarunlessotherwiseindicated1 2013 2012 2011
Fair value of options and warrants granted 21.74 19.57 14.95Share price 103.06 86.87 57.04Exercise price 103.05 86.83 56.88Expected volatility 24% 25% 26%Expected dividends 2.92% 2.50% 2.50%Risk-free interest rate 2.06% 1.73% 2.84%
Expected volatility is based on historical volatility calculated using 2 272 days of historical data. In the determination of the expected volatility, AB InBev is excluding the volatility measured during the period 15 July 2008 until 30 April 2009, in view of the extreme market conditions experienced during that period. The binomial Hull model assumes that all employees would immediately exercise their options if the AB InBev share price is 2.5 times above the exercise price. As a result, no single expected option life applies.
The total number of outstanding AB InBev options and warrants developed as follows:
Millionoptionsandwarrants 2013 2012 2011
Options and warrants outstanding at 1 January 53.3 54.4 56.1Options and warrants issued during the year 4.8 4.5 4.9Options and warrants exercised during the year (4.2) (3.3) (4.1)Options and warrants forfeited during the year (1.4) (2.3) (2.5)
OptionsandwarrantsoutstandingattheendofDecember 52.5 53.3 54.4
1Amounts have been converted to US dollar at the closing rate of the respective period.

7/ Financial Report
The range of exercise prices of the outstanding options and warrants is between 10.32 euro (14.23 US dollar) and 76.20 euro (105.09 US dollar) while the weighted average remaining contractual life is 7.56 years.
Of the 52.5m outstanding options and warrants 2.9m are vested at 31 December 2013.
The weighted average exercise price of the AB InBev options and warrants is as follows:
Amounts in US dollar1 2013 2012 2011
Options and warrants outstanding at 1 January 38.31 32.98 29.88Granted during the year 103.05 87.94 56.52Exercised during the year 41.07 31.85 23.83Forfeited during the year 45.18 32.82 27.65Outstanding at the end of December 45.38 38.31 32.98Exercisable at the end of December 57.28 40.65 31.91
For share options and warrants exercised during 2013 the weighted average share price at the date of exercise was 73.64 euro (101.56 US dollar).
The total number of outstanding AB InBev restricted stock units developed as follows:
Millionrestrictedstockunits 2013 2012 2011
Restricted stock units outstanding at 1 January 3.3 2.3 1.2Restricted stock units issued during the year 1.6 1.1 1.2Restricted stock units exercised during the year – – –Restricted stock units forfeited during the year (0.2) (0.1) (0.1)
RestrictedstockunitsoutstandingattheendofDecember 4.7 3.3 2.3
Ambev share-based payment programsSince 2005, Ambev has had a plan which is substantially similar to the Share-Based Compensation Plan under which bonuses granted to company employees and management are partially settled in shares. Under the Share-Based Compensation Plan as modified as of 2010, Ambev issued, in March 2013, 4.3m restricted stock units with an estimated fair value of 35m US dollar. In March 2012, Ambev issued 4.8m restricted stock units with an estimated fair value of 24m US dollar.
As from 2010, senior employees are eligible for an annual long-term incentive to be paid out in Ambev LTI stock options (or, in future, similar share-based instruments), depending on management’s assessment of the employee’s performance and future potential. In 2013, Ambev granted 12.8m LTI stock options with an estimated fair value of 64m US dollar. In 2012, Ambev granted 15.2m LTI stock options with an estimated fair value of 43m US dollar.
In order to encourage the mobility of managers, the features of certain options granted in previous years have been modified whereby the dividend protection of these options was cancelled and replaced by the issuance of 0.2m options in 2013 representing the economic value of the dividend protection feature. In 2012, 0.3m options were issued representing the economic value of the dividend protection feature. Since there was no change between the fair value of the original award before the modification and the fair value of the modified award after the modification, no additional expense was recorded as a result of this modification.
The weighted fair value of the options and assumptions used in applying a binomial option pricing model for the 2013 Ambev grants are as follows:
AmountsinUSdollarunlessotherwiseindicated1 2013 20122 20112
Fair value of options granted 2.61 2.73 2.40Share price 7.30 8.34 5.93Exercise price 7.30 8.34 4.95Expected volatility 33% 33% 34%Expected dividends 0.00% - 5.00% 0.00% - 5.00% 0.00% - 5.00%Risk-free interest rate 1.90% - 12.60%3 2.10% - 11.20%3 3.10% - 11.89%3
1Amounts have been converted to US dollar at the closing rate of the respective period.2Amounts have been adjusted for the Ambev share split of 11 November 2013.3The weighted average risk-free interest rates refer to granted ADRs and stock options respectively.
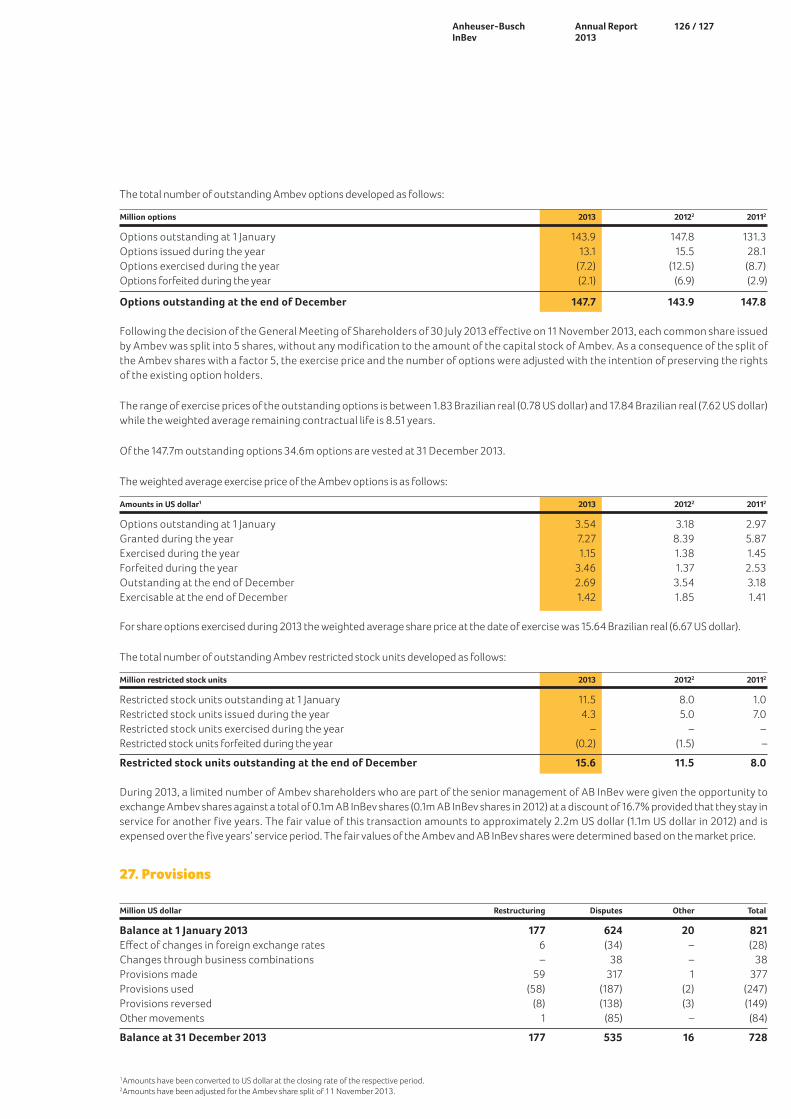
126 / 127Anheuser-Busch InBev
Annual Report 2013
The total number of outstanding Ambev options developed as follows:
Millionoptions 2013 20122 20112
Options outstanding at 1 January 143.9 147.8 131.3Options issued during the year 13.1 15.5 28.1Options exercised during the year (7.2) (12.5) (8.7)Options forfeited during the year (2.1) (6.9) (2.9)
OptionsoutstandingattheendofDecember 147.7 143.9 147.8
Following the decision of the General Meeting of Shareholders of 30 July 2013 effective on 11 November 2013, each common share issued by Ambev was split into 5 shares, without any modification to the amount of the capital stock of Ambev. As a consequence of the split of the Ambev shares with a factor 5, the exercise price and the number of options were adjusted with the intention of preserving the rights of the existing option holders.
The range of exercise prices of the outstanding options is between 1.83 Brazilian real (0.78 US dollar) and 17.84 Brazilian real (7.62 US dollar) while the weighted average remaining contractual life is 8.51 years.
Of the 147.7m outstanding options 34.6m options are vested at 31 December 2013.
The weighted average exercise price of the Ambev options is as follows:
Amounts in US dollar1 2013 20122 20112
Options outstanding at 1 January 3.54 3.18 2.97Granted during the year 7.27 8.39 5.87Exercised during the year 1.15 1.38 1.45Forfeited during the year 3.46 1.37 2.53Outstanding at the end of December 2.69 3.54 3.18Exercisable at the end of December 1.42 1.85 1.41
For share options exercised during 2013 the weighted average share price at the date of exercise was 15.64 Brazilian real (6.67 US dollar).
The total number of outstanding Ambev restricted stock units developed as follows:
Millionrestrictedstockunits 2013 20122 20112
Restricted stock units outstanding at 1 January 11.5 8.0 1.0Restricted stock units issued during the year 4.3 5.0 7.0Restricted stock units exercised during the year – – –Restricted stock units forfeited during the year (0.2) (1.5) –
RestrictedstockunitsoutstandingattheendofDecember 15.6 11.5 8.0
During 2013, a limited number of Ambev shareholders who are part of the senior management of AB InBev were given the opportunity to exchange Ambev shares against a total of 0.1m AB InBev shares (0.1m AB InBev shares in 2012) at a discount of 16.7% provided that they stay in service for another five years. The fair value of this transaction amounts to approximately 2.2m US dollar (1.1m US dollar in 2012) and is expensed over the five years’ service period. The fair values of the Ambev and AB InBev shares were determined based on the market price.
27. Provisions
Million US dollar Restructuring Disputes Other Total
Balanceat1January2013 177 624 20 821Effect of changes in foreign exchange rates 6 (34) – (28)Changes through business combinations – 38 – 38Provisions made 59 317 1 377Provisions used (58) (187) (2) (247)Provisions reversed (8) (138) (3) (149)Other movements 1 (85) – (84)
Balanceat31December2013 177 535 16 728
1Amounts have been converted to US dollar at the closing rate of the respective period.2Amounts have been adjusted for the Ambev share split of 11 November 2013.

7/ Financial Report
The restructuring provisions are primarily explained by the organizational alignments, as explained in Note 8 Non-recurring items. Provisions for disputes mainly relate to various disputed direct and indirect taxes and to claims from former employees.
The provisions are expected to be settled within the following time windows:
MillionUSdollar Total <1year 1-2years 2-5years >5years
RestructuringReorganization 177 80 16 69 12DisputesIncome and indirect taxes 343 58 238 34 13Labor 104 34 29 38 3Commercial 32 12 15 2 3Other disputes 56 7 19 30 –
Othercontingencies 535 111 301 104 19Onerous contracts 2 1 1 – –Guarantees given 4 – 1 3 –Other contingencies 10 4 1 2 3
16 5 3 5 3
Totalprovisions 728 196 320 178 34
Since 1 January 2005 AB InBev is subject to the greenhouse gas emission allowance trading scheme in force in the European Union. Acquired emission allowances are recognized at cost as intangible assets. To the extent that it is expected that the number of allowances needed to settle the CO2 emissions exceeds the number of emission allowances owned, a provision is recognized. Such provision is measured at the estimated amount of the expenditure required to settle the obligation. At 31 December 2013, the emission allowances owned fully covered the expected CO2 emissions. As such no provision needed to be recognized.
28. Trade and Other Payables
Non-current trade and other payables
MillionUSdollar 2013 2012
Indirect taxes payable 369 381Trade payables 381 461Cash guarantees 12 12Deferred consideration on acquisitions 1 801 1 125Derivatives 159 273Other payables 500 61
3222 2313
Current trade and other payables
MillionUSdollar 2013 2012
Trade payables and accrued expenses 9 834 8 476Payroll and social security payables 1 173 883Indirect taxes payable 1 689 1 497Interest payable 888 870Consigned packaging 682 639Cash guarantees 71 53Derivatives 630 1 008Dividends payable 384 765Deferred income 38 28Deferred consideration on acquisitions 861 41Other payables 224 35
16474 14295

128 / 129Anheuser-Busch InBev
Annual Report 2013
The deferred consideration on acquisitions is mainly comprised of 1.5 billion US dollar liability for the Grupo Modelo shares the company did not acquire by 31 December 2013. AB InBev established and funded a Trust to accept further tender of shares by Grupo Modelo shareholders at a price of 9.15 US dollar per share over a period of up to 25 months. Deferred consideration on acquisitions is also comprised of 1.1 billion US dollar for the put option included in the shareholders’ agreement between Ambev and E. León Jimenes S.A. (“ELJ”), which may result in Ambev acquiring additional Class B shares of Cervecería Nacional Dominicana S.A. (“CND”). The put option granted to ELJ is exercisable as of the first year following the transaction. The valuation of this option is based on the EBITDA of the consolidated operations in Dominican Republic.
Derivatives mainly reflect the mark-to-market of interest rate swaps, of forward exchange contracts and of commodity forward contracts entered into to hedge the company’s operational exposure (See also Note 29 Risks arising from financial instruments of the 31 December 2012 consolidated financial statements).
29. Risks Arising from Financial Instruments
AB InBev’s activities expose it to a variety of financial risks: market risk (including currency risk, fair value interest rate risk, cash flow interest risk, commodity risk and equity risk), credit risk and liquidity risk. The company analyses each of these risks individually as well as on an interconnected basis, and defines strategies to manage the economic impact on the company’s performance in line with its financial risk management policy.
Some of the company’s risk management strategies include the usage of derivatives. The main derivative instruments used are foreign currency rate agreements, exchange traded foreign currency futures and options, interest rate swaps and forwards, cross currency interest rate swaps (“CCIRS”), exchange traded interest rate futures, commodity swaps, exchange traded commodity futures and equity swaps. AB InBev’s policy prohibits the use of derivatives in the context of speculative trading.
The following table provides an overview of the derivative financial instruments outstanding at year-end by maturity bucket. The amounts included in this table are the notional amounts.
2013 2012
MillionUSdollar <1year 1–2years 2–3years 3–5years >5years <1year 1–2years 2–3years 3–5years >5years
Foreigncurrency
Forward exchange contracts 7 530 4 – – – 5 900 8 – – –
Foreign currency futures 927 – – – – 2 108 – – – –
Other foreign currency derivatives 415 – – – – – – – – –
Interest rate
Interest rate swaps 11 800 350 – 128 – 6 783 12 700 1 550 3 697 500
Cross currency interest rate swaps 683 1 096 – 2 841 827 1 390 656 1 115 1 632 377
Interest rate futures – 137 13 – – – – 83 113 –
Other interest rate derivatives – – – – – 1 000 – – – –
Commodities
Aluminum swaps 1 383 327 – – – 1 351 54 – – –
Other commodity derivatives 992 293 – – – 820 201 – – –
Equity
Equity derivatives 4 947 716 – – – 2 590 1 125 – – –
To finance the acquisition of Anheuser-Busch, AB InBev entered into a 45 billion US dollar senior facilities agreement, of which 44 billion US dollar was ultimately drawn (the “2008 Senior Facilities”). At the time of the Anheuser-Busch acquisition, the interest rate for an amount of up to 34.5 billion US dollar had effectively been fixed through a series of hedge arrangements at a weighted average rate of 3.875% per annum (plus applicable spreads) for the period 2009 to 2011 and a portion of the hedging arrangements had been successively extended for an additional two-year period. In 2009 the company repaid part of the 2008 Senior Facilities and in 2010, the 2008 Senior Facilities were fully refinanced and partially replaced by the 2010 Senior Facilities. Following the repayment and the refinancing activities performed throughout 2009, 2010 and 2011, the company entered into new interest rate swaps to unwind the ones that became freestanding as a result of these repayments. As of 31 December 2013, there were no remaining open positions covering the interest exposure on the 2010 Senior Facilities and interest rate swaps for a notional equivalent of 8.8 billion US dollar remain outstanding.

7/ Financial Report
Furthermore, during 2013, the company had interest rate swaps for a total notional amount of 6.4 billion US dollar and Treasury lock interest rate derivatives for a total amount of 1.0 billion US dollar in order to pre-hedge future bond issuances. These interest rate swaps and Treasury lock interest rate swaps were settled in 2013. As of 31 December 2013, there were no remaining pre-hedge positions outstanding.
A.ForeigncurrencyriskAB InBev incurs foreign currency risk on borrowings, investments, (forecasted) sales, (forecasted) purchases, royalties, dividends, licenses, management fees and interest expense/income whenever they are denominated in a currency other than the functional currency of the subsidiary. The main derivative financial instruments used to manage foreign currency risk are foreign currency rate agreement, exchange traded foreign currency futures and cross currency interest rate swaps.
Foreign exchange risk on operating activitiesAs far as foreign currency risk on firm commitments and forecasted transactions is concerned, AB InBev’s policy is to hedge operational transactions which are reasonably expected to occur (e.g. cost of goods sold and selling, general & administrative expenses) within the forecast period determined in the financial risk management policy. Operational transactions that are certain are hedged without any limitation in time. Non-operational transactions (such as acquisitions and disposals of subsidiaries) are hedged as soon as they are certain.
The table below provides an indication of the company’s main net foreign currency positions as regards firm commitments and forecasted transactions for the most important currency pairs. The open positions are the result of the application of AB InBev’s risk management policy. Positive amounts indicate that the company is long (net future cash inflows) in the first currency of the currency pair while negative amounts indicate that the company is short (net future cash outflows) in the first currency of the currency pair. The second currency of the currency pairs listed is the functional currency of the related subsidiary.
31December2013 31December2012
Total Total Open Total Total OpenMillion US dollar exposure derivatives position exposure derivatives position
Canadian dollar/US dollar – – – – (95) (95)Euro/Brazilian real (38) 38 – – – –Euro/Canadian dollar (39) 39 – (30) 30 –Euro/Czech koruna (3) (10) (13) – (11) (11)Euro/Hungarian forint (4) (14) (18) – (15) (15)Euro/Mexican peso 138 (138) – – – –Euro/Pound sterling (161) 259 98 (165) 237 72Euro/Russian ruble (97) 97 – (85) 149 64Euro/Ukrainian hryvnia (94) 68 (26) (98) 80 (18)Pound sterling/Canadian dollar – – – (11) 11 –Pound sterling/Euro (53) 33 (20) (53) 29 (24)US dollar/Argentinean peso (282) 282 – (585) 585 –US dollar/Bolivian boliviano (52) 52 – (70) 70 –US dollar/Brazilian real (1 680) 1 680 – (1 542) 1 542 –US dollar/Canadian dollar (184) 184 – (598) 598 –US dollar/Chilean peso (68) 68 – (45) 45 –US dollar/Dominican peso – – – (15) 15 –US dollar/Euro 101 (147) (46) 146 (44) 102US dollar/Mexican peso (694) 627 (67) – – –US dollar/Paraguayan guarani (48) 48 – (64) 64 –US dollar/Peruvian nuevo sol (57) 57 – (85) 85 –US dollar/Pound sterling (31) 27 (4) (34) 30 (4)US dollar/Russian ruble (75) 121 46 (75) 92 17US dollar/Ukrainian hryvnia (35) 70 35 (37) 59 22
US dollar/Uruguayan peso (29) 29 – (31) 31 –
Further analysis on the impact of open currency exposures is performed in the Currency Sensitivity Analysis below.
In conformity with IAS 39 hedge accounting rules, these hedges of firm commitments and highly probable forecasted transactions denominated in foreign currency are designated as cash flow hedges.

130 / 131Anheuser-Busch InBev
Annual Report 2013
Foreign exchange risk on intragroup loansIn 2011, 2012 and 2013, a series of foreign exchange derivatives were contracted to hedge the foreign currency risk from intercompany loans transacted between group entities with different functional currencies. As of 31 December 2013, intercompany loans with Russia were hedged against US dollar for an amount of 5 900m Russian ruble (6 700m Russian ruble in 2012).
Foreign exchange risk on net investments in foreign operationsAB InBev enters into hedging activities to mitigate exposures related to its investments in foreign operations. These strategies are designated as net investment hedges and include both derivative and non-derivative financial instruments.
As of 31 December 2013, designated derivative and non-derivative financial instruments in a net investment hedge relationship amount to 7 866m US dollar equivalent (6 058m US dollar in 2012) in Holding companies and approximately 2 500m US dollar equivalent (3 290m US dollar in 2012) at Ambev level. Those derivatives and non-derivatives are used to hedge foreign operations with functional currencies mainly denominated in Argentinean peso, Brazilian real, Bolivian boliviano, Canadian dollar, Chilean peso, Dominican peso, euro, Mexican peso, pound sterling, Russian ruble, and US dollar.
Foreign exchange risk on foreign currency denominated debtIt is AB InBev’s policy to have the debt in the subsidiaries as much as possible in the functional currency of the subsidiary. To the extent this is not the case, hedging is put in place unless the cost to hedge outweighs the benefits. Following the acquisition of Anheuser-Busch, AB InBev adopted a hybrid currency matching model pursuant to which the company may (i) match net debt currency exposure to cash flows in such currency, measured on the basis of normalized EBITDA, by swapping a significant portion of US dollar debt to other currencies, such as Brazilian real (with a higher coupon), although this would negatively impact AB InBev’s profit and earnings due to the higher Brazilian real interest coupon, and (ii) use AB InBev’s US dollar cash flows to service interest payments under AB InBev’s debt obligations.
A description of the foreign currency risk hedging related to the debt instruments issued in a currency other than the functional currency of the subsidiary is further detailed in the Interest Rate Risk section below.
Currency sensitivity analysisCurrency transactional risk Most of AB InBev’s non-derivative monetary financial instruments are either denominated in the functional currency of the subsidiary or are converted into the functional currency through the use of derivatives. However, the company can have open positions in certain Eastern European countries for which hedging can be limited as the illiquidity of the local foreign exchange market prevents the company from hedging at a reasonable cost. The transactional foreign currency risk mainly arises from open positions in Czech koruna, Hungarian forint, Mexican peso, pound sterling, Russian ruble and Ukrainian hryvnia against the US dollar and the euro. AB InBev estimated the reasonably possible change of exchange rate, on the basis of the average volatility on the open currency pairs, as follows:
2013
Closingrate Possible Volatility 31December2013 closingrate1 ofratesin%
Pound sterling/Euro 1.20 1.12 – 1.28 6.96%Euro/Czech koruna 27.43 25.67 – 29.18 6.39%Euro/Hungarian forint 297.00 274.46 – 319.54 7.59%Euro/Ukrainian hryvnia 11.02 10.18 – 11.87 7.64%US dollar/Euro 0.73 0.67 – 0.78 7.09%US dollar/Mexican peso 13.08 11.67 – 14.5 10.80%US dollar/Russian ruble 32.73 30.29 – 35.17 7.45%
US dollar/Ukrainian hryvnia 7.99 7.78 – 8.21 2.72%
1Sensitivity analysis is assessed based on the yearly volatility using daily observable market data during 250 days at 31 December 2013.

7/ Financial Report
2012
Closingrate Possible PossibleVolatility 31December2012 closingrate1 ofratesin%
Pound sterling/Euro 1.23 1.16 – 1.3 5.74%Euro/Czech koruna 25.15 23.56 – 26.74 6.31%Euro/Hungarian forint 292.31 263.67 – 320.96 9.80%Euro/Russian ruble 40.07 37.12 – 43.03 7.37%Euro/Ukrainian hryvnia 10.55 9.67 – 11.42 8.31%US dollar/Canadian dollar 1.00 0.93 – 1.06 6.22%US dollar/Euro 0.76 0.70 – 0.82 7.93%US dollar/Russian ruble 30.37 27.09 – 33.66 10.82%
US dollar/Ukrainian hryvnia 7.99 7.73 – 8.26 3.34%
Had the Czech koruna, the Hungarian forint, the Mexican peso, the pound sterling, the Russian ruble and the Ukrainian hryvnia weakened/strengthened during 2013 by the above estimated changes against the euro or the US dollar, with all other variables held constant, the 2013 impact on consolidated profit before taxes would have been approximately 19m US dollar (12m US dollar in 2012) higher/lower.
Additionally, the AB InBev sensitivity analysis1 to the foreign exchange rates on its total derivatives positions as of 31 December 2013, shows a positive/negative pre-tax impact on equity reserves of 427m US dollar (261m US dollar in 2012).
B.InterestrateriskThe company applies a dynamic interest rate hedging approach whereby the target mix between fixed and floating rate debt is reviewed periodically. The purpose of AB InBev’s policy is to achieve an optimal balance between cost of funding and volatility of financial results, while taking into account market conditions as well as AB InBev’s overall business strategy.
Fair value hedgePound sterling hedges (foreign currency risk + interest rate risk on borrowings in pound sterling) In June 2009, the company issued a pound sterling bond for an equivalent of 750m pound sterling. This bond bears interest at 6.50% with maturity in June 2017.
In September 2013, the company issued a pound sterling bond for an equivalent of 500m pound sterling. This bond bears interest at 4.00% per year with maturity in September 2025.
The company entered into several pound sterling fixed/euro floating cross currency interest rate swaps to manage and reduce the impact of changes in the pound sterling exchange rate and interest rate on these bonds.
These derivative instruments have been designated in a cash flow hedge accounting relationship.
Ambev bond hedges (interest rate risk on borrowings in Brazilian real) In July 2007 Ambev issued a Brazilian real bond (“Bond 17”), which bears interest at 9.5% and is repayable semi-annually with final maturity date in July 2017.
Ambev entered into a fixed/floating interest rate swap to hedge the interest rate risk on such bond. These derivative instruments have been designated in a fair value hedge accounting relationship.
Private placement hedges (foreign currency risk + interest rate risk on borrowings in US dollar) The company borrowed 850m US dollar through private placement of which 775m US dollar matured during 2009 and 2010, and 75m US dollar matured in 2013.
The company entered into US dollar fixed/euro floating cross currency interest rate swaps for a total amount of 730m US dollar of which 655m US dollar expired during 2009 and 2010 and the remaining matured in 2013.
As of 31 December 2013, there were no remaining balance and open positions related to private placement.
CashflowhedgeFloating interest rate risk on borrowings in US Dollar Following the refinancing and the repayment of the 2008 and 2010 senior facilities the interest rate swaps that were designated for the hedge of the financing of the Anheuser-Busch acquisition became freestanding given the repayment of part of these senior facilities. In order to offset the interest rate risk, the freestanding derivatives were unwound via additional offsetting trades.
1Sensitivity analysis is assessed based on the yearly volatility using daily observable market data during 250 days at 31 December 2012.

132 / 133Anheuser-Busch InBev
Annual Report 2013
As of 31 December 2013 and 2012, there are no remaining open positions covering the interest exposure on the outstanding balance drawn under the 2010 senior facilities.
Economic hedgeSwiss franc bond hedges (foreign currency risk + interest rate risk on borrowings in Swiss franc) In May 2009, the company issued a Swiss franc bond for an equivalent of 600m Swiss franc. This bond bears interest at 4.51% with maturity in June 2014.
The company entered into a Swiss franc fixed/euro floating cross currency interest rate swap to manage and reduce the impact of changes in the Swiss franc exchange rate and interest rate on this bond.
This derivative instrument was designated in a fair value hedge accounting relationship in 2009. During 2010, although this derivative continues to be considered an economic hedge, hedge accounting designation was discontinued.
InterestratesensitivityanalysisIn respect of interest-bearing financial liabilities, the table below indicates their effective interest rates at balance sheet date as well as the split per currency in which the debt is denominated.
31December2013 Beforehedging Afterhedging
Interest-bearingfinancialliabilities Effective EffectiveMillion US dollar interest rate Amount interest rate Amount
Floating rateBrazilian real 7.17% 535 8.16% 862Canadian dollar 0.98% 6 0.98% 6Dominican peso 8.07% 12 8.07% 12Euro 4.40% 69 5.70% 2 406Russian ruble – – 6.10% 184US dollar 0.81% 1 229 0.77% 899
1851 4369Fixed rateBrazilian real 7.93% 611 7.55% 492 Canadian dollar 3.14% 1 682 3.22% 1 263 Chinese yuan 7.11% 7 7.11% 7 Dominican peso 13.00% 20 13.00% 20 Euro 3.61% 10 055 3.59% 10 928 Pound sterling 5.69% 3 031 9.75% 890Swiss franc 4.51% 673 – –US dollar 4.21% 31 195 4.18% 31 156
47274 44756
31December2012 Beforehedging Afterhedging
Interest-bearingfinancialliabilities Effective EffectiveMillion US dollar interest rate Amount interest rate Amount
Floating rateBrazilian real 6.79% 747 6.90% 1 082Dominican peso 10.61% 92 10.61% 92Euro 4.69% 66 4.83% 2 533Russian ruble – – 6.22% 215US dollar 1.17% 1 662 1.33% 1 814
2567 5736Fixed rateBrazilian real 8.25% 708 8.27% 554Canadian dollar 3.65% 601 3.65% 601Dominican peso 12.00% 16 12.00% 16Euro 4.07% 9 076 4.07% 9 076Pound sterling 7.88% 2 233 9.75% 881Swiss franc 4.51% 653 – –US dollar 4.53% 28 487 4.58% 27 477
41774 38605

7/ Financial Report
At 31 December 2013, the total carrying amount of the floating and fixed rate interest-bearing financial liabilities before hedging listed above includes bank overdrafts of 6m US dollar.
As disclosed in the above table, 4 369m US dollar or 8.89% of the company’s interest bearing financial liabilities bear a variable interest rate. The company estimated that the reasonably possible change of the market interest rates applicable to its floating rate debt after hedging is as follows:
2013
Interestrate Possible Volatility 31December20131 interest rate2 ofratesin%
Brazilian real 9.44% 8.17%–10.7% 13.41%Canadian dollar 1.28% 1.27%–1.28% 0.60%Dominican peso 6.25% 3.61%–8.89% 42.16%Euro 0.29% 0.24%–0.33% 16.02%Russian ruble 7.15% 6.68%–7.62% 6.61%US dollar 0.25% 0.23%–0.26% 7.29%
2012
Interestrate Possible Volatility 31December20121 interest rate2 ofratesin%
Brazilian real 6.77% 5.72%–7.81% 15.44%Dominican peso 5.00% 4.12%–5.88% 17.51%Euro 0.19% 0.15%–0.22% 19.03%Russian ruble 7.47% 7.01%–7.93% 6.11%
US dollar 0.31% 0.29%–0.32% 6.19%
When AB InBev applies the reasonably possible increase/decrease in the market interest rates mentioned above on its floating rate debt at 31 December 2013, with all other variables held constant, 2013 interest expense would have been 13m US dollar higher/lower (2012: 14m US dollar). This effect would be more than offset by 82m US dollar higher/lower interest income on AB InBev’s interest-bearing financial assets (2012: 47m US dollar).
C.CommoditypriceriskThe commodity markets have experienced and are expected to continue to experience price fluctuations. AB InBev therefore uses both fixed price purchasing contracts and commodity derivatives to minimize exposure to commodity price volatility. The company has important exposures to the following commodities: aluminum, barley, coal, corn grits, corn syrup, corrugated board, fuel oil, glass, hops, labels, malt, natural gas, orange juice, rice, steel and wheat. As of 31 December 2013, the company has the following commodity derivatives outstanding (in notional amounts): aluminum swaps for 1 710m US dollar (2012: 1 405m US dollar), natural gas and energy derivatives for 330m US dollar (2012: 246m US dollar), exchange traded sugar futures for 147m US dollar (2012: 174m US dollar), corn swaps for 332m US dollar (2012: 392m US dollar), exchange traded wheat futures for 390m US dollar (2012: 136m US dollar) and rice swaps for 70m US dollar (2012: 73m US dollar). These hedges are designated in a cash flow hedge accounting relationship.
Commodity price sensitivity analysisThe impact of changes in the commodity prices for AB InBev’s derivative exposures would have caused an immaterial impact on 2013 profits as most of the company’s commodity derivatives are designated in a hedge accounting relationship.
1Applicable 3-month InterBank Offered Rates as of 31 December 2013 and as of 31 December 2012.2 Sensitivity analysis is assessed based on the yearly volatility using daily observable market data during 250 days at 31 December 2013 and at December 2012. For the Brazilian real
floating rate debt, the estimated market interest rate is composed of the InterBank Deposit Certificate (‘CDI’) and the Long-Term Interest Rate (‘TJLP’). With regard to other market interest rates, the company’s analysis is based on the 3-month InterBank Offered Rates applicable for the currencies concerned (e.g. EURIBOR 3M, LIBOR 3M).

134 / 135Anheuser-Busch InBev
Annual Report 2013
The table below shows the estimated impact that changes in the price of the commodities, for which AB InBev held material derivative exposures at 31 December 2013, would have on the equity reserves.
2013
Pre-taximpactonequity
MillionUSdollar Volatilityofpricesin%1 Prices increase Prices decrease
Aluminum 16.89% 244 (244)Sugar 18.23% 27 (27)Wheat 19.73% 1 (1)Energy 13.77% 46 (46)Rice 18.19% 11 (11)
Corn 37.72% 93 (93)
2012
Pre-taximpactonequity
MillionUSdollar Volatilityofpricesin%2 Prices increase Prices decrease
Aluminum 19.35% 201 (201)Sugar 26.76% 44 (44)Wheat 31.20% 42 (42)Energy 16.92% 40 (40)Rice 20.10% 14 (14)Corn 28.37% 87 (87)
D.EquitypriceriskAB InBev entered into a series of derivative contracts to hedge the risk arising from the different share-based payment programs. The purpose of these derivatives is mainly to effectively hedge the risk that a price increase in the AB InBev shares will negatively impact future cash flows related to the share-based payments. Furthermore, AB InBev entered into a series of derivative contracts to hedge the deferred share instrument related to the Modelo combination (see also Note 11 Finance cost and income and Note 23 Changes in equity and earnings per share). Most of these derivative instruments could not qualify for hedge accounting therefore they have not been designated in any hedging relationships.
As of 31 December 2013, an exposure for an equivalent of 50.9m of AB InBev shares was hedged, resulting in a total gain of 840m US dollar recognized in the profit or loss account for the period, of which 456m US dollar related to the company’s share-based payment programs and 384m US dollar related to the Modelo transaction (see also Note 11 Finance cost and income).
During 2013, AB InBev reset with counterparties certain derivative contracts to market price, which resulted in a cash inflow of 515m US dollar and a decrease of counterparty risk.
Equity price sensitivity analysisThe sensitivity analysis on the share-based payments hedging program, calculated based on a 23.47% (2012: 19.18%) reasonable possible volatility1 of the AB InBev share price and with all the other variables held constant, would show 1 272m US dollar positive/negative impact on the 2013 profit before tax (2012: 629m US dollar).
E.CreditriskCredit risk encompasses all forms of counterparty exposure, i.e. where counterparties may default on their obligations to AB InBev in relation to lending, hedging, settlement and other financial activities. The company has a credit policy in place and the exposure to counterparty credit risk is monitored.
AB InBev mitigates its exposure to counterparty credit risk through minimum counterparty credit guidelines, diversif ication of counterparties, working within agreed counterparty limits and through setting limits on the maturity of financial assets. The company has furthermore master netting agreements with all of the financial institutions that are counterparties to the over the counter (OTC) derivative financial instruments. These agreements allow for the net settlement of assets and liabilities arising from different transactions with the same counterparty. Based on these factors, AB InBev considers the risk of counterparty default per 31 December 2013 to be limited.
1Sensitivity analysis is assessed based on the yearly volatility using daily observable market data during 250 days at 31 December 2013.2Sensitivity analysis is assessed based on the yearly volatility using daily observable market data during 250 days at 31 December 2012.

7/ Financial Report
AB InBev has established minimum counterparty credit ratings and enters into transactions only with financial institutions of investment grade. The company monitors counterparty credit exposures closely and reviews any downgrade in credit rating immediately. To mitigate pre-settlement risk, minimum counterparty credit standards become more stringent as the duration of the derivative financial instruments increases. To minimize the concentration of counterparty credit risk, the company enters into derivative transactions with different financial institutions.
ExposuretocreditriskThe carrying amount of financial assets represents the maximum credit exposure of the company. The carrying amount is presented net of the impairment losses recognized. The maximum exposure to credit risk at the reporting date was:
2013 2012
Netcarrying NetcarryingMillion US dollar Gross Impairment amount Gross Impairment amount
Debt securities held for trading 123 – 123 6 736 – 6 736Available for sale 183 (13) 170 370 (48) 322Held to maturity 23 – 23 25 – 25Trade receivables 3 052 (249) 2 803 2 876 (246) 2 630Cash deposits for guarantees 240 – 240 272 – 272Loans to customers 198 (84) 114 130 (100) 30Other receivables 2 885 (162) 2 723 1 802 (134) 1 668Derivatives 727 – 727 639 – 639Cash and cash equivalents 9 839 – 9 839 7 051 – 7 051
17270 (508) 16762 19901 (528) 19373
There was no significant concentration of credit risks with any single counterparty per 31 December 2013.
Impairment lossesThe allowance for impairment recognized during the period per classes of financial assets was as follows:
2013
Available Trade Loansto Other CashandcashMillionUSdollar forsale receivables customers receivables equivalents Total
Balance at 1 January (48) (246) (100) (134) – (528)Impairment losses (69) (53) – (1) – (123)Derecognition 104 41 19 2 – 204 Currency translation and other – 9 (3) (29) – (23)
Balanceat31December (13) (249) (84) (162) – (508)
2012
Available Trade Loansto Other CashandcashMillionUSdollar forsale receivables customers receivables equivalents Total
Balance at 1 January (55) (230) (109) (122) (4) (520)Impairment losses – (29) (3) (8) – (40)Derecognition 6 12 15 1 – 34Currency translation 1 1 (3) (5) 4 (2)
Balanceat31December (48) (246) (100) (134) 0 (528)
F. Liquidity riskAB InBev’s primary sources of cash flow have historically been cash flows from operating activities, the issuance of debt, bank borrowings and the issuance of equity securities. AB InBev’s material cash requirements have included the following:• Debt service;• Capital expenditures;• Investments in companies;• Increases in ownership of AB InBev’s subsidiaries or companies in which it holds equity investments;• Share buyback programs; and• Payments of dividends and interest on shareholders’ equity.

136 / 137Anheuser-Busch InBev
Annual Report 2013
The company believes that cash flows from operating activities, available cash and cash equivalent and short term investments, along with the derivative instruments and access to borrowing facilities, will be sufficient to fund capital expenditures, financial instrument liabilities and dividend payments going forward. It is the intention of the company to continue to reduce its financial indebtedness through a combination of strong operating cash flow generation and continued refinancing.
The following are the nominal contractual maturities of non-derivative financial liabilities including interest payments and derivative financial assets and liabilities:
2013
Carrying Contractual Lessthan MorethanMillion US dollar amount1 cashflows 1year 1–2years 2–3years 3–5years 5years
Non-derivative financial liabilitiesSecured bank loans (286) (312) (104) (86) (50) (34) (38)Commercial papers (2 065) (2 066) (2 066) – – – –Unsecured bank loans (694) (774) (374) (206) (156) (38) –Unsecured bond issues (45 853) (65 215) (6 590) (6 391) (4 138) (11 758) (36 338)Unsecured other loans (87) (160) (20) (27) (19) (16) (78)Finance lease liabilities (135) (256) (14) (13) (14) (28) (187)Bank overdraft (6) (6) (6) – – – –Trade and other payables (18 891) (19 121) (15 841) (1 806) (271) (260) (943)
(68017) (87910) (25015) (8529) (4648) (12134) (37584)Derivative financial assets/(liabilities)Interest rate derivatives (36) (36) (30) 1 – (7) –Foreign exchange derivatives (64) (74) (74) – – – –Cross currency interest rate swaps (61) 76 15 4 3 10 44 Commodity derivatives (149) (147) (154) 7 – – –Equity derivatives 248 248 210 38 – – –
(62) 67 (33) 50 3 3 44Of which: directly related to cash flow hedges (66) 26 (61) 4 7 32 44
2012
Carrying Contractual Lessthan MorethanMillion US dollar amount1 cashflows 1year 1–2years 2–3years 3–5years 5years
Non-derivative financial liabilitiesSecured bank loans (151) (161) (35) (50) (25) (28) (23)Commercial papers (2 088) (2 092) (2 092) – – – –Unsecured bank loans (1 040) (1 309) (487) (366) (267) (180) (9)Unsecured bond issues (40 828) (60 030) (4 470) (7 117) (6 336) (9 721) (32 386)Secured other loans (5) (6) (6) – – – –Unsecured other loans (88) (139) (9) (17) (17) (15) (81)Finance lease liabilities (141) (274) (14) (14) (15) (29) (202)Trade and other payables (15 311) (15 441) (13 287) (146) (144) (222) (1 642)
(59652) (79452) (20400) (7710) (6804) (10195) (34343)Derivative financial assets/(liabilities)Interest rate derivatives (271) (251) (147) (76) (51) 8 15Foreign exchange derivatives (247) (274) (272) (2) – – –Cross currency interest rate swaps 22 53 (64) 30 31 56 –Commodity derivatives (121) (121) (129) 8 – – –Equity derivatives (26) (26) (29) 3 – – –
(643) (619) (641) (37) (20) 64 15Of which: directly related to cash flow hedges (273) (273) (216) (39) (53) 20 15
1“Carrying amount” refers to net book value as recognized in the balance sheet at each reporting date.

7/ Financial Report
G. Capital ManagementAB InBev is continuously optimizing its capital structure targeting to maximize shareholder value while keeping the desired financial flexibility to execute the strategic projects. AB InBev’s capital structure policy and framework aims to optimize shareholder value through cash flow distribution to the company from its subsidiaries, while maintaining an investment-grade rating and minimizing investments with returns below AB InBev’s weighted average cost of capital. Besides the statutory minimum equity funding requirements that apply to the company’s subsidiaries in the different countries, AB InBev is not subject to any externally imposed capital requirements. When analyzing AB InBev’s capital structure the company uses the same debt/equity classifications as applied in the company’s IFRS reporting.
H. Fair valueFair value is the price that would be received to sell an asset or paid to transfer a liability in an orderly transaction between market participants at the measurement date. In conformity with IAS 39 all derivatives are recognized at fair value in the balance sheet.
The fair value of derivative financial instruments is either the quoted market price or is calculated using pricing models taking into account current market rates.
The fair value of these instruments generally reflects the estimated amount that AB InBev would receive on the settlement of favorable contracts or be required to pay to terminate unfavorable contracts at the balance sheet date, and thereby takes into account any unrealized gains or losses on open contracts.
The following table summarizes for each type of derivative the fair values recognized as assets or liabilities in the balance sheet:
Assets Liabilities Net
MillionUSdollar 2013 2012 2013 2012 2013 2012
ForeigncurrencyForward exchange contracts 200 93 (322) (337) (122) (244)Foreign currency futures 36 27 (29) (30) 7 (3)Other foreign currency derivatives 51 – – – 51 –
Interest rateInterest rate swaps 39 169 (75) (435) (36) (266)Cross currency interest rate swaps 100 258 (161) (236) (61) 22Other interest rate derivatives – – – (5) – (5)
CommoditiesAluminum swaps 11 34 (100) (143) (89) (109)Sugar futures 1 8 (22) (22) (21) (14)Wheat futures 14 7 (19) (10) (5) (3)Other commodity derivatives 27 36 (61) (31) (34) 5
EquityEquity derivatives 248 7 – (33) 248 (26)
727 639 (789) (1282) (62) (643)
During 2013, the net mark-to-market balance for interest rate swaps decreased by 230m US dollar, mainly driven by payment of interests on hedging instruments not part of a hedge relationship, as well as the settlement of interest rate swaps designated for the pre-hedge of future bond issuances.
As of 31 December 2013, the net mark-to-market liability of 36m US dollar for interest rate swaps mostly includes the un-paid portion of the hedges that were unwound as a result of the repayment and the refinancing of the 2008 and 2010 Senior Facilities and that have been recorded as non-recurring costs in the income statement in 2009, 2010 and 2011.
The following table summarizes the carrying amounts of the fixed rate interest-bearing financial liabilities and their fair value. The fair value was assessed using common discounted cash-flow method based on market conditions existing at the balance sheet date. Therefore, the fair value of the fixed interest-bearing liabilities is within level 2 of the fair value hierarchy as set forth by IFRS 13 – Fair value measurement.

138 / 139Anheuser-Busch InBev
Annual Report 2013
Floating rate interest-bearing financial liabilities and all trade and other receivables and payables, including derivatives financial instruments, have been excluded from the analysis as their carrying amounts are a reasonable approximation of their fair values:
Interest-bearingfinancialliabilities 2013 2013 2012 2012MillionUSdollar Carryingamount1 Fair value Carryingamount1 Fair value
Fixed rateBrazilian real (611) (624) (708) (748)Canadian dollar (1 682) (1 685) (601) (632)Chinese yuan (7) (7) – –Dominican peso (20) (20) (16) (16)Euro (10 055) (10 577) (9 076) (9 870)Pound sterling (3 031) (3 615) (2 233) (2 894)Swiss franc (673) (687) (653) (695)US dollar (31 195) (35 028) (28 487) (34 440)
(47274) (52243) (41774) (49295)
As required by IFRS 13 Fair value measurement, the following table provides an analysis of financial instruments that are measured subsequent to initial recognition at fair value, grouped into Levels 1 to 3 based on the degree to which the fair value is observable.• Level 1 fair value measurements are those derived from quoted prices (unadjusted) in active markets for identical assets or liabilities.• Level 2 fair value measurements are those derived from inputs other than quoted prices included within Level 1 that are observable for the
asset or liability, either directly (i.e. as prices) or indirectly (i.e. derived from prices).• Level 3 fair value measurements are those derived from valuation techniques for which the lowest level of input that is significant to the
fair value measurement is unobservable.
Quoted Observable UnobservableFair valuehierarchy2013 (unadjusted) market marketMillionUSdollar prices-level1 inputs-level2 inputs-level3
Financial AssetsHeld for trading (non-derivatives) 123 – –Derivatives at fair value through profit and loss 27 412 –Derivatives in a cash flow hedge relationship 100 119 –Derivatives in a fair value hedge relationship – 25 –Derivatives in a net investment hedge relationship – 44 –
250 600 –Financial LiabilitiesDeferred consideration on acquisitions at fair value – – 1 111 Derivatives at fair value through profit and loss 16 392 –Derivatives in a cash flow hedge relationship 69 216 –Derivatives in a fair value hedge relationship – 68 –Derivatives in a net investment hedge relationship 13 15 –
98 691 1111
Quoted Observable UnobservableFair valuehierarchy2012 (unadjusted) market marketMillionUSdollar prices-level1 inputs-level2 inputs-level3
Financial AssetsHeld for trading (non-derivatives) 6 736 – –Available for sale – 91 –Derivatives at fair value through profit and loss 17 346 –Derivatives in a cash flow hedge relationship 16 124 –Derivatives in a fair value hedge relationship – 91 –Derivatives in a net investment hedge relationship 15 30 –
6784 682 –Financial LiabilitiesNon–derivatives recognized at fair value 5 – –Deferred consideration on acquisitions at fair value – – 1 040Derivatives at fair value through profit and loss 20 753 –Derivatives in a cash flow hedge relationship 43 370 –Derivatives in a fair value hedge relationship – 34 –Derivatives in a net investment hedge relationship 12 50 –
80 1207 10401“Carrying amount” refers to net book value as recognized in the balance sheet at each reporting date.

7/ Financial Report
Derivative instrumentsThe fair value of exchange traded derivatives (e.g. exchange traded foreign currency futures) is determined by reference to the official prices published by the respective exchanges (e.g. the New York Board of Trade). The fair value of over-the-counter derivatives is determined by commonly used valuation techniques. These are based on market inputs from reliable financial information providers.
Non-derivative financial liabilitiesAs part of the shareholders agreement between Ambev and E. León Jimenes S.A., following the acquisition of Cervecería Nacional Dominicana S.A. (“CND”), a put and call option is in place which may result in Ambev acquiring additional shares in CND. As of 31 December 2013, the put option was valued 1 076m US dollar (2012: 1 040m US dollar) and recognized as a deferred consideration on acquisitions at fair value in “level 3” category above. The variance is mainly explained by accretion and foreign exchange expenses partially offset by fair value gains. No value was allocated to the call option. The fair value of such deferred consideration is calculated based on commonly-used valuation techniques (i.e. net present value of future principal and interest cash flows discounted at market rate). These are based on market inputs from reliable financial information providers. As the put option may be exercised in the short-term, the portion of the liability that would relate to such exercise is presented as a current liability.
Fair values determined by reference to prices provided by reliable financial information providers are periodically checked for consistency against other pricing sources.
I. Offsetting financial assets & financial liabilitiesThe following financial assets and liabilities are subject to offsetting, enforceable master netting agreements and similar agreements:
2013
Amountsoffset Amountsnotoffset NetGross Net Cash
Gross amounts amounts Financial collateralMillionUSdollar amounts offset presented instruments received
Derivative assets 727 – 727 (601) – 126Derivative liabilities (789) – (789) 601 21 (167)
2012
Amountsoffset Amountsnotoffset NetGross Net Cash
Gross amounts amounts Financial collateralMillionUSdollar amounts offset presented instruments received
Derivative assets 639 – 639 (589) – 50
Derivative liabilities (1 281) – (1 281) 589 17 (675)
For the financial assets and liabilities subject to enforceable master netting agreements or similar agreements above, each agreement between the company and the counterparty allows for net settlement of the relevant financial assets and liabilities when both elect to settle on a net basis. In the absence of such election, financial assets and liabilities will be settled on a gross basis, however, each party to the master net agreement will have the option to settle all such amounts on a net basis in the event of default of the other part.
J. Significance of financial instruments for financial performanceThe note at hand discloses the different elements composing AB InBev’s position towards financial risk and instruments. The effect of AB InBev’s financial risk management on performance mainly materializes in the items of income, expense, gains or losses recognized in the income statement as presented below (see also Note 11 Finance cost and income) or in the gains and losses directly recognized in other comprehensive income.

140 / 141Anheuser-Busch InBev
Annual Report 2013
Interest expenseInterest expense recognized on unhedged and hedged financial liabilities and the net interest expense from the related hedging derivative instruments can be summarized per type of hedging relationship as follows:
MillionUSdollar 2013 2012
Financial liabilities measured at amortized cost – not hedged (2 066) (1 972)Fair value hedges – hedged items (106) (97)Fair value hedges – hedging instruments 21 43 Cash flow hedges – hedged items – (6)Cash flow hedges – hedging instruments (reclassified from equity) (5) (47)Net investment hedges – hedging instruments (interest component) 94 55 Economic hedges – hedged items not part of a hedge accounting relationship (24) (27)Economic hedges – hedging instruments not part of a hedge accounting relationship 43 (14)
(2043) (2065)
The financial liabilities per type of hedging relationship are mainly comprised of the following:• Financial liabilities measured at amortized cost – not hedged, relate mainly to bonds, unsecured bank loans and commercial papers;• Fair value hedges, relate mainly to bonds hedged for the foreign currency and the interest rate fair value risk;• Cash flow hedges, relate mainly to the 2010 senior facilities floating-rate loans, issued bonds hedged for the foreign currency and the
interest rate risk and future bond issuances hedged for the interest rate risk;• Net investment hedges contracted to hedge the net assets of the company’s foreign operations from the foreign currency risk. Derivatives
and non-derivatives are used to hedge foreign operations with functional currencies mainly denominated in Argentinean peso, Brazilian real, Bolivian boliviano, Canadian dollar, Chilean peso, Dominican peso, euro, Mexican peso, pound sterling, Russian ruble, and US dollar.
• Economic hedges, for which no hedge accounting was applied, relates mainly to the Swiss franc fixed-rate bond that was hedged for the foreign currency and the interest rate risk.
Net foreign exchange resultsForeign exchange results recognized on unhedged and hedged exposures and from the related hedging derivative instruments can be summarized per type of hedging relationship as follows:
MillionUSdollar 2013 2012
Fair value hedges - hedged items – 4 Fair value hedges – hedging instruments (2) (4)Cash flow hedges – hedged items 2 (31)Cash flow hedges – hedging instruments (reclassified from equity) (1) 40 Economic hedges – hedged items not part of a hedge accounting relationship (122) (86)Economic hedges – hedging instruments not part of a hedge accounting relationship 125 37 Other results – not hedged (297) (63)
(295) (103)
30. Operating Leases
Non-cancelable operating leases are payable and receivable as follows:
2013
Publeases Otheroperationalleases NetleaseMillionUSdollar Lessee Sublease Lessee Sublease Lessor obligations
Less than one year (121) 94 (152) 40 3 (136)Between one and two years (117) 90 (116) 31 3 (109)Between two and three years (113) 85 (86) 27 3 (84)Between three and five years (209) 158 (123) 38 6 (130)More than five years (826) 210 (164) 22 7 (751)
(1386) 637 (641) 158 22 (1210)

7/ Financial Report
2012
Publeases Otheroperationalleases NetleaseMillionUSdollar Lessee Sublease Lessee Sublease Lessor obligations
Less than one year (117) 92 (124) 38 3 (108)Between one and two years (113) 88 (102) 29 2 (96)Between two and three years (109) 83 (86) 23 1 (88)Between three and five years (203) 155 (126) 32 1 (141)More than five years (831) 206 (269) 11 4 (879)
(1373) 624 (707) 133 11 (1312)
Following the sale of Dutch and Belgian pub real estate to Cofinimmo in October 2007, AB InBev entered into lease agreements of 27 years. These operating leases maturing in November 2034 represent an undiscounted obligation of 1 386m US dollar. The pubs leased from Cofinimmo are subleased for an average outstanding period of 6 to 8 years and represent an undiscounted right to receive 637m US dollar. These leases are subject to renewal after their expiration date. The impact of such renewal is not reported in the table above.
Furthermore, the company leases a number of warehouses, factory facilities and other commercial buildings under operating leases. The leases typically run for an initial period of five to ten years, with an option to renew the lease after that date. This represents an undiscounted obligation of 641m US dollar. Lease payments are increased annually to reflect market rentals. None of the leases include contingent rentals. Also in this category AB InBev has sublet some of the leased properties, representing an undiscounted right of 158m US dollar.
At 31 December 2013, 255m US dollar was recognized as an expense in the income statement in respect of operating leases as lessee (2012: 260m US dollar), while 141m US dollar was recognized as income in the income statement in respect of subleases (2012: 145m US dollar).
The company also leases out part of its own property under operating leases. At 31 December 2013, 7m US dollar was recognized as income in the income statement in respect of operating leases as lessor (2012: 7m US dollar).
31. Collateral and Contractual Commitments for the Acquisition of Property, Plant and Equipment,
Loans to Customers and Other
MillionUSdollar 2013 2012
Collateral given for own liabilities 559 628Collateral and financial guarantees received for own receivables and loans to customers 57 36Contractual commitments to purchase property, plant and equipment 591 415Contractual commitments to acquire loans to customers 26 23Other commitments 1 021 867
The collateral given for own liabilities of 559m US dollar at 31 December 2013 contains 233m US dollar cash guarantees. Such cash deposits are a customary feature associated with litigations in Brazil: in accordance with Brazilian laws and regulations a company may or must (depending on the circumstances) place a deposit with a bank designated by the court or provide other security such as collateral on property, plant and equipment. With regard to judicial cases, AB InBev has made the appropriate provisions in accordance with IAS 37 Provisions, Contingent Liabilities and Contingent Assets – see also Note 27 Provisions. In the company’s balance sheet the cash guarantees are presented as part of other receivables – see Note 20 Trade and other receivables. The remaining part of collateral given for own liabilities (326m US dollar) contains collateral on AB InBev’s property in favor of the excise tax authorities, the amount of which is determined by the level of the monthly excise taxes due, inventory levels and transportation risk, and collateral on its property, plant and equipment with regard to outstanding loans. To the extent that AB InBev would not respect its obligations under the related outstanding contracts or would lose the pending judicial cases, the collateralized assets would be used to settle AB InBev’s obligations.
To keep AB InBev’s credit risk with regard to receivables and loans to customers as low as possible collateral and other credit enhancements were obtained for a total amount of 57m US dollar at 31 December 2013. Collateral is held on both real estate and debt securities while financial guarantees are obtained from banks and other third parties.
AB InBev has entered into commitments to purchase property, plant and equipment for an amount of 591m US dollar at 31 December 2013.

142 / 143Anheuser-Busch InBev
Annual Report 2013
In a limited number of countries AB InBev has committed itself to acquire loans to customers from banks at their notional amount if the customers do not respect their reimbursement commitments towards the banks. The total outstanding amount of such loans is 26m US dollar at 31 December 2013.
Other commitments amount to 1 021m US dollar at 31 December 2013 and mainly cover guarantees given to pension funds, rental and other guarantees.
As at 31 December 2013, the following M&A related commitments existed with respect to the combination with Grupo Modelo:
• In a transaction related to the combination of AB InBev and Grupo Modelo select Grupo Modelo shareholders committed, upon tender of their Grupo Modelo shares, to acquire 23 076 923 AB InBev shares to be delivered within 5 years for consideration of approximately 1.5 billion US dollar. The consideration was paid on 5 June 2013. Pending the delivery of the AB InBev shares, AB InBev will pay a coupon on each undelivered AB InBev share, so that the Deferred Share Instrument holders are compensated on an after tax basis, for dividends they would have received had the AB InBev shares been delivered to them prior to the record date for such dividend.
• On 7 June 2013, in a transaction related to the combination of AB InBev and Grupo Modelo, AB InBev and Constellation have entered into a three-year transition services agreement by virtue of which Grupo Modelo or its affiliates will provide certain transition services to Constellation to ensure a smooth operational transition of the Piedras Negras brewery. AB InBev and Constellation have also entered into a temporary supply agreement for an initial three-year term, whereby Constellation can purchase inventory from Grupo Modelo or its affiliates under a specified pricing until the Piedras Negras brewery business acquires the necessary capacity to fulfill 100 percent of the US demand.
32. Contingencies1
The company has contingencies for which, in the opinion of management and its legal counsel, the risk of loss is possible but not probable and therefore no provisions have been recorded. The most significant contingencies are discussed below.
Tax mattersAs of 31 December 2013, AB InBev’s material tax proceedings mainly related to Ambev and its subsidiaries with a total estimated possible risk of loss of 14.4 billion Brazilian real (6.1 billion US dollar). As of 31 December 2012, the total estimated possible risk of loss amounted to 10.8 billion Brazilian real (5.3 billion US dollar).
Approximately 10.2 billion Brazilian real (4.4 billion US dollar) of the aforementioned total estimated possible risk related to income tax and social contributions and approximately 3.8 billion Brazilian real (1.6 billion US dollar) related to value added and excise taxes, of which the most significant are discussed below. As of 31 December 2012, the amounts related to income tax and social contributions and to value added and excise taxes were 7.6 billion Brazilian real (3.7 billion US dollar) and 2.9 billion Brazilian real (1.4 billion US dollar), respectively.
During the first quarter 2005, certain subsidiaries of Ambev received a number of assessments from Brazilian federal tax authorities relating to profits of its foreign subsidiaries. In December 2008, the Administrative Court decided on one of the tax assessments relating to earnings of Ambev’s foreign subsidiaries. This decision was partially favorable to Ambev, and in connection with the remaining part, Ambev filed an appeal to the Upper House of the Administrative Court and is awaiting its decision. With respect to another of the tax assessments relating to foreign profits, the Administrative Court rendered a decision favorable to Ambev in September 2011. In December 2013, Ambev received another tax assessment related to profits of its foreign subsidiaries. As of 31 December 2013, Ambev management estimates the exposure of approximately 3.8 billion Brazilian real (1.6 billion US dollar) as a possible risk, and accordingly has not recorded a provision for such amount, and approximately 32m Brazilian real (14m US dollar) as a probable loss.
In December 2011, Ambev received a tax assessment related to the goodwill amortization resulting from the Inbev Holding Brasil S.A. merger with Ambev. Ambev filed an appeal in June 2012 and awaits the administrative level decision (‘Conselho Administrativo de Recursos Fiscais do Ministério da Fazenda - CARF ’). Ambev management estimates the amount of possible losses in relation to this assessment to be approximately 3.9 billion Brazilian real (1.7 billion US dollar) as of 31 December 2013. Ambev has not recorded any provision in connection therewith. In the event Ambev would be required to pay these amounts, Anheuser-Busch InBev SA/NV will reimburse Ambev the amount proportional to the benefit received by Anheuser-Busch InBev SA/NV pursuant to the merger protocol, as well as the respective costs.
Ambev and certain of its subsidiaries received a number of assessments from Brazilian federal tax authorities relating to the consumption of income tax losses in relation to company mergers. Ambev management estimates the total exposures of possible losses in relation to these assessments to be approximately of 582m Brazilian real (248m US dollar), as of 31 December 2013.
1Amounts have been converted to US dollar at the closing rate of the respective period.

7/ Financial Report
In Brazil, goods manufactured within the Manaus Free Trade Zone intended for consumption elsewhere in Brazil are exempt from IPI excise tax. Ambev’s subsidiaries have been registering IPI excise tax presumed credits upon the acquisition of exempted inputs manufactured therein. Since 2009, Ambev has been receiving a number of tax assessments from the Brazilian Federal Tax Authorities relating to the disallowance of such presumed credits, which the decision from the Upper House of the Administrative Court is still pending. Ambev management estimates the possible losses related to these assessments to be approximately 720m Brazilian real (307m US dollar) as of December 31, 2013.
In October 2013, Ambev received a tax assessment related to the goodwill amortization resulting from the merger of QUINSA S.A. into Ambev. Ambev filed a defense in November 2013 and awaits the administrative first decision. Ambev management estimates the amount of possible losses in relation to this assessment to be approximately 1,1 billion Brazilian real (0.5 billion US dollar) as of 31 December 2013. Ambev has not recorded any provision in connection therewith.
Ambev is currently party to legal proceedings with the State of Rio de Janeiro where it is challenging such State’s attempt to assess ICMS with respect to irrevocable discounts granted by Ambev in January 1996 and February 1998. These proceedings are currently before the Superior Court of Justice and the Brazilian Supreme Court. In November 2013, Ambev received a similar tax assessments issued by the State of Pará. Ambev management estimates the total exposure of possible losses in relation to the matter to be approximately 760m Brazilian real (324m US dollar), as of December 31, 2013.
WarrantsCertain holders of warrants issued by Ambev in 1996 for exercise in 2003 proposed lawsuits to subscribe correspondent shares for an amount lower than Ambev considers as established upon the warrant issuance. In case Ambev loses the totality of these lawsuits, the issuance of 172 831 575 shares would be necessary. Ambev would receive in consideration funds that are materially lower than the current market value. This could result in a dilution of about 1% to all Ambev shareholders. Furthermore, the holders of these warrants are claiming that they should receive the dividends relative to these shares since 2003, approximately 413m Brazilian real (176m US dollar) in addition to legal fees. Ambev disputes these claims and intends to continue to vigorously defend its case.
Antitrust mattersOn 22 July 2009, CADE, the Brazilian antitrust authority issued its ruling in Administrative Proceeding No. 08012.003805/2004-1. This proceeding was initiated in 2004 as a result of a complaint filed by Schincariol (a South American brewery and beverage maker based in Brazil) and had, as its main purpose, the investigation of Ambev’s conduct in the market, in particular its customer loyalty program known as “Tô Contigo,” which is similar to airline frequent flyer and other mileage programs. During its investigation, the Secretariat of Economic Law of the Ministry of Justice (“SDE”) concluded that the program should be considered anticompetitive unless certain adjustments were made. These adjustments had already been substantially incorporated into the then-current version of the Program. The SDE opinion did not threaten any fines and recommended that the other accusations be dismissed. After the SDE opinion was issued, the proceeding was sent to CADE, which issued a ruling that, among other things, imposed a fine in the amount of 353m Brazilian real (151m US dollar). Ambev believes that CADE’s decision was without merit and thus has challenged it before the federal courts, which have ordered the suspension of the fine and other parts of the decision upon its posting of a guarantee. Ambev has already rendered a court bond (letter of credit) for this purpose. According to the opinion of Ambev’s management, a loss is possible (but not probable), and therefore Ambev has not established a provision in its financial statements. This possible loss is expected to be limited to the aforementioned fine (which was 490m Brazilian Real (209m US dollar) as of 31 December 2013, reflecting accrued interests) and additional legal fees in connection with this matter. Ambev is also involved in other administrative proceedings before CADE and SDE, relating to the investigation of certain conduct, none of which the company believes contravenes applicable competition rules and regulations.
In August 2011, the German Federal Cartel Office (Bundeskartellamt) launched an investigation against several breweries and retailers in Germany in connection with an allegation of anticompetitive vertical price maintenance by breweries vis-à-vis their trading partners in Germany. Depending on the outcome of the investigation, the company may face fines. The company is taking the appropriate steps in the pending proceedings but has not recorded any provisions for any potential fines at this point in time, as AB InBev management does not know whether the company will eventually face any such fines and, in any event, cannot at this stage reliably estimate the appropriate amount. In addition, the company cannot at this stage estimate the likely timing of the resolution of this matter.
2009dispositionspensionlitigationOn 1 December 2009, AB InBev and several of its related companies were sued in Federal Court in the Eastern District of Missouri in a lawsuit styled Richard F. Angevine v. AB InBev, et al. The plaintiff sought to represent a class of certain employees of Busch Entertainment Corporation, which was divested on 1 December 2009, and the four Metal Container Corporation plants which were divested on 1 October 2009. He also sought to represent certain employees of any other subsidiary of Anheuser-Busch Companies, Inc. (ABC) which were divested on 1 October 2009. The lawsuit contained claims that the class was entitled to enhanced retirement benefits under sections 4.3 and 19.11(f ) of the Anheuser-Busch Companies’ Salaried Employees’ Pension Plan (the “Plan”). Specifically, plaintiff alleged that the divestitures resulted in his “involuntarily termination” from “ABC and its operating division and subsidiaries” within three years after the

144 / 145Anheuser-Busch InBev
Annual Report 2013
18 November 2008 ABC/InBev merger, which allegedly triggered the enhanced benefits under the Plan. The lawsuit claimed that by failing to provide the class members with these enhanced benefits, AB InBev, et al. breached their fiduciary duties under ERISA. The complaint sought punitive damages and attorneys’ fees. On 16 July 2010, the Court ruled that the claims for breach of fiduciary duty and punitive damages were not proper. The Court also found that Angevine did not exhaust his administrative remedies, which he must first do before filing a lawsuit. Angevine filed an appeal of this ruling with the Eighth Circuit Court of Appeals. On 22 July 2011, the Court of Appeals affirmed the decision of the lower court. No further appeals were filed.
On 15 September 2010, AB InBev and several of its related companies were sued in Federal Court for the Southern District of Ohio in a lawsuit entitled Rusby Adams et al. v. AB InBev et al. This lawsuit was filed by four employees of Metal Container Corporation’s facilities in Columbus, Ohio, Gainesville, Florida, and Ft. Atkinson, Wisconsin that were divested on 1 October 2009. Similar to the Angevine lawsuit, these plaintiffs seek to represent a class of participants of the Anheuser-Busch Companies’ Inc. Salaried Employees’ Pension Plan (the “Plan”) who had been employed by subsidiaries of Anheuser-Busch Companies, Inc. that had been divested during the period of 18 November 2008 and 17 November 2011. The plaintiffs also allege claims similar to the Angevine lawsuit: (1) that they are entitled to benefits under section 19.11(f) of the Plan; and (2) that the denial of benefits was a breach of fiduciary duty. AB InBev believed that it had defenses to these claims, and filed a motion to dismiss. On 25 April 2011, the Court dismissed the breach of fiduciary duty claims, and the only remaining claim is for benefits under section 19.11(f). On 28 March 2012, the Court certified that the case could proceed as a class action comprised of former employees of the divested MCC operations. On 9 January 2013, the Court granted AB InBev’s motion for Judgment on the Administrative Record. The plaintiffs appealed this decision on 5 February 2013. That appeal has been fully briefed and argued, and is pending before the Court of Appeals for the 6th Circuit.
On 10 January 2012, a class action complaint asserting claims very similar to those asserted in the Angevine lawsuit was filed in Federal Court for the Eastern District of Missouri, styled Nancy Anderson et al. v. Anheuser-Busch Companies Pension Plan et al. Unlike the Angevine case, however, the plaintiff in this matter alleges complete exhaustion of all administrative remedies. The company filed a motion to dismiss on 9 October 2012. This was still pending when the Court allowed the complaint to be amended on 19 November 2012 to name four new plaintiffs. AB InBev filed a motion to dismiss on 17 December 2012. While this motion was pending, on 11 March 2013 the Court consolidated the case with the Knowlton case (see below) which had been transferred from California to Missouri.
On 10 October 2012, another class action complaint was filed against Anheuser-Busch Companies, LLC, Anheuser-Busch Companies Pension Plan, Anheuser-Busch Companies Pension Plan Appeals Committee and the Anheuser-Busch Companies Pension Plans Administrative Committee by Brian Knowlton, an employee of the divested Busch Entertainment Corporation. This complaint, filed in Federal Court in the Southern District of California, was amended on 12 October 2012. Like the other lawsuits, it claims that the employees of any divested assets were entitled to enhanced retirement benefits under section 19.11(f) of the Plan. However, it specifically excludes the divested Metal Container Corporation facilities that have been included in the Adams class action. On 6 November 2012, the plaintiffs filed a motion asking the court to move the Anderson case to California to join it with the Knowlton case for discovery. The company filed a motion to dismiss/motion to transfer the case to Missouri on 12 November 2012, which was granted on 30 January 2013. As outlined above, on 11 March 2013, the Knowlton case was then consolidated in Missouri with the Anderson case. On 19 April 2013 a consolidated complaint was filed, and a Motion to Dismiss was filed by the company on 10 May 2013. On 30 October 2013, the court dismissed the breach of fiduciary claims, and an answer was filed on 13 November 2013. On 19 November 2013, plaintiffs amended one count of the consolidated complaint. A Motion to Dismiss the amended count was filed on 6 December 2013 and has not yet been ruled upon. Class certification briefing is scheduled to occur during the first quarter of 2014.

7/ Financial Report
33. Related Parties
Transactions with directors and Executive board Management Members (KEY MANAGEMENT PERSONNEL)In addition to short-term employee benefits (primarily salaries) AB InBev’s executive board management members are entitled to post-employment benefits. More particular, members of the executive board management participate in the pension plan of their respective country – see also Note 25 Employee Benefits. Finally, key management personnel are eligible for the company’s share option; restricted stock and/or share swap program (refer Note 26 Share-based Payments). Total directors and executive board management compensation included in the income statement can be detailed as follows:
2013 2012
Executiveboard ExecutiveboardMillion US dollar Directors management Directors management
Short-term employee benefits 2 22 3 25Post-employment benefits – 2 – 2Share-based payments 3 66 3 51
5 90 6 78
Directors’ compensation consists mainly of directors’ fees. Key management personnel was not engaged in any transactions with AB InBev and did not have any outstanding balances with the company.
Jointly controlled entitiesSignificant interests in joint ventures include two distribution entities in Canada, two entities in Brazil, two in China, one in Mexico and one in UK. None of these joint ventures are material to the company. Aggregate amounts of AB InBev’s interest are as follows:
MillionUSdollar 2013 2012
Non-current assets 101 129Current assets 57 72Non-current liabilities 67 154Current liabilities 115 120Result from operations 24 18Profit attributable to equity holders of AB InBev 11 9
Transactions with associatesAB InBev’s transactions with associates were as follows:
MillionUSdollar 2013 2012
Gross profit 31 232Current assets 6 14
Current liabilities 32 9
Transactions with pension plansAB InBev’s transactions with pension plans mainly comprise 12m US dollar other income from pension plans in US and 5m US dollar other income from pension plans in Brazil.
Transactions with government-related entitiesAB InBev has no material transactions with government-related entities.

146 / 147Anheuser-Busch InBev
Annual Report 2013
34. Events after the Balance Sheet Date
Oriental brewery acquisitionOn 20 January, AB InBev, KKR and Affinity Equity Partners announced that an agreement has been entered into whereby AB InBev will reacquire Oriental Brewery (“OB”), the leading brewer in South Korea, from KKR and Affinity for 5.8 billion US dollar.
This agreement returns OB to the AB InBev portfolio, after AB InBev sold the company in July 2009, following the combination of InBev and Anheuser-Busch, in support of the company’s deleveraging commitment. AB InBev will reacquire OB earlier than July 2014, as it was originally entitled to under the 2009 transaction.
Since KKR and Affinity entered into partnership with OB in 2009, OB has grown to become the largest brewer in South Korea, driven by strong growth of the Cass brand. OB and AB InBev also remained long-term partners through OB’s exclusive license to distribute select AB InBev brands in South Korea such as Budweiser, Corona and Hoegaarden.
The enterprise value for the transaction is 5.8 billion USD, and as a result of an agreement entered into with KKR and Affinity in 2009, AB InBev will also receive approximately 320m US dollar in cash at closing from this transaction, subject to closing adjustments according to the terms of the transaction. OB estimates its EBITDA in 2013 was approximately KRW 529 billion or approximately 500m US dollar at exchange rates at the date of the announcement.
The transaction is subject to regulatory approval in South Korea as well as other customary closing conditions, and is expected to close in the first half of 2014.
Bond issuanceOn 27 January 2014, Anheuser-Busch InBev Finance Inc., a subsidiary of AB InBev, issued 5.25 billion US dollar aggregate principal amount of bonds, consisting of 1.2 billion US dollar aggregate principal amount of fixed rate notes due 2017; 300m US dollar aggregate principal amount of floating rate notes due 2017; 1.25 billion US dollar aggregate principal amount of fixed rate notes due 2019; 250m US dollar aggregate principal amount of floating rate notes due 2019; 1.4 billion US dollar aggregate principal amount of fixed rate notes due 2024; and 850m US dollar aggregate principal amount of fixed rate notes due 2044. The fixed rate notes will bear interest at an annual rate of 1.125% for the 2017 notes; 2.150% for the 2019 notes; 3.700% for the 2024 notes; and 4.625% for the 2044 notes. The floating rate notes will bear interest at an annual rate of 19.00 basis points above three-month LIBOR for the 2017 floating rate notes and 40.00 basis points above three-month LIBOR for the 2019 floating rate notes.
Argentinean PESO devaluationIn January 2014, the Argentinean peso underwent a severe devaluation. In 2013, the Argentinean operations represented 4.6% of the company’s consolidated revenue and 5.1% of the company’s consolidated normalized EBITDA. The 2013 Argentinean full year results were translated at an average rate of 5.4466 Argentinean pesos per US dollar. The 2014 devaluation, and further devaluations in the future, if any, is expected to decrease the company’s net assets in Argentina, with a balancing entry in the equity of the company. The translation of results and cash flows of the company’s Argentinean operations are also expected to be impacted.

7/ Financial Report
35. AB Inbev Companies
Listed below are the most important AB InBev companies. A complete list of the company’s investments is available at AB InBev NV, Brouwerijplein 1, B-3000 Leuven, Belgium. The total number of companies consolidated (fully, proportional and equity method) is 452.
List of most important fully consolidated companies
%ofeconomicinterest as at
Nameandregisteredofficeoffullyconsolidatedcompanies 31December2013
Argentina
CERVECERIA Y MALTERIA QUILMES SAICA y G - Charcas 5160 - Buenos Aires 61.89
Belgium
AB INBEV NV - Grote Markt 1 - 1000 - Brussel Consolidating Company
BRASSERIE DE L’ABBAYE DE LEFFE S.A. - Place de l’Abbaye 1 - 5500 - Dinant 98.54
BROUWERIJ VAN HOEGAARDEN N.V. - Stoopkensstraat 46 - 3320 - Hoegaarden 100.00
COBREW N.V. - Brouwerijplein 1 - 3000 - Leuven 100.00
INBEV BELGIUM N.V. - Industrielaan 21 - 1070 - Brussel 100.00
Bolivia
CERVECERIA BOLIVIANA NACIONAL S.A. - Av. Montes 400 and Chuquisaca Street - La Paz 61.89
Brazil
CIA DE BEBIDAS DAS AMERICAS - AMBEV BRASIL - Rua Dr. Renato Paes de Barros, 1017, 4° Andar (parte), cj. 44 e 42 - Itaim Bibi, Sao Paulo 61.89
Canada
LABATT BREWING COMPANY LIMITED - 207 Queen’s Quay West, Suite 299 - M5J 1A7 - Toronto 61.89
Chile
CERVECERIA CHILE S.A. - Av. Presidente Eduardo Frei Montalva 9600 - Quilicura 61.89
China
ANHEUSER-BUSCH INBEV (WUHAN) BREWING COMPANY LIMITED - Shangshou, Qin Duan Kou, Hanyang Area, Wuhan, Hubei Province 97.06
ANHEUSER-BUSCH INBEV HARBIN BREWERY COMPANY LIMITED - 20 Youfang Street - Xiangfang District - Harbin, Heilongjiang Province 100.00
ANHEUSER-BUSCH INBEV (ZHOUSHAN) BREWERY Co., Ltd. - No.1 Linggang Yi Road, Linggang industrial area, Dinghai District - Zhou Shan 100.00
INBEV BAISHA (HUNAN) BREWERY CO LTD - No. 304 Shao Shan Zhong Lu - Changsha 100.00
INBEV DOUBLE DEER GROUP CO LTD - 419 Wu Tian Street - Wenzhou 55.00
INBEV JINLONGQUAN (HUBEI) BREWERY CO LTD - 89 Chang Ning Street - Jingmen 60.00
INBEV JINLONGQUAN (XIAOGAN) BREWERY CO LTD - No. 198 Chengzhan Street - Xiaogan 60.00
INBEV KK (NINGBO) BREWERY CO LTD - Jinjiang Zhen, 315000 - Ningbo 100.00
INBEV SEDRIN BREWERY Co, Ltd - No.2 factory Xialin Cun, Chen Xiang district, PuTian City, Fujian Province 100.00
ANHEUSER-BUSCH INBEV (TAIZHOU) BREWERY CO., LTD. - 159, Qi Xia Dong Road - Cheng Guan, Tiantai County 100.00
ANHEUSER-BUSCH INBEV (NINGBO) BREWERY CO., LTD. - JinJiang Zhen,- 315000 - Ningbo, Zhejiang Province 100.00
ANHEUSER-BUSCH INBEV (NANJING) BREWERY CO., LTD.- Qi Li Qiao, Jiang Pu district, -211800- Nanjing 100.00
Dominican Republic
CERVECERIA NACIONAL DOMINICANA, esquina formada por la Autopista 30 de Mayo – Km. 6-1/2 y calle San Juan Bautista,Santo Domingo, Distrito Nacional 34.04
Ecuador
COMPAÑIA CERVECERA AMBEV ECUADOR S.A. - Km 14.5 Via a Daule S/N y Av. Las Iguanas, Guayaquil 61.89
France
AB - INBEV FRANCE S.A.S. 38 Allée Vauban 59110 La Madeleine 100.00

148 / 149Anheuser-Busch InBev
Annual Report 2013
%ofeconomic interest as at Nameandregisteredofficeoffullyconsolidatedcompanies 31December2013
Germany
BRAUEREI BECK GmbH & CO. KG - Am Deich 18/19 - 28199 - Bremen 100.00
BRAUEREI DIEBELS GmbH & CO.KG - Brauerei-Diebels-Strasse 1 - 47661 - Issum 100.00
BRAUERGILDE HANNOVER AG - Hildesheimer Strasse 132 - 30173 - Hannover 100.00
HAAKE-BECK BRAUEREI GmbH & Co. KG - Am Deich 18/19 - 28199 - Bremen 99.96
HASSERÖDER BRAUEREI GmbH - Auerhahnring 1 - 38855 - Wernigerode 100.00
ANHEUSER-BUSCH INBEV GERMANY HOLDING GmbH - Am Deich 18/19 - 28199 - Bremen 100.00
SPATEN - FRANZISKANER - BRÄU GmbH - Marsstrasse 46 + 48 - 80335 - München 100.00
GrandDuchyofLuxemburg
BRASSERIE DE LUXEMBOURG MOUSEL - DIEKIRCH - 1, Rue de la Brasserie - L-9214 - Diekirch 95.82
India
CROWN BEERS INDIA LIMITED - #8-2-684/A, Road No. 12 - BANJARA HILLS, HYDERABAD 500034 - ANDHRA PRADESH 100.00
Mexico
GRUPO MODELO, S.A.B. DE C.V. – JAVIER BARROS SIERRA 555 PISO 3 ZEDEC ED PLAZA SANTA FE DISTRITO FEDERAL C.P. 01210 100.00
Paraguay
CERVECERIA PARAGUAYA S.A. – Ruta Villeta KM30 - Ypané 61.89
Peru
COMPANIA CERVECERA AMBEV PERU SAC - Av Los Laureles Mza a lote 4 (Mirador 12 Carretera R. Priale) Lima - Luringancho 61.89
Russia
OAO SUN INBEV - 28 Moscovskaya Street, Moscow region - 141600 - Klin 99.95
The Netherlands
INBEV NEDERLAND N.V. - Ceresstraat 1 - 4811 CA - Breda 100.00
INTERBREW INTERNATIONAL B.V. - Ceresstraat 1 - 4811 CA - Breda 100.00
Ukraine
PJSC SUN InBev Ukraine - 30V Fizkultury St - 03680 - Kyiv 98.29
US
ANHEUSER-BUSCH COMPANIES, LLC. - One Busch Place - St. Louis, MO 63118 100.00
ANHEUSER-BUSCH INTERNATIONAL, INC. - One Busch Place - St. Louis, MO 63118 100.00
ANHEUSER-BUSCH PACKAGING GROUP, INC. - One Busch Place - St. Louis, MO 63118 100.00
United Kingdom
BASS BEERS WORLDWIDE LIMITED - Porter Tun House, 500 Capability Green - LU1 3LS - Luton 100.00
INBEV UK LTD - Porter Tun House, 500 Capability Green - LU1 3LS - Luton 100.00
Uruguay
CERVECERIA Y MALTERIA PAYSSANDU S.A. - Rambla Baltasar Brum, 2933 - 11800 - Payssandu 61.89

7/ Financial Report
Information to our Shareholders
Earnings, dividends, share and share price
2013 2012 2011 2010 2009
Cash flow from operating activities (US dollar per share) 8.53 8.29 7.83 6.22 5.76Normalized earnings per share (US dollar per share) 4.91 4.50 4.04 3.17 2.48Dividend (euro per share) 2.05 1.70 1.20 0.80 0.38
Share price high (euro per share) 79.60 71.05 47.35 46.33 36.80Share price low (euro per share) 63.44 46.10 33.85 33.50 16.34Year-end share price (euro per share) 77.26 65.74 47.31 42.80 36.40
Weighted average number of ordinary shares (million shares) 1 617 1 600 1 595 1 592 1 584Diluted weighted average number of ordinary shares (million shares) 1 650 1 628 1 614 1 611 1 593
Volume of shares traded (million shares) 423 486 652 588 798

150 / 151Anheuser-Busch InBev
Annual Report 2013
Information on the Auditors’ Assignments and Related Fees
AB InBev’s Statutory auditor is PricewaterhouseCoopers Bedrijfsrevisoren cvba, represented by Yves Vandenplas, engagement partner.
Base fees for auditing the annual financial statements of AB InBev and its subsidiaries are determined by the general meeting ofshareholders after review and approval by the company’s Audit Committee and Board of Directors.
Fees for 2013 in relation to services provided by PricewaterhouseCoopers Bedrijfsrevisoren amounted to 3 743k US dollar(2012: 3 253k US dollar), which was composed of audit services for the annual financial statements of 1 864k US dollar (2012: 1 676k US dollar),tax services of 1 386k US dollar (2012: 1 324k US dollar), audit related services of 407k US dollar (2012: 83k US dollar) and other services of86k US dollar (2012: 170k US dollar). Audit related services mainly relate to services incurred in connection with rights and bonds issuance, interim dividends, responsible drinking certification and capital increases. Tax services mainly relate to services incurred in connection with expat services and other services mainly relate to services incurred in connection with Better World initiatives, all of which have been pre-approved by the company’s Audit Committee.
Fees for 2013 in relation to services provided by other offices in the PricewaterhouseCoopers network amounted to 18 006k US dollar(2012: 11 411k US dollar), which was composed of audit services for the annual financial statements of 11 804k US dollar (2012: 6 601k US dollar),tax services of 5 154k US dollar (2012: 4 367k US dollar), audit related services of 1 030k US dollar (2012: 276k US dollar) and other services of18k US dollar (2012: 167k US dollar).
Financial Calendar
Publication of 2013 results 26 February 2014Annual report 2013 available on www.ab-inbev.com 26 February 2014General shareholders meeting 30 April 2014Dividend: ex-coupon date 5 May 2014Publication of first quarter results 7 May 2014Publication of half year results 31 July 2014Publication of third quarter results 31 October 2014
Investor Relations Contact
Media InvestorsMarianne Amssoms Graham Staley Tel: +1-212-573-9281 Tel: +1-212-573-4365 E-mail: [email protected] E-mail: [email protected]
Karen Couck Thelke GerdesTel: +32-16-27-69-65 Tel: +32-16-27-68-88E-mail: [email protected] E-mail: [email protected]
Laura Vallis Christina CaspersenTel: +1-212-573-9283 Tel: +1-212-573-4376E-mail: [email protected] E-mail: [email protected]

7/ Financial Report
Excerpt from the AB InBev NV Separate (Non-Consolidated) Financial Statements Prepared in Accordance with Belgian GAAPThe following information is extracted from the separate Belgian GAAP financial statements of AB InBev NV. These separate financial statements, together with the management report of the Board of Directors to the general assembly of shareholders as well as the auditors’ report, will be filed with the National Bank of Belgium within the legally foreseen time limits. These documents are also available on request from: AB InBev NV, Brouwerijplein 1, 3000 Leuven.
It should be noted that only the consolidated financial statements as set forth above present a true and fair view of the financial position and performance of the AB InBev group.
Since AB InBev NV is essentially a holding company, which recognizes its investments at cost in its non-consolidated financial statements, these separate financial statements present no more than a limited view of the financial position of AB InBev NV. For this reason, the Board of Directors deemed it appropriate to publish only an abbreviated version of the non-consolidated balance sheet and income statement prepared in accordance with Belgian GAAP as at and for the year ended 31 December 2013.
The statutory auditor’s report is unqualified and certifies that the non-consolidated financial statements of AB InBev NV prepared in accordance with Belgian GAAP for the year ended 31 December 2013 give a true and fair view of the financial position and results of AB InBev NV in accordance with all legal and regulatory dispositions.

152 / 153Anheuser-Busch InBev
Annual Report 2013
Abbreviated Non-Consolidated Balance Sheet
Millioneuro 2013 2012
AssetsNon-current assetsIntangible assets 197 226Property, plant and equipment 104 87Financial assets 50 268 51 346
50 569 51 659Currentassets 10410 5060
Totalassets 60979 56719
Equity and liabilitiesEquityIssued capital 1 238 1 237Share premium 13 178 13 152Legal reserve 124 124Reserves not available for distribution 38 147Reserves available for distribution 483 374Profit carried forward 24 082 25 621
39143 40655Provisionsanddeferredtaxes 166 136Non-currentliabilities 12925 7540Currentliabilities 8745 8388
Totalequityandliabilities 60979 56719
Abbreviated Non-Consolidated Income Statement
Millioneuro 2013 2012
Operating income 806 831Operating expenses (474) (454)
Operatingresult 332 377Financial result 1 417 5 602Extraordinary result (tax exempted intragroup capital gains on share transfer)
Resultfortheyearavailableforappropriation 1749 5979

7/ Financial Report
Glossary
Aggregated weighted nominal tax rateThe aggregated weighted nominal tax rate is based on the statutory corporate income tax rates applicable in the various countries.
Diluted epsProfit attributable to equity holders of AB InBev divided by the fully diluted weighted average number of ordinary shares.
Diluted weighted average number of ordinary sharesWeighted average number of ordinary shares, adjusted by the effect of share options on issue.
EBITProfit from operations.
EBITDAProf it from operations plus depreciation, amortization and impairment.
EPSProfit attributable to equity holders of AB InBev divided by the weighted average number of ordinary shares.
Invested capitalIncludes property, plant and equipment, goodwill and intangible assets, investments in associates and equity securities, working capital, provisions, employee benefits and deferred taxes.
Marketing expensesInclude all costs relating to the support and promotion of the brands. They include among others operating costs (payroll, office costs, etc.) of the marketing department, advertising costs (agency costs, media costs, etc.), sponsoring and events, and surveys and market research.
Net capexAcquisitions of property, plant and equipment and of intangible assets, minus proceeds from sale.
NetdebtNon-current and current interest-bearing loans and borrowings and bank overdrafts, minus debt securities and cash.
Non-recurring itemsItems of income or expense which do not occur regularly as part of the normal activities of the company.
NormalizedThe term “normalized” refers to performance measures (EBITDA, EBIT, Profit, EPS, effective tax rate) before non-recurring items. Non-recurring items are items of income or expense which do not occur regularly as part of the normal activities of the company and which warrant separate disclosure because they are important for the understanding of the underlying results of the company due to their size or nature. AB InBev believes that the communication and explanation of normalized measures is essential for readers of its f inancial statements to understand fully the sustainable performance of the company. Normalized measures are additional measures used by management and should not replace the measures determined in accordance with IFRS as an indicator of the company’s performance.

154 / 155Anheuser-Busch InBev
Annual Report 2013
Normalized diluted EPSDiluted EPS adjusted for non-recurring items.
Normalized EBITProfit from operations adjusted for non-recurring items.
Normalized EBITDAProfit from operations adjusted for non-recurring items, plus depreciation, amortization and impairment.
NormalizedeffectivetaxrateEffective tax rate adjusted for non-recurring items.
Normalized EPSEPS adjusted for non-recurring items.
NormalizedprofitProfit adjusted for non-recurring items.
NormalizedprofitfromoperationsProfit from operations adjusted for non-recurring items.
PayoutratioGross dividend per share multiplied by the estimated number of ordinary shares outstanding at the dividend record date, divided by normalized profit attributable to equity holders of AB InBev.
RE-measurementsofpost-employeebenefitsComprised of actuarial gains and losses, the effect of the asset ceiling (excluding net interest) and the return on plan assets (excluding net interest).
RevenueGross revenue less excise taxes and discounts.
Sales expensesInclude all costs relating to the selling of the products. They include among others the operating costs (payroll, office costs, etc.) of the sales department and the sales force.
ScopeFinancials are analyzed eliminating the impact of changes in currencies on translation of foreign operations, and scopes. A scope represents the impact of acquisitions and divestitures, the start-up or termination of activities or the transfer of activities between segments, curtailment gains and losses and year-over-year changes in accounting estimates and other assumptions that management does not consider as part of the underlying performance of the business.
WeightedaveragenumberofordinarysharesNumber of shares outstanding at the beginning of the period, adjusted by the number of shares cancelled, repurchased or issued during the period multiplied by a time-weighing factor.
WorkingcapitalIncludes inventories, trade and other receivables and trade and other payables, both current and non-current.