Anglo-Saxon Capitalist Model - Text of the Article
32
1 Mariusz Próchniak ANGLO-SAXON CAPITALIST MODEL 1. Introduction This paper aims to characterise the Anglo-Saxon model of capitalism. In the introduction, we describe the method of the analysis and the sample of countries. Capitalism is a socio-economic system based on private property, personal freedom, and freedom to sign contracts. Economic processes in the capitalist system are governed to a dominant extent by the markets of goods, services, labour, and capital (Wielka Encyklopedia PWN, 2005). Generally speaking, such a system exists in many (perhaps even most) countries of the world. However, the detailed features of the individual capitalist models differ among countries, sometimes considerably. Thus, there are several models of capitalism. There is no unique classification: the authors distinguish many capitalist models derived from different classifications. However, regardless of the methodology of the division, certain common types of capitalism can be found. Following Coates (2001), there are two or three models of capitalism: market-led capitalism and two forms of trust-based capitalism: state-led capitalism (in which the state power plays a dominant role in capital accumulation) and negotiated (consensual) capitalism (which is based on mutual relationships between capital, labour, and the state). According to Coates, market-led capitalism exists primarily in the U.S. and UK. It is also called neo-American, Anglo-Saxon, or liberal model. State-led capitalism can be found in Japan and South Korea. It is also referred to as the Asian capitalism or developmental state capitalism. Negotiated (consensual) model exists, inter alia, in the Scandinavian countries and Germany. It is also called the European welfare capitalism or the Rhine model. Hart (1992) also suggests the existence of three capitalist systems in the world: American, Western European, and Japanese. Hanson (2006) indicates four types of capitalism in Europe: Continental, Mediterranean, Nordic, and Anglo-Saxon. Capitalist models can also be divided in another way. For example, we can link them directly with the region (the Asian model, the Scandinavian model etc.) or with the institutional environment (coordinated or non-coordinated labour market regulations,
-
Upload
palashdon6 -
Category
Documents
-
view
52 -
download
1
description
PDF
Transcript of Anglo-Saxon Capitalist Model - Text of the Article
1
Mariusz Próchniak
ANGLO-SAXON CAPITALIST MODEL
1. Introduction
This paper aims to characterise the Anglo-Saxon model of capitalism. In the introduction,
we describe the method of the analysis and the sample of countries.
Capitalism is a socio-economic system based on private property, personal freedom, and
freedom to sign contracts. Economic processes in the capitalist system are governed to a
dominant extent by the markets of goods, services, labour, and capital (Wielka Encyklopedia
PWN, 2005). Generally speaking, such a system exists in many (perhaps even most) countries
of the world. However, the detailed features of the individual capitalist models differ among
countries, sometimes considerably. Thus, there are several models of capitalism.
There is no unique classification: the authors distinguish many capitalist models derived
from different classifications. However, regardless of the methodology of the division, certain
common types of capitalism can be found. Following Coates (2001), there are two or three
models of capitalism: market-led capitalism and two forms of trust-based capitalism: state-led
capitalism (in which the state power plays a dominant role in capital accumulation) and
negotiated (consensual) capitalism (which is based on mutual relationships between capital,
labour, and the state). According to Coates, market-led capitalism exists primarily in the U.S.
and UK. It is also called neo-American, Anglo-Saxon, or liberal model. State-led capitalism
can be found in Japan and South Korea. It is also referred to as the Asian capitalism or
developmental state capitalism. Negotiated (consensual) model exists, inter alia, in the
Scandinavian countries and Germany. It is also called the European welfare capitalism or the
Rhine model.
Hart (1992) also suggests the existence of three capitalist systems in the world: American,
Western European, and Japanese. Hanson (2006) indicates four types of capitalism in Europe:
Continental, Mediterranean, Nordic, and Anglo-Saxon.
Capitalist models can also be divided in another way. For example, we can link them
directly with the region (the Asian model, the Scandinavian model etc.) or with the
institutional environment (coordinated or non-coordinated labour market regulations,
2
communitarian or individualistic value systems, credit-based or bank-based system,
shareholder capitalism or welfare capitalism).
In this paper, we characterise the Anglo-Saxon capitalist model. It will be also called the
liberal model. This type of capitalism is distinguished in most of the classifications. There is
also a general agreement that the two countries: the U.S. and UK have this form of capitalism.
In this study, we describe the Anglo-Saxon capitalist model based on five countries: USA,
UK, Ireland, Canada, and Australia. In addition to the standard U.S. and UK, we decided to
include three other countries: Ireland, Canada, and Australia, which also represent the Anglo-
Saxon model.1 The same is suggested by some other authors. For example, Hanson (2006)
argues that the Anglo-Saxon capitalism exists in Ireland. The most representative picture of
the liberal model belongs of course to the U.S. and UK and these countries will be the core of
our considerations. However, it is worth to pay attention to several other countries which can
be regarded as representatives of the Anglo-Saxon model.
The best way to show the main characteristics of a particular model is to compare the
countries under study with the countries representing other forms of capitalism. Such an
analysis will show how the features of one economic system are specific to a given system
and identify it uniquely, or they are common and exist in many forms of capitalism.
Therefore, we conduct a comparative analysis and compare Anglo-Saxon countries with 10
other countries representing different forms of capitalism: Germany and France (the
Continental model), Sweden (the best example of Scandinavian capitalism), Italy and Spain
(the Mediterranean capitalist economies), Japan and Korea (the East-Asian model) as well as
– that may be regarded as a novelty – Poland, Czech Republic, and Hungary (emerging
market economies).
We start the analysis by presenting general characteristics of the examined countries, that
is a ‘deep’ institutional environment: their political system, legal framework, and historical
and geographical aspects. Then we smoothly switch to the analysis of the business climate.
We focus on the institutions responsible for private sector development by analysing indices
of economic freedom and doing business indicators. Then we discuss explicitly some
quantitative variables that reflect the size of government and capital market development. We
finish the analysis by comparing the macroeconomic performance of the countries concerned,
that is their current development level.
1 The Anglo-Saxon countries are also New Zealand and South Africa. These countries, however, are excluded from our analysis.
3
The selection of the variables to be examined in the paper is based on a brief review of the
literature concerning institutions, structural reforms, and economic growth determinants (see,
e.g., Hanson, 2007; Rapacki, 2009ab; Sulejewicz, 2009; Wojtyna, 2009).
The paper consists of six points. The first one is this introduction. In point 2, we compare
the countries by examining their ‘deep’ institutional environment (historical, geographical,
cultural, and political factors). Section 3 discusses the institutional framework in terms of
economic freedom and ease of doing business. Point 4 shows some quantitative data on the
size of government, capital market development, and income inequalities. In Section 5, we
compare the current development level of the countries. Point 6 concludes.2
2. ‘Deep’ institutions (historical, geographical, cultural, and political factors)
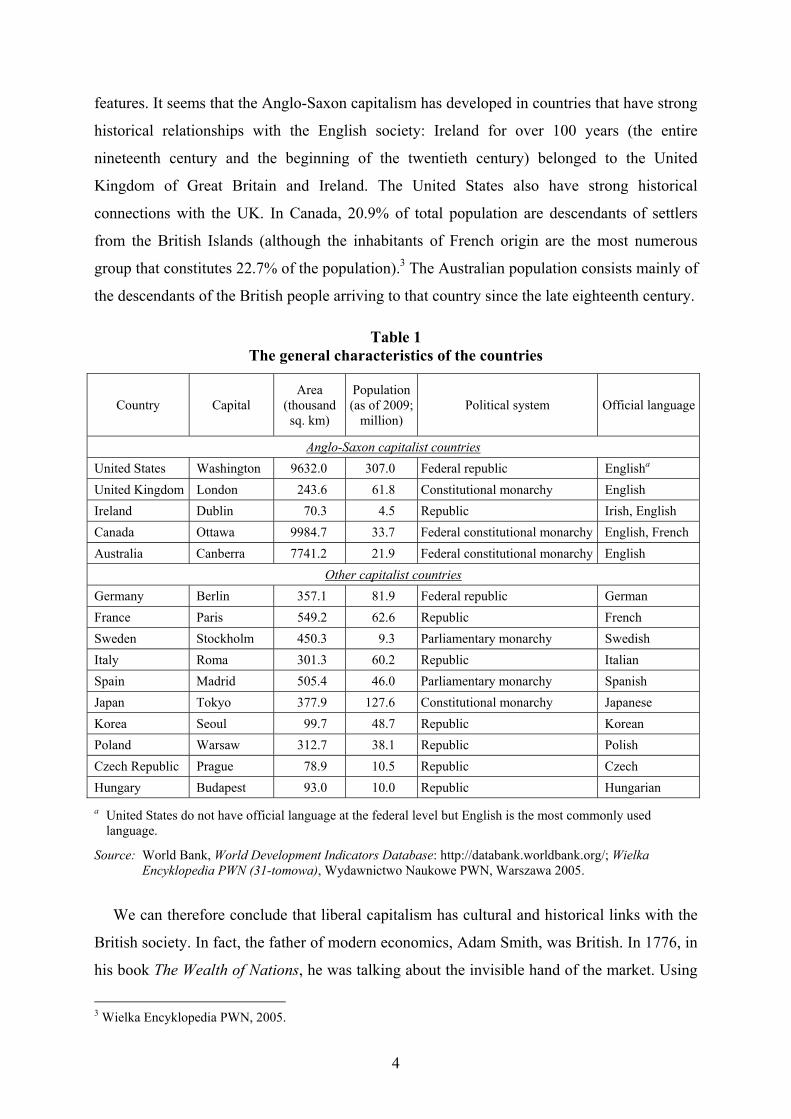
We begin the analysis by comparing the countries in terms of political system,
geographical location, and historical factors. Key data are included in Table 1. It shows the
political system of the country, the official language, the surface area, the size of population,
and the capital city.
The data in Table 1 suggest that the specific type of a democratic political system cannot
be uniquely identified with the Anglo-Saxon capitalism. Within this group, there are countries
that are republics (U.S. and Ireland) and monarchies (UK, Canada, and Australia). Some of
these countries are federations, the others are not. The lack of correlation between the type of
a democratic political system and the model of capitalism is also found for the other analysed
economies.
It is worth to look at the last column of Table 1 which shows the country’s official
language. The language reflects, to some extent, the history of a given country. In a broader
context, it can be treated as a proxy for historical and cultural environment. The Anglo-Saxon
capitalism exists in English speaking countries. Although English needn’t be the only official
language (for example, Ireland has the second official language Irish, while Canada uses also
French), all the Anglo-Saxon capitalist economies are English speaking. The point here, of
course, is not the language itself, since English is also found in many other countries which
are far from the principles of pure capitalism (for example, Zimbabwe and Sierra Leone). In
our case, however, the English language indicates the similarity of historical and cultural
2 In this paper, we conduct our own empirical analysis. We do not present the review of the literature neither report the findings obtained by the other authors. Those who are interested in other authors’ views and the results of other studies should see: Coates (2002). This publication presents a detailed debate on different capitalist models. Liberal capitalism is discussed in vol. III.
4
features. It seems that the Anglo-Saxon capitalism has developed in countries that have strong
historical relationships with the English society: Ireland for over 100 years (the entire
nineteenth century and the beginning of the twentieth century) belonged to the United
Kingdom of Great Britain and Ireland. The United States also have strong historical
connections with the UK. In Canada, 20.9% of total population are descendants of settlers
from the British Islands (although the inhabitants of French origin are the most numerous
group that constitutes 22.7% of the population).3 The Australian population consists mainly of
the descendants of the British people arriving to that country since the late eighteenth century.
Table 1 The general characteristics of the countries
Country Capital Area
(thousand sq. km)
Population (as of 2009;
million) Political system Official language
Anglo-Saxon capitalist countries United States Washington 9632.0 307.0 Federal republic Englisha United Kingdom London 243.6 61.8 Constitutional monarchy English Ireland Dublin 70.3 4.5 Republic Irish, English Canada Ottawa 9984.7 33.7 Federal constitutional monarchy English, French Australia Canberra 7741.2 21.9 Federal constitutional monarchy English
Other capitalist countries Germany Berlin 357.1 81.9 Federal republic German France Paris 549.2 62.6 Republic French Sweden Stockholm 450.3 9.3 Parliamentary monarchy Swedish Italy Roma 301.3 60.2 Republic Italian Spain Madrid 505.4 46.0 Parliamentary monarchy Spanish Japan Tokyo 377.9 127.6 Constitutional monarchy Japanese Korea Seoul 99.7 48.7 Republic Korean Poland Warsaw 312.7 38.1 Republic Polish Czech Republic Prague 78.9 10.5 Republic Czech Hungary Budapest 93.0 10.0 Republic Hungarian a United States do not have official language at the federal level but English is the most commonly used
language.
Source: World Bank, World Development Indicators Database: http://databank.worldbank.org/; Wielka Encyklopedia PWN (31-tomowa), Wydawnictwo Naukowe PWN, Warszawa 2005.
We can therefore conclude that liberal capitalism has cultural and historical links with the
British society. In fact, the father of modern economics, Adam Smith, was British. In 1776, in
his book The Wealth of Nations, he was talking about the invisible hand of the market. Using
3 Wielka Encyklopedia PWN, 2005.
5
the invisible hand, Adam Smith tried to describe the mechanism of capitalist economies.
According to this view, the actions of individuals, due to their selfish desire to satisfy their
own needs, lead to the realization of social needs. Through invisible hand, Adam Smith
rejects the need for state intervention and protectionism as factors contributing to the public
interest. It seems that British society has gone the way proposed in the late eighteenth century
by Smith and, in countries which have the greatest historical ties with the UK, the model of
liberal capitalism has been developed.
The other countries analysed as reference economies are not English speaking. For many
centuries they have developed in a different cultural environment. Perhaps this is one of the
most important reasons, existing deeply in the societies, why these countries put different
emphasis on such issues as the economic role of government.
Anglo-Saxon countries are differentiated as regards the surface area and the number of
population. Canada, USA, and Australia are the largest countries in terms of the area, ranked
2nd, 4th, and 6th respectively in the worldwide ranking. However, Canada and Australia are
sparsely populated: in terms of the size of population, they are smaller than the UK or Poland.
Ireland, in turn, is a relatively small country. The criterion of the country’s size, therefore,
does not identify a particular model of capitalism.
In the next step, we will characterise the countries in terms of the level of democracy,
political stability, legal framework, and governance. These factors will be analysed using
qualitative indicators, compiled by international organisations. The variables involved
measure the profound institutional environment and affect the general framework of a
country’s socio-economic system.
The development of democracy
There is no commonly accepted way to measure democracy. There are various definitions
of democracy. For some people, the nature of a democratic system is binary (the country is
democratic or not). For others, it is of a continuous scale (it is possible to identify countries
that are more or less democratic as well as those that are not democracies). When we consider
the binary definition, all the 15 analysed countries are democratic. In this regard, the
democracy itself is not a factor identifying the Anglo-Saxon model of capitalism.
However, the following question arises: Does the scope (or the development) of a
democracy determine the type of capitalism? Are liberal countries the most democratic ones
or the least democratic? To answer this question we use the democracy index published by the
Economist Intelligence Unit. This is a qualitative variable ranging between 0 and 10. It is
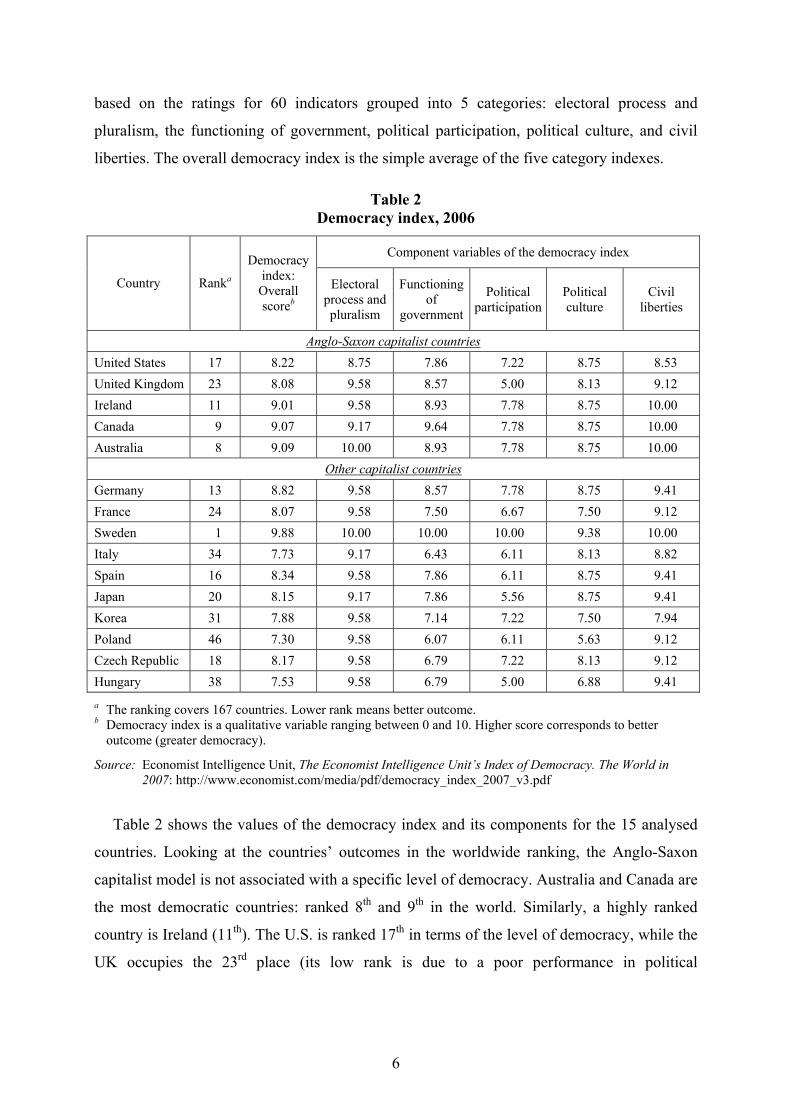
6
based on the ratings for 60 indicators grouped into 5 categories: electoral process and
pluralism, the functioning of government, political participation, political culture, and civil
liberties. The overall democracy index is the simple average of the five category indexes.
Table 2 Democracy index, 2006
Component variables of the democracy index
Country Ranka
Democracy index:
Overall scoreb
Electoral process and pluralism
Functioning of
government
Political participation
Political culture
Civil liberties
Anglo-Saxon capitalist countries United States 17 8.22 8.75 7.86 7.22 8.75 8.53 United Kingdom 23 8.08 9.58 8.57 5.00 8.13 9.12 Ireland 11 9.01 9.58 8.93 7.78 8.75 10.00 Canada 9 9.07 9.17 9.64 7.78 8.75 10.00 Australia 8 9.09 10.00 8.93 7.78 8.75 10.00
Other capitalist countries Germany 13 8.82 9.58 8.57 7.78 8.75 9.41 France 24 8.07 9.58 7.50 6.67 7.50 9.12 Sweden 1 9.88 10.00 10.00 10.00 9.38 10.00 Italy 34 7.73 9.17 6.43 6.11 8.13 8.82 Spain 16 8.34 9.58 7.86 6.11 8.75 9.41 Japan 20 8.15 9.17 7.86 5.56 8.75 9.41 Korea 31 7.88 9.58 7.14 7.22 7.50 7.94 Poland 46 7.30 9.58 6.07 6.11 5.63 9.12 Czech Republic 18 8.17 9.58 6.79 7.22 8.13 9.12 Hungary 38 7.53 9.58 6.79 5.00 6.88 9.41 a The ranking covers 167 countries. Lower rank means better outcome. b Democracy index is a qualitative variable ranging between 0 and 10. Higher score corresponds to better
outcome (greater democracy).
Source: Economist Intelligence Unit, The Economist Intelligence Unit’s Index of Democracy. The World in 2007: http://www.economist.com/media/pdf/democracy_index_2007_v3.pdf
Table 2 shows the values of the democracy index and its components for the 15 analysed
countries. Looking at the countries’ outcomes in the worldwide ranking, the Anglo-Saxon
capitalist model is not associated with a specific level of democracy. Australia and Canada are
the most democratic countries: ranked 8th and 9th in the world. Similarly, a highly ranked
country is Ireland (11th). The U.S. is ranked 17th in terms of the level of democracy, while the
UK occupies the 23rd place (its low rank is due to a poor performance in political
7
participation, which measures how citizens are willing to take part in public debate, elect
representatives, and join political parties).
The results for the other countries show, inter alia, that Sweden, representing the
Scandinavian model of capitalism, is ranked 1st in terms of the development of democracy,
while Spain and Italy, both Mediterranean capitalist economies, rank 16th and 34th
respectively.
According to the general assessments made by the Economist Intelligence Unit, 11 out of
15 countries are full democracies, while Korea, Italy, Hungary, and Poland are in the lower
group of flawed democracies.
Our analysis confirms that the type of capitalism is not correlated with the level of
democracy.
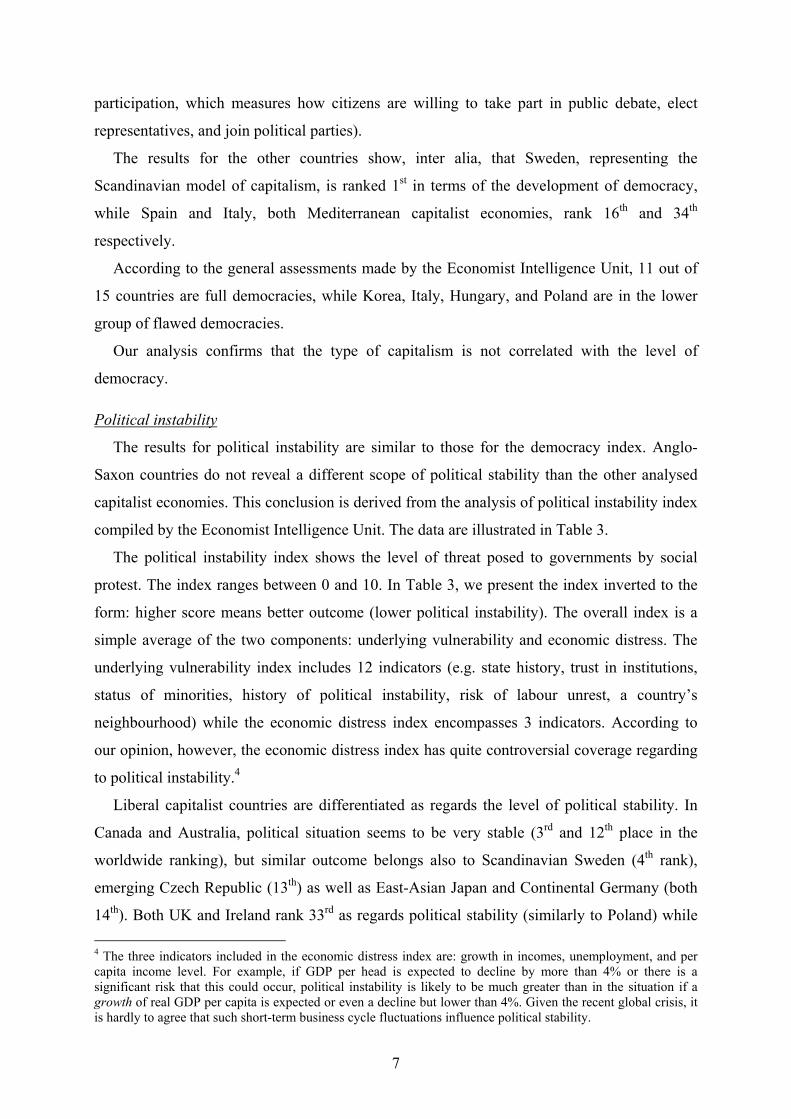
Political instability
The results for political instability are similar to those for the democracy index. Anglo-
Saxon countries do not reveal a different scope of political stability than the other analysed
capitalist economies. This conclusion is derived from the analysis of political instability index
compiled by the Economist Intelligence Unit. The data are illustrated in Table 3.
The political instability index shows the level of threat posed to governments by social
protest. The index ranges between 0 and 10. In Table 3, we present the index inverted to the
form: higher score means better outcome (lower political instability). The overall index is a
simple average of the two components: underlying vulnerability and economic distress. The
underlying vulnerability index includes 12 indicators (e.g. state history, trust in institutions,
status of minorities, history of political instability, risk of labour unrest, a country’s
neighbourhood) while the economic distress index encompasses 3 indicators. According to
our opinion, however, the economic distress index has quite controversial coverage regarding
to political instability.4
Liberal capitalist countries are differentiated as regards the level of political stability. In
Canada and Australia, political situation seems to be very stable (3rd and 12th place in the
worldwide ranking), but similar outcome belongs also to Scandinavian Sweden (4th rank),
emerging Czech Republic (13th) as well as East-Asian Japan and Continental Germany (both
14th). Both UK and Ireland rank 33rd as regards political stability (similarly to Poland) while 4 The three indicators included in the economic distress index are: growth in incomes, unemployment, and per capita income level. For example, if GDP per head is expected to decline by more than 4% or there is a significant risk that this could occur, political instability is likely to be much greater than in the situation if a growth of real GDP per capita is expected or even a decline but lower than 4%. Given the recent global crisis, it is hardly to agree that such short-term business cycle fluctuations influence political stability.
8
the U.S. ranks unexpectedly low (54th place, the same as Continental France). Given these
outcomes, we may conclude that the index is incorrectly measured or – that is more likely to
occur given the previous results for the level of democracy – that the type of the capitalist
system does not depend on the scope of political stability.
Table 3 Political instability index, 2009/10
Component variables of the political instability index
Country Ranka Political instability
index: Overall scoreb Underlying
vulnerability Economic distress
Anglo-Saxon capitalist countries United States 54 4.7 7.5 2.0 United Kingdom 33 5.4 8.7 2.0 Ireland 33 5.4 8.7 2.0 Canada 3 7.2 8.3 6.0 Australia 12 6.4 8.7 4.0
Other capitalist countries Germany 14 6.2 8.3 4.0 France 54 4.7 7.5 2.0 Sweden 4 6.8 9.6 4.0 Italy 45 5.0 7.9 2.0 Spain 62 4.5 7.1 2.0 Japan 14 6.2 8.3 4.0 Korea 46 4.9 5.8 4.0 Poland 30 5.5 7.1 4.0 Czech Republic 13 6.3 6.7 6.0 Hungary 80 3.9 5.8 2.0 a The ranking covers 165 countries. Lower rank means better outcome. b The original political instability index has been inverted to the form: higher score = better outcome (lower
political instability). The index is a qualitative variable ranging between 0 and 10.
Source: Economist Intelligence Unit: http://viewswire.eiu.com/site_info.asp?info_name=social_unrest _table&page=noads&rf=0
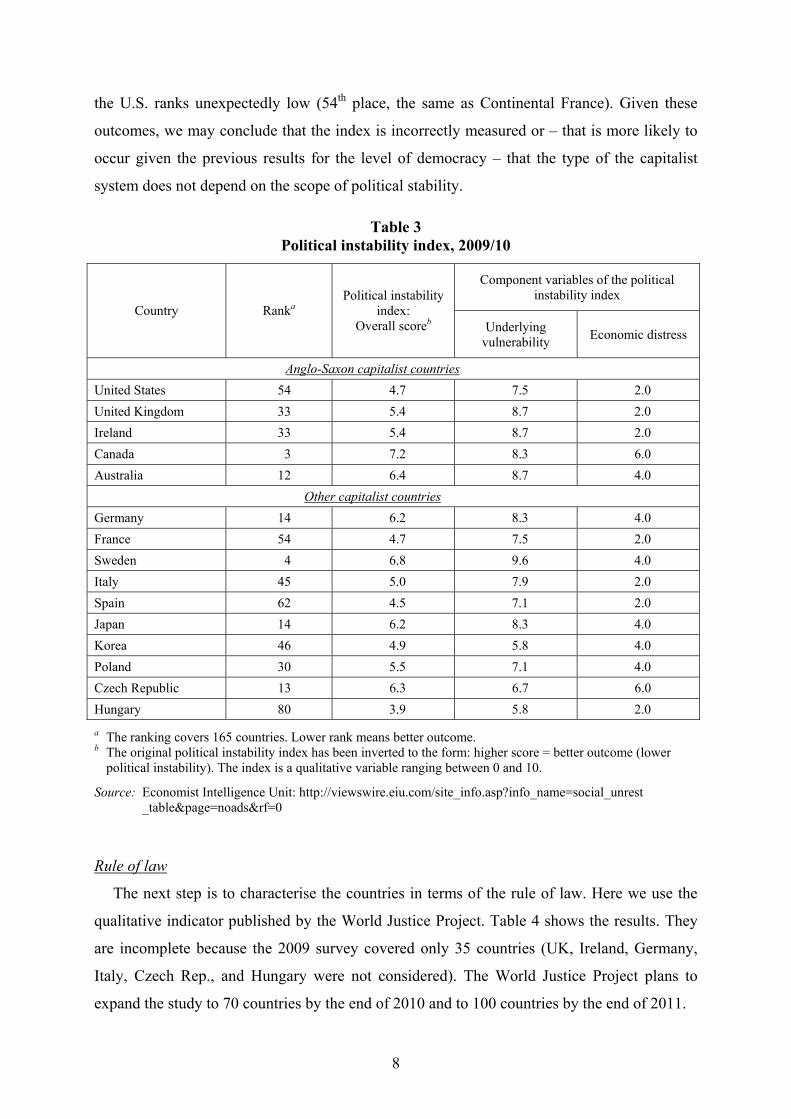
Rule of law
The next step is to characterise the countries in terms of the rule of law. Here we use the
qualitative indicator published by the World Justice Project. Table 4 shows the results. They
are incomplete because the 2009 survey covered only 35 countries (UK, Ireland, Germany,
Italy, Czech Rep., and Hungary were not considered). The World Justice Project plans to
expand the study to 70 countries by the end of 2010 and to 100 countries by the end of 2011.
9
Table 4 Rule of law index, 2009
Accountable government Publicized and stable laws that protect fundamental
rights
Accessible, fair, and efficient process
Access to justice
Country
Rule of law index: Over-
all scoreab
Gov
ernm
ent p
ower
s lim
ited
by
con
stitu
tion
Gov
ernm
enta
l
an
d no
n-go
vern
men
tal c
heck
s A
ccou
ntab
le g
over
nmen
t off
icia
ls
and
agen
ts
Acc
ount
able
mili
tary
, pol
ice,
an
d pr
ison
off
icia
ls
Com
plia
nce
with
inte
rnat
iona
l law
Law
s are
cle
ar, p
ublic
ized
and
stab
le
Law
s pro
tect
fund
amen
tal r
ight
s
Law
s pro
tect
secu
rity
of th
e pe
rson
Law
s pro
tect
secu
rity
of p
rope
rty
Acc
essi
ble
proc
ess
Fair
and
effic
ient
adm
inis
tratio
n
Impa
rtial
and
acc
ount
able
judi
cial
sy
stem
Ef
ficie
nt, a
cces
sibl
e an
d ef
fect
ive
judi
cial
syst
em
Com
pete
nt a
nd in
depe
nden
t at
torn
eys o
r rep
rese
ntat
ives
Fa
ir an
d ef
ficie
nt a
ltern
ativ
e di
sput
e re
solu
tion
Anglo-Saxon capitalist countries USA 0.69 0.73 0.60 0.73 0.64 0.39 0.69 0.75 0.84 0.87 0.72 0.72 0.71 0.61 0.64 0.64 UK n.a. Ireland n.a. Canada 0.76 0.74 0.72 0.71 0.62 0.62 0.77 0.83 0.87 0.84 0.75 0.81 0.83 0.65 0.75 0.84 Australia 0.74 0.81 0.69 0.80 0.66 0.41 0.79 0.81 0.86 0.81 0.72 0.72 0.82 0.67 0.76 0.77
Other capitalist countries Germany n.a. France 0.73 0.75 0.66 0.75 0.66 0.80 0.69 0.74 0.90 0.77 0.65 0.80 0.74 0.58 0.85 0.68 Sweden 0.83 0.78 0.89 0.82 0.71 0.74 0.81 0.89 0.86 0.94 0.86 0.77 0.85 0.82 0.86 0.86 Italy n.a. Spain 0.71 0.83 0.62 0.79 0.73 0.54 0.66 0.79 0.83 0.78 0.60 0.71 0.65 0.53 0.82 0.70 Japan 0.76 0.88 0.77 0.79 0.81 0.64 0.71 0.74 0.85 0.91 0.61 0.74 0.83 0.62 0.82 0.72 Korea 0.64 0.77 0.46 0.51 0.48 0.68 0.74 0.70 0.74 0.79 0.63 0.65 0.69 0.63 0.53 0.63 Poland 0.64 0.81 0.57 0.51 0.49 0.72 0.58 0.71 0.80 0.79 0.55 0.53 0.71 0.56 0.69 0.65 Czech Rep. n.a. Hungary n.a.
a The overall score has been calculated by the author as an arithmetic average of 15 component variables. b Rule of law index is a qualitative variable ranging between 0 and 1. Higher score corresponds to better
outcome. n.a. = not available.
Data for some countries are missing because there are only 35 countries under study.
Source: World Justice Project, The Rule of Law Index, World Justice Forum II, Nov. 11-14, 2009, Vienna: http://www.worldjusticeproject.org/rule-of-law-index/index-2009/Preliminary-Rule-of-Law-Index-2009-Report; own calculations.
The rule of law index is composed of 16 factors and 68 sub-factors, grouped into four
categories, relating to the following issues: (i) the government and its officials and agents are
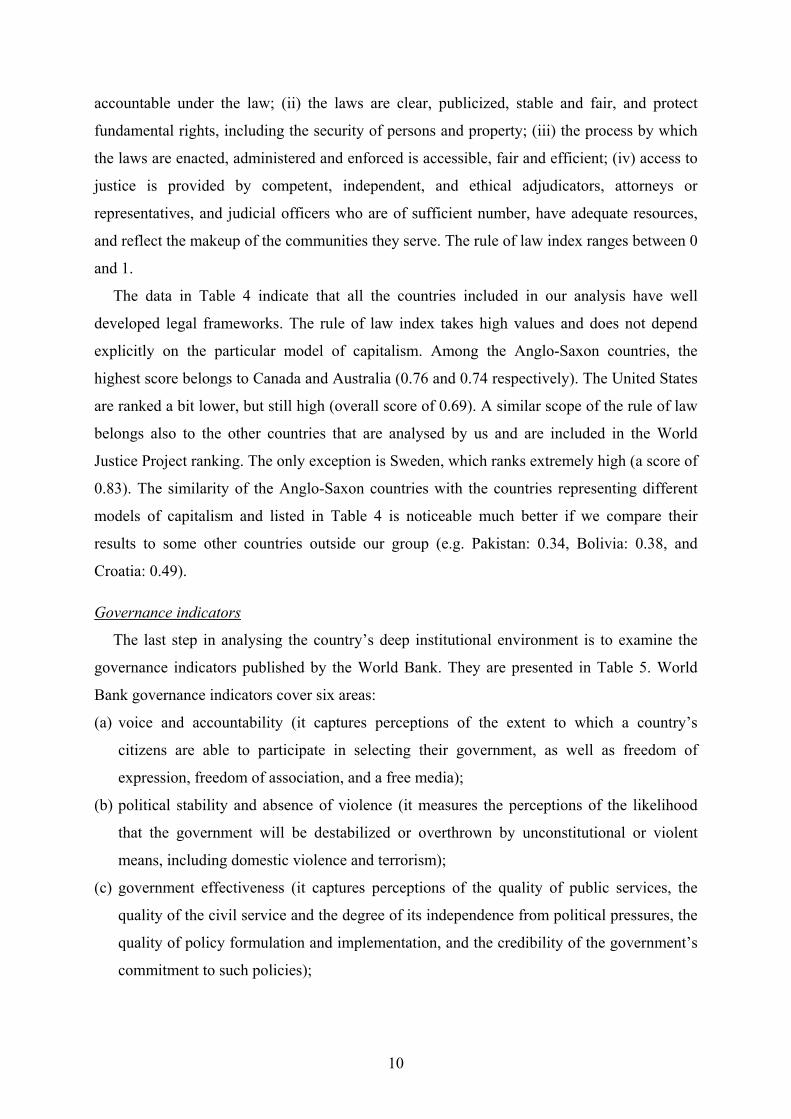
10
accountable under the law; (ii) the laws are clear, publicized, stable and fair, and protect
fundamental rights, including the security of persons and property; (iii) the process by which
the laws are enacted, administered and enforced is accessible, fair and efficient; (iv) access to
justice is provided by competent, independent, and ethical adjudicators, attorneys or
representatives, and judicial officers who are of sufficient number, have adequate resources,
and reflect the makeup of the communities they serve. The rule of law index ranges between 0
and 1.
The data in Table 4 indicate that all the countries included in our analysis have well
developed legal frameworks. The rule of law index takes high values and does not depend
explicitly on the particular model of capitalism. Among the Anglo-Saxon countries, the
highest score belongs to Canada and Australia (0.76 and 0.74 respectively). The United States
are ranked a bit lower, but still high (overall score of 0.69). A similar scope of the rule of law
belongs also to the other countries that are analysed by us and are included in the World
Justice Project ranking. The only exception is Sweden, which ranks extremely high (a score of
0.83). The similarity of the Anglo-Saxon countries with the countries representing different
models of capitalism and listed in Table 4 is noticeable much better if we compare their
results to some other countries outside our group (e.g. Pakistan: 0.34, Bolivia: 0.38, and
Croatia: 0.49).
Governance indicators
The last step in analysing the country’s deep institutional environment is to examine the
governance indicators published by the World Bank. They are presented in Table 5. World
Bank governance indicators cover six areas:
(a) voice and accountability (it captures perceptions of the extent to which a country’s
citizens are able to participate in selecting their government, as well as freedom of
expression, freedom of association, and a free media);
(b) political stability and absence of violence (it measures the perceptions of the likelihood
that the government will be destabilized or overthrown by unconstitutional or violent
means, including domestic violence and terrorism);
(c) government effectiveness (it captures perceptions of the quality of public services, the
quality of the civil service and the degree of its independence from political pressures, the
quality of policy formulation and implementation, and the credibility of the government’s
commitment to such policies);
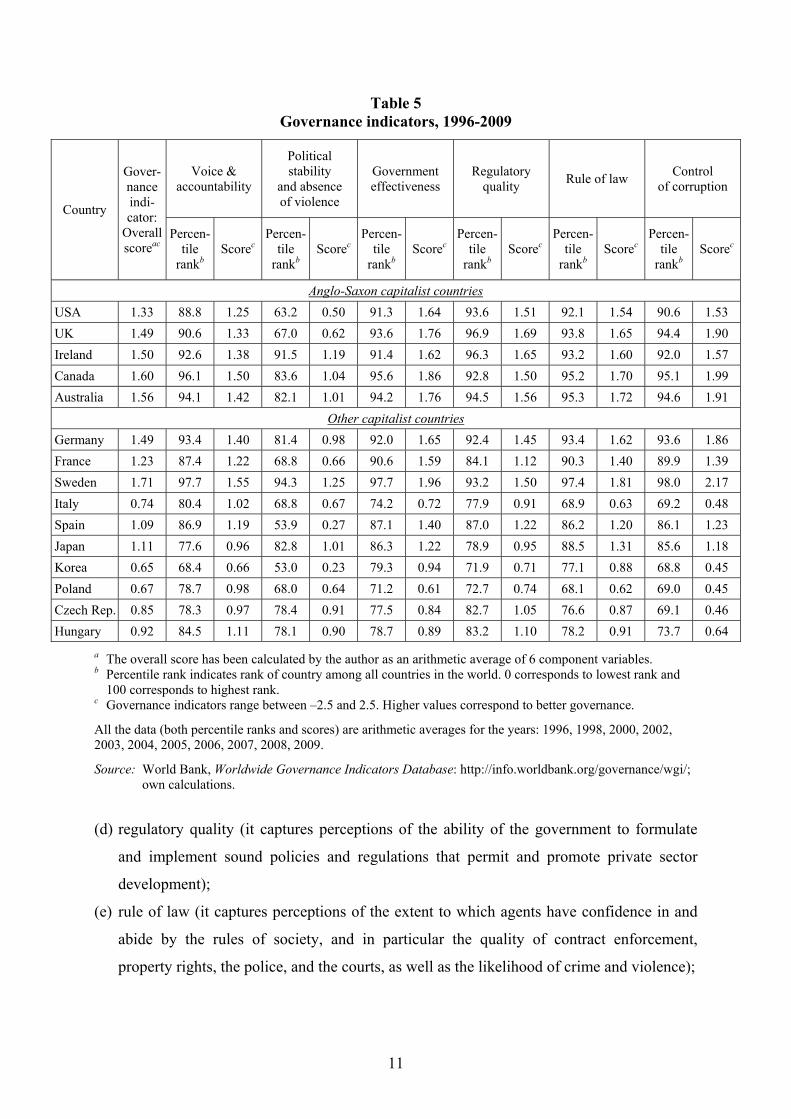
11
Table 5 Governance indicators, 1996-2009
Voice & accountability
Political stability
and absence of violence
Government effectiveness
Regulatory quality Rule of law Control
of corruption
Country
Gover-nance indi-cator:
Overall scoreac
Percen-tile
rankb Scorec
Percen-tile
rankb Scorec
Percen-tile
rankb Scorec
Percen-tile
rankb Scorec
Percen-tile
rankb Scorec
Percen-tile
rankb Scorec
Anglo-Saxon capitalist countries USA 1.33 88.8 1.25 63.2 0.50 91.3 1.64 93.6 1.51 92.1 1.54 90.6 1.53 UK 1.49 90.6 1.33 67.0 0.62 93.6 1.76 96.9 1.69 93.8 1.65 94.4 1.90 Ireland 1.50 92.6 1.38 91.5 1.19 91.4 1.62 96.3 1.65 93.2 1.60 92.0 1.57 Canada 1.60 96.1 1.50 83.6 1.04 95.6 1.86 92.8 1.50 95.2 1.70 95.1 1.99 Australia 1.56 94.1 1.42 82.1 1.01 94.2 1.76 94.5 1.56 95.3 1.72 94.6 1.91
Other capitalist countries Germany 1.49 93.4 1.40 81.4 0.98 92.0 1.65 92.4 1.45 93.4 1.62 93.6 1.86 France 1.23 87.4 1.22 68.8 0.66 90.6 1.59 84.1 1.12 90.3 1.40 89.9 1.39 Sweden 1.71 97.7 1.55 94.3 1.25 97.7 1.96 93.2 1.50 97.4 1.81 98.0 2.17 Italy 0.74 80.4 1.02 68.8 0.67 74.2 0.72 77.9 0.91 68.9 0.63 69.2 0.48 Spain 1.09 86.9 1.19 53.9 0.27 87.1 1.40 87.0 1.22 86.2 1.20 86.1 1.23 Japan 1.11 77.6 0.96 82.8 1.01 86.3 1.22 78.9 0.95 88.5 1.31 85.6 1.18 Korea 0.65 68.4 0.66 53.0 0.23 79.3 0.94 71.9 0.71 77.1 0.88 68.8 0.45 Poland 0.67 78.7 0.98 68.0 0.64 71.2 0.61 72.7 0.74 68.1 0.62 69.0 0.45 Czech Rep. 0.85 78.3 0.97 78.4 0.91 77.5 0.84 82.7 1.05 76.6 0.87 69.1 0.46 Hungary 0.92 84.5 1.11 78.1 0.90 78.7 0.89 83.2 1.10 78.2 0.91 73.7 0.64
a The overall score has been calculated by the author as an arithmetic average of 6 component variables. b Percentile rank indicates rank of country among all countries in the world. 0 corresponds to lowest rank and
100 corresponds to highest rank. c Governance indicators range between –2.5 and 2.5. Higher values correspond to better governance.
All the data (both percentile ranks and scores) are arithmetic averages for the years: 1996, 1998, 2000, 2002, 2003, 2004, 2005, 2006, 2007, 2008, 2009.
Source: World Bank, Worldwide Governance Indicators Database: http://info.worldbank.org/governance/wgi/; own calculations.
(d) regulatory quality (it captures perceptions of the ability of the government to formulate
and implement sound policies and regulations that permit and promote private sector
development);
(e) rule of law (it captures perceptions of the extent to which agents have confidence in and
abide by the rules of society, and in particular the quality of contract enforcement,
property rights, the police, and the courts, as well as the likelihood of crime and violence);
12
(f) control of corruption (it captures perceptions of the extent to which public power is
exercised for private gain, including both petty and grand forms of corruption, as well as
capture of the state by elites and private interests).
The indicators range between –2.5 and +2.5. The overall score has been calculated by us as
the simple average of the respective indices.
Looking at the methodology, we see that governance indicators have similar coverage to
earlier indices, so the main implications should be the same. They really are at the first view,
indicating a non-existence of an evident difference between Anglo-Saxon countries and the
other capitalist economies. As Table 5 illustrates, although the individual indices are quite
differentiated, the overall indicator for the Anglo-Saxon countries is mixed and ranges
between 1.33 and 1.60. The poorest outcome belongs to the U.S.; UK and Ireland are in the
middle; whereas Australia and Canada are the best performers.
However, analysing in detail the values of the overall indicator for the other countries we
see that only Germany ranks similarly to the Anglo-Saxon UK (1.49). Sweden is significantly
better (1.71) while the remaining capitalist economies rank significantly poorer than liberal
ones (France – 1.23; Japan and Spain – 1.11 and 1.09 respectively; Italy, Korea and the CEE
countries – below 1.00). As we can see, here the similarities are not so clear as in the case of
the previous indicators, presented in earlier tables.
How to comment these differences?
Let us analyse the performance of Anglo-Saxon economies in terms of the individual
component indices. We see that the Anglo-Saxon economies perform relatively poorly in
terms of political stability and absence of violence. As regards the other categories, the results
are generally good and percentile ranks are greater than 90 (with one exception).
The most interesting results, however, concern the category: regulatory quality. They point
to an evident difference between Anglo-Saxon capitalist countries and the other reference
economies. Varying scope of regulatory quality explains to some extent the individuality of
the model of liberal capitalism. As it turns out later, this tentative finding is in line with the
findings obtained in the next steps of the analysis.
Regulatory quality is an indicator that covers the quality of government policy and the
degree of regulation for private sector development. It may be treated as a proxy for economic
freedom and the freedom of doing business (i.e. the variables analysed later in the text). If we
look at the World Bank methodology, regulatory quality indicator includes such concepts as:
export and import regulation, nonresident business and equity ownership restrictions, price
controls, discriminatory tariffs and taxes, excessive protections, distortions of tax system,
13
import barriers, limitation of competition in local markets, whether environmental regulations
hurt competitiveness, ease of both starting a business and market entry for new firms. These
are the most important factors determining the scope of economic freedom. Such factors have
not been included in earlier indices.
The above definition explains why all the capitalist countries have been similarly ranked in
the case of earlier indices whereas the current results are not so similar. This arises due to the
fact that regulatory quality indicator encompasses issues related to private sector
development. Such issues were not been included in earlier indices. (For example, the
democracy index compiled by the Economist Intelligence Unit includes ‘functioning of
government’, but that indicator does not encompass any question about economic role of the
state, such as tax policy).
Table 5 clearly shows that in the case of a regulatory quality indicator (which represents
economic freedom), Anglo-Saxon countries record – in general – a better performance than
the other analysed economies. UK and Ireland, that seem to have the best regulatory quality
for private sector development, notice percentile ranks of 96.9 and 96.3 respectively.
Australia ranks 94.5, the U.S. – 93.6, and Canada – 92.8. These are very good results. Among
the other analysed capitalist countries, the outcome comparable to that of the poorest Anglo-
Saxon performers belongs only to Sweden (93.2). The remaining countries are much less
friendly in terms of regulatory quality (Germany ranks 92.4, while the rest of the countries –
below 90.0).
According to our opinion, this is a key difference between the Anglo-Saxon model and the
other types of capitalism. Anglo-Saxon countries are much better in promoting private sector
development because they offer a wide scope of economic freedom to private investors.
The next point of the paper, which is devoted to the analysis of economic freedom and
doing business indicators, will confirm this preliminary finding.
3. Economic freedom and ease of doing business
In this section, we characterise the Anglo-Saxon capitalism in terms of opportunities for
private sector development. We take into account the index of economic freedom and doing
business indicators. The analysis is supplemented by the corruption perceptions index.
Index of economic freedom
Economic freedom is an essential component of the capitalist system. It gives a stimulus to
the development of private sector, being a very important determinant of a favourable
14
business climate and positively affecting the well-being of the society and economic
efficiency. According to one definition, economic freedom exists if:
(a) individuals control the results of their actions (including fruits of labour); they can decide
where to live and work; and may also own property and dispose of it;
(b) successes and failures of people depend on their individual behaviour and effort; state
institutions do not discriminate people on grounds of sex, race, origin, social group,
family connections, or any other non-content-related factors; decisions made by the
government are characterised by openness and transparency;
(c) decision-making process is disaggregated; the allocation of resources for production and
consumption is driven by free and open competition between agents, so that any
individual or firm may succeed.5
According to another definition, the following four issues constitute the basis of economic
freedom: (a) personal choice, (b) voluntary exchange coordinated by markets, (c) freedom to
enter and compete in markets, (d) protection of persons and their property from aggression by
others.6
The features of economic freedom vary between different capitalist countries. Some
systems are closer to the ideal model of economic freedom, while in the other types of
capitalism economic freedom is more restricted. In this part, we would like to check to what
extent the Anglo-Saxon capitalist countries share features of economically free societies.
Economic freedom cannot be described by a simple quantitative variable. On the one hand,
comparison of the scope of economic freedom for different countries can be made in a
descriptive way. On the other hand, to assess economic freedom we may use qualitative
indicators published by specialised international organisations. In the paper we follow the
latter way. The most popular and well-known indices of economic freedom are compiled by:
• Heritage Foundation,
• Fraser Institute.
In this analysis, we use both of these qualitative indicators.
1. Heritage Foundation index of economic freedom
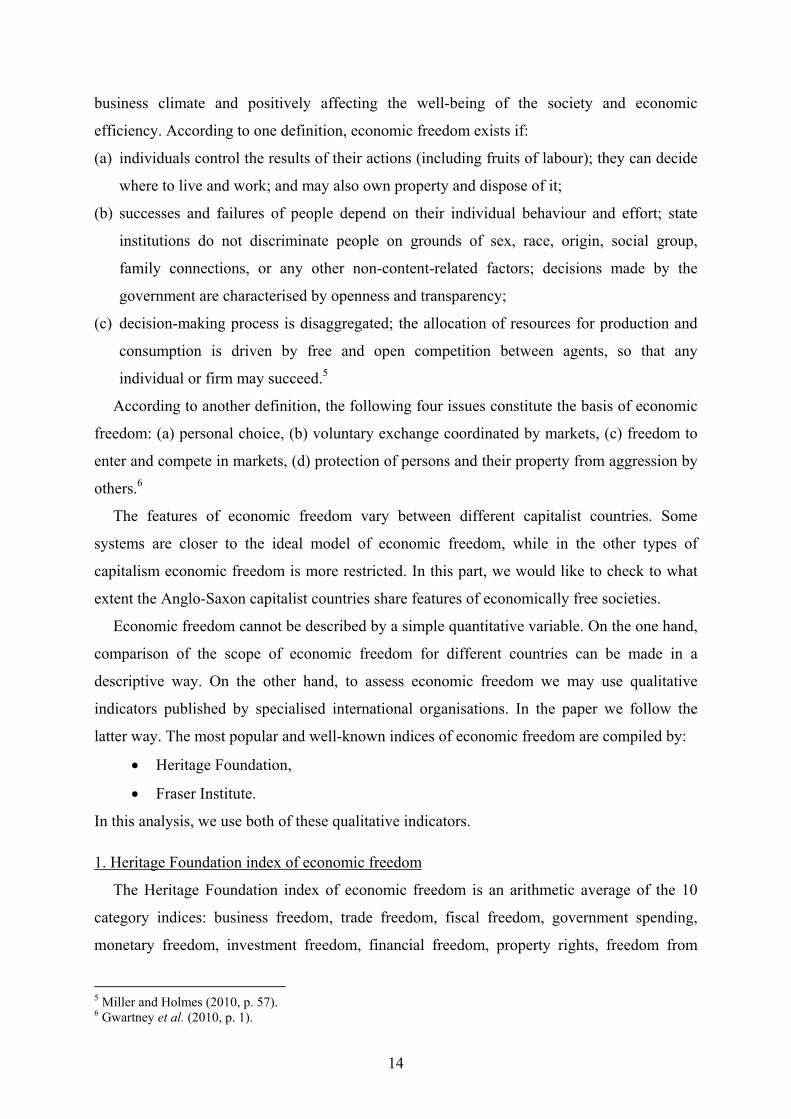
The Heritage Foundation index of economic freedom is an arithmetic average of the 10
category indices: business freedom, trade freedom, fiscal freedom, government spending,
monetary freedom, investment freedom, financial freedom, property rights, freedom from
5 Miller and Holmes (2010, p. 57). 6 Gwartney et al. (2010, p. 1).
15
corruption, and labour freedom. All the indicators range between 0 and 100. Higher value is
the desirable outcome because it represents a greater scope of economic freedom.
Table 6 Heritage Foundation index of economic freedom, 1995-2010
Component variables of the Heritage Foundation index of economic freedom
Country Ranka
Index of econo-
mic freedom: Overall scoreb
Business freedom
Trade freedom
Fiscal freedom
Govern-ment
spending
Mone-tary
freedom
Invest-ment
freedom
Financial freedom
Property rights
Freedom from
corrup-tion
Labour freedom
Anglo-Saxon capitalist countries USA 6 78.3 87.2 81.4 65.9 61.7 84.3 72.2 79.4 89.7 77.2 95.5 UK 7 77.9 88.0 80.9 61.7 44.5 83.6 77.5 89.4 89.7 86.1 78.3 Ireland 8 78.0 87.5 80.9 63.4 58.9 84.2 82.8 81.9 90.0 73.5 79.7 Canada 15 74.0 88.7 81.2 62.4 42.4 84.7 54.7 71.9 90.0 88.7 82.5 Australia 7 78.2 80.1 79.5 58.3 60.1 84.9 71.9 90.0 90.0 84.7 91.8
Other capitalist countries Germany 29 68.9 76.1 80.9 49.7 31.4 85.1 80.9 55.6 90.0 80.4 44.5 France 69 60.9 80.1 79.6 45.4 13.0 82.3 53.8 54.4 70.6 71.7 55.4 Sweden 36 67.6 78.0 80.9 35.4 2.6 86.1 79.1 74.4 82.8 92.1 61.8 Italy 62 62.1 73.4 79.9 48.6 22.6 82.7 70.3 63.8 64.1 51.3 69.6 Spain 40 66.5 72.3 80.9 51.6 47.6 79.9 71.3 70.0 70.0 62.1 49.0 Japan 23 70.6 82.0 80.8 64.4 59.8 90.7 53.8 48.8 79.4 71.5 83.4 Korea 28 69.4 75.4 69.6 70.1 81.2 81.4 66.3 57.5 80.0 48.7 53.5 Poland 74 59.5 65.7 74.3 61.7 37.1 70.2 61.9 58.1 60.3 46.0 60.9 Czech Rep. 33 68.0 77.1 78.4 64.2 40.5 79.4 70.0 87.5 69.7 46.5 64.6 Hungary 59 62.4 72.2 74.2 63.5 19.9 71.1 71.6 68.1 69.7 50.0 68.8
a The rankings include between 101 and 179 countries depending on the year. Lower rank means better
outcome. b The Heritage Foundation index of economic freedom is a qualitative variable ranging between 0 and 100.
Higher score corresponds to better outcome (greater freedom).
All the data (both ranks and scores) have been calculated by the author as arithmetic averages for individual years 1995-2010 (16 years). Labour freedom has been published since 2005.
Source: Heritage Foundation, 2010 Index of Economic Freedom: http://www.heritage.org/index/; own calculations.
Table 6 illustrates overall scores of the index of economic freedom (along with the
countries’ ranks) as well as the component variables. All the figures shown in Table 6 are
very representative because they are averages of the respective indicators over the long period
1995-2010 (16 years). Since the index of economic freedom presented in Table 6 is the
average for 16 consecutive years, it needn’t be exactly equal to the arithmetic average of the
16
component variables (which are also averages for 16 years). Similarly, the countries’ ranks
are the average ranks for 16 years and, therefore, some ranks may double (e.g. 7th).
Because of the importance of the variables presented in Table 6 and very interesting
results, we first characterise the countries in terms of aggregate index of economic freedom,
and then we discuss its component variables.
Countries representing the Anglo-Saxon model of capitalism are characterised by a very
large degree of economic freedom. Such a great scope of economic freedom is not achieved
by any other countries included in the analysis. The most economically free country is the
United States. The index of economic freedom scores 78.3 giving the U.S. the 6th rank in the
world. Over the last 16 years, the scope of economic freedom has been also large in Australia,
UK, and Ireland (the index of 78 with worldwide ranks about 7-8). Canada performs slightly
poorer with the index of 74.0 giving the 15th rank in the world. Hence, we may conclude that
a wide scope of economic freedom is a fundamental element of the Anglo-Saxon model of
capitalism. The other countries listed in Table 6 achieve worse results, even if we compare
them to the poorest Anglo-Saxon performer – Canada. For Japan, the index of economic
freedom over the past 16 years has been equal to 70.6 on average, which yields the 23rd
worldwide rank. For the other countries, this score was lower than 70, placing the countries at
the following ranks: Korea (28th), Germany (29th), Czech Republic (33rd), Sweden (36th),
Spain (40th), Italy (62nd), France (69th), Hungary (59th), and Poland (74th). Given that all these
values are long-run averages for 16 years, such outcomes cannot be a coincidence. They are
stable and represent a certain regularity.
We have just reached a very important conclusion arising from our study. The Anglo-
Saxon capitalism is characterised by significantly higher levels of economic freedom than any
other model of capitalism. It is worth to recall that this finding has already been exposed in
the preceding section of the paper. There, it became apparent that Anglo-Saxon countries have
the institutional environment conducive to greater development of the private sector as
compared with the other countries.
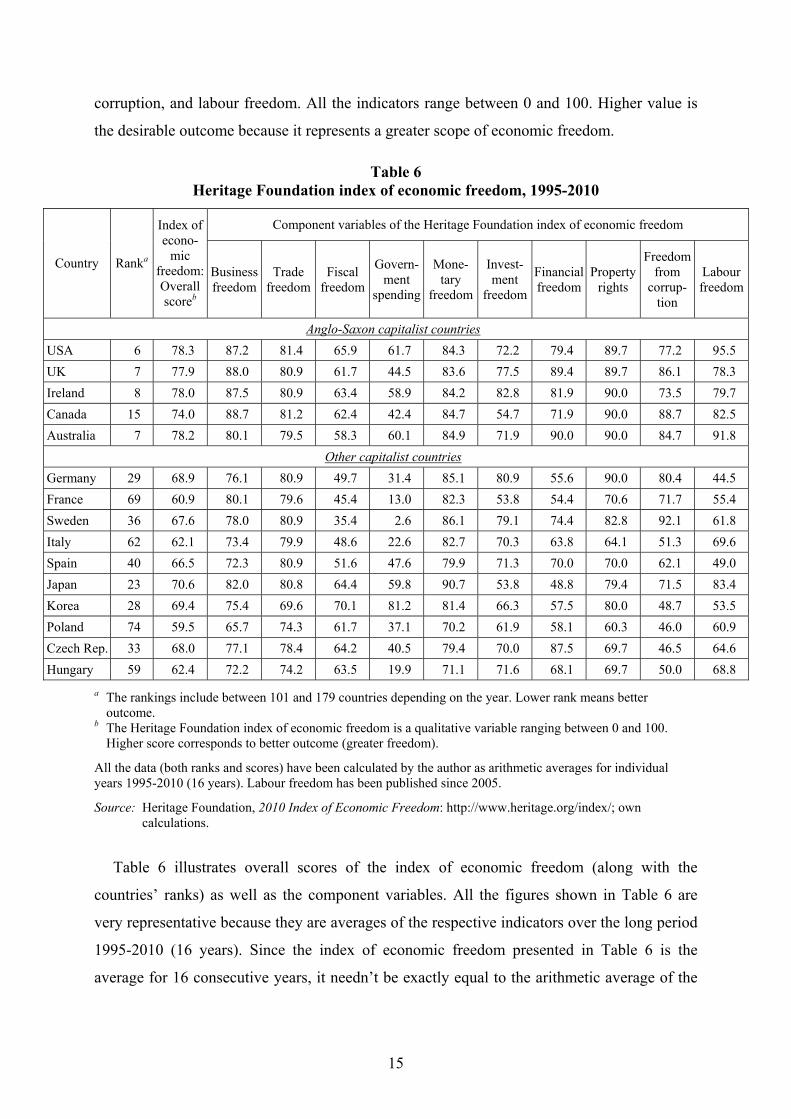
Let us now present the results for the component variables of the Heritage Foundation
index of economic freedom.
Business freedom describes individual’s rights to establish and run an enterprise without
interference from the state. It is based on the qualitative World Bank Doing Business
indicators related to e.g. time, cost and procedures to start or close a business, or obtain a
license. The Anglo-Saxon capitalist countries perform extraordinarily well in this area.
Canada, UK, Ireland, and USA achieve the best results in terms of business freedom (the
17
scores of 87-89).7 None of the other countries under study achieves such good outcomes in
this regard (the best non-Anglo-Saxon performer, namely Japan, scores 82).
Trade freedom reflects the openness of an economy to imports and the ability of citizens to
act freely as buyers and sellers in the international market. The index includes the trade-
weighted average tariff rate and non-tariff barriers. As regards trade freedom, Anglo-Saxon
capitalist countries achieve similar results as compared with the other analysed economies
(only Korea and the CEE countries rank lower).
Anglo-Saxon countries perform very well in terms of fiscal freedom. Fiscal freedom is a
direct measure of the extent to which individuals and firms are permitted by government to
keep and control their income and wealth for their own benefit and use. This indicator
encompasses three sub-indices: the top PIT rate, the top CIT rate, and total tax revenue (as %
of GDP). In this regard, Anglo-Saxon capitalist countries achieve extremely good results if
compared with the Continental, Scandinavian, and Mediterranean models. But comparing
them with the East-Asian countries and emerging market economies, it turns out that the
outcomes are quite similar.
The index of government spending (as % of GDP) assumes that zero-government spending
reflects the best outcome. This is quite controversial and may artificially promote some
underdeveloped economies. However, the scale is nonlinear implying that the countries with a
very high level of government expenditure rank extremely low (e.g. if government spending
exceeds 30% of GDP, doubling spending yields four times less freedom). We may generally
assume that excessive government spending is not the desirable outcome because it hampers
private consumption or investment and discourages economic activity (although some
government spending, e.g. on R&D, infrastructure or human capital, should be treated as
investments that have positive effects). The best outcome (among all the analysed economies
except Korea) belongs to the United States. Australia and Ireland are also free in this regard,
while UK and Canada are assessed much lower.8
The scope of monetary freedom, which is based on the weighted average inflation rate for
the most recent 3 years as well as price controls, does not identify the type of a capitalist
model (the outcomes for liberal economies are not different than those for the other capitalist 7 For example, in many states of the U.S. the procedure for obtaining a business license can be as simple as mailing in a registration form with a minimal fee. In Hong Kong, which may also be considered as the Anglo-Saxon capitalist territory because of strong historical links with the British empire, obtaining a business license requires filling out a single form, and the process can be completed in a few hours (Miller and Holmes, 2010, p. 59). 8 An interesting case is Sweden. With a high level of government spending, it is treated as completely not a free country in this area. However, if we take into account the quality of fiscal policy as well, Sweden is surely not a bad performer.
18
countries). It is because all the analysed countries are characterised by a large scope of
monetary freedom, as reflected by a stable currency and market determined prices.
As regards investment freedom, Anglo-Saxon states rank generally better than the other
countries, although it is not so clear as in the case of some other indices. This indicator
measures a wide variety of restrictions on investments (related mainly to foreign investments).
Ireland has the best investment freedom among all the analysed economies. UK, USA, and
Australia rank lower and achieve worse results than Germany and Sweden.
The development of the banking sector (or, more widely, financial sector) constitutes the
basis for the development of liberal capitalism. This is reflected by the huge difference
between Anglo-Saxon capitalist countries and the other analysed economies in terms of the
financial freedom. The index of financial freedom measures the banking security and the
independence from government control. State ownership of banks and other financial
institutions such as insurers and capital markets reduces competition and generally lowers the
level of available services. In this regard, Anglo-Saxon countries perform extraordinarily
well. The highest financial freedom exists in Australia and UK (the score of 89-90) as well as
Ireland and USA (79-82). Only the Czech Republic achieves such a good outcome (88). The
remaining reference economies have financial sectors less free with the highest freedom
occurring in Sweden (the score of 74) and Spain (70). Referring to these results, we may say
that liberal capitalism is the banking-based capitalism.
Anglo-Saxon countries perform better than the examined reference economies in terms of
property rights. This component is an assessment of the ability of individuals to accumulate
private property, secured by clear laws that are fully enforced by the state. All the 5 Anglo-
Saxon economies achieve very good scores (at the level of 90). The same outcome belongs
only to Germany. The remaining reference countries achieve lower scores, mostly by about
10-20 points.
In terms of corruption, the Anglo-Saxon group does not clearly notice satisfactory results.
The indicator that measures the freedom from corruption is derived primarily from
Transparency International Corruption Perceptions Index and will be analysed separately (see
Table 9).
The last component of the index of economic freedom, i.e. labour freedom, is one of the
key elements that distinguish the Anglo-Saxon model from the other types of capitalism. This
index measures the degree to which the labour market can be treated as the competitive
market, free from any constraints, distortions, and regulations. The indicator is composed of
six factors: (a) ratio of minimum wage to the average value added per worker, (b) hindrance
19
to hiring additional workers, (c) rigidity of hours, (d) difficulty of firing redundant employees,
(e) legally mandated notice period, and (f) mandatory severance pay. The data indicate that
the U.S. have the mostly free labour market among all the analysed countries (the score of
96). Australia achieves similar results in this area (92). Canada, Ireland, and UK, i.e. the
remaining liberal capitalist countries, rank lower but also high (the scores of 83, 80, and 78
respectively). Among the reference economies, only Japan is ranked similarly to Canada (83).
The remaining countries have labour markets much more regulated, that is less free.
To wrap up the results obtained for the Heritage Foundation index of economic freedom,
we can conclude as follows. The Anglo-Saxon capitalist model is much more economically
free than the other types of capitalism. The major differences concern business freedom, fiscal
freedom, financial freedom, and labour freedom. Since our results cover 16 years, they are
representative and stable. They are not biased by business cycles and other temporary shocks.
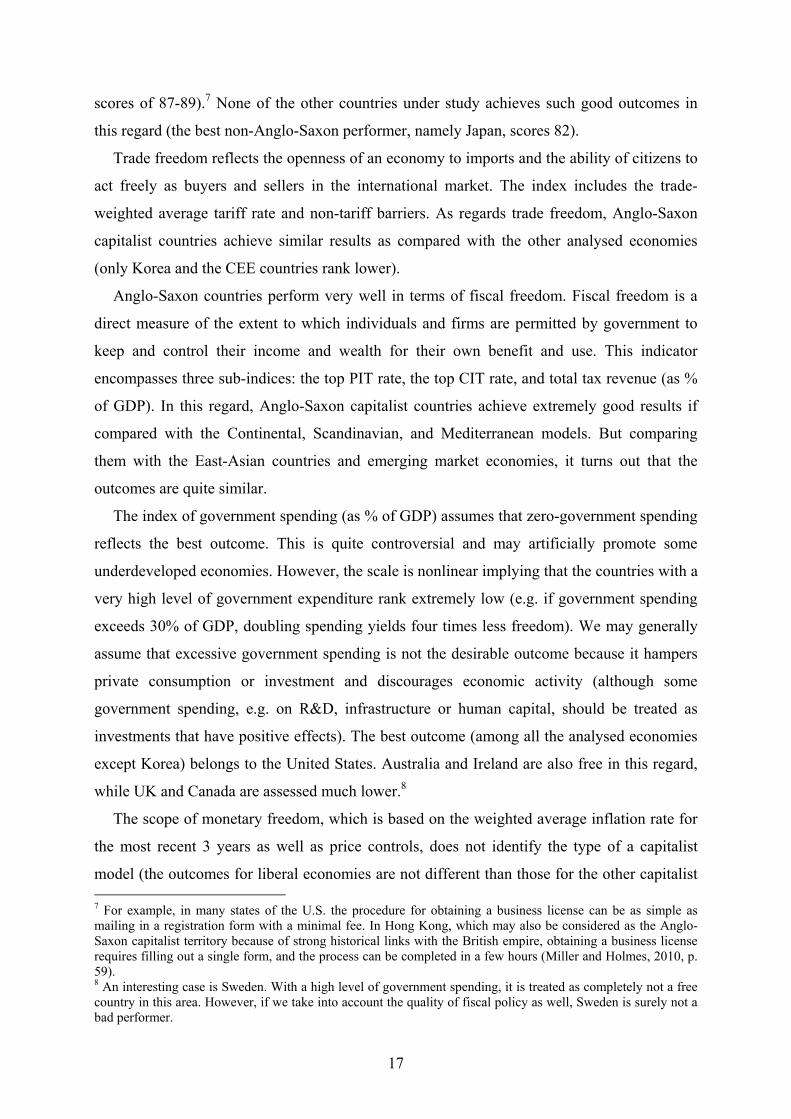
2. Fraser Institute index of economic freedom
Another index of economic freedom is compiled by the Fraser Institute. The Fraser
Institute index of economic freedom is a qualitative variable composed of 5 indicators: (a)
size of government, (b) legal structure and security of property rights, (c) access to sound
money, (d) freedom to trade internationally, (e) regulation of credit, labour and business. The
indicators are made up of several sub-components. In total, the index covers 42 distinct
variables. It ranges between 0 and 10 with higher outcome representing greater scope of
economic freedom.
If we look at the methodology in detail, it turns out that the indices of economic freedom
compiled by both institutions have generally similar coverage. However, certain differences
remain as regards sub-indicators used, the weights applied, the methodology of calculations,
data sources, and the areas covered. Thus, it is worth to examine both indices to have a better
view on the actual scope of economic freedom.
Table 7 presents the Fraser Institute index of economic freedom and its components. All
the data are very representative because they are averages for the years 1995 and 2000-2008
(10 years).9 Hence, the data reveal rather long-term tendencies and they are not biased by
untypical situations prevailing in some years.
The results shown in Table 7 confirm some important differences between the Anglo-
Saxon model and the other types of capitalism in line with our earlier findings.
9 The data for the period 1996-1999 are not available. Probably before 2000, the index was calculated every five years.
20
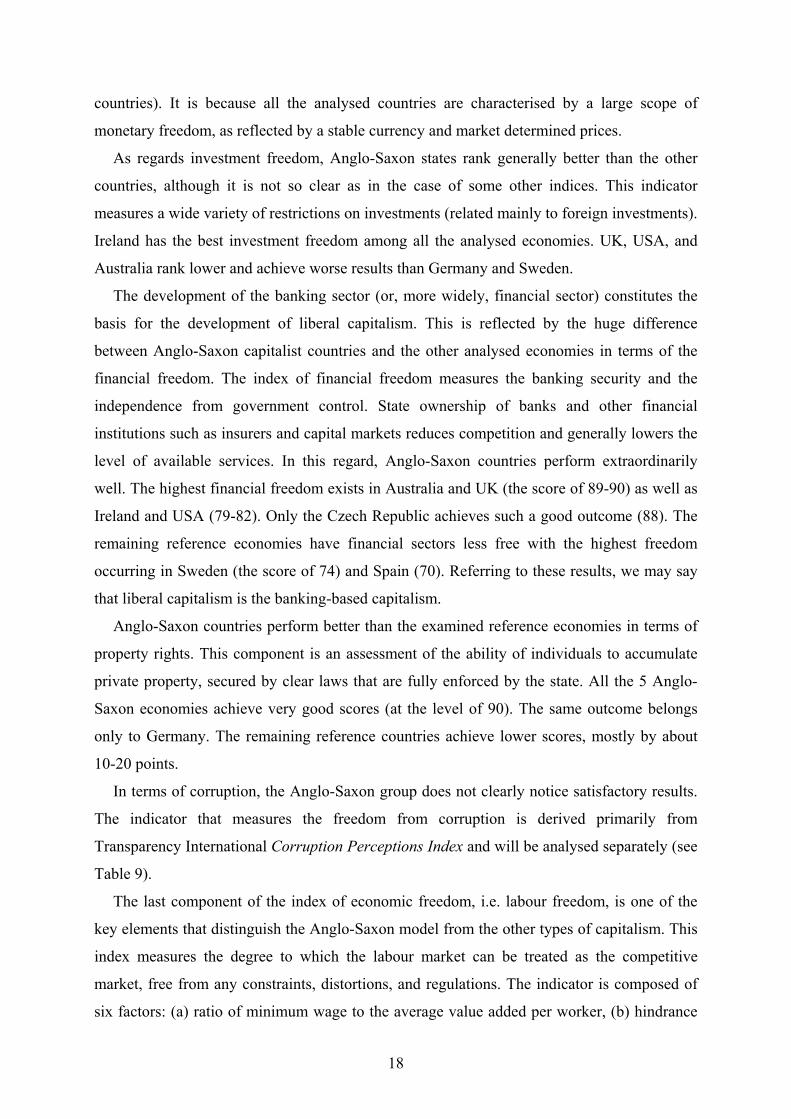
Table 7 Fraser Institute index of economic freedom, 1995-2008
Component variables of the Fraser Institute index of economic freedom
Country Ranka
Index of economic freedom: Overall scoreb
Size of government
Legal structure and security of property rights
Access to sound money
Freedom to trade
internationally
Regulation of credit, labour and business
Anglo-Saxon capitalist countries USA 5 8.17 7.11 8.08 9.75 7.68 8.23 UK 7 8.06 6.11 8.74 9.44 7.98 8.02 Ireland 8 8.01 5.90 8.32 9.58 8.61 7.64 Canada 7 8.04 6.51 8.58 9.45 7.58 8.08 Australia 10 7.85 6.11 8.85 9.38 7.02 7.91
Other capitalist countries Germany 19 7.53 5.05 8.73 9.56 8.17 6.13 France 40 7.06 3.82 7.49 9.61 7.62 6.77 Sweden 29 7.33 3.34 8.64 9.64 7.98 7.07 Italy 47 6.96 5.22 6.42 9.52 7.56 6.09 Spain 31 7.28 5.82 6.75 9.55 7.63 6.65 Japan 24 7.39 5.82 7.69 9.65 6.40 7.39 Korea 40 7.04 6.54 6.54 9.20 7.02 5.93 Poland 74 6.41 4.80 5.93 8.37 6.77 6.21 Czech Rep. 53 6.81 3.96 6.46 8.70 8.06 6.85 Hungary 38 7.09 5.10 6.74 8.69 8.03 6.89
a The rankings include between 123 and 141 countries depending on the year. Lower rank means better
outcome. b The Fraser Institute index of economic freedom is a qualitative variable ranging between 0 and 10. Higher
score corresponds to better outcome (greater freedom).
All the data (both ranks and scores) have been calculated by the author as arithmetic averages for the years 1995 and 2000-2008 (10 years).
Source: Fraser Institute, Economic Freedom of the World 2010: http://www.freetheworld.com/release.html; own calculations.
The Anglo-Saxon capitalist countries enjoy significantly greater scope of economic
freedom than the remaining analysed economies. The best performer is the United States, that
ranks 5th in the world on average during 1995-2008. UK, Canada, and Ireland also achieve
perfect scores, that rank them at 7th and 8th positions in the worldwide ranking. Australia is
slightly less economically free with the rank of 10. Such good results are not achieved by any
of our reference countries. Moreover, the gap between the worst Anglo-Saxon performer
(Australia) and the best non-Anglo-Saxon country (Germany) equals nine ranks. After
Germany, the next is Japan that occupies 24th place, Sweden – 29th, while the remaining
reference countries’ ranks exceed 30. These results confirm one of the most evident
21
distinctions between the Anglo-Saxon model and the other types of capitalism: a different
scope of economic freedom.
Let us discuss now the component variables of the Fraser Institute index of economic
freedom. For the sake of conciseness, we will focus on the outcomes for the U.S. and the
Anglo-Saxon group as a whole.
As regards the detailed coverage of the respective component indicators, size of
government includes the variables such as government consumption and investment, transfers
and subsidies, and top marginal tax rate. Legal framework encompasses e.g. judicial
independence, protection of property rights, and legal enforcement of contracts. Sound money
represents, inter alia, money growth, inflation, and freedom to own foreign currency bank
accounts. Freedom to trade internationally covers e.g. taxes on international trade, regulatory
trade barriers, black-market exchange rates, and international capital market controls. Finally,
regulation covers credit market regulations (e.g. ownership of banks, foreign bank
competition, private sector credit), labour market regulations (e.g. minimum wage, hiring and
firing regulations), and business regulations (e.g. price controls, administrative requirements,
starting a business, licensing restrictions).
The United States record the best results among all the 15 analysed economies in terms of
three indicators: size of government (the score of 7.11), sound money (9.75), and regulation
(8.23). As regards two of these areas: size of government and regulation, the advantage of the
American economy is very large. Moreover, comparing the Anglo-Saxon group as a whole
with the reference economies, it turns out that the Anglo-Saxon countries perform
considerably better than the reference economies in terms of size of government and
regulation. The gap is quite large confirming the reliability of the results. For example,
excluding Korea which is scored very high as regards size of government (6.54), the worst
Anglo-Saxon country, namely Ireland, achieves better score (5.90) than the best non-Anglo-
Saxon performers except Korea, that is Spain and Japan (which are both scored 5.82).
Regulation yields even clearer results: none of the reference economies is ranked better than
any Anglo-Saxon country. The poorest Ireland reports the score of 7.64 which is better than
that of Japan (7.39) and Sweden (7.07). The remaining reference countries are scored less
than 7.
As regards the remaining two indicators: legal structure and freedom to trade
internationally, we cannot find any clear and evident differences between both groups of
countries. Hence, these two areas do not uniquely identify the liberal capitalist system.
22
When we compare these results with the Heritage Foundation index of economic freedom,
it turns out that they are very similar. The United States (and the Anglo-Saxon group as a
whole) perform generally well in terms of size of government and regulation (referring to the
Fraser Institute classification) or business freedom, fiscal freedom and government spending,
financial freedom, and labour freedom (referring to the Heritage Foundation methodology).
These sub-indicators compiled by the two institutions have similar coverage. Size of
government corresponds to fiscal freedom and government spending, whereas regulation
corresponds to business freedom, financial freedom, and labour freedom. As regards these
areas, there is a considerable gap between the countries with liberal capitalist model and the
other types of capitalism. Such results surely are not random and reflect an important
difference between the economies concerned.
Summing up the results for both indices of economic freedom, we may conclude as
follows. Low size of government as well as regulations promoting business freedom, financial
(banking sector) freedom, and labour market freedom are key elements that distinguish the
Anglo-Saxon capitalist model from the other types of capitalism.
Ease of doing business
Here, we will compare the analysed countries in terms of business environment. We use
the World Bank Doing Business Database that includes many indicators measuring the
business climate. Some of these indicators have already been discussed because they are
included in the aggregated indices of economic freedom (e.g. the business freedom
component of the Heritage Foundation index of economic freedom is entirely based on the
World Bank doing business indicators).
Tables 8a and 8b show doing business indicators. All the figures have been calculated as
arithmetic averages for the period 2005-2009 (unless the data for some years are missing).
The second column in Table 8a presents the aggregated ease of doing business index. The
next columns in Table 8a and Table 8b show the component indicators that are included in the
Doing Business Database. In the text, we discuss the most important results.
The Anglo-Saxon climate is the most favourable for doing business. This is well
documented by the values of the aggregated doing business index. The United States rank 4th
worldwide. The remaining Anglo-Saxon countries place consecutively in the analysed group:
UK (6th), Ireland (7th), Canada (8th), and Australia (9th). As we can see, all the liberal capitalist
systems are in the top-ten in terms of ease of doing business. What about the other capitalist
countries? They rank much lower with Japan and Sweden placing in the next ten (14th and
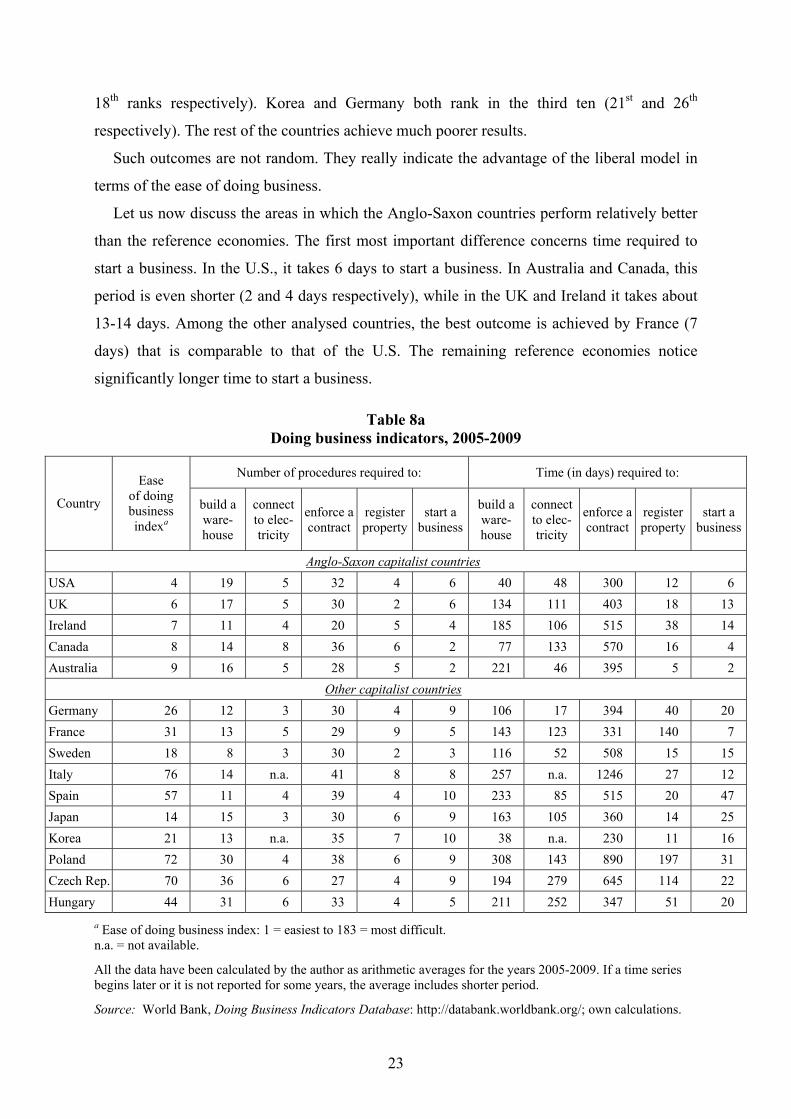
23
18th ranks respectively). Korea and Germany both rank in the third ten (21st and 26th
respectively). The rest of the countries achieve much poorer results.
Such outcomes are not random. They really indicate the advantage of the liberal model in
terms of the ease of doing business.
Let us now discuss the areas in which the Anglo-Saxon countries perform relatively better
than the reference economies. The first most important difference concerns time required to
start a business. In the U.S., it takes 6 days to start a business. In Australia and Canada, this
period is even shorter (2 and 4 days respectively), while in the UK and Ireland it takes about
13-14 days. Among the other analysed countries, the best outcome is achieved by France (7
days) that is comparable to that of the U.S. The remaining reference economies notice
significantly longer time to start a business.
Table 8a Doing business indicators, 2005-2009
Number of procedures required to: Time (in days) required to:
Country
Ease of doing business indexa
build a ware-house
connect to elec-tricity
enforce a contract
register property
start a business
build a ware-house
connect to elec-tricity
enforce a contract
register property
start a business
Anglo-Saxon capitalist countries USA 4 19 5 32 4 6 40 48 300 12 6 UK 6 17 5 30 2 6 134 111 403 18 13 Ireland 7 11 4 20 5 4 185 106 515 38 14 Canada 8 14 8 36 6 2 77 133 570 16 4 Australia 9 16 5 28 5 2 221 46 395 5 2
Other capitalist countries Germany 26 12 3 30 4 9 106 17 394 40 20 France 31 13 5 29 9 5 143 123 331 140 7 Sweden 18 8 3 30 2 3 116 52 508 15 15 Italy 76 14 n.a. 41 8 8 257 n.a. 1246 27 12 Spain 57 11 4 39 4 10 233 85 515 20 47 Japan 14 15 3 30 6 9 163 105 360 14 25 Korea 21 13 n.a. 35 7 10 38 n.a. 230 11 16 Poland 72 30 4 38 6 9 308 143 890 197 31 Czech Rep. 70 36 6 27 4 9 194 279 645 114 22 Hungary 44 31 6 33 4 5 211 252 347 51 20
a Ease of doing business index: 1 = easiest to 183 = most difficult. n.a. = not available.
All the data have been calculated by the author as arithmetic averages for the years 2005-2009. If a time series begins later or it is not reported for some years, the average includes shorter period.
Source: World Bank, Doing Business Indicators Database: http://databank.worldbank.org/; own calculations.
24
Table 8b Doing business indicators, 2005-2009
Taxes Foreign trade Credit
Country Total tax rate
(% of profit)
Tax payments (number)
Time to prepare and pay
taxes (hours)
Docu-ments
to export (number)
Docu-ments
to import (number)
Private credit bureau
coverage (% of
adults)a
Public credit
registry coverage
(% of adults)a
Strength of legal rights indexb
Depth of credit informa-
tion indexc
Rigidity of
employ-ment
indexd
Time to resolve insol-vency (years)
Anglo-Saxon capitalist countries USA 47 10 270 4 5 100 0 8 6 0 1.5 UK 36 8 106 4 4 89 0 9 6 6 1.0 Ireland 26 9 76 4 4 100 0 8 5 10 0.4 Canada 46 9 119 4 5 100 0 6 6 4 0.8 Australia 51 12 107 6 6 100 0 9 5 3 1.0
Other capitalist countries Germany 49 15 196 4 5 95 1 8 6 43 1.2 France 66 17 132 4 5 0 22 6 4 52 1.9 Sweden 55 2 122 4 3 100 0 5 4 34 2.0 Italy 74 15 350 4 4 70 10 3 5 38 1.8 Spain 61 8 268 6 8 8 45 6 5 49 1.0 Japan 54 13 345 4 5 70 0 7 6 14 0.6 Korea 33 14 274 4 6 83 0 7 5 31 1.5 Poland 42 40 409 5 5 49 0 8 4 24 3.0 Czech Rep. 49 15 842 5 7 56 4 7 5 12 7.6 Hungary 57 14 336 5 7 7 0 7 5 24 2.0
a The indicators report the coverage of individuals and firms by a private credit bureau / a public credit registry
with information on their repayment history, unpaid debts, or credit outstanding from the past 5 years (expressed as a percentage of the adult population). A private credit bureau is defined as a private firm or nonprofit organization that maintains a database on the creditworthiness of borrowers (persons or businesses) in the financial system and facilitates the exchange of credit information among banks and financial institutions. A public credit registry is defined as a database managed by the public sector, usually by the central bank or the superintendent of banks, which collects information on the creditworthiness of borrowers (persons or businesses) in the financial system and makes it available to financial institutions. If no private bureau / public registry operates, the coverage value is 0.
b Strength of legal rights index: 0 = weak to 10 = strong. c Depth of credit information index: 0 = low to 6 = high. d Rigidity of employment index: 0 = less rigid to 100 = more rigid.
All the data have been calculated by the author as arithmetic averages for the years 2005-2009. If a time series begins later or it is not reported for some years, the average includes shorter period.
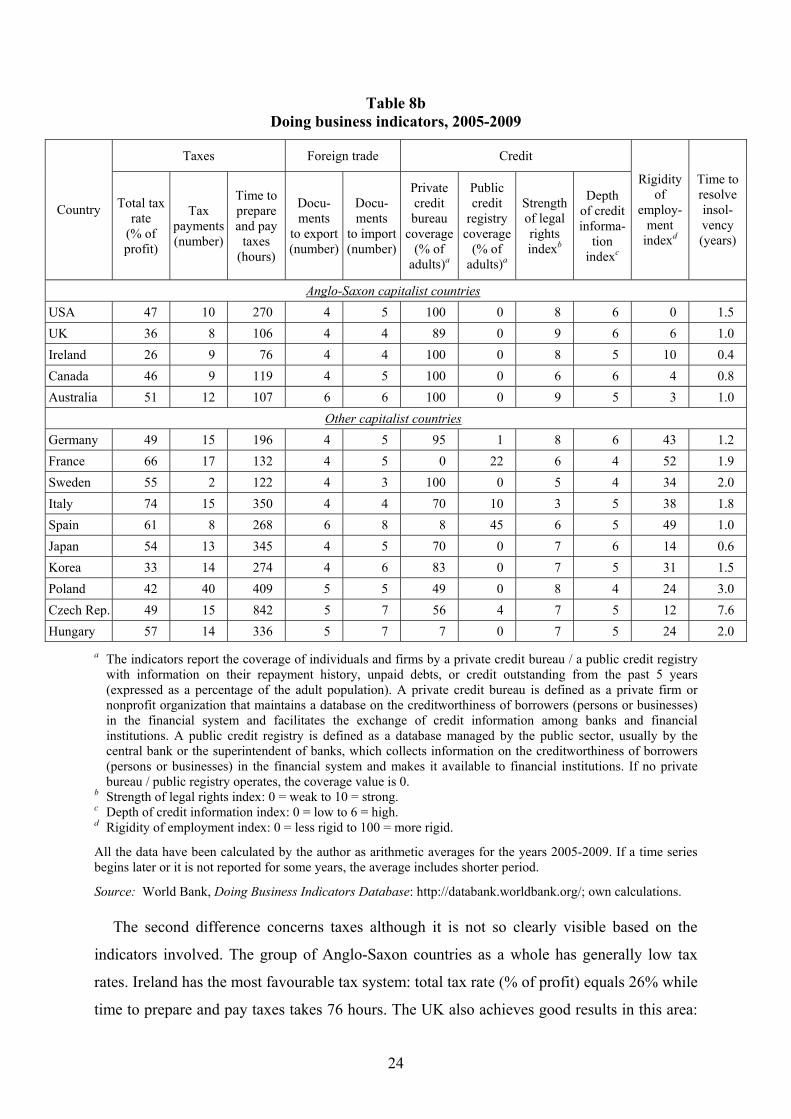
Source: World Bank, Doing Business Indicators Database: http://databank.worldbank.org/; own calculations.
The second difference concerns taxes although it is not so clearly visible based on the
indicators involved. The group of Anglo-Saxon countries as a whole has generally low tax
rates. Ireland has the most favourable tax system: total tax rate (% of profit) equals 26% while
time to prepare and pay taxes takes 76 hours. The UK also achieves good results in this area:
25
36% and 106 hours respectively.
The third clear difference is evidenced by the rigidity of employment index. All the Anglo-
Saxon countries have labour markets more elastic than the reference economies. The highest
labour market flexibility prevails in the United States that achieve the best score worldwide
(0). Australia, Canada, and UK also notice very low rigidity of employment (the scores equal
to 3, 4, and 6 respectively). Ireland ranks high as well, with the index equal to 10. Such good
outcomes are not achieved by the other capitalist countries. Among them, the best one is
Czech Republic (the score of 12), followed by Japan (14), and Poland and Hungary (both 24).
The rest of the economies have labour markets much more regulated. These results are in line
with our earlier results for the labour freedom component of the Heritage Foundation index.
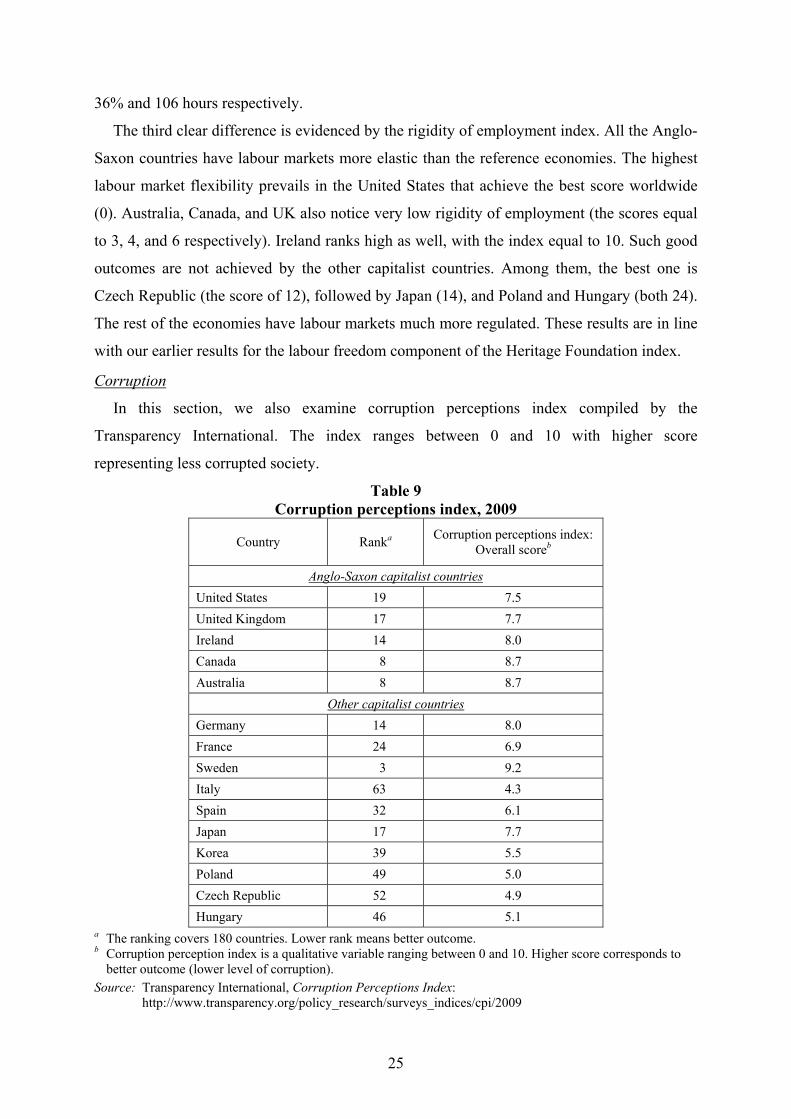
Corruption
In this section, we also examine corruption perceptions index compiled by the
Transparency International. The index ranges between 0 and 10 with higher score
representing less corrupted society.
Table 9 Corruption perceptions index, 2009
Country Ranka Corruption perceptions index: Overall scoreb
Anglo-Saxon capitalist countries United States 19 7.5 United Kingdom 17 7.7 Ireland 14 8.0 Canada 8 8.7 Australia 8 8.7
Other capitalist countries Germany 14 8.0 France 24 6.9 Sweden 3 9.2 Italy 63 4.3 Spain 32 6.1 Japan 17 7.7 Korea 39 5.5 Poland 49 5.0 Czech Republic 52 4.9 Hungary 46 5.1
a The ranking covers 180 countries. Lower rank means better outcome. b Corruption perception index is a qualitative variable ranging between 0 and 10. Higher score corresponds to
better outcome (lower level of corruption).
Source: Transparency International, Corruption Perceptions Index: http://www.transparency.org/policy_research/surveys_indices/cpi/2009
26
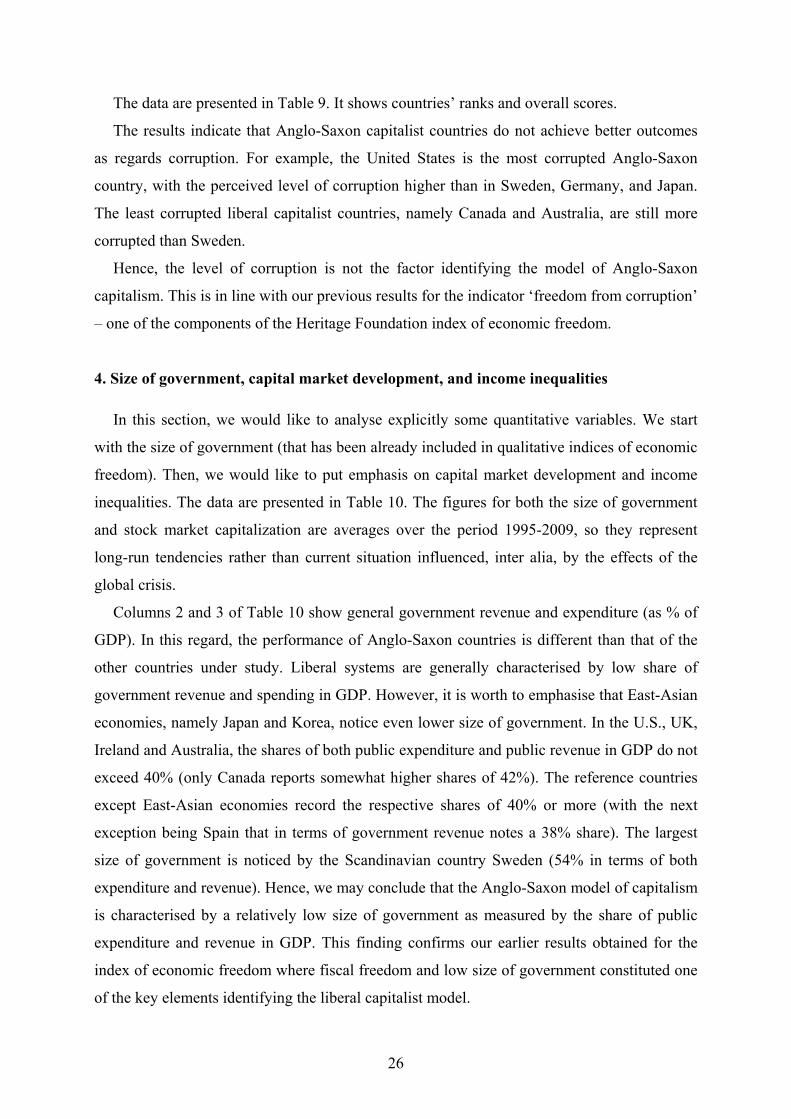
The data are presented in Table 9. It shows countries’ ranks and overall scores.
The results indicate that Anglo-Saxon capitalist countries do not achieve better outcomes
as regards corruption. For example, the United States is the most corrupted Anglo-Saxon
country, with the perceived level of corruption higher than in Sweden, Germany, and Japan.
The least corrupted liberal capitalist countries, namely Canada and Australia, are still more
corrupted than Sweden.
Hence, the level of corruption is not the factor identifying the model of Anglo-Saxon
capitalism. This is in line with our previous results for the indicator ‘freedom from corruption’
– one of the components of the Heritage Foundation index of economic freedom.
4. Size of government, capital market development, and income inequalities
In this section, we would like to analyse explicitly some quantitative variables. We start
with the size of government (that has been already included in qualitative indices of economic
freedom). Then, we would like to put emphasis on capital market development and income
inequalities. The data are presented in Table 10. The figures for both the size of government
and stock market capitalization are averages over the period 1995-2009, so they represent
long-run tendencies rather than current situation influenced, inter alia, by the effects of the
global crisis.
Columns 2 and 3 of Table 10 show general government revenue and expenditure (as % of
GDP). In this regard, the performance of Anglo-Saxon countries is different than that of the
other countries under study. Liberal systems are generally characterised by low share of
government revenue and spending in GDP. However, it is worth to emphasise that East-Asian
economies, namely Japan and Korea, notice even lower size of government. In the U.S., UK,
Ireland and Australia, the shares of both public expenditure and public revenue in GDP do not
exceed 40% (only Canada reports somewhat higher shares of 42%). The reference countries
except East-Asian economies record the respective shares of 40% or more (with the next
exception being Spain that in terms of government revenue notes a 38% share). The largest
size of government is noticed by the Scandinavian country Sweden (54% in terms of both
expenditure and revenue). Hence, we may conclude that the Anglo-Saxon model of capitalism
is characterised by a relatively low size of government as measured by the share of public
expenditure and revenue in GDP. This finding confirms our earlier results obtained for the
index of economic freedom where fiscal freedom and low size of government constituted one
of the key elements identifying the liberal capitalist model.
27
Table 10 The size of government, capital market development, and income inequalities
General government expenditure (% of GDP)
General government
revenue (% of GDP)
Stock market capitalization (% of GDP)
Gini index Country
Average 1995-2009 Average 1995-2009 Average 1995-2009 2000
Anglo-Saxon capitalist countries United States 37.0a 32.5a 130.2 40.8 United Kingdom 39.8 37.0 139.5 36.0b Ireland 35.6 35.2 55.5 34.3 Canada 41.9 41.7 104.2 32.6 Australia 34.3 34.7 103.4 n.a.
Other capitalist countries Germany 47.0 44.7 45.6 28.3 France 53.2 49.8 74.9 32.7c Sweden 53.9 54.2 105.0 25.0 Italy 49.0 45.5 40.5 36.0 Spain 40.5 38.3 75.2 34.7 Japan 35.7 29.8 75.5 n.a. Korea 19.5 21.5 57.1 31.6d Poland 44.4 40.0 20.6 34.9e Czech Republic 44.7 40.0 25.3 25.8f Hungary 48.6 43.5 24.1 30.0g a 2001-2009. b 1999. c 1995. d 1998. e 2005. f 1996. g 2004. n.a. = not available.
General government data according to the IMF. Stock market capitalization and Gini index according to the World Bank.
Source: IMF, World Economic Outlook Database, October 2010: http://www.imf.org/external/pubs/ft/weo/ 2010/02/weodata/index.aspx; World Bank, World Development Indicators Database: http://databank. worldbank.org/; own calculations.
The next quantitative variable, stock market capitalization (% of GDP), also points to a
difference between the Anglo-Saxon model and the other types of capitalism. In general,
Anglo-Saxon countries have capital markets well developed as evidenced by high levels of
stock market capitalization. Except Ireland that reports extremely low level of stock market
capitalization (56% of GDP), in the remaining Anglo-Saxon countries this share exceeds
100% being the highest one in the U.S. (130%) and the UK (140%). Among the reference
economies, only Sweden exceeds 100% in this area whereas the rest of the countries notice
the market capitalization of less than 80%. This observation maintains our previous findings.
When analysing the index of economic freedom we concluded that countries with the liberal
28
capitalist system have banking sectors (or, more widely, financial sectors) well developed.
Now, we may add and confirm, referring to quantitative data, that Anglo-Saxon capitalist
countries have capital markets well developed.
The last indicator included in Table 10 is the Gini index. It measures income inequalities.
Gini index ranges between 0 and 100 with greater values indicating higher income
inequalities. We may expect that the Anglo-Saxon countries, which exhibit a liberal type of
capitalism, should record higher income inequalities. The more so that they notice
considerably lower size of government. Our expectations turn out to be correct. As Table 10
indicates, the highest level of income inequalities exists in the U.S. (Gini index of 40.8)
followed by the UK (36.0) and Ireland (34.3). Among the reference countries, the greatest
inequalities – at the level comparable to that in the UK – exist in Italy (36.0). The country
with the most proportional division of income is Sweden for which the Gini index equals only
25.0.
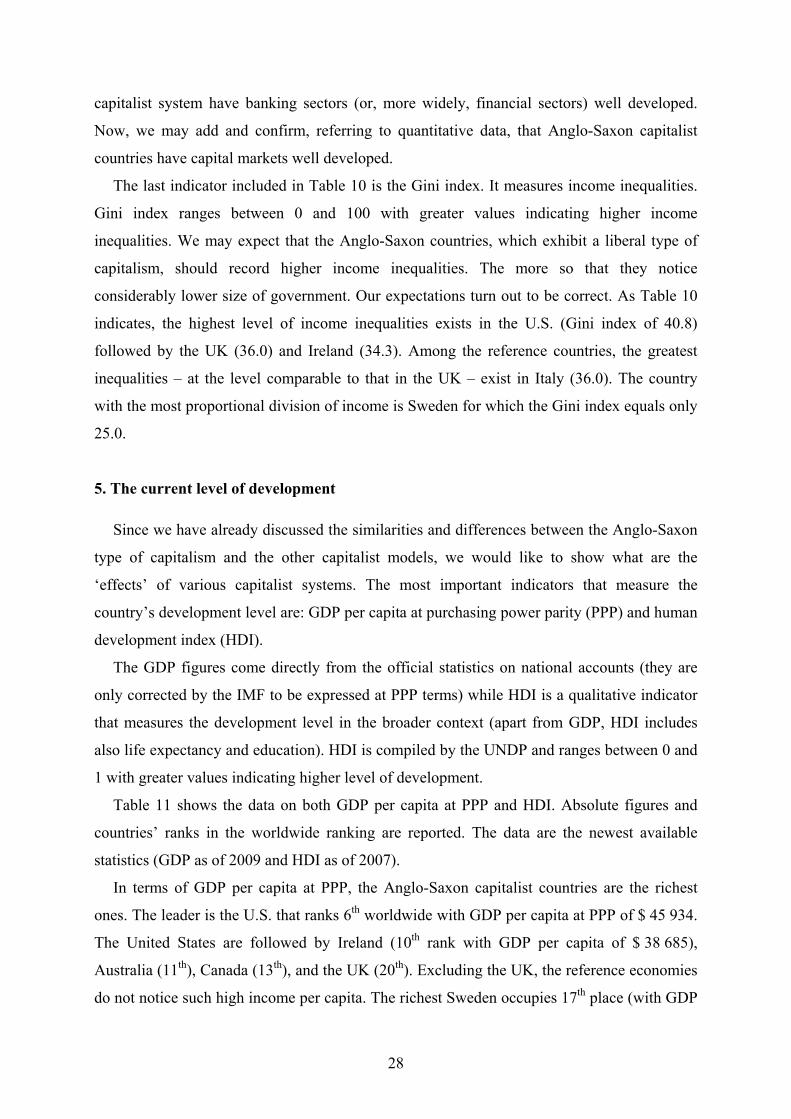
5. The current level of development
Since we have already discussed the similarities and differences between the Anglo-Saxon
type of capitalism and the other capitalist models, we would like to show what are the
‘effects’ of various capitalist systems. The most important indicators that measure the
country’s development level are: GDP per capita at purchasing power parity (PPP) and human
development index (HDI).
The GDP figures come directly from the official statistics on national accounts (they are
only corrected by the IMF to be expressed at PPP terms) while HDI is a qualitative indicator
that measures the development level in the broader context (apart from GDP, HDI includes
also life expectancy and education). HDI is compiled by the UNDP and ranges between 0 and
1 with greater values indicating higher level of development.
Table 11 shows the data on both GDP per capita at PPP and HDI. Absolute figures and
countries’ ranks in the worldwide ranking are reported. The data are the newest available
statistics (GDP as of 2009 and HDI as of 2007).
In terms of GDP per capita at PPP, the Anglo-Saxon capitalist countries are the richest
ones. The leader is the U.S. that ranks 6th worldwide with GDP per capita at PPP of $ 45 934.
The United States are followed by Ireland (10th rank with GDP per capita of $ 38 685),
Australia (11th), Canada (13th), and the UK (20th). Excluding the UK, the reference economies
do not notice such high income per capita. The richest Sweden occupies 17th place (with GDP
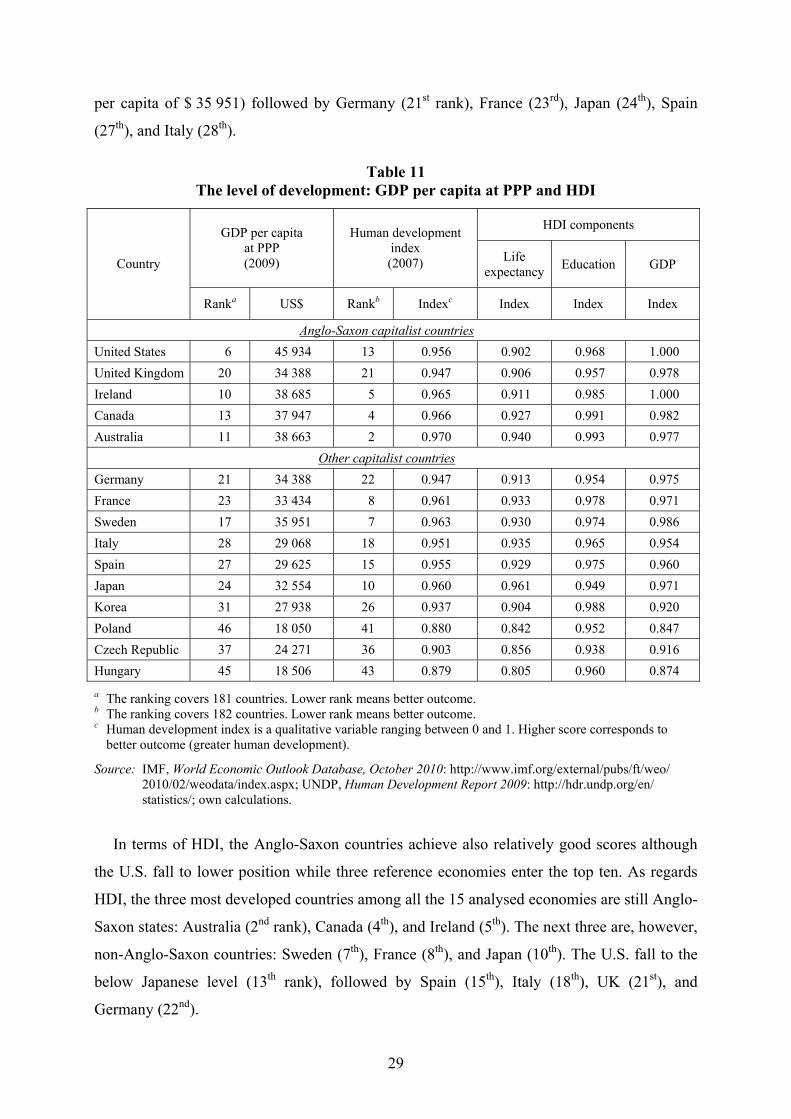
29
per capita of $ 35 951) followed by Germany (21st rank), France (23rd), Japan (24th), Spain
(27th), and Italy (28th).
Table 11 The level of development: GDP per capita at PPP and HDI
HDI components GDP per capita at PPP (2009)
Human development index (2007) Life
expectancy Education GDP Country
Ranka US$ Rankb Indexc Index Index Index
Anglo-Saxon capitalist countries United States 6 45 934 13 0.956 0.902 0.968 1.000 United Kingdom 20 34 388 21 0.947 0.906 0.957 0.978 Ireland 10 38 685 5 0.965 0.911 0.985 1.000 Canada 13 37 947 4 0.966 0.927 0.991 0.982 Australia 11 38 663 2 0.970 0.940 0.993 0.977
Other capitalist countries Germany 21 34 388 22 0.947 0.913 0.954 0.975 France 23 33 434 8 0.961 0.933 0.978 0.971 Sweden 17 35 951 7 0.963 0.930 0.974 0.986 Italy 28 29 068 18 0.951 0.935 0.965 0.954 Spain 27 29 625 15 0.955 0.929 0.975 0.960 Japan 24 32 554 10 0.960 0.961 0.949 0.971 Korea 31 27 938 26 0.937 0.904 0.988 0.920 Poland 46 18 050 41 0.880 0.842 0.952 0.847 Czech Republic 37 24 271 36 0.903 0.856 0.938 0.916 Hungary 45 18 506 43 0.879 0.805 0.960 0.874 a The ranking covers 181 countries. Lower rank means better outcome. b The ranking covers 182 countries. Lower rank means better outcome. c Human development index is a qualitative variable ranging between 0 and 1. Higher score corresponds to
better outcome (greater human development).
Source: IMF, World Economic Outlook Database, October 2010: http://www.imf.org/external/pubs/ft/weo/ 2010/02/weodata/index.aspx; UNDP, Human Development Report 2009: http://hdr.undp.org/en/ statistics/; own calculations.
In terms of HDI, the Anglo-Saxon countries achieve also relatively good scores although
the U.S. fall to lower position while three reference economies enter the top ten. As regards
HDI, the three most developed countries among all the 15 analysed economies are still Anglo-
Saxon states: Australia (2nd rank), Canada (4th), and Ireland (5th). The next three are, however,
non-Anglo-Saxon countries: Sweden (7th), France (8th), and Japan (10th). The U.S. fall to the
below Japanese level (13th rank), followed by Spain (15th), Italy (18th), UK (21st), and
Germany (22nd).
30
Looking at GDP and HDI figures we may conclude as follows. The Anglo-Saxon countries
are richer than the remaining economies. In a broader context, we may say that the Anglo-
Saxon group is more developed as compared with the countries representing different models
of capitalism. Hence, the advantage of the Anglo-Saxon countries in institutional environment
(such as greater scope of economic freedom, easier opportunities of doing business, more
flexible labour market, lower size of government) leads to differences in income and
development levels. Countries representing liberal capitalism are on average richer than the
other countries under study.
6. Summary
1. In this paper, we characterise the Anglo-Saxon model of capitalism based on five countries
(USA, UK, Ireland, Canada, and Australia). We compare them with the countries
representing different types of capitalism. The comparison involves ‘deep’ institutions
(historical, geographical, cultural, and political factors), institutions responsible for private
sector development (economic freedom, ease of doing business), some quantitative
variables (size of government, capital market development, income inequalities), and the
current development level (GDP per capita at PPP and HDI).
2. As regards ‘deep’ institutions, represented by the political system, level of democracy,
political instability, and legal framework, the Anglo-Saxon model does not differ
significantly from the other types of capitalism.
3. The most important differences between the Anglo-Saxon model and the other types of
capitalism concern economic freedom and ease of doing business. The qualitative indices
of economic freedom and doing business indicators show that Anglo-Saxon countries
enjoy a greater scope of economic freedom and offer better opportunities in doing
business.
4. Anglo-Saxon countries are characterised by relatively low size of government (measured
by the share of public spending and revenue in GDP). They also have capital markets well
developed and record greater income inequalities.
5. The figures for GDP per capita at PPP and HDI both indicate that Anglo-Saxon economies
are generally richer and more developed than the other analysed countries.
31
References
Coates D. (2001), Models of Capitalism: Growth and Stagnation in the Modern Era,
Cambridge: Polity Press.
Coates D., ed., (2002), Models of Capitalism: Debating Strengths and Weaknesses, vol. I-III,
Cheltenham – Northampton, MA: Edward Elgar.
Economist Intelligence Unit (2010), The Economist Intelligence Unit’s Index of Democracy.
The World in 2007: http://www.economist.com/media/pdf/democracy_index_2007_v3.pdf
Economist Intelligence Unit (2010): http://viewswire.eiu.com/site_info.asp?info_name=social
_unrest_table&page=noads&rf=0
Fraser Institute (2010), Economic Freedom of the World 2010: http://www.freetheworld.com/
release.html
Gwartney J.D., Hall J.C., and Lawson R. (2010), Economic Freedom of the World: 2010
Annual Report, Fraser Institute, http://www.freetheworld.com/
Hanson P. (2006), The European Union’s Influence on the Development of Capitalism in
Central Europe, unpublished manuscript.
Hanson P. (2007), The Tasks Ahead in Comparative Economic Studies: What Should We Be
Comparing?, “Japanese Journal of Comparative Economics”, 44, pp. 1-14.
Hart J.A. (1992), The Effects of State-Societal Arrangements on International
Competitiveness: Steel, Motor Vehicles and Semiconductors in the United States, Japan
and Western Europe, “British Journal of Political Science”, 22, pp. 255-300.
Heritage Foundation (2010), 2010 Index of Economic Freedom: http://www.heritage.org/
index/
IMF (2010), World Economic Outlook Database, October 2010: http://www.imf.org/external/
pubs/ft/weo/2010/02/weodata/index.aspx;
Miller T. and Holmes K.R. (2010), 2010 Index of Economic Freedom, Washington – New
York: The Heritage Foundation – The Wall Street Journal, http://www.heritage.org/index
/pdf/2010/Index2010_Full.pdf
Rapacki R., ed., (2009a), Wzrost gospodarczy w krajach transformacji: konwergencja czy
dywergencja? [Economic Growth in Transition Countries: Real Convergence or
Divergence?], Warsaw: PWE.
Rapacki R. (2009b), Reformy instytucjonalne a zróżnicowanie ścieżek wzrostu gospodarczego
w krajach transformacji w latach 1990-2005 [Institutional Reforms and Differences in
Economic Growth Paths in Transition Countries, 1990-2005], in: Wzrost gospodarczy w
32
krajach transformacji: konwergencja czy dywergencja? (ed. R. Rapacki), Warsaw: PWE,
pp. 202-226.
Sulejewicz A. (2009), Czynniki instytucjonalne w badaniach wzrostu gospodarczego krajów
transformacji [Institutional Factors in Economic Growth Analyses of Transition
Countries], in: Wzrost gospodarczy w krajach transformacji: konwergencja czy
dywergencja? (ed. R. Rapacki), Warsaw: PWE, pp. 263-302.
Transparency International (2010), Corruption Perceptions Index: http://www.transparency
.org/policy_research/surveys_indices/cpi/2009
UNDP (2010), Human Development Report 2009: http://hdr.undp.org/en/statistics/
Wielka Encyklopedia PWN (31-tomowa), Wydawnictwo Naukowe PWN, Warszawa 2005.
Wojtyna A. (2009), O badaniach nad „głębszymi” przyczynami wzrostu gospodarczego [On
the Studies of ‘Deep’ Sources of Economic Growth], in: Wzrost gospodarczy w krajach
transformacji: konwergencja czy dywergencja? (ed. R. Rapacki), Warsaw: PWE, pp. 187-
201.
World Bank (2010), Doing Business Indicators Database: http://databank.worldbank.org/
World Bank (2010), World Development Indicators Database: http://databank.worldbank.org/
World Bank (2010), Worldwide Governance Indicators Database: http://info.worldbank.org/
governance/wgi/
World Justice Project (2010), The Rule of Law Index, World Justice Forum II, Nov. 11-14,
2009, Vienna: http://www.worldjusticeproject.org/rule-of-law-index/index-2009/
Preliminary-Rule-of-Law-Index-2009-Report