ANGEL INVESTMENT IN THE U.S. TRENDS & BEST...
36
ANGEL INVESTMENT IN THE U.S. – TRENDS & BEST PRACTICES September 26, 2016 Marianne Hudson
Transcript of ANGEL INVESTMENT IN THE U.S. TRENDS & BEST...
ANGEL INVESTMENT
IN THE U.S. –
TRENDS & BEST
PRACTICES
September 26, 2016
Marianne Hudson
TOPICS IN MY PRESENTATION
• Update on Angel Capital Association
• The American startup & expansion funding scene
• Stats and trends in American angel investing
• Best (or maybe good?) practices in angel investing
• Resources ACA offers to global early-stage community

ANGEL CAPITAL ASSOCIATION TODAYWorld’s largest association of accredited angel investorswww.angelcapitalassociation.org
Mission: fuel success of angel groups and accredited investors, as
well as the early-stage companies they support
• 13,000+ investors
• Angel groups
• Accredited platforms
• Family offices
• Individual angels
• 250+ organizations
• Every U.S. state & 5
Canadian provinces
MEMBERS ARE TOP GROUPS & PLATFORMS
New Dominion Angels

ACA MEMBERS FUND GREAT COMPANIES, EXITS
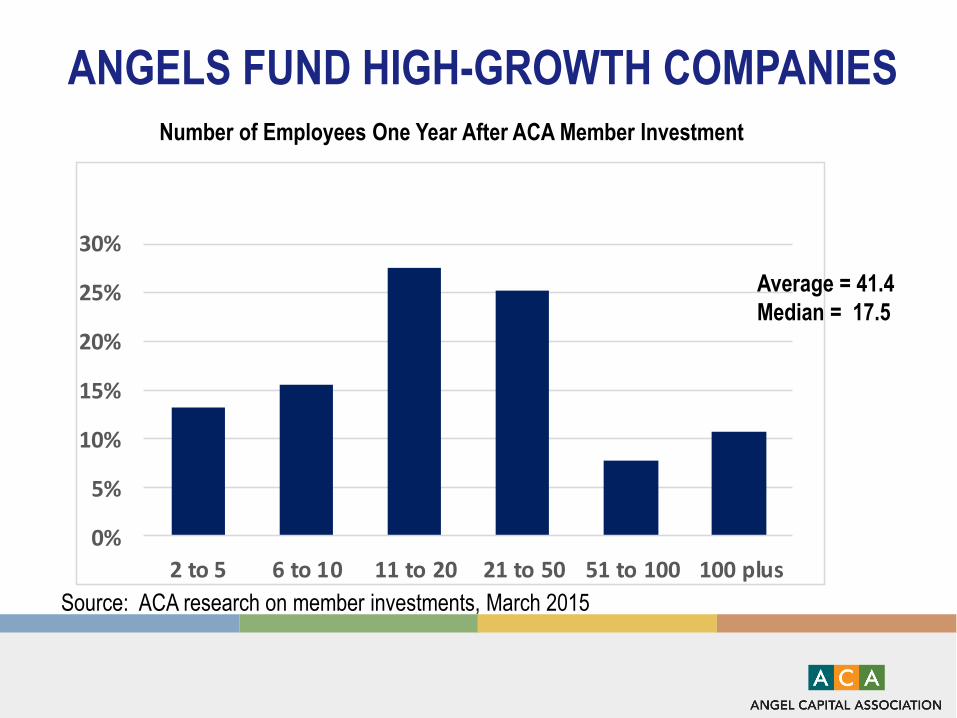
ANGELS FUND HIGH-GROWTH COMPANIES
0%
5%
10%
15%
20%
25%
30%
2 to 5 6 to 10 11 to 20 21 to 50 51 to 100 100 plus
Number of Employees One Year After ACA Member Investment
Average = 41.4
Median = 17.5
Source: ACA research on member investments, March 2015
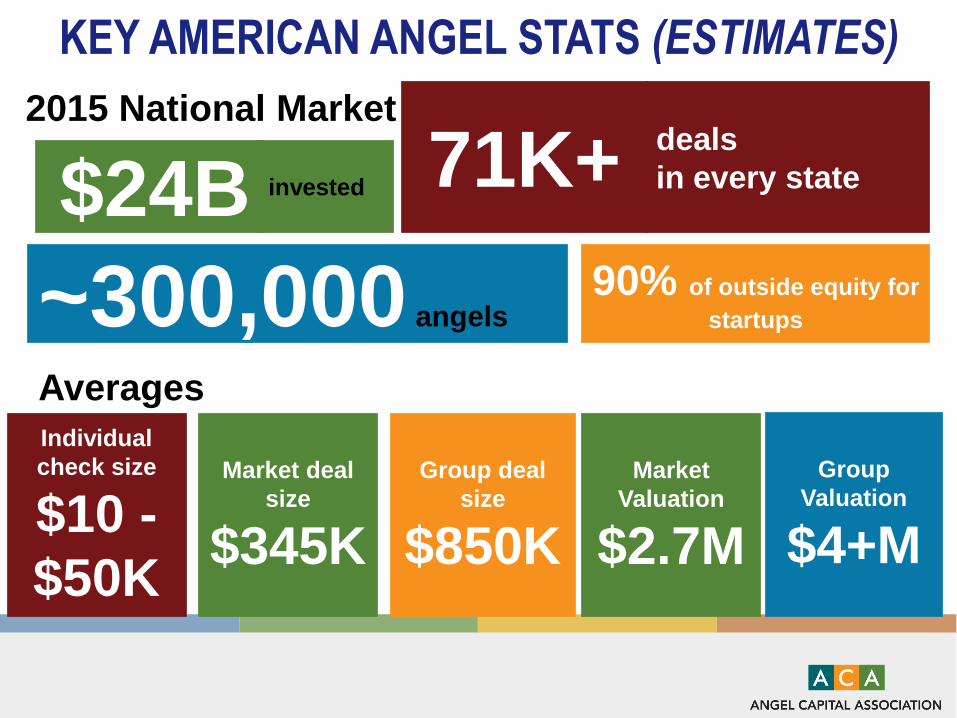
KEY AMERICAN ANGEL STATS (ESTIMATES)
~300,000 angels90% of outside equity for
startups
71K+2015 National Market
$24Bdeals
in every stateinvested
Averages
Group
Valuation
$4+M
Group deal
size
$850K
of
Market deal
size
$345K
Individual
check size
$10 -
$50K
Market
Valuation
$2.7M
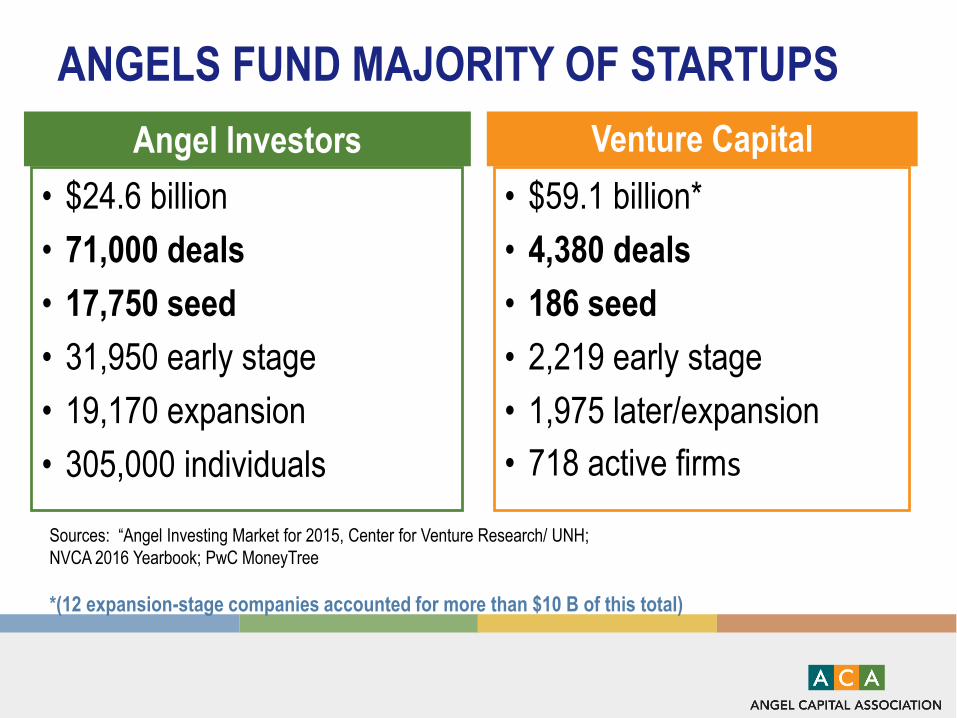
ANGELS FUND MAJORITY OF STARTUPS
Sources: “Angel Investing Market for 2015, Center for Venture Research/ UNH;
NVCA 2016 Yearbook; PwC MoneyTree
*(12 expansion-stage companies accounted for more than $10 B of this total)
• $24.6 billion
• 71,000 deals
• 17,750 seed
• 31,950 early stage
• 19,170 expansion
• 305,000 individuals
Angel Investors
• $59.1 billion*
• 4,380 deals
• 186 seed
• 2,219 early stage
• 1,975 later/expansion
• 718 active firms
Venture Capital

ANGEL VS VC INVESTMENT SIZE AND VALUATION
Sources: “Angel Investing Market for 2015, Center for Venture Research/ UNH; AngelList; NVCA 2015 Yearbook; PwC MoneyTree
• $24.6 billion
• 71,000 deals
• $2.6M
• $347K
Angel Investors
• $59.1 billion*
• 4,361 deals
• $5.1M
• $13.6M
Venture Capital
Total Invested
Total Deals
Average Seed/Early
Stage Pre-Money
Valuation
Average Investment
per deal (all deal sizes)
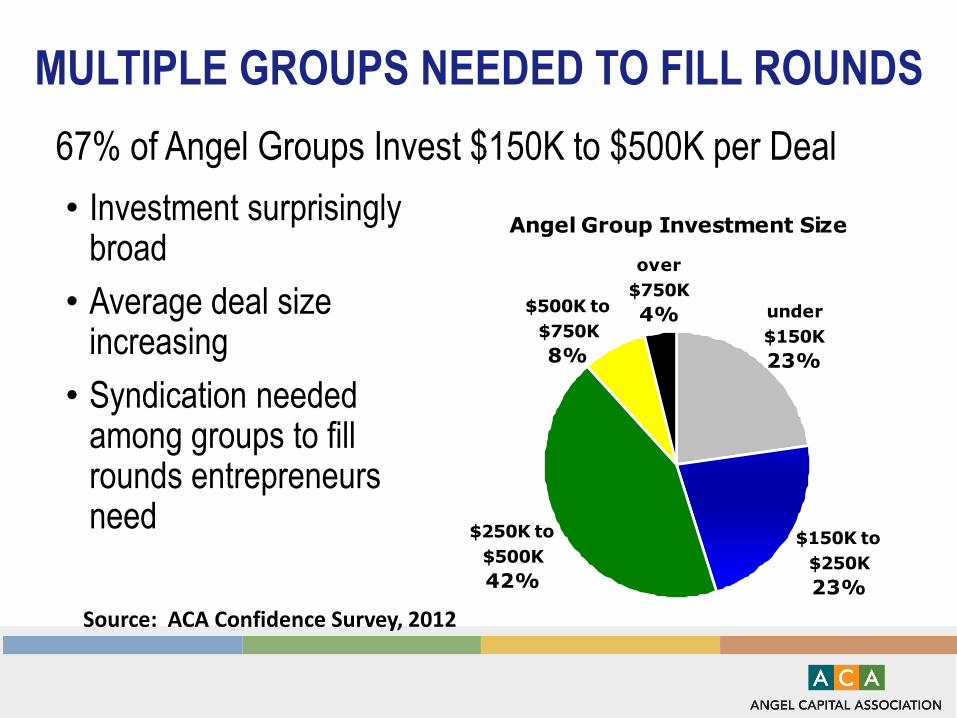
MULTIPLE GROUPS NEEDED TO FILL ROUNDS
• Investment surprisingly broad
• Average deal size increasing
• Syndication needed among groups to fill rounds entrepreneurs need
Angel Group Investment Size
over
$750K
4%$500K to
$750K
8%
$250K to
$500K
42%
$150K to
$250K
23%
under
$150K
23%
Source: ACA Confidence Survey, 2012
67% of Angel Groups Invest $150K to $500K per Deal

MANY WAYS TO INVEST
Informal or
Individual
(on own or
with friends)
Online
(via accredited
platforms)
Accelerator
(funds and/or
connect
through
mentoring)
Angel
Groups
(networks,
funds or
combination)
Large majority invest informally. Other options
offer advantages in deal flow, sophistication,
sharing of work, building portfolios, and
connecting to more funding and exits. Also
seed funds like 500 Startups.
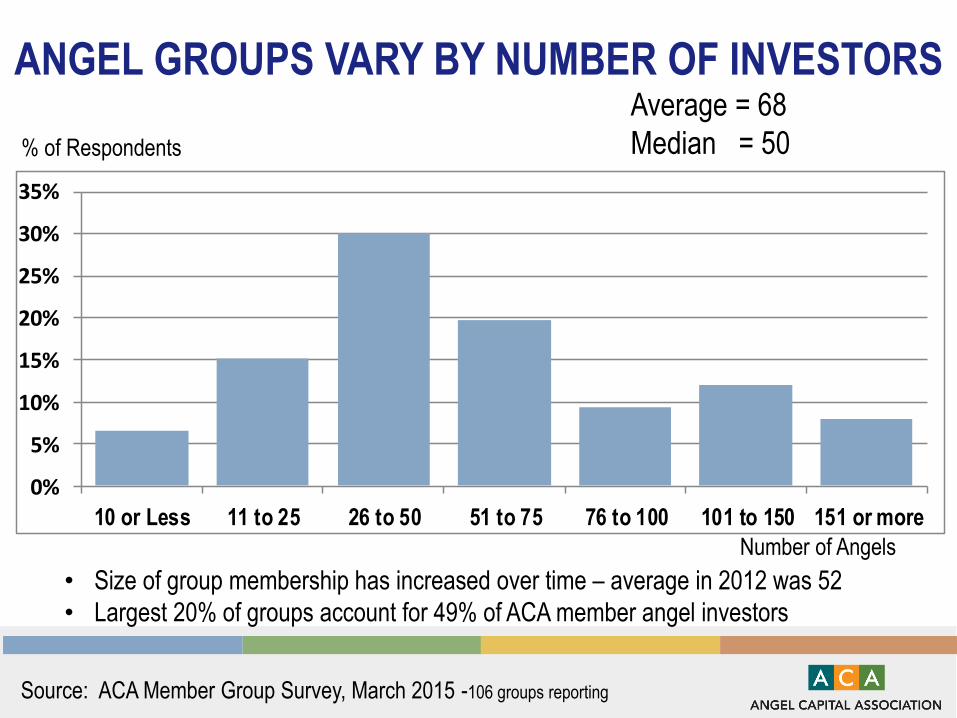
ANGEL GROUPS VARY BY NUMBER OF INVESTORS
• Size of group membership has increased over time – average in 2012 was 52
• Largest 20% of groups account for 49% of ACA member angel investors
0%
5%
10%
15%
20%
25%
30%
35%
10 or Less 11 to 25 26 to 50 51 to 75 76 to 100 101 to 150 151 or more
Average = 68
Median = 50
Number of Angels
% of Respondents
Source: ACA Member Group Survey, March 2015 -106 groups reporting
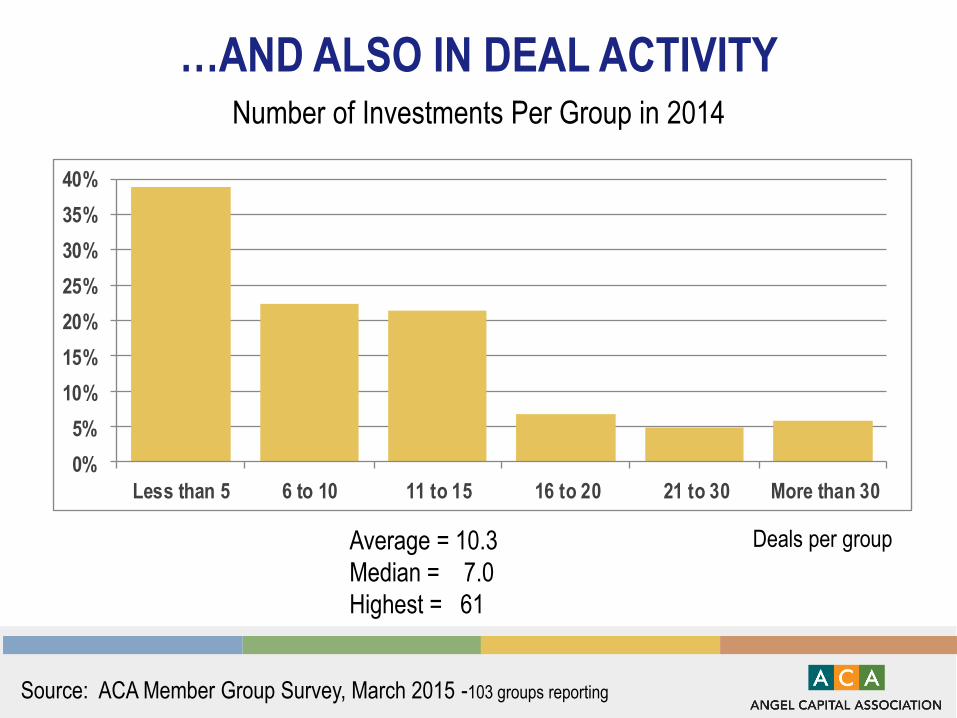
…AND ALSO IN DEAL ACTIVITY
Average = 10.3
Median = 7.0
Highest = 61
Number of Investments Per Group in 2014
Deals per group
0%
5%
10%
15%
20%
25%
30%
35%
40%
Less than 5 6 to 10 11 to 15 16 to 20 21 to 30 More than 30
Source: ACA Member Group Survey, March 2015 -103 groups reporting
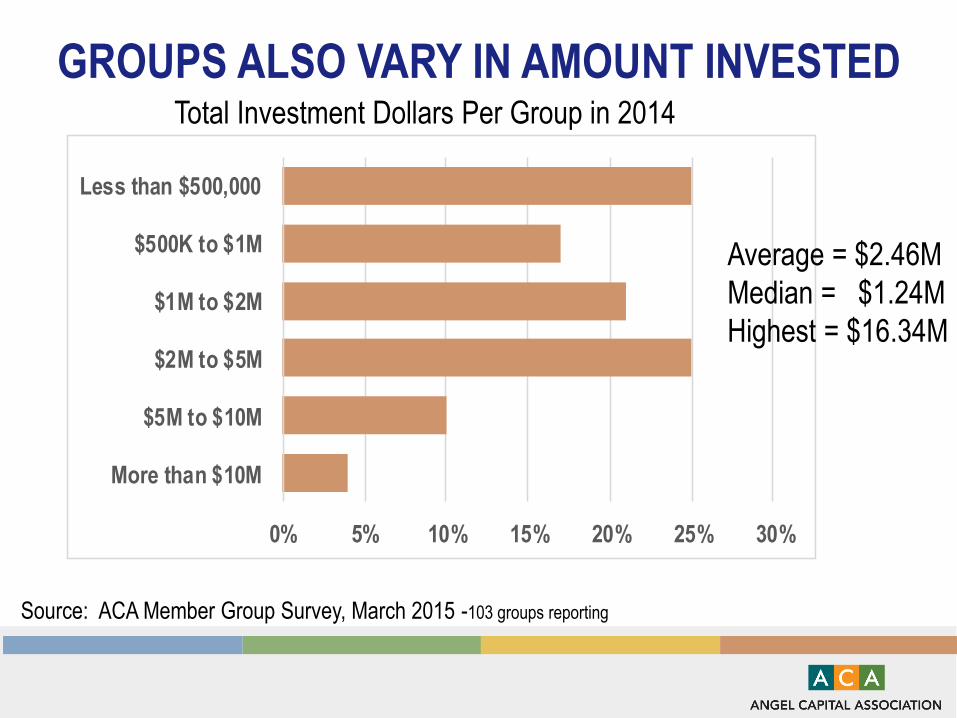
GROUPS ALSO VARY IN AMOUNT INVESTED
0% 5% 10% 15% 20% 25% 30%
More than $10M
$5M to $10M
$2M to $5M
$1M to $2M
$500K to $1M
Less than $500,000
Total Investment Dollars Per Group in 2014
Average = $2.46M
Median = $1.24M
Highest = $16.34M
Source: ACA Member Group Survey, March 2015 -103 groups reporting
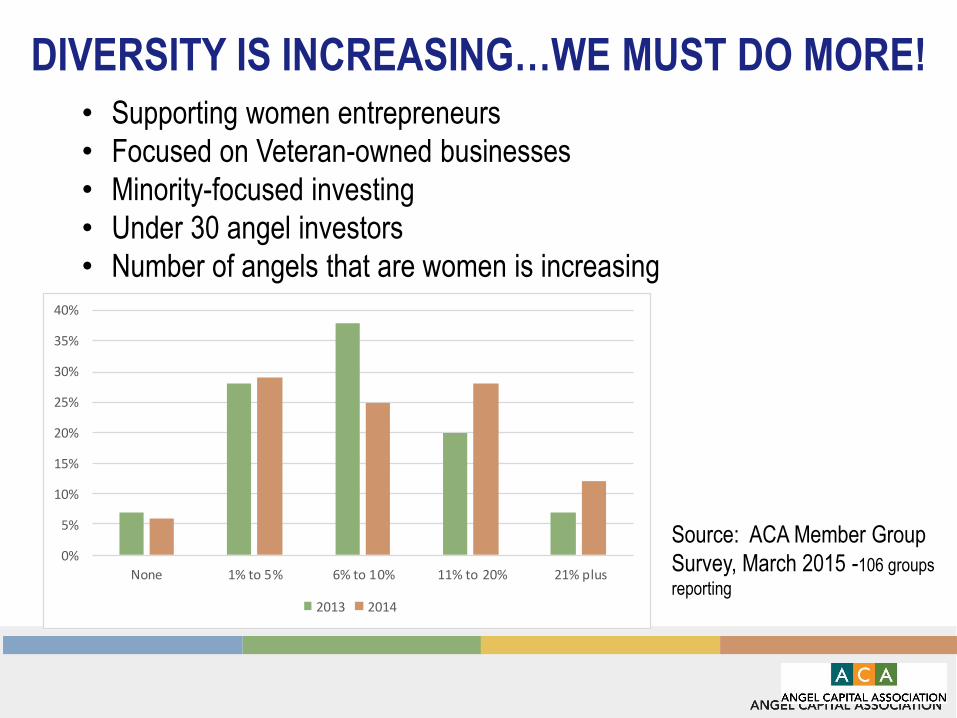
DIVERSITY IS INCREASING…WE MUST DO MORE!
• Supporting women entrepreneurs
• Focused on Veteran-owned businesses
• Minority-focused investing
• Under 30 angel investors
• Number of angels that are women is increasing
0%
5%
10%
15%
20%
25%
30%
35%
40%
None 1% to 5% 6% to 10% 11% to 20% 21% plus
2013 2014
Source: ACA Member Group
Survey, March 2015 -106 groups
reporting

ACA GROUPS BY INVESTMENT STRUCTURE
Fund 16%
Network 63%
Network with Sidecar 12%
Other 9%
MEXICO
Source: ACA Member Group Survey, March 2015 -106 groups reporting
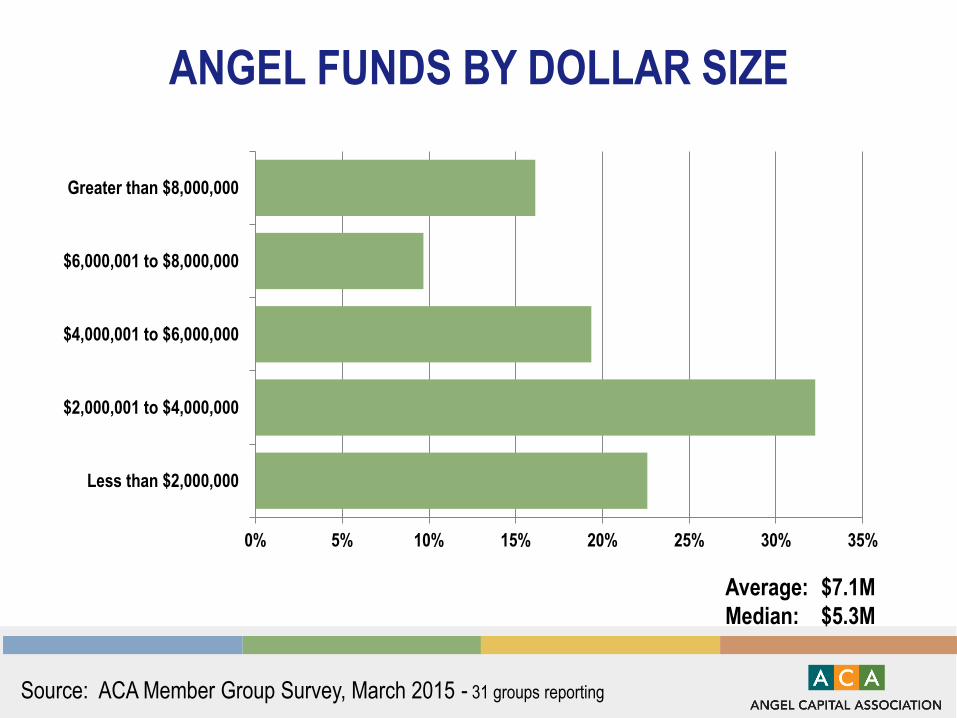
ANGEL FUNDS BY DOLLAR SIZE
Source: ACA Member Group Survey, March 2015 - 31 groups reporting
0% 5% 10% 15% 20% 25% 30% 35%
Less than $2,000,000
$2,000,001 to $4,000,000
$4,000,001 to $6,000,000
$6,000,001 to $8,000,000
Greater than $8,000,000
Average: $7.1M
Median: $5.3M
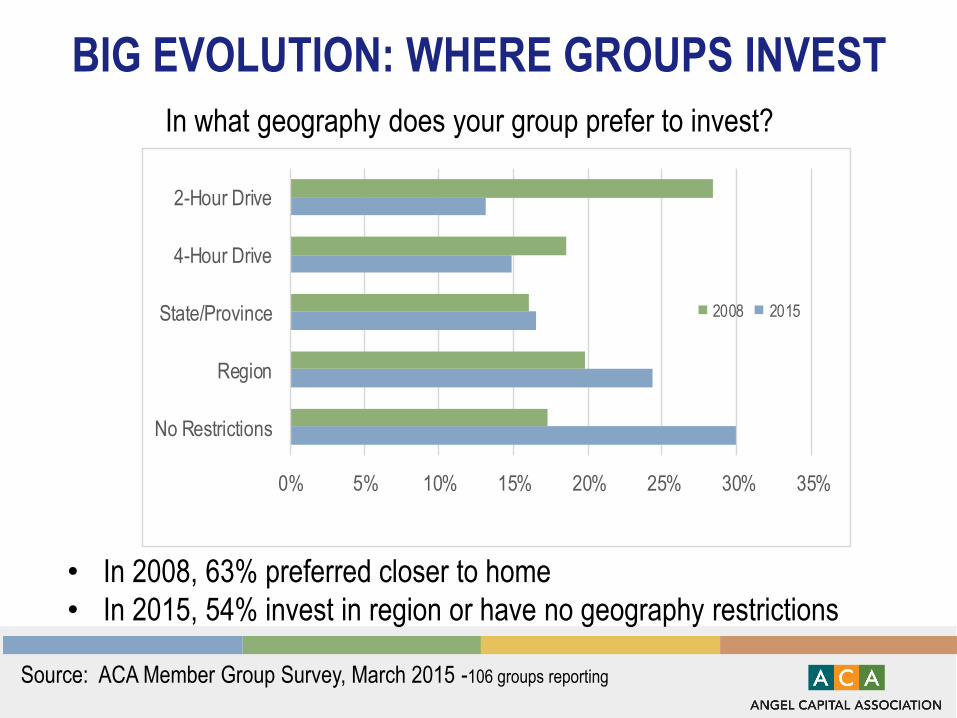
BIG EVOLUTION: WHERE GROUPS INVEST
In what geography does your group prefer to invest?
• In 2008, 63% preferred closer to home
• In 2015, 54% invest in region or have no geography restrictions
0% 5% 10% 15% 20% 25% 30% 35%
No Restrictions
Region
State/Province
4-Hour Drive
2-Hour Drive
2008 2015
Source: ACA Member Group Survey, March 2015 -106 groups reporting

DEAL STRUCTURE PREFERENCES
• Strong preference for priced rounds and preferred stock
• Some will do convertible debt
• Most sectors: products developed and have customer
traction
• Valuation not only for sector but for location (not unlike real
estate)
• Board seat for significant investments
• Most groups stay away from generally solicited offerings
SOME INVESTMENT PRACTICES THAT WORK
• Portfolio strategy
• Syndication
• Focus not just on front end of investing, but on outcomes after the check
• Investment structures – improvements to convertible debt
• Online platforms for accredited investors
• New models for angel groups, bringing in new angels –women, younger investors, etc.
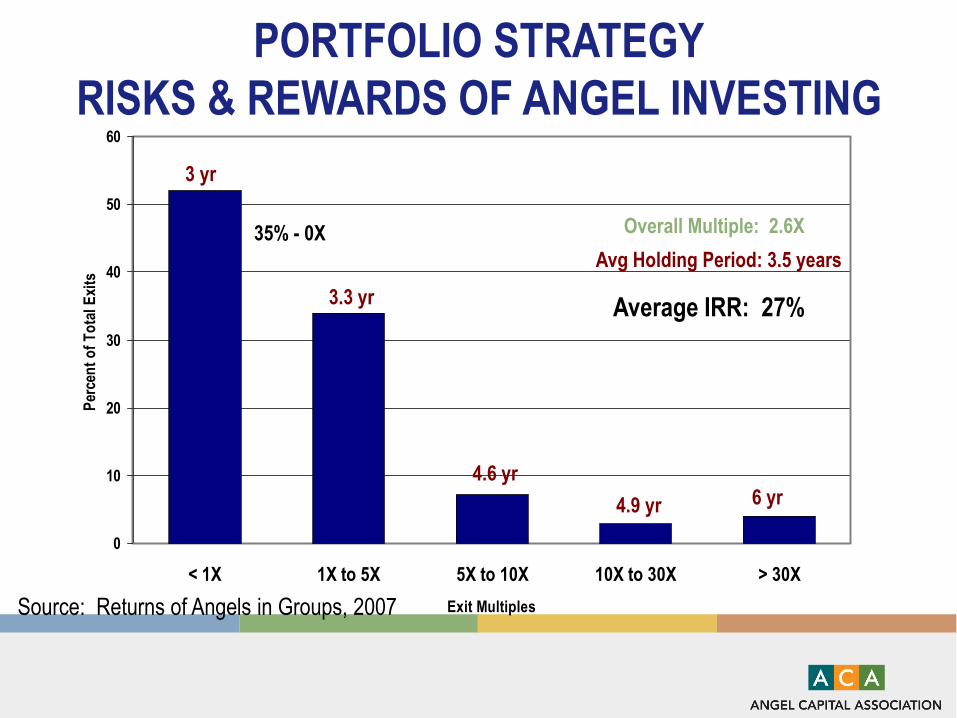
PORTFOLIO STRATEGY
RISKS & REWARDS OF ANGEL INVESTING
0
10
20
30
40
50
60
< 1X 1X to 5X 5X to 10X 10X to 30X > 30X
Exit Multiples
Per
cen
t o
f T
ota
l E
xits
Overall Multiple: 2.6X
Avg Holding Period: 3.5 years
Average IRR: 27%
35% - 0X
3 yr
3.3 yr
4.6 yr
4.9 yr 6 yr
Source: Returns of Angels in Groups, 2007

SYNDICATION
• 75% plus of ACA member deals are syndicated
• Common agreements lead to sharing DD, fast track on group decisions
• Come out of regular communication and trust building
• Regularly include multiple angel groups, family offices, private equity
• Only way to support companies where VCs are rare
• $12M series B
• Led by Golden Seeds
• 6 ACA member groups, across US
• Plus many others

FOCUS BEFORE AND AFTER CHECK
• Angels make, or lose most money, after investing:o Dry powder, criteria next decisions
o Board of Directors (holding their feet to fire, CEO compensation)
o Minimizing losses (taxes, ensuring $ for closing businesses)
o Help with follow-on round investors and exits
o Keep track of cap tables and dilution
Picking good entrepreneurs is
important, as is:
• Negotiating good deals
• Conducting due diligence
But, can you really tell which
will be best in show?
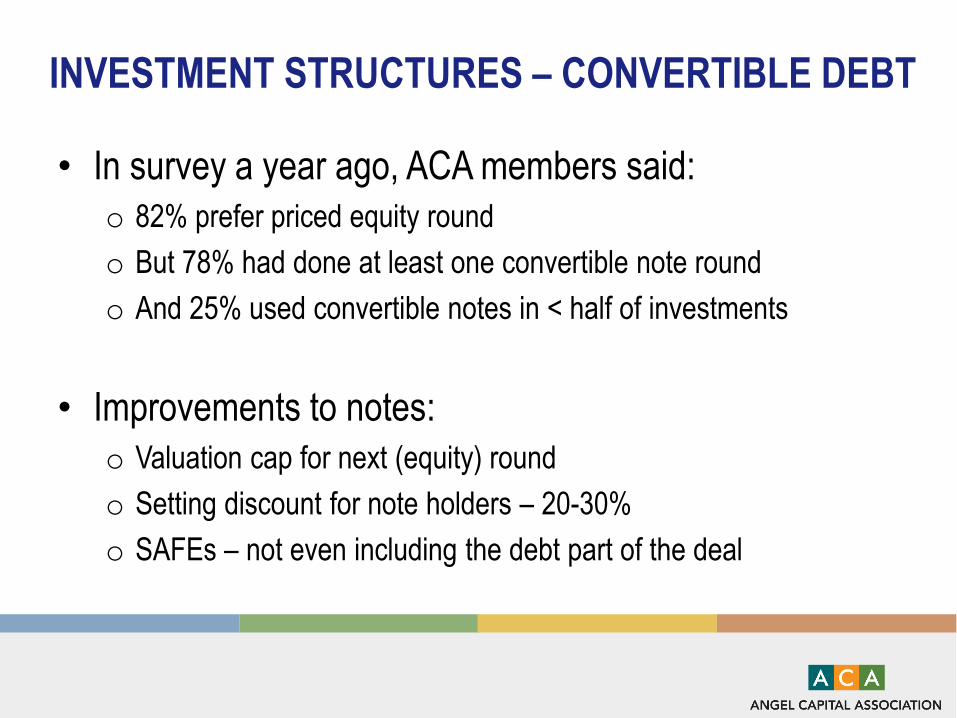
INVESTMENT STRUCTURES – CONVERTIBLE DEBT
• In survey a year ago, ACA members said:
o 82% prefer priced equity round
o But 78% had done at least one convertible note round
o And 25% used convertible notes in < half of investments
• Improvements to notes:
o Valuation cap for next (equity) round
o Setting discount for note holders – 20-30%
o SAFEs – not even including the debt part of the deal

ONLINE INVESTING – FILL ROUNDS, DIVERSIFY
• This means crowdfunding for angels, but not everyone

NEW MODELS BRING DIVERSITY, BETTER DECISIONS

ACA RESOURCES AVAILABLE TO YOU
Via www.angelcapitalassociation.org:
Webinars and Videos Research, Best Practices Timely Articles and Blogs
Sign up for Angel Insights Monthly Newsletter for news, new resources

INVESTORS: COME TO 2017 ACA SUMMIT
Join 700+ investors in San Francisco on April 26-28 to: • Share best practices in angel investing - deal sourcing, terms, supporting portfolio
companies, syndication, and top exits
• Discuss the latest data and trends in startup investing and different industry sectors
• Hear keynote presentations from thought leading investors and entrepreneurs
• Network with top angels from throughout North America and the world
• Meet with corporate leaders to build relationships for investor portfolio companies
and meet a limited number of interesting entrepreneurs
MORE INFORMATION
Marianne Hudson
Angel Capital Association
+1 913-894-4700
www.angelcapitalassociation.org
@ACAAngelCapital
www.forbes.com/sites/mariannehudson
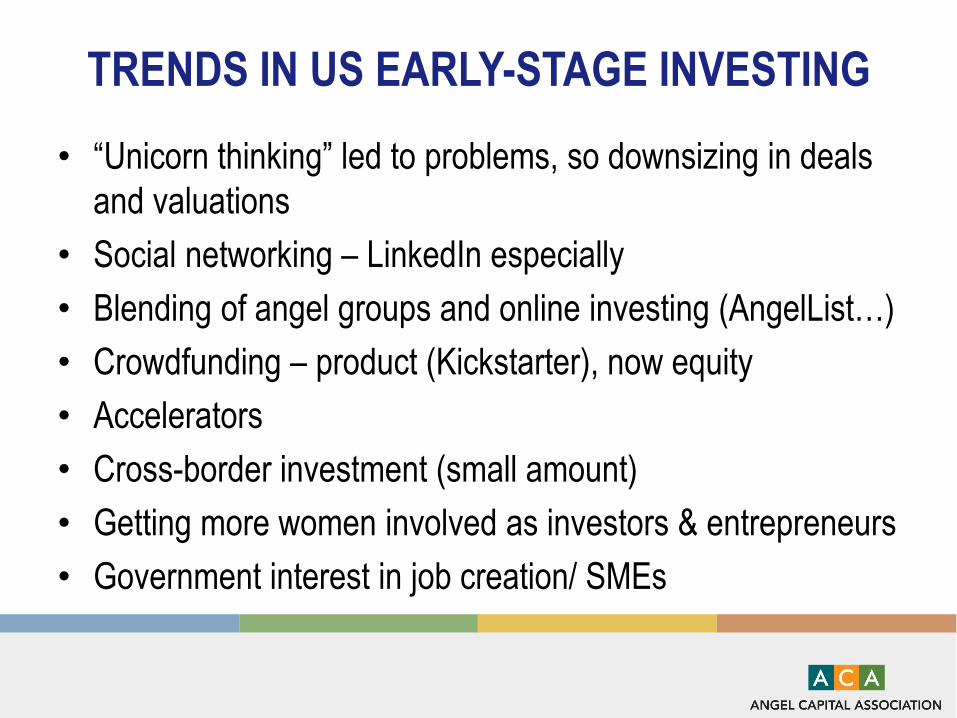
TRENDS IN US EARLY-STAGE INVESTING
• “Unicorn thinking” led to problems, so downsizing in deals
and valuations
• Social networking – LinkedIn especially
• Blending of angel groups and online investing (AngelList…)
• Crowdfunding – product (Kickstarter), now equity
• Accelerators
• Cross-border investment (small amount)
• Getting more women involved as investors & entrepreneurs
• Government interest in job creation/ SMEs
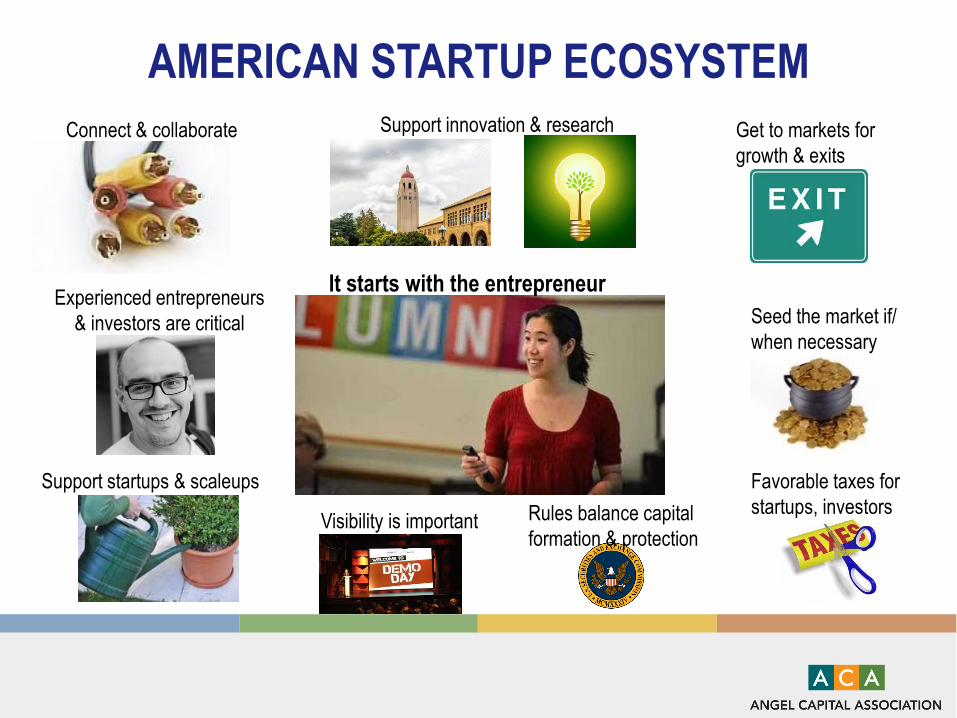
AMERICAN STARTUP ECOSYSTEM
It starts with the entrepreneur
Connect & collaborate
Experienced entrepreneurs
& investors are critical
Support startups & scaleups
Support innovation & research Get to markets for
growth & exits
Seed the market if/
when necessary
Favorable taxes for
startups, investorsRules balance capital
formation & protectionVisibility is important
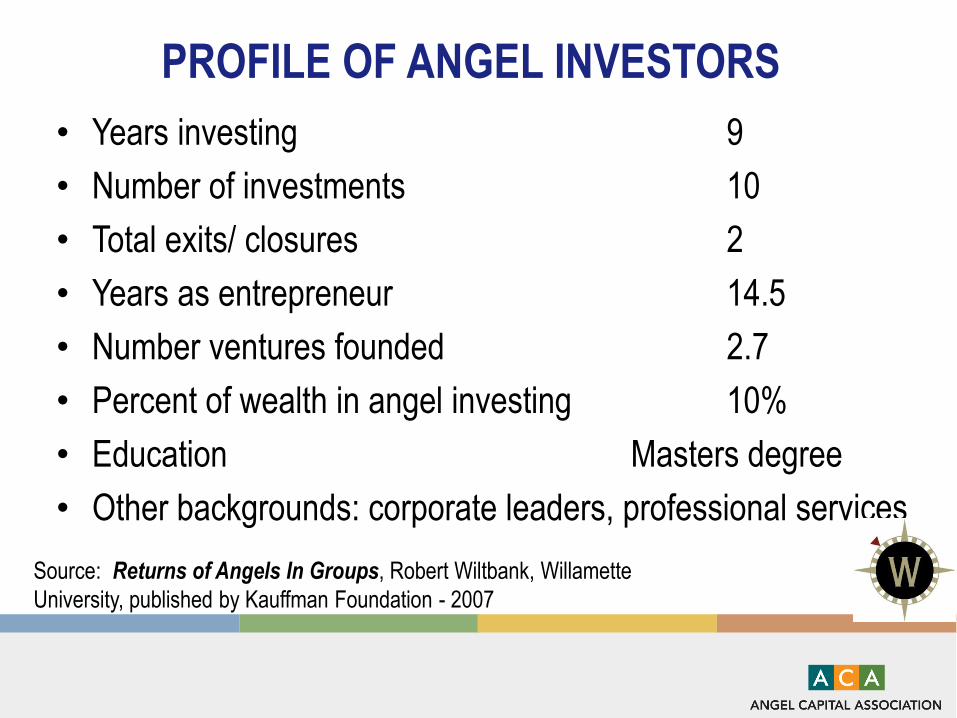
PROFILE OF ANGEL INVESTORS
• Years investing 9
• Number of investments 10
• Total exits/ closures 2
• Years as entrepreneur 14.5
• Number ventures founded 2.7
• Percent of wealth in angel investing 10%
• Education Masters degree
• Other backgrounds: corporate leaders, professional services
Source: Returns of Angels In Groups, Robert Wiltbank, Willamette
University, published by Kauffman Foundation - 2007