ANE/E&E SOTA October 2002 Trend Analysis and Sector Profiles ANE and E&E Regions.
45
ANE/E&E SOTA October 2002 Trend Analysis and Sector Profiles ANE and E&E Regions
-
Upload
sydney-webster -
Category
Documents
-
view
217 -
download
1
Transcript of ANE/E&E SOTA October 2002 Trend Analysis and Sector Profiles ANE and E&E Regions.

ANE/E&E SOTA October 2002
Trend Analysis and Sector ProfilesANE and E&E Regions

ANE/E&E SOTA October 2002
Total Fertility, 1990-2000
0
1
2
3
4
5
6
7
8
Tota
l Fert
ility R
ate
Yemen
Wes
t Ban
k/Gaz
a
Nepal
Cambo
dia
Jord
an
Philipp
ines
Egyp
t
Mor
occo
Bang
lade
sh
India
Indo
nesia
Viet
nam
Kyrg
zsta
n
Uzbe
kistan
Turk
men
istan
Kaza
ksta
n
Azer
baija
n
Moldo
va
Geor
gia
Armen
ia
Ukra
ine
Russ
ia
Roman
ia
USAID Countries
Replacement Level Fertility
2.1
Source: DHS/RHS1990-2001 and PRB 2001 Data Sheet.

ANE/E&E SOTA October 2002
Maternal Mortality Ratios and Attended Births in ANE Region
0
10
20
30
40
50
60
70
80
90
100
Afgh
anist
anLa
os*
Nepal
Bang
lades
h
Pakis
tan
Yemen
Cambo
diaIn
dia
Moroc
co
Indo
nesia
Philip
pines
Egyp
t
China
*
Thail
and*
Vietnam
Mongo
lia*
Sri L
anka
*
Jord
an
Per
cen
t b
irth
s at
ten
ded
by
trai
ned
per
son
nel
0
100
200
300
400
500
600
700
800
900 Matern
al death
s per 100,000 live b
irths
Births Attended 1995-2000 Maternal Mortality Ratio 1985-1999
Source: UNICEF State of the World’s Children, 2002. DHS and WHO/Hill data used when UNICEF data not available.
*No current USAID PHN funding

ANE/E&E SOTA October 2002
Abortion and Non-Abortion Maternal Mortality Rate (MM) in Romania 1965, 1980-1999
Source: 1999 National Commission for Statistics/Romania; UNFPA
0
20
40
60
80
100
120
140
160
180
200
1 2 3 4 5 6 7 8 9 10 11 12 13 14 15 16 17 18 19 20 21 22
Year
Abortion MM Non-Abortion MM MM
‘65 ‘80 ‘81 ‘82 ‘83 ‘84 ‘85 ‘86 ‘87 ‘88 ‘89 ‘90 ‘91 ‘92 ‘93 ‘94 ‘95 ‘96 ‘97 ‘98 ‘99
Num
ber
of
death
s per
100
,000 w
om
en
ANE/E&E SOTA October 2002
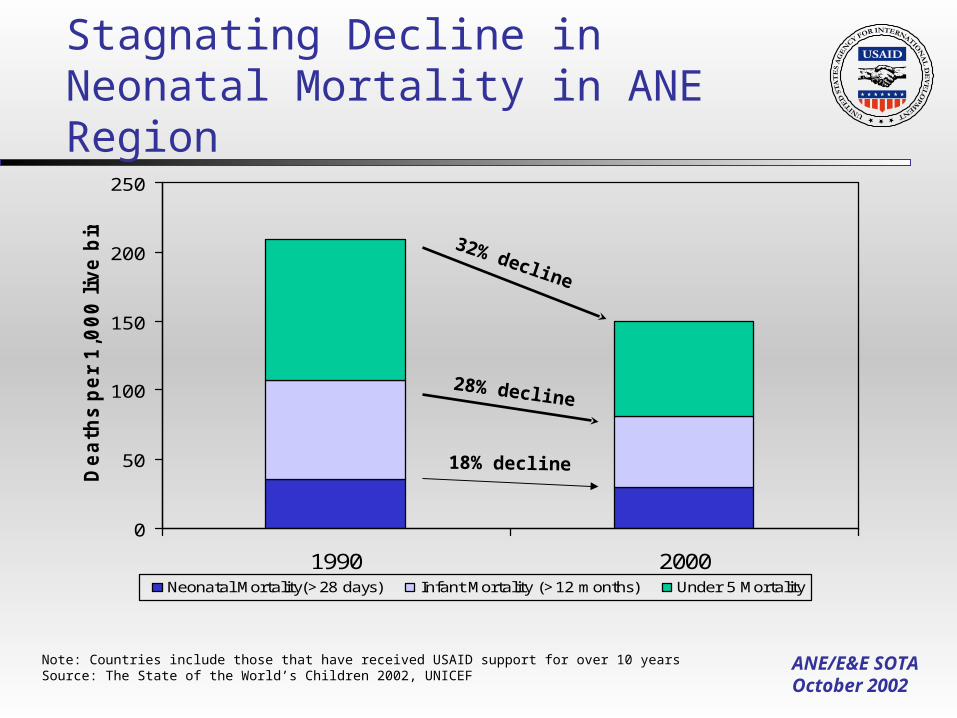
0
50
100
150
200
250
1990 2000
Death
s per
1,0
00 liv
e b
irth
s
Neonatal Mortality(>28 days) Infant Mortality (>12 months) Under 5 Mortality
Stagnating Decline in Neonatal Mortality in ANE Region
Note: Countries include those that have received USAID support for over 10 yearsSource: The State of the World’s Children 2002, UNICEF
28% decline
32% decline
18% decline

ANE/E&E SOTA October 2002
AlbaniaArmenia
AzerbaijanBelarus
Bosnia***
Georgia
KazakstanKyrgyzstan
LatviaLithuania
MoldovaPoland
Romania***
TajikistanTurkey
TurkmenistanUkraine
Uzbekistan
Hungary
Croatia***Cyprus
Slovenia***
RussiaSlovak Rep.***
020406080100120140
Estimated 2007 plan average** 35
APP 99 baseline average 51
BUCEN average* 1997 44
APP 99 plan average 1999 47Source: US BUCEN International Database* Country (unweighted average)** 2007 Plan from APP 2000*** When 1990 data were unavailable, the closest available year was used.Albania, Armenia, Azerbaijan, Belarus, Bosnia, Georgia, Kazakstan, Kyrgystan, Lithuania, Moldova, Russia, Tajikistan, Turkmenistan, Ukraine, and Uzbekistan all experienced increases in their under-5 mortality rates.
= reduction in rate1990
1997
1997 1990
= increase in rate
KEY
Under-5 mortality rateUSAID-assisted countries-progress towards benchmarksEurope/NISBars reflect change in under-5 mortality rate, 1990-1997

ANE/E&E SOTA October 2002
Malaria Deaths in ANE = 1.1 million
ANERegion
10%
AFRRegion
Malaria in ANE Region
0
20
40
60
80
100
120
1975 1976 1978 1980 1982 1984 1986 1988 1990 1992 1994
Year
Cure Rate %
Quinine
Mefloquine
Chloroquine
Sulphadoxine-
PyrimethamineCu
re R
ate
(%)
Falling Cure Rates for Falciparum Malaria in Southeast Asia
Source: SE Asia J Trop Med Public Health 1999; 30: 68
Example from Thailand
ANE/E&E SOTA October 2002
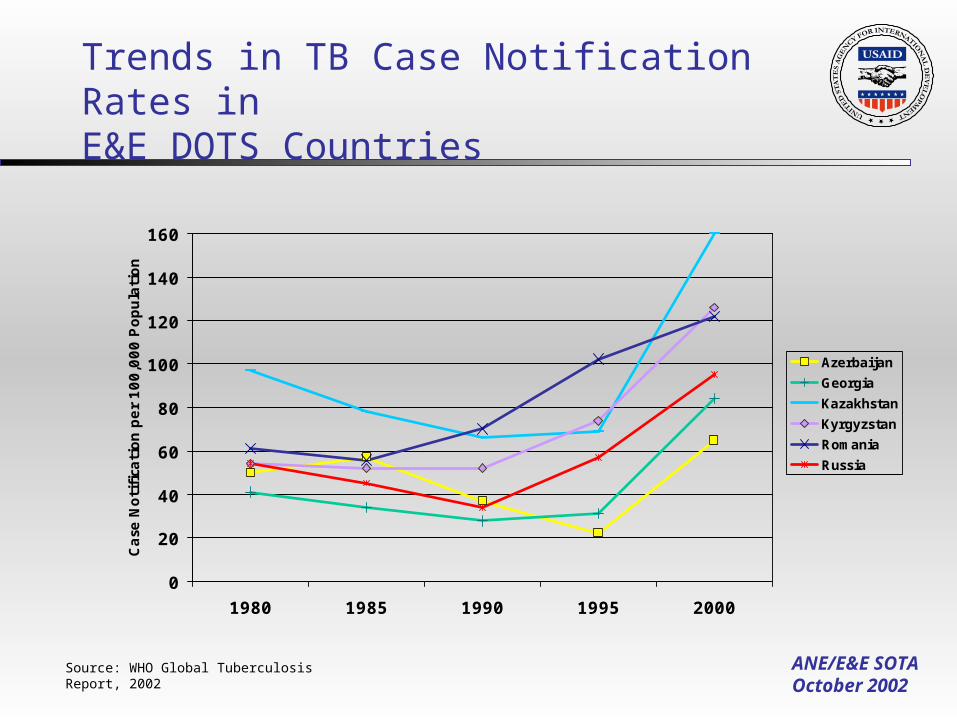
Trends in TB Case Notification Rates in E&E DOTS Countries
0
20
40
60
80
100
120
140
160
1980 1985 1990 1995 2000
Case
Noti
fica
tion p
er
100,0
00 P
opula
tion
Azerbaijan
Georgia
Kazakhstan
Kyrgyzstan
Romania
Russia
Source: WHO Global Tuberculosis Report, 2002
ANE/E&E SOTA October 2002
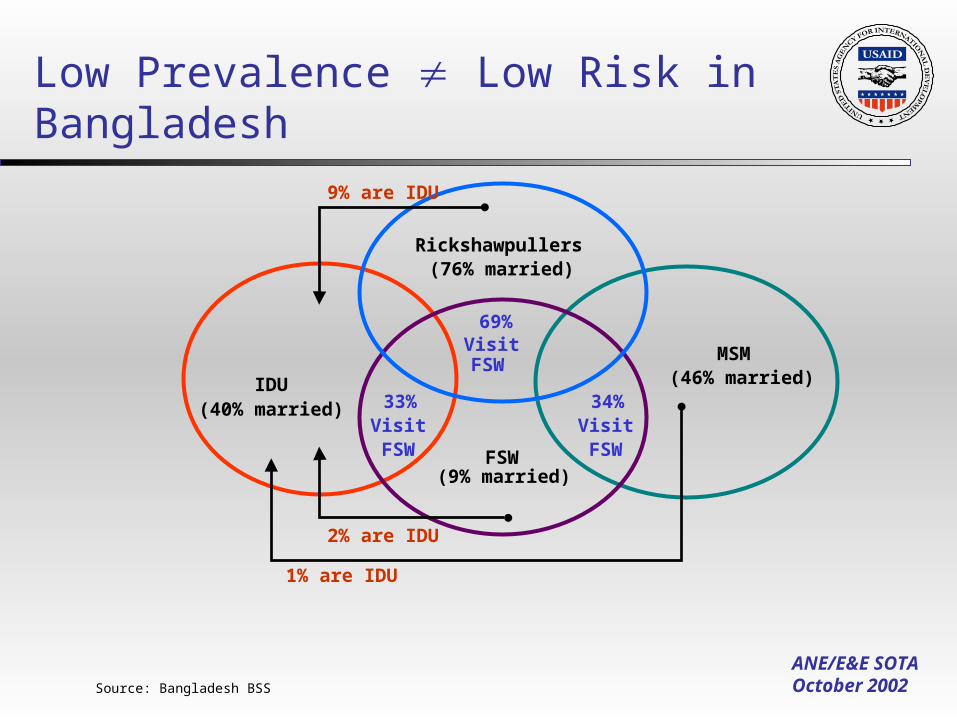
Low Prevalence Low Risk in Bangladesh
Source: Bangladesh BSS
FSW(9% married)
IDU(40% married) 33%
VisitFSW
34%VisitFSW
Rickshawpullers
MSM(46% married)
(76% married)
Visit FSW
9% are IDU
2% are IDU
1% are IDU
69%

ANE/E&E SOTA October 2002
0
100,000
200,000
300,000
400,000
500,000
600,000
700,000
800,000
900,000
1,000,000
1993 1995 1996 1997 1998 1999 2000 2001
New Cases E. Europe/ CAR New Cases W. Europe
Eastern Europe & Central Asia Western Europe
HIV Trends in Eastern Europe & Central Asia and Western Europe, 1993 - 2001
Source: Report on the Global HIV/AIDS Epidemic, UNAIDS July 2002
ANE/E&E SOTA October 2002
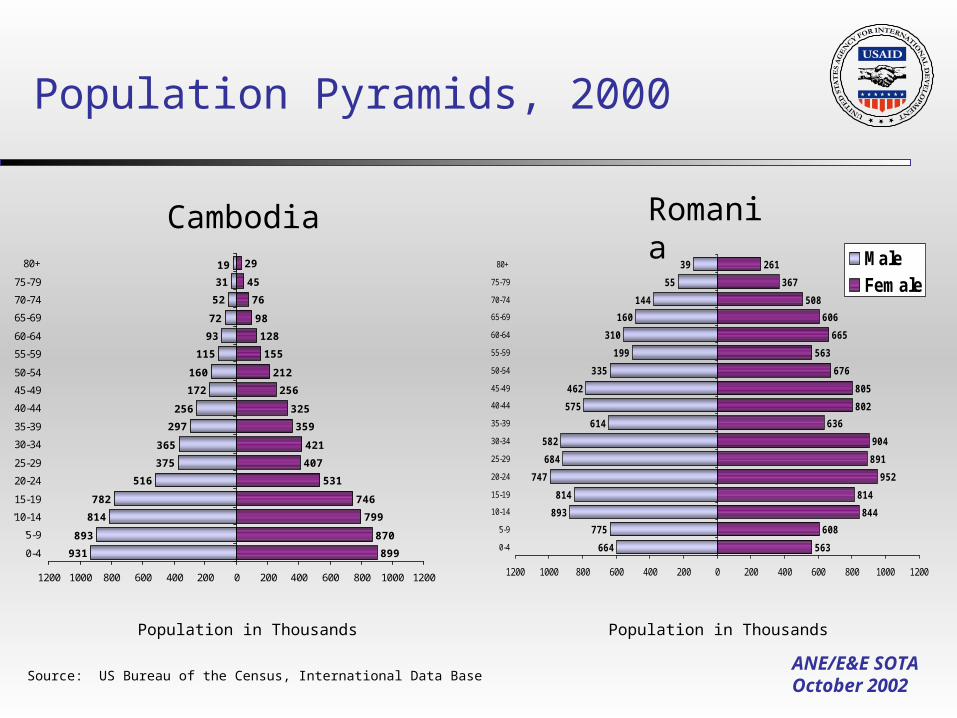
563
608
844
814
952
891
904
636
802
805
676
563
665
606
508
367
261
664
775
893
814
747
684
582
614
575
462
335
199
310
160
39
55
144
1200 1000 800 600 400 200 0 200 400 600 800 1000 1200
0-4
'5-9
10-14
15-19
20-24
25-29
30-34
35-39
40-44
45-49
50-54
55-59
60-64
65-69
70-74
75-79
80+ MaleFemale
899
870
799
746
531
407
421
359
325
256
212
155
128
98
76
45
29
31
19
931
893
814
782
516
375
365
297
256
172
160
115
93
72
52
1200 1000 800 600 400 200 0 200 400 600 800 1000 1200
0-4
'5-9
'10-14
15-19
20-24
25-29
30-34
35-39
40-44
45-49
50-54
55-59
60-64
65-69
70-74
75-79
80+
Source: US Bureau of the Census, International Data Base
Cambodia Romania
Population Pyramids, 2000
Population in Thousands Population in Thousands

ANE/E&E SOTA October 2002
Causes of Death in ANE Region, 2000
Infectious and parasitic diseases
23%
Chronic diseases
excluding CVD31%
Cardiovascular diseases (CVD)
29%
Maternal, perinatal, and
nutritional conditions
7%
Intentional and unintentional
injuries10%
Source: WHO World Health Report, 2001
ANE/E&E SOTA October 2002
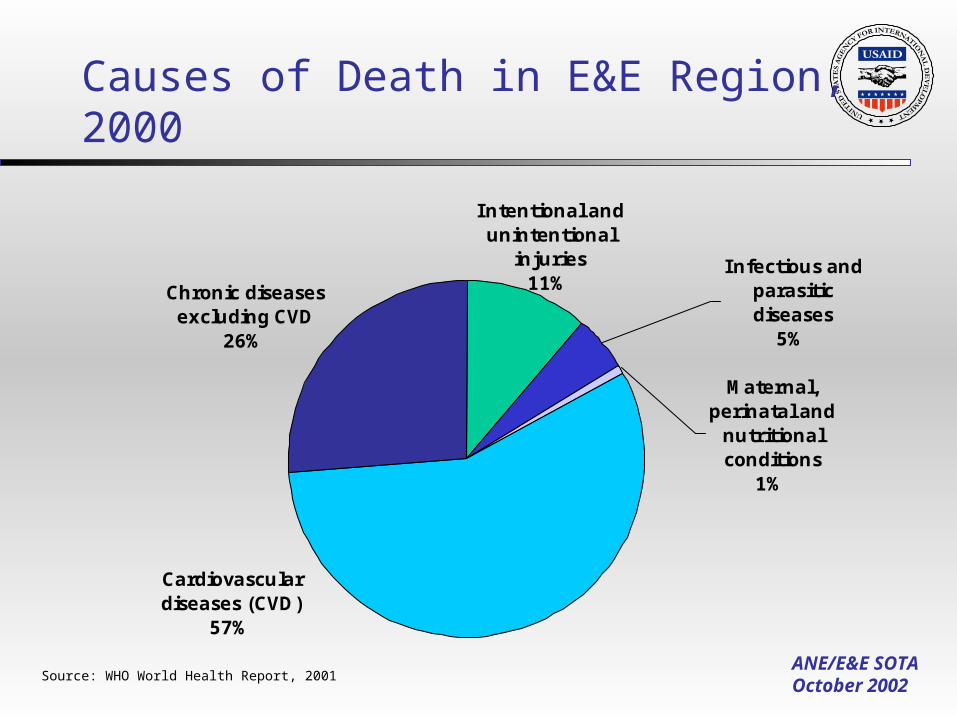
Causes of Death in E&E Region, 2000
Cardiovascular diseases (CVD)
57%
Maternal, perinatal and
nutritional conditions
1%
Chronic diseases excluding CVD
26%
Intentional and unintentional
injuries11%
Infectious and parasitic diseases
5%
Source: WHO World Health Report, 2001

ANE/E&E SOTA October 2002
Population Sector

ANE/E&E SOTA October 2002
Population and Economic Growth Rates in ANE Region
-8
-6
-4
-2
0
2
4
6
8
Per
cen
t
% Annual Population Growth 2000 % GDP Growth 1999-2000
* No current USAID PHN funding
Source: (GDP) World Bank, World Development Indicators 2002, and (Pop) Bureau of Census, International Database 2002. No economic growth data available for Afghanistan.

ANE/E&E SOTA October 2002
Percentage of Population Living on Less Than $2 a Day in E&E Region
Source: 2001 World Development Report/ The World Bank

ANE/E&E SOTA October 2002
Total Fertility and Modern Contraceptive Prevalence in ANE Region
0
10
20
30
40
50
60
70
80
90
Yemen
Afgh
anist
an
Pakis
tan
Cambo
diaLa
os*
Nepal
Philip
pines
Wes
t Ban
k/Gaz
a
Jord
an
Mongo
lia*
India
Bang
lades
h
Sri L
anka
*
Moroc
coEg
ypt
Indo
nesia
Vietnam
Thail
and*
China
*
Co
ntr
acep
tive
Pre
vale
nce
Rat
e
0
1
2
3
4
5
6
7
8
Live b
irths p
er wo
man
CPR
TFR
* No current USAID PHN funding
Source: PRB 2001 Population Data Sheet

ANE/E&E SOTA October 2002
Contraceptive Prevalence Modern Methods in E&E Region
1220 22
3038 45 49 50 51 53 54 53
0
10
20
30
40
50
60
70
80
90
100
AZ GE AM RO UA CZ KG MD UZ TM RU KZ
Tota
l co
ntr
ace
ptive P
revale
nce
Rate
Traditional MethodsModern Methods
Source: DHS or RHS, most recent surveys, 1993-2001, or PRB 2001 Population Data Sheet if DHS/RHS data not available.

ANE/E&E SOTA October 2002
Total Fertility Rate and Total Induced Abortion Rate in E&E Region
1.8 1.92.1 2.1
2.9
3.3 3.4
2.22.5
1.6
2.6
3.7
3.2
1.71.71.41.31.3
1.5
0.60.9
1.41.6
1.3
0
1
2
3
4
5
RO RU UA AM GE MD CZ AZ KZ TM UZ KGTota
l Fe
rtilty
Rate
and T
ota
l In
duce
d A
bort
ion R
ate Total Fertility Rate
Total Induced AbortionRate
Source: DHS or RHS, data from most recent survey, 1993-2001, or PRB 2001 Population Data Sheet if DHS/RHS data not available.

ANE/E&E SOTA October 2002
Outcome of Pregnancy in E&E Region
37
53
30
45
5
11
9
8
60
37
61
47
0%
10%
20%
30%
40%
50%
60%
70%
80%
90%
100%
Georgia Moldova Russia Ukraine
Perc
ent
of Pre
gnanci
es
Induced abortionMiscarriageLive birth
Source: CDC RHS Surveys and Relationships between Abortion and Contraception in Republics of the former Soviet Union by H.I. Goldberg and F. Serbanescu (August 2001).
Data ending five years before survey.

ANE/E&E SOTA October 2002
Unmet Need for Family Planning Services (Modern Methods) in E&E Region
23
27 28 2931 31
37
0
10
20
30
40
50
MD GE RU RO CZ AZ UA
Perc
ent
Unm
et
Need
Source: DHS or RHS, data from most recent survey, 1993-2000, or PRB 2001 Population Data Sheet if DHS/RHS data not available.

ANE/E&E SOTA October 2002
Maternal and Child Health Sector

ANE/E&E SOTA October 2002
Infant Mortality in ANE Region, 1990-2002
0
20
40
60
80
100
120
140
160
Infa
nt
dea
ths
per
1,0
00 l
ive
bir
ths 1990
2002
Source: US Bureau of the Census, International Database, 2002. Uttar Pradesh data from DHS 1992-93 and 1998-99.
* No current USAID PHN funding
World Summit Goal (2000)=50

ANE/E&E SOTA October 2002
Infant Mortality in E&E Region, 1990-2000
5
17 18
2732
3641
49
61 62
74 74
0
20
40
60
80
100
CZ UA RU MD RO AM GE UZ KG KZ TM AZ
Death
s per
1,0
00 liv
e b
irth
s
Source: DHS or RHS, data from most recent survey, 1990-2001. UNICEF, State of the World’s Children 2002, 2000 data for CZ, MD, RU, and UA.

ANE/E&E SOTA October 2002
Estimated 2007 plan** 74
APP 99 baseline average 60
BUCEN average* 1997 73
APP 99 plan average 1999 56
Source: US BUCEN International Database* Country (unweighted average)** 2007 Plan from APP 2000*** When 1990 data were unavailable, the closest available year was used.
Bangladesh***
Cambodia
Egypt
Gaza Strip
India***
Indonesia
Israel
Jordan
Lebanon
Mongolia
Morocco
Nepal
Philippines
Sri Lanka
West Bank
050100150200
= reduction in rate1990 1997
1997 1990
= increase in rate
KEY
Under-5 mortality rateUSAID-assisted countries-progress towards benchmarksAsia/Near EastBars reflect change under-5 mortality rates, 1990-1997
ANE/E&E SOTA October 2002
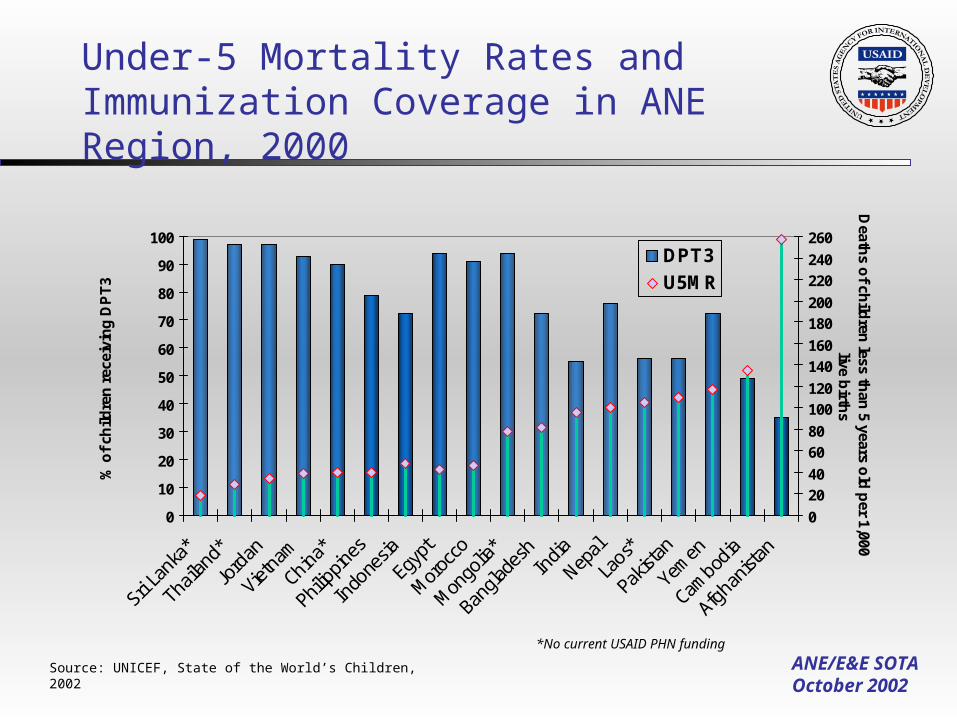
Under-5 Mortality Rates and Immunization Coverage in ANE Region, 2000
0
10
20
30
40
50
60
70
80
90
100
Sri L
anka
*
Thail
and*
Jord
an
Vietna
m
China
*
Philip
pines
Indo
nesia
Egyp
t
Moroc
co
Mongo
lia*
Bang
lades
hIn
diaNep
al
Laos
*
Pakis
tan
Yemen
Cambo
dia
Afgh
anist
an
% o
f ch
ildre
n r
ecei
vin
g D
PT
3
0
2040
6080
100120
140160
180200
220240
260
Death
s of ch
ildren
less than
5 years old
per 1,000
live birth
s
DPT3
U5MR
*No current USAID PHN funding
Source: UNICEF, State of the World’s Children, 2002

ANE/E&E SOTA October 2002
Immunization Coverage in Selected E&E Countries
63.5%94%Tajikistan
98.2%98.2%Kyrgyzstan
61.4%97.7%Georgia
63.4%87.5%Armenia
72%94.7%Azerbaijan
DPT3 Coverage-Surveys by 12 Months of Age
DPT3 Coverage – Official Figures by
Child*
Country
Source: Azzam, H. “GAVI and the Europe and Eurasia Region.” USAID, October 2000. Data for Azerbaijan, Armenia, Georgia and Kyrgyzstan from UNICEF/WHO Joint Report Form on Vaccine-Preventable Diseases.*Official national immunization rates are per child and not by 12 months of age as is the international standard of reporting.In Azerbaijan, the government just adopted the 72% figure of the EPI survey, the only one to do so.Georgia data collected for immunization between the age of 0-27 months. UNICEF’s data for the same period of time indicate 80.5% coverage.Tajikistan’s official data is for 1998.
ANE/E&E SOTA October 2002
IRELAND
UNITEDKINGDOM
NORWAY
SWEDEN
U.K.Dublin
BELGIUM
NETHERLANDSDENMARK
GERMANY
FINLAND
POLANDCZECHREPUBLIC
SLOVAKREPUBLIC
HUNGARY
RUSSIA
YUGO
AUSTRIA
LATVIALITHUANIA
BELARUS
MOLDOVAROMANIA
BULGARIA UKRAINE
BlackSea
GEORGIAARMENIA
CaspianSea
TURKEY
SYRIA
AZERBAIJAN
Jordan
IRAQ
IRAN
KUWAIT
PersianGulf
SAUDIARABIA
AFGHANISTAN
TURKMENISTAN
UZBEKISTAN
KYRGYZSTAN
TAJIKISTAN
AralSea
KAZAKHSTAN
RUSSIA
ESTONIA
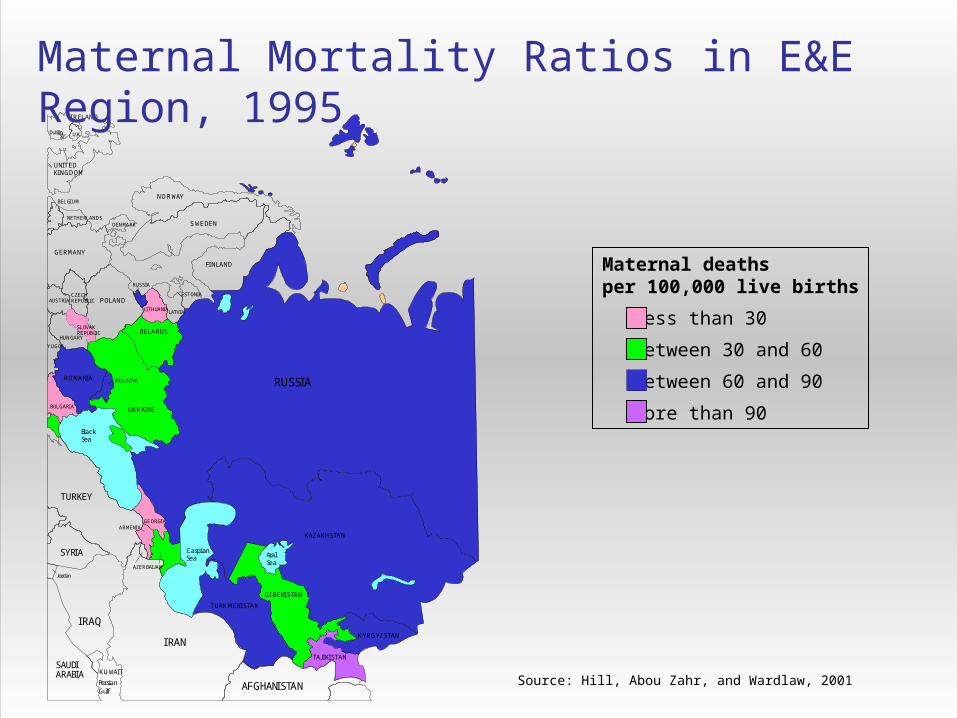
Maternal deaths per 100,000 live births
Less than 30
Between 30 and 60
Between 60 and 90
More than 90
Source: Hill, Abou Zahr, and Wardlaw, 2001
Maternal Mortality Ratios in E&E Region, 1995

ANE/E&E SOTA October 2002
HIV/AIDS Sector

ANE/E&E SOTA October 2002
Adult HIV Prevalence in ANE Region, 2001
Source: UNAIDS, July 2002 and the National AIDS Control Organization
India0.8%
Maharashtra>2%
Andhra Pradesh>2%
Tamil Nadu1-2%
Karnataka1-2%
Manipur1-2%
Myanmar1.99%
Cambodia2.7%
Thailand 1.8%

ANE/E&E SOTA October 2002
OshYange Yul
Temirtau
Almaty
Country Boundary
Major Road
Narcotics Traffic
Capital City
Other Major City
Source: Synergy, 2001.
HIV/AIDS and Drug Trafficking Routes in Central Asia
ANE/E&E SOTA October 2002
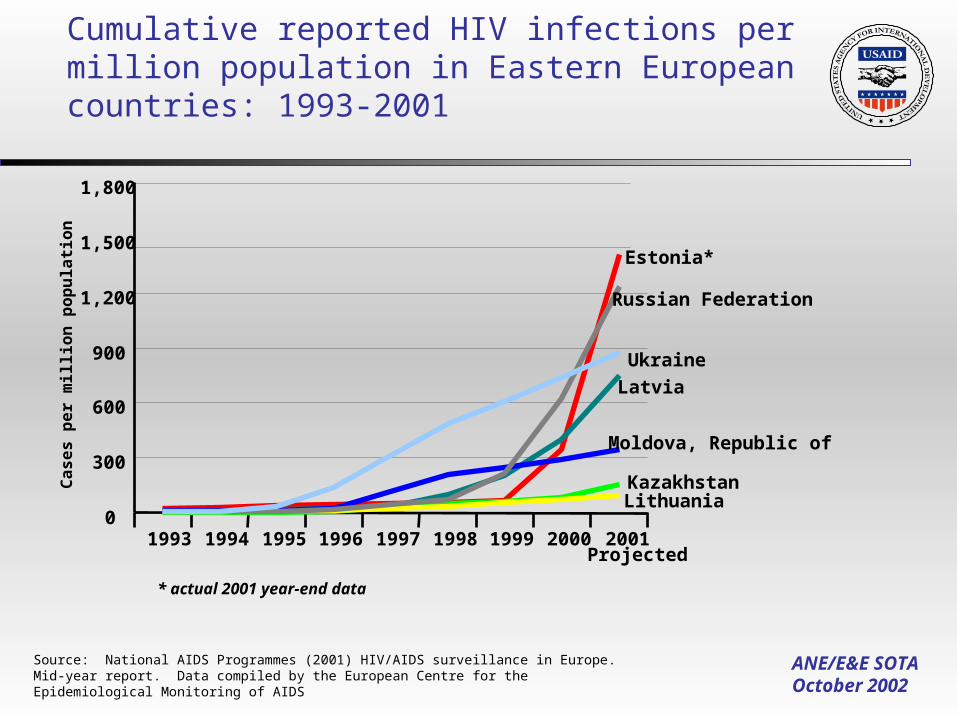
Cumulative reported HIV infections per million population in Eastern European countries: 1993-2001
Estonia*
Kazakhstan
Latvia
Lithuania
Moldova, Republic of
Russian Federation
Ukraine
0
300
600
900
1,200
1,500
1,800
1993 1994 1995 1996 1997 1998 1999 2000 2001Projected
Cases p
er
million
pop
ula
tion
* actual 2001 year-end data
Source: National AIDS Programmes (2001) HIV/AIDS surveillance in Europe. Mid-year report. Data compiled by the European Centre for the Epidemiological Monitoring of AIDS
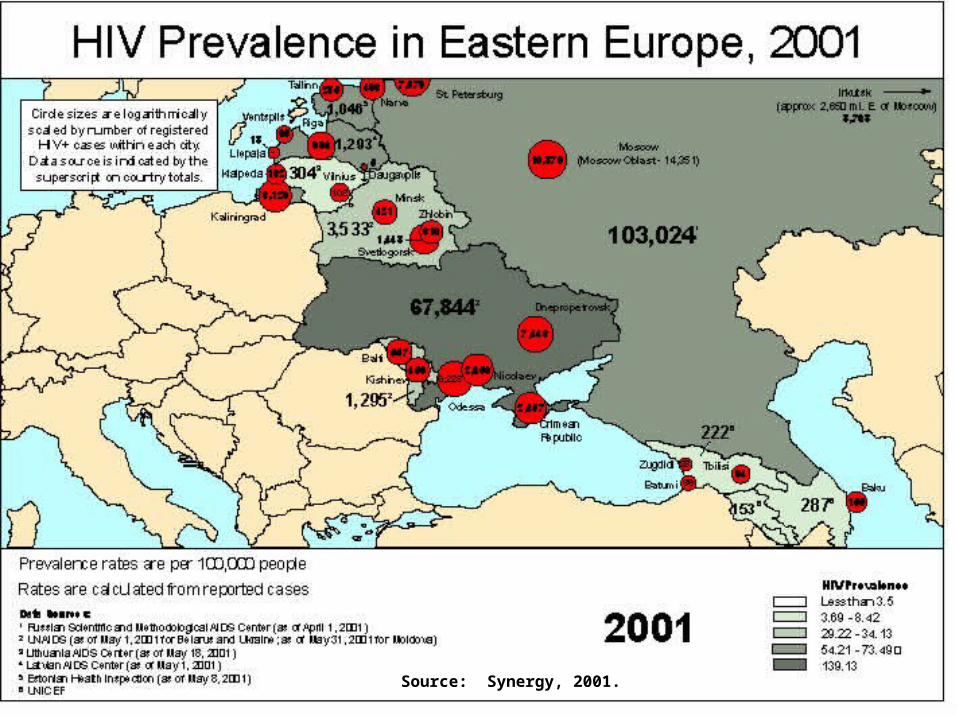
ANE/E&E SOTA October 2002Source: Synergy, 2001.

ANE/E&E SOTA October 2002Source: Synergy, 2001.
DRAFT

ANE/E&E SOTA October 2002
HIV Prevalence Rate and Adults Living with HIV/AIDS in E&E Region, 2001
Ukraine25%
Belarus1%
Poland1%
Other EE&CA Countries
4%
Russia69%
Source: UNAIDS, July 2002.
Country HIV Prevalence Rate
Estonia 1.0
Ukraine 1.0
Russia 0.9
Latvia 0.4
Belarus 0.3
Armenia 0.2
Moldova 0.2
Hungary 0.1
Kazakhstan 0.1
Lithuania 0.1
Poland 0.1
Eastern Europe & Central Asia
0.5
Percent Adults Living with HIV/AIDS in Eastern and Central
Asia
Total Adults Living with HIV/AIDS : 1,000,000

ANE/E&E SOTA October 2002
Infectious Diseases Sector

ANE/E&E SOTA October 2002
Causes of Death in ANE Region, 2000
0
2
4
6
8
10
12
14
Eastern Mediterranean Southeast Asia Western Pacific
To
tal d
eath
s (m
illio
ns)
Infectious/parasiticdiseases
Chronic diseases
Other
WHO regions
Source: WHO World Health Report, 2001

ANE/E&E SOTA October 2002
Infectious Disease Deaths in ANE Region, 2000
Malaria1%
Diarrheal disease16%
Acute respiratory infection
32%
Vaccine-preventable
childhood diseases7%
HIV/ AIDS6%
All others22%
Tuberculosis16%
Source: WHO World Health Report, 2001

ANE/E&E SOTA October 2002
Estimated New Tuberculosis Cases in ANE Region, 2000
Rest of World: 42%
China: 16%
Other High-burden ANE
Countries: 21%
India: 21%
Source: WHO Global Tuberculosis Report, 2002

ANE/E&E SOTA October 2002
Tuberculosis Incidence in ANE Region, 2000
140175184189
242
572
330 321280
0
100
200
300
400
500
600
700
Cambodia
Philippin
es
Afghanis
tan
Indones
ia
Bangla
desh
Vietn
amIn
dia
Pakis
tan
Thailand*
TB
cas
es p
er 1
00,0
00 p
op
ula
tio
n
Source: WHO Global Tuberculosis Report, 2002
* No current USAID PHN funding

ANE/E&E SOTA October 2002
Malaria Cases in ANE Region, 1999/2000
Source: WHO, Roll Back Malaria Web site, Country Profiles
Country Number of Malaria Cases 1999/2000
Afghanistan 395,581
Bangladesh 60,396
Cambodia 62,439
China 18,620
India 1,910,000
Laos 40,006
Myanmar 124,630
Nepal 7,616
Pakistan 82,526
Philippines 36,596
Sri Lanka 210,039
Thailand 91,703
Vietnam 74,316

ANE/E&E SOTA October 2002
Emerging Issues
ANE/E&E SOTA October 2002
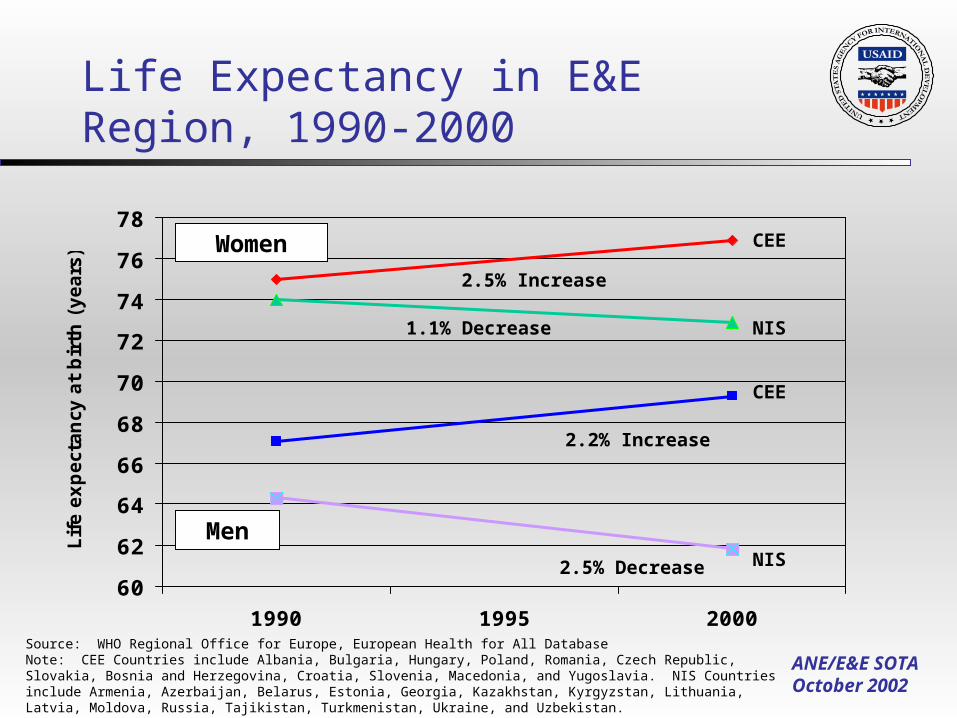
Life Expectancy in E&E Region, 1990-2000
60
62
64
66
68
70
72
74
76
78
1990 1995 2000
Life e
xpect
ancy
at
bir
th (
years
)
2.5% Increase
2.5% Decrease
Source: WHO Regional Office for Europe, European Health for All Database Note: CEE Countries include Albania, Bulgaria, Hungary, Poland, Romania, Czech Republic, Slovakia, Bosnia and Herzegovina, Croatia, Slovenia, Macedonia, and Yugoslavia. NIS Countries include Armenia, Azerbaijan, Belarus, Estonia, Georgia, Kazakhstan, Kyrgyzstan, Lithuania, Latvia, Moldova, Russia, Tajikistan, Turkmenistan, Ukraine, and Uzbekistan.
Men
Women CEE
NIS
CEE
NIS
2.2% Increase
1.1% Decrease

ANE/E&E SOTA October 2002
Distribution of Chronic Disease Deaths in E&E Region, 2000
Ischaemic heart disease35%
Other diseases3%
Respiratory disease4%
Cerebrovascular disease22%
Other cardiovascular disease13%
Digestive and genitourinary
disease5%
Cancers18%
Source: WHO World Health Report, 2001

ANE/E&E SOTA October 2002
Trends in Cigarette Consumption in E&E Region, 1990s
0
500
1000
1500
2000
2500
3000
1990 1997
An
nu
al p
er c
apit
a ci
gar
ette
co
nsu
mp
tio
n
(N
o. c
igar
ette
sti
cks)
Belarus
Bulgaria
Kazakhstan
Romania
Russia
Turkey
Note: Turkey data is for 1998.
Source: The American Cancer Society, Inc. Tobacco Control Country Profiles, 2000.