ANDRITZ financial annual report 2009€¦ · June 2001 2002 2003 2004 2005 2006 2007 2008 2009 ATX...
119
HYDRO PULP PAPER METALS ENVIRONMENT PROCESS FEED BIOFUEL Stormy times Stable base 2009 Annual financial report
Transcript of ANDRITZ financial annual report 2009€¦ · June 2001 2002 2003 2004 2005 2006 2007 2008 2009 ATX...

HYDRO
PULP
PAPER
METALS
ENVIRONMENT
PROCESS
FEED
BIOFUEL
Stormy times
Stable base
2009
Annual financial report

Key figures of the ANDRITZ GROUP 2005-2009
Development of the ANDRITZ share since the IPO
A
1,000%
800%
600%
400%
200%
100%
Relative share price performance of the ANDRITZ share versus the ATX since the IPO
ANDRITZ
B
C
June 2001 2002 2003 2004 2005 2006 2007 2008 2009
ATX
June 2001: Initial Public Offering at 5.25 Euros per share
A
June 2003: Secondary Public Offering at 5.69 Euros per share
B
Share price at year-end 2009:40.25 Euros per share
C
1) Earnings Before Interest, Taxes, Depreciation, and Amortization 2) Earnings Before Interest, Taxes, Amortization of identifiable assets acquired in a business combination and recognized separately from goodwill at the amount of 9,109 TEUR (2008: 7,862 TEUR) and impairment of goodwill at the amount of 7,922 TEUR (2008: 6,783 TEUR) 3) Additions to intangible assets and property, plant, and equipment 4) Total shareholders’ equity incl. non-controlling interests 5) Total shareholders’ equity/totalassets 6) Cash and cash equivalents plus marketable securities plus fair value of interest rate swaps minus financial liabilities 7) Interest bearing liabilities incl. provisions for severance payments, pensions, and jubilee payments minus cash and cash equivalents and marketable securities 8) Non-current receivables plus current assets (excl. cash and cash equivalents as well as marketable securities) minus other non-current liabilities and current liabilities (excl. financial liabilities and provisions) 9) Net working capital plus intangible assets and property, plant, and equipment 10) Net debt/total shareholders’ equity 11) ROE (Return On Equity): Net income/total shareholders’ equity 12) EV (Enterprise Value): market capitalization based on year-end closing price minus net liquidity
(According to IFRS) Unit 2009 2008 2007 2006 2005
Order intake MEUR 3,349.3 3,705.3 3,749.5 2,891.0 1,974.6
Order backlog as of December 31 MEUR 4,434.5 4,277.4 3,843.3 3,397.1 1,695.6
Sales MEUR 3,197.5 3,609.8 3,282.5 2,709.7 1,744.3
EBITDA1) MEUR 218.2 278.2 250.7 197.7 130.9
EBITA2) (excl. restructuring expenses) MEUR 193.1 246.8 209.7 166.2 107.0
EBITA (incl. restructuring expenses) MEUR 164.1 233.2 209.7 166.2 107.0
Earnings Before Interest and Taxes (EBIT) MEUR 147.1 218.5 200.9 163.3 106.7
Earnings Before Taxes (EBT) MEUR 149.6 210.5 200.8 165.3 110.0
Net income (incl. non-controlling interests) MEUR 102.9 147.0 137.8 121.1 80.2
Cash flow from operating activities MEUR 345.7 255.0 33.1 143.1 237.3
Capital expenditure3) MEUR 70.5 69.7 57.0 45.7 26.7
Employees as of December 31 (excl. apprentices) - 13,049 13,707 12,016 10,215 5,943
Fixed assets MEUR 731.4 732.1 632.3 608.6 308.0
Current assets MEUR 2,577.9 2,354.2 1,877.1 1,777.5 1,083.3
Total shareholders' equity4) MEUR 663.5 577.4 481.6 414.5 328.8
Provisions MEUR 529.9 477.3 402.4 386.1 189.8
Other liabilities MEUR 2,115.9 2,031.6 1,625.4 1,585.5 872.7
Total assets MEUR 3,309.3 3,086.3 2,509.4 2,386.1 1,391.3
Equity ratio5) % 20.0 18.7 19.2 17.4 23.6
Net liquidity6) MEUR 677.9 408.9 246.5 365.7 383.9
Net debt7) MEUR -505.3 -242.9 -94.8 -216.9 -316.4
Net working capital8) MEUR -104.3 22.7 99.1 -93.6 -128.2
Capital employed9) MEUR 285.9 406.8 405.6 194.5 21.1
Gearing10) % -76.2 -42.1 -19.7 -52.3 -116.8
EBITDA margin % 6.8 7.7 7.6 7.3 7.5
EBITA margin (excl. restructuring expenses) % 6.0 6.8 6.4 6.1 6.1
EBITA margin (incl. restructuring expenses) % 5.1 6.5 6.4 6.1 6.1
EBIT margin % 4.6 6.1 6.1 6.0 6.1
Net income/sales % 3.2 4.1 4.2 4.5 4.6
ROE11) % 15.5 25.5 28.6 29.2 24.3
EV12)/EBITDA MEUR 6.5 1.9 7.6 9.1 6.3
Depreciation and amortization/sales % 2.0 1.5 1.4 1.3 1.4
Impairment resp. amortization goodwill/sales % 0.2 0.2 0.1 0.0 0.0

Key figures of the business areas 2005-2009
Unit 2009 2008 2007 2006 2005
Order intake MEUR 1,693.9 1,543.4 1,216.1 585.4 71.5
Order backlog as of December 31 MEUR 2,894.5 2,590.1 1,954.9 1,659.5 60.5
Sales MEUR 1,378.0 1,205.9 910.0 467.9 52.7
EBITDA MEUR 120.9 105.7 66.3 35.7 4.8
EBITDA margin % 8.8% 8.8% 7.3% 7.6% 9.1%
EBITA MEUR 100.5 87.9 52.2 27.6 2.6
EBITA margin % 7.3% 7.3% 5.7% 5.9% 4.9%
Capital expenditure MEUR 44.5 35.0 25.4 13.5 3.4
Employees as of December 31 - 5,993 5,606 4,390 3,678 474
HYDRO
Unit 2009 2008 2007 2006 2005
Order intake MEUR 923.0 1,033.8 1,406.4 1,432.4 1,017.0
Order backlog as of December 31 MEUR 778.7 752.8 1,060.4 1,124.4 950.4
Sales MEUR 903.3 1,326.6 1,462.2 1,304.2 1,032.9
EBITDA MEUR 42.0 84.5 105.3 89.6 76.1
EBITDA margin % 4.6% 6.4% 7.2% 6.9% 7.4%
EBITA MEUR 17.5 66.3 87.8 75.9 63.6
EBITA margin % 1.9% 5.0% 6.0% 5.8% 6.2%
Capital expenditure MEUR 14.9 20.2 21.8 21.7 13.6
Employees as of December 31 - 4,239 5,102 4,843 3,863 3,018
PULP & PAPER
Unit 2009 2008 2007 2006 2005
Order intake MEUR 296.2 611.5 636.4 401.9 444.8
Order backlog as of December 31 MEUR 564.1 736.2 631.5 403.7 458.9
Sales MEUR 473.4 566.2 408.0 450.5 275.9
EBITDA MEUR 23.2 42.6 33.1 33.4 18.2
EBITDA margin % 4.9% 7.5% 8.1% 7.4% 6.6%
EBITA MEUR 20.5 40.1 30.6 31.1 15.9
EBITA margin % 4.3% 7.1% 7.5% 6.9% 5.8%
Capital expenditure MEUR 2.0 4.3 3.2 2.3 2.2
Employees as of December 31 - 971 996 880 819 749
METALS
Unit 2009 2008 2007 2006 2005
Order intake MEUR 305.4 361.2 346.9 344.2 340.1
Order backlog as of December 31 MEUR 139.6 151.8 161.1 179.3 202.2
Sales MEUR 322.6 366.6 364.4 366.5 289.2
EBITDA MEUR 29.3 32.1 30.8 25.9 22.0
EBITDA margin % 9.1% 8.8% 8.5% 7.1% 7.6%
EBITA MEUR 24.6 27.3 25.7 20.9 17.7
EBITA margin % 7.6% 7.4% 7.1% 5.7% 6.1%
Capital expenditure MEUR 5.7 7.4 4.9 6.5 6.6
Employees as of December 31 - 1,329 1,437 1,349 1,324 1,213
ENVIRONMENT & PROCESS
Unit 2009 2008 2007 2006 2005
Order intake MEUR 130.8 155.4 143.7 127.1 101.2
Order backlog as of December 31 MEUR 57.6 46.5 35.3 30.2 23.6
Sales MEUR 120.2 144.5 137.8 120.6 93.6
EBITDA MEUR 2.8 13.3 15.2 12.9 9.8
EBITDA margin % 2.3% 9.2% 11.0% 10.7% 10.5%
EBITA MEUR 1.0 11.6 13.4 10.6 7.2
EBITA margin % 0.8% 8.0% 9.7% 8.8% 7.7%
Capital expenditure MEUR 3.4 2.9 1.7 1.7 0.9
Employees as of December 31 - 517 566 553 531 489
FEED & BIOFUEL

STATUS REPORT 03
CORPORATE GOVERNANCE REPORT 13
CORPORATE RISKS 17
REPORT OF THE SUPERVISORY BOARD 21
STATEMENT BY THE EXECUTIVE BOARD 22
CONSOLIDATED FINANCIAL STATEMENTS2009 OF THE ANDRITZ GROUP 23Auditor’s report 24Consolidated balance sheet 26Consolidated income statement 27Consolidated statement of comprehensive income 28Consolidated statement of shareholders’ equity 29Consolidated cash flow statement 30Notes to the consolidated financial statements 31

03
While the global economy was negatively impacted by the economic and financial crisis in the first half of 2009, the economic environment stabilized again in the second half of the year in the main economic regions of the world.
In the USA, the economy recovered slightly as from the third quarter of 2009, following a very difficult first half of the year. Industrial production and, in particular, consumer spending, which is the main contributor to the US gross domestic product, developed favorably, mainly due to the government’s incentive program for the purchase of new fuel-efficient vehicles (‘Cash for Clunkers program’). The real estate market also showed the first signs of improvement. Nevertheless, the labor market remained in a difficult situation with over 10% unemployment.
In Europe, economic development was similar, although the economic recovery in the second half of the year was considerably more modest than in the USA in most of the member countries due to subdued consumer spending. Only highly export-oriented countries, such as Germany, showed significant recovery as a result of the economic revival in the emerging countries.
In Asia and in the other large emerging countries, the global economic crisis had significantly less impact than in the USA or Europe. After a decline in the first quarter of 2009, the Chinese economy recovered quickly, mainly supported by the stimulus program to revive the economy launched by the Chinese government, but also by the rising export figures. Similarly, the emerging countries in South America showed a substantial economic recovery in the second half of 2009.
Source: OECD
Changes in consolidated companies/acquisitionsThe following companies were not, or only partially, included in the ANDRITZ GROUP’s consolidated financial statements for the 2008 business year: Maerz Industrieofenanlagen GmbH: heat treatment plants and melting furnaces. Certain assets of GE (General Electric Company) Energy: hydropower technology. GEHI (majority interest in the General Electric Hydro Inepar joint venture): hydropower technology. Kufferath: Service company for the pulp and paper industry.
The following company was included for the first time in the consolidated financial statement of the ANDRITZ GROUP in 2009: Rollteck: Design and manufacture of winders for the paper industry.
The initial accounting for the companies/businesses acquired in 2008 and 2009 was based on preliminary figures.
SalesSales of the ANDRITZ GROUP amounted to 3,197.5 MEUR in the 2009 business year, thus 11.4% below the record figure for the previous year (2008: 3,609.8 MEUR). While the HYDRO business area achieved a significant increase in sales, sales in the other business areas declined – particularly in PULP & PAPER – compared to the previous year.
South America: 11 (11)
Asia (excl. China): 14 (10)
North America: 16 (14)Europe: 45 (48)
Others: 4 (6)
China: 10 (11)
Sales by region2009 (2008) in %
ENVIRONMENT & PROCESS: 10 (10)
METALS: 15 (16)
PULP & PAPER: 28 (37)
FEED & BIOFUEL: 4 (4)
Sales by business area 2009 (2008) in %
HYDRO: 43 (33)
GENERAL ECONOMIC
CONDITIONS
Status report
BUSINESS DEVELOPMENT
Annual financial report 2009 | Status report
04
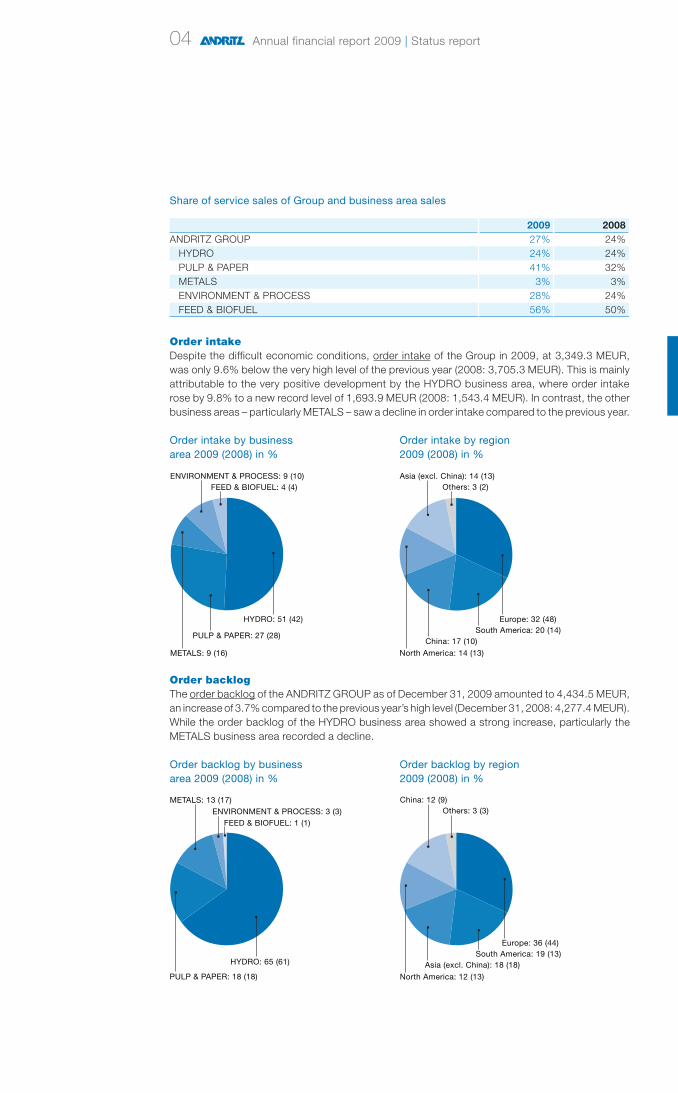
Share of service sales of Group and business area sales
2009 2008ANDRITZ GROUP 27% 24% HYDRO 24% 24% PULP & PAPER 41% 32% METALS 3% 3% ENVIRONMENT & PROCESS 28% 24% FEED & BIOFUEL 56% 50%
Order intakeDespite the difficult economic conditions, order intake of the Group in 2009, at 3,349.3 MEUR, was only 9.6% below the very high level of the previous year (2008: 3,705.3 MEUR). This is mainly attributable to the very positive development by the HYDRO business area, where order intake rose by 9.8% to a new record level of 1,693.9 MEUR (2008: 1,543.4 MEUR). In contrast, the other business areas – particularly METALS – saw a decline in order intake compared to the previous year.
ENVIRONMENT & PROCESS: 9 (10)
METALS: 9 (16)
PULP & PAPER: 27 (28)
HYDRO: 51 (42)
FEED & BIOFUEL: 4 (4)
Order intake by business area 2009 (2008) in %
North America: 14 (13)
China: 17 (10)South America: 20 (14)
Europe: 32 (48)
Others: 3 (2)Asia (excl. China): 14 (13)
Order intake by region 2009 (2008) in %
Order backlogThe order backlog of the ANDRITZ GROUP as of December 31, 2009 amounted to 4,434.5 MEUR, an increase of 3.7% compared to the previous year’s high level (December 31, 2008: 4,277.4 MEUR). While the order backlog of the HYDRO business area showed a strong increase, particularly the METALS business area recorded a decline.
ENVIRONMENT & PROCESS: 3 (3)METALS: 13 (17)
PULP & PAPER: 18 (18)
HYDRO: 65 (61)
FEED & BIOFUEL: 1 (1)
Order backlog by business area 2009 (2008) in %
Order backlog by region2009 (2008) in %
North America: 12 (13)
Asia (excl. China): 18 (18)South America: 19 (13)
Europe: 36 (44)
Others: 3 (3)China: 12 (9)
Annual financial report 2009 | Status report

05
ResultThe EBITA of the Group amounted to 164.1 MEUR in the period under review, significantly below the reference figure for the previous year (2008: 233.2 MEUR). Profitability (EBITA margin) amounted to 5.1% (2008: 6.5%).
This decrease is largely due to expenses for capacity adjustments and operational restructuring – particularly in the PULP & PAPER business area – that were necessary due to the overall economic situation and amounted to approximately 29 MEUR, as well as to the decline in sales. Excluding these one-off expenses, the EBITA in 2009 amounts to 193.1 MEUR, equivalent to an EBITA mar-gin of 6.0%. The adjustments and restructuring measures are expected to yield significant cost savings in the future that should have a positive impact on the operating results for 2010 and the years that follow.
In the reporting period, goodwill impairments of 7.9 MEUR (2008: 6.8 MEUR) were recognized, mainly attributable to the PULP & PAPER business area.
The financial result of the ANDRITZ GROUP amounted to 2.6 MEUR, thus well above the previous year’s figure (2008: -8.1 MEUR). This is largely due to price gains of sold money market funds, which had to be value adjusted in 2008 due to the global financial crisis.
The tax rate was 31.2% in the reporting period (2008: 30.1%).
The net income of the Group excluding non-controlling interests amounted to 96.8 MEUR in the reporting period (2008: 139.7 MEUR).
Financial key figures
Unit 2009 2008 +/-Sales MEUR 3,197.5 3,609.8 -11.4%Return on sales1) % 4.6 6.1 –EBITDA MEUR 218.2 278.2 -21.6%Earnings before interest and taxes (EBIT) MEUR 147.1 218.5 -32.7%Earnings before taxes (EBT) MEUR 149.6 210.5 -28.9%Net income MEUR 102.9 147.0 -30.0%1) EBIT (Earnings Before Interest and Taxes)/Sales
Total assetsThe total assets of the ANDRITZ GROUP as of December 31, 2009 increased to 3,309.3 MEUR (December 31, 2008: 3,086.3 MEUR). The equity ratio as of December 31, 2009 amounted to 20.0% (December 31, 2008: 18.7%).
Liquid funds (cash and cash equivalents plus marketable securities) amounted to 1,082.1 MEUR as of December 31, 2009 (December 31, 2008: 821.8 MEUR). The net liquidity (liquid funds plus fair value of interest rate swaps minus financial liabilities) increased to 677.9 MEUR, thus well above the value at the end of last year (December 31, 2008: 408.9 MEUR).
Key balance sheet ratios
Unit 2009 2008Equity ratio1) % 20.0 18.7Return on equity2) % 22.5 36.5Return on investment3) % 4.4 7.1Net liquidity4) MEUR 677.9 408.9Net debt5) MEUR -505.3 -242.9Net working capital6) MEUR -104.3 22.7Capital employed7) MEUR 285.9 406.8Gearing8) % -76.2 -42.11) Total shareholders’ equity/Total assets 2) EBT (Earnings Before Taxes)/Total shareholders’ equity 3) EBIT (Earnings Be-fore Interest and Taxes)/Total assets 4) Cash and cash equivalents plus marketable securities plus fair value of interest rate swaps minus financial liabilities 5) Interest bearing liabilities incl. provisions for severance payments, pensions, and jubilee payments minus cash and cash equivalents and marketable securities 6) Non-current receivables plus current assets (excl. cash and cash equivalents as well as marketable securities) minus other non-current liabilities and current liabilities (excl. financial liabilities and provisions) 7) Net working capital plus intangible assets and property, plant, and equipment 8) Net debt/Total shareholders’ equity
Annual financial report 2009 | Status report

06
Assets
Long-term assets: 23%
Short-termassets: 44%
Cash and cash equivalents,and marketable securities: 33%
769.2 MEUR
1,458.0MEUR
1,082.1 MEUR
Shareholders’ equity and liabilities
Shareholders’ equityincl. Minority interests: 20%
Financialliabilities:13%
Otherlong-termliabilities:10%
Othershort-termliabilities: 57%
425.7 MEUR
323.1 MEUR
663.5 MEUR
1,897.0 MEUR
Capex and cash flowThe Group’s investments in tangible and intangible assets amounted to 70.5 MEUR (2008: 69.7 MEUR) in 2009. Capital expenditure mainly focused on workshop modernizations.
The cash flow from operating activities amounted to 345.7 MEUR and was thus significantly higher than the previous year’s value (2008: 255.0 MEUR).
Key cash flow ratios
Unit 2009 2008Cash flow from operating activities MEUR 345.7 255.0Capital expenditure1) MEUR 70.5 69.7Free cash flow2) MEUR 285.6 187.5Free cash flow per share3) EUR 5.5 3.61) Additions to intangible assets and property, plant, and equipment 2) Cash flow from operating activities minus capital expenditure plus payments from the sale of intangible assets and property, plant, and equipment 3) Free cash flow/Total number of ANDRITZ shares
ANDRITZ has a Group-wide risk management system whose goal is to identify nascent risks and to take countermeasures. This is an important element in the active risk management within the Group.
Main characteristics of the internal controlling and risk management system for the invoicing processThe Executive Board is responsible for implementing a suitable internal controlling and risk man-agement system for the invoicing process and financial reporting. For this purpose, the Executive Board has agreed on binding regulations and guidelines to be applied throughout the Group for the main business risks and in the financial reporting process.
The accounting department, which includes financial accounting, reports directly to the Executive Board. Suitable organizational arrangements ensure that the legal requirements to make complete, correct, timely, and orderly entries in the books and other records are met. The entire process from procurement to payment is subject to strict rules and guidelines that are intended to avoid any risks these processes may entail. These measures and rules include separation of functions, signature authorization matrices, and signatory powers for authorizing payments applying on a collective basis only and restricted to a small number of employees, as well as system-supported checks by the software in use (SAP).
By using a standardized, Group-wide financial reporting system, together with ad hoc reporting on major events, the Executive Board is informed constantly on all relevant issues. The Supervisory Board is informed in Supervisory Board meetings held at least once every quarter on the current business development, including operative planning and the medium-term strategy of the Group, with direct and immediate information being provided to the Supervisory Board in special cases. Internal control and risk management are among the topics dealt with in audit committee meetings.
Internal auditing, set up as a management administrative department, audits individual processes or Group companies according to an audit plan defined for each year.
Annual financial report 2009 | Status report
RISK MANAGEMENT

07
Financial risksMonitoring and management of financial risks are integral parts of the accounting and controlling activities within the ANDRITZ GROUP. Continuous controlling and regular reporting are intended to increase the likelihood of identifying major risks at an early stage and allow countermeasures to be taken if necessary. Still, there is no guarantee that the monitoring and risk control systems are sufficiently effective.
The essential risks for the business development of the ANDRITZ GROUP in 2010 relate above all to the Group’s dependence on the general economic development and on development of the industries it serves, to whether major orders are received and to the risks they entail, and to whether adequate sales proceeds are realized from the high order backlog. The persistent financial crisis and substantial economic slowdown in the main economic regions of the world also constitute a serious risk for the ANDRITZ GROUP’s financial development during the 2010 business year. The global economic weakness may lead to further delays in the execution of existing orders and to the postponement or cancellation of projects. Cancellations of existing contracts could adversely affect the ANDRITZ GROUP’s order backlog, which would in turn have a negative impact on utilization of the Group’s manufacturing capacities.
The global financial and economic crisis may also necessitate complete or partial impairments of single goodwill created in the course of acquisitions if the business development goals cannot be reached. This may influence the earnings development of the ANDRITZ GROUP. In addition, there is always some risk that partial or full provisions will have to be made for some trade accounts receivable.
For the majority of orders, the risk of payment failure by customers is mitigated by means of bank guarantees and export insurance. Risks related to deliveries to countries with medium to high politi-cal risks typically are also insured to a large extent. Interest and exchange rate risks are minimized and controlled by derivative financial instruments, in particular forward exchange contracts and swaps. Net currency exposure of orders in foreign currencies (mainly US dollar, Euro, and Swiss franc) is hedged by forward contracts. Cash flow risks are monitored via monthly cash flow reports.
In order to further reduce the financial risks and to enhance monitoring, control, and assessment of its financial and liquidity position, the ANDRITZ GROUP has continuously improved its treasury guidelines and information system.
The ANDRITZ GROUP’s position in terms of liquidity is very good; the Group has sufficient liquid-ity reserves and secures access to liquidity. The Group avoids dependence on one single or only a few banks. To ensure independence, no bank will receive more than a certain defined amount of the business in any important product (cash and cash equivalents, financial liabilities, financial assets, guarantees, and derivatives).
Cash is largely invested in low-risk financial assets, such as government bonds, government-guaranteed bonds, investment funds to cover pension obligations, or term deposits. However, the financial market crisis and its effects have led to unfavorable price developments for various securities in which the Group has invested (e.g. money market funds, bonds), or made them non-tradeable. This could have an adverse effect on the ANDRITZ GROUP’s financial result or share-holders’ equity due to necessary depreciation or value adjustments. The crisis has also heightened the risk of default by some issuers of securities, as well as by customers.
Non-financial risksIn the manufacturing sector, precise planning, high commitment, and flexibility of employees are essential factors to ensure short lead times and on-time production. Internally, ANDRITZ uses flextime contracts and a large contingent of temporary workforce to cope with cyclical fluctuations and peaks in workload. In addition, the handling of outsourced business is improved continuously by efficient supplier management, and the pool of suppliers is constantly extended to include new, qualified companies.
Annual financial report 2009 | Status report

08
The ANDRITZ manufacturing strategy is based on in-house manufacture of core components and purchase of additional manufacturing services. This strategy makes it easier to deal with variations in capacity utilization and ensures optimum use of own manufacturing capacities. In accordance with this make-or-buy strategy, process-relevant key components for ANDRITZ plants and prod-ucts are mainly manufactured and assembled in the Group’s own workshops. Simple components, on the other hand, are largely purchased from qualified suppliers, who are subjected to regular quality checks and on-time performance monitoring.
In the Human Resources sector, interesting career opportunities, incentive plans, and focused management training programs are essential elements in attracting well-trained and highly quali-fied employees. High quality standards in the selection process guarantee that the most suitable candidates are recruited.
As part of succession planning, internal candidates for succession to key positions are identified on the basis of standardized performance and potential assessments in order to have candidates available in the short and medium-term to fill any posts becoming vacant.
Variations in capacity utilization can be compensated at Group level by allocating orders to certain sites worldwide and locally by using temporary workforce.
Impact of exchange rate fluctuationsFluctuations in exchange rates are hedged by forward rate contracts.
Non-financial performance indicatorsManufacturingWorkload declined in 2009 in the business areas affected by the global economic weakness, par-ticularly in the PULP & PAPER business area. Capacity adjustments were made at some manufac-turing sites. In contrast, the HYDRO business area saw an increase in workload, and manufacturing capacities were extended in Europe, Asia, and South America as a result of targeted investments. To minimize the risk of sustained underutilization of the Group’s manufacturing capacities, an optimized cyclicality management concept was implemented over the past few years to adapt the Group’s manufacturing units efficiently to deal with changes in general conditions and capacity utilization.
Investments focused on new manufacturing technologies, automation, capacity adjustments at bottlenecks, development of new capacities in the growth markets of India, China, and Brazil, and on systematic extension of the supply chain.
Human ResourcesAt the end of 2009, the ANDRITZ GROUP had a total of 13,049 employees (a decrease of 4.8% compared with December 31, 2008: 13,707 employees).
Employees by region as of December 31, 2009 (December 31, 2008) in %
China: 9 (9)
North America: 10 (12)Europe: 63 (64)
Others: 2 (1)
South America: 7 (7)Asia (excl. China): 9 (7)
Annual financial report 2009 | Status report
09
Human Resources Management is responsible for the coordination and planning of Human Resources activities throughout the Group. Its main targets are to fill vacancies in key positions and to offer attractive career and development opportunities for future managers.
Environmental protectionIn 2009, the ANDRITZ location in Graz, Austria once again received the Ökoprofit gold certificate awarded by the City of Graz for outstanding achievements in the field of environmental protection standards and measures. By implementing suitable measures, the amount of commercial waste was reduced by 32 t, which is a drop of almost 20% compared to 2008. In the business park, energy consumption for heating was reduced by 12,000 kWh/a by installing thermostatic valves. Thanks to an information campaign conducted throughout the site and suitable accompanying measures, consumption of compressed air and thus, production costs for compressed air were cut by one fifth compared to the previous year – in spite of rising energy costs. These two measures translate into reduced CO2 emissions of 20 t/a. Improvements of the pipework system led to a reduction of fresh water consumption by over 40%. 670 employees completed training courses on personal health and safety, safety at work, fire prevention, and environmental protection.
In 2009, the ANDRITZ GROUP invested approximately 49.2 MEUR in research and development activities (2008: 51.2 MEUR). Including contract-related developments, the total expenditure for new processes and products amounted to approximately 3% of sales. More than 300 employees work in the Group’s research centers in Austria, Finland, France, Switzerland, and the USA to de-velop new processes and equipment and to extend ANDRITZ’s technological leadership.
The business areas’ research and development programs in detail:HYDROA major focus of the business area’s research and development in 2009 was the optimization of hydraulic and electrical equipment for the worldwide highest performing bulb turbines and genera-tors running in large hydropower stations.
In addition, the business area is active in improving the smooth running properties of turbine run-ners, both at low partial load and at overload. Due to the know-how on the simulation of dynamic processes and practical experience with numerous maximum-capacity generators, substantial progress was made that was also put to the test successfully in practice.
In the large pumps sector, activities focused on project-related, further hydraulic development of existing runners and distributors. This resulted in significant improvements in efficiency and cavita-tion behavior. A new generation of process pumps was developed in standard centrifugal pumps and the medium-consistency pumps were optimized successfully.
PULP & PAPERA major focus of the PULP & PAPER business area’s research and development activities in 2009 was on supporting customers to achieve sustainable production with higher capacities as well as higher energy-efficiency. The business area is also developing new technologies to generate green energy and for the production of biofuels which will further reduce/minimize greenhouse gas emissions.
The enhancement of low-effluent and chemical recovery systems to lower environmental impact continued. Technology development in evaporation focused on producing highly efficient, effluent-minimizing evaporation systems. White liquor plant development is further reducing gaseous emis-sions and cleaning solid wastes to reduce their pollutant portion.
R&D activities in the area of fiberlines continued to concentrate on lowering the investment cost per ton of pulp produced, as well as further increasing the capacities to more than 5,000 t/d.
Electricity generation in pulp mills has become a very important issue for the entire pulping industry due to the rising energy costs. With ANDRITZ High Energy Recovery Boilers (HERB), pulp mills can maximize electricity generation from black liquor. Research and development focused mainly on the further enhancement of electricity output.
Annual financial report 2009 | Status report
RESEARCH & DEVELOPMENT

10
The business area’s R&D activities also continued to focus on new products for biomass handling and biomass power generation, especially on combustion and emission behaviors of different biomass feedstocks.
Waste-To-Power systems (WTP) is a newly created unit within ANDRITZ PULP & PAPER to develop technologies to produce energy out of paper mill residuals (mainly sludge and rejects from wastepaper recycling processes). The main benefits of WTP are derived from the reduced volume of waste going to landfills and an increase in the amount of energy generated by the mill.
The business area is also developing technologies for bioethanol production from non-food based raw materials such as wood and agricultural waste.
METALSResearch and development of the METALS business area concentrated on improvement and further development of products. A new roller seal was developed, for instance, for the stainless steel annealing furnace sector. This allows a very economical process management, particularly with the increasing demand nowadays for longer length furnaces.
In addition, the process for regeneration of used mixed acid from stainless steel pickles was op-timized. The target is a totally effluent-free pickling system and regeneration process by using an evaporator for the rinsing water.
A further focus concentrates on dezincification of new scrap produced in car manufacturing. Al-though this scrap is high-grade material, the zinc coating on the surface means that it can only be further processed at the expense of the quality, thus resulting in markdowns in price. In a process developed by ANDRITZ METALS, the scrap comes into contact with a liquid from zinc production. The zinc content in the liquid thus increases, and the enriched liquid is eventually delivered back to the zinc manufacturer. After cleaning and drying, the dezinctified scrap can be used for more sophisticated applications, for example in the foundry industry.
ENVIRONMENT & PROCESSThe research and development activities of the Separation Technologies division focused on value analysis programs for products. These can be used either to achieve a cost reduction of around 20% on customer projects or to enhance unit performance also by around one-fifth – with no in-crease in costs. A value analysis project, e.g., resulted in the development and patenting of a cylin-drical-conical screen bowl centrifuge that enables an increase in throughput of 20-30% compared to conventional cylindrical centrifuges – with virtually unchanged space and energy requirement.
The Thermal Processes division focused its research and development work on biomass, concen-trating primarily on increasing the value of biomass fuels and on the drying of biomass. Based on the positive experience gained with installed sawdust dryers, drying technology is now being extended to other biomass fractions, such as bark, rejects, or sludge from the pulp and paper industry. In addition, the through-air process used successfully in sawdust dryers and the alternative process arrangement with circulating air will be developed further; by using circulating air and heat recovery, a savings of up to 20% can be made in the thermal energy required.
Development work on a biological and physical-chemical process for treating exhaust air with the goal to reduce odor and TOC (total organic carbon) emissions from sludge drying plants continued successfully. Pilot tests showed that the non-thermal treatment processes available commercially cannot reliably guarantee the TOC content required by law in some countries. Thus, in borderline cases, the only alternative is to use exhaust air treatment processes with thermal post-combustion.
FEED & BIOFUELThe FEED & BIOFUEL business area – together with the ENVIRONMENT & PROCESS business area – continued focusing its R&D activities on programs to increase the value of biomass fuels.
Additionally, the business area implemented a new test line for biomass milling and pelletizing in order to conduct research and development work in the area of solid biofuel/renewable energy generation. The line will also be used for customer-specific trials to optimize process characteristics for new raw materials, as well as for operator training purposes.
Annual financial report 2009 | Status report
11
According to recent forecasts by leading economic experts, the economic situation in the relevant regions is expected to stabilize further over the next few months; however, a substantial economic recovery is not expected for 2010.
Based on the prevailing economic environment and the current project activity in the relevant mar-kets, the ANDRITZ GROUP’s expectations for its economic development in the coming quarters have not changed.
In the HYDRO business area, favorable development of project activity is also expected to continue in 2010. There are a number of projects in the realization phase, both in the modernization sector for existing hydropower plants and in construction of new hydropower stations. As a result of the high average age of the installed base, investment activity in Europe and North America will continue to focus on modernization, rehabilitation, and capacity increases for existing plants. Small power stations and pumped storage power stations should also continue to see a high level of project activity due to the necessity of securing grid stability.
In South America and Asia, many new hydropower projects are in the development and realization phases. The rapid economic growth in these regions and the increased utilization of renewable energy sources to cover the steeply rising demand for electric power are the main factors driving this market.
In the PULP & PAPER business area, the moderate project activity is expected to continue in 2010 – at least in the first half of the year. Although a number of projects have been announced for the construction of greenfield pulp mills – most of them based on existing plantations – and for the modernization of existing mills, delays are nevertheless expected for the award of new contracts and execution of recent orders due to the financial and economic crisis. However, only when the global pulping industry achieves a sustainable high utilization of capacities and the tight financial markets return to normal, a significant increase in project activity can be expected.
The METALS business area expects the low investment activity to continue in 2010, both in the carbon steel and stainless steel sectors. Many international steel manufacturers have cut their capital expenditure plans in view of the financial and economic crisis and due to the low capacity utilization resulting from the lack of demand. Nevertheless, selected projects are expected to be awarded in some regions, similar to 2009.
In the ENVIRONMENT & PROCESS business area, project activity for sludge dewatering equip-ment should develop satisfactorily in 2010. A slight rise in investment activity is also expected in the course of the year for industrial applications – for instance, in the petrochemical, food, and agricultural sectors. Some recovery can also be expected for municipal sludge drying plants dur-ing the year.
In the FEED & BIOFUEL business area, the animal feed sector should develop satisfactorily in 2010. In the aquatic feed and pet food areas, project activity is also expected to develop solidly. The market for wood and biomass pelleting equipment should continue its positive development that started in the fourth quarter of 2009.
On the basis of these expectations and the order backlog of more than 4.4 billion Euros at the end of 2009, the ANDRITZ GROUP expects sales in 2010 to remain unchanged or slightly up compared to the full year of 2009. Due to the cost reductions as a result of the restructuring measures initiated in 2009, the net income should be influenced positively. If, however, the global economy weakens again, a negative impact on the future sales and earnings developments of the ANDRITZ GROUP could be expected. As a consequence, there may be a further need for restructuring that will affect the 2010 earnings development accordingly.
Significant events after December 31, 2009The status of the global economy and the financial markets did not change substantially in the period between the date of the balance sheet and publication of this report.
Annual financial report 2009 | Status report
OUTLOOK

12
Disclosure according to Article 243a of the Austrian Business Code (Unternehm-ensgesetzbuch – UGB)The capital stock of ANDRITZ AG as of December 31, 2009 amounted to 104,000,000 Euros. As a result, the proportionate amount of the capital is 2.00 Euros per no-par value share.
There are no limitations concerning the voting rights or the transfer of shares. Approximately 29% of the shares are held by Certus Beteiligungs-GmbH, whose Managing Director is Wolfgang Leitner, President and Chief Executive Officer of ANDRITZ AG.
At present, there is no authorized capital. On March 27, 2008, the Annual General Meeting of Shareholders authorized the Executive Board to buy back up to 10% of the total of shares of ANDRITZ AG between October 1, 2008 and March 31, 2011. At the end of September 2008, the Executive Board of ANDRITZ AG decided to make use of this authorization and buy back shares between October 1, 2008 and March 31, 2011. There are no powers of the members of the Ex-ecutive Board, especially regarding the possibility to issue or buy back shares, that do not result directly from legal stipulations.
As far as is known to the company, there are no holders of shares with special controlling rights. Employees exercise their voting rights directly. Furthermore, there are no stipulations regarding the appointment and removal of the members of the Executive Board and the Supervisory Board and modifications of the company’s Articles of Association that do not result directly from legal stipulations.
There are no significant agreements in which the company participates that would become effec-tive, change, or end in the event of a change in the control of the company following a takeover bid. According to the terms of the ANDRITZ corporate bond 2006-2013 issued in June 2006 and of the ANDRITZ corporate bond 2008-2015 issued in February 2008, all holders of a bond form-ing part of the issue shall, in the event of a change of control by a large new shareholder taking place and this change of control leading to a substantial impairment of the issuer’s ability to fulfill its obligations from the bonds forming part of the issue, be entitled to accelerate maturity of their bonds and to require immediate repayment at the nominal value plus any interest accumulated up to the day of repayment.
Compensation agreements exist between the company and members of its Executive Board in the event of a change of control. No such compensation agreements exist for the members of the Supervisory Board or any employees.
Graz, February 25, 2010
The Executive Board of ANDRITZ AG
Wolfgang Leitner Franz Hofmann Karl Hornhofer Humbert Köfler Friedrich Papst (President and CEO)
Disclaimer:Certain statements contained in the annual financial report 2009 and annual report 2009 constitute ‘forward-looking statements.’ These statements, which contain the words ‘believe’, ‘intend’, ‘expect’, and words of a similar meaning, reflect the Executive Board’s beliefs and expectations and are subject to risks and uncertainties that may cause actual results to differ materially. As a result, readers are cautioned not to place undue reliance on such forward-looking statements. The company disclaims any obligation to publicly announce the result of any revisions to the forward-looking statements made herein, except where it would be required to do so under applicable law.
The annual financial report 2009 and the annual report 2009 contain assumptions and forecasts which were based on the information available up to the copy deadline on February 25, 2010. If the premises for these assumptions and forecasts do not occur, or risks indicated in the chapter ‘corporate risks’ and in the status report in the annual financial report 2009 do arise, actual results may vary from the forecasts made in the annual financial report and annual report 2009. Although the greatest caution was exercised in preparing data, all information related to the future is provided without guarantee.
Annual financial report 2009 | Status report
SHARES AND SHAREHOLDER
STRUCTURE

13
Compliance with the rules of conduct laid down in the Austrian Corporate Governance code is an integral part of the ANDRITZ GROUP’s corporate policy. ANDRITZ regards the Code as an essential means to implement responsible company management and control, which is directed towards creating sustainable added value and transparency for shareholders and other stakehold-ers. Implementation of and compliance with the Code will promote and intensify the confidence of shareholders, investors, customers, employees, suppliers, representatives of the media, and other stakeholders in the company. The Executive Board and the Supervisory Board, as well as the entire staff of the ANDRITZ GROUP, are committed to complying with the Code. ANDRITZ has received several awards for its achievements in the area of Corporate Governance.
Mandatory information according to Article 243b of the Austrian Business Code (Unternehmensgesetzbuch – UGB)ANDRITZ has adopted the Austrian Code of Corporate Governance. Changes made to C-rules and R-rules in the course of adaptation to the requirements of the Austrian Stock Corporation Amendment Act and in accordance with the EU Directive, which are to be applied to the business years after December 31, 2009, will be reviewed in the course of the 2010 business year and implemented where relevant.
The Austrian Code of Corporate Governance is publicly accessible and available on the ANDRITZ website at www.andritz.com and on the website of the Austrian working group for Corporate Governance at www.corporate-governance.at.
Categories of rules of the Austrian Code of Corporate GovernanceThe Austrian Corporate Code of Corporate Governance encompasses the following three cat-egories of rules:L-Rules (Legal Requirement): referring to mandatory legal requirements.C-Rules (Comply or Explain): These rules are to be followed or any deviation must be ex- plained and the reasons stated therefore in order to be in compliance with the Code.R-Rules (Recommendation): the nature of this rule is a recommendation; non-compliance with this rule requires neither disclosure nor explanation.
ANDRITZ states as follows regarding the requirements of and the deviations from the Code’s C-Rules:C-Rule 31, C-Rule 51: ANDRITZ AG believes that the publication of the remuneration of single Executive Board members and single Supervisory Board members does not provide the sharehold-ers and other stakeholders with any additional information relevant to the capital market. It would, therefore, not provide them with additional knowledge gain under economic aspects.
Composition of the Executive Board according to Article 243b, para. 2 UGBThe ANDRITZ AG Executive Board consists of five members:Wolfgang Leitner, born on March 27, 1953 President and Chief Executive Officer Responsibilities on the Board: central Group functions such as Controlling, Finance, Treasury, Legal Matters, Internal Auditing, Information Technology, Investor Relations, Corporate Com-munications, Human Resources Management, as well as Organization and Business Process Development
First appointed as President and CEO on June 29, 1994; as CFO on October 1, 1987 Current mandate ends on June 28, 2013 Supervisory board mandates in other listed companies in Austria and abroad: none
Franz Hofmann, born on February 16, 1949 Responsibilities on the Board: METALS and ENVIRONMENT & PROCESS business areas, Group-wide for Automation
First appointed on June 1, 1999 Current mandate ends on March 31, 2011 Supervisory board mandates in other listed companies in Austria and abroad: none
CorporateGovernance report
Annual financial report 2009 | Corporate Governance report
14
Karl Hornhofer, born on March 9, 1968 Responsibilities on the Board: Capital Systems segment of the PULP & PAPER business area, Group-wide for Quality Management
First appointed on January 1, 2007 Current mandate ends on December 31, 2014 Supervisory board mandates in other listed companies in Austria and abroad: none
Humbert Kofler, born on January 11, 1961 Responsibilities on the Board: Service & Units segment of the PULP & PAPER business area, Group-wide for Procurement
First appointed on April 1, 2007 Current mandate ends on March 31, 2015 Supervisory board mandates in other listed companies in Austria and abroad: none
Friedrich Papst, born on November 6, 1952 Responsibilities on the Board: HYDRO and FEED & BIOFUEL business areas, Group-wide for Manufacturing
First appointed on April 1, 1999 Current mandate ends on December 31, 2010 Supervisory board mandates in other listed companies in Austria and abroad: none
Composition of the Supervisory Board according to Article 243b, para. 2 UGBThe ANDRITZ AG Supervisory Board consists of six appointed members and three delegated members.Appointed members:Kurt Stiassny, born on October 6, 1950 Chairman of the Supervisory Board First appointed on December 29, 1999 Current mandate ends on the date of the Annual General Meeting deciding on the discharge for business year 2009
Supervisory board mandates in other listed companies in Austria and abroad: Palfinger AG (until November 30, 2009)
Hellwig Torggler, born on August 26, 1938 Deputy chairman of the Supervisory Board First delegated on September 6, 2000 Current mandate ends on the date of the Annual General Meeting deciding on the discharge for business year 2013
Supervisory board mandates in other listed companies in Austria and abroad: none
Peter Mitterbauer, born on November 14, 1942 First appointed on April 8, 2003 Current mandate ends on the date of the Annual General Meeting deciding on the discharge for business year 2013
Other supervisory board mandates in Austrian and other listed companies: Oberbank AG, Rhein-metall AG
Christian Nowotny, born on July 23, 1950 First appointed on December 29, 1999 Current mandate ends on the date of the Annual General Meeting deciding on the discharge for business year 2012
Other supervisory board mandates in Austrian and other listed companies: CA Immo AG (until May 13, 2009)
Fritz Oberlerchner, born on June 16, 1948 First appointed on March 29, 2006 Current mandate ends on the date of the Annual General Meeting deciding on the discharge for business year 2010
Other supervisory board mandates in Austrian and other listed companies: STRABAG AG,Cologne
Annual financial report 2009 | Corporate Governance report
15
Klaus Ritter, born on April 20, 1940 First appointed on March 30, 2004 Current mandate ends on the date of the Annual General Meeting deciding on the discharge for business year 2011
Supervisory board mandates in other listed companies in Austria and abroad: none
Delegated members:Andreas Martiner, born on November 11, 1964 First delegated on February 14, 2001
Martha Unger, born on May 14, 1951 First appointed on March 28, 2007
Brigitta Wasserbauer, born on June 14, 1952 First delegated on September 6, 2000
Regarding the independence criteria, the Supervisory Board of ANDRITZ AG follows the guidelines laid down in the Corporate Governance Code, Annex 1. According to these guidelines, all members of the Supervisory Board of ANDRITZ AG, with the exception of Hellwig Torggler, can be seen as independent. No member of the Supervisory Board of ANDRITZ AG holds more than 10% of the total of shares.
Description of the working procedures of the Executive Board and the Supervisory Board in accordance with Article 243b, para. 2 UGBAllocation of competencies in the Executive BoardThe Executive Board of ANDRITZ AG holds board meetings at regular intervals on essential, Group-relevant topics and/or single business areas, such as PULP & PAPER and HYDRO. The competencies and responsibilities of the Executive Board members are listed in the notes to the Executive Board members in this Corporate Governance report.
Supervisory Board committeesThe Supervisory Board of ANDRITZ AG established an audit committee that held two meetings (March 5, 2009 and December 4, 2009) to deal with the consolidated financial statements 2008, the preparation of the consolidated financial statements 2009, issues concerning the auditors, and the implementation of the risk management system in the ANDRITZ GROUP. The members of the audit committee are: Kurt Stiassny (Chairman), Christian Nowotny, Hellwig Torggler, Andreas Martiner, and Brigitte Wasserbauer.
The Supervisory Board has also established a remuneration and Human Resources committee whose scope of activities includes the remuneration paid to the Executive Board members and the content of their employment contracts, appointments to Executive Board positions that become vacant, and succession planning matters. The remuneration and Human Resources committee held a meeting on March 29, 2009 and also took circular resolutions. The members of the remunera-tion and Human Resources committee are: Kurt Stiassny (Chairman) and Hellwig Torggler (Deputy).
The ANDRITZ AG Supervisory Board held four regular meetings in 2009. The focal points of these meetings were monitoring of the current business development of the ANDRITZ GROUP, including possible deviations from the budget, the strategic goals, medium-term planning for the individual business areas, as well as specific topics, for instance, acquisitions of companies, granting of joint procurations, and other business subject to approval.
Measures to promote the appointment of women to the Executive Board, the Su-pervisory Board, and to management posts (Article 80, Corporation Act)For many years now, the ANDRITZ GROUP has pursued a strategy of promoting diversity of its employees in terms of their qualification, experience and age, cultural background, gender, and similar factors.
High attention is paid to maintaining a strict equal opportunities policy in the recruitment process. Recruitment of women graduates is also encouraged for posts in engineering.
Annual financial report 2009 | Corporate Governance report

16
Various measures have been implemented and investments made to improve the work-life balance for employees to the extent required by the social structures in the various countries. The company-run nursery school set up beside the headquarters of the ANDRITZ GROUP in Graz and the flexible working hours available to employees with young children are two examples of these measures.
In many areas, women were successful in being appointed to management posts. Only recently, Group-wide managerial posts at first and second reporting level were filled by women.
Disclosure of information on the remunerations of the Executive Board and Su-pervisory Board (C-Rule 30) The remuneration of the Executive Board is composed of a fixed and variable/success-based portion. The amount of the variable portion depends on the net income, including the consider-ation of linear goodwill amortization.
As in previous share option programs, participation in the planned 2010 share option program is contingent on investing at least EUR 20,000 in ANDRITZ shares for managerial staff and EUR 40,000 for members of the Executive Board not later than the allocation date of the options. This investment must be maintained continuously until exercise of the options by those persons subscribing to the option program and evidence thereof must be brought when the options are exercised. There is a waiting period of three years after allocation of the options until options can be exercised.
The members of the Executive Board are entitled to receive pension scheme benefits. In addition to a retirement pension, these include benefits in the event of occupational disability, as well as pension payments for dependents following the death of the beneficiary. The retirement pension is normally paid as from a certain age provided that the employment contract has already been terminated by this date. The administration has been transferred to a pension fund. In the event that the employment contract is terminated prematurely, contributions made up to this point shall still be vested. The pension amount to which the beneficiary is entitled is not subject to an escalation clause before any benefits become payable, but will be adjusted annually thereafter.
Each member of the Executive Board shall, upon termination of his/her function and concurrent termination of employment, be entitled to severance payments in the meaning of Article 23 of the Austrian Employees Act.
ANDRITZ AG took out Directors’ and Officers’ liability insurance (D&O insurance) for 2009. The expenses are borne by the company. The D&O insurance covers certain personal liability risks of persons in the ANDRITZ GROUP acting under responsibility. The annual cost is approximately 200,000 EUR.
The remuneration scheme of the Supervisory Board is composed of a fixed and an attendance-related portion. The fixed portion is a global sum, which is to be distributed such that the chair-man of the Supervisory Board receives double the amount and his deputy one-and-a-half-times the amount paid to the other members. The second portion consists of a lump sum fee paid in respect of each meeting that the member attends.
The remuneration report for the Executive Board and the Supervisory Board of ANDRITZ AG is available in the notes to the annual financial report 2009.
Graz, March 2010
The Executive Board of ANDRITZ AG
Wolfgang Leitner Franz Hofmann Karl Hornhofer Humbert Köfler Friedrich Papst (President and CEO)
Annual financial report 2009 | Corporate Governance report
17
The ANDRITZ GROUP is a globally-operating company serving a variety of industrial markets and customers. As such, the Group is subject to certain general and industry-specific risks. ANDRITZ has a Group-wide control and steering system whose main task is to identify nascent risks at an early stage and – if possible – to take countermeasures.
The risks for the ANDRITZ GROUP include, but are not limited to, the following:Risks in connection with the general economic development Effects of the financial and economic crisisThe prevailing global financing and economic crisis constitutes a considerable risk for the future financial development of the ANDRITZ GROUP and could lead to delays in the execution of existing orders and to postponement or termination of current projects. This could entail a decline in the Group’s order intake. Possible cancellations of existing orders could have a negative impact on the ANDRITZ GROUP’s order backlog. Both factors could have an adverse effect on the future sales and earnings developments of the Group and also on the Group’s order backlog.
The financial market crisis and the resulting negative and volatile development of the securities, in-terest, and currency markets also constitute a considerable financial risk for the ANDRITZ GROUP. The Group avoids dependence on one single or only a few banks by defining limits for certain relevant financial positions (cash and cash equivalents, financial liabilities, financial assets, guar-antees, and derivatives). Cash is largely invested in low-risk financial assets, such as government bonds, government-guaranteed bonds, investment funds to cover pension obligations, or term deposits. There is, however, no way of excluding the possibility of a bank with which the ANDRITZ GROUP does business encountering financial difficulties, which could have a negative impact on the volume placed with this bank or result in ANDRITZ not having immediate or only partial access to these investments. In addition, the developments on the financial markets may lead to unfavor-able price developments or non-tradeability of various securities (investment funds, bonds, etc.) in which the Group has invested, which could adversely affect the ANDRITZ GROUP’s financial result or shareholders’ equity due to necessary depreciations or value adjustments.
The global financial and economic crisis could also create the need for complete or partial impair-ment of some goodwill created in the course of acquisitions if the business development goal cannot be reached. This might significantly influence the earnings development.
Risks related to the industries in which the Group operatesVolatility of incoming ordersSome customers and industries served by the ANDRITZ GROUP are directly dependent on the general economic development and thus subject to frequent fluctuations in the demand for their products. This is especially true of the PULP & PAPER and the METALS business areas, but all business areas can be affected. The prices for the products in these segments are, in part, directly dependent on the prevailing relationship between supply and demand. Possible price fluctuations are, therefore, apt to have a direct influence on each customer’s capital investment decisions, with subsequent influence on the Group’s order intake. This may lead to some volatility in the develop-ment of the Group’s order intake.
Customer concentrationIn many of the industries served by ANDRITZ, there is a trend towards consolidation and mergers. This applies above all to the pulp and paper industry, and also the steel industry. This consolidation may result in a reduction of the number of customers in the future, as well as the Group having to negotiate with global companies that have greater purchasing power. The dependence on key cus-tomers may increase, which could have direct consequences on the Group’s financial development.
Uncertainty of future contractsAmong other things, the Group’s future performance depends on its securing new contracts. It can be difficult to predict when an order for which the ANDRITZ GROUP has provided a quotation will actually be awarded. Contract awards are often affected by events outside the control of the Group, such as prices, demand, general economic conditions, the granting of governmental ap-provals, and the securing of project financing. This uncertainty can cause difficulties in matching the Group’s fixed costs and predicted order volume.
Corporate risks
Annual financial report 2009 | Corporate risks

18
Safety and environmental mattersThe Group’s operations are subject to numerous local, national, and supranational environmental regulations. The Group uses and generates hazardous substances in its manufacturing operations. In addition, many of the Group’s current and former properties are, or were, used for industrial pur-poses, and disposal of waste at disposal sites has been arranged. It is possible that the Group may be subject in the future to liabilities relating to the investigation and clean-up of contaminated areas.
In addition, most of the Group’s systems involve technologies that pose the risk of serious or fatal injury, or property damage. Several systems involve the use of dangerous and hazardous chemicals and materials. The Group provides installation and other services on industrial sites containing dangerous and hazardous chemicals and materials. In the event of an accident, including but not limited to a spill of hazardous materials, a fire or an explosion, the Group could be held liable for extensive property damage, personal or fatal injury, and environmental remediation. While the Group maintains insurance policies for some of these risks, there is no assurance that such insur-ance will be sufficient or cover the risks.
Insurance mattersWhile the ANDRITZ GROUP maintains insurance programs to cover typical insurable risks related to its business, there can be no assurance that the amount of the Group’s insurance will be adequate. Moreover, the Group is involved in certain industries (e.g. space industry) for which such risks are typically uninsurable. Any material liability not covered by insurance would have a material adverse effect on the Group’s financial condition.
Risks related to the Group’s businessCurrenciesThe Group has operations and subsidiaries in a large number of countries outside Euroland, and a significant portion of its sales and costs are denominated in non-Euro currencies, mainly in US dollars and British pounds. The currencies in these countries are subject to fluctuations in exchange rates. Currency and interest rate risks are minimized by derivative financial instruments, in particular forward exchange contracts and swaps.
Although the Group attempts to hedge the net currency exposure of those orders not invoiced in Euros by arranging forward contracts, currency fluctuations can result in the recognition of exchange rate losses in the Group’s financial statements. Developments of exchange rates may also have translation effects on the Group’s sales and earnings whose values are converted into Euros. In addition, shifts in exchange rates may affect ANDRITZ’s position relative to its competi-tors, although most of the main competitors of ANDRITZ are also based in Euroland. As some of ANDRITZ’s major customers are based outside Euroland, changes in exchange rates could lead to delays in project decisions by those customers. Also, the shareholders’ equity of the ANDRITZ GROUP is not hedged and is thus susceptible to being affected by changes in the exchange rate.
Cash flow risks are monitored via monthly cash flow reports.
Competitive positionThe ANDRITZ GROUP does business in highly competitive markets. Some of the markets in which the Group competes are highly fragmented, with a few large, international manufacturers competing against each other and against a large number of smaller, local companies. In some cases, this has had an adverse impact on sales margins realized by certain of the Group’s business transactions. The ANDRITZ GROUP has invested approximately 3% of total sales in research and development and has so far been able to offer its customers the latest technological developments. There is, however, no assurance that the Group can maintain and defend this position in the future.
To the extent that the Group’s competitive position can be traced to proprietary technology, the global increase in piracy and reverse engineering may also have an adverse effect on the Group’s competitive position.
Acquisition and integration of complementary business segmentsOne of the Group’s main strategic goals is to become a full-line supplier in all of its business areas through organic growth and complementary acquisitions. In the course of implementing this strat-egy, the Group has acquired and integrated a number of companies with worldwide operations since 1990.
Annual financial report 2009 | Corporate risks

19
There is, however, no guarantee that the Group will be successful in identifying and acquiring ap-propriate acquisition candidates in the future, or that suitable candidates and sufficient financing will be available. In the past, ANDRITZ was successful in integrating newly acquired companies, but there is no guarantee that planned objectives and synergies can be realized for all acquisitions in the future (including the ongoing integration of the most recently acquired companies), or that the Group may not be exposed to new or legacy risks that have not been properly managed or identified.
Legal proceedingsIn the course of its business, the ANDRITZ GROUP is party to numerous legal proceedings before both administrative and judicial courts and bodies, as well as before arbitration tribunals. The substantial majority of such proceedings is of a nature considered typical of the Group’s business. Where appropriate, provisions are made to cover the expected outcome of proceedings to the extent that negative outcomes are likely and reliable estimates can be made. There is no guarantee, however, that these provisions will be sufficient.
ANDRITZ Inc., a subsidiary of the ANDRITZ GROUP, is one of many defendants in a total of ap-proximately 26 asbestos cases (status as of December 31, 2009) in the USA. In aggregate, the cases involve 686 plaintiffs. Nearly all of these cases involve claims by multiple plaintiffs against multiple defendants. ANDRITZ Inc. does not believe it should be found liable in connection with any of these claims and intends to defend each claim vigorously.
ComplianceThe ANDRITZ GROUP is subject to a variety of legal compliance risks, including compliance with anti-trust and anti-bribery laws in Austria and other countries where the Group conducts business. The Group has adopted a number of compliance policies, including compliance policies prohibiting the violation of applicable anti-trust laws and anti-bribery laws, as well as other rules of conduct. While the Group attempts to make sure that such policies are observed, there can be no assurance that no violations occur. Any such violation could have a lasting adverse impact on the financial position and reputation of the Group.
Risks related to major orders and other contractsPayment risks from customersMuch of the ANDRITZ GROUP’s business involves handling major projects with a large contract value. If a customer fails to meet its payment obligations for one of these projects, this may have a negative effect on the net worth and liquidity position of the Group. The ANDRITZ GROUP tries to limit these risks by securing payment guarantees from banks and export credit insurance agencies. Even in projects covered by export credit insurance, typically only up to 85% of the sales price is secured through such insurance. Moreover, much of the Group’s business for aftermarket sales and services is not secured by bank guarantees. Worsening economic conditions could adversely affect the ability of certain customers to meet their payment obligations to ANDRITZ.
Nevertheless, there is always some risk that partial or full provisions will have to be made for some trade accounts receivable.
Performance risk of projectsIn conjunction with the performance of plants supplied by ANDRITZ, in many cases the Group is under contractual obligation to provide performance guarantees and to meet certain deadlines. If the performance data stated are not achieved or if deadlines are exceeded, the Group may have to perform remedial work at its own expense or pay damages. If a guaranteed performance level or deadline is missed by a wide margin, the customer may have the right to terminate the agree-ment and return the delivered system to the Group for a full refund and/or recover damages. Such action could have an adverse effect on the Group’s financial development.
Cost overrunsA substantial majority of the Group’s projects are based on long-term fixed price contracts. The sales and operating margins realized in a fixed price contract may vary from original estimates as a result of changes in costs, especially fluctuating material costs, and productivity over the term of the contract, especially on projects that include engineering and/or construction of complete plants.
In addition, since certain parts of the Group’s supplies are outsourced, the Group may be forced to quote at a fixed price to the customers without knowing exactly how much the purchased parts
Annual financial report 2009 | Corporate risks
20
will cost. While estimates are made using empirical data and quotes from potential suppliers, these may not always be completely accurate. The Group has experienced significant losses on certain past and pending projects in this regard, and similar difficulties and losses may occur in the future in a way that would adversely affect the Group’s financial condition.
EPC/turnkey contract risksIn a growing number of the Group’s projects, ANDRITZ has responsibility for plant-wide engineer-ing and/or construction in addition to the supply of ANDRITZ equipment. These turnkey or EPC contracts bear the risks discussed above, but also entail certain risks relating to greater on-site responsibilities, including environmental matters, local labor conditions, as well as construction and installation risks. Additionally, the Group is exposed to the risks inherent in managing the third parties providing construction, installation, and engineering services on these projects. The Group has put risk management procedures in place, including insurance programs, contract policies, and project management discipline to reduce these EPC-related risks. Nevertheless, there is no guarantee that these procedures are sufficient to prevent negative financial consequences.
Consortium risksIn many EPC projects and certain other projects, the ANDRITZ GROUP participates with third parties with whom it shares joint and several liabilities. While the Group attempts to make sure that risks in such projects are properly allocated, there can be no assurance it will be successful. Moreover, the inability of one of the Group’s consortium partners to fulfill its obligations on the project, including indemnity obligations to the Group may have an adverse impact on the financial results of the Group.
Limitations of liabilityLiabilities arising out of the Group’s contracts may include liabilities for customers’ loss of profits and other liabilities that can vastly exceed the value of the contract in question. While the Group endeavors to include appropriate limitations of liability in its contracts, there can be no assurance that appropriate limitations will in fact be in place in all contracts or that such limitations will be enforceable under the applicable law.
Government contractA significant amount of the HYDRO business relates to projects with government entities. These projects can involve the performance, liability, and EPC/turnkey contract risks described above. Due to public bid requirements and local laws, it may not always be possible for the Group to obtain its desired contractual safeguards and thus it may remain more exposed to such risks in connection with these projects.
Risks related to the capital marketsDependence on the development of international financial marketsApart from company-related occurrences, development of the ANDRITZ share price is also depen-dent on fluctuations in prices on the international financial markets. Major price fluctuations and high volatility on major stock markets may have an adverse effect on the ANDRITZ share price.
Recommendations by analystsAs a publicly listed company, ANDRITZ is regularly assessed by financial analysts and institutional investors. Analysts’ recommendations to buy or sell ANDRITZ shares and subsequent investment decisions by shareholders may cause considerable fluctuations in the share price. The ANDRITZ GROUP has consistently followed a policy of open and transparent information exchange with shareholders and the financial community to minimize unfounded price fluctuations of its shares.
Active trading of ANDRITZ sharesThe high level (approximately 71%) of public free float of ANDRITZ’s total outstanding shares and the intensive investor relations activities have led to active trading in ANDRITZ shares on the Vienna Stock Exchange. There is no assurance, however, that active trading will be maintained in the future. If active trading were not maintained, the liquidity and market price of ANDRITZ shares would suffer adverse effects and investors may not be able to sell their shares at what they perceive to be an acceptable price. In the absence of active trading or in the event of a major change in market capitalization, the ANDRITZ share could be removed from various international industrial and stock exchange indices, e.g., the ATX, the leading index of the Vienna Stock Exchange, or other international indices. This could result in major changes in the price of the ANDRITZ share.
Annual financial report 2009 | Corporate risks

21
The Supervisory Board and the Executive Board held four meetings during the reporting period for in-depth discussions of the economic situation and strategic development of the company, as well as major events, capital expenditures, and other measures. In the course of regular reporting and in all meetings, the Executive Board informed the Supervisory Board, by means of detailed reports, on the business and financial situation of the Group and its affiliates, as well as on the situation regarding Human Resources, capital expenditure, and acquisition projects. Additional information was provided on special occurrences. The Chairman of the Supervisory Board and the Chief Executive Officer were also in regular contact to review the company’s strategy, business development, and risk management.
Specific topics were discussed in two meetings in depth by the audit committee and reported on subsequently to the Supervisory Board. The Presidium of the Supervisory Board was informed regularly by the Executive Board on the current business development and acted on behalf of the company in matters concerning the Executive Board. None of the members of the Supervisory Board were absent from more than half of the meetings. All members of the audit committee at-tended the committee meetings.
With regard to the financial statements for 2008, the audit committee called in the annual auditor to attend its meeting on March 5, 2009 in order to review the financial statements, consolidated financial statements, the status report, and the Executive Board’s proposal for appropriation of profits. In addition, a statement was drawn up on the auditor designated for business year 2009, his legal relationship with the ANDRITZ GROUP and the members of its Boards verified, the auditing fees negotiated, and a recommendation for the auditor appointment was made. As a further item on the agenda, the audit committee dealt with implementation of the risk management system in the company and suggested allocating additional staff to Internal Auditing.
At the meeting of the audit committee held on December 4, 2009, the Supervisory Board – with the auditor also present – discussed organization, scheduling, and auditing of the 2009 financial statements, as well as a report by the Executive Board on the new requirements resulting from the Commercial Law Amendment Act. In addition, the Supervisory Board adjusted the Executive Board’s rules of procedure to the changed economic and legal requirements.
The Annual General Meeting of Shareholders on March 27, 2009 re-elected DDr. Hellwig Torggler and Dipl.-Ing. Peter Mitterbauer as members of the company’s Supervisory Board for the maximum period stipulated in the Articles of Association, i.e. until the end of the Annual General Meeting deciding on the discharge for the 2013 business year. In its meeting on March 5, 2009, the Super-visory Board reviewed the Corporate Governance of the Group.
After the close of the Annual General Meeting of Shareholders on March 27, 2009, the Supervisory Board convened and confirmed the functions of Mag. Kurt Stiassny as chairman of the Supervisory Board and of Hon. Prof. DDr. Hellwig Torggler as his deputy. Mag. Stiassny and Hon. Prof. DDr. Torggler are members of the personnel committee on Executive Board matters and members of the audit committee. During the meeting on December 4, 2009, the current business development, including the impact of the financial crisis, the forecast for the 2009 results, the budget for 2010, and the medium-term planning were discussed in detail.
The financial statements and the status report of ANDRITZ AG and the consolidated financial statements for 2009 drawn up according to IFRS were audited (including the accounts) and cer-tified by AUDITOR TREUHAND GMBH Wirtschaftsprüfungs- und Steuerberatungsgesellschaft, Vienna, who had been appointed as auditors by the Annual General Meeting of Shareholders. The Supervisory Board examined the documents in accordance with Article 96 of the Corporation Act and approved the financial statements, which are hereby adopted in accordance with Article 96, para. 4, of the Corporation Act. The Supervisory Board also checked and approved the proposed appropriation of profits submitted by the Executive Board.
Graz, March 2010
Kurt StiassnyChairman of the Supervisory Board
Report of the Supervisory Board
Annual financial report 2009 | Report of the Supervisory Board

22
Statement by the Executive Board, pursuant to Article 82 (4) of the (Austrian) Stock Exchange Act:We confirm to the best of our knowledge that the consolidated financial statements give a true and fair view of the assets, liabilities, financial position, and profit or loss of the Group as required by the applicable accounting standards and that the Group status report gives a true and fair view of the development and performance of the business and the position of the Group, together with a description of the principal risks and uncertainties the Group faces.
We confirm to the best of our knowledge that the separate financial statements give a true and fair view of the assets, liabilities, financial position, and profit or loss of the parent company as required by the applicable accounting standards and that the status report gives a true and fair view of the development and performance of the business and the position of the company, together with a description of the principal risks and uncertainties the company faces.
Graz, February 2010
The Executive Board of ANDRITZ AG
Wolfgang Leitner Franz Hofmann Karl Hornhofer Humbert Köfler Friedrich Papst (President and CEO)
Statement by the Executive Board
Annual financial report 2009 | Statement by the Executive Board
23
CONSOLIDATED FINANCIAL STATEMENTS2009 OF THE ANDRITZ GROUP 23Auditor’s report 24Consolidated balance sheet 26Consolidated income statement 27Consolidated statement of comprehensive income 28Consolidated statement of shareholders’ equity 29Consolidated cash flow statement 30Notes to the consolidated financial statements 31

24
Report on the consolidated financial statementsWe have audited the accompanying consolidated financial statements of ANDRITZ AG, Graz, Austria for the financial year from January 1, to December 31, 2009. These consolidated financial statements comprise the consolidated balance sheet as of December 31, 2009, the consolidated income statement, statement of changes in equity and cash flow statement for the year ended December 31, 2009 and the notes.
Management’s responsibility for the consolidated financial statements and the accounting recordsManagement is responsible for the preparation and fair presentation of these consolidated financial statements in accordance with International Financial Reporting Standards (IFRSs) as adopted by the EU. This responsibility includes: designing, implementing and maintaining internal control relevant to the preparation and fair presentation of financial statements that are free from material misstatement, whether due to fraud or error; selecting and applying appropriate accounting poli-cies; and making accounting estimates that are reasonable in the circumstances.
Auditor’s responsibility and description of type and scope of the statutory auditOur responsibility is to express an opinion on these consolidated financial statements based on our audit. We conducted our audit in accordance with laws and regulations applicable in Austria and in accordance with International Standards on Auditing issued by the International Auditing and Assurance Standards Board (IAASB) of the International Federation of Accountants (IFAC).
These standards require that we comply with ethical requirements and plan and perform the audit to obtain reasonable assurance whether the consolidated financial statements are free from mate-rial misstatement.
An audit involves performing procedures to obtain audit evidence about the amounts and disclo-sures in the consolidated financial statements.
The procedures selected depend on the auditor’s judgment, including the assessment of the risks of material misstatement of the consolidated financial statements, whether due to fraud or error. In making those risk assessments, the auditor considers internal control relevant to the entity’s preparation and fair presentation of the consolidated financial statements in order to design audit procedures that are appropriate in the circumstances, but not for the purpose of expressing an opinion on the effectiveness of the entity’s internal control.
An audit also includes evaluating the appropriateness of accounting policies used and the rea-sonableness of accounting estimates made by management, as well as evaluating the overall presentation of the consolidated financial statements.
We believe that the audit evidence we have obtained is sufficient and appropriate to provide a basis for our audit opinion.
OpinionOur audit did not give rise to any objections. In our opinion, which is based on the results of our audit, the consolidated financial statements are in accordance with legal requirements and pre- sent fairly, in all material respects, the financial position of the Group as of December 31, 2009 and of its financial performance and its cash-flows for the financial year from January 1, to December 31, 2009 in accordance with International Financial Reporting Standards as adopted by the EU.
Auditor’s report
Annual financial report 2009 | Auditor’s report
25
Conclusion on management report for the GroupLaws and regulations require us to perform audit procedures to determine whether the consolidated management report is consistent with the consolidated financial statements and whether the other disclosures made in the consolidated management report do not give rise to misconception of the position of the Group. The auditor’s report has to state whether the consolidated management report for the Group is consistent with the consolidated financial statements and whether the disclosures according to section 243a of the Austrian Commercial Code apply.
In our opinion, the consolidated management report for the Group is consistent with the consoli-dated financial statements. The disclosures according to section 243a of the Austrian Commercial Code apply.
Vienna, February 25, 2010
Deloitte Audit Wirtschaftsprüfungs GmbH
Mag. Manfred GERITZER Mag. Michael SCHOBER(Austrian) Certified Public Accountant (Austrian) Certified Public Accountant
If the consolidated financial statements are disclosed or handed over to a third party in a version which differs from that certified by us, our prior approval is necessary if our audit opinion is included or our audit is mentioned.
Annual financial report 2009 | Auditor’s report

26
(in TEUR) Notes 2009 2008ASSETSIntangible assets 1. 44,218 56,391Goodwill 1. 219,894 226,999Property, plant, and equipment 1. 345,990 327,734Shares in associated companies 1. 9,397 9,300Other investments 22,682 35,461Non-current receivables and other non-current assets 2./ 5./ 7. 37,807 32,608Deferred tax assets 18. 89,171 76,246Non-current assets 769,159 764,739Inventories 3. 319,880 360,051Advance payments made 4. 98,211 97,984Trade accounts receivable 5. 454,691 424,947Cost and earnings of projects under construction in excess of billings 6. 383,887 445,548Other current receivables 7. 201,378 171,270Marketable securities 372,545 263,314Cash and cash equivalents 709,532 558,448Current assets 2,540,124 2,321,562TOTAL ASSETS 3,309,283 3,086,301SHAREHOLDERS’ EQUITY AND LIABILITIESShare capital 104,000 104,000Capital reserves 36,476 36,476Retained earnings 8. 488,874 402,029Equity attributable to shareholders of the parent 629,350 542,505Non-controlling interests 34,142 34,877Total shareholders’ equity 663,492 577,382Bonds – non-current 11. 371,553 369,023Bank loans and other financial liabilities – non-current 11. 21,956 25,163Obligations under finance leases – non-current 11. 736 858Provisions – non-current 9./ 10. 209,856 217,147Other liabilities – non-current 12. 23,303 16,989Deferred tax liabilities 18. 89,955 89,992Non-current liabilities 717,359 719,172Bank loans and other financial liabilities – current 11. 31,110 36,334Obligations under finance leases – current 11. 366 523Trade accounts payable 260,337 306,295Billings in excess of cost and earnings of projects under construction 6. 722,839 621,177Advance payments received 49,466 57,629Provisions – current 9. 320,088 260,125Liabilities for current taxes 34,832 34,614Other liabilities – current 12. 509,394 473,050Current liabilities 1,928,432 1,789,747TOTAL SHAREHOLDERS’ EQUITY AND LIABILITIES 3,309,283 3,086,301
The following notes to the consolidated financial statements form an integral part of this consolidated statement of financial position.
Consolidated statement of financial positionas of December 31, 2009
Annual financial report 2009 | Consolidated statement of financial position
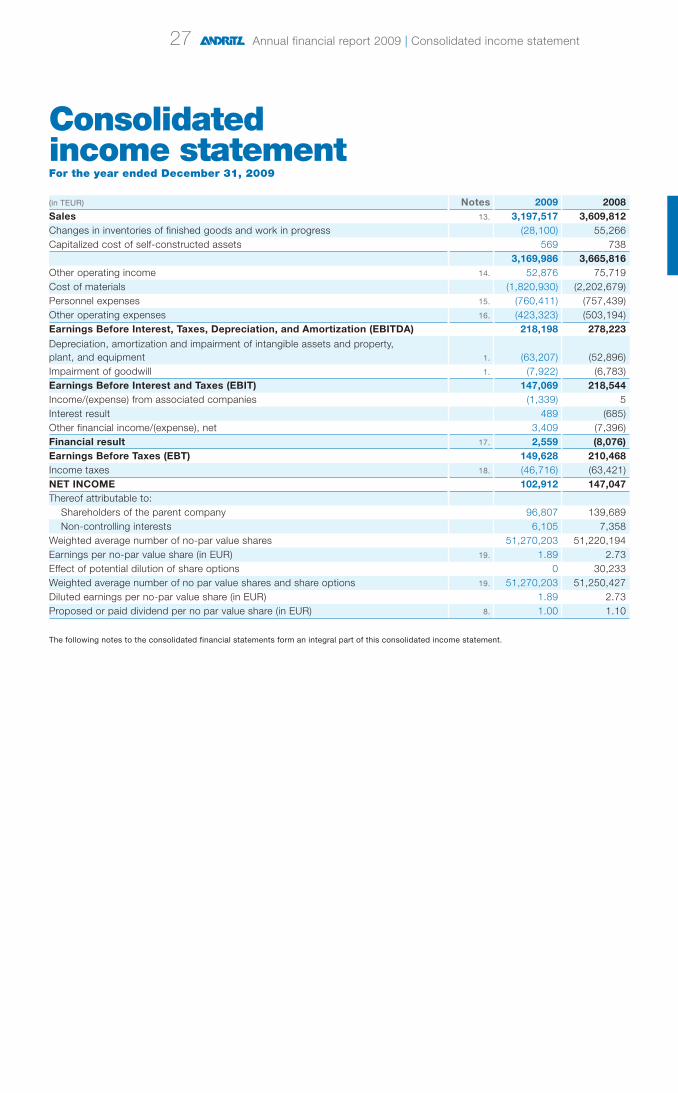
27
(in TEUR) Notes 2009 2008Sales 13. 3,197,517 3,609,812Changes in inventories of finished goods and work in progress (28,100) 55,266Capitalized cost of self-constructed assets 569 738
3,169,986 3,665,816Other operating income 14. 52,876 75,719Cost of materials (1,820,930) (2,202,679)Personnel expenses 15. (760,411) (757,439)Other operating expenses 16. (423,323) (503,194)Earnings Before Interest, Taxes, Depreciation, and Amortization (EBITDA) 218,198 278,223
Depreciation, amortization and impairment of intangible assets and property,plant, and equipment 1. (63,207) (52,896)Impairment of goodwill 1. (7,922) (6,783)Earnings Before Interest and Taxes (EBIT) 147,069 218,544Income/(expense) from associated companies (1,339) 5Interest result 489 (685)Other financial income/(expense), net 3,409 (7,396)Financial result 17. 2,559 (8,076)Earnings Before Taxes (EBT) 149,628 210,468Income taxes 18. (46,716) (63,421)NET INCOME 102,912 147,047Thereof attributable to:
Shareholders of the parent company 96,807 139,689Non-controlling interests 6,105 7,358
Weighted average number of no-par value shares 51,270,203 51,220,194Earnings per no-par value share (in EUR) 19. 1.89 2.73Effect of potential dilution of share options 0 30,233Weighted average number of no par value shares and share options 19. 51,270,203 51,250,427Diluted earnings per no-par value share (in EUR) 1.89 2.73Proposed or paid dividend per no par value share (in EUR) 8. 1.00 1.10
The following notes to the consolidated financial statements form an integral part of this consolidated income statement.
Consolidated income statementFor the year ended December 31, 2009
Annual financial report 2009 | Consolidated income statement

28
(in TEUR) Notes 2009 2008Net income 102,912 147,047
Currency translation adjustments 19,951 (13,492)Actuarial gains/(losses), net of tax 9,218 (6,173)Changes to IAS 39 reserve, net of tax j. 6,091 (5,429)Other comprehensive income for the year 35,260 (25,094)
Total comprehensive income for the year 138,172 121,953Thereof attributable to:
Shareholders of the parent company 127,765 117,753Non-controlling interests 10,407 4,200
The following notes to the consolidated financial statements form an integral part of this consolidated statement of comprehensive income.
Consolidated statement of comprehensive incomeFor the year ended December 31, 2009
Annual financial report 2009 | Consolidated statement of comprehensive income

29
Attributable to shareholders of the parent
Non-control-
ling inter- ests
Total share-
holders' equity
(in TEUR) Notes
Share capi-
tal
Capital re-
serves
Other retained earnings
IAS 39 re-
serve
Actuarial gains
(losses)
Currency transla- tion ad-
justments Total
Status as at January 1, 2008 104,000 36,476 368,447 644 (7,734) (34,424) 467,409 14,166 481,575
Total comprehensive income for the year 0 0 139,689 (5,481) (6,156) (10,299) 117,753 4,200 121,953Dividends 8. (51,087) (51,087) (1,747) (52,834)
Change of consoli-dation range (662) (662) 18,258 17,596
Changes concerning own shares 4,504 4,504 4,504Other changes 4,588 4,588 4,588
STATUS AS AT DECEMBER 31, 2008 104,000 36,476 465,479 (4,837) (13,890) (44,723) 542,505 34,877 577,382
Status as at January 1, 2009 104,000 36,476 465,479 (4,837) (13,890) (44,723) 542,505 34,877 577,382
Total comprehensive income for the year 96,807 5,994 9,088 15,876 127,765 10,407 138,172Dividends 8. (56,321) (56,321) (10,646) (66,967)
Change of consoli-dation range 496 496 (496) 0
Changes concerning own shares 10,207 10,207 10,207Other changes 4,698 4,698 4,698
STATUS AS AT DECEMBER 31, 2009 104,000 36,476 521,366 1,157 (4,802) (28,847) 629,350 34,142 663,492
The following notes to the consolidated financial statements form an integral part of this consolidated statement of shareholders' equity.
Consolidated statement of shareholders’ equityFor the year ended December 31, 2009
Annual financial report 2009 | Consolidated statement of shareholders’ equity
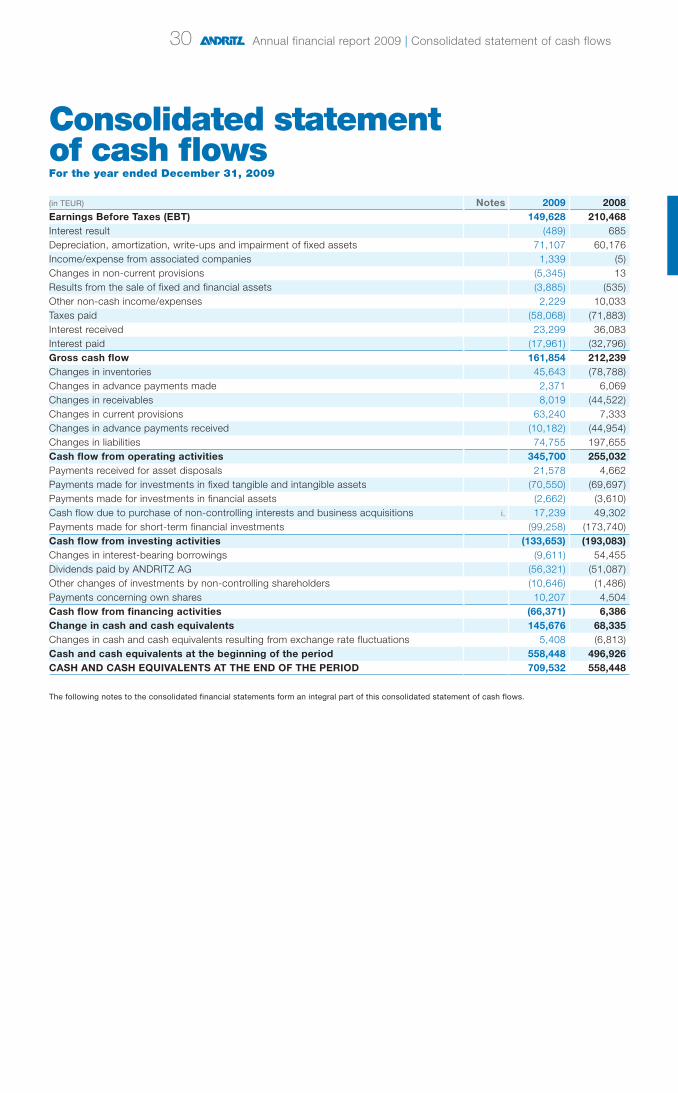
30
(in TEUR) Notes 2009 2008Earnings Before Taxes (EBT) 149,628 210,468Interest result (489) 685Depreciation, amortization, write-ups and impairment of fixed assets 71,107 60,176Income/expense from associated companies 1,339 (5)Changes in non-current provisions (5,345) 13Results from the sale of fixed and financial assets (3,885) (535)Other non-cash income/expenses 2,229 10,033Taxes paid (58,068) (71,883)Interest received 23,299 36,083Interest paid (17,961) (32,796)Gross cash flow 161,854 212,239Changes in inventories 45,643 (78,788)Changes in advance payments made 2,371 6,069Changes in receivables 8,019 (44,522)Changes in current provisions 63,240 7,333Changes in advance payments received (10,182) (44,954)Changes in liabilities 74,755 197,655Cash flow from operating activities 345,700 255,032Payments received for asset disposals 21,578 4,662Payments made for investments in fixed tangible and intangible assets (70,550) (69,697)Payments made for investments in financial assets (2,662) (3,610)Cash flow due to purchase of non-controlling interests and business acquisitions i. 17,239 49,302Payments made for short-term financial investments (99,258) (173,740)Cash flow from investing activities (133,653) (193,083)Changes in interest-bearing borrowings (9,611) 54,455Dividends paid by ANDRITZ AG (56,321) (51,087)Other changes of investments by non-controlling shareholders (10,646) (1,486)Payments concerning own shares 10,207 4,504Cash flow from financing activities (66,371) 6,386Change in cash and cash equivalents 145,676 68,335Changes in cash and cash equivalents resulting from exchange rate fluctuations 5,408 (6,813)Cash and cash equivalents at the beginning of the period 558,448 496,926CASH AND CASH EQUIVALENTS AT THE END OF THE PERIOD 709,532 558,448
The following notes to the consolidated financial statements form an integral part of this consolidated statement of cash flows.
Consolidated statement of cash flowsFor the year ended December 31, 2009
Annual financial report 2009 | Consolidated statement of cash flows
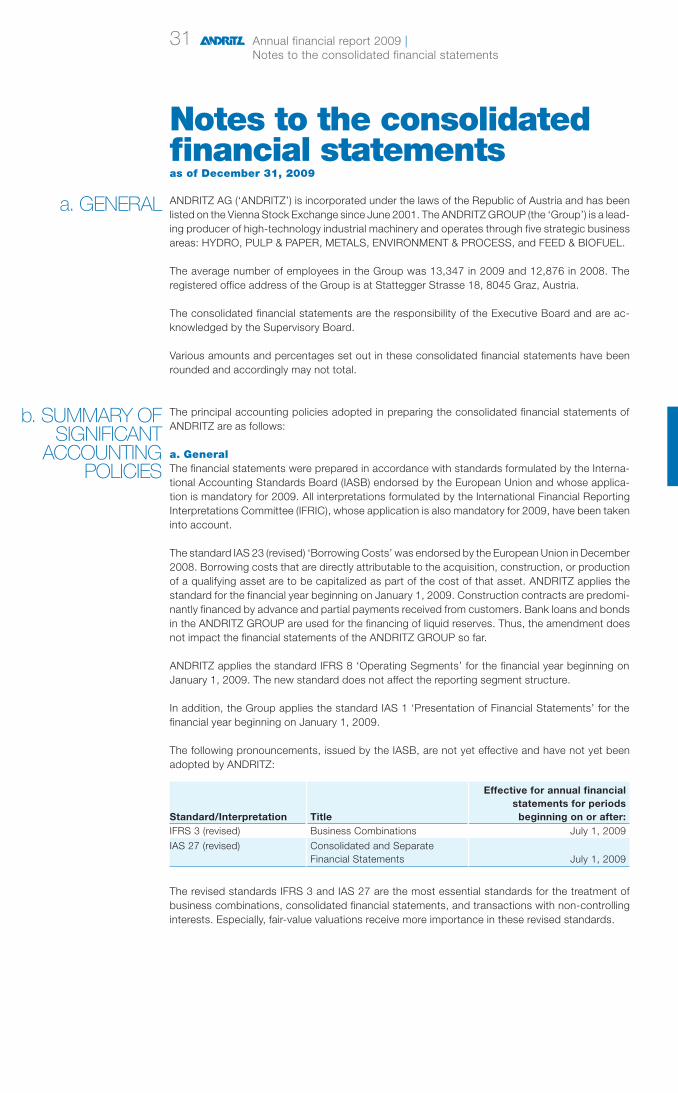
31
ANDRITZ AG (‘ANDRITZ’) is incorporated under the laws of the Republic of Austria and has been listed on the Vienna Stock Exchange since June 2001. The ANDRITZ GROUP (the ‘Group’) is a lead-ing producer of high-technology industrial machinery and operates through five strategic business areas: HYDRO, PULP & PAPER, METALS, ENVIRONMENT & PROCESS, and FEED & BIOFUEL.
The average number of employees in the Group was 13,347 in 2009 and 12,876 in 2008. The registered office address of the Group is at Stattegger Strasse 18, 8045 Graz, Austria.
The consolidated financial statements are the responsibility of the Executive Board and are ac-knowledged by the Supervisory Board.
Various amounts and percentages set out in these consolidated financial statements have been rounded and accordingly may not total.
The principal accounting policies adopted in preparing the consolidated financial statements of ANDRITZ are as follows:
a. GeneralThe financial statements were prepared in accordance with standards formulated by the Interna-tional Accounting Standards Board (IASB) endorsed by the European Union and whose applica-tion is mandatory for 2009. All interpretations formulated by the International Financial Reporting Interpretations Committee (IFRIC), whose application is also mandatory for 2009, have been taken into account.
The standard IAS 23 (revised) ‘Borrowing Costs’ was endorsed by the European Union in December 2008. Borrowing costs that are directly attributable to the acquisition, construction, or production of a qualifying asset are to be capitalized as part of the cost of that asset. ANDRITZ applies the standard for the financial year beginning on January 1, 2009. Construction contracts are predomi-nantly financed by advance and partial payments received from customers. Bank loans and bonds in the ANDRITZ GROUP are used for the financing of liquid reserves. Thus, the amendment does not impact the financial statements of the ANDRITZ GROUP so far.
ANDRITZ applies the standard IFRS 8 ‘Operating Segments’ for the financial year beginning on January 1, 2009. The new standard does not affect the reporting segment structure.
In addition, the Group applies the standard IAS 1 ‘Presentation of Financial Statements’ for the financial year beginning on January 1, 2009.
The following pronouncements, issued by the IASB, are not yet effective and have not yet been adopted by ANDRITZ:
Standard/Interpretation Title
Effective for annual financial statements for periods
beginning on or after:IFRS 3 (revised) Business Combinations July 1, 2009
IAS 27 (revised) Consolidated and Separate Financial Statements July 1, 2009
The revised standards IFRS 3 and IAS 27 are the most essential standards for the treatment of business combinations, consolidated financial statements, and transactions with non-controlling interests. Especially, fair-value valuations receive more importance in these revised standards.
Notes to the consolidated financial statementsas of December 31, 2009
a. GENERAL
b. SUMMARY OF SIGNIFICANT
ACCOUNTING POLICIES
Annual financial report 2009 | Notes to the consolidated financial statements

32
IFRS 3 reconsiders the application of acquisition accounting for business combinations. Major changes relate to the measurement of non-controlling interests, the accounting for business com-binations achieved in stages, as well as the treatment of contingent consideration and acquisition-related costs. Based on the new regulation, non-controlling interests may be measured at their fair value (full-goodwill-method) or at the proportional fair value of assets acquired and liabilities assumed. In business combinations achieved in stages, any previously held equity interest in the acquiree is remeasured to its acquisition date fair value. Any changes to contingent consideration classified as a liability at the acquisition date are recognized in profit and loss. Acquisition-related costs are expensed in the period incurred.
Major changes in relation to IAS 27 relate to the accounting for transactions which do not result in a change of control as well as to those leading to a loss of control. If there is no loss of control, transactions with non-controlling interests are accounted for as equity transactions not affecting profit and loss. At the date control is lost, any retained equity interests are remeasured to fair value. Based on the amended standard, non-controlling interests may show a deficit balance since both profits and losses are allocated to the shareholders based on their equity interests.
The changes in IFRS 3 (revised) and IAS 27 (revised) including consecutive amendments in other standards could have an effect on future transactions, which is currently being evaluated.
b. Reporting currencyThe consolidated financial statements are presented in Euro.
c. Principles of consolidationThe consolidated financial statements of the Group include ANDRITZ and the companies that it controls. This control basically exists where ANDRITZ owns, either directly or indirectly, more than 50% of the voting rights of a company’s share capital and is able to govern the financial and operating policies of an enterprise so as to benefit from its activities. The equity and net income attributable to non-controlling shareholders’ interests are shown separately in the balance sheet and income statement. The purchase method of accounting is used for acquired businesses. Companies acquired or disposed of during the year are included or excluded in the consolidated financial statements from the date of acquisition or date of disposal.
Joint ventures with equal voting rights are consolidated on a proportionate basis.
The following table shows the pro-rata values for entities included in the financial statements by proportionate consolidation:
(in TEUR) 2009 2008Non-current assets 425 324Current assets 3,130 2,233Non-current liabilities 0 0Current liabilities 1,103 994Sales 8,613 10,499Net income 558 919
Inter-company balances and transactions, including inter-company profits and unrealized profits and losses, have been eliminated. The consolidated financial statements have been prepared using uniform accounting policies for like transactions and other events in similar circumstances.
Annual financial report 2009 | Notes to the consolidated financial statements

33
In August 2009, ANDRITZ acquired Rollteck, Germany, a specialist in the design and manufacture of winders for the paper industry, thus further complementing ANDRITZ’s product offerings for the pulp and paper industries. In addition to complete service, Rollteck produces core cutters and components for winders.
The estimated fair values of the assets acquired and liabilities assumed are as follows:
(in TEUR)
Carrying amount
Fair value allocations Fair value
Intangible assets 0 807 807Property, plant, and equipment 53 0 53Inventories 697 0 697Trade and other receivables excluding financial assets 18 0 18Liabilities excluding financial liabilities (1,065) 0 (1,065)Net assets acquired (297) 807 510
The initial accounting for the businesses acquired in 2009 is based on preliminary figures.
a. Intangible assetsIntangible assets are accounted for at acquisition cost. After initial recognition, intangible assets are accounted for at cost less accumulated amortization and any accumulated impairment losses. In-tangible assets are amortized on a straight-line basis over the best estimate of their useful lives. The amortization period and the amortization method are reviewed annually at each financial year-end.
Concessions, industrial rights, and similar rightsAmounts paid for concessions, industrial rights, and similar rights are capitalized and then amor-tized on a straight-line basis over the expected useful life. The expected useful lives vary from 3 to 15 years.
Business combinations and goodwillFor business combinations and goodwill, IFRS 3 has been applied. According to this standard, goodwill is measured as the residual cost of the business combination after recognizing the ac-quiree’s identifiable assets, liabilities, and contingent liabilities. From 2005 on, any goodwill arising from business combinations is no longer amortized. Goodwill is tested for impairment in ac-cordance with IAS 36 at least annually, or more frequently if events or changes in circumstances indicate that it might be impaired. In determining whether the recognition of an impairment loss is required, goodwill is allocated to the cash-generating units that are expected to benefit from the synergies of the business combination. If the carrying amount exceeds the value in use that is calculated by using a Discounted Cash-Flow (DCF) calculation an impairment loss is recognized. An impairment loss recognized for goodwill will not be reversed in a subsequent period.
Future payment surpluses are based on internal forecasts, which are prepared in detail for the next business year and with simplifications for the following two years, and reflect the historical performance and management’s best estimates about future developments. After this detailed planning horizon a constant level is assumed, if no grave reasons speak against it. The discount rate used for DCF calculation is based on an interest rate which represents the actual assessment of possible changes of exchange rates as well as specific risks of an asset. Under consideration of the applicable currency and the corresponding risk profile, a discount rate between 7.27% and 12.00% was applied.
Substantial goodwill was allocated at the acquisition date to existing cash-generating units of ANDRITZ AG (1999), of the pulp business acquired through the ANDRITZ-Ahlstrom Group (2000/2001) as well as of the VA TECH HYDRO Group in the HYDRO business area (2006).
c. ACQUISI-TIONS
d. ACCOUNTING AND VALUATION
PRINCIPLES
Annual financial report 2009 | Notes to the consolidated financial statements
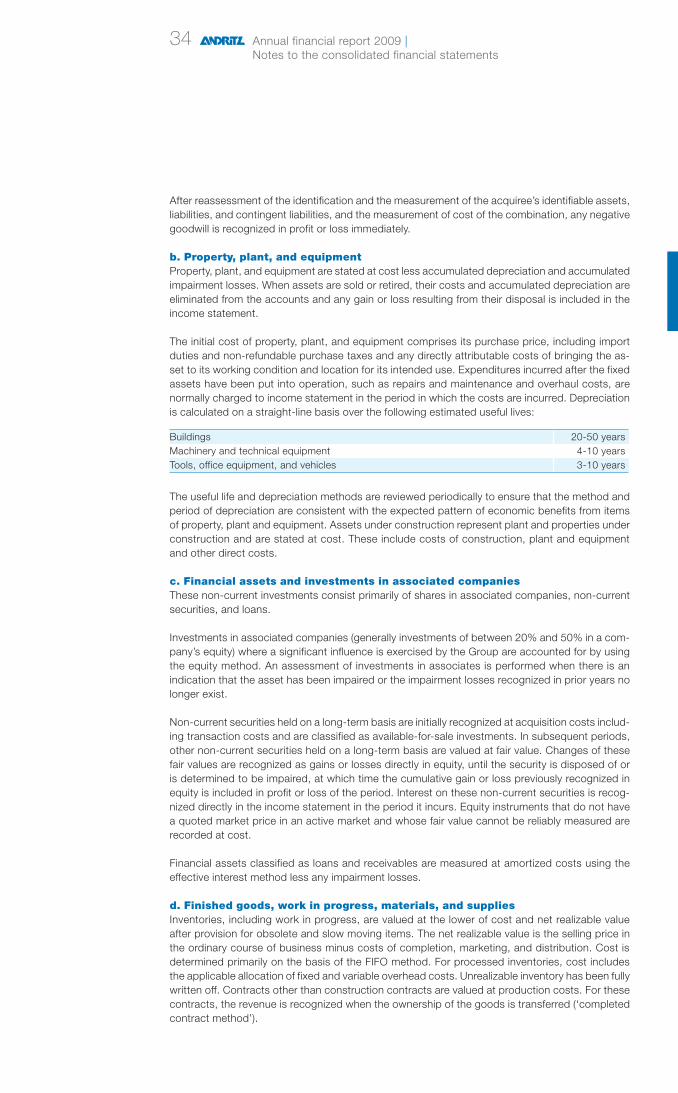
34
After reassessment of the identification and the measurement of the acquiree’s identifiable assets, liabilities, and contingent liabilities, and the measurement of cost of the combination, any negative goodwill is recognized in profit or loss immediately.
b. Property, plant, and equipmentProperty, plant, and equipment are stated at cost less accumulated depreciation and accumulated impairment losses. When assets are sold or retired, their costs and accumulated depreciation are eliminated from the accounts and any gain or loss resulting from their disposal is included in the income statement.
The initial cost of property, plant, and equipment comprises its purchase price, including import duties and non-refundable purchase taxes and any directly attributable costs of bringing the as-set to its working condition and location for its intended use. Expenditures incurred after the fixed assets have been put into operation, such as repairs and maintenance and overhaul costs, are normally charged to income statement in the period in which the costs are incurred. Depreciation is calculated on a straight-line basis over the following estimated useful lives:
Buildings 20-50 yearsMachinery and technical equipment 4-10 yearsTools, office equipment, and vehicles 3-10 years
The useful life and depreciation methods are reviewed periodically to ensure that the method and period of depreciation are consistent with the expected pattern of economic benefits from items of property, plant and equipment. Assets under construction represent plant and properties under construction and are stated at cost. These include costs of construction, plant and equipment and other direct costs.
c. Financial assets and investments in associated companiesThese non-current investments consist primarily of shares in associated companies, non-current securities, and loans.
Investments in associated companies (generally investments of between 20% and 50% in a com-pany’s equity) where a significant influence is exercised by the Group are accounted for by using the equity method. An assessment of investments in associates is performed when there is an indication that the asset has been impaired or the impairment losses recognized in prior years no longer exist.
Non-current securities held on a long-term basis are initially recognized at acquisition costs includ-ing transaction costs and are classified as available-for-sale investments. In subsequent periods, other non-current securities held on a long-term basis are valued at fair value. Changes of these fair values are recognized as gains or losses directly in equity, until the security is disposed of or is determined to be impaired, at which time the cumulative gain or loss previously recognized in equity is included in profit or loss of the period. Interest on these non-current securities is recog-nized directly in the income statement in the period it incurs. Equity instruments that do not have a quoted market price in an active market and whose fair value cannot be reliably measured are recorded at cost.
Financial assets classified as loans and receivables are measured at amortized costs using the effective interest method less any impairment losses.
d. Finished goods, work in progress, materials, and suppliesInventories, including work in progress, are valued at the lower of cost and net realizable value after provision for obsolete and slow moving items. The net realizable value is the selling price in the ordinary course of business minus costs of completion, marketing, and distribution. Cost is determined primarily on the basis of the FIFO method. For processed inventories, cost includes the applicable allocation of fixed and variable overhead costs. Unrealizable inventory has been fully written off. Contracts other than construction contracts are valued at production costs. For these contracts, the revenue is recognized when the ownership of the goods is transferred (‘completed contract method’).
Annual financial report 2009 | Notes to the consolidated financial statements

35
e. Construction contractsReceivables from construction contracts and the related sales are accounted for using the percent-age of completion method. The construction contracts are determined by the terms of the individual contract, which are agreed at fixed prices. The extent of completion (‘stage of completion’) is established by the cost-to-cost method. Reliable estimates of the total costs and sales prices and the actual figures of the accumulated costs are available on a monthly basis. Estimated contract profits are recorded in earnings in proportion to recorded sales. In the cost-to-cost method, sales and profits are recorded after considering the ratio of accumulated costs to the estimated total costs to complete each contract. Changes to total estimated contract costs and losses, if any, are recognized in the income statement in the period in which they are determined. For remain-ing technological and financial risks which might occur during the remaining construction period, an individually assessed amount is included in the estimated contract costs. Impending losses out of the valuation of construction contracts are recognized immediately. Impending losses are recognized when it is probable that the total contract costs will exceed the contract revenues. For possible customer warranty claims, provisions are accounted for according to the profit realization. At the completion of a contract, the remaining warranty risk is reassessed.
f. Trade accounts receivableReceivables are stated at face value after allowances for doubtful accounts.
g. Marketable securitiesMarketable securities consist of government bonds, bonds of first-class banks, and bond funds. They are held for the purpose of investing in liquid funds and are not generally intended to be retained on a long-term basis. Marketable securities are initially recognized at acquisition costs, including transaction costs, and are classified as available-for-sale investments. In subsequent periods, marketable securities are valued at fair value. Changes of these fair values are recognized as gains or losses directly in equity, until the security is disposed of or is determined to be impaired. In case of a significant and not only temporary decline in value, impairment is recognized in the income statement.
h. Cash and cash equivalentsCash includes cash in hand and cash at banks. Cash equivalents might include short-term deposits with banks with original maturities of three months or less and that are not subject to any risk of change in value.
i. Share capitalOnly ordinary shares exist and all shares are issued and have the same rights.
The share capital of ANDRITZ AG amounts to TEUR 104,000 divided into 52,000,000 shares of no-par value.
Based on authorizations of the Shareholders’ Meeting and with approval from the Supervisory Board, the Executive Board has decided on programs for acquisition of up to 5,200,000 own shares between October 1, 2008 and March 31, 2011. In 2008, 241,646 own shares were acquired at an average price of EUR 23.40 per share. 15,000 own shares were resold at a price of EUR 9.38 per share and 304,000 own shares were resold at a price of EUR 31.67 per share to eligible executives under the management share option plan. 10,874 own shares were transferred to employees of ANDRITZ AG in the course of an employee participation program. In 2009, no shares were bought back. 310,000 own shares were resold at a price of EUR 31.67 per share to eligible executives under the management share option plan and 17,133 own shares were transferred to employees of ANDRITZ AG in the course of an employee participation program. At December 31, 2009, the company held 472,141 own shares at a market value of TEUR 19,131. It is planned to use these shares to service the management share option plan.
j. Capital reservesCapital Reserves are created in accordance with Austrian legal requirements and include share premium amounts.
Annual financial report 2009 | Notes to the consolidated financial statements

36
k. Retained earningsRetained earnings include retained income, IAS 39 reserve, actuarial gains and losses, and cur-rency translation adjustments.
l. ProvisionsA provision is recognized when, and only when, the enterprise has a present obligation (legal or constructive) as a result of a past event and it is probable (i.e. more likely than not) that an outflow of resources embodying economic benefits will be required to settle the obligation, and a reliable estimate can be made of the amount of the obligation. Provisions are reviewed at each balance sheet date and adjusted to reflect the current best estimate. Where the effect of the time value of money is material, the amount of a provision is the present value of the expenditures expected to be required to settle the obligation.
m. Financial instruments under IAS 39 and IFRS 7Financial assetsA financial instrument is a contract between two entities which creates a financial asset at one entity and a financial liability or equity instrument at another entity. If the Group qualifies as a party to the contract concerning the contract regulations, a financial asset or financial liability is recognized in the consolidated statement of financial position in accordance with the substance of the contrac-tual arrangement. Financial assets and liabilities include cash and cash equivalents, marketable securities, trade and other accounts receivable and payable, non-current receivables, borrowings, issued bonds, and other investments.
Financial instruments are recognized and derecognized on the trade date. This is the day of pur-chase or sale of a financial asset on which the contract terms require delivery of the financial asset within the timeframe established by the market concerned, and financial assets are initially mea-sured at fair value plus transaction costs, except for those financial assets classified as at fair value through profit or loss, which are initially measured at fair value without transaction costs. Financial instruments are offset when the Group has a legally enforceable right to offset and intends to settle either on a net basis or to realize the asset and settle the liability simultaneously.
Financial assets can be classified into the following specified categories: financial assets ‘at Fair Value Through Profit or Loss’ (FVTPL), ‘held-to-maturity investments’, ‘loans and receivables’ and ‘Available For Sale’ (AFS) financial assets. The classification depends on the nature and purpose of the financial assets and is determined at the time of initial recognition. ANDRITZ GROUP classifies its financial assets either under FVTPL, loans, and receivables or AFS.
Financial assets at FVTPLThe ANDRITZ GROUP classifies its financial assets at FVTPL if the financial asset is held for trading, which applies only to derivatives. The Group uses derivative financial instruments to manage its exposure to foreign exchange rate risk, changes in fair value of the bonds, and commodity price risk. Financial assets at FVTPL are stated at fair value, with any resulting gain or loss recognized in profit or loss unless the derivative is accounted for as a cash flow hedge with gains and losses recognized in equity.
Derivatives are initially recognized at fair value at the date a derivative contract is entered into and are subsequently remeasured to their fair value at each balance sheet date. Depending on the fair value of the derivative, it is either recognized under ‘other receivables’ or ‘other liabilities’, respec-tively bank loans and other financial liabilities.
AFS financial assetsAvailable-for-sale financial assets are non-derivative financial assets that are designated as avail-able-for-sale or are not classified as loans and receivables, held-to-maturity investments, or finan-cial assets at fair value through profit or loss. Equity securities (e.g. shares), debt securities (e.g. bonds), and other investments (e.g. fund shares) held by the ANDRITZ GROUP are designated as AFS financial assets.
AFS are stated at fair value. Gains and losses resulting from changes in fair value are recognized directly in equity in the investments revaluation reserve (IAS 39 reserve) with the exception of impairment losses, interest calculated using the effective interest method, and foreign exchange
Annual financial report 2009 | Notes to the consolidated financial statements

37
gains and losses on monetary assets, which are recognized directly through profit or loss. Where the investment is disposed of or is determined to be impaired, the cumulative gain or loss previ-ously recognized in the investments revaluation reserve is included in profit or loss for the period. Dividends on AFS equity instruments are recognized in profit or loss when the Group’s right to receive payments is established.
The fair value of AFS monetary assets denominated in a foreign currency is determined in that foreign currency and translated at the spot rate at the balance sheet date. The change in fair value attributable to translation differences that result from a change in amortized cost of the asset is recognized in profit or loss, and other changes are recognized in equity.
Loans and receivablesThe ANDRITZ GROUP classifies trade receivables, loans, and other receivables that have fixed or determinable payments that are not quoted in an active market as ‘loans and receivables’. Loans and receivables are measured at amortized costs less any impairment.
Impairment of financial assetsFinancial assets, other than those at FVTPL, are assessed for indicators of impairment at each balance sheet date. Financial assets are impaired where there is objective evidence that, as a result of one or more events that occurred after the initial recognition of the financial asset, the estimated future cash flows of the investment have been impacted. For financial assets carried at amortized costs, the amount of the impairment is the difference between the asset’s carrying amount and the present value of estimated future cash flows, discounted at the original effective interest rate.
The carrying amount of a financial asset is reduced by the impairment loss directly for all financial assets with the exception of trade receivables, where the carrying amount is reduced through the use of an allowance account. When a trade receivable is uncollectible, it is written off against the allowance account. Subsequent recoveries of amounts previously written off are credited against the allowance account. Changes in the carrying amount of the allowance account are recognized through profit or loss.
The previously recognized impairment loss is reversed through profit or loss up to the extent of the initial impairment, if in a subsequent period the amount of the impairment loss decreases and the decrease can be related objectively to an event occurring after the impairment was recognized. The reversal shall not result in a carrying amount of the financial asset that exceeds what the amor-tised cost would have been had the impairment not been recognized at the date the impairment is reversed. An exception is AFS equity instruments, for which any increase in fair value subsequent to an impairment loss is recognized directly in equity.
Financial liabilities and equity instruments issued by the Group Classification as debt or equityDebt and equity instruments are classified as either financial liabilities or as equity in accordance with the substance of the contractual arrangement.
Equity instrumentsAn equity instrument is any contract that evidences a residual interest in the assets of an entity after deducting all of its liabilities. Equity instruments are recorded at the proceeds received, net of direct issue costs.
Financial liabilitiesFinancial liabilities can be classified either as financial liabilities at FVTPL or other financial liabilities.
Financial liabilities at FVTPLThe ANDRITZ GROUP classifies financial liabilities at FVTPL if the financial liability is held for trading, which applies only to derivatives. The Group enters into a variety of derivative financial instruments to manage its exposure to foreign exchange rate risk, changes in fair value of the bonds, and com-modity price risk. Financial liabilities at FVTPL are stated at fair value, with any resulting gain or loss recognized in profit or loss unless the derivative is accounted for as a cash flow hedge with gains and losses recognized in equity.
Annual financial report 2009 | Notes to the consolidated financial statements

38
Other financial liabilitiesOther financial liabilities, including borrowings, are initially measured at fair value, net of transaction costs. Subsequently, they are measured at amortized costs using the effective interest method, with interest expense recognized on an effective yield basis.
Fair value of financial instrumentsThe fair value of financial assets (liabilities) is the amount for which an asset could be exchanged, or a liability settled, between knowledgeable, willing parties in an arm’s length transaction. In this context, a quoted market price is the best evidence for the fair value, if financial assets (liabilities) are traded on active markets. In case an active market does not exist, generally accepted valua-tion techniques are used to determine what the price would have been on the measurement date in an arm’s length exchange motivated by normal business considerations. Valuation techniques include using recent arm’s length market transactions between knowledgeable, willing parties, and if available, reference to the current fair value of another instrument that is substantially the same, discounted cash flow analysis and option pricing models. If no quoted market price (e.g. equity instruments) and no reliable valuation techniques are available, the financial instrument is measured at cost.
Effective interest method and amortized costsThe effective interest method is a method of calculating the amortized costs of a financial asset (liability) and of allocating interest income (expenses) over the relevant period. The effective interest rate is the rate that exactly discounts estimated future cash flows through the expected life of the financial asset (liability), or, where appropriate, a shorter period. Interest is recognized on a time proportion basis that reflects the effective interest rate of the asset (liability).
Hedge accountingThe Group designated the bonds issued and the corresponding interest rate swaps into a hedging relationship accounted for as a fair value hedge according to IAS 39.
At the inception of the hedge relationship, the ANDRITZ GROUP documented the relationship between the hedging instrument and hedged item, along with its risk management objectives and its strategy for undertaking various hedge transactions. Furthermore, at the inception of the hedge and on an ongoing basis, the Group documents whether the swaps are highly effective in offsetting changes in fair values or cash flows of the hedged item.
All investments in a foreign entity are long-term investments and presently a sale of such an invest-ment is not expected for the foreseeable future. According to the Group’s hedging policy, there are no hedges of net investments in foreign currencies.
Fair value hedgeApplying the rules for hedge accounting, the impact is that the gain or loss from remeasuring the hedging instrument at fair value is recognized through profit or loss. The gain or loss on the hedged item attributable to the changes of the hedged risk causes an adjustment of the carrying amount of the hedged item, which is also recognized through profit or loss. In this manner, the gains and losses resulting from the changes in fair value of the hedging instrument and the hedged item offset each other if the hedge is 100% effective.
Hedge accounting is discontinued when the Group revokes the hedging relationship, the hedging instrument expires or is sold, terminated, or exercised, or no longer qualifies for hedge accounting. The adjustment to the carrying amount of the hedged item arising from the hedged risk is amortized to profit or loss from that date.
Cash flow hedgeThe Group uses forward commodity contracts to mitigate exposure to commodity price risk out of projects. Changes in the fair value of a hedging instrument that qualifies as a highly effective cash flow hedge are recognized directly in the IAS 39 reserve in shareholders’ equity. Otherwise, for all other cash flow hedges, gains and losses initially recognized in equity are transferred from IAS 39 reserve to net profit or loss in the same period or periods during which the hedged firm commitment or forecast transaction affects the income statement.
Annual financial report 2009 | Notes to the consolidated financial statements

39
n. Other accounting and valuation principlesResearch and development costsExpenditure for research and development is charged as expense in the period incurred because the criteria for capitalization of development costs (IAS 38) are not met. In 2009, TEUR 49,247 and in 2008 TEUR 51,237 were recognized as expenses.
Government grantsInvestment grants are deducted from the cost of the asset. Performance-related grants are re-corded as other operating income.
Revenue recognition (except for construction contracts)Revenue is recognized when it is probable that the economic benefits associated with the transac-tion will flow to the enterprise and the amount of the revenue can be measured reliably. Sales are recognized net of sales taxes and discounts when delivery has taken place and transfer of risks and rewards has been completed.
Interest is recognized on a time-proportion basis that reflects the effective interest rate of the asset. Dividends are recognized when the shareholders’ right to receive payment is established.
Borrowing costsBorrowing costs that are directly attributable to the acquisition, construction, or production of a qualifying asset are capitalized as part of the cost of the asset. All other costs of borrowing are expensed in the period in which they are incurred.
Impairment of assetsProperty, plant, and equipment and intangible assets are reviewed for impairment whenever events or changes in circumstances indicate that the carrying amount of an asset may not be recover-able. Whenever the carrying amount of an asset exceeds its recoverable amount (the higher of fair value less costs to sell and value in use), an impairment loss is recognized in income for items of property, plant, and equipment and intangibles carried at cost. Recoverable amounts are estimated for individual assets or, if this is not possible, for the cash-generating unit.
Management share option plansDue to the fact that the management share option plans do not include cash-settlements, these corresponding expenses are recorded directly equity, according to the International Financial Re-porting Standards.
o. Foreign currencyForeign currency transactionsForeign currency transactions are recorded in the functional currency by applying the exchange rate between the functional currency and the foreign currency at the date of the transaction. Ex-change rate differences arising on the settlement of monetary items at rates different from those at which they were initially recorded during the periods are recognized in the income statement in the period in which they arise.
Foreign entitiesForeign consolidated subsidiaries are regarded as foreign entities since they are financially, eco-nomically, and organizationally autonomous. Their functional currencies are their respective local currencies. Financial statements of foreign consolidated subsidiaries are translated at year-end rates to the presentation currency with respect to the balance sheet. Expense and revenue items are translated using the average exchange rates for the year. All resulting translation differences are included in a currency translation reserve in equity.
As from 2005, any goodwill arising from the acquisition of a foreign entity is allocated to the acquired entity and is recorded using the exchange rate effective on the balance sheet date.
Annual financial report 2009 | Notes to the consolidated financial statements

40
Exchange differences arising on a monetary item that, in substance, forms part of the Group’s net investment in a foreign entity are classified as equity in the consolidated financial statements until disposal of the net investment.
p. Employee benefitsDefined benefit plans (provisions for pensions)Some Group companies provide defined benefit pension plans for certain employees. The funds are valued every year by professionally qualified independent actuaries. The obligation and costs of pension benefits are determined using the projected unit credit method. The projected unit credit method considers each period of service as giving rise to an additional unit of benefit en-titlement and measures each unit separately to build up the final obligation. Past service costs are recognized on a straight-line basis over the average period until the amended benefits become vested. Gains or losses on the curtailment or settlement of pension benefits are recognized when the curtailment or settlement occurs. In accordance with IAS 19.93A, actuarial gains and losses affecting provisions for pensions are recognized in equity in the year in which they occur with no effect on profit or loss. Interest expenses resulting from employee benefits are included in the consolidated income statement under interest result. The pension obligation is measured at the present value of estimated future cash flows using different discount rates for different countries. Other Group companies provide defined contribution plans for certain employees. The related costs are expensed as they occur.
Severance paymentsIn certain countries the Group is also obliged by law to pay termination indemnities in some cases of termination of employment. No termination indemnities are payable for voluntary termination at the request of the employee. Expenses related to termination indemnities are accrued. The funds are valued every year by professionally qualified independent actuaries. The obligation and costs of pension benefits are determined using the projected unit credit method. The projected unit credit method considers each period of service as giving rise to an additional unit of benefit entitlement and measures each unit separately to build up the final obligation. Past service costs are recognized on a straight-line basis over the average period until the amended benefits become vested. Gains or losses on the curtailment or settlement of employee benefits are recognized when the curtail-ment or settlement occurs. In accordance with IAS 19.93A, actuarial gains and losses affecting provisions for severance are recognized in equity in the year in which they occur with no effect on profit or loss. Interest expenses resulting from employee benefits are included in the consolidated income statement under interest result. The severance obligation is measured at the present value of estimated future cash flows using different discount rates for different countries.
q. Income taxesThe income tax charge is based on profit for the year and considers deferred taxation. Deferred taxes are calculated using the balance sheet liability method. Deferred income taxes reflect the net tax effects of temporary differences between the carrying amount of assets and liabilities for financial reporting purposes and the amount used for income tax purposes.
Deferred tax assets and liabilities are measured using the tax rates expected to apply to taxable income in the years in which those temporary differences are expected to be recovered or settled based on tax rates (and tax laws) that have been enacted or substantively enacted by the balance sheet date. The measurement of deferred tax assets and deferred tax liabilities reflects the tax consequences that would follow from the manner in which the enterprise expects, at the balance sheet date, to recover or settle the carrying amount of its assets and liabilities.
Deferred tax assets and liabilities are recognized regardless of when the timing difference is likely to reverse.
Deferred tax assets are recognized when it is probable that sufficient taxable profits will be avail-able against which the deferred tax assets can be utilized. At each balance sheet date, the Group reassesses unrecognized deferred tax assets and the carrying amount of deferred tax assets. The
Annual financial report 2009 | Notes to the consolidated financial statements
41
Group recognizes a previously unrecognized deferred tax asset to the extent that it has become probable that future taxable profit will allow the deferred tax asset to be recovered. The Group conversely reduces the carrying amount of a deferred tax asset to the extent that it is no longer probable that sufficient taxable profit will be available to allow the benefit of part or total of the deferred tax asset to be utilized.
Deferred tax is charged or credited directly to equity if the tax relates to items that are credited or charged, in the same or a different period, directly to equity, including exchange rate differences arising on the translation of inter-company loans.
r. Use of estimatesThe preparation of financial statements requires the Executive Board to make estimates and as-sumptions that can affect the reported amounts of assets, liabilities, revenues, and expenses as well as amounts reported in the notes. Actual results may differ from these estimates.
The Executive Board has made judgments in the process of applying the company’s accounting policies. Additionally, at the balance sheet date, the Executive Board made the following key as-sumptions concerning the future and has identified other key sources of estimation uncertainty at the balance sheet date that have a significant risk of causing a material adjustment to the carrying amounts of assets and liabilities within the next financial year:
a) Construction contracts: The accounting for construction contracts is based on estimations for costs and recoverable earnings. Although these estimations are based on all information available on the balance sheet date, substantial changes after the balance sheet date are possible. These changes could lead to adjustments of assets and may influence earnings in subsequent periods.
b) Employee benefits: The valuation of the various pension plans is based on a methodology us-ing some parameters, including the expected discount rate, rate of compensation and pension increase, and return on plan assets. If the relevant parameters developed materially differently than expected this could have a material impact on the company‘s defined benefit obligation and subsequently net periodic pension cost.
c) Impairments: The impairment analysis for goodwill, other intangible assets, and tangible assets is principally based upon discounted estimated future cash flows from the use and eventual dis-posal of the assets. Factors like lower than anticipated sales and resulting decreases of net cash flows and changes in the discount rates used could lead to impairments. Regarding the carrying value of goodwill, other intangible assets, and tangible assets see note f (notes to the consolidated statement of financial position).
d) Management share option plans: The share option plans are measured based on the fair value of the options on the granting date. The estimated fair value of these options is based on param-eters such as volatility, interest rate, share price, duration of the option, and expected dividend.
e) Deferred taxes: In assessing the recoverability of deferred tax assets, the Executive Board considers whether it is probable that all the deferred tax assets will be realized. The ultimate realiza-tion of deferred tax assets is dependent upon the generation of future taxable income during the periods in which the temporary differences become deductible. If the company does not generate sufficient taxable income, deferred tax assets on loss carry forwards cannot be used and a valua-tion allowance will need to be recorded.
s. ContingenciesContingent liabilities are not recognized in the financial statements. They are disclosed unless the possibility of an outflow of resources embodying economic benefits is remote. A contingent asset is not recognized in the financial statements but disclosed when an inflow of economic benefits is probable.
Annual financial report 2009 | Notes to the consolidated financial statements

42
Business areasFor management purposes, the Group is divided into five main business areas on a worldwide basis:
ANDRITZ HYDROElectromechanical systems – in particular, turbines, hydropower generators, and turbo generators – and services for new hydropower stations as well as for modernizations of existing hydropower sta-tions; pumps for the pulp and paper industry and for other applications (drinking water supply, etc.).
ANDRITZ PULP & PAPERPlants and services for the production of all types of pulp (chemical, mechanical, recycled fiber pulps), paper, board, tissue, and Medium Density Fiberboard (MDF); biomass boilers for power generation.
ANDRITZ METALSProduction and finishing lines for metallic strip, especially for carbon and stainless steel.
ANDRITZ ENVIRONMENT & PROCESSPlants, equipment, and services for solid/liquid separation for municipalities and industries (e.g. mining, chemical and petrochemical industries, food industry).
ANDRITZ FEED & BIOFUELPlants, equipment, and services for the production of animal feed and biomass pellets, especially wood pellets.
The strategic business areas are the basis upon which the Group reports its primary segment information. Financial information on business and geographical segments is presented according to IFRS 8 ‘Operating Segments’ in section h (segment information).
The accounting and valuation principles of the segments are the same as those described in note d.
According to the internal reporting structure, which is the basis for the primary segment informa-tion, all sales and all direct and indirect expenses (including overhead and administrative costs) are allocated to business areas and reflect the management structure of the organization and the predominant sources of risks and returns. The key measure of operating performance for the Group is Earnings Before Interest, Taxes, Depreciation, and Amortization (EBITDA). There are no material inter-segmental transactions. All consolidation entries are included in the relevant business area.
Transition encompasses corporate assets and liabilities as well as consolidation effects and elimi-nations.
External revenues allocated by geographical segments are based on the geographical location of the company’s customers.
The first–time adoption of IFRS 8 did not have any substantial effects on the consolidated financial statements.
Revenues from transactions with a single external customer do not amount to 10% or more of the Group’s revenues.
e. SEGMENTS
Annual financial report 2009 | Notes to the consolidated financial statements

43
f. NOTES TO THE CONSOLIDATED STATEMENT OF FINANCIALPOSITION1. Changes in intangible and tangible assets, goodwill, and shares in associated companiesAcquisition or production costs
2009
(in TEUR)
Balance as at
January 1, 2009
Currency translation
adjust-ments
Addi-tions
Change of consoli-
dation range
Dispo-sals
Trans-fers
Balance as at
December 31, 2009
Intangible assets 103,763 879 2,489 807 1,017 171 107,092Land and buildings 221,791 660 9,500 14 4,819 6,894 234,040Technical equipment and machinery 238,692 2,084 20,099 0 10,180 16,194 266,889
Other equipment, factory and office equipment 98,179 2,159 11,127 39 6,834 834 105,504
Assets under construction and advance payments 29,957 3,251 27,335 0 528 (24,093) 35,922Total property, plant, and equipment 588,619 8,154 68,061 53 22,361 (171) 642,355Total intangible and tangible assets 692,382 9,033 70,550 860 23,378 0 749,447
2008
(in TEUR)
Balance as at
January 1, 2008
Currency translation
adjust-ments Additions
Change of consoli-
dation range
Dispo-sals
Trans-fers
Balance as at
December 31, 2008
Intangible assets 79,507 50 6,002 18,356 353 201 103,763Land and buildings 202,266 918 3,960 11,865 1,219 4,001 221,791Technical equipment and machinery 195,998 (730) 23,224 26,222 7,962 1,940 238,692
Other equipment, factory and office equipment 97,627 (2,097) 14,734 4,640 16,712 (13) 98,179
Assets under construction and advance payments 11,428 (1,424) 21,777 5,165 860 (6,129) 29,957Total property, plant, and equipment 507,319 (3,333) 63,695 47,892 26,753 (201) 588,619Total intangible and tangible assets 586,826 (3,283) 69,697 66,248 27,106 0 692,382
Depreciation and amortization
2009
(in TEUR)
Balance as at
January 1, 2009
Currency translation
adjust-ments
Depreciation and amor-
tization for the year
Impair- ment
Dis- posals
Trans- fers
Balance as at
December 31, 2009
Intangible assets 47,372 362 14,613 703 232 56 62,874Land and buildings 73,399 (312) 6,989 1,121 835 (8) 80,354Technical equipment and machinery 129,025 (163) 22,694 1,906 5,393 766 148,835
Other equipment, factory and office equipment 58,450 711 14,114 1,067 6,363 (814) 67,165
Assets under construction and advance payments 11 0 0 0 0 0 11Total property, plant, and equipment 260,885 236 43,797 4,094 12,591 (56) 296,365Total intangible and tangible assets 308,257 598 58,410 4,797 12,823 0 359,239
Annual financial report 2009 | Notes to the consolidated financial statements

44
2008
(in TEUR)
Balance as at
January 1, 2008
Currency translation
adjust-ments
Depreciation and amor-
tization for the year
Impair- ment
Dis- posals
Trans- fers
Balance as at
December 31, 2008
Intangible assets 33,134 (60) 13,199 1,382 353 70 47,372Land and buildings 67,602 663 6,274 0 1,156 16 73,399Technical equipment and machinery 116,686 715 18,739 0 7,463 348 129,025
Other equipment, factory and office equipment 62,845 (987) 13,302 0 16,298 (412) 58,450
Assets under construction and advance payments 33 0 0 0 0 (22) 11Total property, plant, and equipment 247,166 391 38,315 0 24,917 (70) 260,885Total intangible and tangible assets 280,300 331 51,514 1,382 25,270 0 308,257
Net book value
2009
(in TEUR)
Costs as at December 31,
2009
Accumu- lated depre-
ciation
Net book value as at
December 31, 2009
Net book value as at
December 31, 2008
Intangible assets 107,092 62,874 44,218 56,391Land and buildings 234,040 80,354 153,686 148,392Technical equipment and machinery 266,889 148,835 118,054 109,667Other equipment, factory and office equipment 105,504 67,165 38,339 39,729Assets under construction and advance payments 35,922 11 35,911 29,946Total property, plant, and equipment 642,355 296,365 345,990 327,734Total intangible and tangible assets 749,447 359,239 390,208 384,125
Finance leasesThe net book value for technical equipment and machinery includes an amount of TEUR 272 (2008: TEUR 491) and the net book value for other equipment, factory and office equipment includes an amount of TEUR 571 (2008: TEUR 1,111) in respect of assets held under finance lease. The total of minimum lease payments at balance sheet date amounts to TEUR 1,136 (2008: TEUR 1,427). The lease contracts have terms from 60 up to 84 months.
GoodwillThe following table illustrates the changes in the carrying amount of goodwill for the periods ended December 31, 2008 and 2009:
(in TEUR)
Goodwill at December 31, 2007 227,083Currency translation adjustments -1,284Change of consolidation range 7,831Impairment -6,783Other changes 152Goodwill at December 31, 2008 226,999Currency translation adjustments 1,288Change of consolidation range 0Impairment -7,922Other Changes -471Goodwill at December 31, 2009 219,894
Annual financial report 2009 | Notes to the consolidated financial statements

45
(in TEUR) 2009 2008VA TECH HYDRO 97,837 97,840ANDRITZ Ahlstrom 21,386 28,486Acquisition of ANDRITZ AG 59,596 59,596Other 41,075 41,077
219,894 226,999
ImpairmentIn 2009, the goodwill arising from the acquisitions of ANDRITZ Ahlstrom, Lynson, and 3SYS met the characteristics for impairment because the businesses did not develop according to plan. The impairment of goodwill amounted to TEUR 7,922 and relates to the PULP & PAPER, METALS, and ENVIRONMENT & PROCESS business areas. The value of the reporting unit was estimated using discounted cash flow forecasts using a weighted average cost of capital of 7.27% and 12.00%, respectively. In 2008, impairment of goodwill was at TEUR 6,783.
Furthermore, in 2009 the company recorded impairment charges in the amount of TEUR 4,797 for intangible and tangible assets predominantly in the PULP & PAPER business area. In 2008, an impairment loss of TEUR 1,382 was recognized for intangible assets.
Shares in associated companiesAccumulated assets of material associated companies included in the consolidated balance sheet as of December 31, 2009 amounted to TEUR 149,591 (December 31, 2008: TEUR 139,227), total liabilities to TEUR 140,549 (December 31, 2008: TEUR 129,301), sales amounted to TEUR 57,748 (2008: TEUR 76,477) and net income amounted to TEUR 765 (2008: TEUR 2,492).
2. Non-current receivables and other non-current assetsNon-current receivables and other non-current assets consist of trade accounts receivable and other non-current receivables.
3. Inventories
(in TEUR) 2009 2008Finished goods 52,993 65,706Work in progress 141,966 156,364Materials and supplies 124,921 137,981
319,880 360,051
Impairment losses of TEUR 7,909 (2008: TEUR 10,045) were recognized for products in cases where the net realizable value (selling price less selling and administrative expenses) was less than the acquisition or production cost or for obsolete and slow-moving items.
4. Advance payments madeThe advance payments made and presented in the balance sheet relate to open purchase orders for ongoing contracts.
5. Trade accounts receivableTotal trade receivables (net of allowances) at December 31, 2009 amounted to TEUR 464,830 (2008: TEUR 432,436), whereas the non-current portion is included in the balance sheet item non-current receivables and other non-current assets.
Annual financial report 2009 | Notes to the consolidated financial statements

46
(in TEUR) 2009 2008Trade accounts receivable – current 454,691 424,947Trade accounts receivable – non-current 10,139 7,489
464,830 432,436Thereof neither past due nor impaired 306,282 299,689Thereof past due but not impaired 147,659 120,009Therof impaired 34,129 37,398Valuation allowance (23,240) (24,660)
464,830 432,436
The average credit period on sales of goods depending on the business area is 30 to 90 days. Before accepting any new customer, the Group uses an internal credit scoring system to assess the potential customer’s credit quality and defines credit limits by customer. Limits and scoring at-tributed to customers are reviewed on an ongoing basis. About two-thirds of the trade receivables are neither past due nor impaired.
Included in the Group’s trade receivable balance are debtors with a carrying amount of TEUR 147,659 (2008: TEUR 120,009) which are past due at the reporting date for which the Group has not recognized any allowance as there has not been a significant change in credit quality and the amounts are still considered recoverable.
The roll-forward of the valuation allowance for trade accounts receivable is as follows:
(in TEUR) 2009 2008Allowance at beginning of the year (24,660) (14,670)Currency translation adjustments (948) 441Charged to expenses (10,732) (13,853)Amounts written-off 6,220 2,157Released 6,880 1,265Allowance at the end of the year (23,240) (24,660)
The trade receivables past due but not impaired at December 31, were as follows:
(in TEUR) 2009 2008Up to 60 days past due 90,574 65,36861 to 120 days past due 21,210 24,809More than 120 days past due 35,875 29,832
147,659 120,009
In determining the recoverability of a trade receivable, the Group considers any change in the credit quality of the trade receivable from the date credit was initially granted up to the reporting date. This determination also regards collateralization of payments by bank guarantees and export insurance. The Executive Board believes that no further credit provision is required in excess of the allowance for doubtful debts already recognized.
6. Construction contracts
(in TEUR) 2009 2008Contract revenue recognized as sales in the current period 2,227,104 2,552,489
Contract costs incurred and recognized profits (less recognized losses) to date 4,911,387 4,672,420Advances received and progress billings 5,250,339 4,848,049Amount of retentions 17,261 15,712
The receivables recorded in the financial position for ‘Cost and earnings of projects under construc-tion in excess of billings’ fall entirely in the category neither past due nor impaired.
Annual financial report 2009 | Notes to the consolidated financial statements

47
7. Other receivables
(in TEUR) 2009 2008Receivables from associated companies 3,394 4,500Foreign exchange forward contracts at fair value 13,297 18,960Commodity forward contracts at fair value 1,300 0Receivables from value-added tax 50,852 42,791Receivables from prepaid income taxes 18,503 19,754Receivables from other taxes and charges 4,500 4,802Prepayments and deferred charges 16,842 11,084Other 120,358 94,498
229,046 196,389thereof other current receivables 201,378 171,270thereof other non-current receivables 27,668 25,119
229,046 196,389
The Executive Board considers that the carrying amount of other receivables corresponds to their fair value.
8. Retained earningsDividendsFor 2009, a dividend of EUR 1.00 per outstanding share is proposed by the Executive Board. The dividend for 2008 of TEUR 56,321, which is equal to EUR 1.10 per share, was proposed by the Executive Board and was approved at the 102nd Annual General Meeting of Shareholders on March 27, 2009. The dividend was paid to the shareholders on April 3, 2009.
On February 25, 2010, the Executive Board authorized the consolidated financial statements for the year ended December 31, 2009 according to IFRS. On February 26, 2009, the Executive Board authorized submission of the consolidated financial statements for the year ended December 31, 2008 according to IFRS to its Supervisory Board. The Supervisory Board is made up solely of members not employed within the Group and representatives of employees. The consolidated financial statements were presented to the Supervisory Board and subsequently to the General Meeting of Shareholders.
Additional capital disclosuresANDRITZ is committed to a strong financial profile, characterized by a conservative capital structure that gives excellent financial flexibility.
As of December 31, 2009 and 2008, equity and total assets of the company were as follows:
(in TEUR) 2009 2008Total equity 663,492 577,382Equity ratio 20.0% 18.7%Total assets 3,309,283 3,086,301
ANDRITZ is not subject to any statutory capital requirements. Commitments exist to sell or other-wise issue common shares in connection with established share-based payment plans. In recent years, commitments from share-based payment have primarily been satisfied through buyback of the company’s shares (see note 10).
The Group manages its capital to ensure that entities in the Group will be able to continue as a going concern while maximizing the return to shareholders through the optimization of the debt and equity balance. Three bonds were issued in the past to safeguard the financial stability, and also to build the foundation for further growth of the ANDRITZ GROUP. The capital structure of the Group con-sists of debt, which includes the borrowings, of cash and cash equivalents and equity attributable to equity holders of the parent, comprising share capital, capital reserves, and retained earnings.
Annual financial report 2009 | Notes to the consolidated financial statements

48
The capital structure is reviewed on an ongoing basis. As a part of this review, the cost of capital and the risks associated with each class of capital are considered. Based on this, the Group will balance its overall capital structure through the payment of dividends, new share issues, and share buy-backs as well as the issue of new debt or the redemption of existing debt.
The Group’s overall strategy remains unchanged from 2008.
9. Provisions
2009
(in TEUR)
Balance as at
January 1, 2009
Currency translation
adjust-ments
Change of conso-
lidation range
Re-classi-
fication UseRever-
salAd-
dition
Balance as at
December 31, 2009
Provisions for severance payments 81,506 (17) 0 0 9,386 5 1,740 73,838Provisions for pensions 68,341 832 0 0 4,276 945 (2,496) 61,456Order-related non-current provisions 51,156 1,524 0 (2,344) 8,197 4,163 20,832 58,808Other non-current provisions 16,144 130 (66) 0 677 24 247 15,754Non-current provisions 217,147 2,469 (66) (2,344) 22,536 5,137 20,323 209,856Order-related current provisions 247,567 6,139 0 2,344 40,652 33,421 113,198 295,175Other current provisions 12,558 260 0 0 7,044 2,896 22,035 24,913Current provisions 260,125 6,399 0 2,344 47,696 36,317 135,233 320,088
2008
(in TEUR)
Balance as at
January 1, 2008
Currency translation
adjust-ments
Change of conso-
lidation range
Re-classi-
fication UseRever-
salAd-
dition
Balance as at
December 31, 2008
Provisions for severance payments 79,930 79 0 0 6,014 3 7,514 81,506Provisions for pensions 56,965 1,810 9,098 0 10,024 262 10,754 68,341Order-related non-current provisions 32,511 196 17,351 (3,550) 4,202 8,736 17,586 51,156Other non-current provisions 14,808 (13) 7 0 146 10 1,498 16,144Non-current provisions 184,214 2,072 26,456 (3,550) 20,386 9,011 37,352 217,147Order-related current provisions 215,396 (2,350) 33,018 3,365 35,727 38,052 71,917 247,567Other current provisions 2,796 9 1,269 185 1,709 393 10,401 12,558Current provisions 218,192 (2,341) 34,287 3,550 37,436 38,445 82,318 260,125
Order-related provisions include primarily warranties, contingencies, and impending losses.
10. Employee benefit obligationsPensionsSome Group companies provide defined benefit pension plans for some classes of employees. Provisions for pension obligations are established for benefits payable in the form of retirement, disability, and surviving dependent pensions. The benefits offered vary according to the legal, fiscal, and economic conditions of each country. Benefits are dependent on years of service and, in some cases, on the respective employee’s compensation.
Annual financial report 2009 | Notes to the consolidated financial statements

49
The following table shows the changes of the pension benefit obligations for the years ended December 31, 2009 and 2008:
(in TEUR) 2009 2008Defined benefit obligation as at January 1 170,449 143,350Currency translation adjustments 2,993 7,870Current service cost 5,444 5,069Interest cost on obligations 7,603 6,247Actuarial gains/losses (2,031) (8,766)Benefits paid (18,766) (11,650)Contributions by the plan participants 2,310 1,732Past service cost 74 201Effect of any curtailment or settlement (945) (262)Change of consolidation range 0 26,658Defined benefit obligation as at December 31 167,131 170,449Fair value of plan assets (105,675) (102,108)Accrued liability as at December 31 61,456 68,341
Total pension obligations of TEUR 167,131 (2008: TEUR 170,449) include TEUR 114,194 (2008: TEUR 123,899) that are covered in part or in full by investments in funds (plan assets).
The following table shows the development of the fair value of the plan assets:
(in TEUR) 2009 2008Fair value of plan assets as at January 1 102,108 86,385Currency translation adjustments 2,161 6,060Expected return on plan assets 4,753 4,785Actuarial gains/losses 2,481 (17,365)Contributions by the employer 6,352 4,577Contributions by the plan participants 2,310 1,732Benefits paid (14,490) (1,626)Change of consolidation range 0 17,560Fair value of plan assets as at December 31 105,675 102,108
The split of fair values of the plan assets is as follows:
(in TEUR) 2009 2008Equity instruments 17,950 30,345Debt instruments 57,258 39,164Property 16,129 15,132Other assets 14,338 17,467
105,675 102,108
Pension expense is comprised of the following:
(in TEUR) 2009 2008Current service cost 5,444 5,069Past service cost 74 201Effect of any curtailment or settlement (945) (262)
4,573 5,008Payments to defined contribution plans 17,944 18,470
22,517 23,478
Annual financial report 2009 | Notes to the consolidated financial statements

50
Principal actuarial assumptions used to determine pension obligations as of December 31, 2009 and 2008 were as follows:
(in %) 2009 2008from to from to
Discount rate 2.00 7.50 2.00 7.50Wage and salary increases 1.00 4.67 1.00 4.50Retirement benefit increases 0.25 3.25 0.25 3.25Expected return on plan assets 2.00 6.25 0.00 6.25
The average expected return is assumed according to the portfolio structure of the plan assets, consideration of historical returns, as well as future estimates of long-term investment returns. In 2009, the actual return on plan assets was 6.58% (2008: actual loss of 4.08%).
Experience adjustments are as follows:
(in TEUR) 2009 2008 2007 2006Present value of defined benefit obligation 167,131 170,449 143,350 147,136Fair value of plan assets 105,675 102,108 86,385 87,818Deficit of the plan 61,456 68,341 56,965 59,318
Experience adjustments of the defined benefit obligation (7,489) (15,112) 341 18Experience adjustments of the plan assets 2,081 (1,895) (917) (165)
The expected payments to pension funds for defined benefits are TEUR 4,726 for the fiscal year 2010.
Severance paymentsThe following table shows the changes in the severance benefit obligations for the years ended December 31, 2009 and 2008:
(in TEUR) 2009 2008Defined benefit obligation as at January 1 81,741 80,075Currency translation adjustments (17) 79Current service cost 2,538 6,297Interest cost on obligations 4,165 3,403Actuarial gains/losses (4,963) (2,186)Benefits paid (9,247) (5,924)Effect of any curtailment or settlement (5) (3)Defined benefit obligation as at December 31 74,212 81,741Fair value of plan assets (374) (235)Accrued liability as at December 31 73,838 81,506
Severance expense is comprised of the following:
(in TEUR) 2009 2008Current service cost 2,538 6,297Effect of any curtailment or settlement (5) (3)
2,533 6,294Payments to defined contribution plans 1,148 968
3,681 7,262
Annual financial report 2009 | Notes to the consolidated financial statements

51
Experience adjustments are as follows:
(in TEUR) 2009 2008 2007 2006Present value of defined benefit obligation 74,212 81,741 80,075 75,043Fair value of plan assets 374 235 145 0Deficit of the plan 73,838 81,506 79,930 75,043
Experience adjustments of the defined benefit obligation 6,411 529 (5,264) (1,808)Experience adjustments of the plan assets (9) 18 0 0
Principal actuarial assumptions used to determine severance obligations were the same as used for pension obligations.
Management share option planThe 99th Annual General Meeting of Shareholders held on March 29, 2006 adopted a share option program for managers and members of the Executive Board. The number of options granted to the different managers varies depending on the area of responsibility, between 6,000, 10,000, and 20,000 shares for managers, to 40,000 for Executive Board members, and 50,000 for the Chief Executive Officer (CEO). The options are to be drawn from the pool of shares bought back under the corporate share buy-back program. One share option entitles the holder to the purchase of one share. In order to exercise a share option, eligible persons must be in active employment with ANDRITZ AG or one of its affiliates from May 1, 2006 until before each date of exercise of an op-tion. Another requirement is that managers must have invested at least EUR 20,000 in ANDRITZ shares from their own resources, and the members of the Executive Board at least EUR 40,000.
The exercise price of the option is the unweighted average closing price of ANDRITZ shares in the four calendar weeks following the 99th Annual General Meeting of Shareholders held on March 29, 2006.
The options can be exercised between May 1, 2008 and April 30, 2010 (=period of exercise) provided that the average unweighted closing price of the ANDRITZ share over twenty consecu-tive trading days within the period from May 1, 2008 to April 30, 2009 is at least 15% above the exercise price and the earnings per share in business year 2007 (based on the total number of shares listed); or that the earnings per share in business year 2008 (based on the total number of shares listed) are at least 15% above the earnings per share in business year 2005 (based on the total number of shares listed); or that the average unweighted closing price of the ANDRITZ share over twenty consecutive trading days within the period from May 1, 2009 to April 30, 2010 is at least 20% above the exercise price and the earnings per share in business year 2008 (based on the total number of shares listed) or the earnings per share in business year 2009 (based on the total number of shares listed) are at least 20% above the earnings per share in business year 2005 (based on the total number of shares listed).
If the conditions of exercise are met, 50% of the options can be exercised immediately, 25% after three months, and the remaining 25% after a further three months. Share options can only be exercised by way of written notification to the company. The share options are not transferable. The shares purchased under the share option program are not subject to a ban on sales over a certain period.
The options granted in 2006 totalled 944,000. The fair value of the options at the time of granting amounts to TEUR 6,492, whereas no expense incurred in 2009. The calculation of the fair value is based on the Black-Scholes option pricing model. The share price at the time of granting the op-tions is the closing price of the ANDRITZ share on June 1, 2006 and amounts to EUR 32.44. The exercise price of EUR 31.67 was calculated in accordance with the rules of the option program. For the lifetime of the options a period of two years was assumed. The expected dividend yield was fixed at 2.5%, a discount rate of 4.5% was used. As expected volatility, the value released by the Vienna Stock Exchange was applied. Further parameters of granting the options were not used.
Annual financial report 2009 | Notes to the consolidated financial statements

52
The 101st Annual General Meeting of Shareholders held on March 27, 2008 adopted another share option program for managers and members of the Executive Board. The number of options granted to the different managers varies depending on the area of responsibility, between 6,000, 10,000, and 20,000 shares for managers, to 40,000 for Executive Board members, and 50,000 for the Chief Executive Officer (CEO). The options are to be drawn from the pool of shares bought back under the corporate share buy-back program. One share option entitles the holder to the purchase of one share. In order to exercise a share option, eligible persons must be in active employment with ANDRITZ AG or one of its affiliates from May 1, 2008 until before each date of exercise of an option. Another requirement is that managers must have invested at least EUR 20,000 in ANDRITZ shares from their own resources, and the members of the Executive Board at least EUR 40,000.
The exercise price of the option is the unweighted average closing price of ANDRITZ shares in the four calendar weeks following the 101st Annual General Meeting of Shareholders held on March 27,2008.
The options can be exercised between May 1, 2010 and April 30, 2012 (=period of exercise) provided that the average unweighted closing price of the ANDRITZ share over twenty consecu-tive trading days within the period from May 1, 2010 to April 30, 2011 is at least 15% above the exercise price and the earnings per share in business year 2009 (based on the total number of shares listed); or that the earnings per share in business year 2010 (based on the total number of shares listed) are at least 15% above the earnings per share in business year 2007 (based on the total number of shares listed); or that the average unweighted closing price of the ANDRITZ share over twenty consecutive trading days within the period from May 1, 2011 to April 30, 2012 is at least 20% above the exercise price and the earnings per share in business year 2010 (based on the total number of shares listed) or the earnings per share in business year 2011 (based on the total number of shares listed) are at least 20% above the earnings per share in business year 2007 (based on the total number of shares listed).
If the conditions of exercise are met, 50% of the options can be exercised immediately, 25% after three months, and the remaining 25% after a further three months. Share options can only be exercised by way of written notification to the company. The share options are not transferable. The shares purchased under the share option program are not subject to a ban on sales over a certain period.
The shares purchased under the share option program are not subject to a ban on sales over a certain period. The options granted in 2008 totalled 1,100,000. The fair value of the options at the time of granting amounts to TEUR 9,396, thereof TEUR 4,698 have been reported as proportion-ate expense in 2009. The calculation of the fair value is based on the Black-Scholes option pricing model. The share price at the time of granting the options is the closing price of the ANDRITZ share on May 5, 2008 and amounts to EUR 39.55. The exercise price of EUR 35.44 was calculated in accordance with the rules of the option program. For the lifetime of the options a period of two years was assumed. The expected dividend yield was fixed at 2.5%, a discount rate of 4.5% was used. As expected volatility, the value released by the Vienna Stock Exchange was applied. Further parameters of granting the options were not used.
Movements in options under the stock option plans for financial years 2009 and 2008 were as follows:
2009 2008
Number of options
Average exercise price
per option (in EUR)
Number of options
Average exercise price
per option (in EUR)
Total at the beginning of the year 1,678,000 34.14 913,000 31.30Options granted 0 0 1,100,000 35.44Options exercised (310,000) 31.67 (319,000) 30.62Options forfeited (34,000) 35.44 (16,000) 31.67Total at the end of the year 1,334,000 34.68 1,678,000 34.14
Exercisable at year-end 268,000 31.67 578,000 31.67
Annual financial report 2009 | Notes to the consolidated financial statements
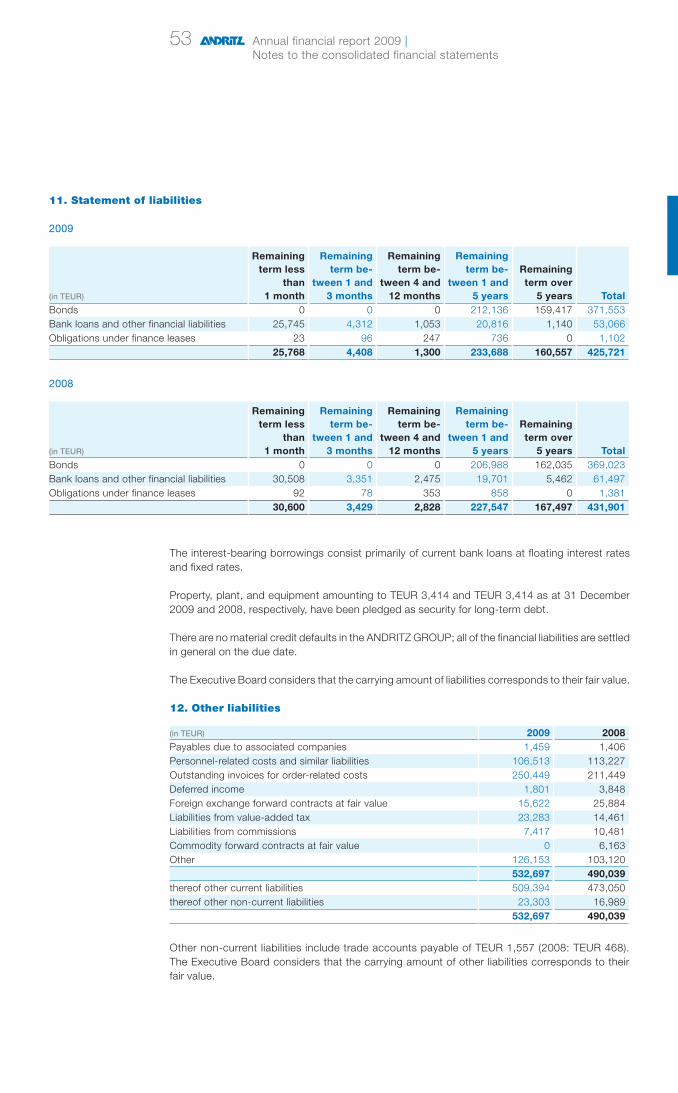
53
11. Statement of liabilities
2009
(in TEUR)
Remaining term less
than 1 month
Remaining term be-
tween 1 and 3 months
Remaining term be-
tween 4 and 12 months
Remaining term be-
tween 1 and 5 years
Remaining term over
5 years TotalBonds 0 0 0 212,136 159,417 371,553Bank loans and other financial liabilities 25,745 4,312 1,053 20,816 1,140 53,066Obligations under finance leases 23 96 247 736 0 1,102
25,768 4,408 1,300 233,688 160,557 425,721
2008
(in TEUR)
Remaining term less
than 1 month
Remaining term be-
tween 1 and 3 months
Remaining term be-
tween 4 and 12 months
Remaining term be-
tween 1 and 5 years
Remaining term over
5 years TotalBonds 0 0 0 206,988 162,035 369,023Bank loans and other financial liabilities 30,508 3,351 2,475 19,701 5,462 61,497Obligations under finance leases 92 78 353 858 0 1,381
30,600 3,429 2,828 227,547 167,497 431,901
The interest-bearing borrowings consist primarily of current bank loans at floating interest rates and fixed rates.
Property, plant, and equipment amounting to TEUR 3,414 and TEUR 3,414 as at 31 December 2009 and 2008, respectively, have been pledged as security for long-term debt.
There are no material credit defaults in the ANDRITZ GROUP; all of the financial liabilities are settled in general on the due date.
The Executive Board considers that the carrying amount of liabilities corresponds to their fair value.
12. Other liabilities
(in TEUR) 2009 2008Payables due to associated companies 1,459 1,406Personnel-related costs and similar liabilities 106,513 113,227Outstanding invoices for order-related costs 250,449 211,449Deferred income 1,801 3,848Foreign exchange forward contracts at fair value 15,622 25,884Liabilities from value-added tax 23,283 14,461Liabilities from commissions 7,417 10,481Commodity forward contracts at fair value 0 6,163Other 126,153 103,120
532,697 490,039thereof other current liabilities 509,394 473,050thereof other non-current liabilities 23,303 16,989
532,697 490,039
Other non-current liabilities include trade accounts payable of TEUR 1,557 (2008: TEUR 468). The Executive Board considers that the carrying amount of other liabilities corresponds to their fair value.
Annual financial report 2009 | Notes to the consolidated financial statements

54
13. Sales
(in TEUR) 2009 2008Contract revenue recognized as sales in the current period 2,227,104 2,552,489Other 970,413 1,057,323
3,197,517 3,609,812
14. Other operating income
(in TEUR) 2009 2008Profit on disposal of intangible and tangible assets 991 732Exchange rate gains 12,487 36,896Rental income 2,866 2,677Other 36,532 35,414
52,876 75,719
15. Personnel expenses
(in TEUR) 2009 2008Wages and salaries 592,378 595,890Pension expenses 22,517 23,478Severance expenses 3,681 7,262Social security and payroll-related duties 102,312 103,808Other social payments 39,523 27,001
760,411 757,439
16. Other operating expenses
(in TEUR) 2009 2008Exchange rate losses 15,094 51,240Sales expenses 187,999 221,341Administrative expenses 32,990 38,264Rents and leases 33,266 28,007Change of allowance of trade receivables 10,732 12,588Loss on disposal of intangible and tangible assets 1,543 396Other 141,699 151,358
423,323 503,194
17. Financial result
(in TEUR) 2009 2008Income/(expense) from associated companies (1,339) 5Interest and similar income 23,154 37,242Interest and similar expenses (22,665) (37,927)Interest result 489 (685)Other financial income/(expense), net 3,409 (7,396)
2,559 (8,076)
Interest and similar expenses include TEUR 6,888 (2008: TEUR 4,848) interest cost on pension and severance obligations as well as expected return on plan assets.
18. Income taxes
(in TEUR) 2009 2008Current tax expense (60,661) (79,858)Changes in deferred taxes charged to the income statement 13,945 16,437
(46,716) (63,421)
g. NOTES TO THE CONSOLI-
DATED INCOME STATEMENT
Annual financial report 2009 | Notes to the consolidated financial statements
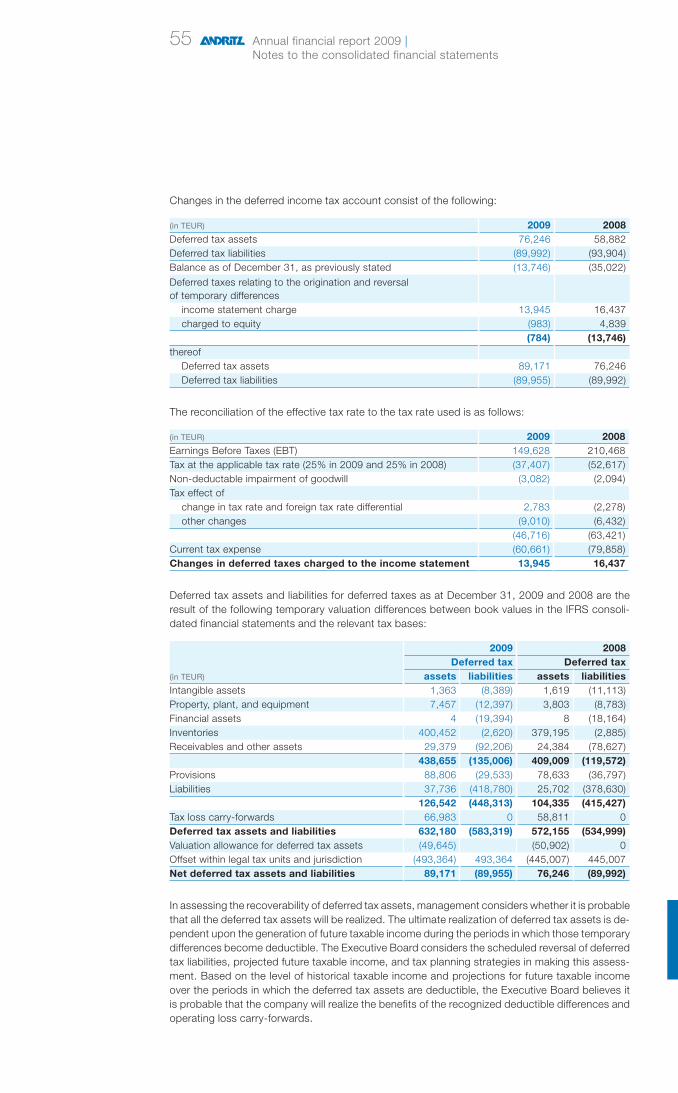
55
Changes in the deferred income tax account consist of the following:
(in TEUR) 2009 2008Deferred tax assets 76,246 58,882Deferred tax liabilities (89,992) (93,904)Balance as of December 31, as previously stated (13,746) (35,022)
Deferred taxes relating to the origination and reversal of temporary differences
income statement charge 13,945 16,437charged to equity (983) 4,839
(784) (13,746)thereof
Deferred tax assets 89,171 76,246Deferred tax liabilities (89,955) (89,992)
The reconciliation of the effective tax rate to the tax rate used is as follows:
(in TEUR) 2009 2008Earnings Before Taxes (EBT) 149,628 210,468Tax at the applicable tax rate (25% in 2009 and 25% in 2008) (37,407) (52,617)Non-deductable impairment of goodwill (3,082) (2,094)Tax effect of
change in tax rate and foreign tax rate differential 2,783 (2,278)other changes (9,010) (6,432)
(46,716) (63,421)Current tax expense (60,661) (79,858)Changes in deferred taxes charged to the income statement 13,945 16,437
Deferred tax assets and liabilities for deferred taxes as at December 31, 2009 and 2008 are the result of the following temporary valuation differences between book values in the IFRS consoli-dated financial statements and the relevant tax bases:
2009 2008Deferred tax Deferred tax
(in TEUR) assets liabilities assets liabilitiesIntangible assets 1,363 (8,389) 1,619 (11,113)Property, plant, and equipment 7,457 (12,397) 3,803 (8,783)Financial assets 4 (19,394) 8 (18,164)Inventories 400,452 (2,620) 379,195 (2,885)Receivables and other assets 29,379 (92,206) 24,384 (78,627)
438,655 (135,006) 409,009 (119,572)Provisions 88,806 (29,533) 78,633 (36,797)Liabilities 37,736 (418,780) 25,702 (378,630)
126,542 (448,313) 104,335 (415,427)Tax loss carry-forwards 66,983 0 58,811 0Deferred tax assets and liabilities 632,180 (583,319) 572,155 (534,999)Valuation allowance for deferred tax assets (49,645) (50,902) 0Offset within legal tax units and jurisdiction (493,364) 493,364 (445,007) 445,007Net deferred tax assets and liabilities 89,171 (89,955) 76,246 (89,992)
In assessing the recoverability of deferred tax assets, management considers whether it is probable that all the deferred tax assets will be realized. The ultimate realization of deferred tax assets is de-pendent upon the generation of future taxable income during the periods in which those temporary differences become deductible. The Executive Board considers the scheduled reversal of deferred tax liabilities, projected future taxable income, and tax planning strategies in making this assess-ment. Based on the level of historical taxable income and projections for future taxable income over the periods in which the deferred tax assets are deductible, the Executive Board believes it is probable that the company will realize the benefits of the recognized deductible differences and operating loss carry-forwards.
Annual financial report 2009 | Notes to the consolidated financial statements

56
19. Earnings per shareBasic earnings per share (see consolidated income statement) are calculated by dividing the net income for the period attributable to shareholders of the parent company by the weighted aver-age number of ordinary shares outstanding during the period. Diluted basic earnings per share are calculated by dividing the net income for the period attributable to shareholders of the parent company by the weighted average number of ordinary shares outstanding during the period with consideration of share options.
Segment information is prepared on the following basis:
Business areasThe ANDRITZ GROUP conducts its business activities through the following business areas:a. HYDRO (HY)b. PULP & PAPER (PP)c. METALS (ME)d. ENVIRONMENT & PROCESS (EP)e. FEED & BIOFUEL (FB)
Geographical segmentsThe Group’s activities are conducted predominantly in Europe, North America, South America, and Asia.
2009Business area data
(in TEUR) HY PP ME EP FB Transition TotalSales 1,378,035 903,330 473,378 322,605 120,169 0 3,197,517
Earnings Before Interest, Taxes, Depreciation, and Amortization (EBITDA) 120,897 41,964 23,157 29,333 2,847 0 218,198Total assets 1,167,590 560,423 215,837 230,968 75,731 1,058,734 3,309,283Total liabilities 1,052,713 500,486 171,975 107,773 41,509 771,335 2,645,791Capital expenditure 44,521 14,921 2,011 5,675 3,422 0 70,550
Depreciation, amortization, and impairment of intangible assets and property, plant, and equipment* 28,463 24,967 3,233 4,693 1,851 0 63,207Share of net profit/(loss) of associates (1,923) 602 (18) 0 (1,339)Shares in associated companies 5,978 2,810 609 0 9,397
* Depreciation, amortization, and impairment of intangible assets and property, plant, and equipment includes TEUR 9,109, which refers to amortization of identifiable intangible assets acquired in a business combination and recognized separately from goodwill.
Geographical segment data
(in TEUR) EuropeNorth
AmericaSouth
America Asia
Rest of the world and
consolidation TotalExternal sales 1,440,600 511,049 347,532 769,861 128,475 3,197,517Total assets 4,293,477 475,991 330,815 393,593 (2,184,593) 3,309,283Capital expenditure 35,025 5,288 13,532 16,331 374 70,550
h. SEGMENT INFORMATION
Annual financial report 2009 | Notes to the consolidated financial statements

57
2008Business area data
(in TEUR) HY PP ME EP FB Transition TotalSales 1,205,899 1,326,565 566,208 366,639 144,501 0 3,609,812
Earnings Before Interest, Taxes, Depre-ciation, and Amortization (EBITDA) 105,759 84,509 42,577 32,115 13,263 0 278,223Total assets 1,067,787 685,364 230,998 250,468 89,743 761,941 3,086,301Total liabilities 925,946 513,722 204,181 128,228 39,162 697,680 2,508,919Capital expenditure 35,046 20,156 4,265 7,374 2,856 0 69,697
Depreciation, amortization, and impairment of intangible assets and property, plant, and equipment* 24,722 18,678 2,970 4,862 1,664 0 52,896Share of net profit/(loss) of associates 0 1,153 0 (889) (259) 0 5Shares in associated companies 0 5,867 0 2,806 627 0 9,300
* Depreciation, amortization, and impairment of intangible assets and property, plant, and equipment includes TEUR 7,862, which refers to amortization of identifiable intangible assets acquired in a business combination and recognized separately from goodwill.
Geographical segment data
(in TEUR) EuropeNorth
AmericaSouth
America Asia
Rest of the world and
consolidation TotalExternal sales 1,716,187 507,560 408,914 762,840 214,311 3,609,812Total assets 4,115,978 538,125 212,167 327,518 (2,107,487) 3,086,301Capital expenditure 43,791 4,626 8,604 12,129 547 69,697
Cash flows from acquisition of subsidiaries*
Business Area Total Total
(in TEUR) HYDROPULP & PAPER METALS 2009 2008
Intangible assets 0 807 0 807 18,382Property, plant, and equipment 0 53 0 53 49,524Inventories 0 697 0 697 46,831
Trade and other receivables excluding financial assets 0 18 0 18 86,423Liabilities excluding financial liabilities 0 (1,065) 0 (1,065) (230,802)Non-interest bearing net assets 0 510 0 510 (29,642)Cash and cash equivalents acquired 0 0 0 0 113,730Debt assumed 0 0 0 0 (7,420)Goodwill 0 0 0 0 5,420Changes in non-controlling interests 0 0 0 0 (17,596)
Purchase price for investments previously accounted under the equity method 0 0 0 0 (64)Total purchase price 0 510 0 510 64,428
Purchase price paid 0 (510) 0 (510) (64,428)
Changes in receivables due to acquisitions of prior years not affecting net income 17,749 0 0 17,749 0Cash and cash equivalents acquired 0 0 0 0 113,730Net cash flow 17,749 (510) 0 17,239 49,302* converted by using exchange rates as per dates of transaction
i. NOTES TO THE CONSOLI-DATED STATE-
MENT OFCASH FLOWS
Annual financial report 2009 | Notes to the consolidated financial statements

58
a. Risk managementAs a global company serving a variety of different markets and customers, the Group is subject to certain general and industry-specific risks. These risks mainly relate to the industries the Group serves (e.g. uncertainty of future contracts, volatility of incoming orders, customer concentration, etc.), the Group’s business (e.g. currency exposure, competitive position, legal proceedings, etc.), and to major orders (e.g. payment risks, liabilities, and performance of projects, cost overruns, etc.).
ANDRITZ has a long-established Group-wide management steering committee whose main task is to identify nascent risks early and to take countermeasures. This is an important element in the active risk management system within the Group.
Although having this monitoring and risk management system in place, it cannot be guaranteed that all risks will be identified at an early stage, and consequently the financial situation of the Group could be adversely affected.
The essential risks for the business development of the ANDRITZ GROUP in 2010 relate above all to the Group’s dependence on the general economic development and on development of the industries it serves, the receipt to whether major orders are received and to the risks they entail, and to whether adequate sales proceeds are realized from the high order backlog. The persistent financial crisis and substantial economic slowdown in the main economic regions of the world also constitute a serious risk for the ANDRITZ GROUP’s financial development during the 2010 busi-ness year. The global economic weakness may lead to further delays in the execution of existing orders and to the postponement or cancellation of projects. Cancellations of existing contracts could adversely affect the ANDRITZ GROUP’s order backlog, which would in turn have a negative impact on the utilization of the Group’s manufacturing capacities.
The global financial and economic crisis may also necessitate complete or partial impairments of single goodwill created in the course of acquisitions if the business development goals cannot be reached. Moreover, a negative business development in certain areas could make impairments of certain assets necessary. This may influence the earnings development of the ANDRITZ GROUP. Furthermore, there is always some risk that partial or full provisions will have to be made for some trade accounts receivable.
The monitoring and management of financial risks are integral parts of ANDRITZ’s Group-wide ac-counting and controlling activities. Continuous controlling and regular reporting should ensure the identification of major risks at an early stage and to take countermeasures, if necessary.
The Group seeks to minimize the effects of these risks by using derivative financial instruments to hedge these risk exposures. The use of financial derivatives is governed by the Group’s policies ap-proved by the Executive Board, which provide written principles on managing financial risks. More-over, rules are defined for the use of derivative and non-derivative financial transactions as well as surplus cash. Compliance with policies and exposure limits is reviewed by the internal auditor on a continuous basis. The Group does not own or trade financial instruments for speculative purposes.
For the majority of orders, the risk of payment failure by customers is mitigated by means of bank guarantees and export insurance. Risks related to deliveries to countries with medium to high political risks typically are also insured to a large extent. Interest and exchange rate risks are mini-mized and controlled by derivative financial instruments, in particular forward exchange contracts and swaps.
The Group enters into forward foreign exchange contracts to manage its foreign exchange risk resulting from cash flows from current business activities. Transaction risk is calculated in each foreign currency and includes currency denominated assets and liabilities and certain off-balance sheet items such as highly probable future cash flows or firm commitments and highly probable purchases,and sales. The currency risks of the Group occur due to the fact that the Group‘s opera-tions, production sites and markets are located in various countries. The Group carries its forward exchange contracts at fair value.
j. FINANCIAL INSTRUMENTS
Annual financial report 2009 | Notes to the consolidated financial statements

59
Cash flow risks are minimized by the Group’s cash management system which controls cash in- and outflows of all relevant ANDRITZ affiliates. It also monitors the Group’s cash pooling activities in order to optimize net financing income. The Group manages liquidity risks especially by holding adequate reserves, by issuing bonds, by receiving substantial customer advances, and by con-stantly monitoring the predicted and actual cash flows, as well as reconciling maturity date profiles of financial assets and liabilities.
b. Liquidity risksIn order to further reduce the financial risks and to enhance monitoring, control, and assessment of its financial and liquidity position, the ANDRITZ GROUP has continuously improved its treasury guidelines and information system.
The ANDRITZ GROUP’s position in terms of liquidity is very good; the Group has sufficient liquid-ity reserves and secures access to liquidity. The Group avoids dependence on one single or only a few banks. To ensure independence, no bank will receive more than a certain defined amount of the business in any important product (cash and cash equivalents, financial liabilities, financial assets, guarantees, and derivatives).
Cash is largely invested in low-risk financial assets, such as government bonds, government-guaranteed bonds, investment funds to cover pension obligations, or term deposits. However, the financial market crisis and its effects have led to unfavorable price developments for various securities in which the Group has invested (e.g. money market funds, bonds) or made them non-tradeable. This could have an adverse effect on the ANDRITZ GROUP’s financial result or share-holders’ equity due to necessary depreciation or value adjustments. The crisis has also heightened the risk of default by some issuers of securities, as well as by customers.
c. Credit risksCredit risks, or the risk of counterparties defaulting, are controlled by the application of credit approvals, limits, and monitoring procedures. Where appropriate, the Group obtains guarantees from governmental export agencies or similar private institutions to reduce the risk of a counterpart defaulting.
Credit risk associated with the investment of liquid funds and securities is low, as a wide distribution with simultaneously defined minimum criteria for the creditworthiness of the contractual partners are determining factors for the conservative investment strategy.
For certain financial assets and financial liabilities, the Group has a legally enforceable right to set off. These amounts are only reported on a net basis. For all known risks, valuation allowances are included. It cannot be excluded that in the future there will a shortfall in payment exceeding the recorded valuation allowance. Without considering risk minimization strategies as described above, the carrying amounts of financial assets recorded in the financial statements represent the Group’s maximum exposure to credit risk of the corresponding categories.
(in TEUR) 2009 2008Held for trading 40,109 49,428Available for sale 375,019 269,183Loans and receivables 657,066 597,906Cash and cash equivalents 709,532 558,448
1,781,726 1,474,965
No impairment was recorded in the category available for sale (2008: TEUR 7,817). The trade receivables in the category loans and receivables are impaired by TEUR 23,240 (balance 2008: TEUR 24,660).
The Group does not have any significant credit risk exposure to any single counterparty or any group of counterparties having similar characteristics. The Group defines counterparties as hav-ing similar characteristics if they are related entities. The three largest customers contribute less than 15% of all incoming orders in various strategic business areas. Thus, there is no significant concentration of credit risk.
Annual financial report 2009 | Notes to the consolidated financial statements

60
d. Interest riskIn June 2006, the company issued bond for a nominal value of MEUR 200 with a repayment period of seven years and a nominal interest rate of 4.5% p.a. For this bond interest swaps have been used to hedge the risk arising from the fixed interest rate of the bond. The interest swaps change the fixed interest rate for the whole period to a variable interest rate based on the 1 month’s Euribor. Therefore, there is the risk of a changing interest rate concerning the cash flows but the fair value of the bond is hedged and hedge accounting in the sense of IAS 39 was applied.
In February 2008, the company issued another bond for a nominal value of MEUR 150 with a repayment period of seven years and a nominal interest rate of 5.25% p.a. For this bond interest swaps have been used to hedge the risk arising from the fixed interest rate of the bond. The interest swaps change the fixed interest rate for the whole period to a variable interest rate based on the 3 month’s Euribor. Therefore, there is the risk of a changing interest rate concerning the cash flows but the fair value of the bond is hedged and hedge accounting in the sense of IAS 39 was applied.
The contractual basic parameters of the swaps are similar to the ones of the bonds, and therefore the hedges were 100% effective in hedging the fair value exposure to interest rate movements during the period. By applying the rules for hedge accounting, the gain or loss from the swaps to fair value was recognized through profit or loss. The gain or loss attributable to the changes of the hedged interest rate risk caused an adjustment of the bonds’ carrying amounts and was also recognized through profit or loss. Therefore, the gains and losses resulting from the changes in fair value of the swaps and the bonds offset each other.
The details to the change of the fair value of the swaps designated as fair value hedge are as follows:
(in TEUR) 2009 2008Fair value swap end of previous period 19,023 (7,737)Fair value swap end of current period 21,553 19,023Gain/(loss) recognized through profit or loss 2,530 26,760
The Executive Board believes that the exposure to interest rate risk of remaining financial assets and liabilities is negligible. Consequently, additional material derivative instruments for hedging these interest risks are not used within the Group.
The weighted average interest rates at the balance sheet date were as follows:
(in %) 2009 2008Cash on current accounts 0.6 1.9Short-term deposits 1.2 3.5Securities, short-term 2.7 2.9Securities, long-term 1.6 3.3Overdrafts on current accounts 5.0 5.4Short-term loans 5.8 8.1Long-term loans 2.7 4.2Bonds 2.2 5.1
e. Sensitivity analysesThe Group’s activities are exposed primarily to the financial risks of changes in foreign currency, changes in fair value and changes in interest rates. The Group enters into financial derivatives to manage its exposure to foreign currency risk and the risk of changes in fair values. These market risk exposures are measured using sensitivity analyses:
Annual financial report 2009 | Notes to the consolidated financial statements

61
Foreign currency sensitivitySensitivity analyses provide an approximate quantification of the exposure in the event that certain specified parameters were to be met under a specific set of assumptions.
The Group is mainly exposed to the US Dollar (USD) and Swiss Franc (CHF).
The following explanations detail the Group’s sensitivity to an increase and decrease in US Dollar and Swiss Franc against the Euro (EUR). The change represents the amount applied on internal reporting of foreign currency risk and represents the Executive Board’s assessment of the possible change in foreign exchange rates. The sensitivity analyses include the material outstanding foreign currency denominated monetary items.
The impacts on the net income compared to the net income recognized and on the equity compared to the equity stated, respectively, are as follows:
(in TEUR) 2009 2008Increase of USD to EUR by 10% (498) (1,467)Decrease of USD to EUR by 10% 199 (445)Increase of CHF to EUR by 10% (514) (1,384)Decrease of CHF to EUR by 10% 1,112 2,197
The changes of the net income compared to the reported net income comprises mainly the fair values of the forward foreign exchange contracts in US Dollar and Swiss Franc calculated with new foreign exchange rates.
Interest rate sensitivityThe sensitivity analyses have been determined based on the exposure to interest rates of the bonds. There is no risk of a changing interest rate concerning the cash flows for the company as the issuer of the fixed-interest bearing bonds, although there is the risk of changes in the fair value of the bonds. The company entered into swaps to hedge against this risk of changes in the fair value, so that on a net basis, the Group has the liability to pay a variable interest rate based on 1 month’s Euribor and 3 month’s Euribor, respectively.
A 100 basis point change in interest rate is used when reporting interest rate risk internally to key management personnel and represents the Executive Board’s assessment of the possible change in interest rates.
If interest rates had been 100 basis points higher and all other variables were held constant, this would have caused a decrease of the fair value of the swaps in the amount of TEUR 13,090 (2008: decrease of TEUR 16,249). This change would be offset by a basis adjustment of the bonds in the same amount.
If interest rates had been 100 basis points lower and all other variables were held constant, this would have caused an increase of the fair value of the swaps in the amount of TEUR 15,815 (2008: increase of TEUR 17,283). This change would be offset by a basis adjustment of the bonds in the same amount.
Annual financial report 2009 | Notes to the consolidated financial statements

62
A rise in the interest level by 100 basis points by simultaneously keeping constant all other variables would have led to an increase of the interest result of TEUR 5,313 in the business year 2009 (2008: rise by TEUR 3,669). A decline in the interest level would have led to a decrease of the interest result at the same amount.
f. Fair value of financial instrumentsThe following table discloses the carrying values of financial instruments with their fair values per class:
(in TEUR)
Carrying value December 31,
2009
Market value December 31,
2009
Carrying value December 31,
2008
Market value December 31,
2008ASSETSOther investmentsAvailable for sale 2,474 2,474 5,869 5,869Loans and receivables 20,141 20,141 29,593 29,593Receivables and other assetsLoans and receivables 636,925 636,925 568,313 568,313At fair value through profit and loss – trading* 40,109 40,109 49,428 49,428Marketable securitiesAvailable for sale 372,545 372,545 263,314 263,314Cash and cash equivalents 709,532 709,532 558,448 558,448
1,781,726 1,781,726 1,474,965 1,474,965LIABILITIESFinancial liabilitiesMeasured at amortized costs 371,553 371,553 369,023 369,023At fair value through profit and loss – designation 53,066 53,066 61,497 61,497Not allocated to any IAS-39 valuation category 1,102 1,102 1,381 1,381Trade accounts payableMeasured at amortized costs 260,337 260,337 306,295 306,295Other liabilitiesAt fair value through profit and loss – trading** 21,448 21,448 37,421 37,421Measured at amortized costs 511,249 511,249 452,618 452,618
1,218,755 1,218,755 1,228,235 1,228,235* thereof hedging of cash flows TEUR 1,300 (2008: TEUR 0).
** thereof hedging of cash flows TEUR 0 (2008: TEUR 6,163).
The bonds are recognized at fair value as hedge accounting (fair value hedge) is applied.
Annual financial report 2009 | Notes to the consolidated financial statements

63
The following table discloses the IAS 39 valuation categories for the financial instruments:
(in TEUR)
Carrying value December 31,
2009
Market value December 31,
2009
Carrying value December 31,
2008
Market value December 31,
2008FINANCIAL ASSETSCash and cash equivalents 709,532 709,532 558,448 558,448At fair value through profit and loss – tradingDerivatives* 36,150 36,150 37,983 37,983Embedded derivatives 3,959 3,959 11,445 11,445Available for saleNon-current securities 2,474 2,474 5,869 5,869Marketable securities 372,545 372,545 263,314 263,314Loans and receivablesLoans granted 4,200 4,200 15,513 15,513Investments in other companies 15,941 15,941 14,080 14,080Non-current receivables and other non-current assets 16,254 16,254 13,585 13,585Trade accounts receivable 454,691 454,691 424,947 424,947Other receivables and assets - current 165,980 165,980 129,781 129,781
1,781,726 1,781,726 1,474,965 1,474,965FINANCIAL LIABILITIESAt fair value through profit and loss – tradingDerivatives** 15,622 15,622 32,047 32,047Embedded derivatives 5,826 5,826 5,374 5,374At fair value through profit and loss – designationBonds 371,553 371,553 369,023 369,023Financial liabilities measured at amortized costsBank loans and other financial liabilities 53,066 53,066 61,497 61,497Trade accounts payable 260,337 260,337 306,295 306,295Other liabilities 511,249 511,249 452,618 452,618
Other liabilities, not allocated to any IAS 39 valuation categoryObligations under finance leases 1,102 1,102 1,381 1,381
1,218,755 1,218,755 1,228,235 1,228,235* thereof hedging of cash flows TEUR 1,300 (2008: TEUR 0).
** thereof hedging of cash flows TEUR 0 (2008: TEUR 6,163).
The bonds are recognized at fair value as hedge accounting (fair value hedge) is applied.
Annual financial report 2009 | Notes to the consolidated financial statements

64
The following table allocates our financial assets and liabilities measured at fair value to the three levels of the fair value hierarchy. It distinguishes fair value measurements by the significance of the inputs used and reflects the availability of ob-servable market inputs when estimating fair values.
2009
(in TEUR)
Total as of December 31,
2009thereof level 1
thereof level 2
thereof level 3
FINANCIAL ASSETSAt fair value through profit and loss – tradingDerivatives 36,150 36,150Embedded derivatives 3,959 3,959Available for saleNon-current securities 2,474 2,474Marketable securities 372,545 372,545
415,128 375,019 40,109 0FINANCIAL LIABILITIESAt fair value through profit and loss – tradingDerivatives 15,622 15,622Embedded derivatives 5,826 5,826At fair value through profit and loss – designationBonds 371,553 371,553
393,001 0 21,448 371,553
The levels of the fair value hierarchy and its application to our financial assets and liabilities are described below:
Level 1:Quoted prices in active markets for identical assets or liabilities
Level 2:Inputs other than quoted prices that are observable for the asset or liability, either directly (i.e. as prices) or indirectly (i.e. derived from prices)
Level 3:Inputs for the asset or liability that are not based on observable market data
Reconciliation of the financial instruments at fair value classified at level 3 is as follows:
(in TEUR) 2009Opening balance 369,023Gains and losses in income statement* 2,530Issues 0Settlements 0Closing balance 371,553Total gains and losses for liablities at the end of the period 2,530* without consideration of gains or losses of the concluded swaps
Fair value calculationThe fair value of foreign exchange forward contracts is determined using forward exchange market rates at the balance sheet date.
Annual financial report 2009 | Notes to the consolidated financial statements
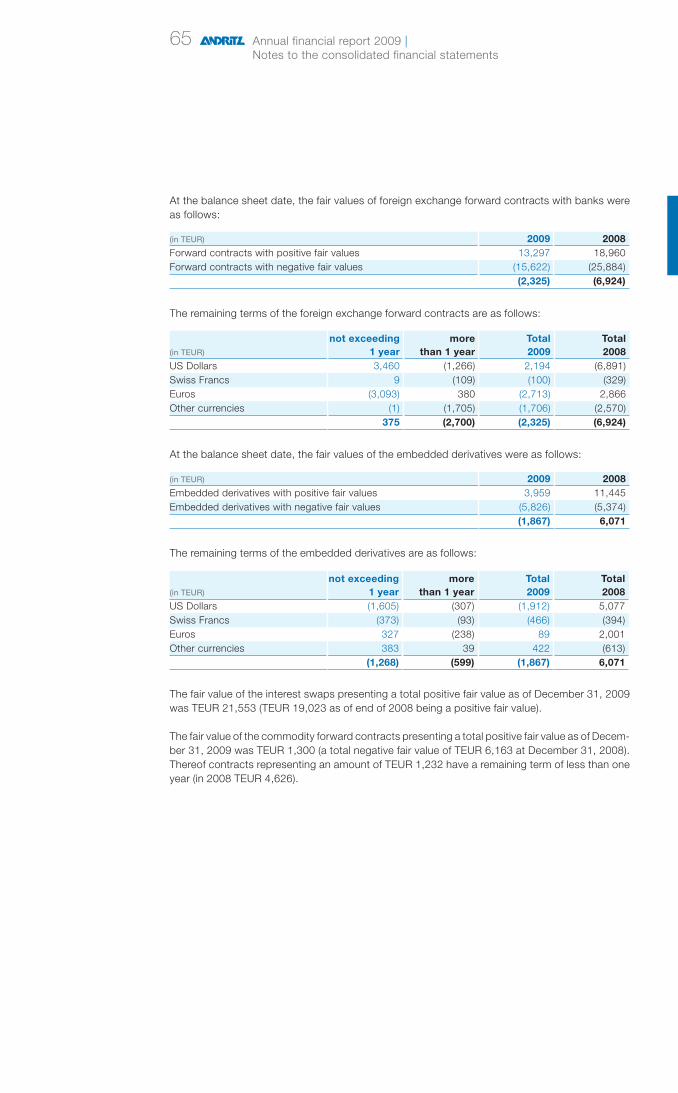
65
At the balance sheet date, the fair values of foreign exchange forward contracts with banks were as follows:
(in TEUR) 2009 2008Forward contracts with positive fair values 13,297 18,960Forward contracts with negative fair values (15,622) (25,884)
(2,325) (6,924)
The remaining terms of the foreign exchange forward contracts are as follows:
(in TEUR)
not exceeding 1 year
more than 1 year
Total 2009
Total 2008
US Dollars 3,460 (1,266) 2,194 (6,891)Swiss Francs 9 (109) (100) (329)Euros (3,093) 380 (2,713) 2,866Other currencies (1) (1,705) (1,706) (2,570)
375 (2,700) (2,325) (6,924)
At the balance sheet date, the fair values of the embedded derivatives were as follows:
(in TEUR) 2009 2008Embedded derivatives with positive fair values 3,959 11,445Embedded derivatives with negative fair values (5,826) (5,374)
(1,867) 6,071
The remaining terms of the embedded derivatives are as follows:
(in TEUR)
not exceeding 1 year
more than 1 year
Total 2009
Total 2008
US Dollars (1,605) (307) (1,912) 5,077Swiss Francs (373) (93) (466) (394)Euros 327 (238) 89 2,001Other currencies 383 39 422 (613)
(1,268) (599) (1,867) 6,071
The fair value of the interest swaps presenting a total positive fair value as of December 31, 2009 was TEUR 21,553 (TEUR 19,023 as of end of 2008 being a positive fair value).
The fair value of the commodity forward contracts presenting a total positive fair value as of Decem-ber 31, 2009 was TEUR 1,300 (a total negative fair value of TEUR 6,163 at December 31, 2008). Thereof contracts representing an amount of TEUR 1,232 have a remaining term of less than one year (in 2008 TEUR 4,626).
Annual financial report 2009 | Notes to the consolidated financial statements

66
Cash and cash equivalents, current and non-current financial assetsThe carrying amount of cash and other financial assets approximates the fair value due to the relatively short-term maturity of these financial instruments.
Non-current and current securitiesThe fair values of publicly traded instruments are based on quoted market prices. Non-current securities of the Group are classified as available for sale and are valued at their quoted market price at the balance sheet date.
Receivables and payablesThe historical carrying amounts of receivables and payables which are all subject to normal trade credit terms correspond basically to their fair values.
Short-term borrowingsThe carrying amount approximates the fair value because of the short period to maturity of those instruments.
Long-term borrowingsThe fair value of the long-term debts is based on the current interest rates available for debt with the same maturity profile. The fair value of non-current borrowings and other payables with vari-able interest rates approximates their carrying amounts. The risks of the changes in fair value have been hedged by interest rate swaps. The management believes that the exposure to interest rate risk of the remaining financial assets and liabilities is negligible.
IAS 39 reserveThe table below shows the movements in the IAS 39 reserve in equity:
(in TEUR)
Unrealized gain (loss) on hed-ging activities
Unrealized gain (loss) on
securities
Unrealized gain (loss) total IAS
39 reserveBalance as at January 1, 2008 0 644 644Gains and losses from changes in fair value (6,163) (942) (7,105)Deferred income taxes thereon 1,541 274 1,815Transfers to income statement 0 (255) (255)Deferred income taxes thereon 0 64 64Balance as at December 31, 2008 (4,622) (215) (4,837)Gains and losses from changes in fair value 2,837 223 3,060Deferred income taxes thereon (709) (65) (774)Transfers to income statement 4,626 318 4,944Deferred income taxes thereon (1,157) (79) (1,236)Balance as at December 31, 2009 975 182 1,157
The net gains and losses for each category of financial instruments are as follows:
2009
(in TEUR)
Held for trading
Held for trading
Available for sale
DerivativesEmbedded derivatives Securities
Changes in fair values recognized in profit or loss 2,503 (7,938) (318)Changes in fair values recognized in equity 2,837 0 223Recycling out of equity 4,626 0 318Net gains/(losses) 9,966 (7,938) 223
Annual financial report 2009 | Notes to the consolidated financial statements

67
2008
(in TEUR)
Held for trading
Held for trading
Available for sale
DerivativesEmbedded derivatives Securities
Changes in fair values recognized in profit or loss 8,708 9,597 (7,562)Changes in fair values recognized in equity (6,163) 0 (942)Recycling out of equity 0 0 (255)Net gains/(losses) 2,545 9,597 (8,759)
The Group has entered into various operating lease agreements for machinery, offices, and other facilities as lessee. Lease terms do not contain restrictions on the Group’s activities concerning dividends, additional debt, or further leasing.
Future minimum lease payments under non-cancellable operating leases are as follows:
(in TEUR) 2009 2008Not exceeding 1 year 17,241 16,4061 year to 5 years 37,464 35,698After 5 years 9,409 7,793
64,114 59,897
Commitments arising from contracts for expenditure on property, plant, and equipment are only in-curred in the ordinary course of business. As of December 31, 2009, these commitments amounted to TEUR 12,850 (2008: to TEUR 14,628).
Various legal actions and claims are pending or may be asserted in the future against Group com-panies incidental to the ordinary course of the Group’s business. Many of these actions and claims arise out of project-related disputes. Although the outcome of these items cannot be ascertained with precision, management believes, subject to the following paragraph, that the outcome of these legal actions and claims, individually or in the aggregate, should not have a material adverse effect on the company’s business, liquidity, result of operations, or financial position.
As of December 2009, ANDRITZ Inc., as subsidiary of the company, was one of many defendants in a total of approximately 26 asbestos cases in the US. Nearly all of these cases involve claims against multiple defendants. In aggregate, the cases involve a total of approximately 686 plaintiffs. ANDRITZ Inc. plans to vigorously defend each claim. As the vast majority of claims against ANDRITZ Inc. have not as yet been stated with specificity, it is not possible for ANDRITZ Inc. to assess the full extent of its potential exposure to asbestos litigation. Through December 31, 2009 ANDRITZ Inc. has not had a judgment of liability rendered against it in connection with an asbestos claim. Approximately 96 asbestos cases and about 20,393 claims against ANDRITZ have been dismissed, and one claim has been resolved without ANDRITZ incurring any significant liability or expense. It is possible that the final adjudication or settlement of such proceedings will have an adverse effect on the company’s business, results of operations, and financial condition.
There are no take-back obligations, other than the guarantee claims customary within the industry. The management is not aware of any further risks and rewards originating from off-balance sheet transactions.
k. LEASES
l. COMMIT-MENTS
m. CONTINGENT LIABILITIES AND OFF-BALANCE SHEET TRANS-
ACTIONS
Annual financial report 2009 | Notes to the consolidated financial statements

68
Only minor business relations exist with the shareholders. The shareholders are:
Free float 71%Certus Beteiligungs-GmbH 29%
Transactions with associated companies and not consolidated companies were not material. As the Group’s transfer-price policy provides for at arm’s length transfer-prices, no transactions are carried out, which do not represent market standards.
Transactions with companies in which members of the Supervisory Board of ANDRITZ AG are ac-tive are concluded at third-party conditions and are immaterial in scope.
Emoluments of the Executive BoardA provision of TEUR 4,056 in 2009 (TEUR 4,650 in 2008) was recorded for pensions of former members of the Executive Board and their dependants; the current year expense for these pen-sions amounted to TEUR 75 for 2009 (TEUR 554 for 2008).
The following expenses have been recognized for the Executive Board:
(in TEUR) 2009 2008Short-term benefits 6,364 8,374Post-employment benefits 544 1,581Share-based expenses 974 812
7,882 10,767
The members of the Supervisory Board received remunerations in the amount of TEUR 125 (2008: TEUR 125).
The expenses for services rendered by the group auditor comprise the following:
(in TEUR) 2009 2008Year-end audit 208 208Tax advisory services 52 73
260 281
n. RELATED PARTY TRANS-
ACTIONS
o. EXPENSES FOR SERVICES RENDERED BY
THE GROUP AUDITOR
Company Headquarters Interest
Type of consoli-
dationRe-
marksAnstalt für Strömungsmaschinen GmbH Graz, Austria 100% NC 1)ANDRITZ Technology and Asset Management GmbH Graz, Austria 100% FC
ANDRITZ Finance GmbH Vienna, Austria 100% FCANDRITZ Power & Water GmbH Vienna, Austria 100% FC
European Mill Service GmbH Graz, Austria 50% NC 1)ANDRITZ R&M Service S.R.L. Bucharest, Romania 25% NC 1)
ANDRITZ HYDRO GmbH Vienna, Austria 100% FCANDRITZ HYDRO S.A.S. Grenoble, France 100% FCANDRITZ HYDRO Pvt. Ltd. Bhopal, India 100% FCANDRITZ Deutschland Beteiligungs GmbH Krefeld, Germany 100% FC
ANDRITZ GmbH Hemer, Germany 100% FCANDRITZ Kaiser GmbH Bretten-Gölshausen, Germany 100% FCSundwig GmbH Hemer, Germany 75% FCANDRITZ Fiedler GmbH Regensburg, Germany 100% FC
ANDRITZ Fiedler Holding S.A.R.L. Scorbé Clairvaux, France 100% FCANDRITZ Separation GmbH Cologne, Germany 100% FC
p. LIST OF SUBSIDIARIES
Annual financial report 2009 | Notes to the consolidated financial statements
69
Company Headquarters Interest
Type of consoli-
dationRe-
marksANDRITZ - Jochman s.r.o. Spišská Nová Ves, Slovakia 90% EQ
ANDRITZ Fliessbett Systeme GmbH Ravensburg, Germany 100% FCLenser Verwaltungs GmbH Senden, Germany 100% FC
ANDRITZ S.R.L. Cisnadie, Romania 100% EQLenser Filtration GmbH Senden, Germany 100% FC
Lenser Asia Sdn. Bhd. Selangor, Malaysia 100% FCANDRITZ HYDRO GmbH Ravensburg, Germany 100% FCANDRITZ Küsters GmbH Krefeld, Germany 100% FCANDRITZ Kufferath GmbH Düren, Germany 100% FCAKRE Real Estate GmbH Düren, Germany 100% FCANDRITZ Maerz GmbH Düsseldorf, Germany 100% FCANDRITZ Rollteck GmbH Krefeld, Germany 100% FC
ANDRITZ HYDRO S.L. Madrid, Spain 100% FCANDRITZ HYDRO S.r.l. Vicenza, Italy 100% FC
ANDRITZ HYDRO AOSTA S.r.l. Aosta, Italy 100% NC 1)ANDRITZ HYDRO AG Kriens, Switzerland 100% FCANDRITZ HYDRO S.A. de CV. Morelia, Mexico 100% FCANDRITZ HYDRO AS Jevnaker, Norway 100% FCANDRITZ HYDRO BRASIL Ltda. São Paulo, Brazil 100% FCANDRITZ HYDRO Ltd. Sirketi Ankara, Turkey 100% FCPT ANDRITZ HYDRO Jakarta, Indonesia 51% FCANDRITZ HYDRO S.A. Lima, Peru 100% NC 1)ANDRITZ HYDRO (Pty) Ltd. Bedfordview, South Africa 100% NC 1)ANDRITZ HYDRO Limitada Bogotá, Colombia 100% NC 1)ANDRITZ HYDRO s.r.o. Prague, Czech Republic 100% NC 1)ANDRITZ INDIA Pvt. Ltd. Faridabad, India 100% NC 1)ANDRITZ HYDRO C.A. Caracas, Venezuela 100% NC 1)ANDRITZ POWER Sdn. Bhd. Kuala Lumpur, Malaysia 30% NC 1)ANDRITZ HYDRO Inc. Makati City, Philippines 100% NC 1)The Hydro Equipment Association Limited London, Great Britain 33.3% NC 1)
HGI Holdings Limited Limassol, Cyprus 100% EQAP Anlage-Projektierungs AG Bülach, Switzerland 100% FCANDRITZ Separation (India) Private Ltd. Chennai, India 100% FCANDRITZ spol. s.r.o. Hradec Králové, Czech Republic 100% NC 1)ANDRITZ Denmark A/S Esbjerg, Denmark 100% FC
ANDRITZ FEED & BIOFUEL A/S Esbjerg, Denmark 100% FCANDRITZ FEED & BIOFUEL Brasil Ltda. Porto Alegre, Brazil 100% NC 1)
ANDRITZ FEED & BIOFUEL s.r.o. Humenné, Slovakia 100% EQANDRITZ Chile Ltda. Santiago de Chile, Chile 100% FCANDRITZ (USA) Inc. Roswell, Georgia, USA 100% FC
ANDRITZ Inc. Roswell, Georgia, USA 100% FCANDRITZ Finance Inc. Tualatin, Oregon, USA 100% FC
Delta Holding Corporation Tualatin, Oregon, USA 100% FCANDRITZ Separation Inc. Arlington, Texas, USA 100% FCANDRITZ Filter Press Inc. Arlington, Texas, USA 100% FCANDRITZ Automation Inc. Decatur, Georgia, USA 100% FCCyberMetrics Inc. Alpharetta, Georgia, USA 100% FCLenser Filtration Inc. Lakewood, New Jersey, USA 100% FCANDRITZ HYDRO Corp. Charlotte, North Carolina, USA 100% FC
ANDRITZ S. A. S. Vélizy, France 100% FCANDRITZ Selas S.A.S. Asnières-sur-Seine, France 100% FCLenser Filtration S.A.R.L. Haguenau, France 100% FC
Jaybee Engineering (Holdings) Pty. Ltd. Victoria, Australia 100% FCANDRITZ Pty. Ltd. Victoria, Australia 100% FC
ANDRITZ Ingeniería S.A. Madrid, Spain 100% FCANDRITZ Brasil Ltda. Curitiba, Brazil 100% FC
Annual financial report 2009 | Notes to the consolidated financial statements

70
Company Headquarters Interest
Type of consoli-
dationRe-
marks
ANDRITZ Separation Industria e Comércio de Equipamentos de Filtraçâo Ltda. Pomerode, Brazil 100% FCSindus Manutençâo e Sistemas Industriais Ltda. Porto Alegre, Brazil 50% QU
Sindus ANDRITZ Uruguay S.A. Río Negro, Uruguay 50% NC 1)ANDRITZ Hydro Inepar do Brasil S.A. São Paulo, Brazil 50% FC
ANDRITZ Pilão Equipamentos Ltda. São Paulo, Brazil 100% FCANDRITZ Oy Helsinki, Finland 100% FC
Savonlinna Works Oy Savonlinna, Finland 100% FCANDRITZ Hydro Inepar Finland Oy Tampere, Finland 100% FCCarbona Oy Helsinki, Finland 80% EQWarkaus Works Oy Varkaus, Finland 50% EQEnmas ANDRITZ Private Ltd. Chennai, India 40% EQ
ANDRITZ HYDRO Canada Inc. Stoney Creek, Ontario, Canada 100% FCANDRITZ HYDRO Canada Ltd./Ltee, Pointe Claire, Quebec, Canada 100% FC
ANDRITZ HYDRO Installations Inc. Lachine, Quebec, Canada 100% NC 1)ANDRITZ Ltd./Ltée. Lachine, Quebec, Canada 100% FC
ANDRITZ Paper Machinery Ltd. Lachine, Quebec, Canada 100% FCANDRITZ Automation Ltd. Richmond, British Columbia, Canada 100% FCIDEAS Simulation & Control Ltd. Richmond, British Columbia, Canada 100% FC
ANDRITZ AB Örnsköldsvik, Sweden 100% FCANDRITZ Lynson AB Vallentuna, Sweden 100% FCANDRITZ Waplans AB Nälden, Sweden 100% FC
ANDRITZ Hydro Inepar Sweden AB Kristinehamn, Sweden 100% FCANDRITZ Ltd. Staffordshire, Great Britain 100% FC
ANDRITZ Selas UK Ltd. Derbyshire, Great Britain 100% FCANDRITZ-Kenflo Foshan Pump Co. Ltd. Foshan, China 60% FCANDRITZ Technologies Ltd. Foshan, China 100% FCANDRITZ-Wolfensberger Special Alloy Foundry Co., Ltd. Foshan, China 65% FCANDRITZ Technologies H.K. Ltd. Hong Kong, China 100% NC 1)Kufferath Forming Technology China (Zhejiang) Co., Ltd. Zhejiang, China 100% NC 1)ANDRITZ THERMTEC Holding B.V. Rotterdam, The Netherlands 100% FC
ANDRITZ THERMTEC B.V. Rotterdam, The Netherlands 100% FCANDRITZ Technologies Private Limited Bangalore, India 100% FCANDRITZ FEED & BIOFUEL Limited Hull, Great Britain 100% FCANDRITZ FEED & BIOFUEL B.V. Geldrop, The Netherlands 100% FC
ANDRITZ B.V. Den Helder, The Netherlands 100% FCANDRITZ 3SYS AG Wohlen, Switzerland 100% FCANDRITZ Singapore Pte. Ltd. Singapore, Singapore 100% FCANDRITZ (Thailand) Limited Bangkok, Thailand 100% FCANDRITZ Uruguay S.A. Río Negro, Uruguay 100% FCANDRITZ Industrias S.A. Río Negro, Uruguay 100% NC 1)ANDRITZ Pulp Technologies Punta Pereira S.A. Montevideo, Uruguay 100% NC 1)ANDRITZ K.K. Tokyo, Japan 100% FCANDRITZ (Pty) Ltd. Bedfordview, South Africa 100% FCPT ANDRITZ Jakarta, Indonesia 100% FCANDRITZ Australia Pty. Ltd. Melbourne, Victoria, Australia 100% NC 1)LLC ANDRITZ St. Petersburg, Russia 100% FCOOO ANDRITZ Metals Moscow, Russia 100% NC 1)ANDRITZ Kufferath s.r.o. Levice, Slovakia 100% FCANDRITZ Kft. Tiszakécske, Hungary 100% FC
Graz, February 25, 2010
Wolfgang Leitner Franz Hofmann Karl Hornhofer Humbert Köfler Friedrich Papst (President and CEO)
Annual financial report 2009 | Notes to the consolidated financial statements
1) immaterial FC: Full consolidation QU: Proportional consolidation EQ: Equity accounting NC: No consolidation

71
Publisher:ANDRITZ AG, Stattegger Strasse 188045 Graz, Austria
Editor in charge: Dr. Michael Buchbauer
Design:Faschingbauer & Schaar Werbeagentur
ANDRITZ AGStattegger Strasse 188045 Graz, AustriaPhone: +43 (316) 6902 0Fax: +43 (316) 6902 [email protected]
Corporate Communications & Investor RelationsOliver PokornyPhone: +43 (316) 6902 2722Fax: +43 (316) 6902 [email protected]
DISCLAIMER Certain statements contained in the annual financial report 2009 and annual report 2009 constitute ‘forward-looking statements.’ These statements, which contain the words ‘believe’, ‘intend’, ‘ex-pect’, and words of a similar meaning, reflect the Executive Board’s beliefs and expectations and are subject to risks and uncertainties that may cause actual results to differ materially.
As a result, readers are cautioned not to place undue reliance on such forward-looking state-ments. The company disclaims any obligation to publicly announce the result of any revisions to the forward-looking statements made herein, except where it would be required to do so under applicable law.
The annual financial report 2009 and the annual report 2009 contain assumptions and forecasts which were based on the information available up to the copy deadline on February 25, 2010. If the premises for these assumptions and forecasts do not occur, or risks indicated in the chapter ‘corporate risks’ and in the status report in the annual financial report 2009 do arise, actual results may vary from the forecasts made in the annual financial report and annual report 2009.
Although the greatest caution was exercised in preparing data, all information related to the future is provided without guarantee.
PUBLISHER’S NOTE
CONTACT
The online version of the annual report and annual financial report offers you special features: Downloading of all tables with key financial fig-ures.
Targeted search for major topics. Advanced search function for such areas as company share, key figures, consolidated finan-cial statement, order intake, and acquisitions.
Selection of individual sections and compila-tion of a customized report.
reports.andritz.com/2009/
All annual reports, annual financial reports, and quarterly reports of the ANDRITZ GROUP since the IPO in 2001 are available at:www.andritz.com/reports
Always up-to-date: current news at www.andritz.comFor current announcements on major orders, company acquisitions, as well as all other impor-tant information, please visit the ANDRITZ web site.
Order printed copies of the annual reports, annual financial reports, and quarterly re-ports free of charge:
ANDRITZ AGInvestor RelationsStattegger Strasse 188045 Graz, AustriaTel. +43 (316) 6902 [email protected]
Financial calendar (preliminary): Annual Genera
l Meetin
g in G
raz,
Aust
ria
Ex-div
idend
Divid
end paym
ent
March 26,2010
March 30,2010
April 1,2010
The financial calendar with regularupdates can be found on www.andritz.com
Results
for t
he firs
t quarte
r of 2
010
Results
for t
he firs
t half
of 2010
Results
for t
he firs
t thre
e quarte
rs o
f 2010
May 7,2010
August 9,2010
November 8,2010
ANDRITZ annual report 2009Companies all over the world have been confronted with exceptional challenges as a result of the finan-cial and economic crisis. Additionally, such central topics as globalization or climate and environmental protection also present global challenges that have to be answered.
The ANDRITZ annual report 2009 relates how the ANDRITZ GROUP stood its ground and developed in the face of these challenges – and how it tackles day-to-day challenges in order to achieve its goals of world market leadership and long-term, profitable growth.
HYDRO
PULP
PAPER
METALS
ENVIRONMENT
PROCESS
FEED
BIOFUEL
Stormy times
Stable base
2009
Annual report

Präambel Lagebericht ANDRITZ-GRUPPE Bilanz ANDRITZ AG Gewinn- und Verlustrechnung ANDRITZ AG Anhang ANDRITZ AG
Jahresabschluss 2009der ANDRITZ AG
Lagebericht Präambel
Der Jahresabschluss (Einzelabschluss) der ANDRITZ AG wird nach den
Bilanzierungs- und Bewertungsvorschriften des österreichischen UGB aufgestellt.
Entsprechend dieser Vorschriften sind die verbundenen Unternehmen im Rahmen
des Finanzanlagevermögens ausgewiesen. Dadurch ergibt sich aus dem
Einzelabschluss lediglich ein Ausschnitt der wirtschaftlichen Lage für die ANDRITZ
AG und ihre verbundenen Unternehmen.
Finanzielle Leistungsindikatoren der ANDRITZ AG:
Die Kennzahlen wurden entsprechend dem Fachgutachten zur Mindestausgestaltung
finanzieller Leistungsindikatoren im Lagebericht berechnet.
in MEUR bzw. in % 2008 2009
Auftragsstand 1.470,2 1.590,9
Umsatzerlöse 765,6 477,5
Ergebnis vor Zinsen und Steuern 91,9 88,1
Umsatzrentabilität 12,0% 18,5%
Eigenkapitalrentabilität 21,5% 23,7%
Gesamtkapitalrentabilität 7,1% 6,4%
Nettoverschuldung 265,0 190,9
Nettoumlaufvermögen -79,8 63,4
Eigenkapitalquote 23,8% 23,7%
Verschuldungsgrad 85,9% 58,9%
Ergebnis vor Zinsen, Steuern und Abschreibungen 130,2 120,9
Aufgrund der geringeren Endabrechnung von Großprojekten sind die Umsatzerlöse
und das Betriebsergebnis im Vorjahresvergleich deutlich zurückgegangen.

Der Netto-Geldfluss aus laufender Geschäftstätigkeit betrug in 2009 +159,4 MEUR
(2008: +121,4 MEUR), jener aus der Investitionstätigkeit -29,8 MEUR (2008: -160,4
MEUR) und jener aus der Finanzierungstätigkeit -56,8 MEUR (2008: +37,9 MEUR).
Der Finanzmittelbestand am Ende der Periode erhöhte sich daher von 45,2 MEUR
am 31.12.2008 auf 118,0 MEUR am 31.12.2009.
Nicht-finanzielle Leistungsindikatoren der ANDRITZ AG: Bezüglich der Themenbereiche Fertigung, Personalwesen und Umweltschutz wird
auf die Ausführungen im Konzernlagebericht verwiesen, welche auch für die
ANDRITZ AG zutreffend sind. Im Bereich Forschung und Entwicklung ist die
ANDRITZ AG eines von mehreren Forschungszentren in der ANDRITZ-Gruppe und
in sämtlichen Geschäftsbereichen mit Ausnahme des Geschäftsbereichs FEED &
BIOFUEL in verschiedenen Projekten tätig.
Zur besseren Einsicht in die Vermögens-, Finanz- und Ertragslage basiert der
folgende Lagebericht auf dem nach IFRS erstellten Konzernabschluss.

01
Während die Entwicklung der Weltwirtschaft im 1. Halbjahr 2009 durch die globale Finanz- und Wirtschaftskrise negativ beeinflusst war, stabilisierte sich in der zweiten Jahreshälfte das wirtschaft-liche Umfeld in den wichtigsten Wirtschaftsregionen.
In den USA kam es nach einem sehr schwierigen 1. Halbjahr zu einer leichten Erholung der Wirt-schaft ab dem 3. Quartal 2009. Die Industrie-Produktion und v. a. der Privatkonsum, der den Haupt-teil des US-Bruttonationalprodukts ausmacht, entwickelten sich erfreulich, wobei sich das von der US-Regierung gestartete Anreiz-Programm zum Kauf von neuen, sparsamen Kraftfahrzeugen („Abwrackprämie“) positiv auswirkte. Ebenso kam es am Immobilienmarkt zu einer Entspannung. Dennoch blieb die Situation am Arbeitsmarkt mit einer Arbeitslosenquote von über 10% schwierig.
In Europa war eine ähnliche wirtschaftliche Entwicklung feststellbar, wenngleich die wirtschaftliche Erholung im 2. Halbjahr 2009 durch den schwachen Privatkonsum in den meisten Mitgliedsstaaten deutlich gemäßigter als in den USA ausfiel. Nur stark exportorientierte Länder, wie z. B. Deutsch-land, zeigten durch die Belebung der Wirtschaft in den aufstrebenden Ländern eine deutlichere Erholung.
In Asien und den anderen großen aufstrebenden Ländern waren die Auswirkungen der Weltwirt-schaftskrise deutlich geringer als in den USA oder Europa. In China kam es nach einer Phase der Abkühlung im 1. Quartal 2009 rasch zu einer Erholung der Wirtschaft; das Wirtschaftswachstum wurde hier v. a. durch das von der chinesischen Regierung aufgelegte Stimulus-Programm zur Belebung der Wirtschaft, aber auch durch die steigenden Exporte unterstützt. Ebenso zeigten die aufstrebenden Wirtschaftsnationen in Südamerika im Verlauf des 2. Halbjahrs 2009 eine starke wirtschaftliche Erholung.
Quelle: OECD
Veränderung des Konsolidierungskreises/AkquisitionenDie folgenden Unternehmen waren im Geschäftsjahr 2008 nicht oder nur teilweise im Konzern-Abschluss der ANDRITZ-GRUPPE enthalten: Maerz Industrieofenanlagen GmbH: Wärmebehandlungsanlagen und Schmelzöfen. Einzelne Vermögenswerte von GE (General Electric Company) Energy: Wasserkraft-Technologie. GEHI (Mehrheitsbeteiligung am Joint Venture General Electric Hydro Inepar): Wasserkraft-Tech-nologie.
Kufferath: Service-Unternehmen für die Zellstoff- und Papier-Industrie.
Folgendes Unternehmen wurde 2009 im Konzern-Abschluss der ANDRITZ-GRUPPE neu konso-lidiert: Rollteck: Konstruktion und Fertigung von Rollenschneid-Maschinen für die Papier-Industrie.
Die erstmalige Einbeziehung der in 2008 und 2009 erworbenen Unternehmen/Geschäftsfeldererfolgte auf Basis vorläufiger Werte.
UmsatzDer Umsatz der ANDRITZ-GRUPPE betrug im Geschäftsjahr 2009 3.197,5 MEUR und lag damit um 11,4% unter dem Rekordwert des Vorjahrs (2008: 3.609,8 MEUR). Während der Geschäftsbereich HYDRO seinen Umsatz deutlich steigern konnte, ging der Umsatz in den anderen Geschäftsberei-chen – insbesondere im Bereich PULP & PAPER – im Jahresvergleich zurück.
LageberichtWIRTSCHAFT-
LICHE RAHMEN-BEDINGUNGEN
GESCHÄFTS-ENTWICKLUNG

02
Südamerika: 11 (11)
Asien (exkl. China): 14 (10)
Nordamerika: 16 (14)Europa: 45 (48)
Sonstige: 4 (6)
China: 10 (11)
Umsatz nach Regionen 2009 (2008) in %
ENVIRONMENT & PROCESS: 10 (10)
METALS: 15 (16)
PULP & PAPER: 28 (37)
FEED & BIOFUEL: 4 (4)
Umsatz nach Geschäfts-bereichen 2009 (2008) in %
HYDRO: 43 (33)
Anteil Service-Umsatz am Umsatz der Gruppe und der Geschäftsbereiche
2009 2008ANDRITZ-GRUPPE 27% 24% HYDRO 24% 24% PULP & PAPER 41% 32% METALS 3% 3% ENVIRONMENT & PROCESS 28% 24% FEED & BIOFUEL 56% 50%
AuftragseingangTrotz der schwierigen gesamtwirtschaftlichen Entwicklung lag der Auftragseingang der Gruppe mit 3.349,3 MEUR im Jahr 2009 nur um 9,6% unter dem sehr hohen Wert des Vorjahrs (2008: 3.705,3 MEUR). Dies ist v. a. auf die sehr positive Entwicklung des Geschäftsbereichs HYDRO zurückzuführen – der Auftragseingang stieg hier um 9,8% auf den neuen Rekordwert von 1.693,9 MEUR an (2008: 1.543,4 MEUR). Die anderen Geschäftsbereiche – insbesondere der Geschäftsbereich METALS – verzeichneten dagegen im Jahresvergleich Rückgänge des Auftrags-eingangs.
ENVIRONMENT & PROCESS: 9 (10)
METALS: 9 (16)
PULP & PAPER: 27 (28)
HYDRO: 51 (42)
FEED & BIOFUEL: 4 (4)
Auftragseingang nach Geschäfts-bereichen 2009 (2008) in %
Nordamerika: 14 (13)
China: 17 (10)Südamerika: 20 (14)
Europa: 32 (48)
Sonstige: 3 (2)Asien (exkl. China): 14 (13)
Auftragseingang nach Regionen2009 (2008) in %
AuftragsstandDer Auftragsstand der ANDRITZ-GRUPPE per 31. Dezember 2009 betrug 4.434,5 MEUR, was einen Anstieg von 3,7% gegenüber dem hohen Niveau des Vorjahrs bedeutet (31. Dezember 2008: 4.277,4 MEUR). Während sich der Auftragsstand des Geschäftsbereichs HYDRO im Jahresver-gleich deutlich erhöhte, ging der Auftragsstand v. a. im Geschäftsbereichen METALS deutlich zurück.

03
ENVIRONMENT & PROCESS: 3 (3)METALS: 13 (17)
PULP & PAPER: 18 (18)
HYDRO: 65 (61)
FEED & BIOFUEL: 1 (1)
Auftragsstand nach Geschäfts-bereichen 2009 (2008) in %
Auftragsstand nach Regionen 2009 (2008) in %
Nordamerika: 12 (13)
Asien (exkl. China): 18 (18)Südamerika: 19 (13)
Europa: 36 (44)
Sonstiges: 3 (3)China: 12 (9)
ErgebnisDas EBITA der Gruppe betrug im Berichtsjahr 164,1 MEUR und lag damit deutlich unter dem Vorjahreswert (2008: 233,2 MEUR) Die Rentabilität (EBITA-Marge) erreichte einen Wert von 5,1% (2008: 6,5%).
Dieser Rückgang ist im Wesentlichen auf Aufwendungen für konjunkturbedingt notwendige, kapa-zitive Anpassungen und operative Restrukturierungen in Höhe von rd. 29 MEUR – insbesondere im Geschäftsbereich PULP & PAPER – sowie auf den Umsatzrückgang zurückzuführen. Exklusive dieser einmaligen Aufwendungen beträgt das EBITA im Jahr 2009 193,1 MEUR, was einer EBITA-Marge von 6,0% entspricht. Aus den Anpassungen und Restrukturierungen werden zukünftig deutliche Einsparungseffekte erwartet, die sich auf das operative Ergebnis im Geschäftsjahr 2010 und in den Folgejahren positiv auswirken sollten.
Im Berichtsjahr wurden Wertminderungen von Firmenwerten von 7,9 MEUR (2008: 6,8 MEUR) erfasst, die v. a. dem Geschäftsbereich PULP & PAPER zuzuordnen sind.
Das Finanzergebnis der ANDRITZ-GRUPPE betrug 2,6 MEUR und lag damit deutlich über dem Wert des Vorjahrs (2008: -8,1 MEUR). Dies ist im Wesentlichen auf Kursgewinne veräußerter Geldmarktfonds zurückzuführen, die 2008 bedingt durch die weltweite Finanzkrise wertberichtigt werden mussten.
Die Steuerquote betrug im Berichtsjahr 31,2% (2008: 30,1%).
Das Konzern-Ergebnis der Gruppe nach Abzug von Minderheitsanteilen betrug im Berichtsjahr 96,8 MEUR (2008: 139,7 MEUR).
Finanz-Kennzahlen
Einheit 2009 2008 +/-Umsatz MEUR 3.197,5 3.609,8 -11,4%Umsatzrendite1) % 4,6 6,1 –EBITDA MEUR 218,2 278,2 -21,6%Ergebnis vor Zinsen und Ertragsteuern (EBIT) MEUR 147,1 218,5 -32,7%Ergebnis vor Ertragsteuern (EBT) MEUR 149,6 210,5 -28,9%Konzern-Ergebnis MEUR 102,9 147,0 -30,0%1) EBIT (Ergebnis vor Zinsen und Ertragsteuern)/Umsatz
Vermögens- und KapitalstrukturDie Bilanzsumme der ANDRITZ-GRUPPE per 31. Dezember 2009 stieg auf 3.309,3 MEUR an (31. Dezember 2008: 3.086,3 MEUR). Die Eigenkapitalquote per 31. Dezember 2009 betrug 20,0% (31. Dezember 2008: 18,7%).

04
Die liquiden Mittel (flüssige Mittel plus Wertpapiere des Umlaufvermögens) per 31. Dezember 2009 betrugen 1.082,1 MEUR (31. Dezember 2008: 821,8 MEUR). Die Netto-Liquidität (liquide Mittel plus Marktwert der Zinsswaps abzüglich Finanzverbindlichkeiten) betrug 677,9 MEUR und lag damit deutlich über dem Wert zum Ende des Vorjahrs (31. Dezember 2008: 408,9 MEUR).
Bilanz-Kennzahlen
Einheit 2009 2008Eigenkapitalquote1) % 20,0 18,7Eigenkapitalrentabilität2) % 22,5 36,5Gesamtkapitalrentabilität3) % 4,4 7,1Nettoliquidität4) MEUR 677,9 408,9Nettoverschuldung5) MEUR -505,3 -242,9Nettoumlaufvermögen6) MEUR -104,3 22,7Capital employed7) MEUR 285,9 406,8Verschuldungsgrad8) % -76,2 -42,11) Summe Eigenkapital/Bilanzsumme 2) Ergebnis vor Ertragsteuern/Summe Eigenkapital 3) Ergebnis vor Zinsen und Ertrag-steuern/Bilanzsumme 4) Flüssige Mittel plus Wertpapiere des Umlaufvermögens plus Marktwert der Zinsswaps abzüglich Finanzverbindlichkeiten 5) Verzinsliches Fremdkapital inkl. Rückstellungen für Abfertigungen, Pensionen und Jubiläumsgel-der abzüglich flüssige Mittel und Wertpapiere des Umlaufvermögens 6) Langfristige Forderungen plus kurzfristige Vermö-genswerte (exkl. Wertpapiere des Umlaufvermögens und flüssige Mittel) abzüglich sonstige langfristige Verbindlichkeiten und kurzfristige Verbindlichkeiten (exkl. Finanzverbindlichkeiten und Rückstellungen) 7) Nettoumlaufvermögen plus immaterielle Vermögenswerte und Sachanlagen 8) Nettoverschuldung/Summe Eigenkapital
Aktiva
Langfristiges Vermögen: 23%
Sonstiges kurzfristiges Vermögen: 44%
Flüssige Mittel und Wertpapiere des Umlaufvermögens: 33%
769,2 MEUR
1.458,0MEUR
1.082,1 MEUR
Passiva
Summe Eigen-kapital inkl. Anteile in Fremdbesitz: 20%
Finanzverbind-lichkeiten: 13%
Sonstige langfristige Verbind-lichkeiten:10%
Sonstige kurzfristige Verbindlichkeiten: 57%
425,7 MEUR
323,1 MEUR
663,5 MEUR
1.897,0 MEUR
Investitionen und CashflowDie Investitionen in materielle und immaterielle Vermögensgegenstände betrugen 2009 70,5 MEUR (2008: 69,7 MEUR) und betrafen im Wesentlichen Modernisierungen von Fertigungsstätten.
Der Cashflow aus laufender Geschäftstätigkeit betrug 345,7 MEUR und war damit deutlich höher als im Vorjahr (2008: 255,0 MEUR).
Cashflow-Kennzahlen
Einheit 2009 2008Cashflow aus laufender Geschäftstätigkeit MEUR 345,7 255,0Investitionen1) MEUR 70,5 69,7Free Cashflow2) MEUR 285,6 187,5Free Cashflow je Aktie3) EUR 5,5 3,61) Zugänge zu immateriellen Vermögenswerten und Sachanlagen 2) Cashflow aus laufender Geschäftstätigkeit abzüglich Investitionen plus Einzahlungen aus dem Verkauf von immateriellen Vermögenswerten und Sachanlagen 3) Free Cashflow/Aktiengesamtzahl

05
ANDRITZ verfügt über ein gruppenweites Risiko-Managementsystem, mit dem Risikopotenziale erkannt und Gegenmaßnahmen getroffen werden sollen. Dies ist ein wichtiges Element des aktiven Risikomanagements innerhalb der Gruppe.
Wesentliche Merkmale des internen Kontroll- und Risikomanagement-systems in Hinblick auf den RechnungslegungsprozessDie Einrichtung eines angemessenen internen Kontroll- und Risikomanagementsystems in Hinblick auf den Rechnungslegungsprozess bzw. die Finanzberichterstattung liegt in der Verantwortung des Vorstands. Dazu hat der Vorstand sowohl für die wesentlichen Geschäftsrisiken innerhalb der Gruppe als auch für den Finanzberichterstattungsprozess gruppenweit verbindlich anzuwendende Regelungen und Richtlinien verabschiedet.
Das Rechnungswesen und die darin integrierte Finanzbuchhaltung sind direkt dem Vorstand unter-stellt. Durch entsprechende organisatorische Maßnahmen wird sichergestellt, dass die gesetzliche Vorgabe, dass die Eintragungen in die Bücher und die sonstigen Aufzeichnungen vollständig, richtig, zeitgerecht und geordnet zu erfolgen haben, erfüllt wird. Der gesamte Prozess von der Beschaffung bis zur Zahlung unterliegt strengen Regeln und Richtlinien, welche jegliche damit im Zusammenhang stehenden Risken vermeiden sollen. Zu diesen Maßnahmen und Regeln zählen u. a. Funktionstrennungen, Unterschriftenordnungen, ausschließlich kollektive und auf wenige Personen eingeschränkte Zeichnungsermächtigung für Zahlungen sowie systemunterstützte Prü-fungen durch die verwendete Software (SAP).
Durch ein standardisiertes, konzernweites Finanzberichtswesen sowie durch Adhoc-Berichter-stattung über bedeutende Ereignisse wird der Vorstand laufend über alle relevanten Sachverhalte informiert. Der Aufsichtsrat wird in zumindest einer pro Quartal stattfindenden Aufsichtsratssitzung über den laufenden Geschäftsgang inklusiver operativer Planung und mittelfristiger Strategie des Konzerns unterrichtet, in besonderen Fällen wird der Aufsichtsrat auch unmittelbar informiert. In den Prüfungsausschusssitzungen wird u. a. auch das interne Kontroll- und Risikomanagement behandelt.
Eine interne Revision, die als Stabstelle des Vorstands eingerichtet ist, auditiert konzernweit ein-zelne Prozesse oder Gesellschaften anhand eines jährlich festgelegten Prüfplans.
Finanzielle RisikenÜberwachung und Management finanzieller Risiken sind integrale Bestandteile des Rechnungs-wesens und des Controllings innerhalb der gesamten ANDRITZ-GRUPPE. Kontinuierliches Con-trolling und regelmäßiges Reporting sollen die Wahrscheinlichkeit erhöhen, dass größere Risiken früh erkannt und wenn notwendig Gegenmaßnahmen getroffen werden können. Dennoch gibt es keine Garantie dafür, dass die Überwachungs- und Risikokontroll-Systeme effektiv genug sind.
Die wesentlichen Risiken für die Geschäftsentwicklung der ANDRITZ-GRUPPE im Jahr 2010 be-ziehen sich v. a. auf die Abhängigkeit der Gruppe von der allgemeinen Konjunkturentwicklung und der Entwicklung der von ihr bedienten Industrien, den Erhalt von Großaufträgen und die Erzielung der entsprechenden Umsatzerlöse aus dem hohen Auftragsstand. Die anhaltende Finanzkrise und die starke wirtschaftliche Verlangsamung in den wichtigsten Wirtschaftsregionen der Welt stellen darüber hinaus für die finanzielle Entwicklung der ANDRITZ-GRUPPE im Geschäftsjahr 2010 ein ernstes Risiko dar. Die weltweite Wirtschaftsschwäche könnte zu weiteren Verzögerungen bei der Abwicklung bestehender Aufträge sowie zur Verzögerung oder Einstellung laufender Projekte führen. Die Stornierung bestehender Aufträge könnte den Auftragsstand der ANDRITZ-GRUPPE negativ beeinflussen, was sich wiederum negativ auf die Kapazitätsauslastung der Produktions-stätten der Gruppe auswirken könnte.
Die globale Finanz- und Wirtschaftskrise könnte auch eine vollständige oder teilweise Abschrei-bung einzelner im Zuge von Akquisitionen entstandener Firmenwerte notwendig machen, wenn die wirtschaftlichen Ziele nicht erreicht werden können. Dies könnte die Ergebnisentwicklung der ANDRITZ-GRUPPE beeinflussen. Abseits davon besteht jederzeit das Risiko, dass Forderungen aus Lieferungen und Leistungen teilweise oder gänzlich wertberichtigt werden müssen.
RISIKO-MANAGEMENT

06
Das Zahlungsausfallsrisiko von Kunden wird für einen Großteil der Aufträge durch Besicherung von Zahlungen durch Banken sowie durch Abschluss von Exportversicherungen reduziert. Das Risiko für Lieferungen in als politisch durchschnittlich riskant oder sehr riskant eingestufte Länder wird üblicherweise ebenfalls in großem Ausmaß versichert. Zins- und Wechselkursrisiken werden durch die Verwendung von derivativen Finanzinstrumenten – v. a. Devisentermingeschäfte und Swaps – minimiert und gesteuert. Bei in Fremdwährung fakturierten Aufträgen (hauptsächlich solchen in US-Dollar, Euro und Schweizer Franken) wird die Nettowährungsposition durch den Abschluss von Termingeschäften gesichert. Cashflow-Risiken werden über monatliche Cashflow-Berichte überwacht.
Um die finanziellen Risiken weiter zu reduzieren und zur besseren Überwachung, Kontrolle und Bewertung der Finanz- und Liquiditätsposition verbessert die ANDRITZ-GRUPPE laufend ihre Treasury-Richtlinien und -Informationssysteme.
Die ANDRITZ-GRUPPE ist hinsichtlich Liquidität sehr gut positioniert und verfügt über ausreichen-de Liquiditätsreserven sowie einen gesicherten Zugang zu Liquidität. Die Gruppe vermeidet es, von einer einzigen Bank oder von nur wenigen Banken abhängig zu sein. Zur Sicherstellung der Unabhängigkeit wird bei allen wichtigen Finanz-Produkten (flüssige Mittel, Finanzverbindlichkeiten, Finanzanlagevermögen, Garantien und Derivate) jeweils nur ein bestimmtes Volumen mit einer Bank abgewickelt.
Geld wird weitgehend in risikoarme Finanzanlagen investiert, wie z. B. in Staatsanleihen, staatsga-rantierte Anleihen, Wertpapierfonds zur Deckung der Pensionsverpflichtungen oder Termingelder. Die Finanzmarktkrise und deren Auswirkungen können jedoch zu einer ungünstigen Preisentwick-lung bei verschiedenen Wertpapieren, in welche die Gruppe investiert hat (z. B. Wertpapierfonds oder Anleihen), oder zu deren Unhandelbarkeit führen. Dies könnte sich aufgrund notwendig wer-dender Abwertungen oder Wertberichtigungen negativ auf das Finanzergebnis oder das Eigen-kapital der ANDRITZ-GRUPPE auswirken. Durch die Krise erhöht sich zudem das Ausfallsrisiko einzelner Emittenten der Wertpapiere bzw. der Kunden.
Nicht-finanzielle RisikenIm Bereich der Fertigung sind exakte Planung, hoher Einsatz und Flexibilität seitens der Mitar-beiter wesentliche Erfolgsfaktoren, um kurze Auftragsdurchlaufzeiten und hohe Termintreue zu garantieren. ANDRITZ setzt intern auf flexible Arbeitszeitmodelle und einen hohen Anteil an Zeit-arbeitern, um zyklischen Auslastungsschwankungen zu begegnen. Weiters wird durch effizientes Lieferantenmanagement die Abwicklung des Zukaufsvolumens kontinuierlich verbessert und der Lieferantenpool laufend um qualifizierte Unternehmen erweitert.
Die ANDRITZ-Fertigungsstrategie basiert auf Eigenfertigung der Kernbauteile sowie Zukauf von Fertigungsleistungen. Damit können Auslastungsschwankungen besser ausgeglichen werden und die vorhandenen eigenen Fertigungskapazitäten optimal ausgelastet werden. Gemäß dieser „Make- or-Buy“-Strategie werden prozessrelevante Schlüsselkomponenten für Anlagen und Produkte von ANDRITZ meist in eigenen Produktionsstätten gefertigt und montiert. Einfache Komponenten wer-den dagegen vorwiegend bei qualifizierten Lieferanten beschafft, deren Qualität und Termintreue laufend kontrolliert und überwacht wird.
Im Bereich Personal sind interessante Karrieremöglichkeiten, eine leistungsorientierte Entlohnung und fokussierte Management-Trainingsprogramme wesentliche Voraussetzungen, dass ANDRITZ bestens ausgebildete und hoch qualifizierte Mitarbeiter anzieht. Hohe Qualitätsstandards im Aus-wahlverfahren gewährleisten, dass die am besten geeigneten Kandidaten eingestellt werden.
Im Rahmen der Nachfolgeplanung werden auf Basis standardisierter Leistungs- und Potenzial-Beurteilungen für jede Schlüsselposition interne Nachfolgekandidaten identifiziert, um für kurz- und mittelfristige Nachbesetzungen jederzeit Kandidaten verfügbar zu haben.
Auslastungsschwankungen können gruppenweit durch die Zuteilung von Aufträgen auf die ein-zelnen globalen Standorte sowie lokal durch den Einsatz von Leiharbeitern ausgeglichen werden.

07
Auswirkungen von WechselkursänderungenWechselkursänderungen werden durch entsprechende Terminkontrakte abgesichert.
Nicht-finanzielle LeistungsindikatorenFertigungIn den von der weltweiten Konjunkturschwäche betroffenen Geschäftsbereichen, insbesondere im Bereich PULP & PAPER, ging 2009 die Auslastung zurück. Es wurden an einzelnen Fertigungs- standorten kapazitive Anpassungen vorgenommen. Im Bereich HYDRO hingegen wurde eine Erhö-hung der Auslastung verzeichnet und es wurden die Fertigungskapazitäten durch gezielte Investiti-onen in Europa, Asien und Südamerika erweitert. Zur Minimierung des Risikos einer nachhaltigen Unterauslastung der gruppenweiten Fertigungskapazitäten wurde in den vergangenen Jahren ein optimiertes Zyklizitätsmanagement implementiert, das die Fertigungseinheiten der Gruppe effizient und schnell an veränderte Rahmenbedingungen und Auslastungen anpasst.
Bei den Investitionen lag der Schwerpunkt auf neuen Fertigungstechnologien, Automatisierung, Kapazitätsanpassungen bei Engpassprozessen, Aufbau von Kapazitäten in den Wachstumsmärk-ten Indien, China und Brasilien sowie auf der gezielten Erweiterung der Wertschöpfungskette.
PersonalwesenDie ANDRITZ-GRUPPE beschäftigte per Ende 2009 13.049 Mitarbeiter (-4,8% gegenüber 31. De-zember 2008: 13.707 Mitarbeiter).
Mitarbeiter nach Regionen per 31. Dezember 2009 (31. Dezember 2008) in %
China: 9 (9)
Nordamerika: 10 (12)Europa: 63 (64)
Sonstige: 2 (1)
Südamerika: 7 (7)Asien (exkl. China): 9 (7)
Das Human Resources-Management ist gruppenweit für die Koordination und Planung des Per-sonalwesens verantwortlich. Hauptziele sind die Nachbesetzung von Schlüsselpositionen sowie die Schaffung attraktiver Karriere- und Entwicklungsmöglichkeiten für zukünftige Führungskräfte.
UmweltschutzbelangeDer ANDRITZ-Standort Graz, Österreich, erhielt 2009 für herausragende Leistungen im Bereich Umwelt-Standards und Umwelt-Maßnahmen von der Stadt Graz erneut die Ökoprofit-Auszeich-nung in Gold. Durch gezielte Maßnahmen gelang es, das Aufkommen des Gewerbeabfalls um 32 t zu senken, das entspricht einer Reduktion von knapp 20% gegenüber 2008. Im Gewerbepark wurde durch Einbau von Thermostatventilen der Energieverbrauch für Heizung um 12.000kWh/a gesenkt. Durch eine standortweite Informationskampagne und begleitende Maßnahmen wurden der Pressluftverbrauch und damit die Pressluftherstellkosten – trotz steigender Energiekosten – im Jahresvergleich um ein Fünftel reduziert. Diese beiden Maßnahmen bedeuten eine Reduktion des CO2-Ausstoßes von 20 t pro Jahr. Durch Verbesserungen im Leitungssystem wurde der Frischwas-serverbrauch um mehr als 40% reduziert. 670 Mitarbeiter absolvierten Schulungen zu den Themen Gesundheit, Arbeitssicherheit, Brandschutz und Umweltschutz.

10
Im Jahr 2009 investierte die ANDRITZ-GRUPPE rd. 49,2 MEUR in Forschung und Entwicklung (2008: 51,2 MEUR). Einschließlich der auftragsbezogenen Entwicklungsarbeiten wurden rd. 3% des Umsatzes für die Entwicklung neuer Verfahren und Produkte aufgewendet. In den Forschungs-zentren der Gruppe in Österreich, Finnland, Frankreich, der Schweiz und den USA arbeiten mehr als 300 Mitarbeiter an der Entwicklung neuer Prozesse und Anlagen, um die Technologieführerschaft von ANDRITZ weiter auszubauen.
Die Forschungs- und Entwicklungsarbeiten der Geschäftsbereiche im Detail:HYDROEin wesentlicher Forschungs- und Entwicklungsschwerpunkt des Geschäftsbereichs lag 2009 in der hydraulischen und elektrischen Optimierung der weltweit leistungsstärksten Rohr-Turbinen und -Generatoren, die in großen Wasserkraftwerken eingesetzt werden.
Darüber hinaus beschäftigt sich der Geschäftsbereich mit der Verbesserung der Laufruhe von Turbinenlaufrädern sowohl bei tiefer Teillast als auch bei Überlast. Durch das Know-how auf dem Gebiet der Simulation dynamischer Vorgänge sowie die praktische Erfahrung mit zahlreichen Grenzleistungsmaschinen wurden weitere wesentliche Fortschritte verzeichnet, die bereits in der Praxis erfolgreich unter Beweis gestellt werden konnten.
Im Bereich Großpumpen lag der Schwerpunkt in der projektbezogenen, hydraulischen Weiter-entwicklung von bestehenden Laufrädern und Leitapparaten. Dadurch konnten signifikante Ver-besserungen im Wirkungsgrad und Kavitationsverhalten erzielt werden. Im Bereich Standard-Kreiselpumpen wurden eine neue Prozesspumpen-Generation entwickelt und die Mittelkonsis-tenzpumpen erfolgreich optimiert.
PULP & PAPERWesentlicher Schwerpunkt der Forschungs- und Entwicklungstätigkeiten des Geschäftsbereichs PULP & PAPER war die Unterstützung der Kunden bei der Erreichung ihrer Ziele hinsichtlich einer nachhaltigen Produktion mit höheren Kapazitäten und einer höheren Energie-Effizienz. Darüber hinaus entwickelte der Geschäftsbereich Technologien für die Erzeugung von Ökostrom und zur Herstellung von Biobrennstoffen, die das Entstehen von Treibhausgas reduzieren bzw. minimieren. Um die Auswirkungen auf die Umwelt zu verringern, wurde die Verbesserung von Systemen hin-sichtlich Chemikalien-Rückgewinnung und Reduktion der Abwassermenge fortgesetzt. Bei Ein-dampfanlagen fokussierte die technologische Entwicklung auf den Bau hocheffizienter Anlagen, um die Abwassermenge zu minimieren. Durch Entwicklungen in der Weißlaugen-Rückgewinnung werden Abgasmengen weiter gesenkt und Feststoff-Abfälle gereinigt, um deren Schadstoff-Gehalt zu reduzieren.
Im Bereich Faserlinie konzentrierten sich die Forschungs- und Entwicklungstätigkeiten weiterhin auf die Senkung der Investitionskosten pro Tonne produzierten Zellstoff sowie auf eine weitere Erhöhung der Kapazitäten auf mehr als 5.000 t/d.
Auf Grund der steigenden Energiekosten ist die Stromerzeugung in Zellstoff-Werken zu einem wesentlichen Thema in der gesamten Zellstoff-Industrie geworden. Mit von ANDRITZ entwickelten HERB-Rückgewinnungskesseln (HERB: High Energy Recovery Boiler) können Zellstoff-Fabriken die Stromerzeugung aus Schwarzlauge maximieren. Die Forschungs- und Entwicklungsarbeit be-schäftigte sich u. a. mit einer weiteren Steigerung der Strom-Produktion.
Ein weiterer Forschungs- und Entwicklungsschwerpunkt liegt unverändert auf neuen Produkten für die Verarbeitung von Biomasse und auf der Stromerzeugung aus Biomasse, v. a. hinsichtlich Verbrennungs- und Emissionsverhalten unterschiedlicher Biomasse-Rohstoffe.
Waste-To-Power Systeme (WTP) ist ein neu geschaffener Bereich von ANDRITZ PULP & PAPER, der Technologien zur Erzeugung von Energie aus den in Papier-Fabriken anfallenden Rückständen ermöglichen soll (v. a. aus Schlamm und Rejekten der Altpapier-Aufbereitung). Der wesentliche Nutzen von WTP liegt im geringeren Volumen an Rückständen für die Abfallentsorgung und in der Erhöhung der werkseigenen Energieproduktion.
FORSCHUNG & ENTWICKLUNG

11
Der Geschäftsbereich entwickelt weiters Technologien für die Herstellung von Bio-Ethanol aus Rohstoffen, die nicht aus dem Lebensmittelbereich stammen, wie z. B. aus Holz und landwirt-schaftlichen Abfällen.
METALSDie Forschungs- und Entwicklungsaktivitäten des Geschäftsbereichs METALS konzentrierten sich auf Produkt-Verbesserung und -Weiterentwicklung. So wurde im Bereich der Glühöfen für Edelstahl eine neue Rollenabdichtung entwickelt, die eine sehr wirtschaftlicher Prozess-Führung insbeson-dere bei den heute vermehrt nachgefragten Öfen mit großer Länge ermöglicht.
Weiters wurde die Regeneration von verbrauchten Mischsäuren aus Edelstahlbeizen optimiert. Das Ziel ist eine vollkommen abwasserfreie Beize und Regeneration durch Einsatz eines Spülwas-serverdampfers.
Ein weiterer Schwerpunkt konzentriert sich auf die Entzinkung von bei der Automobil-Produktion anfallendem Neuschrott. Obwohl dieser Schrott hochwertig ist, konnte er wegen des Zinkbelags an der Oberfläche bislang nur mit Qualitätseinbußen und daher mit Preisabschlägen weiterverwertet werden. In einer von ANDRITZ METALS entwickelten Pilotanlage wird der Schrott mit einer Flüssig-keit aus der Zinkproduktion in Kontakt gebracht. Der Zinkgehalt der Flüssigkeit steigt dadurch an und wird angereichert an den Zinkhersteller zurückgeliefert. Nach Reinigung und Trocknung kann der entzinkte Schrott für anspruchsvolle Anwendungen z. B. in der Gießerei-Industrie eingesetzt werden.
ENVIRONMENT & PROCESSIm Mittelpunkt der Forschungs- und Entwicklungsaktivitäten der Division Separation Technologies standen Programme zur Wertanalyse von Produkten. Damit können bei Kundenprojekten entweder Kostenreduktionen von rd. 20% erzielt oder die Leistung des Aggregats – bei gleichbleibenden Kosten – ebenfalls um ca. ein Fünftel gesteigert werden. So wurde z. B. im Rahmen eines Wertana-lyseprojekts eine kombinierte zylindrisch-konische Siebmantelzentrifuge entwickelt und patentiert, die im Vergleich zur herkömmlichen zylindrischen Zentrifuge – bei annähernd gleichem Platz- und Energie-Bedarf – eine Durchsatzsteigerung von 20–30% ermöglicht.
Die Division Thermal Processes fokussierte ihre Forschungs- und Entwicklungsarbeit auf Biomas-se und konzentrierte sich dabei v. a. auf die Wertsteigerung von Biomasse-Brennstoffen und die Biomasse-Trocknung. Ausgehend von den guten Erfahrungen mit bereits installierten Sägespäne-Trocknern wird die Trocknungstechnologie auf weitere Biomasse-Fraktionen wie Rinde, Rejekte oder Schlamm aus der Zellstoff- und Papier-Industrie erweitert. Zusätzlich werden das bei Säge-späne-Trocknern bewährte Durchluftverfahren und die alternative Umluft-Prozessführung weiter entwickelt; durch den Einsatz von Umluft und die Wärmerückgewinnung können bis zu 20% der thermischen Energie eingespart werden.
Erfolgreich weitergeführt wurde die Untersuchung von biologischen und physikalisch-chemischen Abluftbehandlungsverfahren zur Reduktion der Geruchs- und TOC-Emissionen (TOC: Total Organic Carbon) von Schlammtrocknungsanlagen. Pilotversuche zeigten, dass die marktüblichen, nicht-thermischen Behandlungsverfahren die in einigen Ländern gesetzlich geforderten TOC-Gehalte nicht zuverlässig gewährleisten können. Als Alternative können daher in Grenzfällen nur Abluftbe-handlungsverfahren mit thermischer Nachverbrennung eingesetzt werden.
FEED & BIOFUELDer Geschäftsbereich konzentrierte seine Forschungs- und Entwicklungsaktivitäten – in Zusam-menarbeit mit dem Geschäftsbereich ENVIROMENT & PROCESS – weiterhin auf Entwicklungs-programme zur Wertsteigerung von Biomasse-Brennstoffen.
In den Bereichen feste Biobrennstoffe und Energieerzeugung aus erneuerbaren Ressourcen er-richtete der Geschäftsbereich weiters eine neue Versuchslinie für das Mahlen und die Pelletierung von Biomasse. Die Linie wird auch für kundenspezifische Versuche zur Optimierung der Prozess-eigenschaften bei neuen Rohstoffen sowie bei der Schulung von Bedienungspersonal eingesetzt.

12
Gemäß den Prognosen führender Wirtschaftsexperten wird sich die Wirtschaftssituation in den wichtigsten Regionen der Welt zwar in den kommenden Monaten weiter stabilisieren, eine starke und nachhaltige Erholung ist jedoch für 2010 nicht zu erwarten.
Auf Basis dieser wirtschaftlichen Rahmenbedingungen sowie der aktuellen Projektaktivität in den für die ANDRITZ-GRUPPE relevanten Märkten haben sich die Erwartungen der ANDRITZ-GRUPPE hinsichtlich der wirtschaftlichen Entwicklung in den kommenden Quartalen nicht geändert.
Im Geschäftsbereich HYDRO wird auch für 2010 eine unverändert gute Entwicklung der Projekt-tätigkeit erwartet. Sowohl im Bereich der Modernisierung bestehender Wasserkraftanlagen als auch im Bereich der Errichtung neuer Wasserkraftwerke befindet sich eine Reihe von Projekten in der Realisierungsphase. In Europa und Nordamerika wird sich – bedingt durch das hohe durch-schnittliche Alter der installierten Basis – die Investitionstätigkeit weiterhin v. a. auf Modernisierung, Rehabilitation und Kapazitätssteigerung bestehender Anlagen konzentrieren. Die Projekttätigkeit bei Kleinwasserkraftwerken sowie bei Pumpspeicherkraftwerken zur Sicherung der Netzstabilität sollte ebenfalls auf hohem Niveau bleiben.
In Südamerika und Asien befindet sich eine große Anzahl von neuen Wasserkraftwerksprojekten in der Entwicklungs- oder Realisierungsphase. Das rasche Wirtschaftswachstum dieser Regionen und die zunehmende Nutzung erneuerbarer Energiequellen zur Deckung der stark steigenden Stromnachfrage sind dabei die wesentlichen Markttreiber.
Im Geschäftsbereich PULP & PAPER wird für 2010 mit einer Fortsetzung der nur moderaten Pro-jektaktivität – zumindest im 1. Halbjahr – gerechnet. Es gibt zwar eine Anzahl angekündigter Projek-te für den Bau neuer Zellstoff-Werke, meist basierend auf bereits bestehenden Plantagen, und für die Modernisierung bestehender Fabriken, dennoch sind wegen der Finanz- und Wirtschaftskrise Verzögerungen sowohl bei der Auftragsvergabe als auch bei der Abwicklung von zuletzt vergebe-nen Aufträgen zu erwarten. Erst wenn die weltweite Zellstoff-Industrie eine nachhaltige hohe Ka-pazitätsauslastung erzielt und sich die angespannte Situation an den Finanzmärkten normalisiert, ist mit einem deutlichen Anziehen der Projektaktivität zu rechnen.
Im Geschäftsbereich METALS wird 2010 sowohl für Kohlenstoffstahl- als auch für Edelstahl-Aus-rüstungen mit einer Fortsetzung der niedrigen Investitionstätigkeit gerechnet. Viele der internati-onalen Stahl-Hersteller haben angesichts der Finanz- und Wirtschaftskrise und der nachfragebe-dingt niedrigen Kapazitätsauslastung ihre Investitionspläne massiv gekürzt. Dennoch sind ähnlich wie in 2009 selektive Projektvergaben in einzelnen Regionen zu erwarten.
Im Geschäftsbereich ENVIRONMENT & PROCESS sollte sich 2010 die Projekttätigkeit bei Schlamm-entwässerungsanlagen zufriedenstellend entwickeln. Bei industriellen Anwendungen – etwa in den Bereichen Petrochemie, Lebensmittel und Landwirtschaft – wird im Jahresverlauf eine leicht anziehende Investitionstätigkeit erwartet. Auch bei Schlammtrocknungsanlagen für Kommunen ist mit einer leichten Erholung im Jahresverlauf zu rechnen.
Im Geschäftsbereich FEED & BIOFUEL sollte sich 2010 der Bereich Tierfutter weiter zufriedenstel-lend entwickeln. Auch in den Bereichen Fischfutter- und Haustierfutter-Erzeugung ist mit einer so-liden Entwicklung der Projektaktivität zu rechnen. Im Bereich Holz- und Biomasse-Pelletieranlagen sollte sich die ab dem 4. Quartal 2009 verzeichnete Marktbelebung auch im Jahr 2010 fortsetzen.
Auf Basis dieser Erwartungen und des Auftragsstands von mehr als 4,4 Milliarden Euro per Ultimo 2009 erwartet die ANDRITZ-GRUPPE für das Geschäftsjahr 2010 aus heutiger Sicht einen im Vergleich zum Gesamtjahr 2009 unveränderten bzw. leicht ansteigenden Umsatz. Das Konzern-Ergebnis sollte durch die Kostenreduktionen aus den 2009 eingeleiteten Restrukturierungsmaß-nahmen positiv beeinflusst werden. Sollte sich jedoch die globale Weltwirtschaft im Jahr 2010 erneut eintrüben, so ist mit negativen Auswirkungen auf die Umsatz- und Ertragsentwicklung der ANDRITZ-GRUPPE zu rechnen. Ebenso könnten weitere Restrukturierungsaufwendungen not-wendig werden, welche die Ergebnisentwicklung 2010 ebenso beeinflussen würden.
Wichtige Ereignisse nach dem 31. Dezember 2009Die Situation der Weltwirtschaft sowie an den Finanzmärkten hat sich in der Zeit zwischen dem Bilanzstichtag und der Veröffentlichung dieses Berichts nicht wesentlich geändert.
AUSBLICK

13
Offenlegung gemäß § 243a UGBDas Grundkapital der ANDRITZ AG per 31. Dezember 2009 betrug 104.000.000 Euro. Auf jede nennwertlose Aktie entfällt damit ein anteiliger Betrag am Grundkapital von 2,00 Euro.
Es bestehen keine Beschränkungen, welche die Stimmrechte oder die Übertragung von Aktien betreffen. Rund 29% der Aktien befinden sich in Besitz der Certus Beteiligungs-GmbH, deren Geschäftsführer Wolfgang Leitner, Vorstandsvorsitzender der ANDRITZ AG, ist.
Es gibt derzeit kein genehmigtes Kapital. Aufgrund eines Beschlusses der Hauptversammlung vom 27. März 2008 ist der Vorstand ermächtigt, zwischen 1. Oktober 2008 und 31. März 2011 bis zu 10% des Grundkapitals der ANDRITZ AG zurückzuerwerben. Ende September 2008 hat der Vorstand der ANDRITZ AG beschlossen, von dieser Ermächtigung Gebrauch zu machen und Aktien zwischen 1. Oktober 2008 und 31. März 2011 zurückzukaufen. Es gibt keine sich nicht unmittelbar aus dem Gesetz ergebenden Befugnisse für Mitglieder des Vorstands, insbesondere hinsichtlich der Möglichkeit, Aktien auszugeben oder zurückzukaufen.
Soweit der Gesellschaft bekannt ist, gibt es keine Inhaber von Aktien mit besonderen Kontroll-rechten. Die Arbeitnehmer üben das Stimmrecht direkt aus. Es existieren darüber hinaus auch keine sich nicht unmittelbar aus dem Gesetz ergebenden Bestimmungen über die Ernennung und Abberufung der Mitglieder des Vorstands und des Aufsichtsrats und über die Änderung der Satzung der Gesellschaft.
Die Gesellschaft ist keine bedeutenden Vereinbarungen eingegangen, die bei einem Kontrollwech-sel der Gesellschaft infolge eines Übernahmeangebots wirksam, sich ändern oder enden würden. Gemäß den Bedingungen der im Juni 2006 begebenen ANDRITZ-Anleihe 2006–2013 bzw. der im Februar 2008 begebenen ANDRITZ-Anleihe 2008–2015 ist jeder Inhaber von Teilschuldverschrei-bungen berechtigt, seine Teilschuldverschreibungen fällig zu stellen und sofortige Rückzahlung zum Nennbetrag zuzüglich der bis zum Tag der Rückzahlung aufgelaufenen Zinsen zu verlangen, falls ein Kontrollwechsel durch einen neuen Großaktionär erfolgt, und dieser Kontrollwechsel zu einer wesentlichen Beeinträchtigung der Fähigkeit der Emittentin führt, ihre Verpflichtungen aus den Teilschuldverschreibungen zu erfüllen.
Es existieren Entschädigungsvereinbarungen zwischen der Gesellschaft und Mitgliedern des Vor-stands im Falle eines Kontrollwechsels. Es gibt keine Entschädigungsvereinbarungen für die Auf-sichtsratsmitglieder und Arbeitnehmer.
Graz, am 25. Februar 2010
Der Vorstand der ANDRITZ AG
Wolfgang Leitner Franz Hofmann Karl Hornhofer Humbert Köfler Friedrich Papst (Vorstands- vorsitzender)
Disclaimer:Bestimmte Aussagen im Jahresfinanzbericht 2009 und im Geschäftsbericht 2009 sind „zukunftsgerichtete Aussagen“. Diese Aussa-gen, welche die Worte „glauben“, „beabsichtigen“, „erwarten“ und Begriffe ähnlicher Bedeutung enthalten, spiegeln die Ansichten und Erwartungen der Geschäftsleitung wider und unterliegen Risiken und Unsicherheiten, welche die tatsächlichen Ergebnisse wesentlich beeinträchtigen können. Der Leser sollte daher nicht unangemessen auf diese zukunftsgerichteten Aussagen vertrauen. Die Gesellschaft ist nicht verpflichtet, das Ergebnis allfälliger Berichtigungen der hierin enthaltenen zukunftsgerichteten Aussagen zu veröffentlichen, außer dies ist nach anwendbarem Recht erforderlich.
Der Jahresfinanzbericht 2009 und der Geschäftsbericht 2009 enthalten Annahmen und Prognosen, die auf Basis aller bis Redaktions-schluss am 25. Februar 2010 zur Verfügung stehenden Informationen getroffen wurden. Sollten die den Annahmen und Prognosen zugrunde liegenden Einschätzungen nicht eintreffen oder die im Kapitel „Unternehmensrisiken“ und im Lagebericht des Jahresfi-nanzberichts 2009 angesprochenen Risiken eintreten, so können die tatsächlichen Ergebnisse von den im Jahresfinanzbericht 2009 und im Geschäftsbericht 2009 erwarteten Ergebnissen abweichen. Trotz größter Sorgfalt erfolgen daher alle zukunftsbezogenen Aussagen ohne Gewähr.
AKTIEN UND AKTIONÄRS-
STRUKTUR
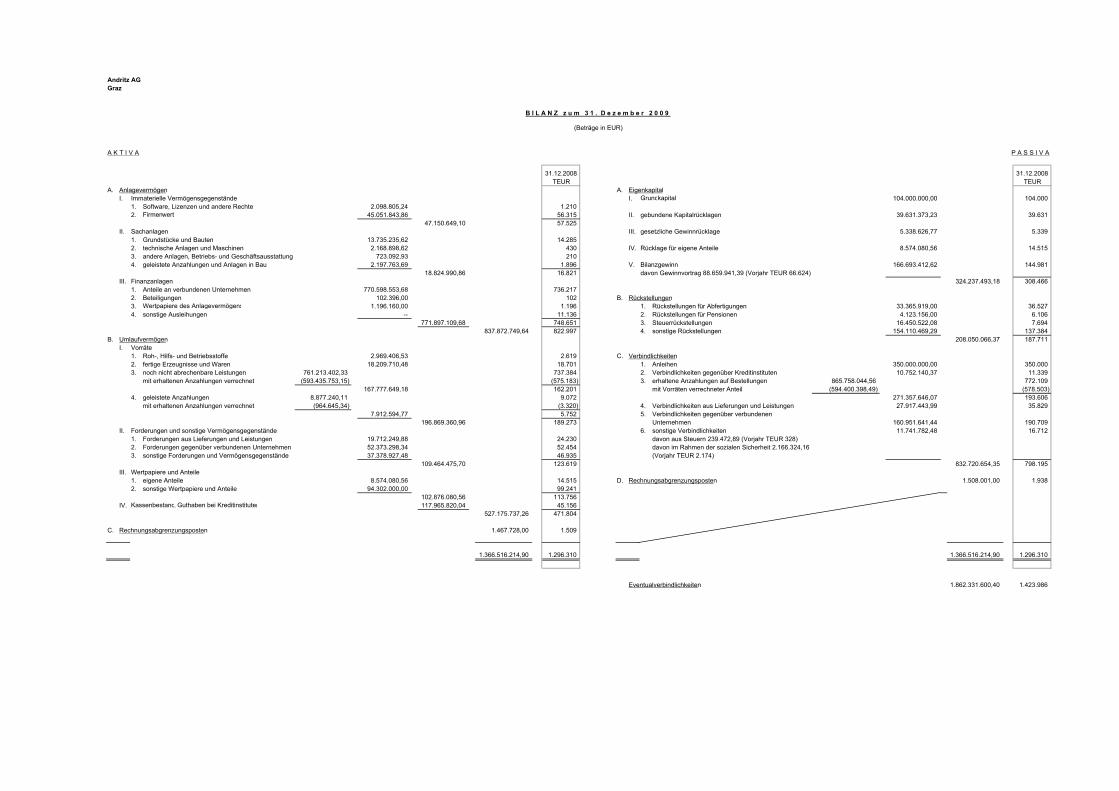
Andritz AGGraz
B I L A N Z z u m 3 1 . D e z e m b e r 2 0 0 9
(Beträge in EUR)
A K T I V A P A S S I V A
31.12.2008 31.12.2008TEUR TEUR
A. Anlagevermögen A. EigenkapitalI. Immaterielle Vermögensgegenstände I. Grundkapital 104.000.000,00 104.000
1. Software, Lizenzen und andere Rechte 2.098.805,24 1.210 2. Firmenwert 45.051.843,86 56.315 II. gebundene Kapitalrücklagen 39.631.373,23 39.631
47.150.649,10 57.525 II. Sachanlagen III. gesetzliche Gewinnrücklage 5.338.626,77 5.339
1. Grundstücke und Bauten 13.735.235,62 14.285 2. technische Anlagen und Maschinen 2.168.898,62 430 IV. Rücklage für eigene Anteile 8.574.080,56 14.515 3. andere Anlagen, Betriebs- und Geschäftsausstattung 723.092,93 210 4. geleistete Anzahlungen und Anlagen in Bau 2.197.763,69 1.896 V. Bilanzgewinn 166.693.412,62 144.981
18.824.990,86 16.821 davon Gewinnvortrag 88.659.941,39 (Vorjahr TEUR 66.624)III. Finanzanlagen 324.237.493,18 308.466
1. Anteile an verbundenen Unternehmen 770.598.553,68 736.217 2. Beteiligungen 102.396,00 102 B. Rückstellungen3. Wertpapiere des Anlagevermögens 1.196.160,00 1.196 1. Rückstellungen für Abfertigungen 33.365.919,00 36.527 4. sonstige Ausleihungen -- 11.136 2. Rückstellungen für Pensionen 4.123.156,00 6.106
771.897.109,68 748.651 3. Steuerrückstellungen 16.450.522,08 7.694 837.872.749,64 822.997 4. sonstige Rückstellungen 154.110.469,29 137.384
B. Umlaufvermögen 208.050.066,37 187.711 I. Vorräte
1. Roh-, Hilfs- und Betriebsstoffe 2.969.406,53 2.619 C. Verbindlichkeiten2. fertige Erzeugnisse und Waren 18.209.710,48 18.701 1. Anleihen 350.000.000,00 350.000 3. noch nicht abrechenbare Leistungen 761.213.402,33 737.384 2. Verbindlichkeiten gegenüber Kreditinstituten 10.752.140,37 11.339
mit erhaltenen Anzahlungen verrechnet (593.435.753,15) (575.183) 3. erhaltene Anzahlungen auf Bestellungen 865.758.044,56 772.109 167.777.649,18 162.201 mit Vorräten verrechneter Anteil (594.400.398,49) (578.503)
4. geleistete Anzahlungen 8.877.240,11 9.072 271.357.646,07 193.606 mit erhaltenen Anzahlungen verrechnet (964.645,34) (3.320) 4. Verbindlichkeiten aus Lieferungen und Leistungen 27.917.443,99 35.829
7.912.594,77 5.752 5. Verbindlichkeiten gegenüber verbundenen196.869.360,96 189.273 Unternehmen 160.951.641,44 190.709
II. Forderungen und sonstige Vermögensgegenstände 6. sonstige Verbindlichkeiten 11.741.782,48 16.712 1. Forderungen aus Lieferungen und Leistungen 19.712.249,88 24.230 davon aus Steuern 239.472,89 (Vorjahr TEUR 328)2. Forderungen gegenüber verbundenen Unternehmen 52.373.298,34 52.454 davon im Rahmen der sozialen Sicherheit 2.166.324,163. sonstige Forderungen und Vermögensgegenstände 37.378.927,48 46.935 (Vorjahr TEUR 2.174)
109.464.475,70 123.619 832.720.654,35 798.195 III. Wertpapiere und Anteile
1. eigene Anteile 8.574.080,56 14.515 D. Rechnungsabgrenzungsposten 1.508.001,00 1.938 2. sonstige Wertpapiere und Anteile 94.302.000,00 99.241
102.876.080,56 113.756 IV. Kassenbestand, Guthaben bei Kreditinstituten 117.965.820,04 45.156
527.175.737,26 471.804
C. Rechnungsabgrenzungsposten 1.467.728,00 1.509
1.366.516.214,90 1.296.310 1.366.516.214,90 1.296.310
Eventualverbindlichkeiten 1.862.331.600,40 1.423.986

Andritz AGGraz
GEWINN- UND VERLUSTRECHNUNG für das Geschäftsjahr 2009
(Beträge in EUR)
2008TEUR
1. Umsatzerlöse 477.497.268,83 765.603 2. Bestandsveränderungen
a) Veränderung des Bestands an fertigen Erzeugnissen sowie annoch nicht abrechenbaren Leistungen 23.829.405,58 (44.348)
b) Veränderungen der Auftragsrückstellungen (18.274.701,32) (46.692)5.554.704,26 (91.040)
3. andere aktivierte Eigenleistungen 356.144,18 186 4. sonstige betriebliche Erträge
a) Erträge aus dem Abgang vom Anlagevermögen mit Ausnahmeder Finanzanlagen 111.469,75 45
b) übrige 41.357.512,46 36.446 41.468.982,21 36.491
5. Aufwendungen für Material und sonstige bezogene Herstellungsleistungena) Materialaufwand (262.670.345,42) (366.729)b) Aufwendungen für bezogene Leistungen (29.868.923,50) (34.014)
(292.539.268,92) (400.743)6. Personalaufwand
a) Löhne (17.002.402,31) (21.114)b) Gehälter (77.054.023,84) (87.439)c) Aufwendungen für Abfertigungen und Leistungen an
betriebliche Mitarbeitervorsorgekassen (1.144.221,38) (2.474)d) Aufwendungen für Altersversorgung (807.560,60) (2.696)e) Aufwendungen für gesetzlich vorgeschriebene Sozialabgaben
sowie vom Entgelt abhängige Abgaben und Pflichtbeiträge (21.542.858,18) (23.351)f) sonstige Sozialaufwendungen (252.300,44) (265)
(117.803.366,75) (137.339)7. Abschreibungen auf immaterielle Gegenstände des Anlagevermögens und
Sachanlagen (13.088.333,53) (14.624)8. sonstige betriebliche Aufwendungen
a) Steuern, soweit sie nicht unter Z 18 fallen (630.753,79) (758)b) übrige (105.975.598,17) (128.550)
(106.606.351,96) (129.308)
9. Zwischensumme aus Z 1 bis 8 (Betriebserfolg) (5.160.221,68) 29.226
10. Erträge aus Beteiligungen 99.115.495,23 74.887 davon aus verbundenen Unternehmen 99.115.495,23 (Vorjahr TEUR 74.887)
11. Erträge aus anderen Wertpapieren 55.180,00 116 12. sonstige Zinsen und ähnliche Erträge 7.696.546,83 11.258
davon aus verbundenen Unternehmen 1.006.135,84 (Vorjahr TEUR 1.337)13. Erträge aus dem Abgang von Finanzanlagen und Wertpapieren des
Umlaufvermögens 8.312.781,67 52 14. Aufwendungen aus Finanzanlagen und aus Wertpapieren des Umlaufvermögens (21.918.308,26) (23.618)
davon aus Abschreibungen -19.701.796,36 (Vorjahr TEUR -23.618)davon Aufwendungen aus verbundenen Unternehmen -18.861.796,36(Vorjahr TEUR -11.481)
15. Zinsen und ähnliche Aufwendungen (11.380.873,63) (25.661)davon betreffend verbundene Unternehmen -317.477,35 (Vorjahr TEUR -673)
16. Zwischensumme aus Z 10 bis 15 (Finanzerfolg) 81.880.821,84 37.034
17. Ergebnis der gewöhnlichen Geschäftstätigkeit 76.720.600,16 66.260
18. Steuern vom Einkommen und vom Ertrag (4.627.864,21) (1.446)davon Weiterbelastung vom Gruppenträger 14.400.579,00 (Vorjahr TEUR 14.749)
19. Jahresüberschuss 72.092.735,95 64.814
20. Auflösung Rücklage für eigene Anteile 5.940.735,28 13.543 21. Gewinnvortrag aus dem Vorjahr 88.659.941,39 66.624
22. Bilanzgewinn 166.693.412,62 144.981
Andritz AG Graz
1
Jahresabschluss zum 31. Dezember 2009
A N H A N G
I. Bilanzierungs- und Bewertungsmethoden
Der Jahresabschluss zum 31. Dezember 2009 wurde unter Beachtung der Grundsätze ordnungs-
gemäßer Buchführung sowie unter Beachtung der Generalnorm, ein möglichst getreues Bild der
Vermögens-, Finanz- und Ertragslage zu vermitteln, aufgestellt. Für die Gewinn- und Verlustrech-
nung wird das Gesamtkostenverfahren angewendet.
Die immateriellen Vermögensgegenstände und das Sachanlagevermögen werden zu Anschaf-
fungs- bzw. Herstellungskosten abzüglich planmäßiger linearer Abschreibungen bewertet. Für
Zugänge werden ab dem Folgemonat der Anschaffung monatlich Abschreibungen vorgenommen.
Bei voraussichtlich dauernder Wertminderung werden außerplanmäßige Abschreibungen
vorgenommen. Geringwertige Wirtschaftsgüter werden im Jahr des Zugangs voll abgeschrieben
und als Abgang behandelt. Für die Abschreibung des Firmenwerts wird eine Nutzungsdauer von
14 Jahren zugrundegelegt, die Nachhaltigkeit ist durch die Marktpositionierung und die
Zukunftsperspektiven der Andritz AG gegeben. Die Sätze der Normalabschreibungen entsprechen
den unternehmensrechtlichen Vorschriften. Sie betragen für das übrige immaterielle Anlagevermö-
gen zwischen 20% und 25%, für Gebäude und sonstige Baulichkeiten zwischen 2% und 14,29%,
für technische Anlagen und Maschinen, andere Anlagen und Betriebs- und Geschäftsausstattung
zwischen 10% und 33,3%.
Beteiligungen werden mit den Anschaffungskosten oder im Falle einer dauernden Wertminderung
mit den niedrigeren Ertragswerten bewertet. Ausleihungen und Wertpapiere des Anlagevermögens
werden zu den Anschaffungskosten oder den niedrigeren Kurswerten bewertet.
Die Vorräte und Forderungen werden unter Beachtung des strengen Niederstwertprinzips bewer-
tet.

Andritz AG Graz
2
Aufträge werden mit ihren Herstellungskosten abzüglich allfälliger Vorsorgen für drohende Verluste
bewertet. Gewinnrealisierungen erfolgen bei Endabrechnung der Kundenaufträge, für das
Gewährleistungsrisiko werden Einzelvorsorgen gebildet.
Der Bilanzansatz der noch nicht abrechenbaren Leistungen wird mit erhaltenen Anzahlungen, so-
weit diese bereits angearbeitete Aufträge betreffen, offen saldiert.
Wertpapiere und eigene Anteile werden zu den Anschaffungskosten oder den niedrigeren
Kurswerten bewertet.
Die Verpflichtungen aus vertraglichen Pensionszusagen und laufenden Pensionen, aus Abferti-
gungen sowie die kollektivvertraglichen Jubiläumsgelder sind nach versicherungsmathematischen
Grundsätzen passiviert, wobei die Bewertungsvorschriften von IAS 19 angewandt wurden. Die
Rückstellungen berücksichtigen die nach den Grundsätzen kaufmännischer Beurteilung er-
kennbaren Risiken und Verpflichtungen.
Anleihen werden mit ihren Rückzahlungsbeträgen ausgewiesen.
Fremdwährungsforderungen werden mit dem Entstehungskurs oder mit dem für die Bilanzierung
maßgeblichen, niedrigeren Stichtagskurs bewertet. Fremdwährungsverbindlichkeiten werden mit
dem Entstehungskurs oder mit dem für die Bilanzierung maßgeblichen, höheren Stichtagskurs
bewertet.
Die Ansätze für die Vermögenswerte und Schulden entsprechen im Übrigen den bereits in den
Vorjahren angewandten Grundsätzen.
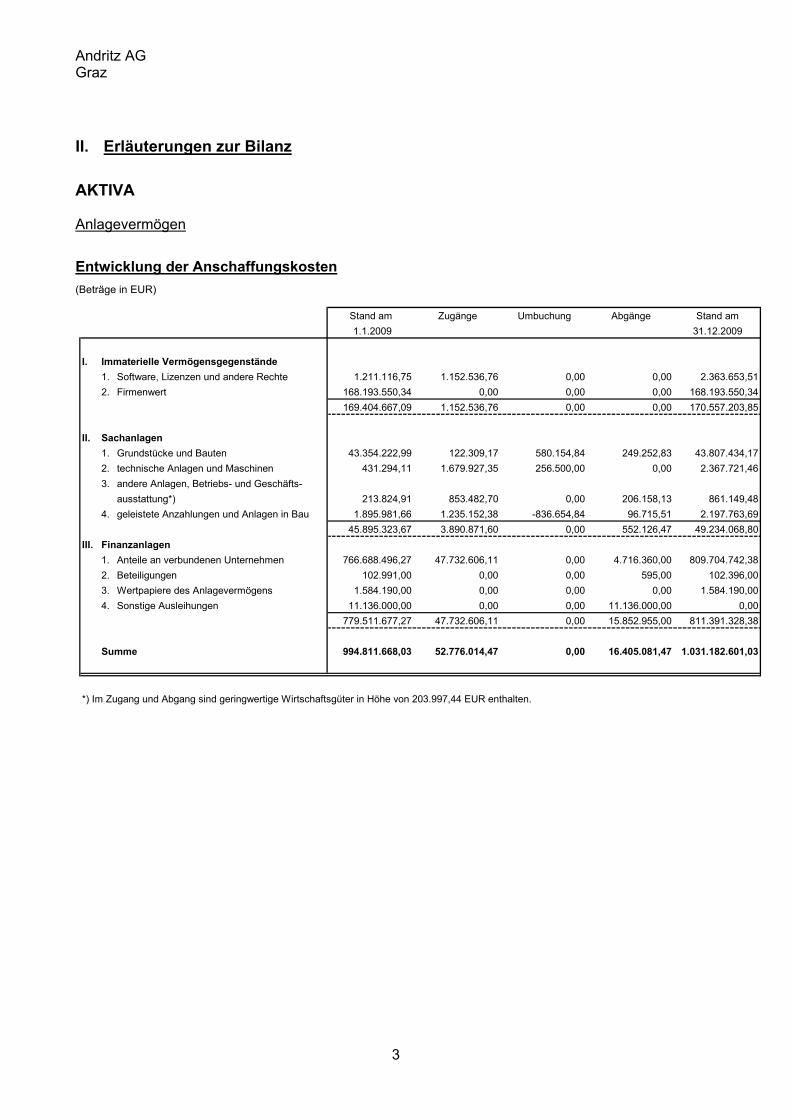
Andritz AG Graz
3
II. Erläuterungen zur Bilanz
AKTIVA
Anlagevermögen
Entwicklung der Anschaffungskosten (Beträge in EUR)
Stand am Zugänge Umbuchung Abgänge Stand am 1.1.2009 31.12.2009
I. Immaterielle Vermögensgegenstände1. Software, Lizenzen und andere Rechte 1.211.116,75 1.152.536,76 0,00 0,00 2.363.653,512. Firmenwert 168.193.550,34 0,00 0,00 0,00 168.193.550,34
169.404.667,09 1.152.536,76 0,00 0,00 170.557.203,85
II. Sachanlagen1. Grundstücke und Bauten 43.354.222,99 122.309,17 580.154,84 249.252,83 43.807.434,172. technische Anlagen und Maschinen 431.294,11 1.679.927,35 256.500,00 0,00 2.367.721,463. andere Anlagen, Betriebs- und Geschäfts-
ausstattung*) 213.824,91 853.482,70 0,00 206.158,13 861.149,484. geleistete Anzahlungen und Anlagen in Bau 1.895.981,66 1.235.152,38 -836.654,84 96.715,51 2.197.763,69
45.895.323,67 3.890.871,60 0,00 552.126,47 49.234.068,80III. Finanzanlagen
1. Anteile an verbundenen Unternehmen 766.688.496,27 47.732.606,11 0,00 4.716.360,00 809.704.742,382. Beteiligungen 102.991,00 0,00 0,00 595,00 102.396,003. Wertpapiere des Anlagevermögens 1.584.190,00 0,00 0,00 0,00 1.584.190,004. Sonstige Ausleihungen 11.136.000,00 0,00 0,00 11.136.000,00 0,00
779.511.677,27 47.732.606,11 0,00 15.852.955,00 811.391.328,38
Summe 994.811.668,03 52.776.014,47 0,00 16.405.081,47 1.031.182.601,03
*) Im Zugang und Abgang sind geringwertige Wirtschaftsgüter in Höhe von 203.997,44 EUR enthalten.

Andritz AG Graz
4
Entwicklung der kumulierten Abschreibungen (Beträge in EUR)
Stand am Jahres- Abgänge Stand am1.1.2009 abschreibung 31.12.2009
I. Immaterielle Vermögensgegenstände1. Software, Lizenzen und andere Rechte 1.524,17 263.324,10 0,00 264.848,272. Firmenwert 111.878.745,52 11.262.960,96 0,00 123.141.706,48
111.880.269,69 11.526.285,06 0,00 123.406.554,75
II. Sachanlagen1. Grundstücke und Bauten 29.069.037,24 1.025.889,37 22.728,06 30.072.198,552. technische Anlagen und Maschinen 1.483,81 197.339,03 0,00 198.822,843. andere Anlagen, Betriebs- und Geschäfts-
ausstattung*) 3.594,04 338.820,07 204.357,56 138.056,5529.074.115,09 1.562.048,47 227.085,62 30.409.077,94
III. Finanzanlagen1. Anteile an verbundenen Unternehmen 30.471.943,72 8.634.244,98 0,00 39.106.188,702. Beteiligungen 0,00 0,00 0,00 0,003. Wertpapiere des Anlagevermögens 388.030,00 0,00 0,00 388.030,004. Sonstige Ausleihungen 0,00 0,00 0,00 0,00
30.859.973,72 8.634.244,98 0,00 39.494.218,70
Summe 171.814.358,50 21.722.578,51 227.085,62 193.309.851,39
*) In der Jahresabschreibung und in den Abgängen sind geringwertige Wirtschaftsgüter in Höhe von 203.997,44 EUR enthalten.

Andritz AG Graz
5
Buchwerte zum 31.12.2009 (Beträge in EUR)
Anschaffungs- kumulierte Buchwertewerte Abschreibungen
I. Immaterielle Vermögensgegenstände1. Software, Lizenzen und andere Rechte 2.363.653,51 264.848,27 2.098.805,242. Firmenwert 168.193.550,34 123.141.706,48 45.051.843,86
170.557.203,85 123.406.554,75 47.150.649,10
II. Sachanlagen1. Grundstücke und Bauten 43.807.434,17 30.072.198,55 13.735.235,622. technische Anlagen und Maschinen 2.367.721,46 198.822,84 2.168.898,623. andere Anlagen, Betriebs- und Geschäfts-
ausstattung 861.149,48 138.056,55 723.092,934. geleistete Anzahlungen und Anlagen in Bau 2.197.763,69 0,00 2.197.763,69
49.234.068,80 30.409.077,94 18.824.990,86III. Finanzanlagen
1. Anteile an verbundenen Unternehmen 809.704.742,38 39.106.188,70 770.598.553,682. Beteiligungen 102.396,00 0,00 102.396,003. Wertpapiere des Anlagevermögens 1.584.190,00 388.030,00 1.196.160,004. Sonstige Ausleihungen 0,00 0,00 0,00
811.391.328,38 39.494.218,70 771.897.109,68
Summe 1.031.182.601,03 193.309.851,39 837.872.749,64

Andritz AG Graz
6
Immaterielle Vermögensgegenstände
Der aus der Verschmelzung mit der Andritz Internationale Technologie AG stammende Firmenwert
von 168 MEUR wird plangemäß über 14 Jahre verteilt abgeschrieben.
Sachanlagen
Der in den Grundstücken enthaltene Grundwert beträgt 1.511.642 EUR (Vorjahr: 1.517.506 EUR).
Finanzanlagen
Die Zugänge unter den Anteilen an verbundenen Unternehmen betreffen im Jahr 2009 getätigte
Akquisitionen sowie Kapitalmaßnahmen bei bestehenden Tochtergesellschaften.
Von den sonstigen Ausleihungen wurden nach Verwertung von Sicherheiten und planmäßigen
Rückführungen im Berichtsjahr 7.610.456 EUR getilgt, die verbleibenden 3.525.544 EUR mussten
ausgebucht werden.
Die aus steuerrechtlichen Gründen unterlassene Zuschreibung bei den Wertpapieren des
Anlagevermögens beträgt 147.740 EUR (Vorjahr: 0 EUR).
Roh-, Hilfs- und Betriebsstoffe
Die Bewertung erfolgte zu durchschnittlichen Einstandspreisen oder den niedrigeren Wiederbe-
schaffungspreisen des Bilanzstichtags. Für nicht- oder schwergängige Materialien wurden ange-
messene Abwertungen vorgenommen.
fertige Erzeugnisse und Waren
Die fertigen Erzeugnisse wurden zu Herstellungskosten angesetzt. Wertberichtigungen wurden
nach dem Grad der Verwertbarkeit bzw. dem kaufmännischen Vorsichtsgebot entsprechend in
angemessener Höhe gebildet.

Andritz AG Graz
7
noch nicht abrechenbare Leistungen
Der Wertansatz bei diesen Leistungen erfolgte zu Herstellungskosten, wobei auch bei langfristiger
Fertigung keine Zuschläge für Verwaltungs- und Vertriebskosten angesetzt werden. Wertberichti-
gungen wurden für aus Kundenaufträgen erwartete Verluste sowie für schwere Verwertbarkeit bei
Vorratsaufträgen gebildet. Noch nicht verrechnete Anzahlungen von Kunden wurden, soweit die
Aufträge bereits angearbeitet waren, in dieser Bilanzposition offen saldiert.
Forderungen und sonstige Vermögensgegenstände (Beträge in TEUR)
Restlaufzeit Restlaufzeit Bilanz-bis 1 Jahr > 1 Jahr wert(Vorjahr) (Vorjahr) (Vorjahr)
Forderungen aus Lieferungen und Leistungen 19.033 679 19.712(24.204) (26) (24.230)
Forderungen gegenüber verbundenen Unternehmen 52.373 0 52.373(52.454) (0) (52.454)
sonstige Forderungen und Vermögensgegenstände 8.960 28.419 37.379(18.516) (28.419) (46.935)
80.366 29.098 109.464(95.174) (28.445) (123.619)
Unter Beachtung des strengen Niederstwertprinzips wurden bei den Forderungen und sonstigen
Vermögensgegenständen erkennbare Risiken durch Einzelwertberichtigungen berücksichtigt.
Auslandsforderungen sind in den meisten Fällen durch Exportgarantien besichert. Unverzinsliche
langfristige Forderungen aus Lieferungen und Leistungen wurden abgezinst.
In den Forderungen gegen verbundene Unternehmen sind 26.612.856 EUR (Vorjahr:
9.390.365 EUR) aus Lieferungen und Leistungen enthalten.
In den sonstigen Forderungen sind keine Erträge enthalten, welche erst nach dem
Abschlussstichtag zahlungswirksam werden.
In den sonstigen Forderungen ist insbesondere eine Restforderung an die UniCredit Bank
Austria AG für die Abdeckung bereits rückgestellter Verluste der Jahre 1983 und 1984 enthalten.

Andritz AG Graz
8
eigene Anteile
Der Vorstand hat auf Basis einer Ermächtigung der Hauptversammlung und mit Zustimmung des
Aufsichtsrats ein Aktienrückkauf- und -wiederverkaufsprogramm beschlossen, welches den Erwerb
von bis zu 5.200.000 Stückaktien im Zeitraum 1.Oktober 2008 bis 31.März 2011 ermöglicht. Zum
31. Dezember 2009 befinden sich 472.141 Stückaktien in Besitz der Andritz AG, dies entspricht
einem Anteil am Grundkapital in Höhe von 0,91% bzw. 944.282 EUR. Es ist vorgesehen, diese
Aktien für die Bedienung der Optionen im Rahmen des Aktienbeteiligungsprogramms für
Führungskräfte zu verwenden.
2009 wurden von berechtigten Führungskräften Optionen zum Erwerb von insgesamt 310.000
Stückaktien zu einem Preis von 31,67 EUR je Aktie ausgenutzt; die Bedienung erfolgte aus
vorhandenen Beständen eigener Anteile; der auf diese Aktien entfallende Betrag des
Grundkapitals ist 620.000 EUR, der Anteil am Grundkapital beträgt 0,60%. Die aus den Verkäufen
erzielten Erlöse wurden zur kurzfristigen Liquiditätssteuerung verwendet.
Weiters wurden im Rahmen einer Mitarbeiterbeteiligungsaktion 17.133 Stückaktien an Mitarbeiter
der Andritz AG abgegeben.
Die aus steuerrechtlichen Gründen unterlassene Zuschreibung bei den eigenen Anteilen beträgt
5.151.058 EUR (Vorjahr: 0 EUR).

Andritz AG Graz
9
PASSIVA
Grundkapital
Das Grundkapital der Gesellschaft beträgt 104.000.000 EUR (Vorjahr: 104.000.000 EUR). Es ist in
52.000.000 Stückaktien ohne Nennwert zerlegt.
Rücklage für eigene Anteile
Die Rücklage für eigene Anteile zum 31. Dezember 2009 beträgt 8.574.081 EUR; ihr stehen auf
der Aktivseite ausgewiesene eigene Anteile in gleicher Höhe gegenüber.
Rückstellungen für Abfertigungen, Rückstellungen für Pensionen
Die Verpflichtungen aus den theoretischen Abfertigungsansprüchen der Dienstnehmer sowie die
Rückstellungen für Pensionen wurden zum 31.12.2009 nach versicherungsmathematischen
Grundsätzen unter Verwendung eines Zinssatzes von 5,25% (Vorjahr: 5,5%) sowie eines
Gehaltstrends von 3,25% (Vorjahr: 3,75%) (IAS 19) berechnet. Für die Berechnung wurden die
AVÖ2008 – Angestellte Pagler & Pagler zugrunde gelegt. Aufgrund der geänderten Prozentsätze
wurden aperiodische Erträge in Höhe von 877.965 EUR erzielt. Die Korridormethode wurde nicht
angewendet. Das rechnungsmäßige Pensionsalter entspricht wie im Vorjahr dem frühest
möglichen Anfallsalter für die vorzeitige Alterspension gemäß der im Budgetbegleitgesetz 2003
verankerten Pensionsreform. Für die im Jahr 1999 an eine Pensionskasse übertragenen
Pensionsansprüche wurde ein Gutachten nach den gleichen Grundsätzen erstellt. Zum
31. Dezember 2009 lag das Deckungskapital der Pensionsversicherung auf dem Niveau der
entsprechenden Pensionsverpflichtungen.

Andritz AG Graz
10
sonstige Rückstellungen 31.12.2009
in MEUR
Auftragsbezogene Vorsorgen für
- fehlende Selbstkosten 26,1
- Gewährleistungen und Mehrkosten 42,8
Personalaufwendungen 35,3
Zu erwartende Auftragsverluste werden in Höhe der Unterschiedsbeträge zwischen den voraus-
sichtlichen Gesamtselbstkosten und den Erlösen ermittelt und passiviert.
Die Rückstellung für unverbrauchte Urlaube ist mit 14,7 MEUR (Vorjahr: 16,6 MEUR) angesetzt.
Die Rückstellung für Jubiläumsgelder wurde nach versicherungsmathematischen Grundsätzen
(IAS 19) berechnet. Aufgrund der geänderten %-Sätze wurden aperiodische Erträge in Höhe von
111.137 EUR erzielt.

Andritz AG Graz
11
Verbindlichkeiten (Beträge in TEUR)
Restlaufzeit Restlaufzeit Restlaufzeit Bilanz- davon bis 1 Jahr 1 bis 5 Jahre > als 5 Jahre w ert Hypothekar-
schulden (Vorjahr) (Vorjahr) (Vorjahr) (Vorjahr) (Vorjahr)
Anleihen 0 200.000 150.000 350.000 0(0) (200.000) (150.000) (350.000) (0)
Verbindlichkeiten gegenüber Kreditinstituten 10.556 196 0 10.752 0(10.752) (588) (0) (11.339) (0)
erhaltene Anzahlungen auf Bestellungen 121.266 150.092 0 271.358 0(135.207) (58.399) (0) (193.606) (0)
Verbindlichkeiten aus Lieferungen undLeistungen 27.434 483 0 27.917 0
(35.236) (593) (0) (35.829) (0)
Verbindlichkeiten gegenüber verbundenenUnternehmen 128.327 32.625 0 160.952 0
(170.005) (20.704) (0) (190.709) (0)
sonstige Verbindlichkeiten 10.960 781 0 11.742 120(15.626) (958) (128) (16.712) (151)
298.543 384.177 150.000 832.721 120(366.826) (281.242) (150.128) (798.195) (151)
Am 19. Juni 2006 wurde eine öffentliche Anleihe am Kapitalmarkt mit einer Laufzeit von 7 Jahren
platziert; das Volumen beträgt 200 MEUR, die Kuponverzinsung wurde mit 4,5% p.a. fixiert. Am
20. Februar 2008 wurde eine weitere öffentliche Anleihe in Höhe von 150 MEUR mit einer Laufzeit
von 7 Jahren und einer Fixverzinsung von 5,25% p.a. begeben. Über das gesamte Volumen und
die gesamte Laufzeit beider Anleihen wurden Zinsswaps abgeschlossen, mit denen die fixen
Zinszahlungen der Gesellschaft gegen variable Zinszahlungen auf Basis 1-Monats-EURIBOR bzw.
3-Monats-EURIBOR getauscht wurden.
In den Verbindlichkeiten gegenüber verbundenen Unternehmen sind 20.279.684 EUR (Vorjahr:
17.794.554 EUR) aus Lieferungen und Leistungen und 118.856.748 EUR (Vorjahr: 144.900.381
EUR) aus erhaltenen Anzahlungen enthalten.
In den sonstigen Verbindlichkeiten sind Aufwendungen in Höhe von 3.925.421 EUR (Vorjahr:
6.737.692 EUR) enthalten, welche erst nach dem Abschlussstichtag zahlungswirksam werden.
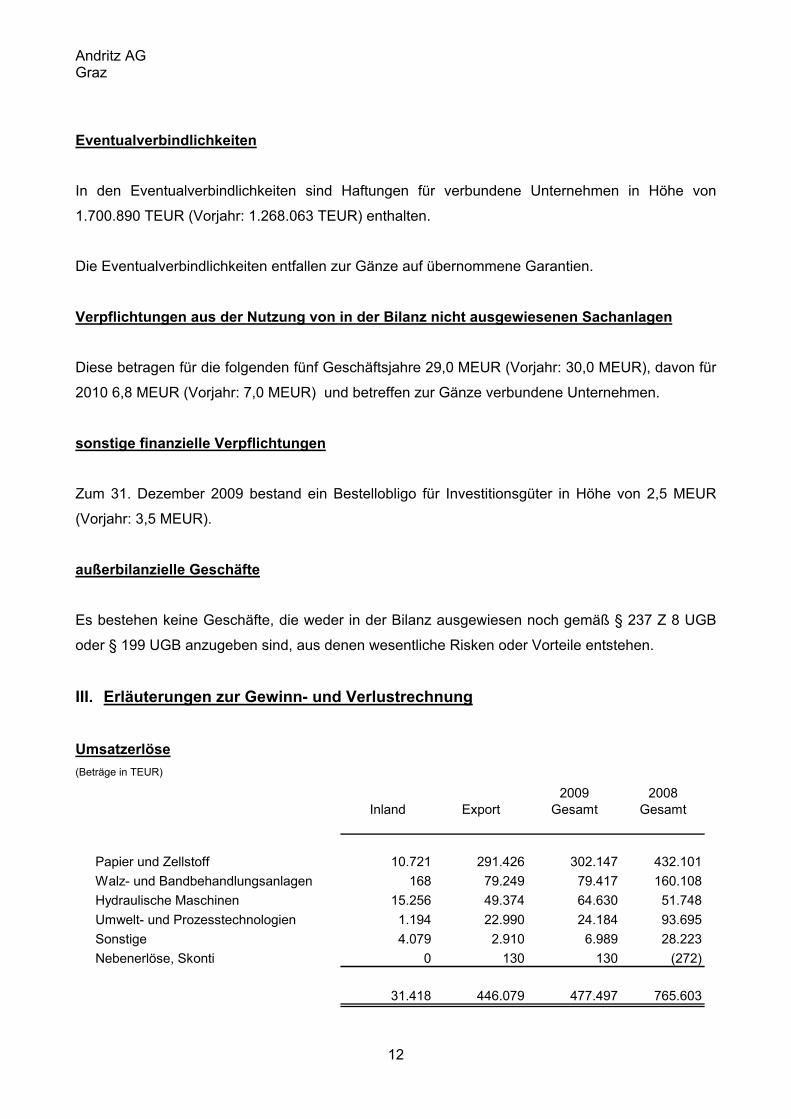
Andritz AG Graz
12
Eventualverbindlichkeiten
In den Eventualverbindlichkeiten sind Haftungen für verbundene Unternehmen in Höhe von
1.700.890 TEUR (Vorjahr: 1.268.063 TEUR) enthalten.
Die Eventualverbindlichkeiten entfallen zur Gänze auf übernommene Garantien.
Verpflichtungen aus der Nutzung von in der Bilanz nicht ausgewiesenen Sachanlagen
Diese betragen für die folgenden fünf Geschäftsjahre 29,0 MEUR (Vorjahr: 30,0 MEUR), davon für
2010 6,8 MEUR (Vorjahr: 7,0 MEUR) und betreffen zur Gänze verbundene Unternehmen.
sonstige finanzielle Verpflichtungen
Zum 31. Dezember 2009 bestand ein Bestellobligo für Investitionsgüter in Höhe von 2,5 MEUR
(Vorjahr: 3,5 MEUR).
außerbilanzielle Geschäfte
Es bestehen keine Geschäfte, die weder in der Bilanz ausgewiesen noch gemäß § 237 Z 8 UGB
oder § 199 UGB anzugeben sind, aus denen wesentliche Risken oder Vorteile entstehen.
III. Erläuterungen zur Gewinn- und Verlustrechnung
Umsatzerlöse (Beträge in TEUR)
2009 2008Inland Export Gesamt Gesamt
Papier und Zellstoff 10.721 291.426 302.147 432.101Walz- und Bandbehandlungsanlagen 168 79.249 79.417 160.108Hydraulische Maschinen 15.256 49.374 64.630 51.748Umwelt- und Prozesstechnologien 1.194 22.990 24.184 93.695Sonstige 4.079 2.910 6.989 28.223Nebenerlöse, Skonti 0 130 130 (272)
31.418 446.079 477.497 765.603

Andritz AG Graz
13
Umsatzerlöse nach Märkten
2009 2008
Inland 31.418 23.171Europäische Union 159.471 200.378Übriges Europa 29.632 19.787Nordamerika 22.899 9.455Asien 149.615 292.928Übrige Welt 84.462 219.884
477.497 765.603
in TEUR
Der Exportanteil bei den Umsatzerlösen beträgt 93%.
übrige sonstige betriebliche Erträge
In den übrigen sonstigen betrieblichen Erträgen sind neben diversen Mieterlösen (1.076 TEUR)
und Erträgen aus Wechselkursdifferenzen (3.511 TEUR) insbesondere Verrechnungen an
Tochtergesellschaften (31.702 TEUR) enthalten.
Aufwendungen für Abfertigungen und Leistungen an betriebliche Mitarbeitervorsorge-
kassen
In den Aufwendungen für Abfertigungen und Leistungen an betriebliche Mitarbeitervorsorgekassen
sind Aufwendungen für Abfertigungen in Höhe von 632 TEUR enthalten. Der restliche Betrag von
512 TEUR betrifft Leistungen an betriebliche Mitarbeitervorsorgekassen.
übrige betriebliche Aufwendungen
Die übrigen betrieblichen Aufwendungen setzen sich im Wesentlichen aus auftragsbezogenen
Kosten (34.707 TEUR), Wechselkursdifferenzen (4.658 TEUR) sowie aus Beratungs-
(10.110 TEUR), Reise- (14.065 TEUR), Instandhaltungs- (7.825 TEUR) und sonstigen allgemeinen
Verwaltungskosten zusammen.
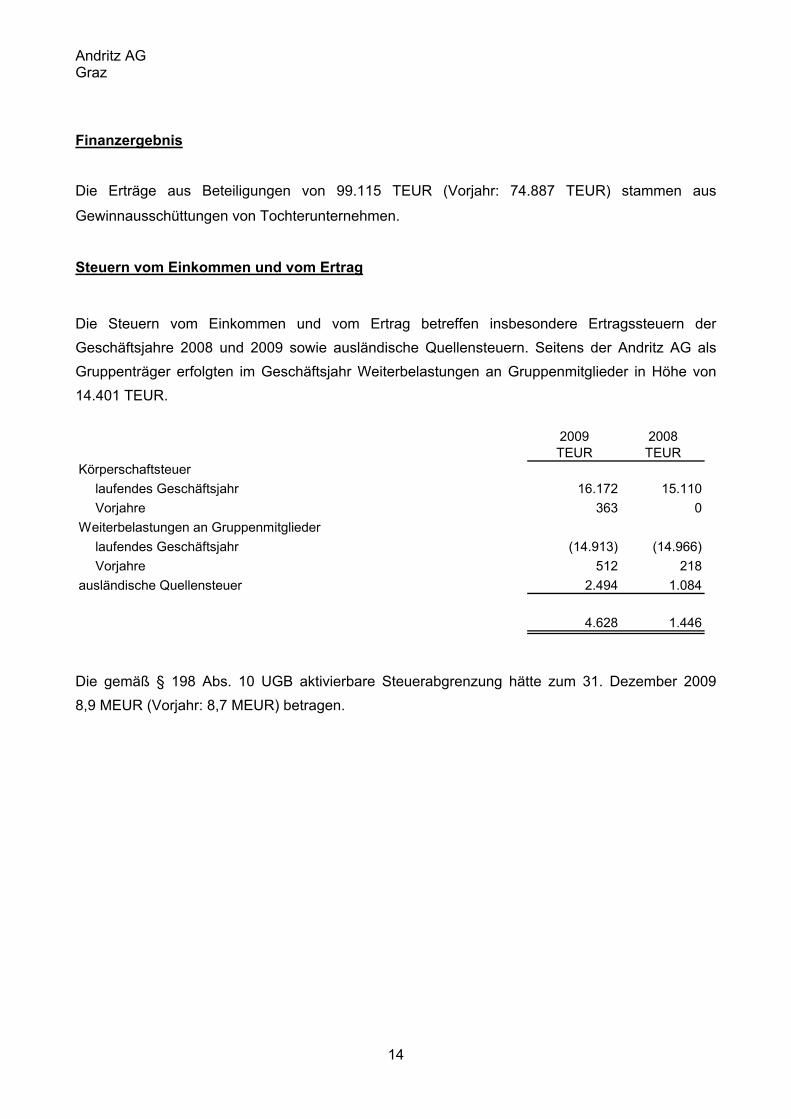
Andritz AG Graz
14
Finanzergebnis
Die Erträge aus Beteiligungen von 99.115 TEUR (Vorjahr: 74.887 TEUR) stammen aus
Gewinnausschüttungen von Tochterunternehmen.
Steuern vom Einkommen und vom Ertrag
Die Steuern vom Einkommen und vom Ertrag betreffen insbesondere Ertragssteuern der Geschäftsjahre 2008 und 2009 sowie ausländische Quellensteuern. Seitens der Andritz AG als Gruppenträger erfolgten im Geschäftsjahr Weiterbelastungen an Gruppenmitglieder in Höhe von 14.401 TEUR.
2009 2008TEUR TEUR
Körperschaftsteuerlaufendes Geschäftsjahr 16.172 15.110Vorjahre 363 0
Weiterbelastungen an Gruppenmitgliederlaufendes Geschäftsjahr (14.913) (14.966)Vorjahre 512 218
ausländische Quellensteuer 2.494 1.084
4.628 1.446
Die gemäß § 198 Abs. 10 UGB aktivierbare Steuerabgrenzung hätte zum 31. Dezember 2009 8,9 MEUR (Vorjahr: 8,7 MEUR) betragen.

Andritz AG Graz
15
IV. Sonstiges Beteiligungen, verbundene Unternehmen (Beträge in TEUR)
Sitz in TEURVerbundene Unternehmen direkt indirekt Jahresüberschuss Eigenkapital
Anstalt für Strömungsmaschinen GmbH Graz / Österreich 100% *)
ANDRITZ Technology and Asset Management GmbH Graz / Österreich 100% 356,77 179.987,39ANDRITZ Finance GmbH Wien / Österreich 100% 3.794,96 158.835,16ANDRITZ Pow er & Water GmbH Wien / Österreich 100% 3.653,31 40.173,31
European Mill Service GmbH Graz / Österreich 50% *)
ANDRITZ HYDRO GmbH Wien / Österreich 100% 52.184,62 218.215,36ANDRITZ HYDRO S.A.S. Grenoble / Frankreich 100% 1.840,45 4.614,16ANDRITZ HYDRO Private Limited Bhopal / Indien 100% 5.440,08 17.465,01ANDRITZ Deutschland Beteiligungs GmbH Krefeld / Deutschland 49% 51% 25.616,81 203.779,11
ANDRITZ GmbH Hemer / Deutschland 6,25% 93,75% 19.687,36 60.229,49ANDRITZ Kaiser GmbH Bretten-Gölshausen / Deutschland 100% -1.841,72 326,70Sundw ig GmbH Hemer / Deutschland 75% 7.176,95 50.760,74ANDRITZ Fiedler GmbH Regensburg / Deutschland 100% -1.339,79 3.812,58
ANDRITZ Fiedler Holding S. A. R. L. Scorbé Clairvaux / Frankreich 100% 1.137,17 2.446,51ANDRITZ Separation GmbH Köln / Deutschland 100% 5.031,60 10.242,97
ANDRITZ - Jochman s. r. o. Spišská Nová Ves / Slow akei 90% *)
ANDRITZ Fliessbettsysteme GmbH Ravensburg / Deutschland 100% 1.755,77 7.766,81Lenser Verw altungs GmbH Senden / Deutschland 100% 22,78 288,52
ANDRITZ S.R.L. Cisnadie / Rumänien 100% *)
Lenser Filtration GmbH Senden / Deutschland 100% -2.170,86 9.754,78Lenser Asia Sdn. Bhd. Selangor / Malaysien 100% 370,61 2.072,48
ANDRITZ HYDRO GmbH Ravensburg / Deutschland 100% 9.717,34 29.812,24ANDRITZ Küsters GmbH Krefeld / Deutschland 100% -6.496,99 21.753,10ANDRITZ Kufferath GmbH Düren / Deutschland 100% 166,12 8.074,51AKRE Real Estate GmbH Düren / Deutschland 100% -3,66 3.022,98ANDRITZ Maerz GmbH Düsseldorf / Deutschland 100% 9.854,50 24.477,17ANDRITZ Rollteck GmbH Krefeld / Deutschland 100% -870,37 -845,37
ANDRITZ HYDRO S.L. Madrid / Spanien 100% 1.217,81 6.279,45ANDRITZ HYDRO S.r.l. Vicenza / Italien 100% 3.342,12 10.738,24
ANDRITZ HYDRO Aosta S.r.l. Aosta / Italien 100% *)
ANDRITZ HYDRO AG Kriens / Schw eiz 100% 376,51 8.195,05ANDRITZ HYDRO S.A. de C.V. Morelia / Mexiko 100% 431,68 509,40ANDRITZ HYDRO AS Jevnaker / Norw egen 100% 2.096,68 7.226,61ANDRITZ HYDRO Brasil Ltda. São Paulo / Brasilien 100% 5.083,23 3.747,50ANDRITZ HYDRO Ltd. Sirketi Ankara / Türkei 100% *)
PT. ANDRITZ HYDRO Jakarta / Indonesien 51% 1.227,79 1.919,29ANDRITZ HYDRO S.A. Lima / Peru 100% *)
ANDRITZ HYDRO (Pty) Ltd. Umhlanga / Südafrika 100% *)
ANDRITZ HYDRO Ltda. Bogota / Kolumbien 100% *)
ANDRITZ HYDRO s.r.o. Prag / Tschechische Republik 100% *)
ANDRITZ INDIA PRIVATE LIMITED Faridabad / Indien 100% *)
ANDRITZ HYDRO C.A. Caracas / Venezuela 100% *)
ANDRITZ POWER Sdn. Bhd. Kuala Lumpur / Malaysia 30% *)
ANDRITZ HYDRO Inc. Makati City / Philippinen 100% *)
HGI Holdings Limited Limassol / Zypern 100% *)
AP Anlage-Projektierungs AG Bülach / Schw eiz 100% -535,18 -5.503,55ANDRITZ Separation (India) Private Ltd. Chennai / Indien 100% 364,60 921,06ANDRITZ spol.s.r.o. Hradec Kralove / Tschechische Republik 100% *)
ANDRITZ Denmark A/S Esbjerg / Dänemark 100% -4.013,27 5.004,65 **)
ANDRITZ FEED&BIOFUEL A/S Esbjerg / Dänemark 100%ANDRITZ FEED&BIOFUEL do Brasil Ltda. Porto Alegre / Brasilien 100% *)
ANDRITZ FEED&BIOFUEL s.r.o. Humenné / Slow akei 100% *)
ANDRITZ Chile Ltda. Santiago de Chile / Chile 100% -720,30 1.674,82ANDRITZ (USA) Inc. Rosw ell / Georgia (USA) 100% -4.896,71 73.733,31 **)
ANDRITZ Inc. Rosw ell / Georgia (USA) 100%ANDRITZ Finance Inc. Tualatin / Oregon (USA) 100%
Delta Holding Corporation Tualatin / Oregon (USA) 100%ANDRITZ Separation Inc. Arlington / Texas (USA) 100%ANDRITZ Filter Press Inc. Arlington / Texas (USA) 100%ANDRITZ Automation Inc. Decatur / Georgia (USA) 100%CyberMetrics Inc. Alpharetta / Georgia (USA) 100%Lenser Filtration Inc. Lakew ood / New Jersey (USA) 100%ANDRITZ HYDRO Corp. Charlotte / North Carolina (USA) 100%
ANDRITZ S. A. S. Velizy / Frankreich 100% 5.271,82 23.632,58Andritz Selas S.A.S. Asnières-sur-Seine / Frankreich 100% 1.309,68 2.886,99Lenser Filtration S. A. R. L. Haguenau / Frankreich 100% 2,79 110,98
*) w egen Unw esentlichkeit nicht im Konzernabschluss einbezogen**) konsolidiert
Beteiligungsquote

Andritz AG Graz
16
Sitz in TEURVerbundene Unternehmen direkt indirekt Jahresüberschuss Eigenkapital
Jaybee Eng. (Holdings) Pty. Ltd. Victoria (Australia) 100% -4.140,26 3.625,40 **)
ANDRITZ Pty. Ltd. Victoria (Australia) 100%ANDRITZ Ingeniería S.A. Madrid / Spanien 100% 717,70 1.543,05ANDRITZ Brasil Ltda. Curitiba / Brasilien 100% 14.515,75 62.481,33
ANDRITZ Separation Industria e Comércio de Equipamentos de Filtraçâo Ltda. Pomerode / Brasilien 100% -487,92 9.307,84Sindus Manutençâo e Sistemas Industriais Ltda. Porto Alegre / Brasilien 50% 557,88 2.451,51
Sindus ANDRITZ Uruguay S.A. Rio Negro / Uruguay 50% *)ANDRITZ HYDRO Inepar do Brasil S.A. Campinas - São Paulo / Brasilien 50% 6.304,87 39.450,53
ANDRITZ Pilão Equipamentos Ltda. Vinhedo, São Paulo / Brasilien 100% -4.019,01 -3.566,03ANDRITZ Oy Helsinki / Finnland 100% 5.113,86 74.877,74
Savonlinna Works Oy Savonlinna / Finnland 100% -4.422,09 559,25ANDRITZ HYDRO Inepar Finland Oy Tampere / Finnland 100% 1.522,25 4.281,54
Carbona Oy Helsinki / Finnland 80%ANDRITZ HYDRO Canada Inc. Stoney Creek / Ontario (Kanada) 100% -2.952,12 21.341,19 **)
ANDRITZ HYDRO Canada Ltd./Ltée. Pointe Claire / Quebec (Kanada) 100%ANDRITZ HYDRO Installations Inc. Lachine / Quebec (Kanada) 100%
ANDRITZ Ltd./Ltée. Lachine / Quebec (Kanada) 100%ANDRITZ Paper Machinery Ltd. Lachine / Quebec (Kanada) 100%ANDRITZ Automation Ltd. Richmond / British Columbia (Kanada) 100%IDEAS Simulation & Control Ltd. Richmond / British Columbia (Kanada) 100%
ANDRITZ AB Örnsköldsvik / Schw eden 100% 2.511,64 9.791,10ANDRITZ Lynson AB Vallentuna / Schw eden 100% 220,39 365,10ANDRITZ Waplans AB Nälden / Schw eden 100% 759,73 2.781,36
ANDRITZ HYDRO Inepar Sw eden AB Kristinehamn / Schw eden 100% 69,40 868,08ANDRITZ Ltd. Staffordshire / Großbritannien 100% -119,73 3.219,85
ANDRITZ Selas UK Ltd. Derbyshire / Großbritannien 100% 76,12 458,55ANDRITZ-Kenflo Foshan Pump Co. Ltd. Foshan / China 60% 448,73 7.792,98ANDRITZ Technologies Ltd. Foshan / China 100% 8.137,98 44.534,27ANDRITZ - Wolfensberger Special Alloy Foundry Co., Ltd. Foshan / China 65% -2.386,81 -2.798,54ANDRITZ Technologies H.K. Ltd. Hong Kong / China 100% *)
Kufferath Forming Technology China (Zhejiang) Co. Ltd. Zhejiang / China 100% *)
ANDRITZ Thermtec Holding B.V. Rotterdam / Niederlande 100% 2.295,84 4.413,84 **)
ANDRITZ Thermtec B.V. Rotterdam / Niederlande 100%ANDRITZ Technologies Private Ltd. Bangalore / Indien 100% 484,89 1.059,05ANDRITZ FEED&BIOFUEL Ltd. Hull / Großbritannien 100% 334,60 2.098,12ANDRITZ FEED&BIOFUEL B.V. Geldrop / Niederlande 100% 2.035,41 13.984,67
ANDRITZ B. V. Den Helder / Niederlande 100% 281,00 1.252,50ANDRITZ 3SYS AG Wohlen / Schw eiz 100% -1.652,98 -4.636,43ANDRITZ Singapore Pte. Ltd. Singapur / Singapur 100% 2.191,63 4.401,72ANDRITZ (Thailand) Ltd. Bangkok / Thailand 100% 10,67 128,12ANDRITZ Uruguay S. A. Rio Negro / Uruguay 100% 1.386,91 2.127,48ANDRITZ Industrias S. A. Rio Negro / Uruguay 100% *)
ANDRITZ Pulp Technologies Punta Pereira S.A. Montevideo/ Uruguay 100% *)
ANDRITZ KK Tokio / Japan 100% 228,44 3.854,37ANDRITZ (Pty) Ltd. Umhlanga / Südafrika 100% 434,64 1.633,89PT ANDRITZ Jakarta / Indonesien 100% 69,68 4,74ANDRITZ Australia Pty. Ltd. Victoria (Australia) 100% *)
LLC ANDRITZ St. Petersburg / Russland 100% -189,88 -231,14OOO ANDRITZ Metals Moskau / Russland 100% *)
ANDRITZ Kufferath s.r.o. Levice / Slow akei 100% 375,02 6.736,38ANDRITZ Kft. Tiszakécske / Ungarn 100% 3.472,84 22.551,34
Sonstige Unternehmen
ASH DEC Umw elt AG Wien / Österreich 2,87%CEST Kompetenzzentrum für elektrochemische Oberflächentechnologie GmWiener Neustadt / Österreich 2,38%Warkaus Works Oy Varkaus / Finnland 50%Enmas ANDRITZ Private Ltd. Chennai / Indien 40%The Hydro Equipment Association Limited London / Großbritannien 33,3%ANDRITZ R&M Service S.R.L. Bukarest / Rumänien 25%Motter Printing Equipment Ltd. Kriens / Schw eiz 19,6%Orissa Pow er Consortium Ltd. Hyderabad / Indien 19%Birecik Baraj ve Hidroelektrik Birecik / Türkei 3,7%Venture Capital Zentralschw eiz AG Luzern / Schw eiz 1,3%DC Hidro Enerji Üretim A.Ş Istanbul / Türkei 1%Eriç Enerji Üretim ve Ticaret A.Ş. Istanbul / Türkei 1%Kalehan Enerji Üretim ve Ticaret A.Ş. Ankara / Türkei 0,0003%
*) w egen Unw esentlichkeit nicht im Konzernabschluss einbezogen**) konsolidiert
Beteiligungsquote
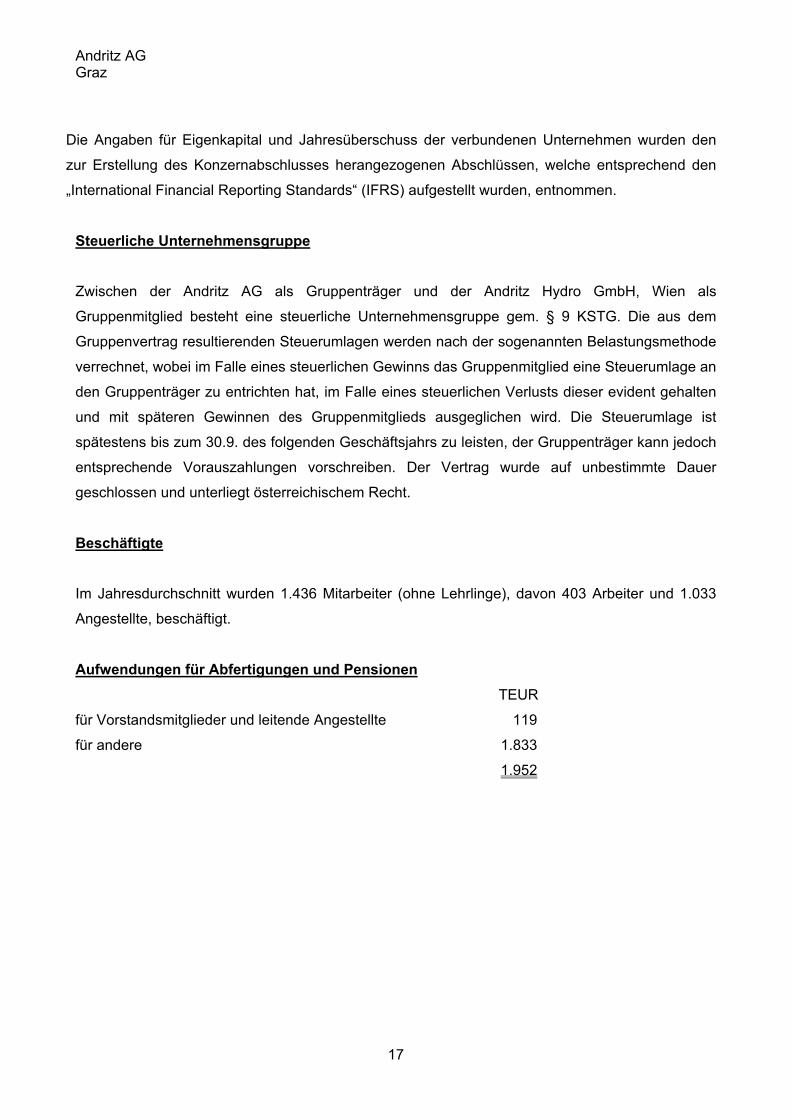
Andritz AG Graz
17
Die Angaben für Eigenkapital und Jahresüberschuss der verbundenen Unternehmen wurden den
zur Erstellung des Konzernabschlusses herangezogenen Abschlüssen, welche entsprechend den
„International Financial Reporting Standards“ (IFRS) aufgestellt wurden, entnommen.
Steuerliche Unternehmensgruppe
Zwischen der Andritz AG als Gruppenträger und der Andritz Hydro GmbH, Wien als
Gruppenmitglied besteht eine steuerliche Unternehmensgruppe gem. § 9 KSTG. Die aus dem
Gruppenvertrag resultierenden Steuerumlagen werden nach der sogenannten Belastungsmethode
verrechnet, wobei im Falle eines steuerlichen Gewinns das Gruppenmitglied eine Steuerumlage an
den Gruppenträger zu entrichten hat, im Falle eines steuerlichen Verlusts dieser evident gehalten
und mit späteren Gewinnen des Gruppenmitglieds ausgeglichen wird. Die Steuerumlage ist
spätestens bis zum 30.9. des folgenden Geschäftsjahrs zu leisten, der Gruppenträger kann jedoch
entsprechende Vorauszahlungen vorschreiben. Der Vertrag wurde auf unbestimmte Dauer
geschlossen und unterliegt österreichischem Recht.
Beschäftigte
Im Jahresdurchschnitt wurden 1.436 Mitarbeiter (ohne Lehrlinge), davon 403 Arbeiter und 1.033
Angestellte, beschäftigt.
Aufwendungen für Abfertigungen und Pensionen TEUR
für Vorstandsmitglieder und leitende Angestellte 119
für andere 1.833
1.952

Andritz AG Graz
18
Aktienbeteiligungsprogramm für Führungskräfte Sämtliche Angaben wurden entsprechend dem im Jahr 2007 durchgeführten Aktiensplit (1 : 4) angepasst.
Optionsprogramm 1:
Die 99. ordentliche Hauptversammlung vom 29. März 2006 hat ein Aktienoptionsprogramm für
leitende Angestellte und Mitglieder des Vorstands beschlossen.
Die Anzahl der je berechtigter Führungskraft gewährten Optionen beträgt je nach
Verantwortungsbereich 6.000, 10.000 oder 20.000, für Mitglieder des Vorstands 40.000 und für
den Vorsitzenden des Vorstands 50.000. Die Optionen sollen aus von der Gesellschaft rückerwor-
benen eigenen Aktien bedient werden.
Eine Aktienoption berechtigt zum Bezug einer Aktie. Um eine Aktienoption ausüben zu können,
muss der Berechtigte vom 1.5.2006 bis vor einem jeden Ausübungszeitpunkt dauernd in einem
aktiven Arbeitsverhältnis zur Gesellschaft oder einer zum Andritz-Konzern gehörenden
Gesellschaft gestanden haben. Weitere Voraussetzung ist ein Eigeninvestment in Andritz-Aktien
von zumindest 20.000 EUR für leitende Angestellte und 40.000 EUR für Mitglieder des Vorstands.
Der Ausübungspreis für die Aktienoptionen ist der ungewichtete Durchschnitt der Börsenschluss-
kurse der Andritz-Aktie während der vier auf die 99. ordentliche Hauptversammlung vom 29. März
2006 folgenden Kalenderwochen und beträgt 31,67 EUR.
Die Optionen können in der Zeit vom 1. Mai 2008 bis 30. April 2010 (= Ausübungszeitraum)
ausgeübt werden und nur dann, wenn
• der ungewichtete Schlusskurs der Andritz-Aktie im Durchschnitt von zwanzig aufeinander-
folgenden Handelstagen im Zeitraum von 1. Mai 2008 bis 30. April 2009 mindestens 15% über
dem Ausübungspreis liegt und
• der Gewinn je Aktie (bezogen auf die Gesamtzahl der gelisteten Aktien) des Geschäftsjahrs
2007 oder der Gewinn je Aktie des Geschäftsjahrs 2008 (bezogen auf die Gesamtzahl der
gelisteten Aktien) mindestens 15% über dem Gewinn je Aktie (bezogen auf die Gesamtzahl der
gelisteten Aktien) des Geschäftsjahrs 2005 liegt
oder wenn
• der ungewichtete Schlusskurs der Andritz-Aktie im Durchschnitt von zwanzig aufeinander-
folgenden Handelstagen im Zeitraum 1. Mai 2009 bis 30. April 2010 mindestens 20% über dem
Ausübungspreis liegt und

Andritz AG Graz
19
• der Gewinn je Aktie (bezogen auf die Gesamtzahl der gelisteten Aktien) des Geschäftsjahrs
2008 oder der Gewinn je Aktie (bezogen auf die Gesamtzahl der gelisteten Aktien) des
Geschäftsjahrs 2009 mindestens 20 % über dem Gewinn je Aktie (bezogen auf die Gesamtzahl
der gelisteten Aktien) des Geschäftsjahrs 2005 liegt.
Im Falle der Erfüllung der Ausübungsbedingungen können 50% der Optionen sofort, 25% der
Optionen nach drei Monaten und die restlichen 25% nach weiteren drei Monaten bezogen werden.
Aktienoptionen können nur durch schriftliche Erklärung an die Gesellschaft ausgeübt werden. Die
Aktienoptionen sind nicht übertragbar. Die in Ausübung der Aktienoptionen bezogenen Aktien
unterliegen keiner Behaltefrist.
Optionsprogramm 2:
Die 101. ordentliche Hauptversammlung vom 27. März 2008 hat ein Aktienoptionsprogramm für
leitende Angestellte und Mitglieder des Vorstands beschlossen.
Die Anzahl der je berechtigter Führungskraft gewährten Optionen beträgt je nach
Verantwortungsbereich 6.000, 10.000 oder 20.000, für Mitglieder des Vorstands 40.000 und für
den Vorsitzenden des Vorstands 50.000. Die Optionen sollen aus von der Gesellschaft rückerwor-
benen eigenen Aktien bedient werden.
Eine Aktienoption berechtigt zum Bezug einer Aktie. Um eine Aktienoption ausüben zu können,
muss der Berechtigte vom 1.5.2008 bis vor einem jeden Ausübungszeitpunkt dauernd in einem
aktiven Arbeitsverhältnis zur Gesellschaft oder einer zum Andritz-Konzern gehörenden
Gesellschaft gestanden haben. Weitere Voraussetzung ist ein Eigeninvestment in Andritz-Aktien
von zumindest 20.000 EUR für leitende Angestellte und 40.000 EUR für Mitglieder des Vorstands.
Der Ausübungspreis für die Aktienoptionen ist der ungewichtete Durchschnitt der Börsenschluss-
kurse der Andritz-Aktie während der vier auf die 101. ordentliche Hauptversammlung vom
27. März 2008 folgenden Kalenderwochen und beträgt 35,44 EUR.
Die Optionen können in der Zeit vom 1. Mai 2010 bis 30. April 2012 (= Ausübungszeitraum)
ausgeübt werden und nur dann, wenn
• der ungewichtete Schlusskurs der Andritz-Aktie im Durchschnitt von zwanzig aufeinander-
folgenden Handelstagen im Zeitraum von 1. Mai 2010 bis 30. April 2011 mindestens 15% über
dem Ausübungspreis liegt und

Andritz AG Graz
20
• der Gewinn je Aktie (bezogen auf die Gesamtzahl der gelisteten Aktien) des Geschäftsjahrs
2009 oder der Gewinn je Aktie des Geschäftsjahrs 2010 (bezogen auf die Gesamtzahl der
gelisteten Aktien) mindestens 15% über dem Gewinn je Aktie (bezogen auf die Gesamtzahl der
gelisteten Aktien) des Geschäftsjahrs 2007 liegt
oder wenn
• der ungewichtete Schlusskurs der Andritz-Aktie im Durchschnitt von zwanzig aufeinander-
folgenden Handelstagen im Zeitraum 1. Mai 2011 bis 30. April 2012 mindestens 20% über dem
Ausübungspreis liegt und
• der Gewinn je Aktie (bezogen auf die Gesamtzahl der gelisteten Aktien) des Geschäftsjahrs
2010 oder der Gewinn je Aktie (bezogen auf die Gesamtzahl der gelisteten Aktien) des
Geschäftsjahrs 2011 mindestens 20% über dem Gewinn je Aktie (bezogen auf die Gesamtzahl
der gelisteten Aktien) des Geschäftsjahrs 2007 liegt.
Im Falle der Erfüllung der Ausübungsbedingungen können 50% der Optionen sofort, 25% der
Optionen nach drei Monaten und die restlichen 25% nach weiteren drei Monaten bezogen werden.
Aktienoptionen können nur durch schriftliche Erklärung an die Gesellschaft ausgeübt werden. Die
Aktienoptionen sind nicht übertragbar. Die in Ausübung der Aktienoptionen bezogenen Aktien
unterliegen keiner Behaltefrist.

Andritz AG Graz
21
Optionsprogramm 2
im Jahr 2009 im Jahr 2010 eingeräumteausgenützte ausnützbare Optionen
Optionen Optionen per 31.12.2009per 31.12.2009
Vorstand Wolfgang Leitner 50.000 0 50.000 Franz Hofmann 0 40.000 40.000 Karl Hornhofer 10.000 0 40.000 Humbert Köfler 10.000 0 40.000 Friedrich Papst 40.000 0 40.000
Leitende Angestellte 200.000 228.000 856.000
GESAMT 310.000 268.000 1.066.000
Ausübungspreis je Aktie in EUR 31,67 31,67 35,44Wert Optionen gesamt bei Ausübung 31.12.2009 31.12.2009in EUR 1.916.796 2.371.800 5.415.280
Optionsprogramm 1

Andritz AG Graz
22
Derivative Finanzinstrumente
Zum Bilanzstichtag bestanden folgende Devisentermingeschäfte (in TEUR):
Umfang Zeitwert
US-Dollar: 50.305 1.244
Pfund Sterling: 10.825 -172
Andere Währungen 2.462 -26
Summe 63.592 1.046
Der beizulegende Zeitwert wird auf Basis der Terminkurse zum Bilanzstichtag durch Abzinsung
des ermittelten Endwerts über die Restlaufzeit errechnet.
Die beizulegenden Zeitwerte für die Zinssicherung der Anleihen in Form von Zinsswaps betragen
zum 31.12.2009 21.553 TEUR (Vorjahr: 19.023 TEUR) und repräsentieren die Marktwerte zum
Bilanzstichtag.
Weiters bestehen zum 31.12.2009 zwei Zinsswaps zu Beteiligungsfinanzierungen (Umfang:
19.075 TEUR). Die beizulegenden Zeitwerte für die Zinssicherungen betragen zum 31.12.2009
726 TEUR (Vorjahr: 420 TEUR) und repräsentieren die Marktwerte zum Bilanzstichtag.
Drohende Verluste aus derivativen Finanzinstrumenten werden in der Bilanz nicht passiviert, da
diese mit bilanzierten Aktiv- bzw. Passivposten eine geschlossene Position bilden.
Nahestehende Unternehmen und Personen
Es bestehen keine wesentlichen Geschäftsbeziehungen mit nahestehenden Unternehmen und
Personen, die unter marktunüblichen Bedingungen abgeschlossen wurden.

Andritz AG Graz
23
Vorstand und Aufsichtsrat
Die Vorstandsvergütungen betrugen:
2009 2008
Kurzfristige Leistungen 6.364 8.374Leistungen nach Beendigung des Arbeitsverhältnisses 544 1.581Aktienbasierte Vergütungen 974 812
7.882 10.767
in TEUR
Der Gegenwert der aktienbasierten Vergütungen wurde nach IFRS ermittelt.
Von verbundenen Unternehmen wurden keine Bezüge ausbezahlt. An ehemalige
Vorstandsmitglieder und deren Hinterbliebene wurden 330.169 EUR (Vorjahr: 328.388 EUR)
ausbezahlt.
Die Mitglieder des Aufsichtsrats erhielten Vergütungen von 125.000 EUR (Vorjahr: 125.000 EUR).
Aufsichtsrat:
Gewählte Mitglieder:
Kurt Stiassny
Vorsitzender
Hellwig Torggler
Stellvertreter des Vorsitzenden
Peter Mitterbauer
Christian Nowotny
Fritz Oberlerchner
Klaus Ritter

Andritz AG Graz
24
Delegierte Mitglieder:
Andreas Martiner
Martha Unger
Brigitta Wasserbauer
Vorstand: Wolfgang Leitner
Vorsitzender
Franz Hofmann
Karl Hornhofer
Humbert Köfler
Friedrich Papst
Graz, am 25. Februar 2010 Der Vorstand Wolfgang Leitner Franz Hofmann Karl Hornhofer Humbert Köfler Friedrich Papst

Andritz AG Graz
25
Bestätigungsvermerk Wir haben den beigefügten Jahresabschluss der Andritz AG, Graz, für das Geschäftsjahr vom 1. Jänner 2009 bis zum 31. Dezember 2009 unter Einbeziehung der Buchführung geprüft. Dieser Jahresabschluss umfasst die Bilanz zum 31. Dezember 2009, die Gewinn- und Verlustrechnung für das am 31. Dezember 2009 endende Geschäftsjahr sowie den Anhang.
Verantwortung der gesetzlichen Vertreter für den Jahresabschluss und für die Buchführung
Die gesetzlichen Vertreter der Gesellschaft sind für die Buchführung sowie für die Aufstellung und den Inhalt des Jahresabschlusses verantwortlich, der ein möglichst getreues Bild der Vermögens-, Finanz- und Ertragslage der Gesellschaft in Übereinstimmung mit den österreichischen unternehmensrechtlichen Vorschriften vermittelt. Diese Verantwortung beinhaltet: Gestaltung, Umsetzung und Aufrechterhaltung eines internen Kontrollsystems, soweit dieses für die Aufstellung des Jahresabschlusses und die Vermittlung eines möglichst getreuen Bildes der Vermögens-, Finanz- und Ertragslage der Gesellschaft von Bedeutung ist, damit dieser frei von wesentlichen Fehldarstellungen ist, sei es auf Grund von beabsichtigten oder unbeabsichtigten Fehlern; die Auswahl und Anwendung geeigneter Bilanzierungs- und Bewertungsmethoden; die Vornahme von Schätzungen, die unter Berücksichtigung der gegebenen Rahmenbedingungen angemessen erscheinen.
Verantwortung des Abschlussprüfers und Beschreibung von Art und Umfang der gesetzlichen Abschlussprüfung
Unsere Verantwortung besteht in der Abgabe eines Prüfungsurteils zu diesem Jahresabschluss auf der Grundlage unserer Prüfung. Wir haben unsere Prüfung unter Beachtung der in Österreich geltenden gesetzlichen Vorschriften und Grundsätze ordnungsgemäßer Abschlussprüfung durchgeführt. Diese Grundsätze erfordern, dass wir die Standesregeln einhalten und die Prüfung so planen und durchführen, dass wir uns mit hinreichender Sicherheit ein Urteil darüber bilden können, ob der Jahresabschluss frei von wesentlichen Fehldarstellungen ist.
Eine Prüfung beinhaltet die Durchführung von Prüfungshandlungen zur Erlangung von Prüfungsnachweisen hinsichtlich der Beträge und sonstigen Angaben im Jahresabschluss. Die Auswahl der Prüfungshandlungen liegt im pflichtgemäßen Ermessen des Abschlussprüfers unter Berücksichtigung seiner Einschätzung des Risikos eines Auftretens wesentlicher Fehldar-stellungen, sei es auf Grund von beabsichtigten oder unbeabsichtigten Fehlern.

Andritz AG Graz
26
Bei der Vornahme dieser Risikoeinschätzung berücksichtigt der Abschlussprüfer das interne Kontrollsystem, soweit es für die Aufstellung des Jahresabschlusses und die Vermittlung eines möglichst getreuen Bildes der Vermögens-, Finanz- und Ertragslage der Gesellschaft von Bedeutung ist, um unter Berücksichtigung der Rahmenbedingungen geeignete Prüfungs-handlungen festzulegen, nicht jedoch um ein Prüfungsurteil über die Wirksamkeit der internen Kontrollen der Gesellschaft abzugeben. Die Prüfung umfasst ferner die Beurteilung der Angemessenheit der angewandten Bilanzierungs- und Bewertungsmethoden und der von den gesetzlichen Vertretern vorgenommenen wesentlichen Schätzungen sowie eine Würdigung der Gesamtaussage des Jahresabschlusses.
Wir sind der Auffassung, dass wir ausreichende und geeignete Prüfungsnachweise erlangt haben, sodass unsere Prüfung eine hinreichend sichere Grundlage für unser Prüfungsurteil darstellt.
Prüfungsurteil
Unsere Prüfung hat zu keinen Einwendungen geführt. Auf Grund der bei der Prüfung gewonnenen Erkenntnisse entspricht der Jahresabschluss nach unserer Beurteilung den gesetzlichen Vorschriften und vermittelt ein möglichst getreues Bild der Vermögens- und Finanzlage der Andritz AG zum 31. Dezember 2009 sowie der Ertragslage der Gesellschaft für das Geschäftsjahr vom 1. Jänner 2009 bis zum 31. Dezember 2009 in Übereinstimmung mit den österreichischen Grundsätzen ordnungsmäßiger Buchführung.
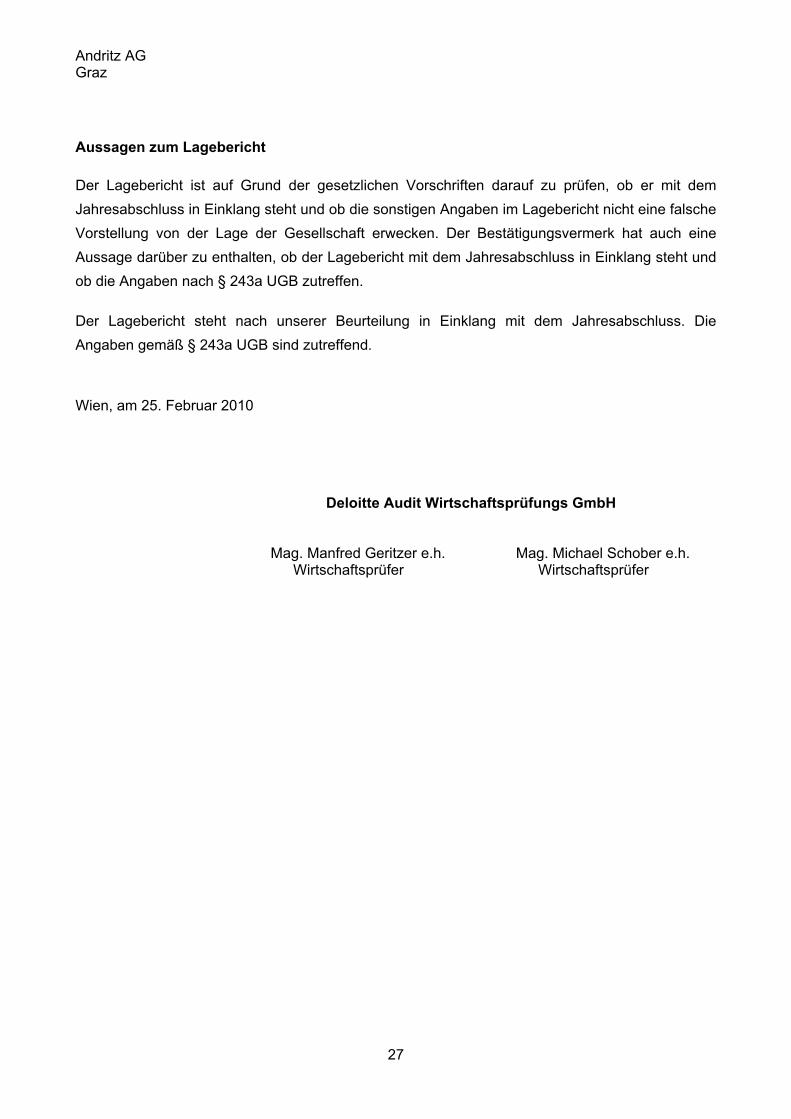
Andritz AG Graz
27
Aussagen zum Lagebericht
Der Lagebericht ist auf Grund der gesetzlichen Vorschriften darauf zu prüfen, ob er mit dem Jahresabschluss in Einklang steht und ob die sonstigen Angaben im Lagebericht nicht eine falsche Vorstellung von der Lage der Gesellschaft erwecken. Der Bestätigungsvermerk hat auch eine Aussage darüber zu enthalten, ob der Lagebericht mit dem Jahresabschluss in Einklang steht und ob die Angaben nach § 243a UGB zutreffen.
Der Lagebericht steht nach unserer Beurteilung in Einklang mit dem Jahresabschluss. Die Angaben gemäß § 243a UGB sind zutreffend.
Wien, am 25. Februar 2010
Deloitte Audit Wirtschaftsprüfungs GmbH
Mag. Manfred Geritzer e.h. Mag. Michael Schober e.h. Wirtschaftsprüfer Wirtschaftsprüfer