ANDRITZ CMD 2017 · Paper/Dryer . Recovery Area . ... 450 . 2015 : Customer R . 4,700 : 2015 . Pulp...
21
Daniel Schuck, 12 th September 2017, Graz www.andritz.com ANDRITZ Capital Market Day 2017 OPP (Optimization of Process Performance)
Transcript of ANDRITZ CMD 2017 · Paper/Dryer . Recovery Area . ... 450 . 2015 : Customer R . 4,700 : 2015 . Pulp...

Daniel Schuck, 12th September 2017, Graz
www.andritz.com
ANDRITZ Capital Market Day 2017 OPP (Optimization of Process Performance)

OPP Goals
Increase process stability
Reduce energy or chemical cost
Debottleneck production, increasing total production
Increase mill availability
Fast response to move from area to area, or production to cost
Keep existing savings in the long term
Support to operation: in diagnostics, start-up, mill-balance
OPP - Optimization of Process Performance
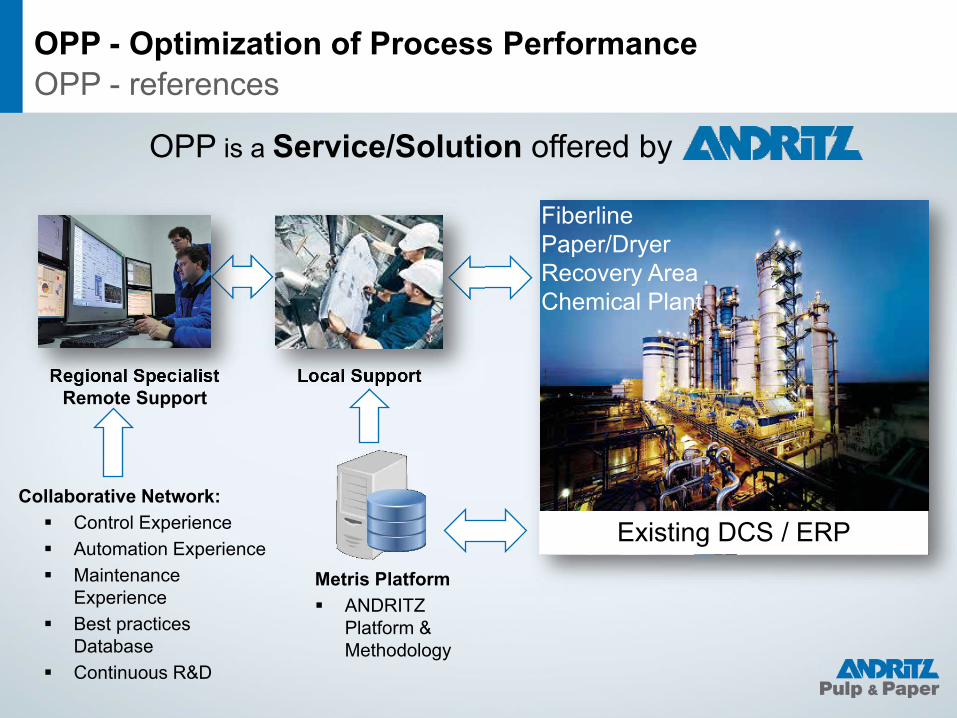
OPP is a Service/Solution offered by
OPP - Optimization of Process Performance OPP - references
Local Support Regional Specialist Remote Support
Metris Platform ANDRITZ
Platform & Methodology
Collaborative Network: Control Experience Automation Experience Maintenance
Experience Best practices
Database Continuous R&D
Existing DCS / ERP
Fiberline Paper/Dryer Recovery Area Chemical Plant

OPP - Optimization of Process Performance OPP - references
Customer 1000 ton/year Start-up
Customer A 2,330 2007 Customer B 1,758 2010 Customer C 485 2010 Customer D 1,100 2011 Customer E 1,300 2011 Customer F 1,125 2011 Customer G 1,490 2011 Customer H 455 2012 Customer I 780 2013 Customer J 1,100 2013 Customer K 420 2013 Customer L 460 2014 Customer M 610 2014 Customer N 450 2014 Customer O 1,500 2014 Customer P 500 2015 Customer Q 450 2015 Customer R 4,700 2015
Pulp Paper Pulp/Paper Steel
Customer 1000 ton/year Start-up
Customer S 1,950 2016 Customer T 400 2016 Customer U 700 2016 Customer V ----- 2016 Customer W 1,700 2016 ANDRITZ P&P (Capital) ----- 2016 ANDRITZ P&P (Services) ----- 2016 ANDRITZ HYDRO ----- 2016 ANDRITZ METALS ----- 2016 ANDRITZ SEPARATION ----- 2016 Customer X 730 2017 Customer Y 950 2017 Customer Z 2017 Customer AA 2017 Customer AB 2017 Customer AC 2017 Customer AD 2017
+5 by end of 2017 +116 by end of 2020

Typical Savings
More than 150 million euros savings without capital investments

How OPP reaches process performance
Production target due to instability
Pro
duct
ion
Time
Production Capacity
New production level
Variability reduction
Specification
Varia
ble
Time
SP due to variability
New set point
$$$
Chemical or energy savings
Production increase

How OPP reaches process performance
0 50 100 150 200 250 300
Prod
uctio
n / D
ay
350
Maximum Production Level / Day
Average Production Level / Day
Reduce process variability Debottlenecking
Fast start-up Mill balance
Avoid shutdown using automatic slowdown system
Mill balance
Production stability
Equipment failure prediction
<90% (opportunity to improved) 90-91% (acceptable) 91-92% (target) >92% (excellent)

BUSINESS INTELLIGENCE
Management and technical KPIs, dashboards, balanced scorecard, project management tool, etc LEVEL 4: MANAGERS
LEVEL 3: ENGINEERS (OPERATIONS AND
MAINTENANCE)
LEVEL 2: OPERATORS AND SHIFT SUPERVISOR /
CORDINATOR
LEVEL 1: FIELD OPERATORS AND
MAINTENANCE TECHNICIAN
Data mining, statistics, power spectral density, KPIs
OPP, SMS, e-mail, follow-up
Data historian, process displays
Tools for Log book, meetings, risk assessment, work permit
Start-up sequences, diagnostic systems, root cause analysis, process specification check
Advanced Process Controls, Decision support, adaptative setpoints, mill balance
Measurement validation, process diagnostics
Control loop tuning and assessment, dead time compensators, feedforward, etc.
Real time data, diagnostic, procedures, remote support
Risk-based maintenance, predictive maintenance, condition Monitoring, Valves, motors, analyzers, interlock bypass, etc.
DATA ANALYTICS
NOTIFIER
PIMS
DAILY MANAGEMENT
OPERATOR ASSISTANCE
SMART CONTROLS
SOFT SENSORS
REGULATORY CONTROL
AUGMENTED REALITY
ASSET MANAGEMENT
Metris Platform Strategy & Organization

BUSINESS INTELLIGENCE
Management and technical KPIs, dashboards, balanced scorecard, project management tool, etc
Data mining, statistics, power spectral density, KPIs
OPP, SMS, e-mail, follow-up
Data historian, process displays
Tools for Log book, meetings, risk assessment, work permit
Start-up sequences, diagnostic systems, root cause analysis, process specification check
Advanced Process Controls, Decision support, adaptative setpoints, mill balance
Measurement validation, process diagnostics
Control loop tuning and assessment, dead time compensators, feedforward, etc.
Real time data, diagnostic, procedures, remote support
Risk Based Maintenance, predictive maintenance, condition Monitoring, Valves, motors, analyzers, interlock bypass, etc.
DATA ANALYTICS
NOTIFIER
PIMS
DAILY MANAGEMENT
OPERATOR ASSISTANCE
SMART CONTROLS
SOFT SENSORS
REGULATORY CONTROL
AUGMENTED REALITY
ASSET MANAGEMENT
Metris Platform Strategy & Organization
CUSTOMERS STRATEGIC
DRIVERS
PRO
DU
CTI
ON
RA
W M
ATE
RIA
L C
OST
ENER
GY
CO
ST
MA
INT
CO
ST
QU
ALI
TY
SAFE
TY
ENVI
RO
NM
EN.
PRO
DU
CTI
VITY

Strategy & Organization Metris OPP Platform
MANAGEMENT OPTIMIZATION
PROCESS OPTIMIZATION
ASSET OPTIMIZATION
1
2
3
4
5
1
2
3
4
1
2
Business Intelligence Quality Management
Augmented Reality
Knowledge Management
Data Analytics
Process & Control Engineering
Production Management Mill Balance
Smart Controls
Systems
Devices
AUTONOMOUS OPERATIONS

Autonomous Operations Decision levels
Maximize company results Market x Budget analysis and definition of production strategy
Budget control Speed, Economy, Balanced (It defines how mill balance should work)
Mill balance control Start-up/Stop, Speed-up/Slow-down, Recipes (35 controls)
Control of complex variables Kappa, Brightness, Moisture, Dry-solids, etc. (75-100 controls)
Control of simple variables and avoid interlocks Flow, Temperature, etc. (1000 controls + 2000+ interlocks)
Equipment (some assets have their own controls) Big assets, instruments, valves, motors, etc. (15,000+ devices)
MARKET STRATEGY
PRODUCTION STRATEGY
PRODUCTION & COST MANAGEMENT
SMART CONTROLS
REGULATORY CONTROLS & SAFETY
RELIABILITY MILISECONDS
0.1 -1 SECONDS
3 -300 SECONDS
MINUTES TO HOURS
DAILY
MONTHLY

Autonomous Operations How to achieve it
Customer need How to improve it?
Equipment must be reliable Prediction of failure and
automatic notification based on on-line data
Risk-based Maintenance (RBM)
algorithm
Prediction of failure and automatic notification based on inpections.
AR (Augmented Reality) can help.
Instruments
Motors
Control Valves
On-off Valves
Variable Frequency Drives
Smart Sensors
Pumps
Soft Sensors

Autonomous Operations How to achieve it
Customer need How to improve it?
Basic loops must work at least 95% in auto mode, with minimum IAE (Integral of Absolute Error)
Automatic diagnostics of instruments and valves
Automatic diagnostics of control loop performance
Control loop monitoring and tuning

Autonomous Operations How to achieve it
Customer need How to improve it?
Interlocks must be avoided Automatic slow-down
system
Eliminate not needed
interlocks
Delay interlocks when possible
Review interlock
limits
“Hacking” operator actions and make it
automatically

Autonomous Operations How to achieve it
Customer need How to improve it?
Key process variables must be controled inside specifications
Sophisticated control algorithms must be developed
and updated continuously
Specifications limits must be reviewed based on best
operations days
Prediction of process problems and automatic
notification
Prediction of variables KPIs
Advanced Process Control
Notifications
OEE

Autonomous Operations How to achieve it
Customer need How to improve it? Production rate and
chemical/energy consumption must work must be always
optimized
Sophisticated control algorithms must be
developed and updated continuously
Benchmark with best productions days and suggest possible
changes in the model automatically
Create a footprint of key equipment

Autonomous Operations How to achieve it
Customer need How to improve it?
How to deal with changes in raw material
Process model and recipes must be created for every scenario to make the process at its optimal level

Autonomous Operations How to achieve it
Customer need How to improve it?
How to deal when something goes wrong, like an instrument failure
Switch off part of the algorithm and give instructions in how to proceed
Start-up sequence to start the process quickly and in a standardized way
Prediction of variables

Autonomous Operations How to achieve it
Customer need How to improve it?
How to reduce the time to repair Show contextual information Have a knowledge database Team of experts to support the mill

Autonomous Operations Results
KPI Baseline Goal Jan/17 Feb/17 Mar/17 Apr/17 May/17 Jun/17
Operational Stability
(average/ MSR) hour base
91% 94% 90.3% 94.1% 93.7% 90.5% 93.3% 95.5
Variable Costs (Consumption + Energy)
0% -10% -6,2% -10,9% -10.5% -6.5% -9.7% -11%
OPP controls ON
(% of Time of) 0% 90% 65,1% 90% 95% 85% 96% 97%
Production Records Before Q1/2017 Q2/2017 Q3/2017
Daily 5420 - 5508 (+1.6 %)
Monthly average 4988 - 5045
(+1.1 %) 5105
(+2.3 %)
Quarter average 4694 4814
(+2.5%) 4872
(+3.8 %)
Installation and tuning: Sep-Dec/16