Andrew S. Persichetti HHS Public Access Geoffrey K ...
17
Value is in the eye of the beholder: Early visual cortex codes monetary value of objects during a diverted attention task Andrew S. Persichetti 1 , Geoffrey K. Aguirre 2 , and Sharon L. Thompson-Schill 1 1 Department of Psychology, University of Pennsylvania, Philadelphia, Pennsylvania 19104 2 Department of Neurology, University of Pennsylvania, Philadelphia, Pennsylvania 19104 Abstract A central concern in the study of learning and decision-making is the identification of neural signals associated with the values of choice alternatives. An important factor in understanding the neural correlates of value is the representation of the object itself, separate from the act of choosing. Is it the case that the representation of an object within visual areas will change if it is associated with a particular value? We used fMRI adaptation to measure the neural similarity of a set of novel objects before and after subjects learned to associate monetary values with the objects. We used a range of both positive and negative values to allow us to distinguish effects of behavioral salience (i.e., large versus small values) from effects of valence (i.e., positive versus negative values). During the scanning session, subjects made a perceptual judgment unrelated to value. Crucially, the similarity of the visual features of any pair of objects did not predict the similarity of their value, so we could distinguish adaptation effects due to each dimension of similarity. Within early visual areas we found that value similarity modulated the neural response to the objects following training. These results show that an abstract dimension, in this case monetary value, modulates neural response to an object in visual areas of the brain even when attention is diverted. INTRODUCTION The neural representation of a visual stimulus must code many dimensions, and so the similarity space of a set of objects is multi-dimensional, even in a single brain region. For example, the similarity of the neural responses in V1 reflects both stimulus orientation and spatial frequency (Mazer et al., 2002), and the similarity of neural codes in V4 reflects both stimulus color and shape (Roe et al., 2012). The voxel-level BOLD response can reflect multiple stimulus dimensions that are coded, at the neural level, either independently or conjointly (Drucker et al., 2009). For these basic visual dimensions and beyond, it is clear that neural responses early in the visual pathway are shaped by learning, both of categorical boundaries along visual stimulus dimensions (Folstein et al., 2012) and of abstract information about objects (e.g., biological Corresponding author and address (including email): Andrew S. Persichetti, Emory University, Department of Psychology, 36 Eagle Row, Room 410, Atlanta, GA 30322, [email protected], P: 404-727-8172. The authors declare no competing financial interests. HHS Public Access Author manuscript J Cogn Neurosci. Author manuscript; available in PMC 2015 May 01. Published in final edited form as: J Cogn Neurosci. 2015 May ; 27(5): 893–901. doi:10.1162/jocn_a_00760. Author Manuscript Author Manuscript Author Manuscript Author Manuscript
Transcript of Andrew S. Persichetti HHS Public Access Geoffrey K ...

Value is in the eye of the beholder: Early visual cortex codes monetary value of objects during a diverted attention task
Andrew S. Persichetti1, Geoffrey K. Aguirre2, and Sharon L. Thompson-Schill1
1Department of Psychology, University of Pennsylvania, Philadelphia, Pennsylvania 19104
2Department of Neurology, University of Pennsylvania, Philadelphia, Pennsylvania 19104
Abstract
A central concern in the study of learning and decision-making is the identification of neural
signals associated with the values of choice alternatives. An important factor in understanding the
neural correlates of value is the representation of the object itself, separate from the act of
choosing. Is it the case that the representation of an object within visual areas will change if it is
associated with a particular value? We used fMRI adaptation to measure the neural similarity of a
set of novel objects before and after subjects learned to associate monetary values with the objects.
We used a range of both positive and negative values to allow us to distinguish effects of
behavioral salience (i.e., large versus small values) from effects of valence (i.e., positive versus
negative values). During the scanning session, subjects made a perceptual judgment unrelated to
value. Crucially, the similarity of the visual features of any pair of objects did not predict the
similarity of their value, so we could distinguish adaptation effects due to each dimension of
similarity. Within early visual areas we found that value similarity modulated the neural response
to the objects following training. These results show that an abstract dimension, in this case
monetary value, modulates neural response to an object in visual areas of the brain even when
attention is diverted.
INTRODUCTION
The neural representation of a visual stimulus must code many dimensions, and so the
similarity space of a set of objects is multi-dimensional, even in a single brain region. For
example, the similarity of the neural responses in V1 reflects both stimulus orientation and
spatial frequency (Mazer et al., 2002), and the similarity of neural codes in V4 reflects both
stimulus color and shape (Roe et al., 2012). The voxel-level BOLD response can reflect
multiple stimulus dimensions that are coded, at the neural level, either independently or
conjointly (Drucker et al., 2009).
For these basic visual dimensions and beyond, it is clear that neural responses early in the
visual pathway are shaped by learning, both of categorical boundaries along visual stimulus
dimensions (Folstein et al., 2012) and of abstract information about objects (e.g., biological
Corresponding author and address (including email): Andrew S. Persichetti, Emory University, Department of Psychology, 36 Eagle Row, Room 410, Atlanta, GA 30322, [email protected], P: 404-727-8172.
The authors declare no competing financial interests.
HHS Public AccessAuthor manuscriptJ Cogn Neurosci. Author manuscript; available in PMC 2015 May 01.
Published in final edited form as:J Cogn Neurosci. 2015 May ; 27(5): 893–901. doi:10.1162/jocn_a_00760.
Author M
anuscriptA
uthor Manuscript
Author M
anuscriptA
uthor Manuscript
class structure of living things; Connolly et al., 2012). The goal of the current study is to
explore whether (and where) neural responses to novel visual stimuli reflect the abstract but
behaviorally relevant variable of value. We show that early in the visual processing
pathway, nonvisual information is coded in the neural response, even when (i) the abstract
dimension is orthogonal to all visual dimensions; (ii) the abstract dimension is newly
learned; and (iii) responses are measured during a task that makes no reference to the
abstract (value) dimension.
Many recent experiments have sought to identify neural signals associated with the values of
choice alternatives (see Bartra et al., 2013 for review). It has been suggested that the process
of choosing between items is a two-staged process, in which values are first assigned to each
option and then compared to yield a choice (Kable and Glimcher, 2009; Levy et al., 2011).
This two-staged process of choice suggests that the process of tracking values of items is
independent of choosing between them (Lebreton et al., 2009). Several studies have shown
brain responses that engage automatically to different kinds of valuations, including,
monetary value (Tallon-Baudry et al., 2011), facial attractiveness (e.g. Chatterjee et al.,
2009), houses and paintings (e.g. Lebreton et al., 2009), consumer goods (e.g. Levy et al.
2011), and to faces that have learned associations to monetary values (Rothkirch et al.,
2012). These results address if values are stored separately from a choice task, but their use
of familiar objects makes it difficult to disentangle the value of a stimulus from its cultural
significance and familiarity (Erk et al., 2002; Rangel et al., 2008). In Rothkirch et al.,
(2012), a baseline measure of brain response to the face stimuli before value learning is not
provided to compare the fMRI results after value learning, thus leaving their findings
ambiguous.
Finally, prior work has suggested that coupling reward with visual stimuli may modulate the
visual representation of the reward predicting stimuli (Seitz et al., 2009; Arsenault et al.,
2013), and improve performance during perceptual tasks (Pessiglione et al., 2006;
Engelmann and Pessoa, 2007; Serences, 2008; Nomoto et al., 2010). Stanisor et al., 2013
showed that V1 neurons that exhibited a strong response to value, also exhibited a strong
attention effect. We add to this literature by showing that these behaviorally relevant
changes to visual representations of reward related stimuli are present even when attention is
diverted away from value, and engaged instead in a perceptual task that is not reward
related. Using fMRI, we measured neural responses to novel objects with learned values
while subjects performed an unrelated perceptual task. We calculated the degree of fMRI
adaptation (Grill-Spector and Malach, 2001) as a measure of neural similarity between
objects along the value dimension, to determine if the response of neurons in visual cortex is
modulated by the newly learned value of these objects.
MATERIALS & METHODS
Subjects
Thirteen right-handed subjects (mean age = 24.3 years, 9 females) with normal or contact
corrected vision participated in the study for monetary compensation. Informed consent was
obtained from each subject as approved by the University of Pennsylvania Institutional
Review Board.
Persichetti et al. Page 2
J Cogn Neurosci. Author manuscript; available in PMC 2015 May 01.
Author M
anuscriptA
uthor Manuscript
Author M
anuscriptA
uthor Manuscript

Design and Procedure
Subjects learned the value for novel stimuli over the course of a four-session training
protocol. Before and after training, subjects were scanned while performing a visual
decision task unrelated to value. The total span of the experiment for each subject was one
week.
The novel stimuli were nine closed contours, or “moon” shapes, that varied across three
dimensions: color, shape, and monetary value. The nine objects were created by pairing each
of three shapes with each of three colors (Fig. 1a), and they ranged in value from negative
$10 to positive $10, in increments of $2.50. For any pair of objects, we could assign a
distance along the color dimension (0–2 “steps”), the shape dimension (also 0–2 “steps”),
and the value dimension (1–8 steps; 0 would occur only for two identical stimuli). So, for
example, the stimuli in the upper left and lower left of Figure 1a would differ in 0 shape
steps, 2 color steps, and 2 value steps. The values were assigned to the objects such that
these three distances were uncorrelated across the set of stimuli, allowing us to measure the
effect of value similarity independently of the effects of color or shape similarity.
During each trial of the training sessions the subject saw two objects next to each other on a
computer screen. Subjects were asked to choose one object in an effort to maximize the total
amount of money in their bank. On each trial during the choice task, the value of each object
was drawn from a Gaussian distribution with a standard deviation of $0.25 that was centered
on the mean value of the object. The variation was intended to be a way of presenting the
stimuli and their associated values during the learning phase while preventing subjects from
simply associating a number with an object (instead of thinking about these objects as
having worth). After an object was chosen, it was highlighted and the amounts for both
objects were displayed on the bottom of the screen. Next, a screen appeared showing the
subject’s total bank up to that point. Each subject completed a total of twenty blocks, of 72
trials each, of this task over a four-day period. Each object was paired with every other
object an equal number of times, and identical objects were never presented together during
a trial. Each subject received payment after the final scan. This payment included ten
percent of the final bank value of a randomly chosen block, excluding blocks on the first
day, from the training sessions. The average of this bonus payment across subjects was $29.
The primary dependent variable was a measure of fMRI activity obtained while subjects
viewed these objects while performing a difficult cover task unrelated to value (Fig. 1b). On
each trial, we presented one object on a gray background. A vertical line bisected the object,
leaving 65% of the object either on the left or right side of the line. This line was randomly
tilted between 10 and 40 degrees from the vertical. The subject indicated by button press on
each trial whether more of the shape was to the left or to the right of the line. We chose this
cover task because it required the subject to attend to the appearance of the stimulus, shown
on each trial, but did not involve an explicit comparison between sequential stimuli, nor
their respective monetary values (Drucker et al., 2009). The stimuli were back-projected
onto a screen viewed by the subject through a mirror mounted on the head coil, and
subtended 5° of visual angle. Each stimulus was presented for 1300 milliseconds (ms), with
a 300 ms inter-stimulus interval (ISI) consisting of the mean gray background.
Persichetti et al. Page 3
J Cogn Neurosci. Author manuscript; available in PMC 2015 May 01.
Author M
anuscriptA
uthor Manuscript
Author M
anuscriptA
uthor Manuscript

We employed a pseudorandom and counterbalanced, continuous carry-over design (Aguirre,
2007) that controlled the influence of stimulus order upon neural response. This allowed us
to measure both fMRI adaptation and the direct effect for each item in a continuous
sequence. The order of the stimuli was determined using a de Bruijn sequence (Aguirre et
al., 2011). Given the nine stimuli and a null-trial, a k=10, n=3 de Bruijn sequence was
sought, using a trial duration of 1600 ms, and three separate neural models (i.e., value, color
and shape) (Fig. 1c). The sequence was optimized to detect adaptation responses predicted
by the value dimension (and specifically, by the dimension of what we will refer to, below,
as the signed value, in contrast to the unsigned or absolute value), but detection powers for
effects of the unsigned value dimension and each of the visual dimensions were also taken
into consideration while optimizing the sequence. Additional blank trials were added to the
sequence to increase the power of the main effect (all stimuli vs. null-trials) and to increase
the total length of the sequence to an integer multiple of TRs. This sequence was then
broken into 5 runs of 128 TRs each. The last 8 TRs from each run were added to the
beginning of the subsequent run to ensure that our sequence counterbalancing was not
affected by breaking it into smaller runs.
In addition to the cover task, we collected fMRI data during two additional tasks. At the end
of the first scanning session, subjects completed a one-back task with faces, objects, and
scrambled objects. We included this functional localizer so that we could define regions of
interest corresponding to early visual cortex (EVC), using the contrast of scrambled objects
greater than objects (Fig. 2), and to lateral occipital cortex (LOC), using the contrast of
objects greater than scrambled objects. The EVC region corresponds to the foveal
confluence of visual areas V1–V3, which we confirmed by projecting a cortical surface
template of these early visual areas (Benson et al., 2014) onto the volumetric data. During
the second scanning session, after completing the cover task, subjects completed two short
runs of a choice task in which they saw each object on the screen for 1300 ms and were
asked to choose whether they would prefer to have the value of that object or one dollar.
This choice task differed from the training task because we needed to present one stimulus at
a time in the scanner so that we could later conduct item specific analyses. Each run of the
choice task was 68 TRs.
Scanning
Scans were collected on a 3-T Siemens Trio using a 32-channel surface array coil.
Echoplanar BOLD fMRI data were collected at a TR of 3 seconds, with 3x3x3 mm isotropic
voxels covering the entire brain. A high-resolution anatomical image (3D MPRAGE) was
also collected with 1x1x1 mm voxels for each subject. The stimuli were presented using a
Sanyo SXGA 4200 lumens projector with a Buhl long-throw lens for rear projection onto
Mylar screens, which subjects viewed through a mirror mounted on the head coil.
Data analysis
Image preprocessing and analyses were conducted using FSL (Smith et al., 2004). The first
8 TRs from each scan were removed prior to analysis. The data were smoothed with a full-
width half-maximum Gaussian kernel of 5 mm. The functional images were aligned to the
middle image of the time series with MCFLIRT (Jenkinson et al., 2002) and then
Persichetti et al. Page 4
J Cogn Neurosci. Author manuscript; available in PMC 2015 May 01.
Author M
anuscriptA
uthor Manuscript
Author M
anuscriptA
uthor Manuscript
transformed to standard MNI space. Within-subject statistical models were created using a
general linear model (Fig. 1d). Experimental conditions were convolved with a canonical
hemodynamic response function and spikes caused by head motion were included as
covariates in the model. Beta estimates from the model were then averaged across each ROI.
When using the continuous carry-over approach to measuring neural adaptation, the
relationship of each stimulus to the prior stimulus forms the basis of the covariates (Aguirre
2007). In our design, we used both positive and negative values to distinguish changes in
responses due to the actual value of the objects from those due to the behavioral salience of
each object (i.e., large versus small values, as reflected by the absolute value, or what we
will call the unsigned value). With this in mind we modeled the distance between the value
of each stimulus and the prior stimulus in two ways: One covariate models the “signed
effect”, with nine different transition sizes, such that the stimulus associated with wins of
$10 was maximally different from the one associated with losses of $10; the second
covariate models the “unsigned effect”, with five transition sizes such that those two stimuli
(positive and negative $10) would be maximally similar. The inclusion of the unsigned
covariate was added to the analysis to demonstrate that our effect of interest, namely the
signed adaptation effect in early visual cortex, was about value per se and not simply
behavioral salience.
Our model included covariates for signed adaptation, unsigned adaptation, blank trials, and
trials following a blank trial. When using the continuous carry-over approach to measure
adaptation, a trial in the adaptation covariates represents the difference along a given
dimension between the present stimulus and the one that precedes it. Therefore we included
trials that followed blank screens as a covariate of no interest in the model because a blank
screen trial does not have a value to serve as a comparison for the stimulus it precedes. For
each subject, the five main task runs were first modeled individually and then combined
using a higher-level fixed effects model. Data were then combined across subjects using a
random effects model.
We report analyses in five regions of interest (ROIs). We included two functionally defined
ROIs in visual cortex, EVC and LOC, as described above. While we were primarily
interested in the effects of value on object representations in EVC (and potentially LOC), we
included value-related ROIs to provide a point of reference for our findings in EVC. For
example, if we find that the signed value covariate does explain variance in EVC after
training, how does that compare with more traditionally value-related ROIs? Is there
dissociation between EVC and these other regions, or are the effects similar across these
different cortical regions? Because there is not currently an agreed upon way to functionally
localize value-related brain areas, we defined value-related ROIs based on the anatomical
coordinates reported in a meta-analysis of fMRI experiments that examined subjective value
(Bartra et al., 2013); we defined ROIs in ventromedial prefrontal cortex (VMPFC),
dorsomedial prefrontal cortex (DMPFC), and striatum.
Persichetti et al. Page 5
J Cogn Neurosci. Author manuscript; available in PMC 2015 May 01.
Author M
anuscriptA
uthor Manuscript
Author M
anuscriptA
uthor Manuscript
RESULTS
Behavioral results
During each day of the training, and at the end of the second scan, subjects performed a
choice task that required them to use their knowledge of the values of the objects to optimize
their winnings. Subjects chose the object with the greater associated reward more frequently
from the first training day (mean ± SEM correct = 69.7%±2.7) to the final training day
(mean ± SEM correct = 90.1%±3.4). The scores at the end of training were above chance
(50%) for all subjects (Fig. 3) and significantly different than the scores on day one (t(12) =
9.7, p<0.001). Subjects were also able to identify the values associated with the stimuli
during the alternate choice task (i.e. object versus $1) at the end of the second scan (mean ±
SEM correct = 89.7%±2.3).
fMRI results
We measured the degree to which the learned value of an object modulates the neural
response to the presentation of subsequent objects of greater or lesser value. This neural
adaptation effect could be manifest as proportional to the signed value of an object, meaning
that an object associated with a loss of $10 would be treated as maximally different from an
object associated with a gain of $10. Alternatively, neural populations could encode the
absolute value of an object, and thus reflect behavioral salience. In this case, an object
associated with either a gain or a loss of $10 would be treated as maximally different from
an object with a small relative value (e.g., $2.50). We tested for both of these possible
effects in each of five regions of interest. Additionally, we examined these effects before
and after learning of object value.
The primary question of this experiment is whether nonvisual value information is coded in
the neural response early in the visual processing pathway, even when it is orthogonal to all
visual dimensions, and the responses are measured during a task that makes no reference to
the abstract (value) dimension. As expected, prior to training, no significant adaptation
effect related to either signed or unsigned value was found in any region of interest (Fig. 4).
In contrast, significant neural adaptation related to shape similarity was found in multiple
regions. This indicates that object value and shape were unrelated prior to training.
Following training, we observed an adaption effect for the signed model in EVC
(t(12)=2.87, p<.02) (Fig. 5a). This effect was greater than that observed during the pre-
training scan (marginally significant interaction, t(12)=2.11, p=.057). Signed value was not
associated with adaptation in any of the other ROIs, nor did we find significant effects with
the unsigned model in any of our ROIs.
Prior studies of value representation have examined the overall magnitude of neural
response associated with item value (Tusche et al., 2010; Levy et al., 2011; and Bartra et al.,
2013 for review). We tested for similar item effects in our data by determining if the
magnitude of the BOLD fMRI signal was proportional to object value, independently of the
similarity of value to preceding or following stimuli. We did not observe a significant item
effect for signed value in any of our ROIs during either scan session. Given that prior studies
have shown monotonic increase of activity in the PFC and striatum as a function of stimulus
Persichetti et al. Page 6
J Cogn Neurosci. Author manuscript; available in PMC 2015 May 01.
Author M
anuscriptA
uthor Manuscript
Author M
anuscriptA
uthor Manuscript
value during value related decision tasks, we also measured these effects during the value
task at the end of the second scan session. We analyzed the data from these scans in the
same way as the data from the main task. Whereas we did not find adaptation effects of
value during this task, we did find direct effects of relative value in DMPFC (t=2.77, p <
0.02), but not in striatum or VMPFC (both p-values > 0.1). While the inability to measure a
significant response to value in striatum and VMPFC may seem odd, it could be because
subjects did not expect a reward based on their performance in this task (i.e., subjects were
aware that we were simply testing their knowledge of the values).
Finally, we examined the adaptation effect of shape similarity. Although this effect has no
direct bearing on the goals of this study, we report it here as it establishes the sensitivity of
our ROIs to object similarity, beyond value. We observed an adaptation effect of shape
similarity in LOC (t(12)=2.96, p<.02), EVC (t(12)=2.31, p<.05), DMPFC (t(12)=3.05, p=.
01), VMPFC (t(12)=3.02, p=.01), and a marginal effect of shape similarity in striatum
(t(12)=2.06, p=.06) (Fig. 5b). There were no reliable differences in the magnitude of the
shape adaptation effect pre- versus post-training in any of these ROIs. We also tested for
neural adaptation related to the sequential effect of color change. This effect was not
significant during either scan in the EVC (both p-values > 0.3) or the LOC (both p-values >
0.2).
In sum, EVC showed adaptation to shape before and after training, and adaptation to value
after training. In contrast, LOC, DMPFC, VMPFC showed adaption to shape (at both time
points) but no adaptation to value.
DISCUSSION
We scanned subjects while they viewed a set of nine novel objects that varied across two
visual dimensions (color and shape) and one orthogonal, non-visual dimension (monetary
value). We measured fMRI adaptation to characterize the neural similarity of these novel
objects before and after a training period during which subjects associated monetary values
with the objects. We found a recovery from adaptation along the monetary value dimension
in EVC present only after training. We interpret this as evidence that object representations
in the visual cortex are affected by value learning even when value is orthogonal to visual
features, and even when subjects are engaged in a perceptual task unrelated to object value.
This value effect may be related to other effects of learning that have been reported in the
visual system. (Folstein et al., 2012) mention that in previous studies in which shape spaces
were created by morphing complex objects, the dimensions that define those spaces are
unclear and may not have existed prior to category learning (Goldstone and Steyvers, 2001;
Gureckis and Goldstone, 2008). The authors further posit that because the objects that differ
along dimensions relevant to the learned categories are more perceptually discriminable
after learning, category learning may create representations of those relevant object
dimensions. In the present study, we believe that a similar process is at work. Specifically,
learning the abstract property of value has modified the representations within certain
assemblies of color and shape responsive neurons in EVC to better discriminate along the
value dimension.
Persichetti et al. Page 7
J Cogn Neurosci. Author manuscript; available in PMC 2015 May 01.
Author M
anuscriptA
uthor Manuscript
Author M
anuscriptA
uthor Manuscript

Our results go beyond the evidence for attention effects of value in the visual system
(Serences, 2008), or what others have called Visual Perceptual Learning (VPL) (Sasaki et
al., 2009).These studies have shown that reward history associated with a specific feature of
a set of stimuli will modulate responses to that feature in EVC and out into higher-level
visual areas. Our results add to this literature by showing that even when reward history is
orthogonal to the low level features of objects, neural activity in EVC tracks the value of
each stimulus. Previous studies have suggested that coupling reward with visual stimuli may
improve performance during perceptual tasks (Pessiglione et al., 2006; Engelmann &
Pessoa, 2007; Serences, 2008; Nomoto et al., 2010).
While prior studies of the representation of value have examined the bulk neural response
evoked by the stimulus, we measured here neural adaptation induced by the similarity of
object values. We used neural adaptation to characterize the similarity space represented
within separate neural populations. We chose this method because it allowed for us to
manipulate and measure each stimulus dimension separately, and to observe neural
sensitivity to each stimulus dimension across our ROIs. We did not observe a modulation of
overall level of neural activity driven by object value in any of our ROIs. Interestingly, we
also found that brain regions commonly found to be associated with value (dorsal and
ventral mPFC) encoded the shapes of objects, but not their values, indicating that when
value is irrelevant to the present task, these regions will instead track task-relevant
dimensions of the presented stimuli. This finding is not surprising since it has been reported
that regions of frontal cortex, including dorsal and medial PFC, play a crucial role in the
active biasing of task-relevant processes against strong competing alternatives (Chadick et
al., 2014; Chadick and Gazzaley, 2011; Miller and Cohen, 2001). Furthermore, evidence
from several species suggests that the striatum contributes directly to decision-making,
action selection and initiation (Green et al., 2012; Balleine et al., 2007). This finding
suggests that the process of tracking values occurs early in perception, and that more frontal
brain regions, involved in executive functions, are not recruited in value representation
unless a choice between items is necessary.
Taken together, our findings that value learning modified the representations within certain
neurons in EVC to better discriminate along the value dimension, and that neurons in brain
regions commonly found to be associated with value are not tuned to the value dimension
when it is irrelevant to the task, suggest that the sensory system plays a large role in the
valuation process in the brain. This top-down facilitation in visual areas serves to assist in
learning and in disambiguating input data, which can lead to faster reaction times and better
accuracy in important situations (Bar, 2003; Hsieh et al., 2010; Nomoto et al., 2010). If
neurons in executive brain regions are not tuned to dimensions irrelevant to task demands,
then where does value information reside when not in use? Our data support the idea that
neural tuning in EVC, as measured by fMRI adaptation, contains information that could
facilitate faster processing during value-based decision tasks. However, the lack of a main
effect of value in EVC suggests that value is represented in visual cortex differently from
putative “value regions”. In this study, we did find an item-level effect of value in the
striatum after training, indicating a different representation of value is associated with this
brain region.
Persichetti et al. Page 8
J Cogn Neurosci. Author manuscript; available in PMC 2015 May 01.
Author M
anuscriptA
uthor Manuscript
Author M
anuscriptA
uthor Manuscript

An interesting topic for further examination is if altered neural representations in early
visual cortex give rise to altered performance on simple perceptual tasks. Speeded
discrimination judgments might reflect the value of the objects, suggesting that learning to
associate a value with an object influences perceptual similarity, in addition to neural
similarity.
In conclusion, we found that neural populations in early visual cortex encode value
information. The response in EVC was measured during a demanding task that diverted
attention away from the object value. The stimuli used were novel objects with no prior
reward history, cultural significance, or familiarity, and the value dimension was orthogonal
to the low level visual features of the stimuli. These findings suggest that the learned value
of objects penetrates to the earliest level of cortical sensory representation.
Acknowledgements
This work was funded by National Institutes of Health grant R01EY021717. We would like to thank the Kable lab at the University of Pennsylvania for their insightful comments.
REFERENCES
Aguirre GK. Continuous carry-over designs for fMRI. NeuroImage. 2007; 35:1480–1494. [PubMed: 17376705]
Aguirre GK, Mattar MG, Magis-Weinberg L. de Bruijn cycles for neural decoding. NeuroImage. 2011; 56:1293–1300. [PubMed: 21315160]
Arsenault JT, Nelissen K, Jarraya B, Vanduffel W. Dopaminergic Reward Signals Selectively Decrease fMRI Activity in Primate Visual Cortex. Neuron. 2013; 77:1174–1186. [PubMed: 23522051]
Balleine BW, Delgado MR, Hikosaka O. The Role of the Dorsal Striatum in Reward and Decision-Making. J Neurosci. 2007; 27:8161–8165. [PubMed: 17670959]
Bar M. A cortical mechanism for triggering top-down facilitation in visual object recognition. J Cogn Neurosci. 2003; 15:600–609. [PubMed: 12803970]
Bartra O, McGuire JT, Kable JW. The valuation system: a coordinate-based meta-analysis of BOLD fMRI experiments examining neural correlates of subjective value. NeuroImage. 2013; 76:412–427. [PubMed: 23507394]
Benson NC, Butt OH, Brainard DH, Aguirre GK. Einhäuser W. Correction of Distortion in Flattened Representations of the Cortical Surface Allows Prediction of V1-V3 Functional Organization from Anatomy. PLoS Comput Biol. 2014; 10:e1003538. [PubMed: 24676149]
Chadick JZ, Gazzaley A. Differential coupling of visual cortex with default or frontal-parietal network based on goals. Nat Neurosci. 2011; 14:830–832. [PubMed: 21623362]
Chadick JZ, Zanto TP, Gazzaley A. Structural and functional differences in medial prefrontal cortex underlie distractibility and suppression deficits in ageing. Nat Commun. 2014; 5 Available at: http://www.nature.com/doifinder/10.1038/ncomms5223.
Chatterjee A, Thomas A, Smith SE, Aguirre GK. The neural response to facial attractiveness. Neuropsychology. 2009; 23:135–143. [PubMed: 19254086]
Connolly AC, Guntupalli JS, Gors J, Hanke M, Halchenko YO, Wu Y-C, Abdi H, Haxby JV. The representation of biological classes in the human brain. J Neurosci Off J Soc Neurosci. 2012; 32:2608–2618.
Drucker DM, Kerr WT, Aguirre GK. Distinguishing conjoint and independent neural tuning for stimulus features with fMRI adaptation. J Neurophysiol. 2009; 101:3310–3324. [PubMed: 19357342]
Engelmann JB, Pessoa L. Motivation sharpens exogenous spatial attention. Emotion. 2007; 7:668–674. [PubMed: 17683222]
Persichetti et al. Page 9
J Cogn Neurosci. Author manuscript; available in PMC 2015 May 01.
Author M
anuscriptA
uthor Manuscript
Author M
anuscriptA
uthor Manuscript

Erk S, Spitzer M, Wunderlich AP, Galley L, Walter H. Cultural objects modulate reward circuitry. Neuroreport. 2002; 13:2499–2503. [PubMed: 12499856]
Folstein JR, Palmeri TJ, Gauthier I. Category Learning Increases Discriminability of Relevant Object Dimensions in Visual Cortex. Cereb Cortex. 2012 Available at: http://cercor.oxfordjournals.org/content/early/2012/04/05/cercor.bhs067.
Goldstone RL, Steyvers M. The sensitization and differentiation of dimensions during category learning. J Exp Psychol Gen. 2001; 130:116–139. [PubMed: 11293456]
Green N, Biele GP, Heekeren HR. Changes in Neural Connectivity Underlie Decision Threshold Modulation for Reward Maximization. J Neurosci. 2012; 32:14942–14950. [PubMed: 23100417]
Grill-Spector K, Malach R. fMR-adaptation: a tool for studying the functional properties of human cortical neurons. Acta Psychol (Amst). 2001; 107:293–321. [PubMed: 11388140]
Gureckis TM, Goldstone RL. The effect of the internal structure of categories on perception. (n.d.).
Hsieh P-J, Vul E, Kanwisher N. Recognition alters the spatial pattern of FMRI activation in early retinotopic cortex. J Neurophysiol. 2010; 103:1501–1507. [PubMed: 20071627]
Jenkinson M, Bannister P, Brady M, Smith S. Improved Optimization for the Robust and Accurate Linear Registration and Motion Correction of Brain Images. NeuroImage. 2002; 17:825–841. [PubMed: 12377157]
Kable JW, Glimcher PW. The neurobiology of decision: consensus and controversy. Neuron. 2009; 63:733–745. [PubMed: 19778504]
Lebreton M, Jorge S, Michel V, Thirion B, Pessiglione M. An Automatic Valuation System in the Human Brain: Evidence from Functional Neuroimaging. Neuron. 2009; 64:431–439. [PubMed: 19914190]
Levy I, Lazzaro SC, Rutledge RB, Glimcher PW. Choice from non-choice: predicting consumer preferences from blood oxygenation level-dependent signals obtained during passive viewing. J Neurosci Off J Soc Neurosci. 2011; 31:118–125.
Mazer JA, Vinje WE, McDermott J, Schiller PH, Gallant JL. Spatial frequency and orientation tuning dynamics in area V1. Proc Natl Acad Sci U S A. 2002; 99:1645–1650. [PubMed: 11818532]
Miller EK, Cohen JD. A N I NTEGRATIVE T HEORY OF P REFRONTAL C ORTEX F UNCTION. Annu Rev Neurosci. 2001; 24:167–202. [PubMed: 11283309]
Nomoto K, Schultz W, Watanabe T, Sakagami M. Temporally Extended Dopamine Responses to Perceptually Demanding Reward-Predictive Stimuli. J Neurosci. 2010; 30:10692–10702. [PubMed: 20702700]
Pessiglione M, Seymour B, Flandin G, Dolan RJ, Frith CD. Dopamine-dependent prediction errors underpin reward-seeking behaviour in humans. Nature. 2006; 442:1042–1045. [PubMed: 16929307]
Rangel A, Camerer C, Montague PR. A framework for studying the neurobiology of value-based decision making. Nat Rev Neurosci. 2008; 9:545–556. [PubMed: 18545266]
Roe AW, Chelazzi L, Connor CE, Conway BR, Fujita I, Gallant JL, Lu H, Vanduffel W. Toward a unified theory of visual area V4. Neuron. 2012; 74:12–29. [PubMed: 22500626]
Rothkirch M, Schmack K, Schlagenhauf F, Sterzer P. Implicit motivational value and salience are processed in distinct areas of orbitofrontal cortex. NeuroImage. 2012; 62:1717–1725. [PubMed: 22728149]
Sasaki Y, Nanez JE, Watanabe T. Advances in visual perceptual learning and plasticity. Nat Rev Neurosci. 2009; 11:53–60. [PubMed: 19953104]
Seitz AR, Kim D, Watanabe T. Rewards Evoke Learning of Unconsciously Processed Visual Stimuli in Adult Humans. Neuron. 2009; 61:700–707. [PubMed: 19285467]
Serences JT. Value-based modulations in human visual cortex. Neuron. 2008; 60:1169–1181. [PubMed: 19109919]
Smith SM, Jenkinson M, Woolrich MW, Beckmann CF, Behrens TEJ, Johansen-Berg H, Bannister PR, De Luca M, Drobnjak I, Flitney DE, Niazy RK, Saunders J, Vickers J, Zhang Y, De Stefano N, Brady JM, Matthews PM. Advances in functional and structural MR image analysis and implementation as FSL. NeuroImage. 2004; 23(Suppl 1):S208–S219. [PubMed: 15501092]
Persichetti et al. Page 10
J Cogn Neurosci. Author manuscript; available in PMC 2015 May 01.
Author M
anuscriptA
uthor Manuscript
Author M
anuscriptA
uthor Manuscript
Stanisor L, van der Togt C, Pennartz CMA, Roelfsema PR. A unified selection signal for attention and reward in primary visual cortex. Proc Natl Acad Sci. 2013; 110:9136–9141. [PubMed: 23676276]
Tallon-Baudry C, Meyniel F, Bourgeois-Gironde S. Sirigu A. Fast and Automatic Activation of an Abstract Representation of Money in the Human Ventral Visual Pathway. PLoS ONE. 2011; 6:e28229. [PubMed: 22140556]
Tusche A, Bode S, Haynes J-D. Neural responses to unattended products predict later consumer choices. J Neurosci Off J Soc Neurosci. 2010; 30:8024–8031.
Persichetti et al. Page 11
J Cogn Neurosci. Author manuscript; available in PMC 2015 May 01.
Author M
anuscriptA
uthor Manuscript
Author M
anuscriptA
uthor Manuscript

Figure 1. (a) Subjects learned the values of these nine two-dimensional closed contours, or “moon”
shapes, that varied across three orthogonal Dimensions: color, shape, and monetary value.
The values indicated here are the expected values of a normally distributed set of possible
values for each object. (b) During fMRI scanning, subjects judged whether the majority of
the area of the shape was to the left or the right of the bisecting line (right, in this example).
(c) Stimuli were presented in a counterbalanced and pseudorandom sequence. Covariates
were made for each stimulus that captured the stepwise difference between each stimulus
and the one preceding it. (d) Simulated BOLD response for a counterbalanced stimulus
presentation (red), and the model fit (blue) for the value covariate.
Persichetti et al. Page 12
J Cogn Neurosci. Author manuscript; available in PMC 2015 May 01.
Author M
anuscriptA
uthor Manuscript
Author M
anuscriptA
uthor Manuscript

Figure 2. The “Early Visual Cortex” (EVC) region of interest for an example subject, defined by
having a greater response to scrambled as compared to intact objects in a functional localizer
scan. The volumetric position of the visual areas V1–V3 as defined by reference to a cortical
surface topology atlas (Benson et al., 2014) is shown.
Persichetti et al. Page 13
J Cogn Neurosci. Author manuscript; available in PMC 2015 May 01.
Author M
anuscriptA
uthor Manuscript
Author M
anuscriptA
uthor Manuscript

Figure 3. Value learning across subjects. Accuracy during each training session and the in-scanner
choice task. Each session is the mean of all subjects’ accuracy during each session. Error
bars represent +/− 1 standard error. Fit line is a third-order polynomial.
Persichetti et al. Page 14
J Cogn Neurosci. Author manuscript; available in PMC 2015 May 01.
Author M
anuscriptA
uthor Manuscript
Author M
anuscriptA
uthor Manuscript

Figure 4. Brain regions showing adaptation effects during the pre-scan. The adaptation effect for
shape was significant in EVC, LOC, DMPFC, and VMPFC. Error bars represent +/− 1
standard error.
Persichetti et al. Page 15
J Cogn Neurosci. Author manuscript; available in PMC 2015 May 01.
Author M
anuscriptA
uthor Manuscript
Author M
anuscriptA
uthor Manuscript
Persichetti et al. Page 16
J Cogn Neurosci. Author manuscript; available in PMC 2015 May 01.
Author M
anuscriptA
uthor Manuscript
Author M
anuscriptA
uthor Manuscript

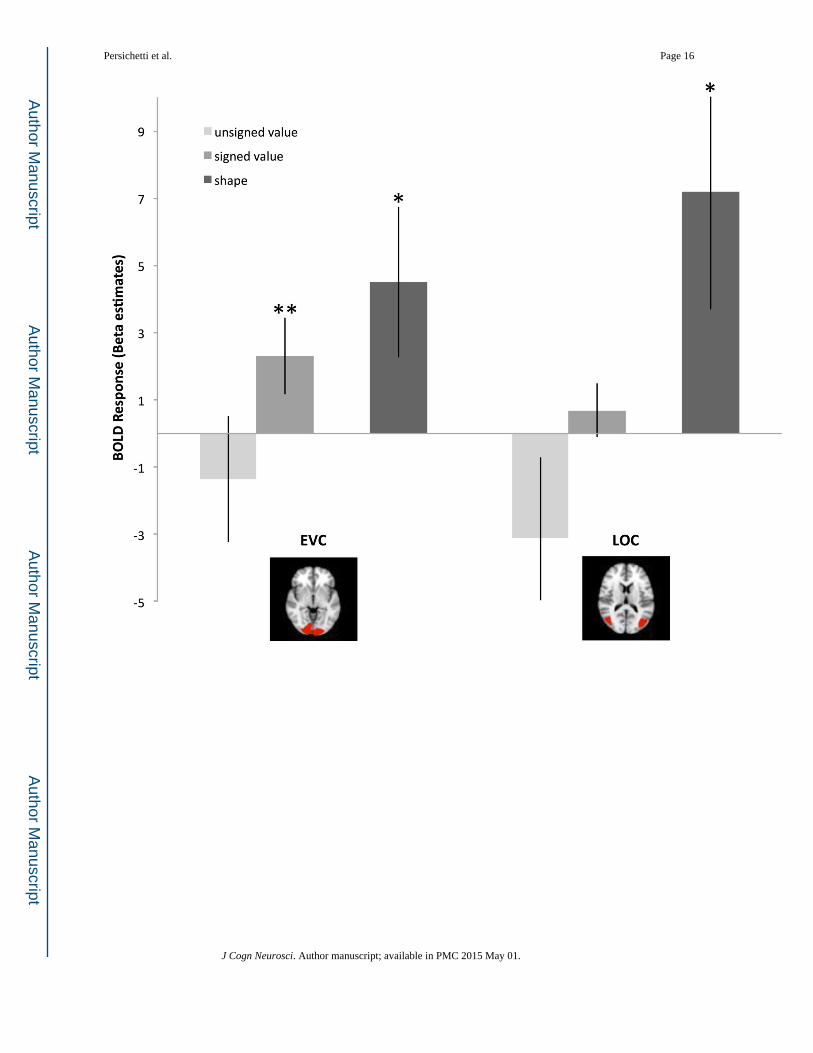
Figure 5. (a) Visual brain regions showing adaptation effects during the post-scan. The adaptation
effect for shape was significant in LOC (t(12)=2.96, p=.01) and EVC (t(12)=2.31, p<.05)
during pre- and post-scans. The adaptation effect for the signed model was significant in
EVC (t(12)=2.87, p=.01) during the post-scan. Error bars represent +/− 1 standard error. (b)
Frontal brain regions showing adaptation effects during the post-scan. The adaptation effect
for shape was significant in DMPFC (t(12)=3.05, p=.01), VMPFC (t(12)=3.02, p=.01), and
marginally significant in striatum (t(12)=2.06, p=.06) during pre- and post-scans. Error bars
represent +/− 1 standard error.
Persichetti et al. Page 17
J Cogn Neurosci. Author manuscript; available in PMC 2015 May 01.
Author M
anuscriptA
uthor Manuscript
Author M
anuscriptA
uthor Manuscript