OSPI CHANGES AND PRIORITIES January 2009. OSPI agency priorities and organization chart.
Upload
gwen-lynchCategory
view
220download
0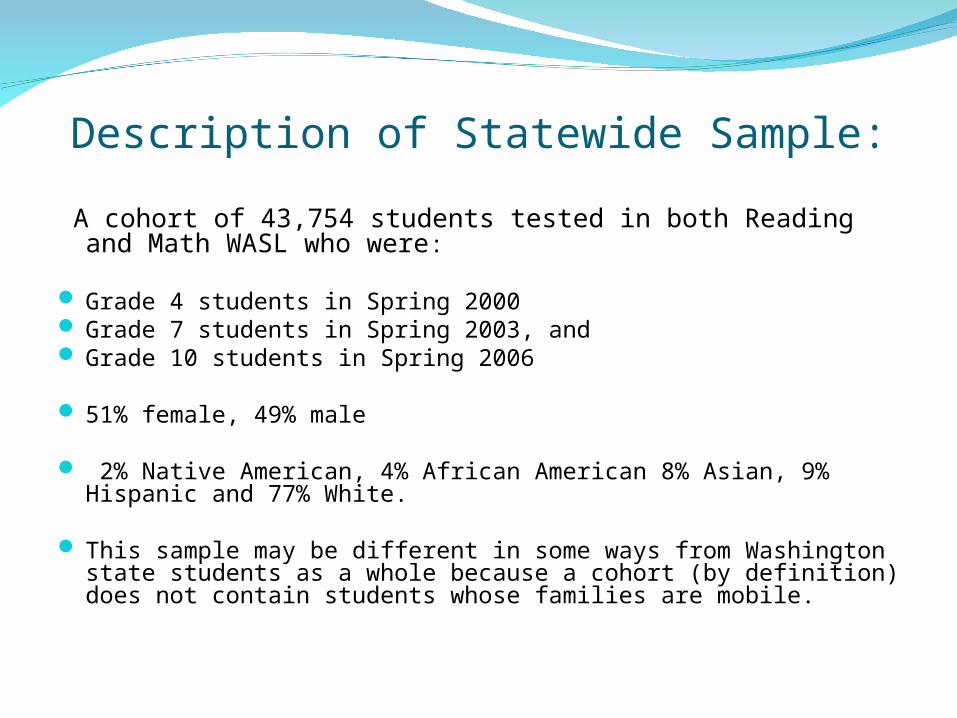
Description of Statewide Sample:
A cohort of 43,754 students tested in both Reading and Math WASL who were:
Grade 4 students in Spring 2000 Grade 7 students in Spring 2003, and Grade 10 students in Spring 2006
51% female, 49% male
2% Native American, 4% African American 8% Asian, 9% Hispanic and 77% White.
This sample may be different in some ways from Washington state students as a whole because a cohort (by definition) does not contain students whose families are mobile.
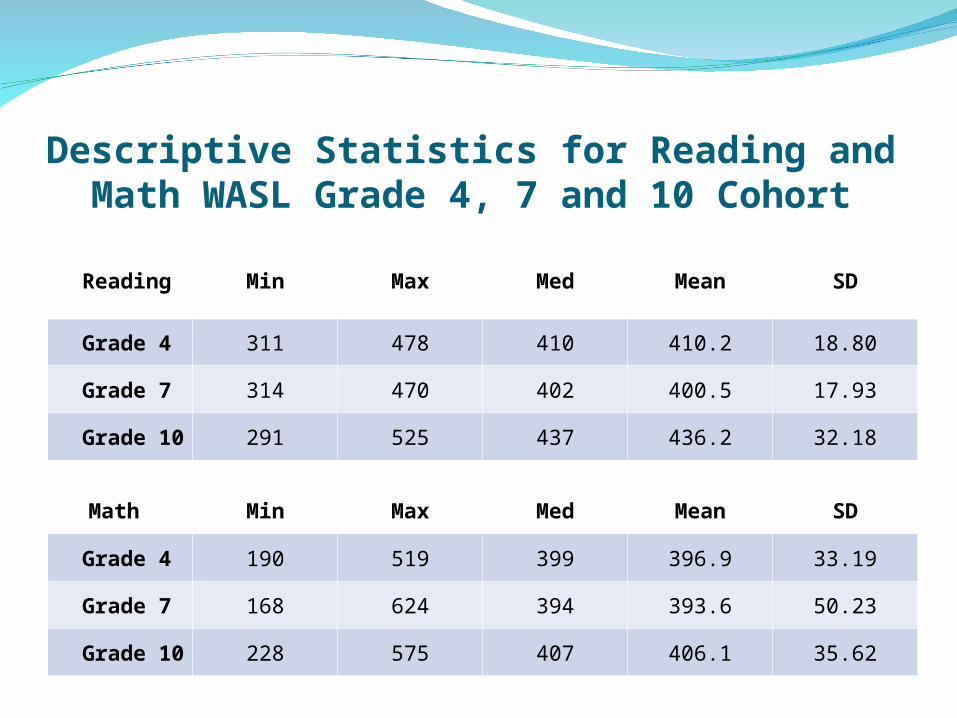
Descriptive Statistics for Reading and Math WASL Grade 4, 7 and 10 Cohort
Reading Min Max Med Mean SD
Grade 4 311 478 410 410.2 18.80
Grade 7 314 470 402 400.5 17.93
Grade 10 291 525 437 436.2 32.18
Math Min Max Med Mean SD
Grade 4 190 519 399 396.9 33.19
Grade 7 168 624 394 393.6 50.23
Grade 10 228 575 407 406.1 35.62


Pearson Correlations Statewide Cohort
WASL Reading Scale Scores
WASL Math Scale Scores
Grade 7 Grade 10
Grade 4 .649 .569
Grade 7 .637
Grade 7 Grade 10
Grade 4 .745 .694
Grade 7 .778

Thought experiment
You’re a teacher at Emerald Elementary in the Green School District.
100 students in your school take the WASL in 2000 as 4th graders.
Imagine them lined up in order of their WASL Reading Scores and then again in the order of their WASL Math, Students who receive the same rank stand side by side.
Now, do your two lines look the same? Are the students in the same order?
Thought experiment continued
Jump ahead to 2003. You now teach at Sage Middle School.
These same 100 students now attend Sage as 7Th grade students and take the Reading and Math WASL.
Again, imagine the students lining up in rank order of WASL Reading and WASL Math scores.
You see familiar faces, but are these students in the same order as they were in grade 4?
Thought experiment continued
It’s now 2006, and you are now the District Assessment Coordinator for Emerald SD.
The WASL is a major part of your work. You would like to know to what extent is the rank
order of the students in the 2000-2003-2006 cohort the same as in previous WASL Reading and Math Assessments.
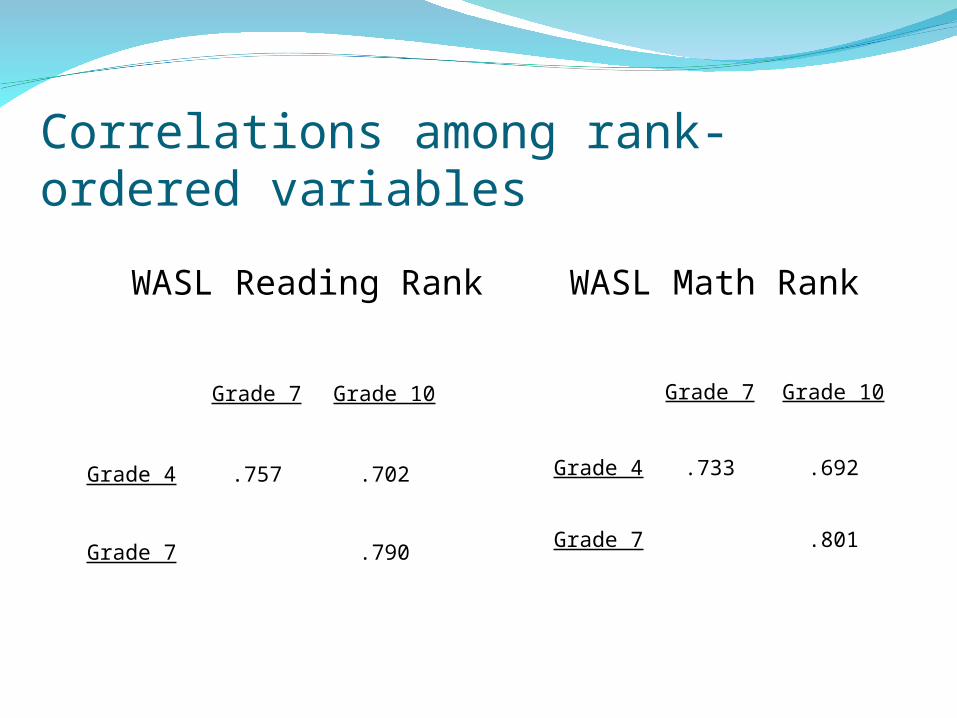
Correlations among rank-ordered variables
WASL Reading Rank WASL Math Rank
Grade 7 Grade 10
Grade 4 .757 .702
Grade 7 .790
Grade 7 Grade 10
Grade 4 .733 .692
Grade 7 .801

Math Rank Grade 4 by Grade 10 Reading Rank Grade 4 by Grade 10
Questions, Observations, Comments?

Appendix – SPSS Syntax to Create Rank Variables and Spearman vs. Pearson
SPSS Syntax
Rank
RANK order (1=highest value and 100 is lowest value)
VARIABLES=rscale6 (A) /RANK /PRINT=YES
/TIES=MEAN .
Percentile AKA Fractional Rank
RANK percentile (100=highest value and l is lowest value)
VARIABLES=rscale6 (A) /RFRACTION /PRINT=YES
/TIES=MEAN .

Pearson vs. SpearmanSyntax for Pearson correlation -- r Use when you have equal interval scale, measures are the same or equivalent. Large sample or population Magnitude of association is important
CORRELATIONS /VARIABLES=mtraw6 sscale6
/PRINT=TWOTAIL NOSIG
/MISSING=PAIRWISE .
Syntax for Spearman correlation -- rho Use when you have ordinal scale, measures may be different. Good for survey data, e.g, Likert scales, agree/disagree Smaller sample or population (~ 100) Need to reject Null Hypothesis that two measures are not related.
NONPAR CORR /VARIABLES=mtraw6 sscale6
/PRINT=SPEARMAN TWOTAIL NOSIG
/MISSING=PAIRWISE .
NOTE: Running Pearson correlation on ranked variables = Spearman correlation.

For more information on Spearman correlationhttp://www.google.com/search?hl=en&q=spearman+pearson&btnG=Google+Search
http://www.google.com/search?hl=en&q=spearman+assumptions&btnG=Search
http://www.google.com/search?hl=en&q=spearman+rank+order&btnG=Search
http://www.google.com/search?hl=en&q=spearman+rho&btnG=Google+Search