Andrea Bellucci , Ilario Favaretto , Germana Giombini (2014... · Thus, the aim of our paper is to...
24
Abstract We aim to analyze the impact of credit availability on firms’ probability to inno- vate. Using detailed information on more than five thousand five hundred credit lines to small and medium enterprises (SMEs), we find that innovative activities are posi- tively affected by measures of bank loan availability. Further, estimates also show that firms located in an industrial district have higher probability to be innovative than oth- er firms. Our results support the idea that Italian institutions should undertake and re- inforce an economic policy oriented to sustain the access to credit of SMEs as a key el- ement for the growth and development of innovative firms. Keywords: innovative firms, probability to innovate, credit access Parole chiave: imprese innovative, probabilità di innovazione, credito d’accesso Jel classification: D22, D40, G21 Received: 27.3.2014 Final revision received: 10.7.2014 Economia e Politica Industriale - Journal of Industrial and Business Economics 2014 vol. 41 (4): 27-50 CREDIT AVAILABILITY AND PROPENSITY TO INNOVATE OF SMALL AND MEDIUM ENTERPRISES ° Andrea Bellucci * , Ilario Favaretto ** , Germana Giombini *** ° We are grateful for comments and suggestions from two anonymous referees, Giorgio Calcagnini, Alfredo Del Monte, Donato Iacobucci, Antonello Zanfei, Alberto Zazzaro and seminar participants at the University of Urbino, University of Naples Federico II and IAW, Tubingen. Andrea Bellucci acknowledges the support from the FP7 Marie Curie Actions of the European Commission, via the Intra European Fellowship (Grant Agreement Number PIEF-GA-2012-331728), and previously the REPOS project. All remaining errors are our own. * University of Tübingen, IAW (Institute for Applied Economic Research); [email protected]. ** Università degli studi di Urbino, Dipartimento di economia società politica; [email protected]. *** Università degli studi di Urbino, Dipartimento di economia società politica; Mo.Fi.r (Money & Finance Research); [email protected]. Copyright © FrancoAngeli N.B: Copia ad uso personale. È vietata la riproduzione (totale o parziale) dell’opera con qualsiasi mezzo effettuata e la sua messa a disposizione di terzi, sia in forma gratuita sia a pagamento. FrancoAngeli
-
Upload
truonghanh -
Category
Documents
-
view
213 -
download
0
Transcript of Andrea Bellucci , Ilario Favaretto , Germana Giombini (2014... · Thus, the aim of our paper is to...

Abstract
We aim to analyze the impact of credit availability on firms’ probability to inno-vate. Using detailed information on more than five thousand five hundred credit linesto small and medium enterprises (SMEs), we find that innovative activities are posi-tively affected by measures of bank loan availability. Further, estimates also show thatfirms located in an industrial district have higher probability to be innovative than oth-er firms. Our results support the idea that Italian institutions should undertake and re-inforce an economic policy oriented to sustain the access to credit of SMEs as a key el-ement for the growth and development of innovative firms.
Keywords: innovative firms, probability to innovate, credit access
Parole chiave: imprese innovative, probabilità di innovazione, credito d’accesso
Jel classification: D22, D40, G21
Received: 27.3.2014Final revision received: 10.7.2014
Economia e Politica Industriale - Journal of Industrial and Business Economics2014 vol. 41 (4): 27-50
CREDIT AVAILABILITY AND PROPENSITY TO INNOVATE OF SMALL AND MEDIUM ENTERPRISES°
Andrea Bellucci*, Ilario Favaretto**, Germana Giombini***
° We are grateful for comments and suggestions from two anonymous referees, GiorgioCalcagnini, Alfredo Del Monte, Donato Iacobucci, Antonello Zanfei, Alberto Zazzaro andseminar participants at the University of Urbino, University of Naples Federico II and IAW,Tubingen. Andrea Bellucci acknowledges the support from the FP7 Marie Curie Actions of theEuropean Commission, via the Intra European Fellowship (Grant Agreement NumberPIEF-GA-2012-331728), and previously the REPOS project. All remaining errors are our own.* University of Tübingen, IAW (Institute for Applied Economic Research);[email protected].** Università degli studi di Urbino, Dipartimento di economia società politica;[email protected].*** Università degli studi di Urbino, Dipartimento di economia società politica; Mo.Fi.r(Money & Finance Research); [email protected].
Copyright © FrancoAngeli N.B: Copia ad uso personale. È vietata la riproduzione (totale o parziale) dell’opera con qualsiasi
mezzo effettuata e la sua messa a disposizione di terzi, sia in forma gratuita sia a pagamento.
FrancoAngeli

Introduction
The access to credit plays a crucial role for all firms, by extending or un-dermining their profits and growth opportunities (Calcagnini, Ferrando andGiombini, 2014). Particularly, financial resources are vital to foster the start-up and development of innovative firm projects (Canepa and Stoneman,2002), and the financing of innovation is acknowledged to be a key factor tosubstantially increase firms’ competitiveness and performances. Notwithstand-ing this, R&D expenses have a number of characteristics that make them dif-ferent from fixed investment (Hall, 2009), and the empirical literature hasmainly focused on which financial models are more suitable for innovativefirms (Brierley, 2001; OECD, 2006; Robb, 2010). Generally, it is argued thatdebt financing is less suitable than other sources (internal resources and equityissues) to finance innovative firms, due to the presence of tougher moral haz-ard problems, riskier activity, lower collateral, and therefore to potential in-vestors’ difficulties in valuing their investment projects (Guiso, 1998).
By contrast, the impact of bank loans on firm propensity to innovate, i.e.whether firms’ investment in innovation is affected by credit availability, re-mains an open question, especially if referred to small- and medium-sized en-terprises (SMEs).
In this paper we aim to fill in the informative gap about the causal effect ofexternal debt, i.e. bank loans, on the firm’s propensity to innovate using acombination of information obtained by two datasets on firms operating in anItalian context. The first dataset contains the entire portfolio on more than fivethousand five hundred credit lines granted to SMEs by a major inter-regionalItalian bank. The second dataset identifies innovative firms that carry out anarrow set of innovative activities, such as registration of patents to the ItalianPatent Office (IPO), to the European Patent Office (EPO) or to the UnitedStates Patent and Trademark Office (USPTO), or participation to National re-search projects.
Previous empirical evidence shows that the financial development of acountry may considerably influence the adoption of innovative processes bothfor small-sized firms as well as for those operating in high-intensity sectors(Benfratello, Schiantarelli and Sembenelli, 2008). Other studies point out thatpublic R&D subsidies have a positive effect on innovation (Almus and Czar-nitzki, 2003; Gorg and Strobl, 2007), and there is evidence on the role of fi-nance in the specialization of the Italian industrial districts (Ferri and Rotondi,2006). Finally there is some empirical evidence that issuing equity increasesthe probability that the firm has R&D expenditures for small, young, and moreleveraged high-tech firms (Magri, 2013), while the evidence on the role of ex-ternal debt financing in determining firms’ investment in innovation is scanty.
28 Economia e Politica Industriale
A. Bellucci, I. Favaretto, G. Giombini Credit availability and propensity to innovate of SMEs
Copyright © FrancoAngeli N.B: Copia ad uso personale. È vietata la riproduzione (totale o parziale) dell’opera con qualsiasi
mezzo effettuata e la sua messa a disposizione di terzi, sia in forma gratuita sia a pagamento.
FrancoAngeli

Thus, the aim of our paper is to identify whether bank loans provide sup-port to the adoption of investments in innovative activities undertaken bySMEs. The focus of the analysis is on SMEs for a twofold argument. Firstly,Italian SMEs account for over 99% of firms and about 80% of employment(Istat, 2007). Secondly, SMEs and large firms differ significantly in terms offinancial structure (ECB, 2009), and SMEs largely rely on banks when se-lecting sources of external financing.1 Indeed, for small- and medium-sizedfirms market-based and equity financing play a minor role2 to finance in-vestment projects.3
Finally, there is recent empirical evidence on the real-side implications ofcredit access, i.e. the use of credit lines, both in periods of easier credit andduring the financial crises. Campello et al. (2010) find that firms use availablecredit lines when the internal sources of financing are limited easing theprocess of corporate spending, even during a credit crunch. In a similar vein,Lins, Servaes and Tufano (2010) find that credit lines provide firms with theability to explore future business opportunities.
As a preview of the results, we show that the probability to innovate ofSMEs is positively influenced by many factors. Firstly, by the access to creditcaptured by a measure of credit availability and a measure of credit tightness;secondly by the loan size, i.e. the amount of granted credit by the bank forsuch investments. Thirdly, by the firm size, and lastly, by the firm location, i.e.being inside an industrial district fosters firm propensity to innovate.
The paper is organized as follows. Section one reviews the empirical liter-ature on innovative firms’ financial problems. Section two describes thedataset employed, while section three analyzes the empirical strategy, and sec-tion four discusses the main empirical findings. The last section concludes.
Journal of Industrial and Business Economics 29
A. Bellucci, I. Favaretto, G. Giombini Credit availability and propensity to innovate of SMEs
1. According to ECB (2009), the 32% of SMEs used a bank loan in the previous sixmonths, and the 30% used a bank over-draft or credit line. Leasing, hire purchase and fac-toring (used by 27%), and trade credit (15%) also played a relatively important role.2. Following the ECB (2009) only the 0.9% of small- and medium-sized firms issued debtsecurities and 1.3% issued equity or relied on external equity investors.3. Giudici and Paleari (2000), analyzing a sample of small- and medium-sized innovativeItalian firms, find support for the pecking order theory. Indeed, a firm owner’s wealth is themain source of funds, followed by short-term bank debt, whereas outside equity finance isused only if the new investors also provide new financial skills. Colombo and Grilli (2007)studying the determinants of financing sources of small-sized innovative Italian firms con-firmed the pecking order hypothesis. Indeed, only a small share of firms finances invest-ment projects by using external equity and the main financing source is the entrepreneur’spersonal wealth, followed by bank loans. Calcagnini, Favaretto and Giombini (2011) em-pirically analyze financial models of innovative firms in Italy, and find that only a smallnumber of interviewed firms have faced problems in raising external funds for innovation,even during the period of the economic and financial crisis.
Copyright © FrancoAngeli N.B: Copia ad uso personale. È vietata la riproduzione (totale o parziale) dell’opera con qualsiasi
mezzo effettuata e la sua messa a disposizione di terzi, sia in forma gratuita sia a pagamento.
FrancoAngeli

1. A short literature review
The financing of innovative investments has attracted great interest in theeconomic literature, and recently, some studies have started to analyze the linkbetween sources of financing and the firm’s propensity to innovate. Fromthese works it emerges that firms experience problems that prevent them frominvesting in innovation activities, and one of the more severe constraint theyface is, among others, the lack of appropriate financial sources (Canepa andStoneman, 2002; Mohnen and Röller 2005; Savignac, 2006).
More closely related to our idea on the importance of the banking channel tofinance innovative investments, some recent studies investigate the effect of thedevelopment of the local banking system and of the credit availability on theprobability of adoption of innovation by firms (Alessandrini, Presbitero andZazzaro, 2010; Benfratello, Schiantarelli and Sembenelli, 2008; Ferri and Ro-tondi, 2006; Herrera and Minetti, 2007). Using survey data on “Community In-novation Survey” and looking at the probability to introduce both process andproduct innovation, Benfratello, Schiantarelli and Sembenelli (2008) find a pos-itive effect of the bank branch density on the probability of introducing innova-tions. The latter is significantly higher for firms located in areas with higherbank branch density, and this effect is larger for small and high-tech firms thanfor the others. However, this evidence seems to be stronger for product innova-tion, while it is weaker for process innovation. In a similar vein, Herrera andMinetti (2007) using eighth Capitalia Survey find a positive relationship be-tween the probability of introducing innovation and the length of credit relation-ship with referred bank. Using a more recent version of data provided by Capi-talia Survey, Ferri and Rotondi (2006) confirm the previous study, corroboratingthe importance of the relationship with referred bank on the probability to intro-duce innovation processes. Alessandrini, Presbitero and Zazzaro (2010) analysethe effect of bank-size and bank-branch distance on the probability of small- andmedium-sized firms to adopt innovative processes at provincial level. Their re-sults show that the distance between banks decisional headquarters and localeconomies, as a measure of banks organizational structure, impacts negativelyon the probability of innovation. In particular, an increasing distance betweenbank’s headquarter and local branches significantly reduce the likelihood of lo-cal small- and medium-sized firms to introduce innovation, while the bank’s sizeon the adoption of process innovation seems to have a weak effect. Recently, Gi-annetti (2012) shows that relationship lending has negligible impact on the inno-vative activity of SMEs while plays an important role for firms operating inhigh-tech industries. Brancati (2014) using the MET survey on Italian firms per-formed in 2008, 2009 and 2011 finds that financial constraints strongly hamperfirms’ probability of introducing innovations.
30 Economia e Politica Industriale
A. Bellucci, I. Favaretto, G. Giombini Credit availability and propensity to innovate of SMEs
Copyright © FrancoAngeli N.B: Copia ad uso personale. È vietata la riproduzione (totale o parziale) dell’opera con qualsiasi
mezzo effettuata e la sua messa a disposizione di terzi, sia in forma gratuita sia a pagamento.
FrancoAngeli

Finally, Amore, Schneider and Zaldokas (2013) present evidence that bankingdevelopment plays a key role in technological progress. Focusing on manufactur-ing firms’ innovative performance, the authors find that the deregulation of bank-ing activities across US states during the 1980s and 1990s had significant benefi-cial effects on the quantity and quality of innovation activities, especially forfirms highly dependent on external capital and located closer to entering banks.
2. Dataset
2.1. Dataset description
To analyze whether firm’s probability to innovate depends on bank loanswe combine information from two distinct datasets. The first proprietarydataset collects information on credit lines granted mainly to SMEs, by a largeItalian bank belonging to a major Italian banking group quoted on the MilanStock Exchange. One of the bank’s core businesses is the provision of financ-ing to SMEs making this dataset ideal for the purposes of our analysis. Thesample includes the bank’s entire portfolio of credit lines as of September2004 and 2006, which was mainly concentrated in two Italian provinces.4 Theprovinces are also representative of the Italian economic structure, character-ized by the presence of a large number of SMEs.5 During the timeframe of ourstudy, the bank operates with sixty branches in both provinces.
Firms operate in more than twenty-three industry sectors defined at the2-digit level according to the Italian National Institute of Statistics (Istat). Thedataset contains information on loan contract terms (e.g. credit limit, interestrate), bank-borrower relationship (e.g. length and exclusivity, whether the bor-rower uses other services offered by the bank, rating, collateral, portfolio, de-cisional level, etc.), borrower characteristics (e.g. address, sales, industry sec-tor, juridical form, etc.), and characteristics of the local credit market and lend-ing branch (e.g. concentration, province, etc.).
The latter dataset provides information on firms, which engaged in innova-tive activities in 2004 and 2006 collected by the Regional Government Agency.
Journal of Industrial and Business Economics 31
A. Bellucci, I. Favaretto, G. Giombini Credit availability and propensity to innovate of SMEs
4. For the sake of confidentiality, we cannot reveal the Bank identity or the Region forwhich the data are available. Less than 4% of the credit lines are granted to firms located inother two neighboring provinces.5. Using GDP per capita in Italy in 2006 as a base of one hundred, both provinces areslightly richer than the average Italian province (110.3 and 101.2, respectively). In bothprovinces, the manufacturing sector contributes 30% of overall value added, services con-tribute 68%, and agriculture only 2% (for the aggregate Italian economy, these figures are27, 71 and 2%, respectively).
Copyright © FrancoAngeli N.B: Copia ad uso personale. È vietata la riproduzione (totale o parziale) dell’opera con qualsiasi
mezzo effettuata e la sua messa a disposizione di terzi, sia in forma gratuita sia a pagamento.
FrancoAngeli
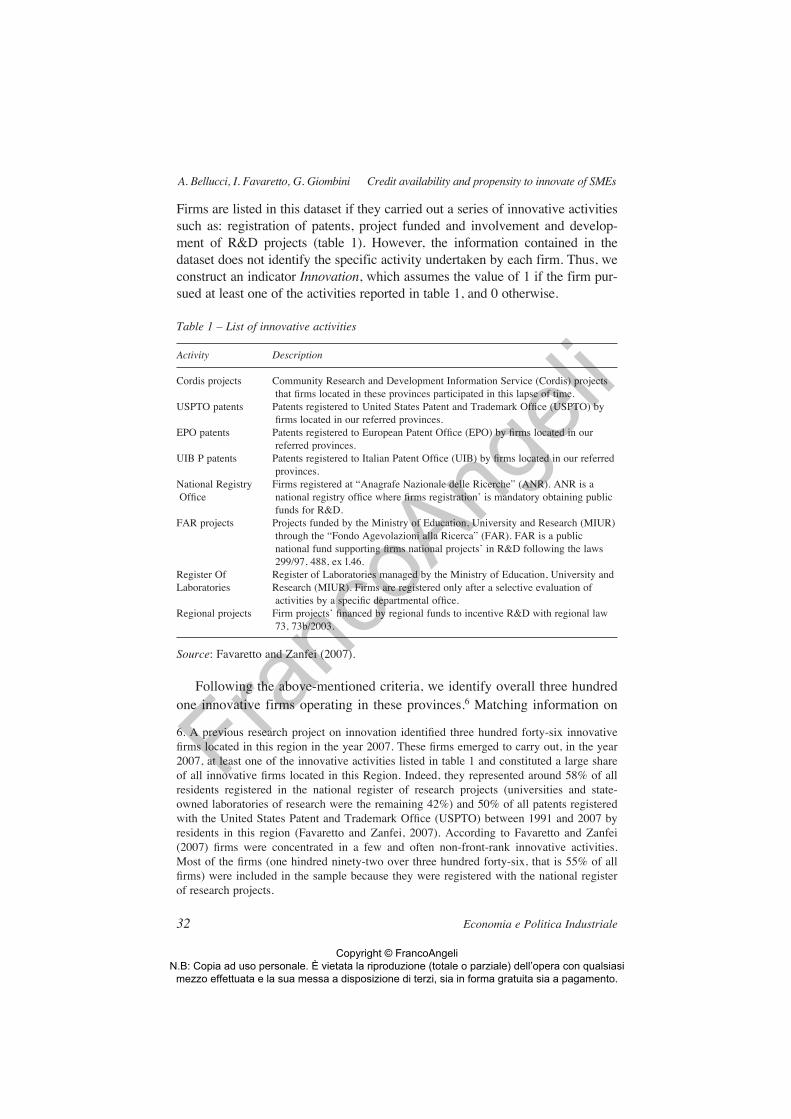
Firms are listed in this dataset if they carried out a series of innovative activitiessuch as: registration of patents, project funded and involvement and develop-ment of R&D projects (table 1). However, the information contained in thedataset does not identify the specific activity undertaken by each firm. Thus, weconstruct an indicator Innovation, which assumes the value of 1 if the firm pur-sued at least one of the activities reported in table 1, and 0 otherwise.
Table 1 – List of innovative activities
Activity Description
Cordis projects Community Research and Development Information Service (Cordis) projects that firms located in these provinces participated in this lapse of time.
USPTO patents Patents registered to United States Patent and Trademark Office (USPTO) by firms located in our referred provinces.
EPO patents Patents registered to European Patent Office (EPO) by firms located in our referred provinces.
UIB P patents Patents registered to Italian Patent Office (UIB) by firms located in our referred provinces.
National Registry Firms registered at “Anagrafe Nazionale delle Ricerche” (ANR). ANR is a Office national registry office where firms registration’ is mandatory obtaining public
funds for R&D. FAR projects Projects funded by the Ministry of Education, University and Research (MIUR)
through the “Fondo Agevolazioni alla Ricerca” (FAR). FAR is a public national fund supporting firms national projects’ in R&D following the laws 299/97, 488, ex l.46.
Register Of Register of Laboratories managed by the Ministry of Education, University and Laboratories Research (MIUR). Firms are registered only after a selective evaluation of
activities by a specific departmental office.Regional projects Firm projects’ financed by regional funds to incentive R&D with regional law
73, 73b/2003.
Source: Favaretto and Zanfei (2007).
Following the above-mentioned criteria, we identify overall three hundredone innovative firms operating in these provinces.6 Matching information on
32 Economia e Politica Industriale
A. Bellucci, I. Favaretto, G. Giombini Credit availability and propensity to innovate of SMEs
6. A previous research project on innovation identified three hundred forty-six innovativefirms located in this region in the year 2007. These firms emerged to carry out, in the year2007, at least one of the innovative activities listed in table 1 and constituted a large shareof all innovative firms located in this Region. Indeed, they represented around 58% of allresidents registered in the national register of research projects (universities and state-owned laboratories of research were the remaining 42%) and 50% of all patents registeredwith the United States Patent and Trademark Office (USPTO) between 1991 and 2007 byresidents in this region (Favaretto and Zanfei, 2007). According to Favaretto and Zanfei(2007) firms were concentrated in a few and often non-front-rank innovative activities.Most of the firms (one hindred ninety-two over three hundred forty-six, that is 55% of allfirms) were included in the sample because they were registered with the national registerof research projects.
Copyright © FrancoAngeli N.B: Copia ad uso personale. È vietata la riproduzione (totale o parziale) dell’opera con qualsiasi
mezzo effettuata e la sua messa a disposizione di terzi, sia in forma gratuita sia a pagamento.
FrancoAngeli

bank’s portfolio and firm innovation activities, we identify one hundred twen-ty-four bank-innovative firm relationships in 2006.
As our focus is on small business lending, we follow the EU definition ofsmall business enterprises and exclude from our dataset fifteen innovative bor-rowers with sales exceeding fifty million euros.7 Finally, other firms weredropped from the sample because of missing values in key explanatory vari-ables. Thus, our final sample contains ninety innovative and five thousandfour hundred forty-four non-innovative firms in 2006. In table 2 we report thedescriptive statistics of innovative and non-innovative firms while in the Ap-pendix we report the construction and definition of our variables.
Table 2 – Summary statistics. Innovative firms vs non-innovative firms
Variable Observations Mean Dev. st. Min. Max.
Innovative firmsCredit availability 90 0.97 0.18 0 1Credit tightness 90 0.53 0.31 0 1.09Interest rate 90 7.08 1.95 3.97 13.50Multilending 90 0.96 0.21 0.00 1.00Other services 90 0.98 0.14 0 1Turnover (millions of euro) 90 12.6 11,900,000 0.12 37.5Portfolio 90 0.51 0.50 0 1Leverage 90 0.23 0.74 0 6.52Total accorded (euro) 90 275,381 661,275 20 3,364,670Industrial district 90 0.81 0.39 0 1HHI 90 0.15 0.10 0.07 0.56Corporation 90 0.91 0.29 0 1Sales 90 4.42 1.17 1.00 6.00Distance 90 6,542.44 6,851.34 0 44,998Non-innovative firmsCredit availability 5,444 0.80 0.40 0 1Credit tightness 5,444 0.73 0.44 0 9Interest rate 5,444 7.34 2.18 3.70 13.50Multilending 5,444 0.94 0.24 0 1Other services 5,444 0.92 0.27 0 1Turnover (millions of euro) 5,444 2.60 6,314,637 0.12 37.5Portfolio 5,444 0.09 0.28 0 1Leverage 5,444 0.23 0.47 0.0003 14.40Total accorded (euro) 5,444 88,946.50 309,857.20 2.03 8,193,811Industrial district 5,444 0.60 0.49 0 1HHI 5,444 0.19 0.14 0.07 1Corporation 5,444 0.33 0.47 0 1Sales 5,444 2.19 1.47 1 6Distance 5,444 4,889.84 7,034.81 0 138,006
Source: our elaborations on own bank data.
Journal of Industrial and Business Economics 33
A. Bellucci, I. Favaretto, G. Giombini Credit availability and propensity to innovate of SMEs
7. The European Commission adopted the definition of small business enterprises in itsRecommendation of 6.5.2003 (GUCE L 124/36 of 20.5.2003).
Copyright © FrancoAngeli N.B: Copia ad uso personale. È vietata la riproduzione (totale o parziale) dell’opera con qualsiasi
mezzo effettuata e la sua messa a disposizione di terzi, sia in forma gratuita sia a pagamento.
FrancoAngeli

2.2. Explanatory variables
In this study we aim at testing the impact of bank funds on firms’ propensi-ty to innovate, and firms are considered innovative if they engage in one of theactivities listed in table 1. Thus, we firstly define two variables, Credit Avail-ability and Credit Tightness, which measure the availability of credit. Second-ly, as innovation might depend on various borrower and lender characteristics,we introduce a rich set of control variables related to borrower and lendingbranch characteristics.
The first explanatory variable we consider is Credit Availability, a dichoto-mous variable taking the value of 1 if a borrower has not experienced a creditrestriction and 0 otherwise. Credit restrictions are measured on the basis of theoverdraw practice, i.e. whether the borrower uses more than the amount grant-ed on the credit line by the bank.
In the time-lapse of our study, Italian credit lines provide borrowers with acertain degree of flexible use by either allowing them to not fully utilize the com-mitted credit, free of any charge, or overdraw up to a certain amount, subject tofees and penalty interest rates on the overdrawn part. Within our data, the fre-quency with which traditional firms experience credit restriction in the access tocredit is significantly higher respect to innovative ones (20% vs. 3.3%).
Alternatively, we measure firm access to bank credit with the variableCredit Tightness, which is a continuous variable that measures the percentageof credit line utilized on total amount granted by the bank, and we assume thehigher this percentage is, the higher the probability that the firm is experienc-ing binding credit limits. Descriptive statistics for this variable show that inno-vative firms seem to experience less binding credit limits than non-innovativefirms: the former use, on average, the 52% of the accorded amount of credit,while the average value of credit tightness for the latter is 72%.
Descriptive statistics of table 2 show relevant differences between innovativeand non-innovative firms in other loan characteristics. Thus, in our empiricalmodels we also control for the price of credit (Interest Rate) and the loan size (To-tal Accorded), which could reveal other aspects of the contract characteristics.The interest rate paid by innovative borrowers is, on average, approximatelytwenty-six basis points less than that paid by traditional ones (7.08 vs. 7.34). To-tal Accorded is a continuous variable that measures the total amount accorded bybank to firm. The average amount accorded by the bank is ninety-three thousandseventy-three euros. However, on average this amount is higher for innovativefirms than traditional one (three hundred forty-two thousand six hundred seventy-
34 Economia e Politica Industriale
A. Bellucci, I. Favaretto, G. Giombini Credit availability and propensity to innovate of SMEs
8. In the empirical analysis we opted to use as explanatory variable the natural logarithm ofthe total amount accorded to the firm.
Copyright © FrancoAngeli N.B: Copia ad uso personale. È vietata la riproduzione (totale o parziale) dell’opera con qualsiasi
mezzo effettuata e la sua messa a disposizione di terzi, sia in forma gratuita sia a pagamento.
FrancoAngeli

eight euros vs. eighty-eight thousand nine hundred forty-six euros).8We also introduce two measures intended to capture the nature of the bank-
borrower lending relationship. First Other Services considers the scope of thebank-borrower interaction (Cole and Wolken, 1995). This is a dummy variabletakes the value of 1 if the firm uses additional services provided by the bankand 0 otherwise. 92,2% of firms utilizes other financial services from thisbank. However, innovative firms tend to use more of these services from thebank respect to traditional counterpart (97,8% vs. 92.1%). Second, MultipleLending is a dummy variable designed to capture the exclusivity of the rela-tionship. The variable takes the value of 1 if the firm borrows from multiplebanks and 0 if the borrower has an exclusive relationship with our bank. In oursample, only 4,4% of the firms have an exclusive lending relationship with thebank and we do not notice differences between innovative and traditionalfirms.9
Our empirical analysis takes into account firm characteristics. Larger firmsusually have more internal resources and are less credit constrained, and havesize advantages in terms of internal knowledge, financial resources for innova-tion, and market power (Cohen and Klepper, 1996).
Thus, we expect that these firms have a higher probability of undertakinginvestment projects and, more specifically, should show a higher propensity toinnovate. Indeed, previous studies find that innovation, measured by R&D, in-creases with firm size (Scherer, 1965). Vaona and Pianta, (2008) find thatproduct innovation is explained by a growth-oriented strategy, while processinnovation is associated to the acquisition of new machinery. The authors ar-gue that these distinct models identify two trajectories for innovation, althoughsome complementarities exist and they are stronger for large firms.
Thus, we use borrower’s total sales as a proxy of firm size. The bank onlyprovides sales categories rather than exact sales amounts, and in terms of aver-age Turnover innovative firms are significantly greater than the traditionalones, (on average 12.6 vs. 2.6 millions of euro, see table 2).
Thus, we construct a step variable considering six categories of sales,and we measure firm size by means of a set of dummy variables D (Sale_n)that take the value of 1 if the firm total sales fall in the n-th category and 0otherwise.
To take in account for the organizational structure and decision makingprocess of the bank (e.g., Liberti and Mian, 2009), we include the variablePortfolio that identifies the bank’s operating segments in which the borrowersfall. Specifically, the variable takes the value of 1 if the bank considers thecredit line as part of its small business market and 0 if it is part of its corporate
Journal of Industrial and Business Economics 35
A. Bellucci, I. Favaretto, G. Giombini Credit availability and propensity to innovate of SMEs
9. This variable is actually dropped from the sample during the estimation procedure.
Copyright © FrancoAngeli N.B: Copia ad uso personale. È vietata la riproduzione (totale o parziale) dell’opera con qualsiasi
mezzo effettuata e la sua messa a disposizione di terzi, sia in forma gratuita sia a pagamento.
FrancoAngeli
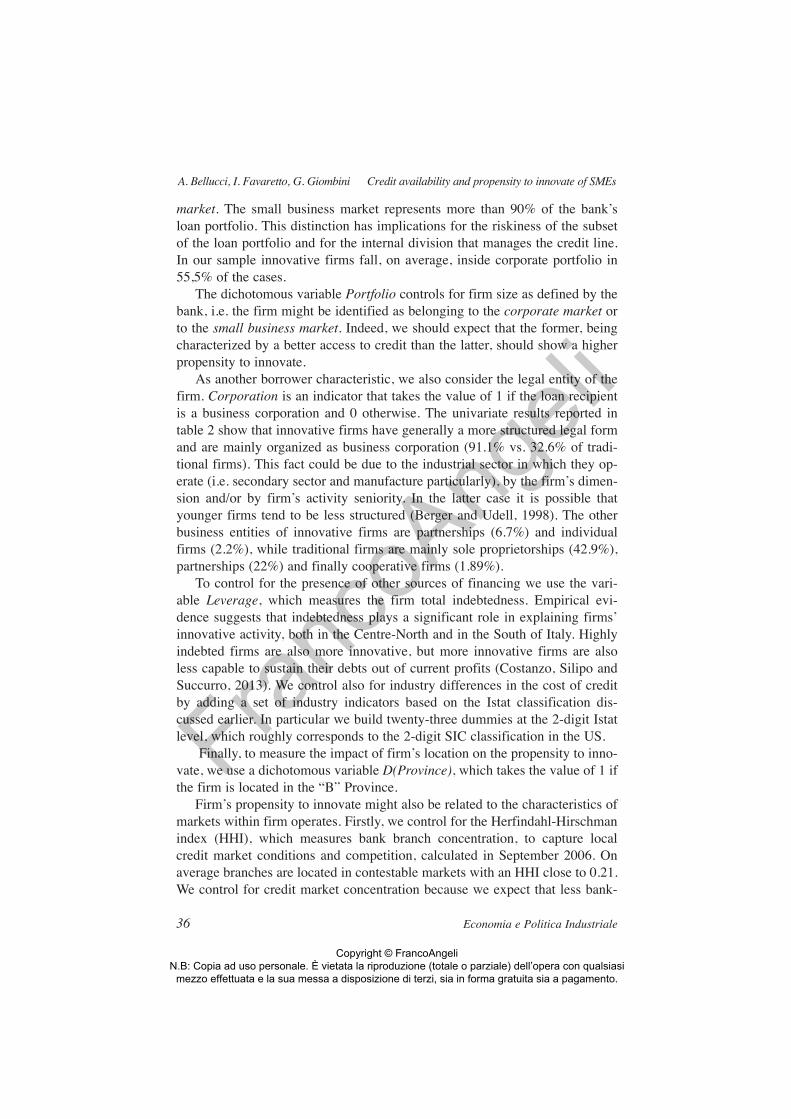
market. The small business market represents more than 90% of the bank’sloan portfolio. This distinction has implications for the riskiness of the subsetof the loan portfolio and for the internal division that manages the credit line.In our sample innovative firms fall, on average, inside corporate portfolio in55,5% of the cases.
The dichotomous variable Portfolio controls for firm size as defined by thebank, i.e. the firm might be identified as belonging to the corporate market orto the small business market. Indeed, we should expect that the former, beingcharacterized by a better access to credit than the latter, should show a higherpropensity to innovate.
As another borrower characteristic, we also consider the legal entity of thefirm. Corporation is an indicator that takes the value of 1 if the loan recipientis a business corporation and 0 otherwise. The univariate results reported intable 2 show that innovative firms have generally a more structured legal formand are mainly organized as business corporation (91.1% vs. 32.6% of tradi-tional firms). This fact could be due to the industrial sector in which they op-erate (i.e. secondary sector and manufacture particularly), by the firm’s dimen-sion and/or by firm’s activity seniority. In the latter case it is possible thatyounger firms tend to be less structured (Berger and Udell, 1998). The otherbusiness entities of innovative firms are partnerships (6.7%) and individualfirms (2.2%), while traditional firms are mainly sole proprietorships (42.9%),partnerships (22%) and finally cooperative firms (1.89%).
To control for the presence of other sources of financing we use the vari-able Leverage, which measures the firm total indebtedness. Empirical evi-dence suggests that indebtedness plays a significant role in explaining firms’innovative activity, both in the Centre-North and in the South of Italy. Highlyindebted firms are also more innovative, but more innovative firms are alsoless capable to sustain their debts out of current profits (Costanzo, Silipo andSuccurro, 2013). We control also for industry differences in the cost of creditby adding a set of industry indicators based on the Istat classification dis-cussed earlier. In particular we build twenty-three dummies at the 2-digit Istatlevel, which roughly corresponds to the 2-digit SIC classification in the US.
Finally, to measure the impact of firm’s location on the propensity to inno-vate, we use a dichotomous variable D(Province), which takes the value of 1 ifthe firm is located in the “B” Province.
Firm’s propensity to innovate might also be related to the characteristics ofmarkets within firm operates. Firstly, we control for the Herfindahl-Hirschmanindex (HHI), which measures bank branch concentration, to capture localcredit market conditions and competition, calculated in September 2006. Onaverage branches are located in contestable markets with an HHI close to 0.21.We control for credit market concentration because we expect that less bank-
36 Economia e Politica Industriale
A. Bellucci, I. Favaretto, G. Giombini Credit availability and propensity to innovate of SMEs
Copyright © FrancoAngeli N.B: Copia ad uso personale. È vietata la riproduzione (totale o parziale) dell’opera con qualsiasi
mezzo effettuata e la sua messa a disposizione di terzi, sia in forma gratuita sia a pagamento.
FrancoAngeli

ing competition stimulate relation-based lending and facilitates the funding ofopaque borrowers/projects (Cetorelli, 1999; Petersen and Rajan, 1995). Fur-thermore, Alessandrini, Presbitero and Zazzaro (2010) find that small andmedium enterprises located in more concentrated credit markets have a higherprobability of introducing innovation.
Secondly, to consider for differences in the specialization of the borrower,we introduce a dummy variable Industrial District that takes the value of 1 ifthe borrower is located in an industrial district and 0 otherwise. From table 2we note that on average the presence of innovative firms within an industrialdistrict is higher than that of traditional ones (81% vs. 60% respectively).
Within the Italian industrial districts, there is a significant level of variety,specialization and selection, and the engine of the introduction of innovationin local firms is typically represented by social and technical interactions(Belussi and Pilotti, 2002). Thus, on the one side, we could expect a positivecorrelation between the innovative processes and the fact that the firm belongsto the industrial district. However, on the other side, it has been found thatfirms belonging the industrial district invest in exploiting the networks of cre-ativity to support product innovation, while science-driven innovation seemsto be predominant for firms not embedded in districts (Chiarvesio and DiMaria, 2009).
Finally, we also control for the operative distance between the firm and thebank by means of the variable Distance. Indeed, firm propensity to innovatecould be positively affected by proximity of financial resources. The underlinerationale is that the lower the distance, the higher the flow of soft informationfrom the borrower to the bank and the better the access to credit and the termsof loan (Bellucci, Borisov and Zazzaro, 2013). Thus, we should expect a neg-ative estimated coefficient for this variable. Previous studies found a negativeimpact of the functional distance (i.e. bank-branch distance) on innovationadoption by SMEs (Alessandrini, Presbitero and Zazzaro, 2010).
3. Empirical strategy
3.1. Reverse causation and endogeneity
To deal with our central research question, i.e. whether bank loans canstimulate innovative activities, we need to control for possible endogeneityand reverse causation problems between innovation and credit access.
Indeed, two issues deserve attention. First, is has been shown that the inno-vative nature of firms might influence firm access to credit (Bellucci, Favaret-to and Giombini, 2014; Czarnitzki and Hottenrott, 2011; Freel, 2007) and that
Journal of Industrial and Business Economics 37
A. Bellucci, I. Favaretto, G. Giombini Credit availability and propensity to innovate of SMEs
Copyright © FrancoAngeli N.B: Copia ad uso personale. È vietata la riproduzione (totale o parziale) dell’opera con qualsiasi
mezzo effettuata e la sua messa a disposizione di terzi, sia in forma gratuita sia a pagamento.
FrancoAngeli

the financing of innovative firms may be particularly difficult and onerous dueto the presence of tougher moral hazard problems, riskier activity, lower col-lateral in innovative firms with respect to traditional ones (Hall, 2009). Thus,debt might be a less suitable source of financing than other sources to financeinnovative, small-sized firms, especially during their start-up phase (Jensenand Meckling, 1976).
Indeed, the economic conditions, industry characteristics, and unobservedfactors could influence both firms' innovation and credit availability, thus bias-ing the effect of finance on technological progress (Amore, Schneider and Zal-dokas, 2013). Thus, to overcome the potential endogeneity that could affectour estimates, a second argument needs to be addressed.
The second consideration concerns the criteria used by the Regional Gov-ernment Agency to select firms in the innovation dataset. Basically, a firm isincluded into the dataset if the innovation activity (e.g., registration of patent)is actually concluded. As there is generally a lapse of time between the stageat which the firm gets the loan and the stage at which the innovation activity isfully undertaken, the firm needs foremost financial resources to fully imple-ment such innovation activities.
Thus, in order to gauge a causal effect of bank credit availability on innov-ative activity and to control for the timing of the investment in innovative ac-tivities, the identification strategy relies on the availability of data for twoyears, 2004 and 2006. Specifically, the empirical equations test whether theavailability of credit in the former year affects firm propensity to innovate inthe latter year.
3.2. The models
We estimate two alternative models. The first model assumes that the prob-ability that the firm undertakes innovative activities depends not only on firm-and market-specific characteristics, but also on bank credit availability and onother characteristics of the bank loan, such as its costs. The empirical equationof model [1] takes the following form:
[1]
where i refers to firms and Firm, Market, and Bank are vectors of charac-teristics related to the firm profile (sales, activity sector, organizational form,leverage, etc..), local credit market (concentration, industrial district) the bank-firm relationship (services, exclusivity of relationship, interest rate, loan size,
38 Economia e Politica Industriale
A. Bellucci, I. Favaretto, G. Giombini Credit availability and propensity to innovate of SMEs
Copyright © FrancoAngeli N.B: Copia ad uso personale. È vietata la riproduzione (totale o parziale) dell’opera con qualsiasi
mezzo effettuata e la sua messa a disposizione di terzi, sia in forma gratuita sia a pagamento.
FrancoAngeli

etc..), as described in section two. The second model relates firm propensity to innovate to firm-, loan- and
market-specific characteristics, and to a measure of credit restrictions, i.e.Credit Tightness. The empirical equation of model [2] takes the followingform:
[2]
where i refers to firms, and vectors Firm, Market and Bank contain thesame set of characteristics as in model [1].
In a limited dependent variable setting, we first assume a linear probability(LP) model, according to which the dichotomous Innovation variable is a lin-ear function of the independent variables (i.e.: Φ = 1). In large samples, thestatistical inference of the LP Model follows the OLS procedures under thenormality assumption. Within this framework, the slope coefficient measuresdirectly the change in the probability of undertaking innovative activities (i.e.,Innovation = 1) as a result of a unit change in the value of a regressor. How-ever, there is a major problem with the OLS estimation of the LP model, i.e.the estimated coefficients do not necessarily lie between the [0, 1] range.Therefore, we in turn show estimated coefficients of model [1] obtained by aprobit estimation (i.e.: Φ(.) is assumed to be the CDF of the standard normaldistribution), and a logit estimation (i.e.: Φ(.) is assumed to be the CDF of thelogistic distribution). Within these settings, the relationship between the prob-ability of undertaking innovative activities and the vectors of variates is non-linear. All models are estimated with standard error clustered at bank branchlevel.
4. Results
4.1. Main findings
Column (1) of table 3 shows the estimates of a baseline version of the lin-ear probability model [1], in which the probability that Innovation is equal to 1depends on Credit Availability and by the following firm characteristics: firmsize (D (Sales_n)), industry (Industry Dummy) and location (Province). Find-ings suggest that, as expected, the credit availability affects positively firmpropensity to innovate, as the estimated coefficient of Credit Availability ispositive and statistically significant. The estimated coefficient suggests that afirm, which does not experience overdraw in the year 2004 has, on average, a
Journal of Industrial and Business Economics 39
A. Bellucci, I. Favaretto, G. Giombini Credit availability and propensity to innovate of SMEs
Copyright © FrancoAngeli N.B: Copia ad uso personale. È vietata la riproduzione (totale o parziale) dell’opera con qualsiasi
mezzo effettuata e la sua messa a disposizione di terzi, sia in forma gratuita sia a pagamento.
FrancoAngeli
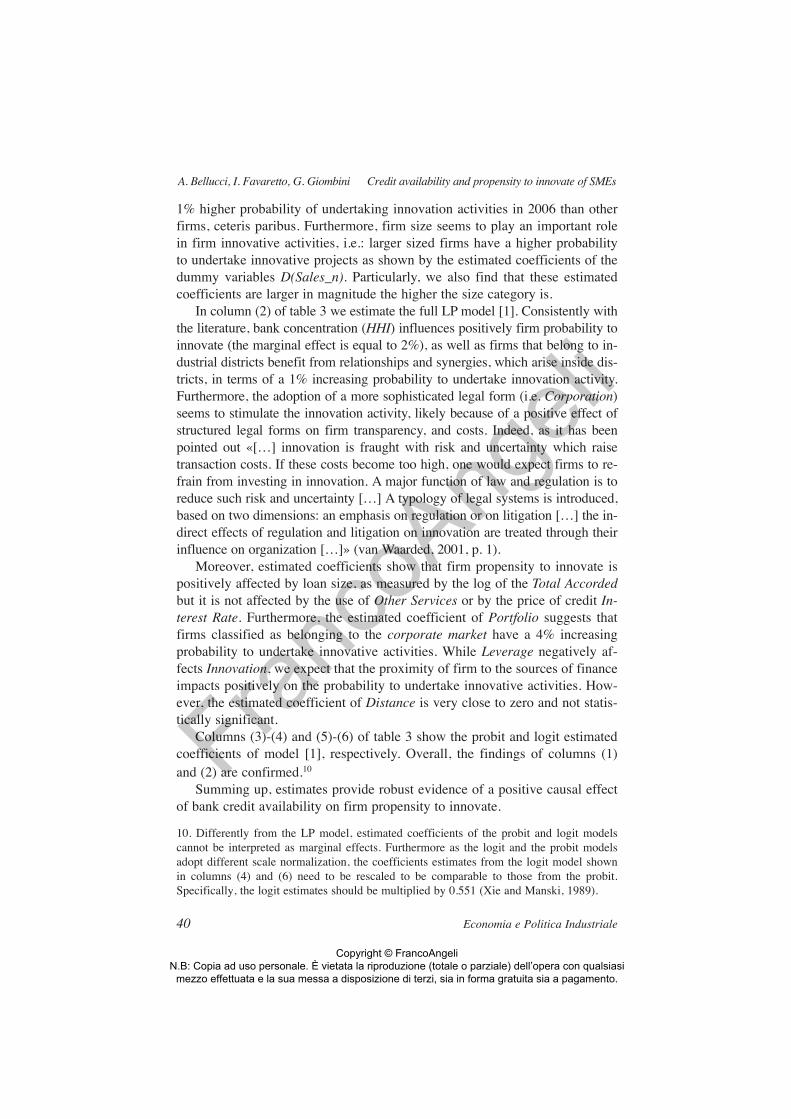
1% higher probability of undertaking innovation activities in 2006 than otherfirms, ceteris paribus. Furthermore, firm size seems to play an important rolein firm innovative activities, i.e.: larger sized firms have a higher probabilityto undertake innovative projects as shown by the estimated coefficients of thedummy variables D(Sales_n). Particularly, we also find that these estimatedcoefficients are larger in magnitude the higher the size category is.
In column (2) of table 3 we estimate the full LP model [1]. Consistently withthe literature, bank concentration (HHI) influences positively firm probability toinnovate (the marginal effect is equal to 2%), as well as firms that belong to in-dustrial districts benefit from relationships and synergies, which arise inside dis-tricts, in terms of a 1% increasing probability to undertake innovation activity.Furthermore, the adoption of a more sophisticated legal form (i.e. Corporation)seems to stimulate the innovation activity, likely because of a positive effect ofstructured legal forms on firm transparency, and costs. Indeed, as it has beenpointed out «[…] innovation is fraught with risk and uncertainty which raisetransaction costs. If these costs become too high, one would expect firms to re-frain from investing in innovation. A major function of law and regulation is toreduce such risk and uncertainty […] A typology of legal systems is introduced,based on two dimensions: an emphasis on regulation or on litigation […] the in-direct effects of regulation and litigation on innovation are treated through theirinfluence on organization […]» (van Waarded, 2001, p. 1).
Moreover, estimated coefficients show that firm propensity to innovate ispositively affected by loan size, as measured by the log of the Total Accordedbut it is not affected by the use of Other Services or by the price of credit In-terest Rate. Furthermore, the estimated coefficient of Portfolio suggests thatfirms classified as belonging to the corporate market have a 4% increasingprobability to undertake innovative activities. While Leverage negatively af-fects Innovation, we expect that the proximity of firm to the sources of financeimpacts positively on the probability to undertake innovative activities. How-ever, the estimated coefficient of Distance is very close to zero and not statis-tically significant.
Columns (3)-(4) and (5)-(6) of table 3 show the probit and logit estimatedcoefficients of model [1], respectively. Overall, the findings of columns (1)and (2) are confirmed.10
Summing up, estimates provide robust evidence of a positive causal effectof bank credit availability on firm propensity to innovate.
40 Economia e Politica Industriale
A. Bellucci, I. Favaretto, G. Giombini Credit availability and propensity to innovate of SMEs
10. Differently from the LP model, estimated coefficients of the probit and logit modelscannot be interpreted as marginal effects. Furthermore as the logit and the probit modelsadopt different scale normalization, the coefficients estimates from the logit model shownin columns (4) and (6) need to be rescaled to be comparable to those from the probit.Specifically, the logit estimates should be multiplied by 0.551 (Xie and Manski, 1989).
Copyright © FrancoAngeli N.B: Copia ad uso personale. È vietata la riproduzione (totale o parziale) dell’opera con qualsiasi
mezzo effettuata e la sua messa a disposizione di terzi, sia in forma gratuita sia a pagamento.
FrancoAngeli

Table 3 – The impact of credit availability on firm propensity to innovate. Full sampleanalysis°
LP model Probit model Logit modelDependent variable: (1) (2) (3) (4) (5) (6)innovation
Credit availability 0.01*** 0.01** 0.66*** 0.69*** 1.38*** 1.41***(0.002) (0.002) (0.198) (0.200) (0.510) (0.478)
Industrial district 0.01** 0.37*** 0.63**(0.004) (0.139) (0.314)
HHI 0.02** 0.53 1.55(0.010) (0.536) (1.089)
Corporation 0.02*** 0.55*** 1.42***(0.005) (0.185) (0.484)
Portfolio 0.04*** 0.24 0.50*(0.013) (0.145) (0.277)
Other services 0.002 0.12 0.13(0.004) (0.290) (0.740)
Total accorded (log) 0.003** 0.12*** 0.27***(0.002) (0.042) (0.072)
Interest Rate 0.001 0.03* 0.06**(0.001) (0.015) (0.032)
Leverage - 0.01** - 0.01 - 0.01(0.002) (0.058) (0.115)
Distance 0.0000002 0.0001*** 0.0003***(0.0000002) (0.00001) (0.00001)
D(Sales_2)- 0.00 - 0.01** 0.52* 0.32 1.52* 0.96(0.003) (0.003) (0.301) (0.296) (0.805) (0.822)
D(Sales_3) 0.00 - 0.01** 0.69** 0.38 1.91*** 1.01(0.005) (0.004) (0.270) (0.267) (0.705) (0.720)
D(Sales_4) 0.02*** 0.00 1.24*** 0.69*** 3.15*** 1.76***(0.008) (0.006) (0.215) (0.217) (0.578) (0.593)
D(Sales_5) 0.06*** 0.02 1.61*** 0.82*** 3.95*** 1.96***(0.014) (0.019) (0.171) (0.270) (0.500) (0.674)
D(Sales_6) 0.10*** 0.03 1.72*** 0.80*** 4.14*** 1.88***(0.030) (0.028) (0.149) (0.224) (0.410) (0.544)
Province - 0.02*** - 0.02*** - 1.26*** - 1.44*** - 2.85*** - 3.33***(0.003) (0.004) (0.209) (0.235) (0.577) (0.679)
Costant - 0.01** - 0.06*** - 8.50*** - 10.77 - 20.92*** - 25.96***(0.003) (0.016) (0.445) (0.000) (0.843) (1.118)
Industry specific effect yes yes yes yes yes yesNumber of observations 5,534 5,534 5,534 5,534 5,534 5,534
° the table presents multivariate analysis of the impact of Credit Availability on firm propensityto innovate (model [1]). Columns (1) (3) and (5) shows results from a baseline LP, probit, andlogit model, respectively, with dependent variable Innovation, which takes the value of 1 if thefirm carries on an innovative activity and 0 otherwise. Innovative activities are listed in table 1.Columns (2), (4) and (6) show results from augmented LP, probit, and logit models, respec-tively. The table reports point estimates of the coefficients, followed in parentheses by robuststandard errors, clustered at branch level. The definition and construction of the variables isprovided in the Appendix. * = p < 0.1, ** = p < 0.05, *** = p < 0.01.Source: our elaborations on own bank data.
Journal of Industrial and Business Economics 41
A. Bellucci, I. Favaretto, G. Giombini Credit availability and propensity to innovate of SMEs
Copyright © FrancoAngeli N.B: Copia ad uso personale. È vietata la riproduzione (totale o parziale) dell’opera con qualsiasi
mezzo effettuata e la sua messa a disposizione di terzi, sia in forma gratuita sia a pagamento.
FrancoAngeli

Table 4 – The impact of credit tightness on firm propensity to innovate. Full sample analysis°
LP model Probit model Logit modelDependent variable: (1) (2) (3) (4) (5) (6)innovation
Credit tightness - 0.01** - 0.01** - 0.35** - 0.37** - 0.69** - 0.72**(0.003) (0.003) (0.153) (0.166) (0.345) (0.361)
Industrial district 0.01** 0.37*** 0.65**(0.004) (0.135) (0.311)
HHI 0.02** 0.60 1.76(0.010) (0.531) (1.100)
Corporation 0.02*** 0.54*** 1.39***(0.005) (0.180) (0.474)
Portfolio 0.04*** 0.19 0.40(0.013) (0.155) (0.300)
Other services 0.00 0.07 - 0.01(0.004) (0.287) (0.735)
Total accorded (log) 0.00*** 0.15*** 0.32***(0.002) (0.042) (0.073)
Interest rate 0.00 0.02 0.06*(0.001) (0.015) (0.031)
Leverage - 0.01** - 0.02 - 0.02(0.002) (0.058) (0.119)
Distance 0.00 0.00*** 0.00***(0.000) (0.000) (0.000)
D(Sales_2)- 0.00 - 0.01** 0.51* 0.29 1.53* 0.94(0.003) (0.003) (0.302) (0.290) (0.807) (0.805)
D(Sales_3) 0.00 - 0.01** 0.68** 0.35 1.94*** 1.00(0.005) (0.004) (0.266) (0.260) (0.701) (0.711)
D(Sales_4) 0.02*** 0.00 1.22*** 0.63*** 3.16*** 1.70***(0.008) (0.006) (0.212) (0.210) (0.576) (0.587)
D(Sales_5) 0.06*** 0.01 1.58*** 0.77*** 3.95*** 1.94***(0.014) (0.018) (0.164) (0.271) (0.492) (0.682)
D(Sales_6) 0.10*** 0.03 1.73*** 0.79*** 4.21*** 1.92***(0.030) (0.028) (0.149) (0.227) (0.418) (0.577)
Province - 0.02*** - 0.02*** - 1.22*** - 1.39*** - 2.83*** - 3.26***(0.003) (0.004) (0.212) (0.238) (0.582) (0.677)
Costant 0.00 - 0.05*** - 6.48*** - 9.08*** - 18.51*** - 24.57***(0.004) (0.017) (0.139) (0.443) (0.529) (0.847)
Industry specific effect yes yes yes yesNumber of observations 5,534 5,534 5,534 5,534 5,534 5,534
° the table presents multivariate analysis of the impact of Credit Tightness on firmpropensity to innovate (model [2]). Columns (1) (3) and (5) shows results from a base-line LP, probit, and logit model, respectively, with dependent variable Innovation,which takes the value of 1 if the firm carries on an innovative activity and 0 otherwise.Innovative activities are listed in table 1. Columns (2), (4) and (6) show results fromaugmented LP, probit, and logit models, respectively. The table reports point estimates ofthe coefficients, followed in parentheses by robust standard errors, clustered at branch lev-el. The definition and construction of the variables is provided in the Appendix. * = p < 0.1,** = p < 0.05, *** = p < 0.01.Source: our elaborations on own bank data.
42 Economia e Politica Industriale
A. Bellucci, I. Favaretto, G. Giombini Credit availability and propensity to innovate of SMEs
Copyright © FrancoAngeli N.B: Copia ad uso personale. È vietata la riproduzione (totale o parziale) dell’opera con qualsiasi
mezzo effettuata e la sua messa a disposizione di terzi, sia in forma gratuita sia a pagamento.
FrancoAngeli
For robustness checks table 4 shows estimated coefficients of model [2],which relates firm propensity to innovate to credit restrictions, as measured bythe variable Credit Tightness, and firm-, bank- and contract-specific character-istics. Columns (1)-(2), (3)-(4), and (5)-(6) of table 4 refer to a baseline and afull specification of a LP, probit, and logit model, respectively. Overall, esti-mates suggest that the higher is the credit tightness the lower the probabilitythat firms innovate. As for the impact of other characteristics, previous find-ings of table 3 are confirmed, i.e.: firms characterized by larger-sized, andwith more structured legal form have a higher propensity to innovation thanthe others, as well as the firms which operate inside an industrial district or inmore concentrated credit markets. Finally, the size of the loan matters, andlarger loans affect positively firm propensity to innovate.
4.2. Stratified sample analysis
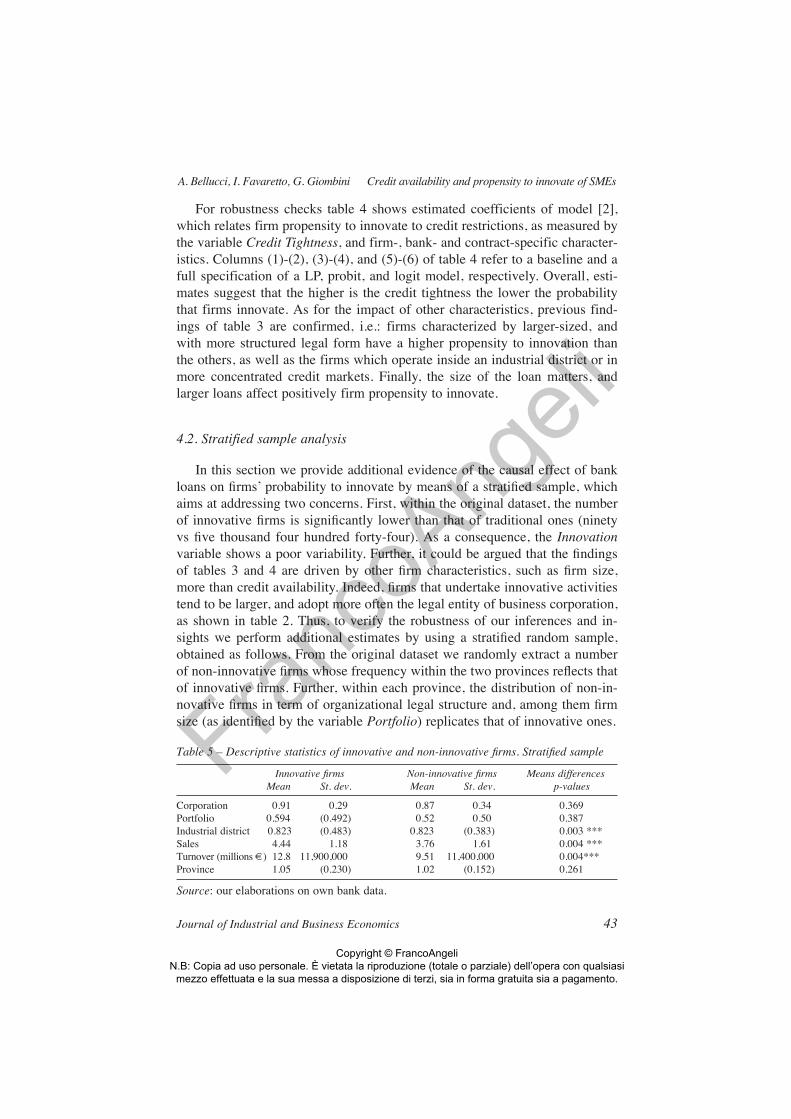
In this section we provide additional evidence of the causal effect of bankloans on firms’ probability to innovate by means of a stratified sample, whichaims at addressing two concerns. First, within the original dataset, the numberof innovative firms is significantly lower than that of traditional ones (ninetyvs five thousand four hundred forty-four). As a consequence, the Innovationvariable shows a poor variability. Further, it could be argued that the findingsof tables 3 and 4 are driven by other firm characteristics, such as firm size,more than credit availability. Indeed, firms that undertake innovative activitiestend to be larger, and adopt more often the legal entity of business corporation,as shown in table 2. Thus, to verify the robustness of our inferences and in-sights we perform additional estimates by using a stratified random sample,obtained as follows. From the original dataset we randomly extract a numberof non-innovative firms whose frequency within the two provinces reflects thatof innovative firms. Further, within each province, the distribution of non-in-novative firms in term of organizational legal structure and, among them firmsize (as identified by the variable Portfolio) replicates that of innovative ones.
Table 5 – Descriptive statistics of innovative and non-innovative firms. Stratified sample
Innovative firms Non-innovative firms Means differencesMean St. dev. Mean St. dev. p-values
Corporation 0.91 0.29 0.87 0.34 0.369Portfolio 0.594 (0.492) 0.52 0.50 0.387Industrial district 0.823 (0.483) 0.823 (0.383) 0.003 ***Sales 4.44 1.18 3.76 1.61 0.004 ***Turnover (millions €) 12.8 11,900,000 9.51 11,400,000 0.004***Province 1.05 (0.230) 1.02 (0.152) 0.261
Source: our elaborations on own bank data.
Journal of Industrial and Business Economics 43
A. Bellucci, I. Favaretto, G. Giombini Credit availability and propensity to innovate of SMEs
Copyright © FrancoAngeli N.B: Copia ad uso personale. È vietata la riproduzione (totale o parziale) dell’opera con qualsiasi
mezzo effettuata e la sua messa a disposizione di terzi, sia in forma gratuita sia a pagamento.
FrancoAngeli

Table 6 – The impact of credit availability on firm propensity to innovate. Stratified sampleanalysis°
LP model Probit model Logit modelDependent variable: (1) (2) (3) (4) (5) (6)innovation
Credit availability 0.25*** 0.26*** 0.96*** 1.07*** 1.57*** 1.86***(0.070) (0.071) (0.293) (0.332) (0.513) (0.609)
Industrial district 0.12 0.49* 0.89*(0.080) (0.288) (0.512)
HHI 0.02 0.63 0.74(0.233) (0.801) (1.430)
Corporation - 0.08 - 0.41 - 0.61(0.118) (0.423) (0.835)
Portfolio - 0.31*** - 1.11*** - 2.08***(0.103) (0.334) (0.701)
Other services - 0.04 0.03 0.04(0.143) (0.576) (0.949)
Total accorded (log) 0.06* 0.24** 0.44**(0.031) (0.114) (0.192)
Interest rate 0.01 0.02 0.02(0.012) (0.040) (0.073)
Leverage - 0.01 - 0.04 - 0.05(0.017) (0.076) (0.134)
Distance 0.00 0.00 0.00(0.000) (0.000) (0.000)
D(Sales_2) 0.03 - 0.00 0.20 0.03 0.32 - 0.07(0.145) (0.140) (0.573) (0.633) (1.021) (1.110)
D(Sales_3) 0.11 0.04 0.50 0.29 0.74 0.25(0.130) (0.142) (0.509) (0.536) (0.911) (0.950)
D(Sales_4) 0.13 0.12 0.57 0.55 0.93 0.86(0.101) (0.118) (0.412) (0.469) (0.742) (0.789)
D(Sales_5) 0.14* 0.31*** 0.61* 1.20*** 0.98 2.00***(0.082) (0.107) (0.349) (0.421) (0.631) (0.728)
D(Sales_6) 0.08 0.26* 0.39 0.99* 0.57 1.61*(0.103) (0.130) (0.402) (0.508) (0.722) (0.878)
Province - 0.28** - 0.29* - 0.99** - 1.27** - 1.59** - 2.00**(0.134) (0.150) (0.475) (0.518) (0.811) (0.876)
Costant - 0.25*** - 0.91** - 5.58*** - 8.44*** - 15.12*** - 20.41***(0.070) (0.416) (0.367) (1.411) (1.131) (2.767)
Industry specific effect yes yes yes yes yes yesNumber of observations 211 211 211 211 211 211
° the table presents multivariate analysis of the impact of Credit Availability on firm propensi-ty to innovate (model [1]). Columns (1) (3) and (5) shows results from a baseline LP, probit,and logit model, respectively, with dependent variable Innovation, which takes the value of 1if the firm carries on an innovative activity and 0 otherwise. Innovative activities are listed intable 1. Columns (2), (4) and (6) show results from augmented LP, probit, and logit models,respectively. The table reports point estimates of the coefficients, followed in parentheses byrobust standard errors, clustered at branch level. The definition and construction of the vari-ables is provided in the Appendix. * = p < 0.1, ** = p < 0.05, *** = p < 0.01.Source: our elaborations on own bank data.
44 Economia e Politica Industriale
A. Bellucci, I. Favaretto, G. Giombini Credit availability and propensity to innovate of SMEs
Copyright © FrancoAngeli N.B: Copia ad uso personale. È vietata la riproduzione (totale o parziale) dell’opera con qualsiasi
mezzo effettuata e la sua messa a disposizione di terzi, sia in forma gratuita sia a pagamento.
FrancoAngeli
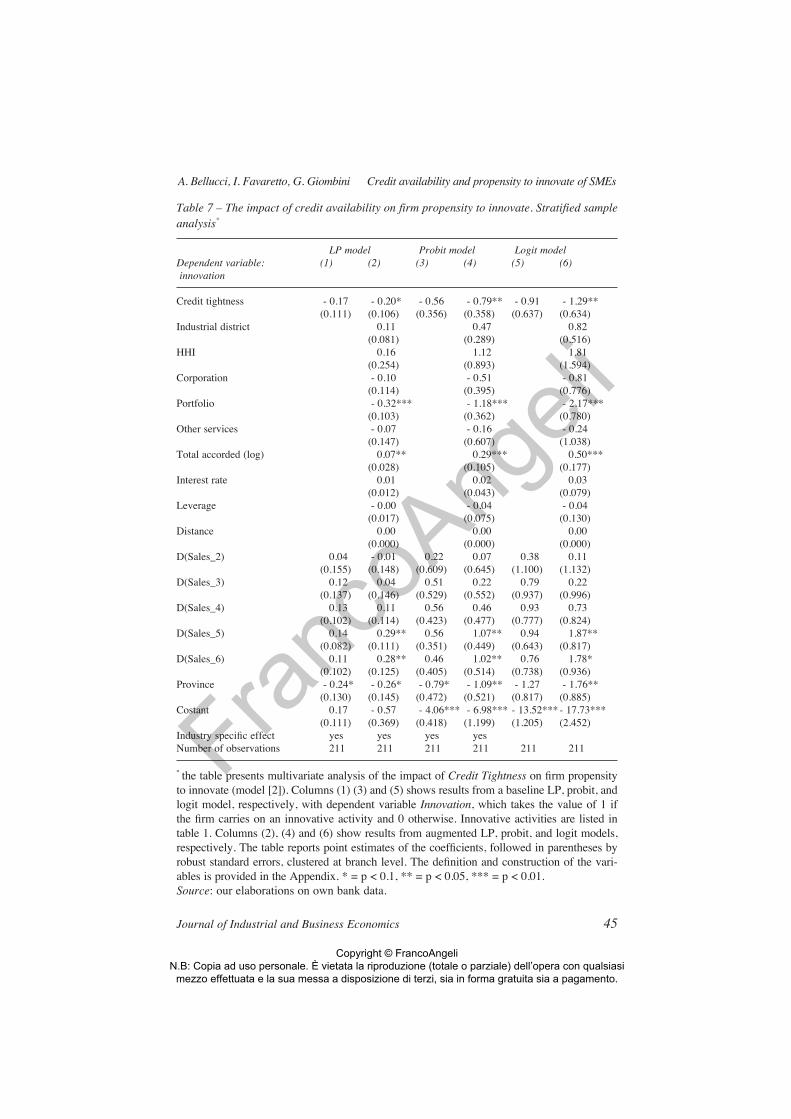
Table 7 – The impact of credit availability on firm propensity to innovate. Stratified sampleanalysis°
LP model Probit model Logit modelDependent variable: (1) (2) (3) (4) (5) (6)innovation
Credit tightness - 0.17 - 0.20* - 0.56 - 0.79** - 0.91 - 1.29**(0.111) (0.106) (0.356) (0.358) (0.637) (0.634)
Industrial district 0.11 0.47 0.82(0.081) (0.289) (0.516)
HHI 0.16 1.12 1.81(0.254) (0.893) (1.594)
Corporation - 0.10 - 0.51 - 0.81(0.114) (0.395) (0.776)
Portfolio - 0.32*** - 1.18*** - 2.17***(0.103) (0.362) (0.780)
Other services - 0.07 - 0.16 - 0.24(0.147) (0.607) (1.038)
Total accorded (log) 0.07** 0.29*** 0.50***(0.028) (0.105) (0.177)
Interest rate 0.01 0.02 0.03(0.012) (0.043) (0.079)
Leverage - 0.00 - 0.04 - 0.04(0.017) (0.075) (0.130)
Distance 0.00 0.00 0.00(0.000) (0.000) (0.000)
D(Sales_2) 0.04 - 0.01 0.22 0.07 0.38 0.11(0.155) (0.148) (0.609) (0.645) (1.100) (1.132)
D(Sales_3) 0.12 0.04 0.51 0.22 0.79 0.22(0.137) (0.146) (0.529) (0.552) (0.937) (0.996)
D(Sales_4) 0.13 0.11 0.56 0.46 0.93 0.73(0.102) (0.114) (0.423) (0.477) (0.777) (0.824)
D(Sales_5) 0.14 0.29** 0.56 1.07** 0.94 1.87**(0.082) (0.111) (0.351) (0.449) (0.643) (0.817)
D(Sales_6) 0.11 0.28** 0.46 1.02** 0.76 1.78*(0.102) (0.125) (0.405) (0.514) (0.738) (0.936)
Province - 0.24* - 0.26* - 0.79* - 1.09** - 1.27 - 1.76**(0.130) (0.145) (0.472) (0.521) (0.817) (0.885)
Costant 0.17 - 0.57 - 4.06*** - 6.98*** - 13.52*** - 17.73***(0.111) (0.369) (0.418) (1.199) (1.205) (2.452)
Industry specific effect yes yes yes yesNumber of observations 211 211 211 211 211 211
° the table presents multivariate analysis of the impact of Credit Tightness on firm propensityto innovate (model [2]). Columns (1) (3) and (5) shows results from a baseline LP, probit, andlogit model, respectively, with dependent variable Innovation, which takes the value of 1 ifthe firm carries on an innovative activity and 0 otherwise. Innovative activities are listed intable 1. Columns (2), (4) and (6) show results from augmented LP, probit, and logit models,respectively. The table reports point estimates of the coefficients, followed in parentheses byrobust standard errors, clustered at branch level. The definition and construction of the vari-ables is provided in the Appendix. * = p < 0.1, ** = p < 0.05, *** = p < 0.01.Source: our elaborations on own bank data.
Journal of Industrial and Business Economics 45
A. Bellucci, I. Favaretto, G. Giombini Credit availability and propensity to innovate of SMEs
Copyright © FrancoAngeli N.B: Copia ad uso personale. È vietata la riproduzione (totale o parziale) dell’opera con qualsiasi
mezzo effettuata e la sua messa a disposizione di terzi, sia in forma gratuita sia a pagamento.
FrancoAngeli
The final stratified random sample contains one hundred twenty-six firms,which do not undertake innovative activities, and eighty-five firms, which areinvolved in at least one of the activities reported in table 1. Table 5 providessome summary statistics for the stratified random sample: firms that innovatedo not show statistically significant differences with respect to non-innovativeones in terms of legal entity type, bank operating segment, and location.
Subsequently we re-estimate models [1] and [2], and the outcomes of theserobustness checks are reported in tables 6 and 7, respectively. Our results arequalitatively unchanged: the estimated coefficient of Credit Availability is pos-itive and statistically significant in all specifications, while the estimated coef-ficient of Industrial District is statistically significant in the probit and logitspecifications (columns (4) and (6) of table 6, respectively). Thus, firms thatdo not experience overdraw in the year 2004 or firms within the industrial dis-trict show higher probabilities of undertaking innovation activities than otherfirms, ceteris paribus. The propensity to innovate increases with the loan (asmeasured by the log of Total Accorded and with firm’s size (D(Sales_5)).
Table 7 shows results of model [2]: the estimated coefficient of CreditTightness is statistically significant in all specifications, as well as the coeffi-cient of Total Accorded. These finding confirm that better credit conditionsfoster the probability of firms to undertake innovative activities.
Conclusion
In this paper we empirically addressed a specific research question, i.e.whether the availability of credit affects SME probability of undertaking inno-vative activities, by means of data available for an Italian region. The motiva-tion for this study is related to the recognition that the innovation activity, oneof the key factors for the economic growth of a country, shows in Italy a gapcompared with the other main advanced economies, especially in the privatesector. The expenditure in R&S, for example, is lower and far away from thetarget of the 3% over GDP set by the European Commission Europe 2020strategy. As for the private sector, it is argued that the causes of such a delayare related to characteristics of both the productive and the financial structuresof Italian firms (Bank of Italy, 2013).
Furthermore, a survey of the European Central Bank (ECB, 2009) showsthat SMEs largely rely on banks, while market-based financing plays a minorrole. Thus, it becomes nonetheless crucial to find out the effect of bank loanson the firm propensity to innovate.
This paper provides evidence of a causal effect of credit availability on thefirm probability of undertaking innovative activities, showing that the propen-
46 Economia e Politica Industriale
A. Bellucci, I. Favaretto, G. Giombini Credit availability and propensity to innovate of SMEs
Copyright © FrancoAngeli N.B: Copia ad uso personale. È vietata la riproduzione (totale o parziale) dell’opera con qualsiasi
mezzo effettuata e la sua messa a disposizione di terzi, sia in forma gratuita sia a pagamento.
FrancoAngeli

sity to innovate is higher when firms do not experience credit restrictions.Moreover, the empirical exercise reveals that firms organized in a more struc-tured legal form or firms of larger size have a higher probability to innovate.Further, we also find evidence of a positive correlation between the innovativeprocesses and the fact that the firm belongs to the industrial district.
Keeping in mind that these findings refer to a specific Italian region, we be-lieve that a future research agenda could extend our analysis, so that to obtainpolicy implications oriented to promote and facilitate firm access to bank credit.
References
Alessandrini P., Presbitero A.F., Zazzaro A. 2010. Bank size or distance: what ham-pers innovation adoption by SMEs? Journal of Economic Geography, 10 (6): 845-881.
Almus M., Czarnitzki D. 2003. The effects of public R&D subsidies on firms’ innova-tion activities: the case of Eastern Germany. Journal of Business & Economic Sta-tistics, 21 (2): 226-236.
Amore M.D., Schneider C., Zaldokas A. 2013. Credit supply and corporate innovation.Journal of Financial Economics, 109 (3): 835-855.
Bank of Italy. 2013. Annual Report. Bank of Italy: Roma.Bellucci A., Borisov A., Zazzaro A. 2013. Do banks price discriminate spatially? Evi-
dence from small business lending in local credit markets. Journal of Banking andFinance, 37 (11): 4183-4197.
Bellucci A., Favaretto I., Giombini G. 2014. Does innovation affect credit access?New empirical evidence from italian small business lending. IAW Discussion Pa-pers 104.
Belussi F., Pilotti L. 2002. Learning and innovation by networking within the Italianindustrial district: the development of an explorative analytical model. Sinergie, 20(58): 3-43.
Benfratello L., Schiantarelli F., Sembenelli A. 2008. Banks and innovation: micro-econometric evidence on Italian firms. Journal of Financial Economics, 90 (2):197-217.
Berger A.N., Udell G.F. 1998. The economics of small business finance: the roles ofprivate equity and debt markets in the financial growth cicle. Journal of Bankingand Finance, 22: 613-674.
Brancati E. 2014. Innovation, financial constraints and relationship lending: evidencefrom Italy during the recent crises. MPRA Paper 53031.
Brierley P. 2001. The financing of technology-based small firms. A review of the liter-ature. Bank of England Quarterly Bulletin, 41 (1): 64-76.
Calcagnini G., Favaretto I., Giombini G. 2011. Financial models of small innovativefirms: an empirical investigation, in Calcagnini G., Favaretto I. (eds.) The Econom-ics of Small Businesses. An International Perspective. Springer-Verlag: Berlin-Heidelberg, doi: 10.1007/978-3-7908-2623-4_9.
Journal of Industrial and Business Economics 47
A. Bellucci, I. Favaretto, G. Giombini Credit availability and propensity to innovate of SMEs
Copyright © FrancoAngeli N.B: Copia ad uso personale. È vietata la riproduzione (totale o parziale) dell’opera con qualsiasi
mezzo effettuata e la sua messa a disposizione di terzi, sia in forma gratuita sia a pagamento.
FrancoAngeli

Calcagnini G., Ferrando A., Giombini G. 2014. Multiple market imperfections, firmprofitability and investment. European Journal of Law and Economics, forthcoming.
Campello M., Giambona E., Graham J.R., Harvey C.R. 2010. Liquidity managementand corporate investment decision during financial crisis. Review of FinancialStudies, 24 (6): 1944-1979.
Canepa A., Stoneman P. 2002. Financial constraints on innovations: a European cross-country study. Kiel Institute of World Economics Working Paper 02-11.
Canepa A., Stoneman P. 2008. Financial constraints to innovation in the UK: evidencefrom CIS2 and CIS3. Oxford Economic Papers, 60 (4): 711-730.
Cetorelli N. 1999. Competitive analysis in banking: appraisal of the methodologies.Federal Reserve Bank of Chicago Economic Perspectives, 23 (1): 2-15.
Chiarvesio M., Di Maria E. 2009. ICT and innovation processes in SMEs inside andoutside districts. Marco Fanno Working Paper 100.
Cohen W.M., Klepper S. 1996. A reprise of size and R&D. Economic Journal, 106(437): 925-951.
Cole R., Wolken J.D. 1995. Financial services used by small businesses: evidencefrom the 1993 national survey of small business finances. Federal Reserve Bul-letin, 81 (7): 629-667.
Colombo M., Grilli L. 2007. Funding gaps? Access to bank loans by high-tech start-ups. Small Business Economics, 29 (1-2): 25-46.
Costanzo G.D., Silipo D., Succurro M. 2013. Over-indebtedness and innovation: solepreliminary results. Università della Calabria Working Paper 4/2013.
Czarnitzki D., Hottenrott H. 2011. R&D investment and financing constraints of smalland medium-sized firms. Small Business Economics, 36 (1): 65-83.
ECB. 2009. Survey on the Access to Finance of Small and Medium-Sized Enterprisesin the Euro Area. European Central Bank: Frankfurt am Main.
Favaretto I., Zanfei A. 2007. Rapporto finale 2007. Innovazione e centri di ricercanelle Marche. Università di Urbino: Urbino.
Ferri G., Rotondi Z. 2006. Does finance matter in the re-specialization of Italy’s indus-trial districts?, in Bracchi G., Masciandaro D. (eds.) XI Report on the Italian Fi-nancial System. Bancaria Editrice: Milano.
Freel M.S. 2007. Are small innovators credit rationed? Small Business Economics, 28(1): 23-35.
Giannetti C. 2012. Relationship lending and firm innovativeness. Journal of EmpiricalFinance, 19 (5): 762-781.
Giudici G., Paleari S. 2000. The provision of finance to innovation: a survey conduct-ed among Italian technology-based small firms. Small Business Economics, 14 (1):37-53.
Gorg H., Strobl E. 2007. The effect of R&D subsidies on private R&D. Economica, 74(294): 215-234.
Guiso L. 1998. High-tech firms and credit rationing. Journal of Economic Behavior &Organization, 35 (1): 39-59.
Hall B.H. 2009. The financing of R&D and innovation. NBER Working Paper 15325.Herrera A.M., Minetti R. 2007. Informed finance and technological change: evidence
from credit relationships. Journal of Financial Economics, 83 (1): 223-269.
48 Economia e Politica Industriale
A. Bellucci, I. Favaretto, G. Giombini Credit availability and propensity to innovate of SMEs
Copyright © FrancoAngeli N.B: Copia ad uso personale. È vietata la riproduzione (totale o parziale) dell’opera con qualsiasi
mezzo effettuata e la sua messa a disposizione di terzi, sia in forma gratuita sia a pagamento.
FrancoAngeli

Istat. 2007. La demografia d’impresa. Istat: Roma. Jensen M., Meckling W.H. 1976. Theory of the firm: managerial behavior, agency
costs and ownership structure. Journal of Financial Economics, 3 (4): 305-360.Liberti J.M., Mian A.R. 2009. Estimating the effect of hierarchies on information use.
Review of Financial Studies, 22 (10): 4057-4090.Lins K., Servaes H., Tufano P. 2010. What drives corporate liquidity? An internation-
al survey of cash holdings and lines of credit. Journal of Financial Economics, 98:160-176.
Magri S. 2013. Does issuing equity help R&D activities? Evidence from non-publicItalian high-tech manufacturing firms. SSRN Working Papers 2309909.
Mohnen P., Röller L.H. 2005. Complementarities in innovation policy. European Eco-nomic Review, 49 (6): 1431-1450.
OECD. 2006. Risk Capital and Innovative SMEs, in The SME Financing Gap: Theoryand Evidence. OECD: Paris.
Petersen M.A., Rajan R.G. 1995. The effect of credit market competition on lendingrelationships. The Quarterly Journal of Economics, 110 (2): 407-443.
Robb A. 2010. Sources of Financing for New Technology Firms: Evidence from theKauffman Firm Survey. Kauffman Foundation: Kansas City.
Savignac F. 2006. The impact of financial constraints on innovation: evidence fromFrench manufacturing firms. Cahiers de la Maison des Sciences Economiques 42.
Scherer F.M. 1965. Firm size, market structure, opportunity and the output patented in-ventions. American Economic Review, 55 (5): 1097-1125.
van Waarded F. 2001. Institutions and innovation: the legal environment of innovatingfirms. Organization Studies, 22 (5): 765-795.
Vaona A., Pianta M. 2008. Firm size and innovation in European manufacturing. SmallBusiness Economics, 30 (3): 283-299.
Xie W., Mansky C.F. 1989. The logit model and response-based samples. SociologicalMethods & Research, 17 (3): 283-302.
Journal of Industrial and Business Economics 49
A. Bellucci, I. Favaretto, G. Giombini Credit availability and propensity to innovate of SMEs
Copyright © FrancoAngeli N.B: Copia ad uso personale. È vietata la riproduzione (totale o parziale) dell’opera con qualsiasi
mezzo effettuata e la sua messa a disposizione di terzi, sia in forma gratuita sia a pagamento.
FrancoAngeli

Appendix
Table A1 – List of variables
Variable Definition
Innovative A dichotomous variable that take the value of 1 if the firm is involved in many of innovative activities following the classification specified in table 1, and 0 otherwise.
Interest Rate The interest rate charged by the bank, expressed as a percentage.Credit availability A dichotomous variable that takes the value of 1 if the borrower uses less than
the amount granted on the credit line by the bank and 0 otherwise.Credit tightness A continuous variable that measures the percentage of credit line utilized by
firm on total amount granted by the bank.Turnover A continuous variable that measures firms total sales. It is constructed as mean
value of the firm sale category.Sales A step variable that takes the value 1 if sales are less than two hundred fifty
thousand euros; 2 for sales between two hundred fifty thousand euros and five hundred thousand euros; 3 for sales between five hundred thousand euros and one million five hundred thousand euros; 4 for sales between one million five hundred thousand euros and five million euros, 5 for sales between five millioneuros and twenty-five million euros; 6 for sales between twenty-five million euros and fifty million euros.
D(Sales i) An indicator variable that takes the value of 1 if the firm’s sales fall in the i-th category (1 through 6) and 0 otherwise.
Other services A dichotomous variable that takes the value of 1 if the bank branch provides other (besides the credit line) services to the borrower and 0 otherwise.
Portfolio A dichotomous variable that takes the value of 1 if the bank considers the creditline as part of its small business market and 0 if it is part of its corporate market.
Industrial district A dichotomous variable that takes the value of 1 if the firm is located within an industrial district area and 0 otherwise.
Corporation A dichotomous variable that takes the value of 1 if the legal entity of the loan recipient is a business corporation and 0 otherwise
HHI A branch-based Herfindahl-Hirschman Index of market concentration. The relevant market for each bank branch is determined by the postal area code where the branch is located.
Total accorded A continuous variable that measures the total amount accorded: constructed as the natural logarithm of 1+ total amount accorded to the firm.
Leverage A continuous variable that captures the total indebtedness of the firm. It is calculated as the ratio between the Total accorded/Turnover.
Distance A continuous variable that measures the bank-borrower distance: constructed asthe natural logarithm of 1 + the length of the bank-borrower distance in meters.
Source: our elaborations.
50 Economia e Politica Industriale
A. Bellucci, I. Favaretto, G. Giombini Credit availability and propensity to innovate of SMEs
Copyright © FrancoAngeli N.B: Copia ad uso personale. È vietata la riproduzione (totale o parziale) dell’opera con qualsiasi
mezzo effettuata e la sua messa a disposizione di terzi, sia in forma gratuita sia a pagamento.
FrancoAngeli