ANDHRA PRADESH STATE PERSPECTIVE AND IMPLEMENTATION PLAN...
60
ANDHRA PRADESH STATE PERSPECTIVE AND IMPLEMENTATION PLAN SOCIETY FOR ELIMINATION OF RURAL POVERTY (INDIRA KRANTHI PATHAM) (Department of Rural Development, Govt. of A.P.) IV Floor, Hermitage Office Complex, Hill Fort Road, Hyderabad, 500004 2011-2017
Transcript of ANDHRA PRADESH STATE PERSPECTIVE AND IMPLEMENTATION PLAN...
ANDHRA PRADESH STATE PERSPECTIVE
AND IMPLEMENTATION PLAN
SOCIETY FOR ELIMINATION OF RURAL POVERTY
(INDIRA KRANTHI PATHAM)
(Department of Rural Development, Govt. of A.P.) IV Floor, Hermitage Office Complex, Hill Fort Road,
Hyderabad, 500004
2011-2017
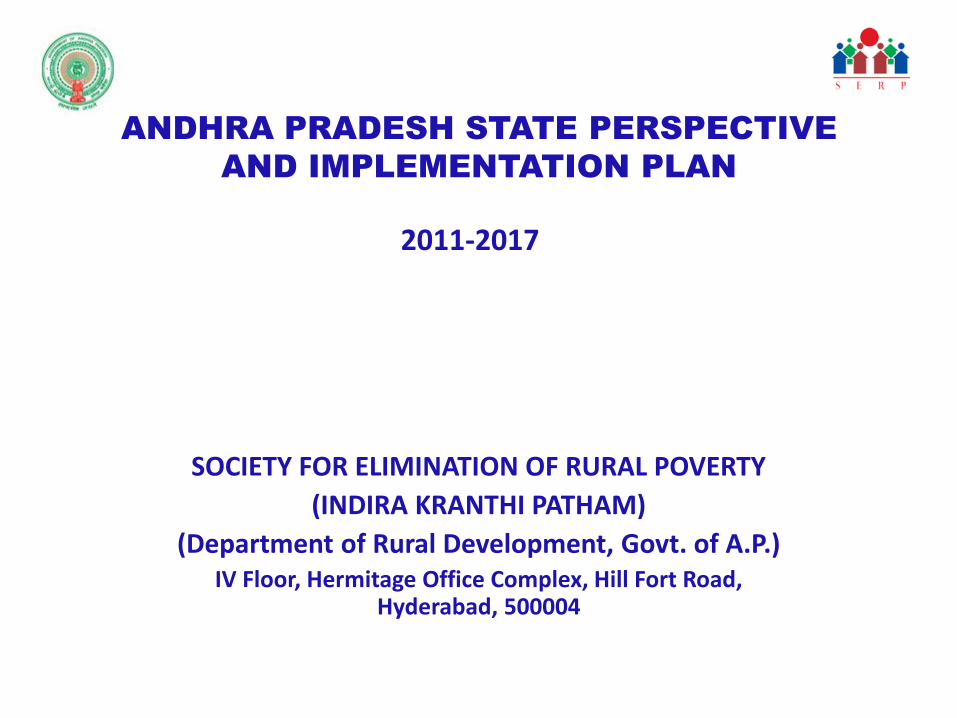
Early 90s
National Literacy Mission
1995-2000
• UNDP-SAPAP Pilot
I Phase
DPIP (2000-2006)
6 Districts
II Phase
APRPRP (2003-2011)
From 16 scaled up to 22 districts
III Phase
2011-2017
22 districts
Evolution of SERP
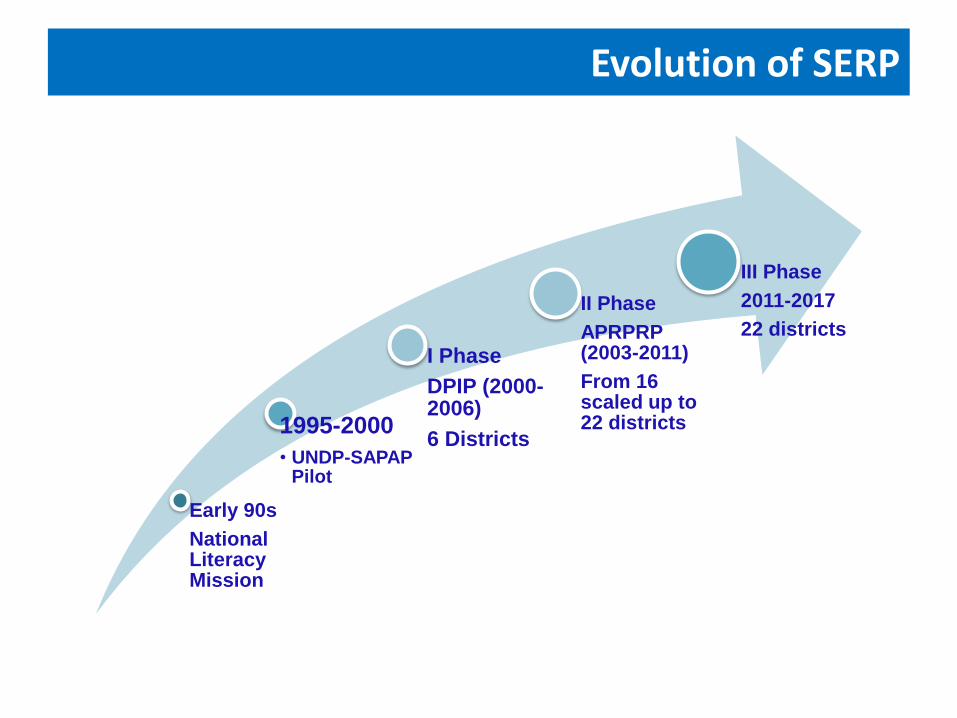
VISION
Every poor family in Andhra Pradesh comes out of poverty, is
stabilized against shocks that threaten their advancement, improves
its livelihoods options, and enjoys a decent quality of life.
Women lead lives with dignity Enjoy equality within the family and outside
Should be free from hunger Earn decent incomes: >Rs.100,000 per annum
Plan their household expenditure
Secured from risks to - life, health, assets and enterprises Enjoy secure shelter Secure quality education
Enjoy good health and access quality health services
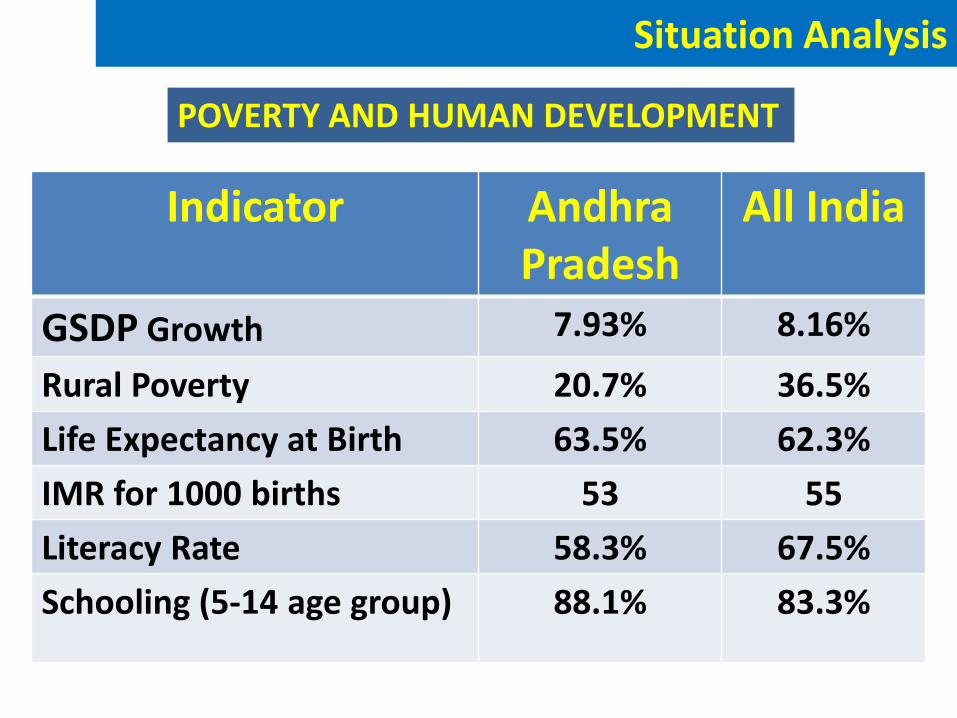
Situation Analysis
Indicator Andhra Pradesh
All India
GSDP Growth 7.93% 8.16%
Rural Poverty 20.7% 36.5%
Life Expectancy at Birth 63.5% 62.3%
IMR for 1000 births 53 55
Literacy Rate 58.3% 67.5%
Schooling (5-14 age group) 88.1% 83.3%
POVERTY AND HUMAN DEVELOPMENT
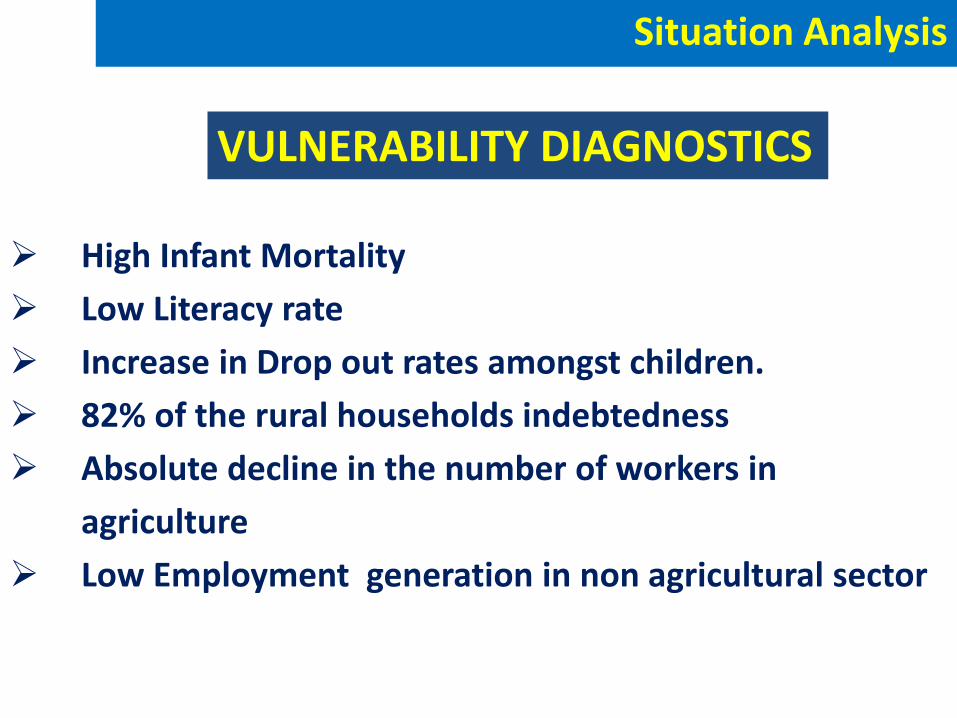
High Infant Mortality
Low Literacy rate
Increase in Drop out rates amongst children.
82% of the rural households indebtedness
Absolute decline in the number of workers in
agriculture
Low Employment generation in non agricultural sector
VULNERABILITY DIAGNOSTICS
Situation Analysis
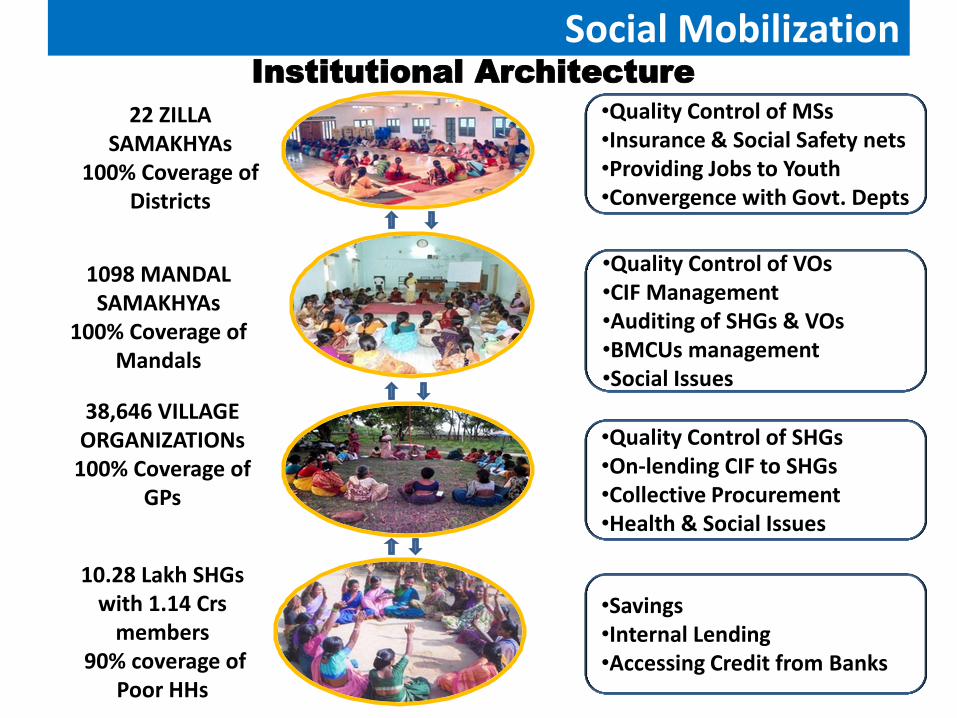
•Quality Control of MSs •Insurance & Social Safety nets •Providing Jobs to Youth •Convergence with Govt. Depts
•Quality Control of VOs •CIF Management •Auditing of SHGs & VOs •BMCUs management •Social Issues
•Quality Control of SHGs •On-lending CIF to SHGs •Collective Procurement •Health & Social Issues
•Savings •Internal Lending •Accessing Credit from Banks
22 ZILLA SAMAKHYAs
100% Coverage of Districts
1098 MANDAL SAMAKHYAs
100% Coverage of Mandals
38,646 VILLAGE ORGANIZATIONs
100% Coverage of GPs
10.28 Lakh SHGs with 1.14 Crs
members 90% coverage of
Poor HHs
Social Mobilization Institutional Architecture
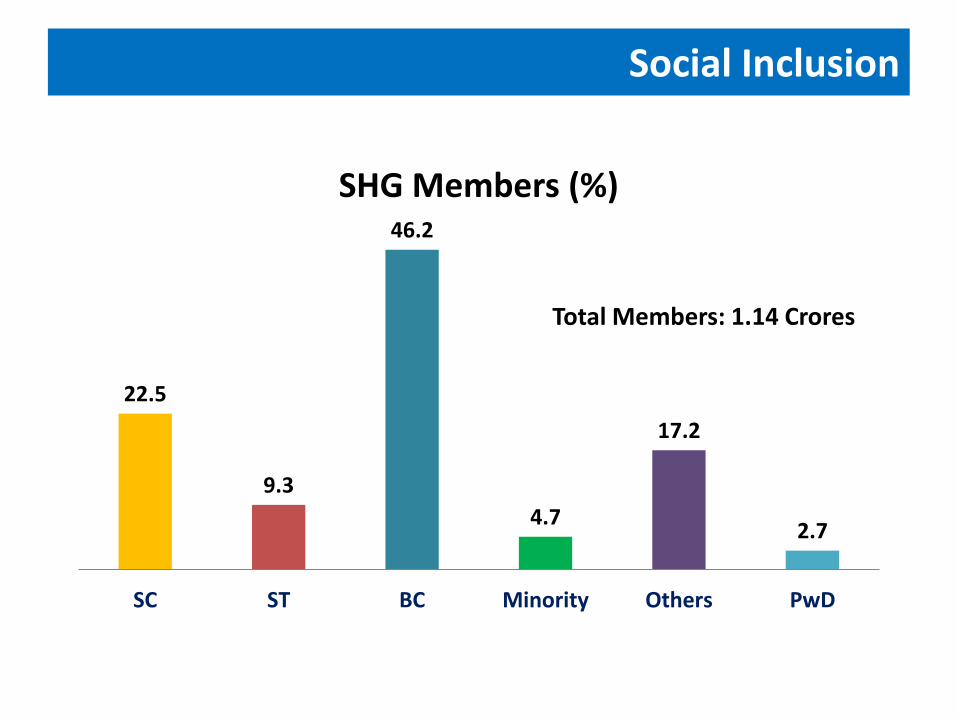
Social Inclusion
22.5
9.3
46.2
4.7
17.2
2.7
SC ST BC Minority Others PwD
SHG Members (%)
Total Members: 1.14 Crores
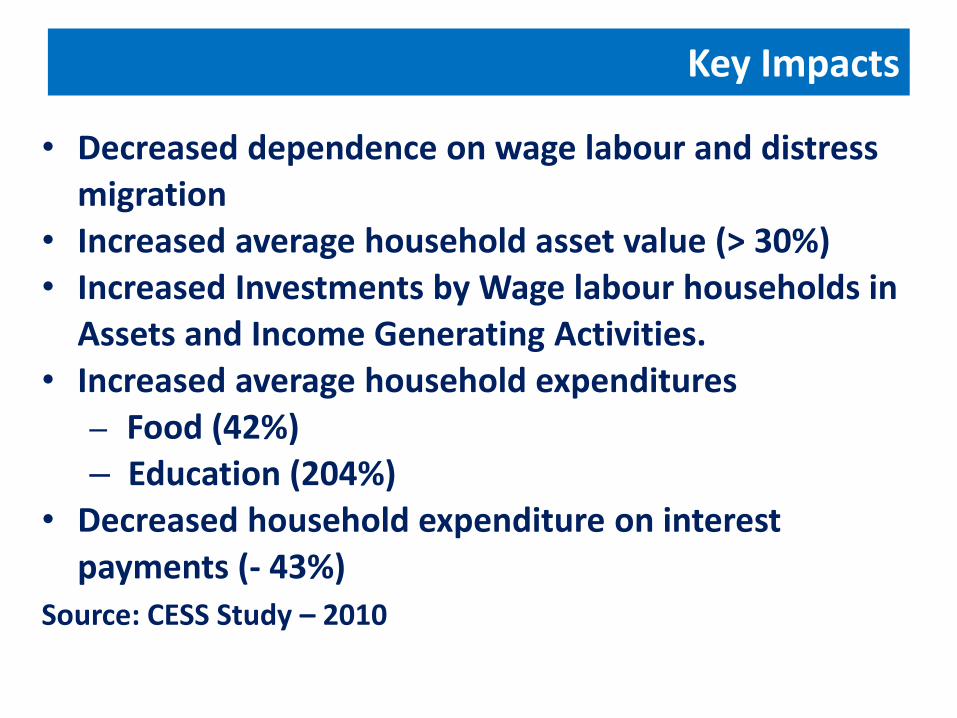
• Decreased dependence on wage labour and distress migration
• Increased average household asset value (> 30%)
• Increased Investments by Wage labour households in Assets and Income Generating Activities.
• Increased average household expenditures
– Food (42%) – Education (204%)
• Decreased household expenditure on interest
payments (- 43%) Source: CESS Study – 2010
Key Impacts
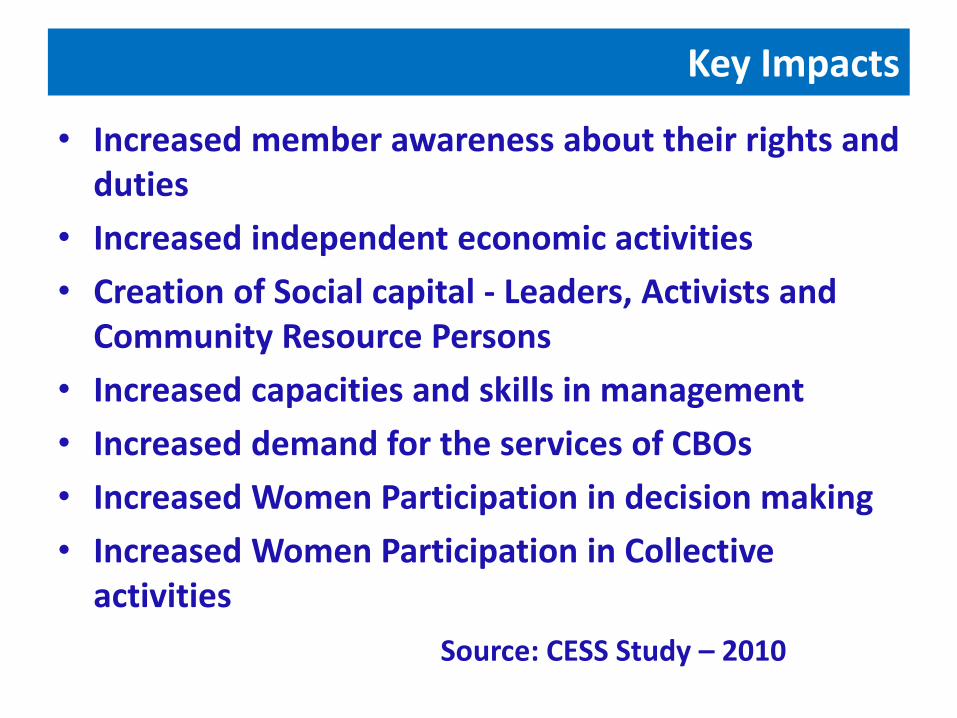
• Increased member awareness about their rights and duties
• Increased independent economic activities
• Creation of Social capital - Leaders, Activists and Community Resource Persons
• Increased capacities and skills in management
• Increased demand for the services of CBOs
• Increased Women Participation in decision making
• Increased Women Participation in Collective activities
Source: CESS Study – 2010
Key Impacts
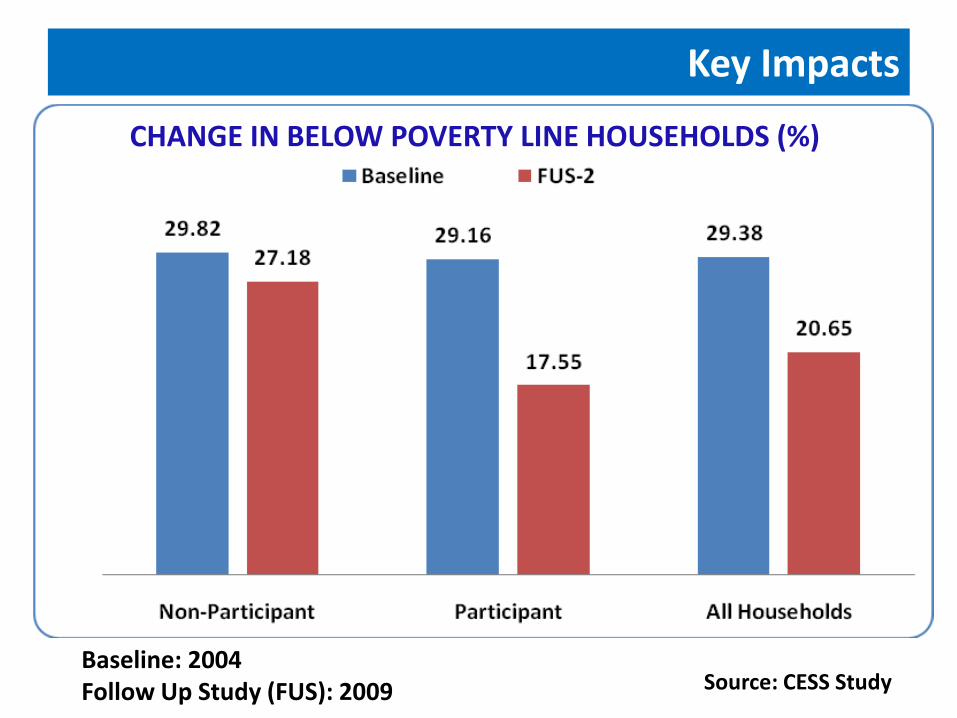
Key Impacts
Baseline: 2004 Follow Up Study (FUS): 2009
CHANGE IN BELOW POVERTY LINE HOUSEHOLDS (%)
Source: CESS Study
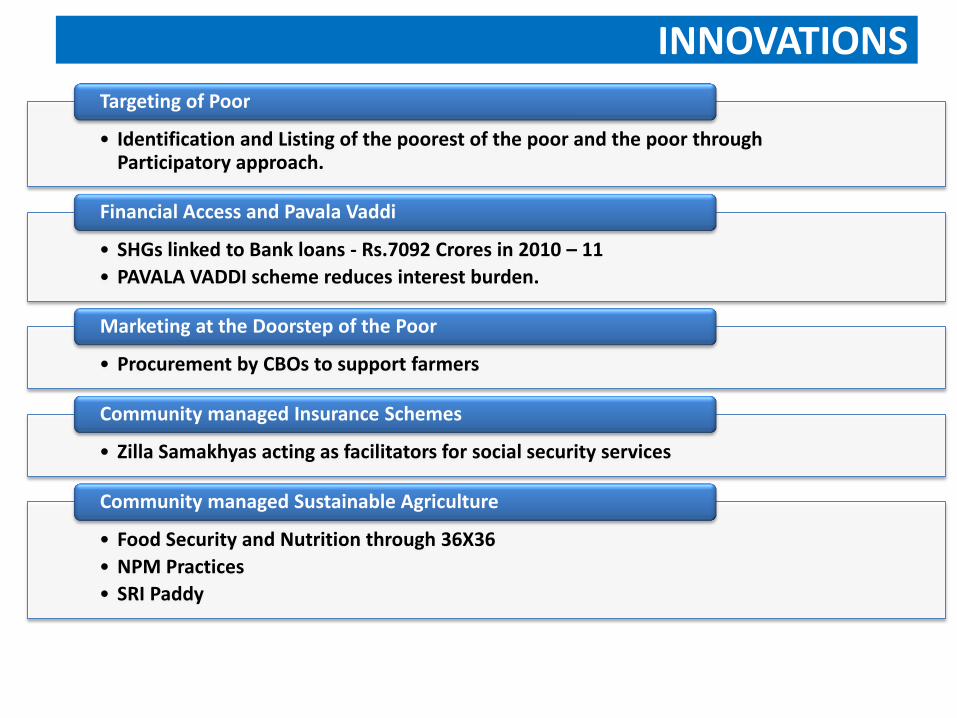
INNOVATIONS
• Identification and Listing of the poorest of the poor and the poor through Participatory approach.
Targeting of Poor
• SHGs linked to Bank loans - Rs.7092 Crores in 2010 – 11
• PAVALA VADDI scheme reduces interest burden.
Financial Access and Pavala Vaddi
• Procurement by CBOs to support farmers
Marketing at the Doorstep of the Poor
• Zilla Samakhyas acting as facilitators for social security services
Community managed Insurance Schemes
• Food Security and Nutrition through 36X36
• NPM Practices
• SRI Paddy
Community managed Sustainable Agriculture
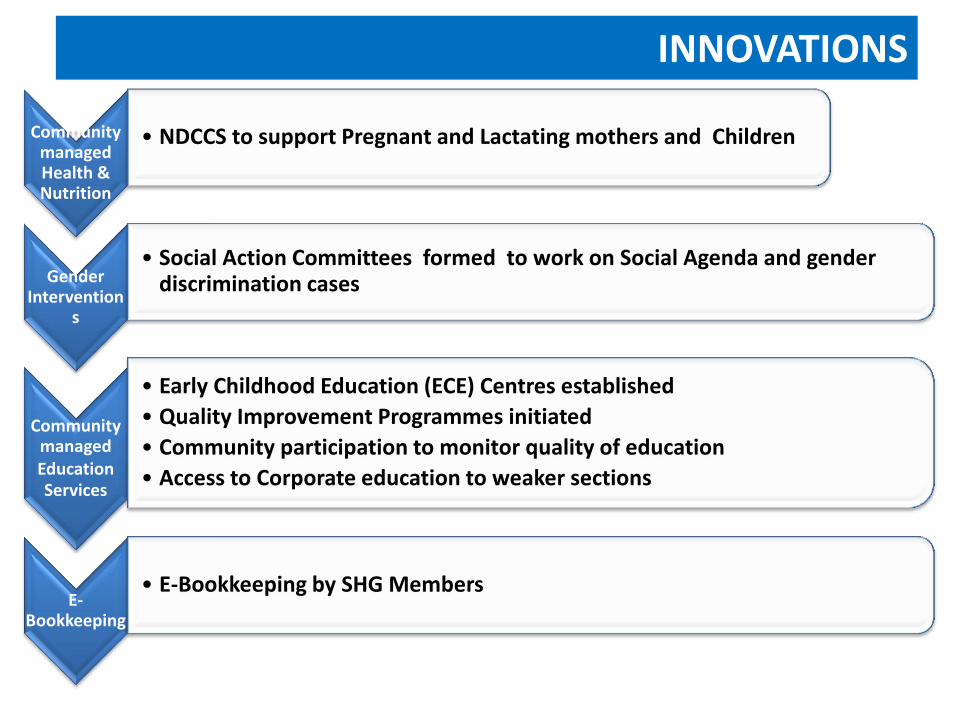
Community managed Health & Nutrition
• NDCCS to support Pregnant and Lactating mothers and Children
Gender Intervention
s
• Social Action Committees formed to work on Social Agenda and gender discrimination cases
Community managed Education Services
• Early Childhood Education (ECE) Centres established
• Quality Improvement Programmes initiated
• Community participation to monitor quality of education
• Access to Corporate education to weaker sections
E-Bookkeeping
• E-Bookkeeping by SHG Members
INNOVATIONS

Resurgent and Member
Focused CBOs
Restructured and POP
Focused SERP
Converge to Bring Synergy
ICT to Power the CBO
Processes
Re-skilled and Re-oriented
Human Resource
Achieving an income levels of Rs. 1,00,000 per annum per family for all the 30 Lakh PoP households in the State in addition to improved human development indicators
SERP’s RENEWED VISION
Key Activity Purpose Scale
Promotion of Institutions of Poor at various levels
Self Reliant and Self Sustainable CBOs
All 1098 rural mandals covered
Creation of corpus fund in CBO Institutions
CBO Corpus of Rs. 5333crores has been created
Mobilization of credit from commercial banks
Rs. 38,469crores mobilised so far
INSTITUTION BUILDING
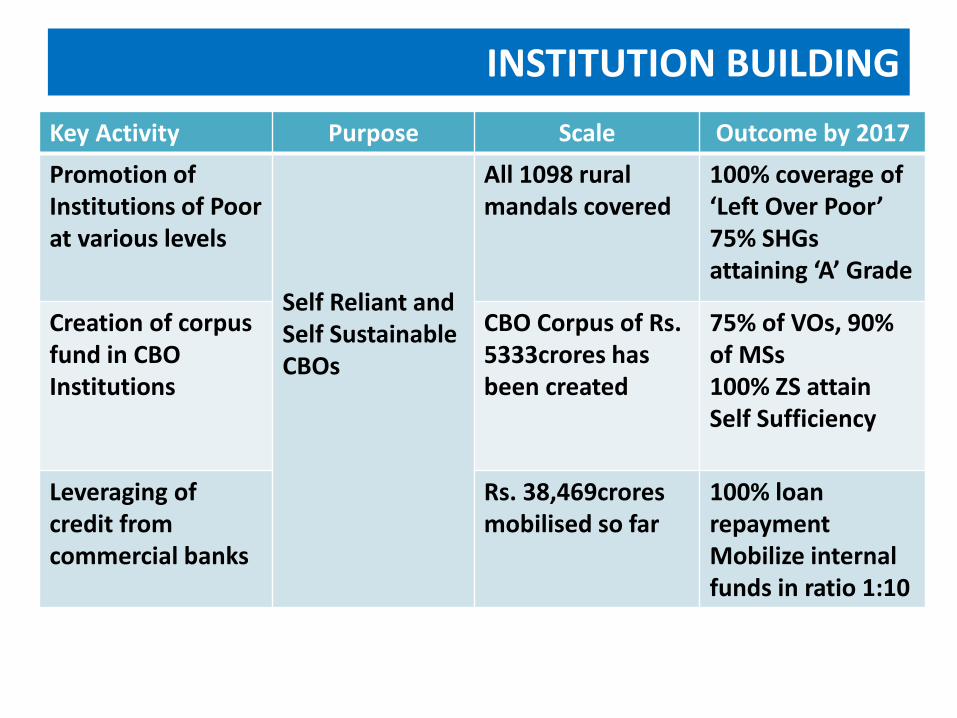
Key Activity Purpose Scale Outcome by 2017
Promotion of Institutions of Poor at various levels
Self Reliant and Self Sustainable CBOs
All 1098 rural mandals covered
100% coverage of ‘Left Over Poor’ 75% SHGs attaining ‘A’ Grade
Creation of corpus fund in CBO Institutions
CBO Corpus of Rs. 5333crores has been created
75% of VOs, 90% of MSs 100% ZS attain Self Sufficiency
Leveraging of credit from commercial banks
Rs. 38,469crores mobilised so far
100% loan repayment Mobilize internal funds in ratio 1:10
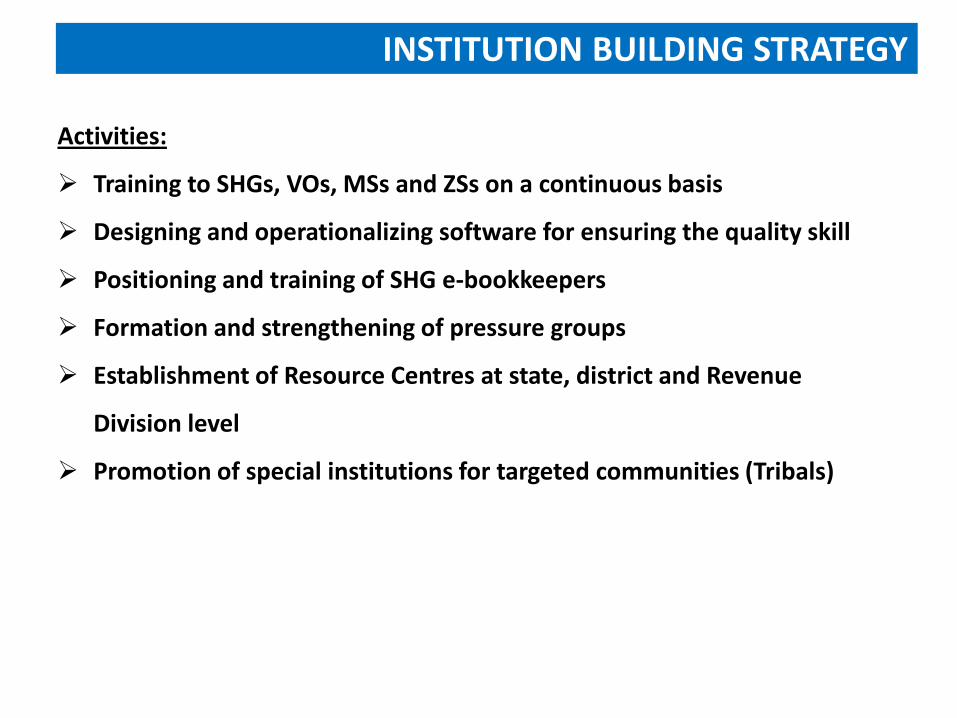
Activities:
Training to SHGs, VOs, MSs and ZSs on a continuous basis
Designing and operationalizing software for ensuring the quality skill
Positioning and training of SHG e-bookkeepers
Formation and strengthening of pressure groups
Establishment of Resource Centres at state, district and Revenue
Division level
Promotion of special institutions for targeted communities (Tribals)
INSTITUTION BUILDING STRATEGY
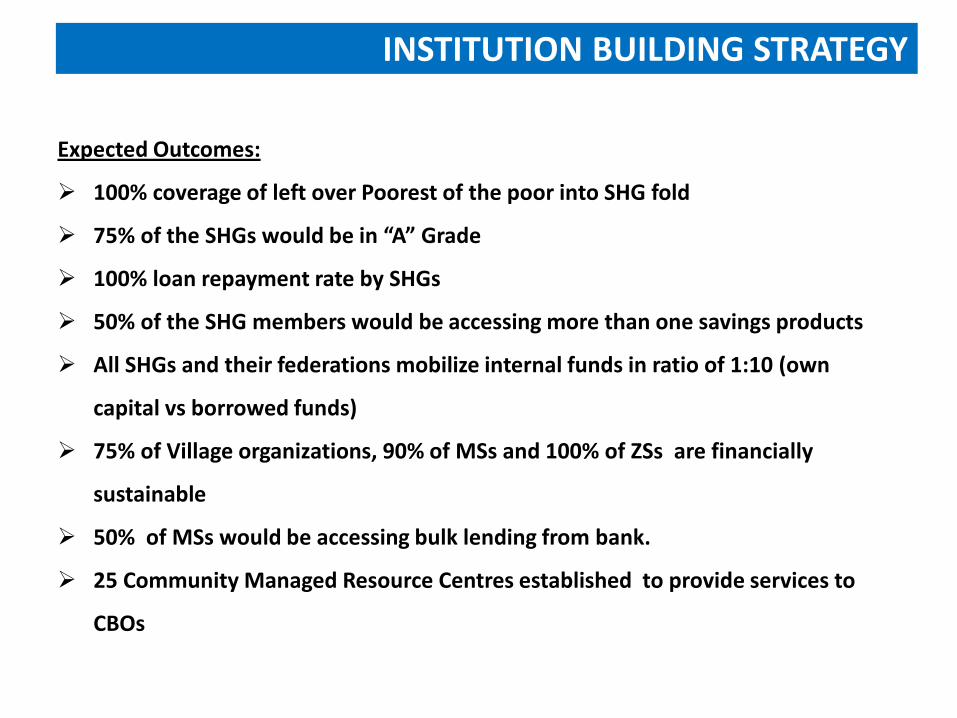
Expected Outcomes:
100% coverage of left over Poorest of the poor into SHG fold
75% of the SHGs would be in “A” Grade
100% loan repayment rate by SHGs
50% of the SHG members would be accessing more than one savings products
All SHGs and their federations mobilize internal funds in ratio of 1:10 (own
capital vs borrowed funds)
75% of Village organizations, 90% of MSs and 100% of ZSs are financially
sustainable
50% of MSs would be accessing bulk lending from bank.
25 Community Managed Resource Centres established to provide services to
CBOs
INSTITUTION BUILDING STRATEGY
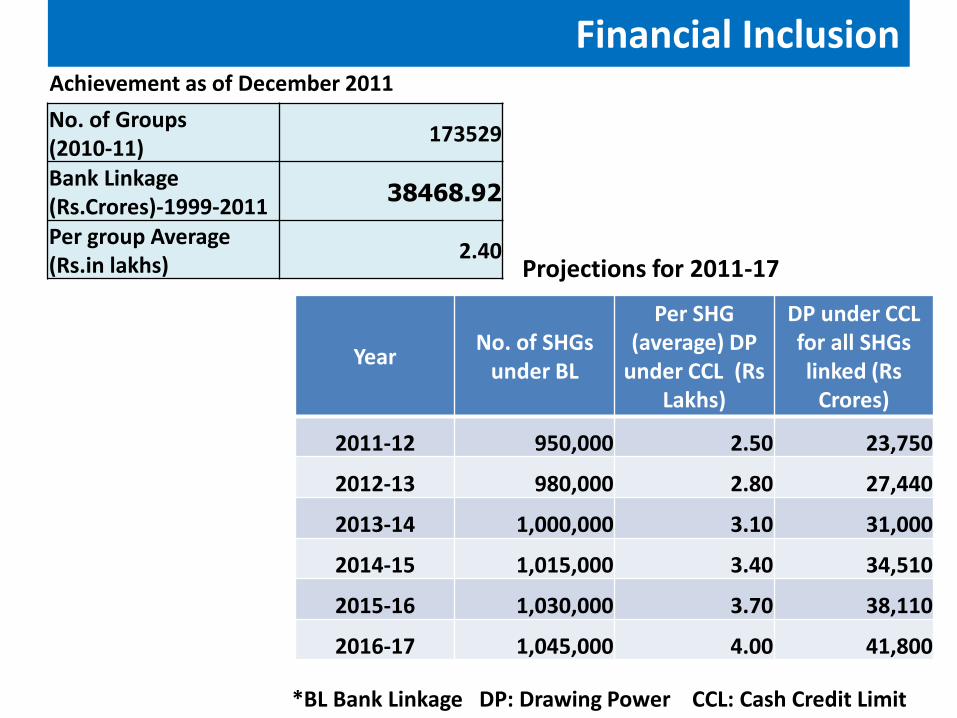
Year No. of SHGs
under BL
Per SHG (average) DP
under CCL (Rs Lakhs)
DP under CCL for all SHGs linked (Rs
Crores)
2011-12 950,000 2.50 23,750
2012-13 980,000 2.80 27,440
2013-14 1,000,000 3.10 31,000
2014-15 1,015,000 3.40 34,510
2015-16 1,030,000 3.70 38,110
2016-17 1,045,000 4.00 41,800
*BL Bank Linkage DP: Drawing Power CCL: Cash Credit Limit
Financial Inclusion
No. of Groups (2010-11)
173529
Bank Linkage (Rs.Crores)-1999-2011
38468.92
Per group Average (Rs.in lakhs)
2.40
Achievement as of December 2011
Projections for 2011-17
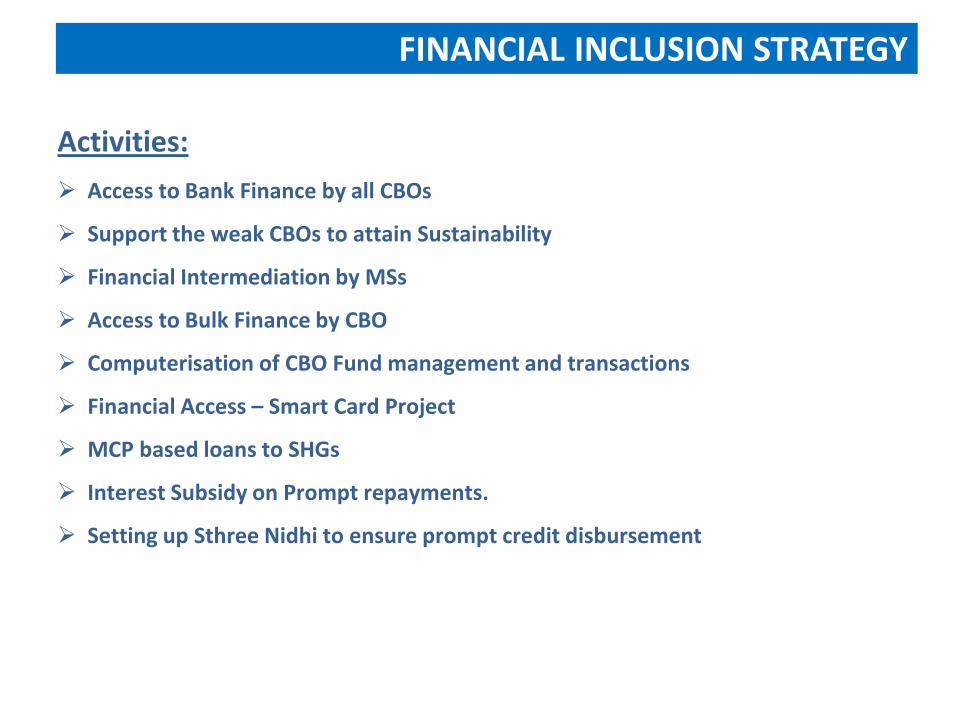
Activities:
Access to Bank Finance by all CBOs
Support the weak CBOs to attain Sustainability
Financial Intermediation by MSs
Access to Bulk Finance by CBO
Computerisation of CBO Fund management and transactions
Financial Access – Smart Card Project
MCP based loans to SHGs
Interest Subsidy on Prompt repayments.
Setting up Sthree Nidhi to ensure prompt credit disbursement
FINANCIAL INCLUSION STRATEGY
Expected Outcomes:
Credit flow to the tune of Rs 3000 crores through MS
Promotion of IGA activities with PoP targeting
Increased corpus with SHGs
Conduct of Village Investment opportunities survey and Database
Creation
FINANCIAL INCLUSION STRATEGY
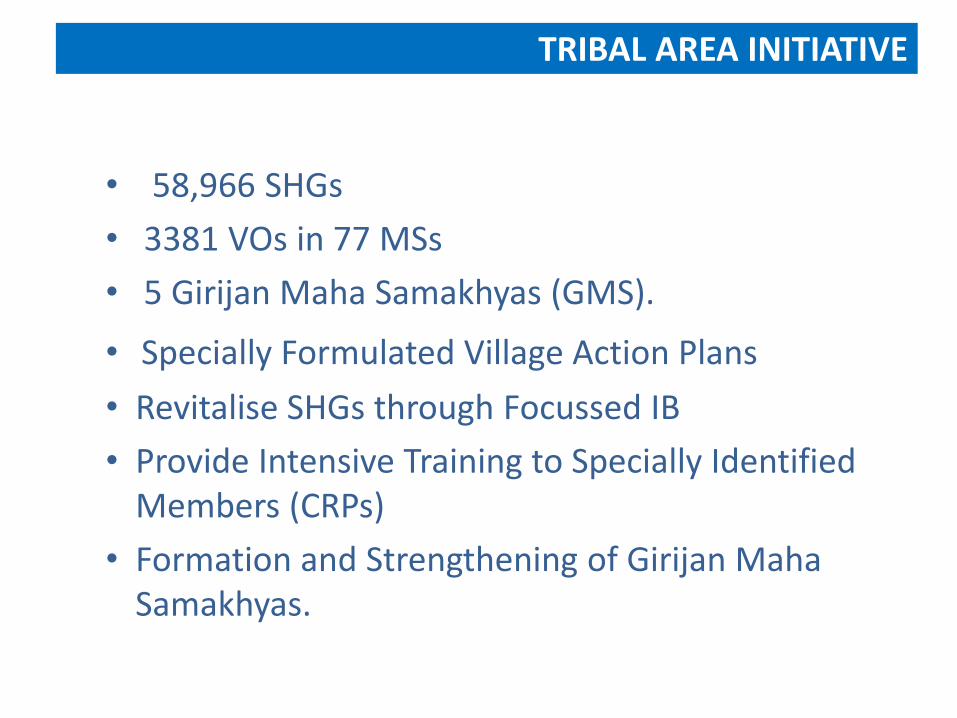
• 58,966 SHGs
• 3381 VOs in 77 MSs
• 5 Girijan Maha Samakhyas (GMS).
• Specially Formulated Village Action Plans
• Revitalise SHGs through Focussed IB
• Provide Intensive Training to Specially Identified Members (CRPs)
• Formation and Strengthening of Girijan Maha Samakhyas.
TRIBAL AREA INITIATIVE
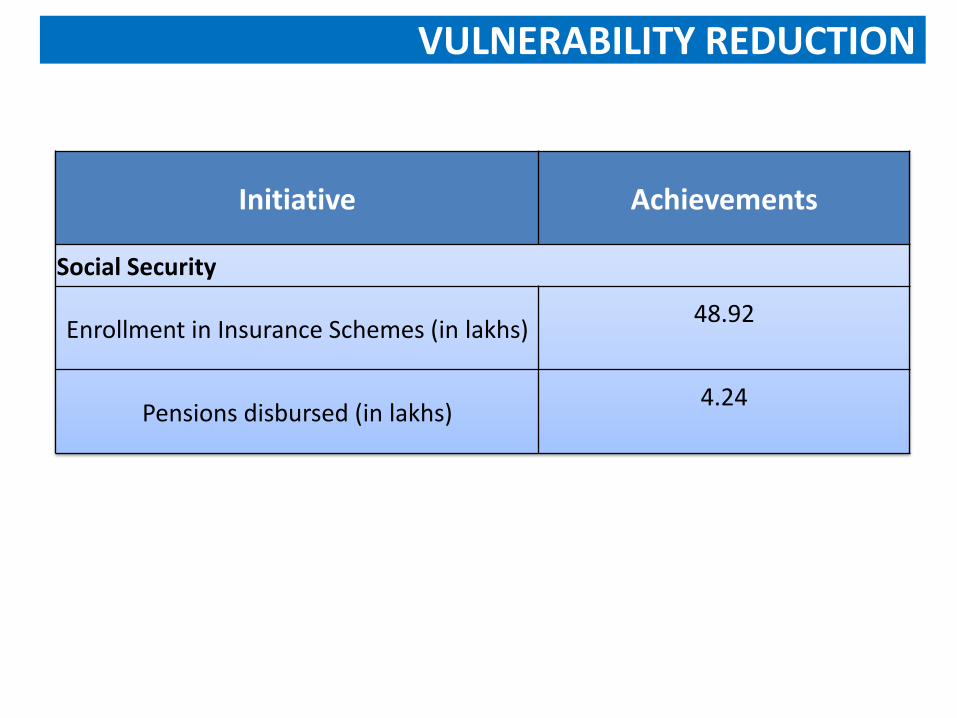
VULNERABILITY REDUCTION
Initiative Achievements
Social Security
Enrollment in Insurance Schemes (in lakhs) 48.92
Pensions disbursed (in lakhs) 4.24
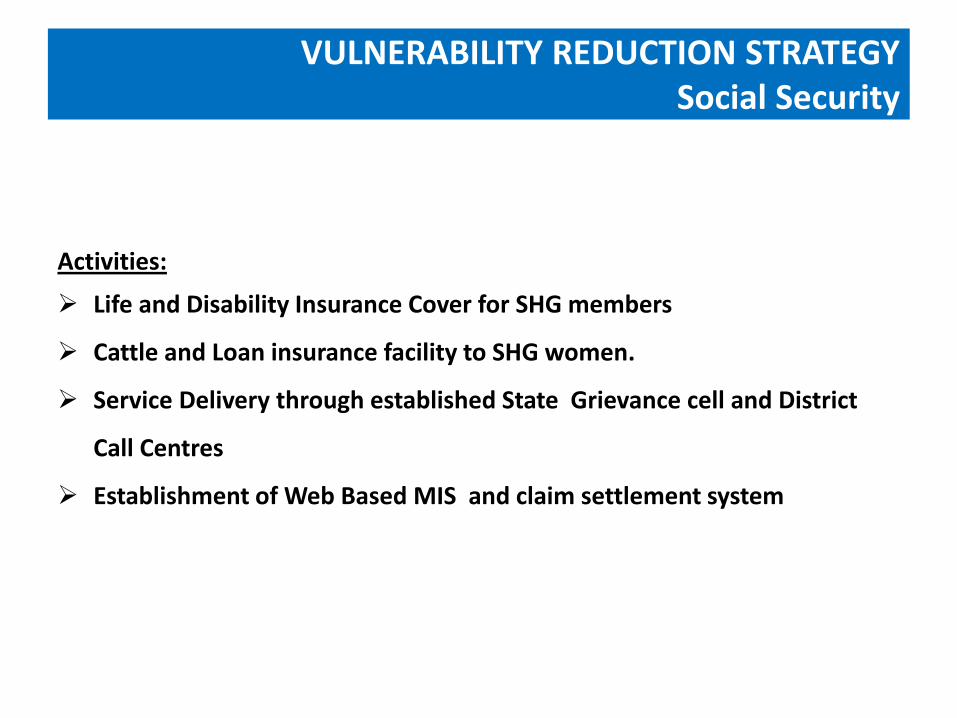
VULNERABILITY REDUCTION STRATEGY Social Security
Activities:
Life and Disability Insurance Cover for SHG members
Cattle and Loan insurance facility to SHG women.
Service Delivery through established State Grievance cell and District
Call Centres
Establishment of Web Based MIS and claim settlement system
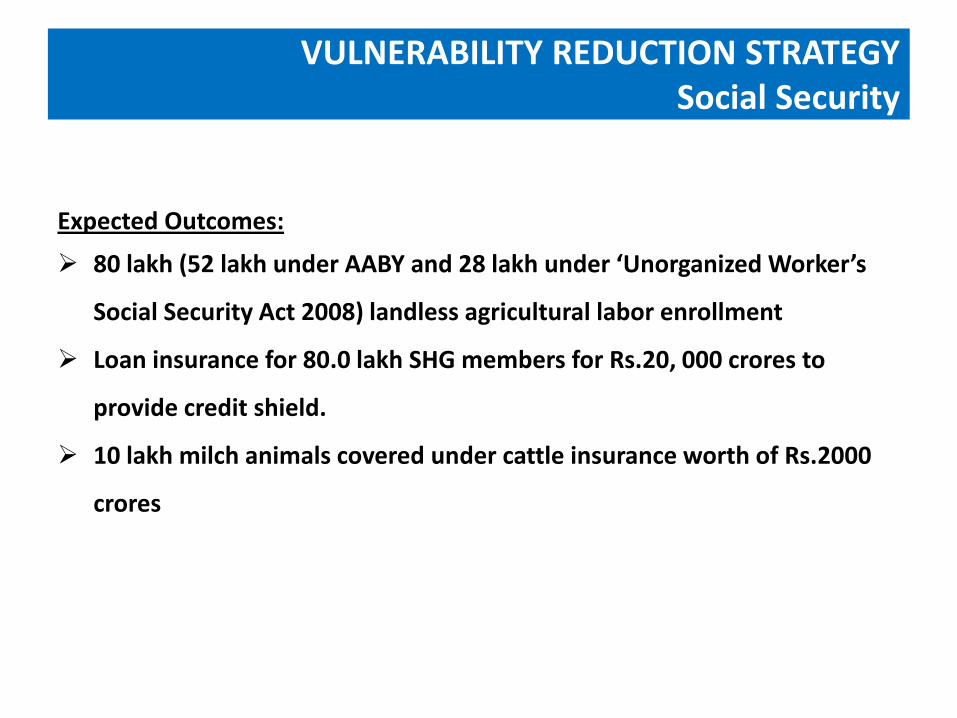
VULNERABILITY REDUCTION STRATEGY Social Security
Expected Outcomes:
80 lakh (52 lakh under AABY and 28 lakh under ‘Unorganized Worker’s
Social Security Act 2008) landless agricultural labor enrollment
Loan insurance for 80.0 lakh SHG members for Rs.20, 000 crores to
provide credit shield.
10 lakh milch animals covered under cattle insurance worth of Rs.2000
crores
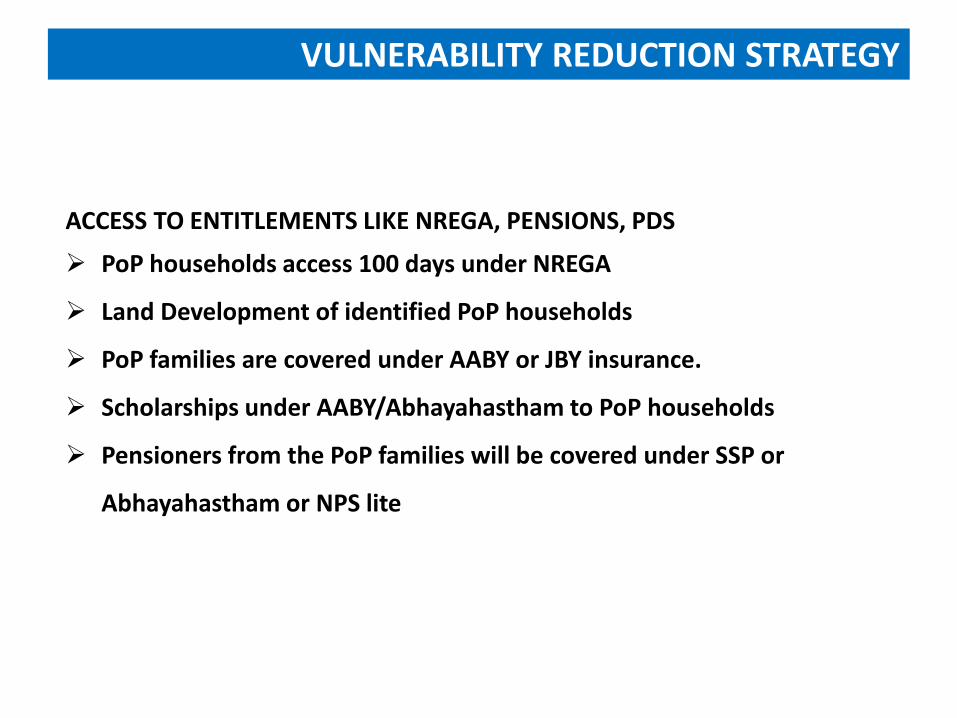
ACCESS TO ENTITLEMENTS LIKE NREGA, PENSIONS, PDS
PoP households access 100 days under NREGA
Land Development of identified PoP households
PoP families are covered under AABY or JBY insurance.
Scholarships under AABY/Abhayahastham to PoP households
Pensioners from the PoP families will be covered under SSP or
Abhayahastham or NPS lite
VULNERABILITY REDUCTION STRATEGY
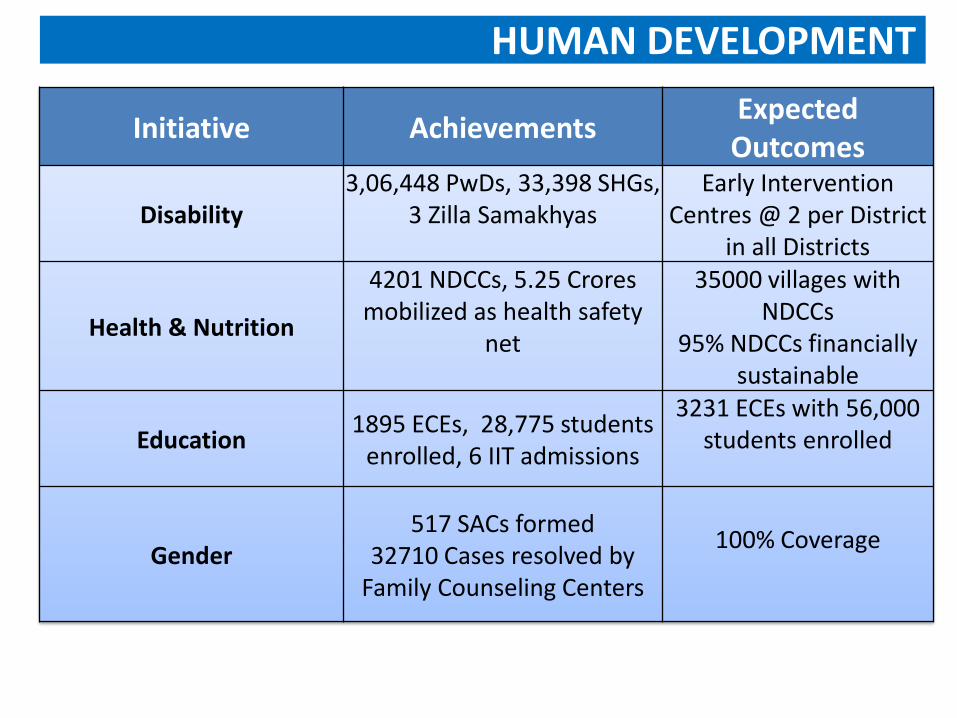
HUMAN DEVELOPMENT
Initiative Achievements Expected Outcomes
Disability 3,06,448 PwDs, 33,398 SHGs,
3 Zilla Samakhyas
Early Intervention Centres @ 2 per District
in all Districts
Health & Nutrition
4201 NDCCs, 5.25 Crores mobilized as health safety
net
35000 villages with NDCCs
95% NDCCs financially sustainable
Education 1895 ECEs, 28,775 students
enrolled, 6 IIT admissions
3231 ECEs with 56,000 students enrolled
Gender 517 SACs formed
32710 Cases resolved by Family Counseling Centers
100% Coverage
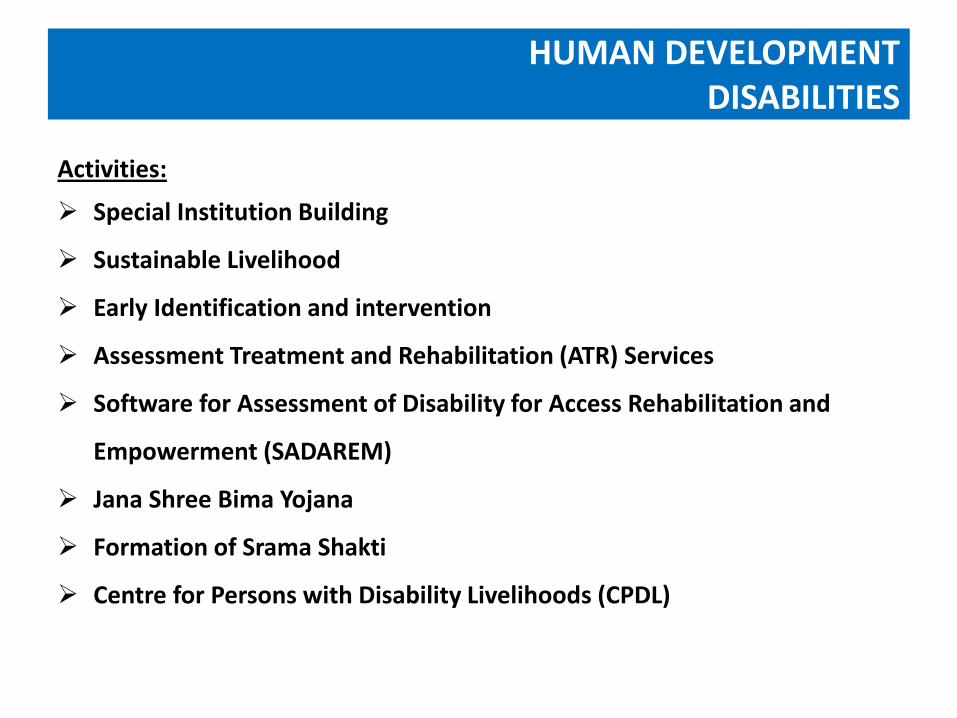
HUMAN DEVELOPMENT DISABILITIES
Activities:
Special Institution Building
Sustainable Livelihood
Early Identification and intervention
Assessment Treatment and Rehabilitation (ATR) Services
Software for Assessment of Disability for Access Rehabilitation and
Empowerment (SADAREM)
Jana Shree Bima Yojana
Formation of Srama Shakti
Centre for Persons with Disability Livelihoods (CPDL)
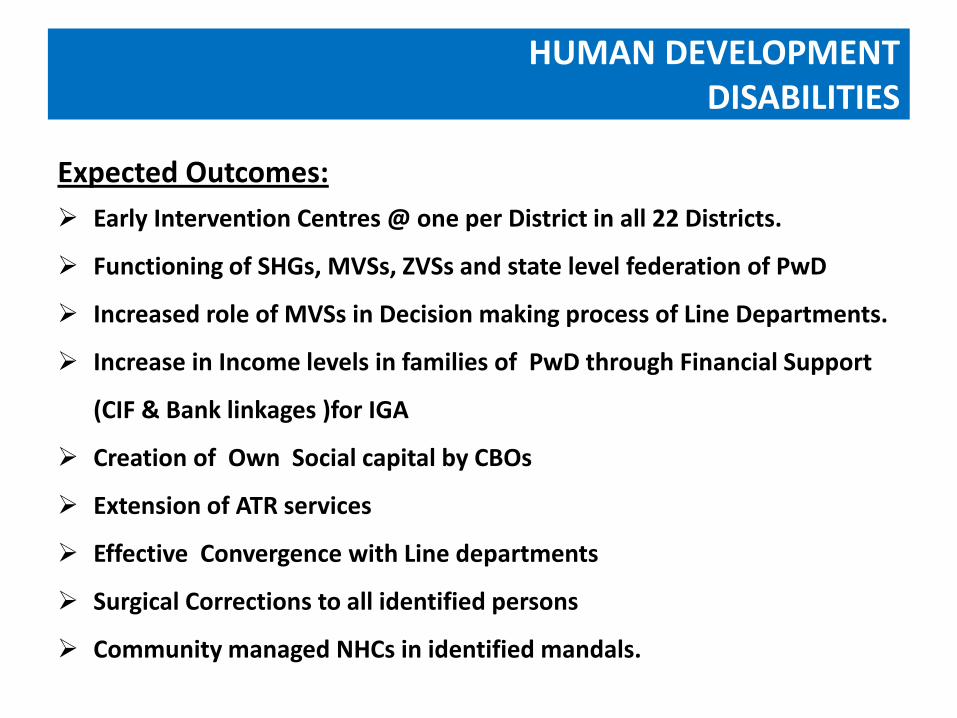
HUMAN DEVELOPMENT DISABILITIES
Expected Outcomes:
Early Intervention Centres @ one per District in all 22 Districts.
Functioning of SHGs, MVSs, ZVSs and state level federation of PwD
Increased role of MVSs in Decision making process of Line Departments.
Increase in Income levels in families of PwD through Financial Support
(CIF & Bank linkages )for IGA
Creation of Own Social capital by CBOs
Extension of ATR services
Effective Convergence with Line departments
Surgical Corrections to all identified persons
Community managed NHCs in identified mandals.
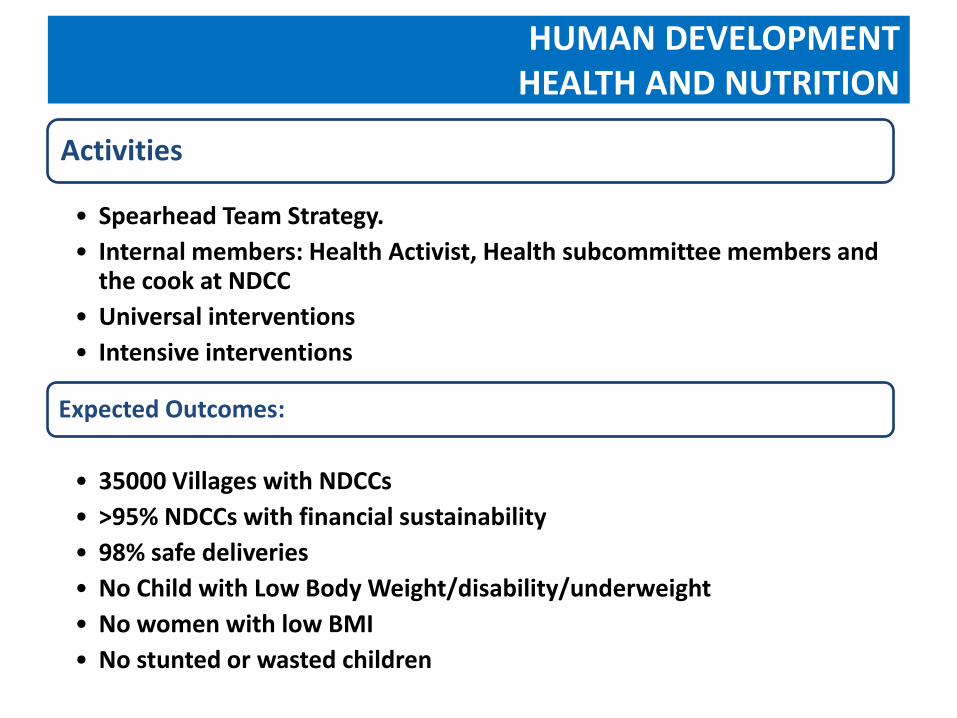
HUMAN DEVELOPMENT HEALTH AND NUTRITION
Activities
• Spearhead Team Strategy.
• Internal members: Health Activist, Health subcommittee members and the cook at NDCC
• Universal interventions
• Intensive interventions
Expected Outcomes:
• 35000 Villages with NDCCs
• >95% NDCCs with financial sustainability
• 98% safe deliveries
• No Child with Low Body Weight/disability/underweight
• No women with low BMI
• No stunted or wasted children
VULNERABILITY REDUCTION STRATEGY Community Managed Education Services
Activities:
Community governed, community managed ECE centres
District Resource Centre (DRC) for Supporting & monitoring the ECE
centres.
Two State Resource Centres (SRCs) for providing technical support to the
DRCs
Innovative Residential Bridge Course for drop-out tribal youth
Bala Mitra & Career Counselling
VULNERABILITY REDUCTION STRATEGY Community Managed Education Services
Expected Outcomes:
Children are ready for formal primary school.
Children at Class I attained desirable learning outcomes
Every child in all the 9000 villages enrolled in the ECE centre
Reduced drop-out rate in the tribal areas.
Improved quality of studies and confidence through Balamitra.
HUMAN DEVELOPMENT GENDER
Activities:
Formation of Social Action Committees in all Mandals and villages.
Training to all these committee members on Gender specific basic and
strategic needs
Develop State level Resource Centre
HUMAN DEVELOPMENT GENDER
Expected Outcomes:
Presence of Gender point persons in all CBO Forums
Conducting Regular gender enquiries
SHG women and Girls resist violence
No untouchability, Liquor, Child marriages, Child Labor
Education for all Girls
All births, deaths, marriages will be registered.
Enhancing women’s participation in Local Governing Bodies
Active counseling
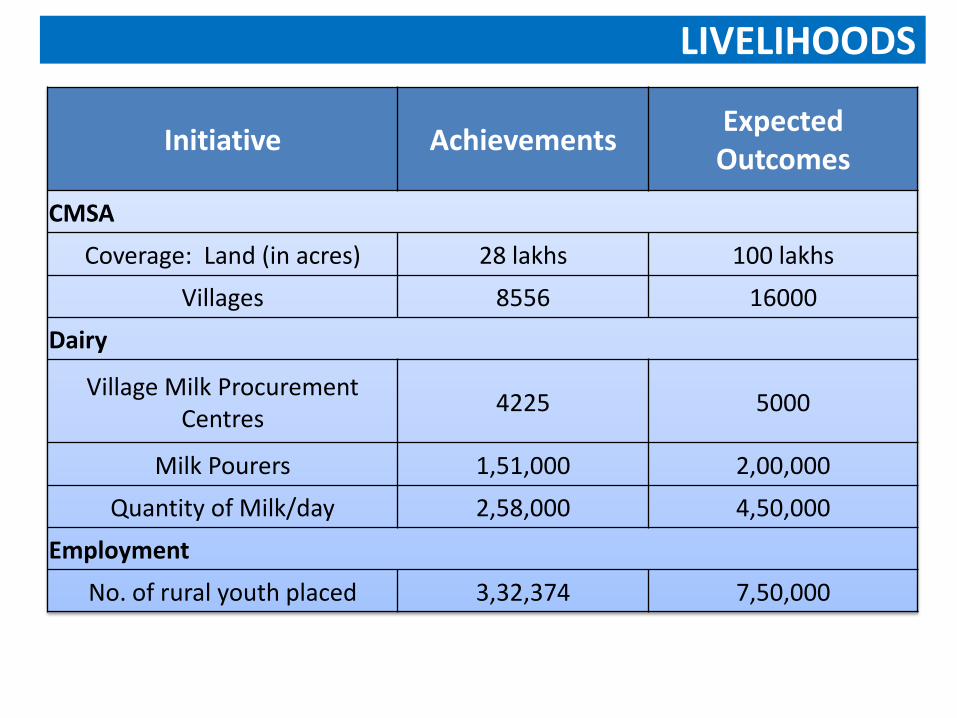
Initiative Achievements Expected Outcomes
CMSA
Coverage: Land (in acres) 28 lakhs 100 lakhs
Villages 8556 16000
Dairy
Village Milk Procurement Centres
4225 5000
Milk Pourers 1,51,000 2,00,000
Quantity of Milk/day 2,58,000 4,50,000
Employment
No. of rural youth placed 3,32,374 7,50,000
LIVELIHOODS
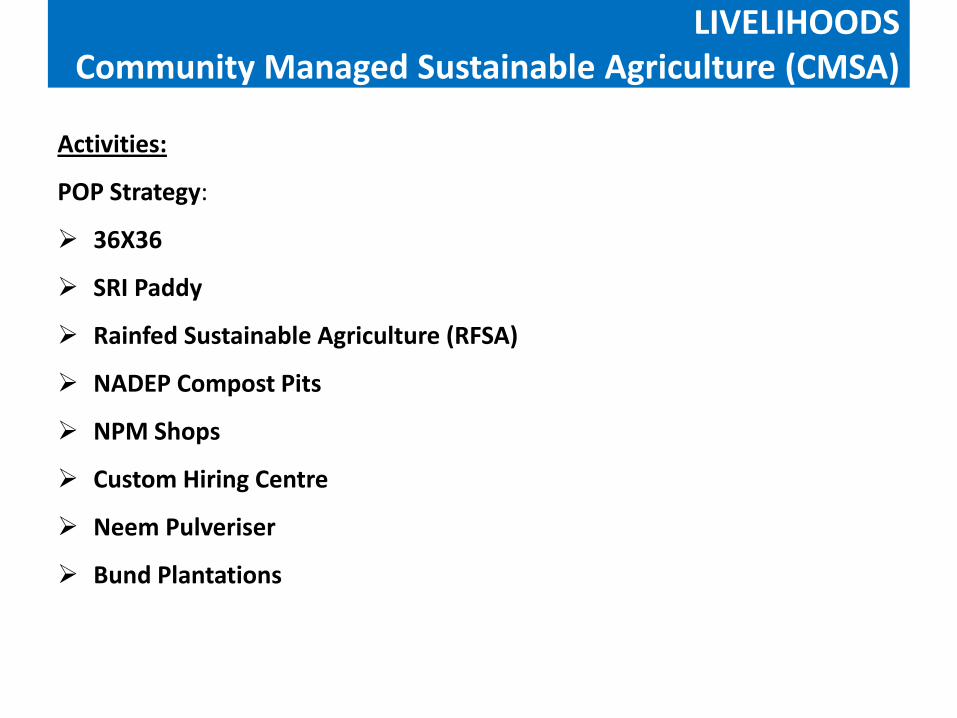
LIVELIHOODS Community Managed Sustainable Agriculture (CMSA)
Activities:
POP Strategy:
36X36
SRI Paddy
Rainfed Sustainable Agriculture (RFSA)
NADEP Compost Pits
NPM Shops
Custom Hiring Centre
Neem Pulveriser
Bund Plantations
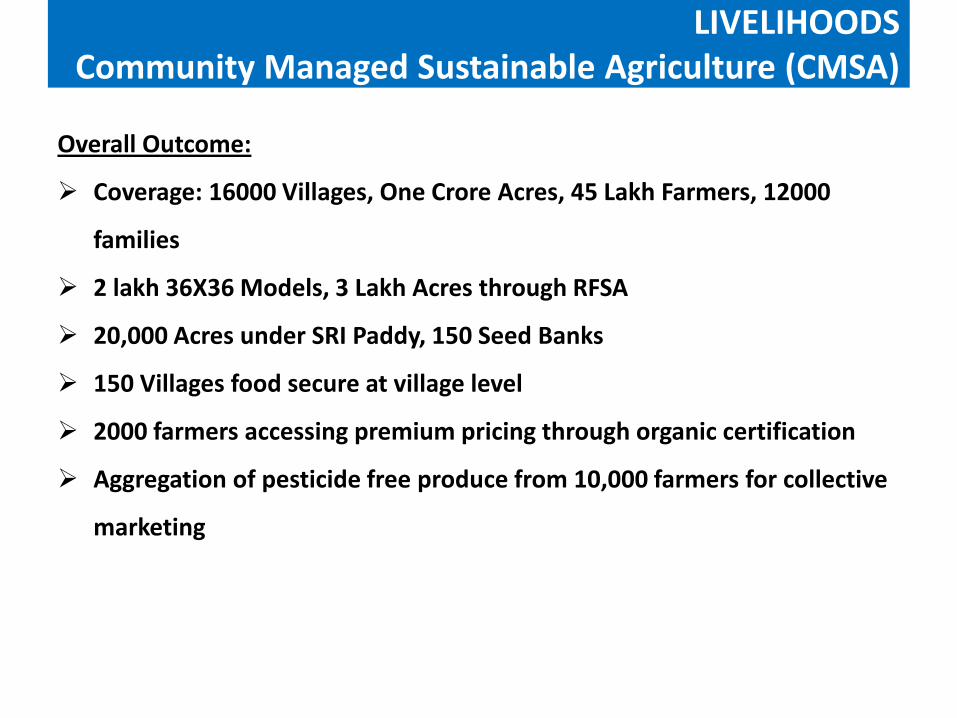
LIVELIHOODS Community Managed Sustainable Agriculture (CMSA)
Overall Outcome:
Coverage: 16000 Villages, One Crore Acres, 45 Lakh Farmers, 12000
families
2 lakh 36X36 Models, 3 Lakh Acres through RFSA
20,000 Acres under SRI Paddy, 150 Seed Banks
150 Villages food secure at village level
2000 farmers accessing premium pricing through organic certification
Aggregation of pesticide free produce from 10,000 farmers for collective
marketing
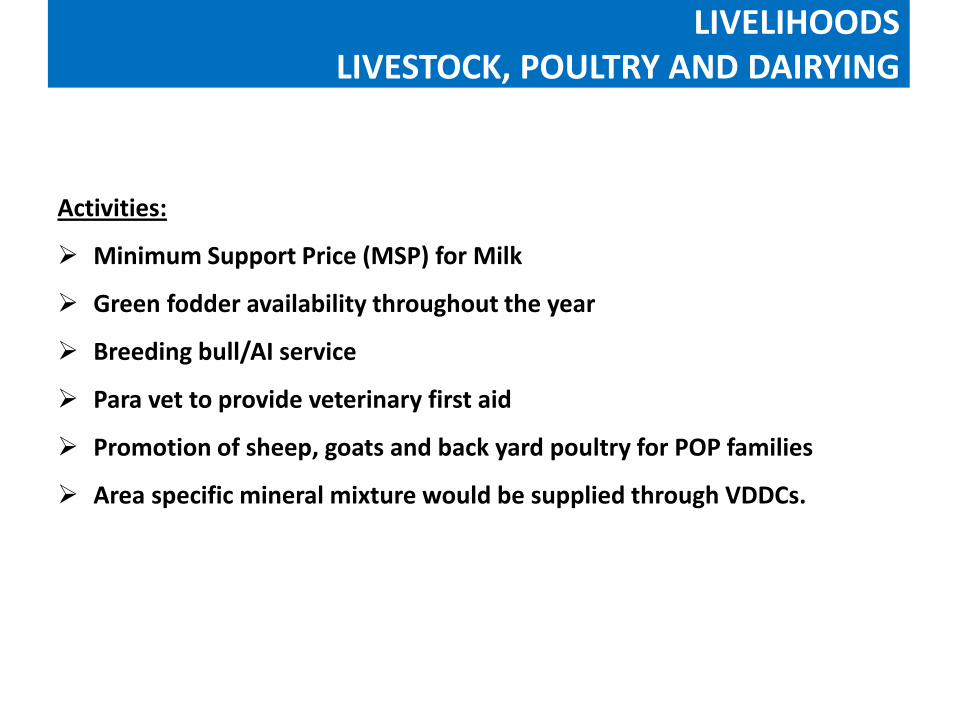
LIVELIHOODS LIVESTOCK, POULTRY AND DAIRYING
Activities:
Minimum Support Price (MSP) for Milk
Green fodder availability throughout the year
Breeding bull/AI service
Para vet to provide veterinary first aid
Promotion of sheep, goats and back yard poultry for POP families
Area specific mineral mixture would be supplied through VDDCs.
LIVELIHOODS LIVESTOCK, POULTRY AND DAIRYING
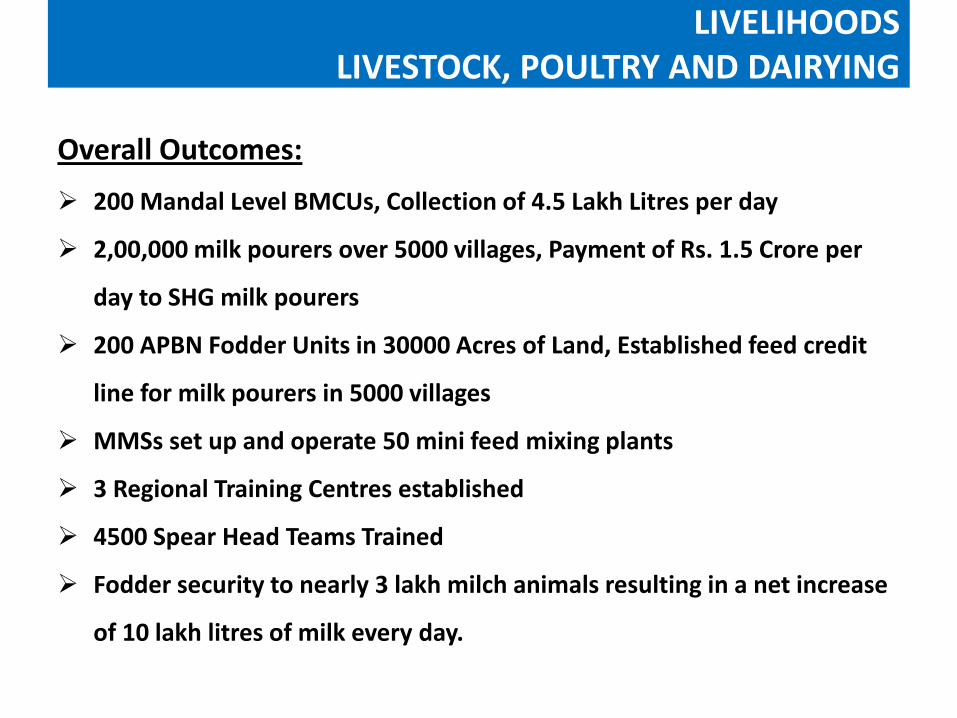
Overall Outcomes:
200 Mandal Level BMCUs, Collection of 4.5 Lakh Litres per day
2,00,000 milk pourers over 5000 villages, Payment of Rs. 1.5 Crore per
day to SHG milk pourers
200 APBN Fodder Units in 30000 Acres of Land, Established feed credit
line for milk pourers in 5000 villages
MMSs set up and operate 50 mini feed mixing plants
3 Regional Training Centres established
4500 Spear Head Teams Trained
Fodder security to nearly 3 lakh milch animals resulting in a net increase
of 10 lakh litres of milk every day.
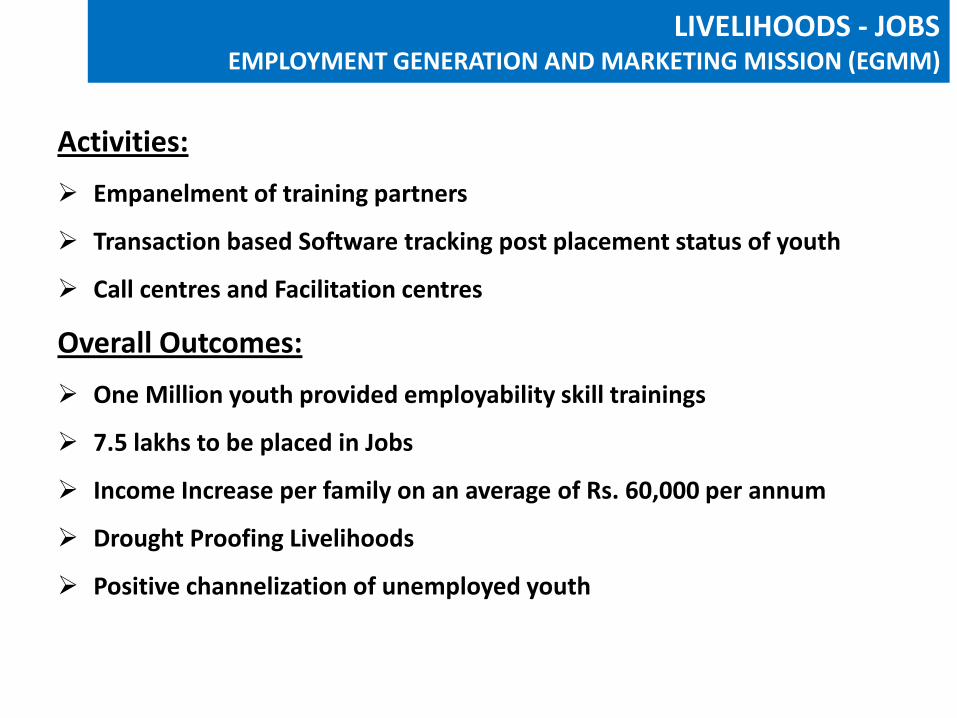
Activities:
Empanelment of training partners
Transaction based Software tracking post placement status of youth
Call centres and Facilitation centres
Overall Outcomes:
One Million youth provided employability skill trainings
7.5 lakhs to be placed in Jobs
Income Increase per family on an average of Rs. 60,000 per annum
Drought Proofing Livelihoods
Positive channelization of unemployed youth
LIVELIHOODS - JOBS EMPLOYMENT GENERATION AND MARKETING MISSION (EGMM)
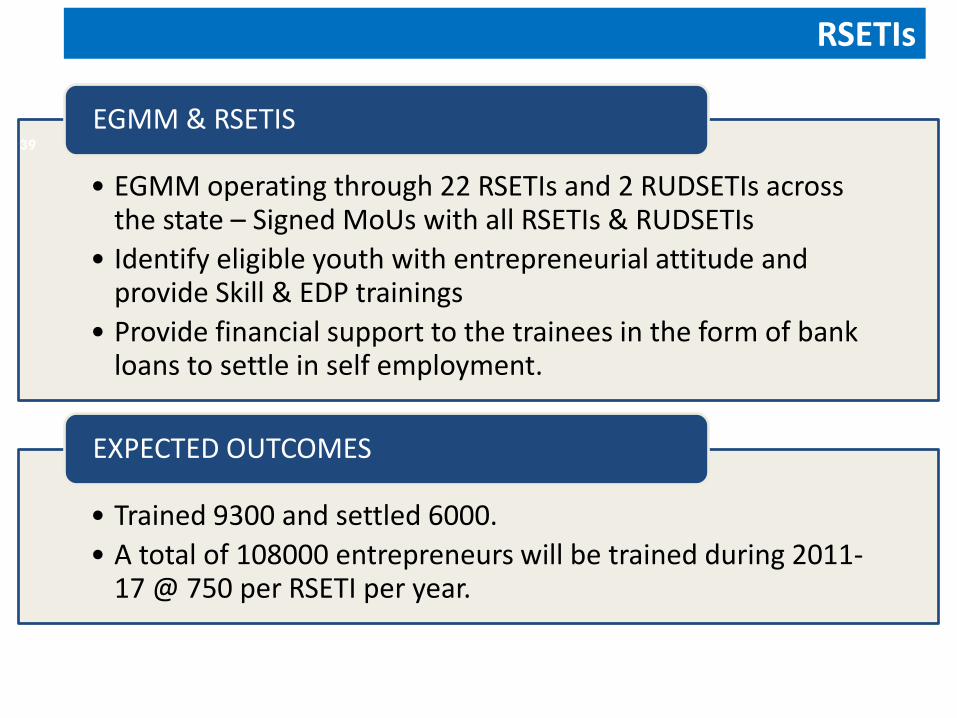
• EGMM operating through 22 RSETIs and 2 RUDSETIs across the state – Signed MoUs with all RSETIs & RUDSETIs
• Identify eligible youth with entrepreneurial attitude and provide Skill & EDP trainings
• Provide financial support to the trainees in the form of bank loans to settle in self employment.
EGMM & RSETIS
• Trained 9300 and settled 6000.
• A total of 108000 entrepreneurs will be trained during 2011-17 @ 750 per RSETI per year.
EXPECTED OUTCOMES
39
RSETIs
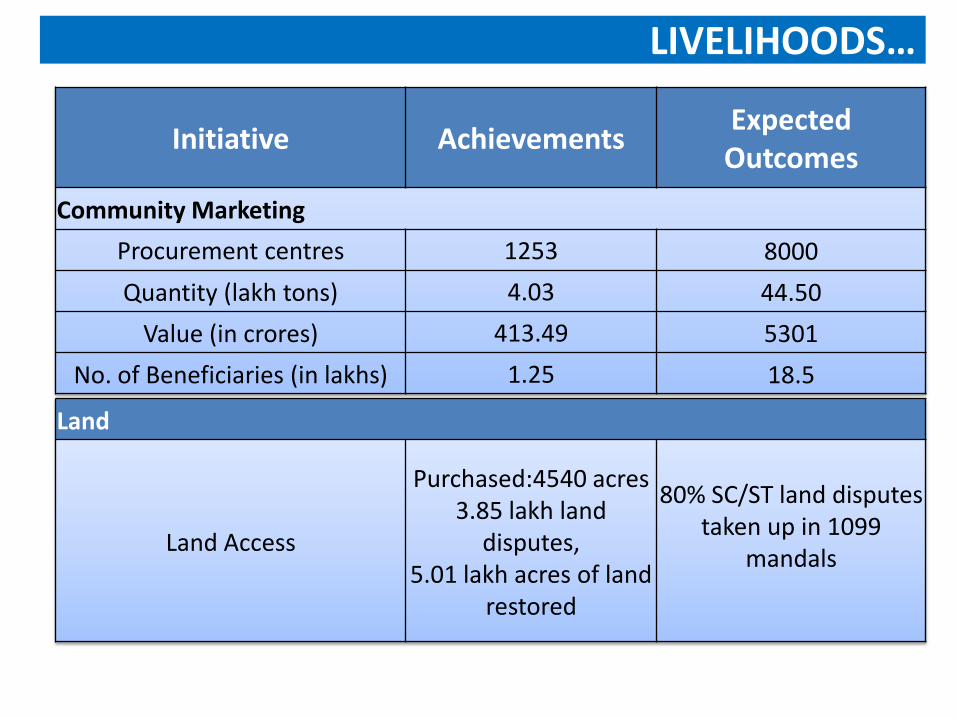
Initiative Achievements Expected Outcomes
Community Marketing
Procurement centres 1253 8000
Quantity (lakh tons) 4.03 44.50
Value (in crores) 413.49 5301
No. of Beneficiaries (in lakhs) 1.25 18.5
LIVELIHOODS…
Land
Land Access
Purchased:4540 acres 3.85 lakh land
disputes, 5.01 lakh acres of land
restored
80% SC/ST land disputes taken up in 1099
mandals
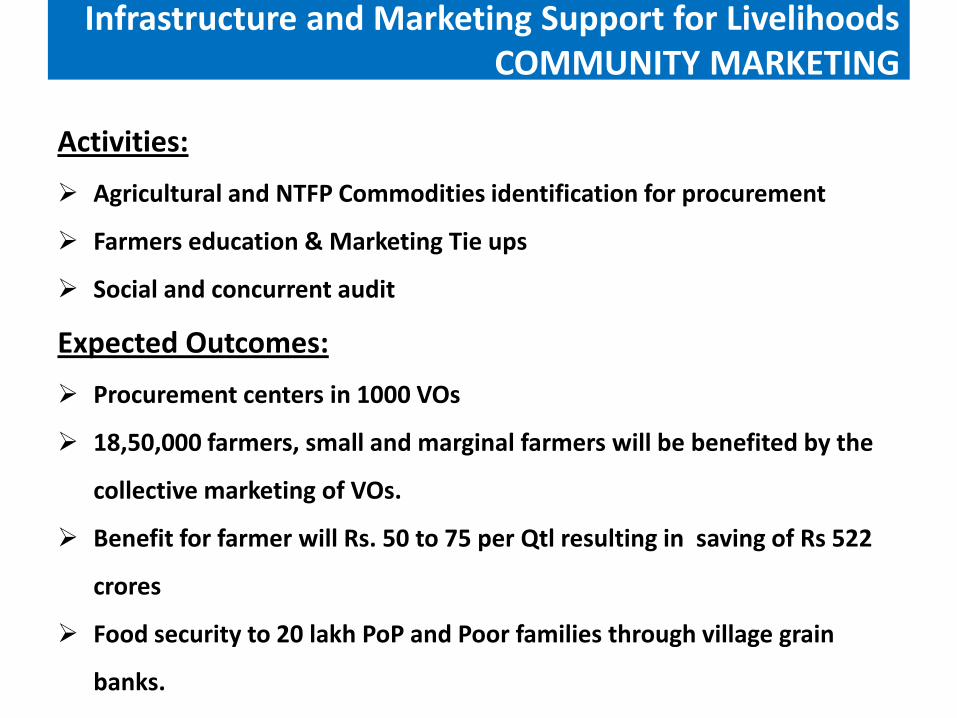
Activities:
Agricultural and NTFP Commodities identification for procurement
Farmers education & Marketing Tie ups
Social and concurrent audit
Expected Outcomes:
Procurement centers in 1000 VOs
18,50,000 farmers, small and marginal farmers will be benefited by the
collective marketing of VOs.
Benefit for farmer will Rs. 50 to 75 per Qtl resulting in saving of Rs 522
crores
Food security to 20 lakh PoP and Poor families through village grain
banks.
Infrastructure and Marketing Support for Livelihoods COMMUNITY MARKETING
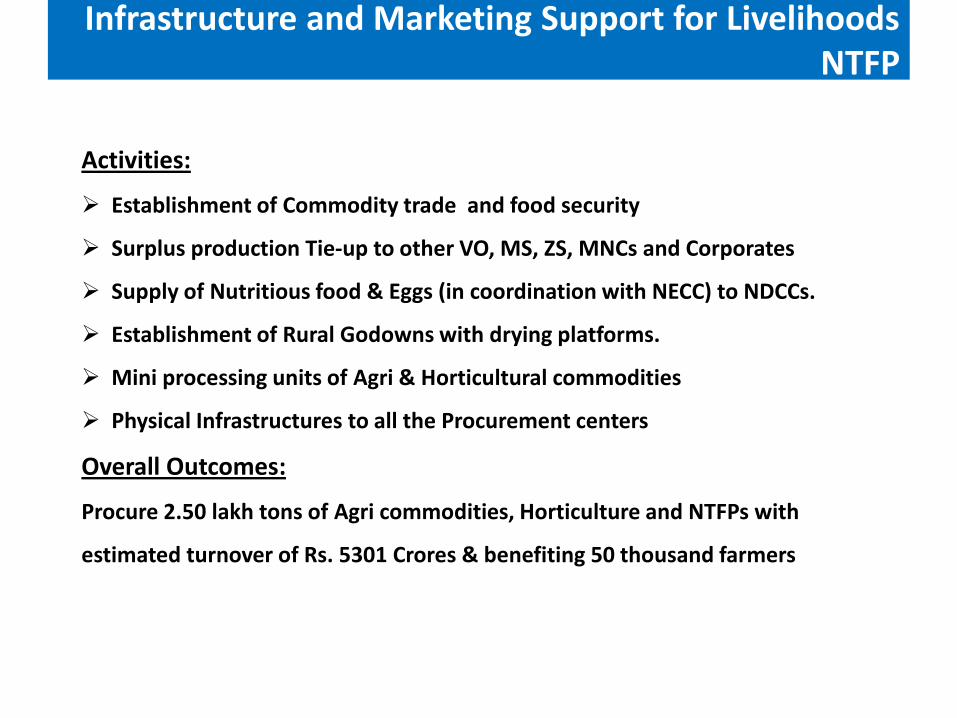
Infrastructure and Marketing Support for Livelihoods NTFP
Activities:
Establishment of Commodity trade and food security
Surplus production Tie-up to other VO, MS, ZS, MNCs and Corporates
Supply of Nutritious food & Eggs (in coordination with NECC) to NDCCs.
Establishment of Rural Godowns with drying platforms.
Mini processing units of Agri & Horticultural commodities
Physical Infrastructures to all the Procurement centers
Overall Outcomes:
Procure 2.50 lakh tons of Agri commodities, Horticulture and NTFPs with
estimated turnover of Rs. 5301 Crores & benefiting 50 thousand farmers
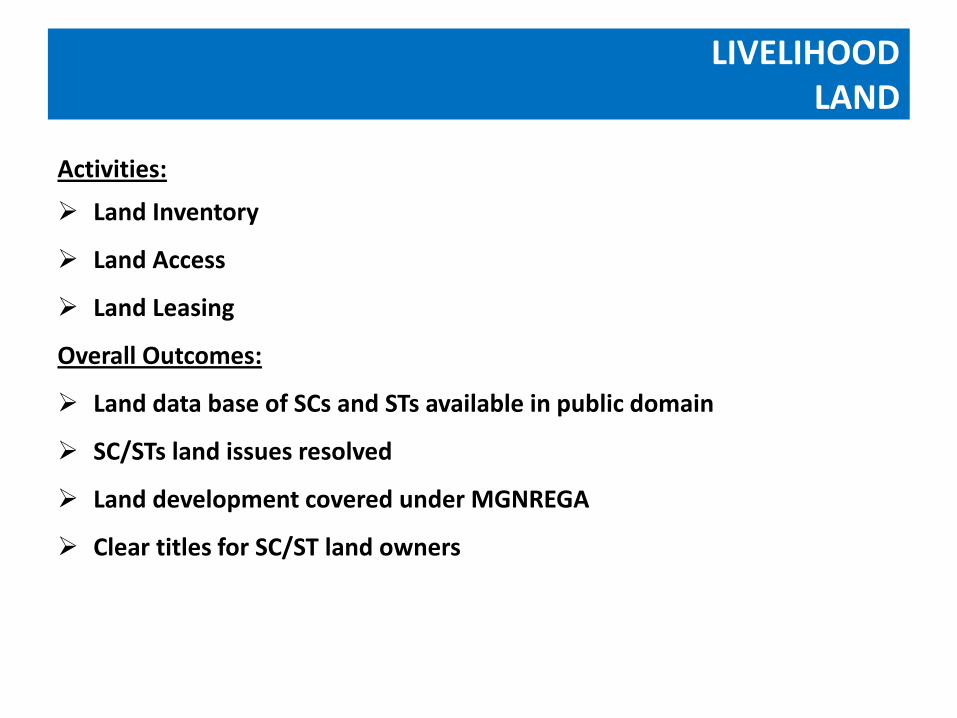
LIVELIHOOD LAND
Activities:
Land Inventory
Land Access
Land Leasing
Overall Outcomes:
Land data base of SCs and STs available in public domain
SC/STs land issues resolved
Land development covered under MGNREGA
Clear titles for SC/ST land owners
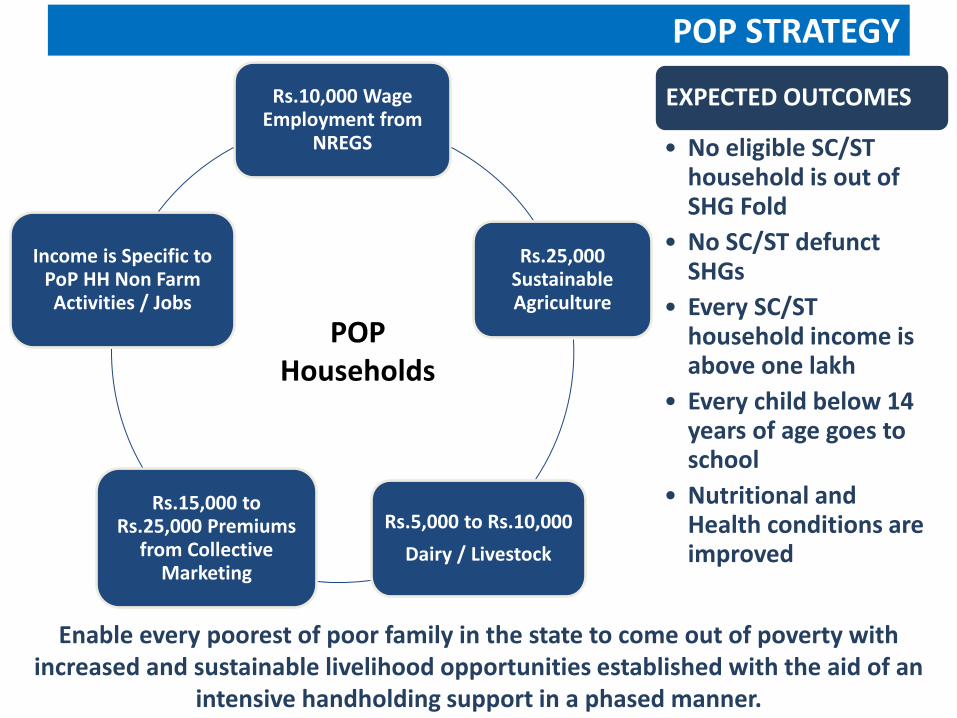
POP STRATEGY
Rs.10,000 Wage Employment from
NREGS
Rs.25,000 Sustainable Agriculture
Rs.5,000 to Rs.10,000
Dairy / Livestock
Rs.15,000 to Rs.25,000 Premiums
from Collective Marketing
Income is Specific to PoP HH Non Farm Activities / Jobs
POP Households
EXPECTED OUTCOMES
• No eligible SC/ST household is out of SHG Fold
• No SC/ST defunct SHGs
• Every SC/ST household income is above one lakh
• Every child below 14 years of age goes to school
• Nutritional and Health conditions are improved
Enable every poorest of poor family in the state to come out of poverty with increased and sustainable livelihood opportunities established with the aid of an
intensive handholding support in a phased manner.
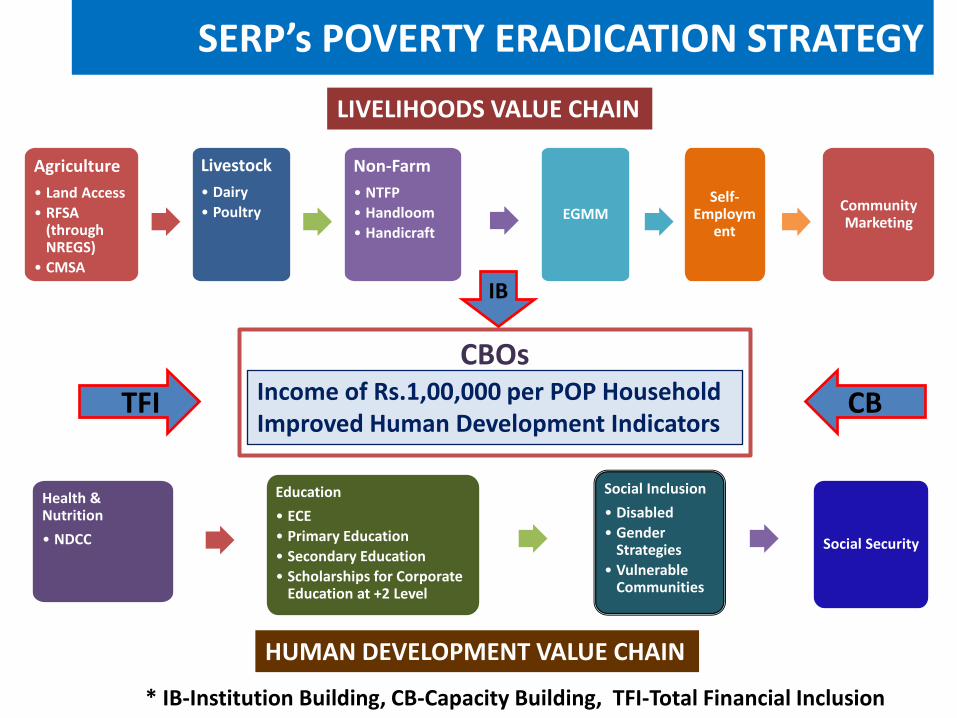
TFI CB
* IB-Institution Building, CB-Capacity Building, TFI-Total Financial Inclusion
HUMAN DEVELOPMENT VALUE CHAIN
LIVELIHOODS VALUE CHAIN
CBOs
Income of Rs.1,00,000 per POP Household Improved Human Development Indicators
IB
SERP’s POVERTY ERADICATION STRATEGY
Agriculture
• Land Access
• RFSA (through NREGS)
• CMSA
Livestock
• Dairy
• Poultry
Non-Farm
• NTFP
• Handloom
• Handicraft
Self- Employm
ent
Community Marketing
Health & Nutrition
• NDCC
Education
• ECE
• Primary Education
• Secondary Education
• Scholarships for Corporate Education at +2 Level
Social Inclusion
• Disabled
• Gender Strategies
• Vulnerable Communities
Social Security
EGMM
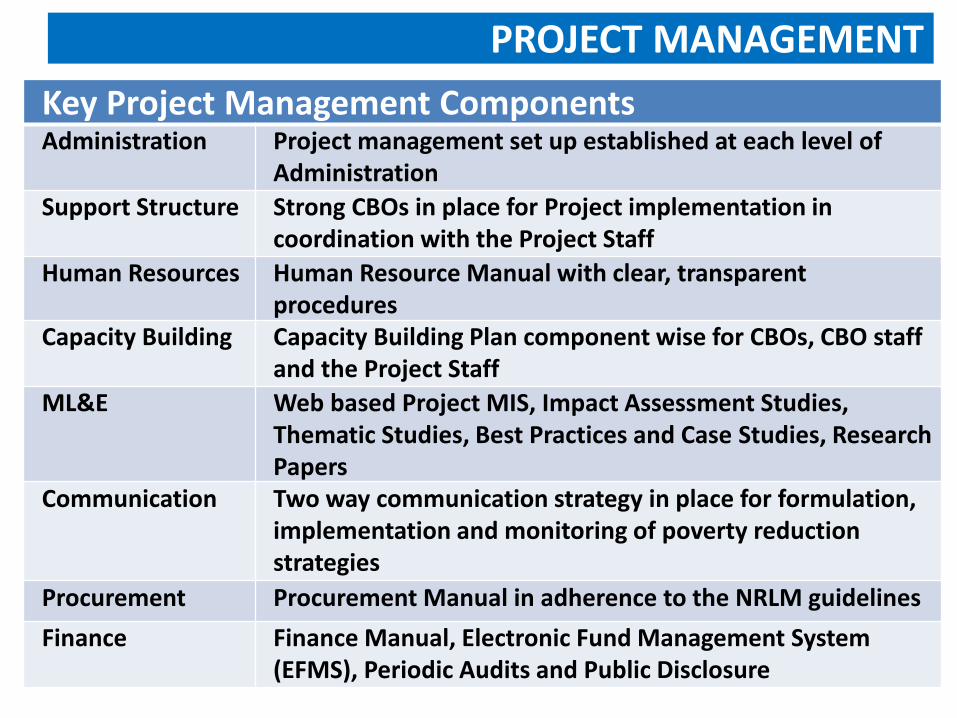
Key Project Management Components Administration Project management set up established at each level of
Administration
Support Structure Strong CBOs in place for Project implementation in coordination with the Project Staff
Human Resources Human Resource Manual with clear, transparent procedures
Capacity Building Capacity Building Plan component wise for CBOs, CBO staff and the Project Staff
ML&E Web based Project MIS, Impact Assessment Studies, Thematic Studies, Best Practices and Case Studies, Research Papers
Communication Two way communication strategy in place for formulation, implementation and monitoring of poverty reduction strategies
Procurement Procurement Manual in adherence to the NRLM guidelines
Finance Finance Manual, Electronic Fund Management System (EFMS), Periodic Audits and Public Disclosure
PROJECT MANAGEMENT
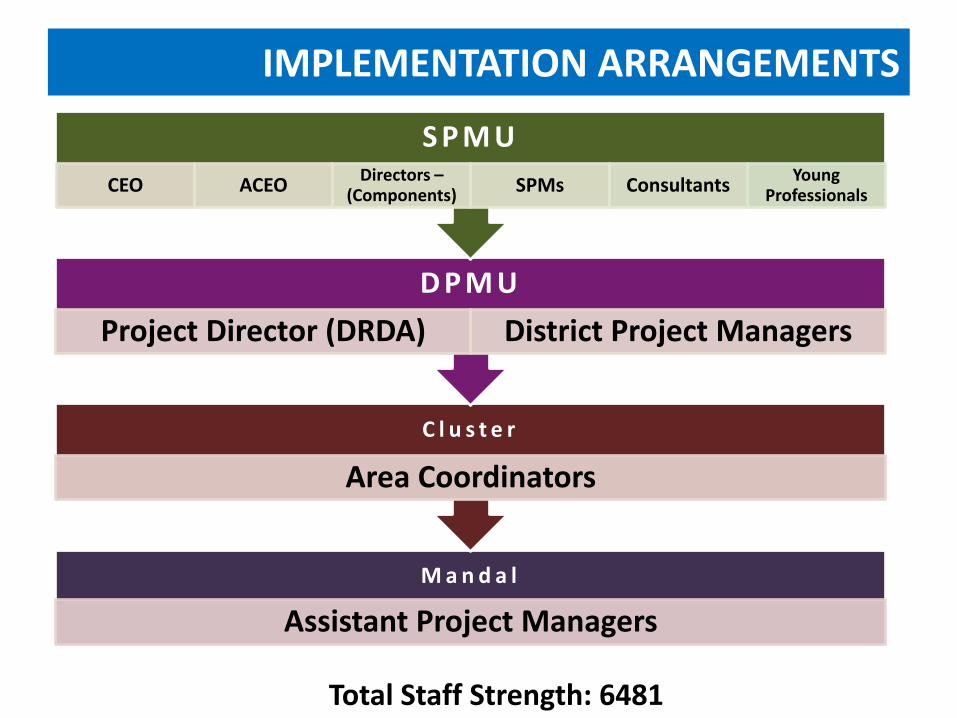
IMPLEMENTATION ARRANGEMENTS
M a n d a l
Assistant Project Managers
C l u s t e r
Area Coordinators
D P M U
Project Director (DRDA) District Project Managers
S P M U
CEO ACEO Directors –
(Components) SPMs Consultants
Young Professionals
Total Staff Strength: 6481
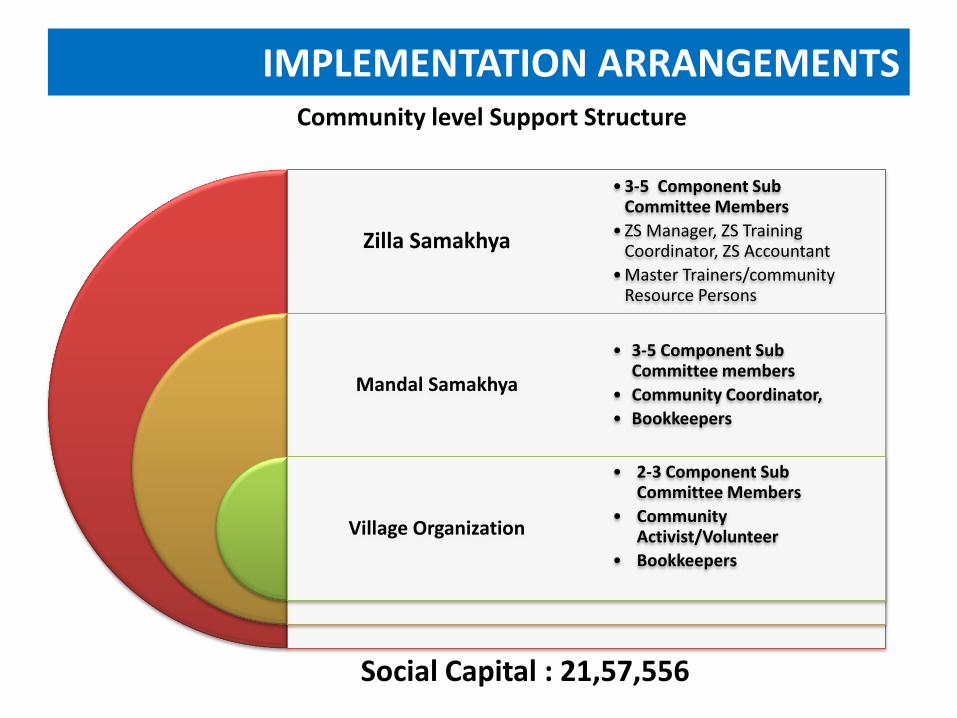
Zilla Samakhya
Mandal Samakhya
Village Organization
•3-5 Component Sub Committee Members
• ZS Manager, ZS Training Coordinator, ZS Accountant
•Master Trainers/community Resource Persons
• 3-5 Component Sub Committee members
• Community Coordinator,
• Bookkeepers
• 2-3 Component Sub Committee Members
• Community Activist/Volunteer
• Bookkeepers
Community level Support Structure
IMPLEMENTATION ARRANGEMENTS
Social Capital : 21,57,556
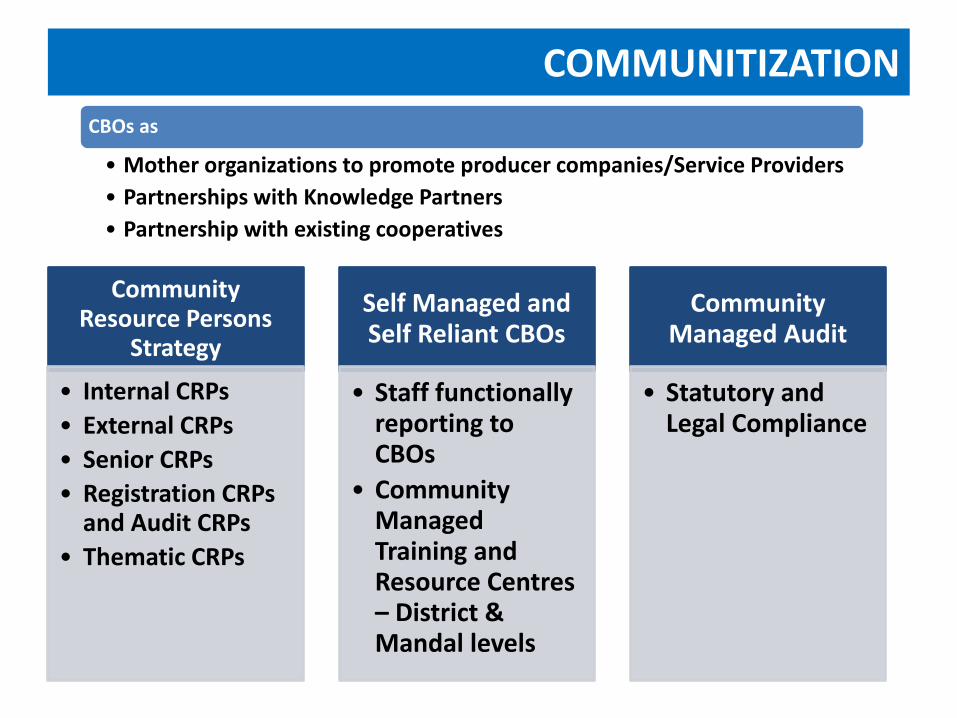
COMMUNITIZATION
Community Resource Persons
Strategy
• Internal CRPs
• External CRPs
• Senior CRPs
• Registration CRPs and Audit CRPs
• Thematic CRPs
Self Managed and Self Reliant CBOs
• Staff functionally reporting to CBOs
• Community Managed Training and Resource Centres – District & Mandal levels
Community Managed Audit
• Statutory and Legal Compliance
CBOs as
• Mother organizations to promote producer companies/Service Providers
• Partnerships with Knowledge Partners
• Partnership with existing cooperatives
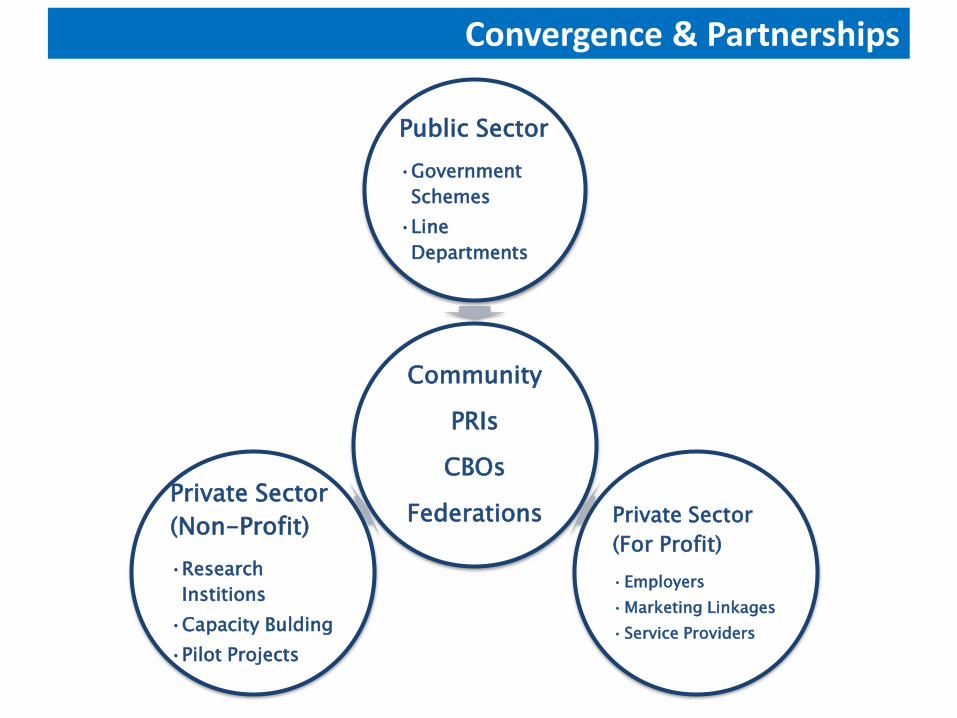
Convergence & Partnerships
Community
PRIs
CBOs
Federations
Public Sector
•Government
Schemes
•Line
Departments
Private Sector
(For Profit)
•Employers
•Marketing Linkages
•Service Providers
Private Sector
(Non-Profit)
•Research
Institions
•Capacity Bulding
•Pilot Projects
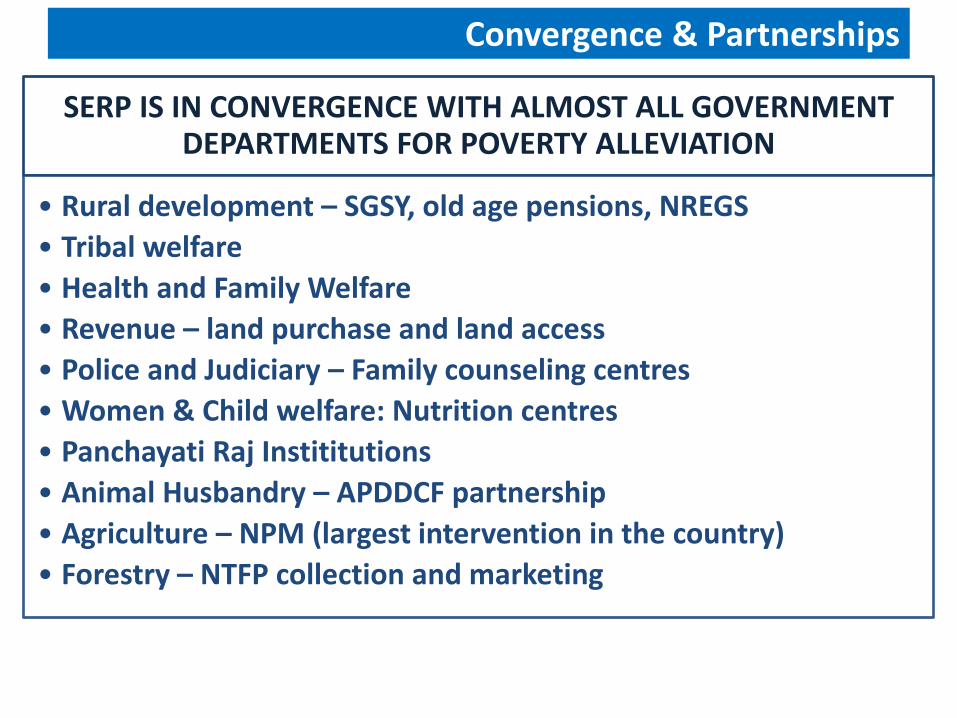
SERP IS IN CONVERGENCE WITH ALMOST ALL GOVERNMENT DEPARTMENTS FOR POVERTY ALLEVIATION
• Rural development – SGSY, old age pensions, NREGS
• Tribal welfare
• Health and Family Welfare
• Revenue – land purchase and land access
• Police and Judiciary – Family counseling centres
• Women & Child welfare: Nutrition centres
• Panchayati Raj Instititutions
• Animal Husbandry – APDDCF partnership
• Agriculture – NPM (largest intervention in the country)
• Forestry – NTFP collection and marketing
Convergence & Partnerships
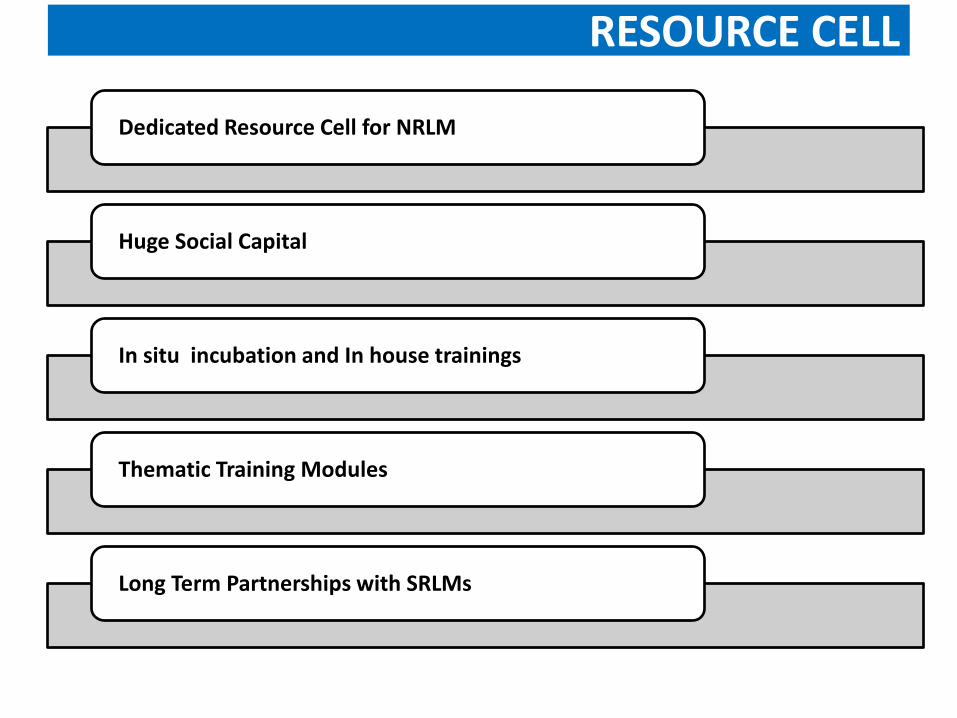
Dedicated Resource Cell for NRLM
Huge Social Capital
In situ incubation and In house trainings
Thematic Training Modules
Long Term Partnerships with SRLMs
RESOURCE CELL
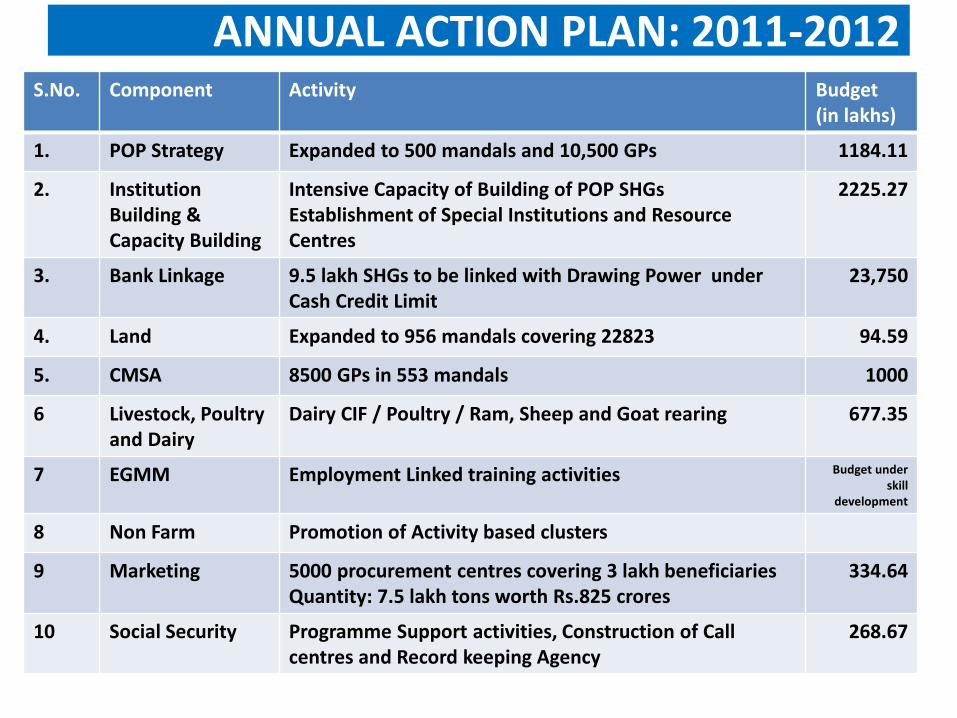
S.No. Component Activity Budget (in lakhs)
1. POP Strategy Expanded to 500 mandals and 10,500 GPs 1184.11
2. Institution Building & Capacity Building
Intensive Capacity of Building of POP SHGs Establishment of Special Institutions and Resource Centres
2225.27
3. Bank Linkage 9.5 lakh SHGs to be linked with Drawing Power under Cash Credit Limit
23,750
4. Land Expanded to 956 mandals covering 22823 94.59
5. CMSA 8500 GPs in 553 mandals 1000
6 Livestock, Poultry and Dairy
Dairy CIF / Poultry / Ram, Sheep and Goat rearing 677.35
7 EGMM Employment Linked training activities Budget under skill
development
8 Non Farm Promotion of Activity based clusters
9 Marketing 5000 procurement centres covering 3 lakh beneficiaries Quantity: 7.5 lakh tons worth Rs.825 crores
334.64
10 Social Security Programme Support activities, Construction of Call centres and Record keeping Agency
268.67
ANNUAL ACTION PLAN: 2011-2012
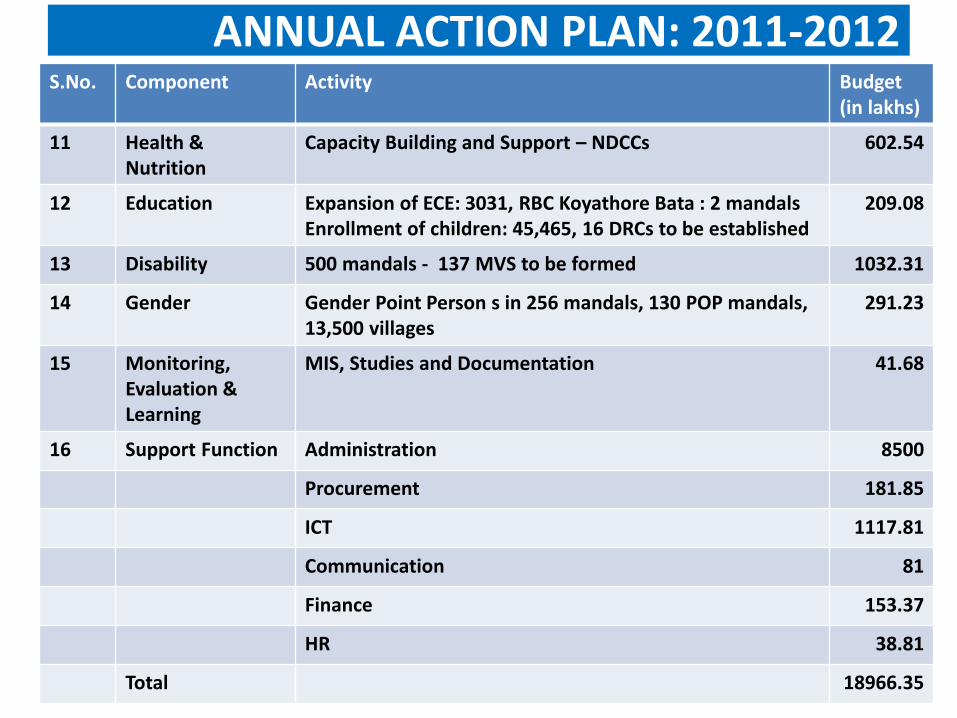
S.No. Component Activity Budget (in lakhs)
11 Health & Nutrition
Capacity Building and Support – NDCCs 602.54
12 Education Expansion of ECE: 3031, RBC Koyathore Bata : 2 mandals Enrollment of children: 45,465, 16 DRCs to be established
209.08
13 Disability 500 mandals - 137 MVS to be formed 1032.31
14 Gender Gender Point Person s in 256 mandals, 130 POP mandals, 13,500 villages
291.23
15 Monitoring, Evaluation & Learning
MIS, Studies and Documentation 41.68
16 Support Function Administration 8500
Procurement 181.85
ICT 1117.81
Communication 81
Finance 153.37
HR 38.81
Total 18966.35
ANNUAL ACTION PLAN: 2011-2012
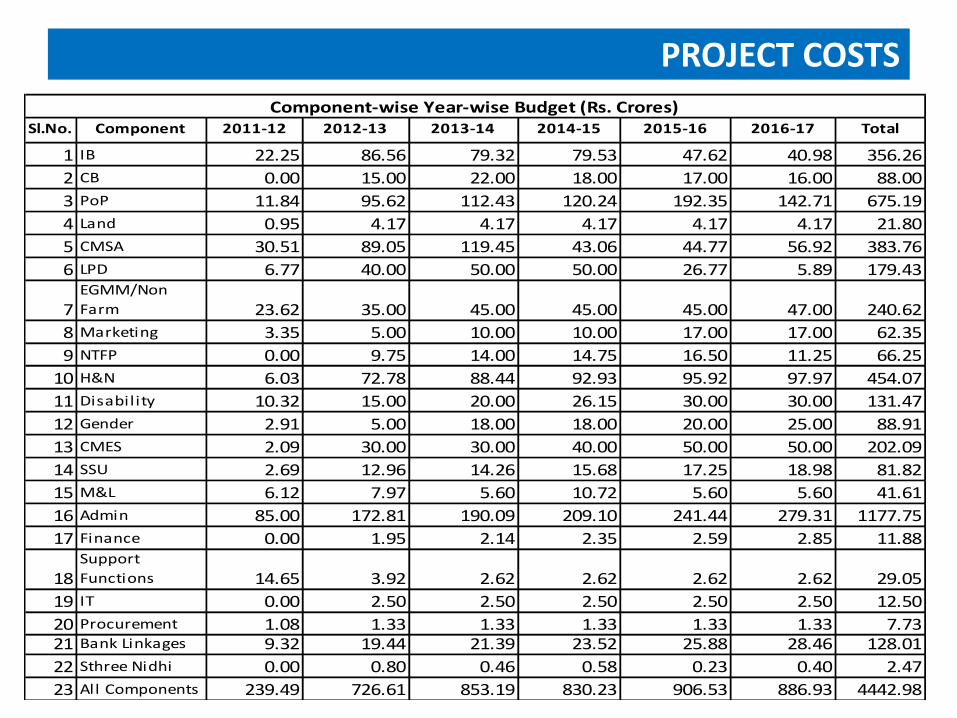
PROJECT COSTS
Sl.No. Component 2011-12 2012-13 2013-14 2014-15 2015-16 2016-17 Total
1 IB 22.25 86.56 79.32 79.53 47.62 40.98 356.26
2 CB 0.00 15.00 22.00 18.00 17.00 16.00 88.00
3 PoP 11.84 95.62 112.43 120.24 192.35 142.71 675.19
4 Land 0.95 4.17 4.17 4.17 4.17 4.17 21.80
5 CMSA 30.51 89.05 119.45 43.06 44.77 56.92 383.76
6 LPD 6.77 40.00 50.00 50.00 26.77 5.89 179.43
7EGMM/Non
Farm 23.62 35.00 45.00 45.00 45.00 47.00 240.62
8 Marketing 3.35 5.00 10.00 10.00 17.00 17.00 62.35
9 NTFP 0.00 9.75 14.00 14.75 16.50 11.25 66.25
10 H&N 6.03 72.78 88.44 92.93 95.92 97.97 454.07
11 Disability 10.32 15.00 20.00 26.15 30.00 30.00 131.47
12 Gender 2.91 5.00 18.00 18.00 20.00 25.00 88.91
13 CMES 2.09 30.00 30.00 40.00 50.00 50.00 202.09
14 SSU 2.69 12.96 14.26 15.68 17.25 18.98 81.82
15 M&L 6.12 7.97 5.60 10.72 5.60 5.60 41.61
16 Admin 85.00 172.81 190.09 209.10 241.44 279.31 1177.75
17 Finance 0.00 1.95 2.14 2.35 2.59 2.85 11.88
18Support
Functions 14.65 3.92 2.62 2.62 2.62 2.62 29.05
19 IT 0.00 2.50 2.50 2.50 2.50 2.50 12.50
20 Procurement 1.08 1.33 1.33 1.33 1.33 1.33 7.7321 Bank Linkages 9.32 19.44 21.39 23.52 25.88 28.46 128.01
22 Sthree Nidhi 0.00 0.80 0.46 0.58 0.23 0.40 2.47
23 All Components 239.49 726.61 853.19 830.23 906.53 886.93 4442.98
Component-wise Year-wise Budget (Rs. Crores)
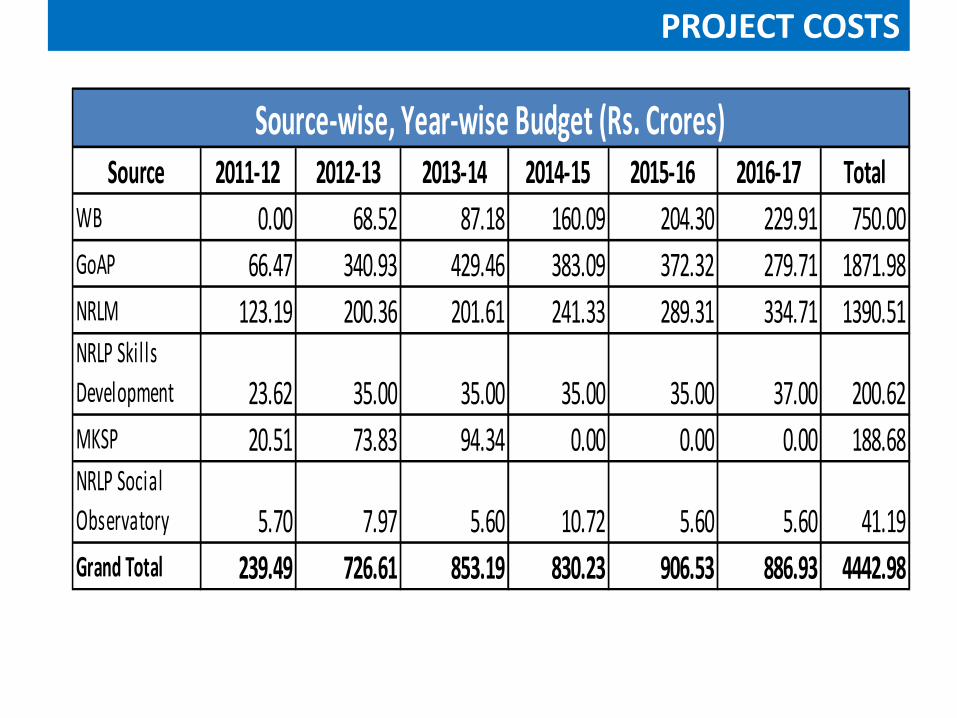
PROJECT COSTS
Source 2011-12 2012-13 2013-14 2014-15 2015-16 2016-17 Total
WB 0.00 68.52 87.18 160.09 204.30 229.91 750.00
GoAP 66.47 340.93 429.46 383.09 372.32 279.71 1871.98
NRLM 123.19 200.36 201.61 241.33 289.31 334.71 1390.51NRLP Skills
Development 23.62 35.00 35.00 35.00 35.00 37.00 200.62
MKSP 20.51 73.83 94.34 0.00 0.00 0.00 188.68NRLP Social
Observatory 5.70 7.97 5.60 10.72 5.60 5.60 41.19
Grand Total 239.49 726.61 853.19 830.23 906.53 886.93 4442.98
Source-wise, Year-wise Budget (Rs. Crores)
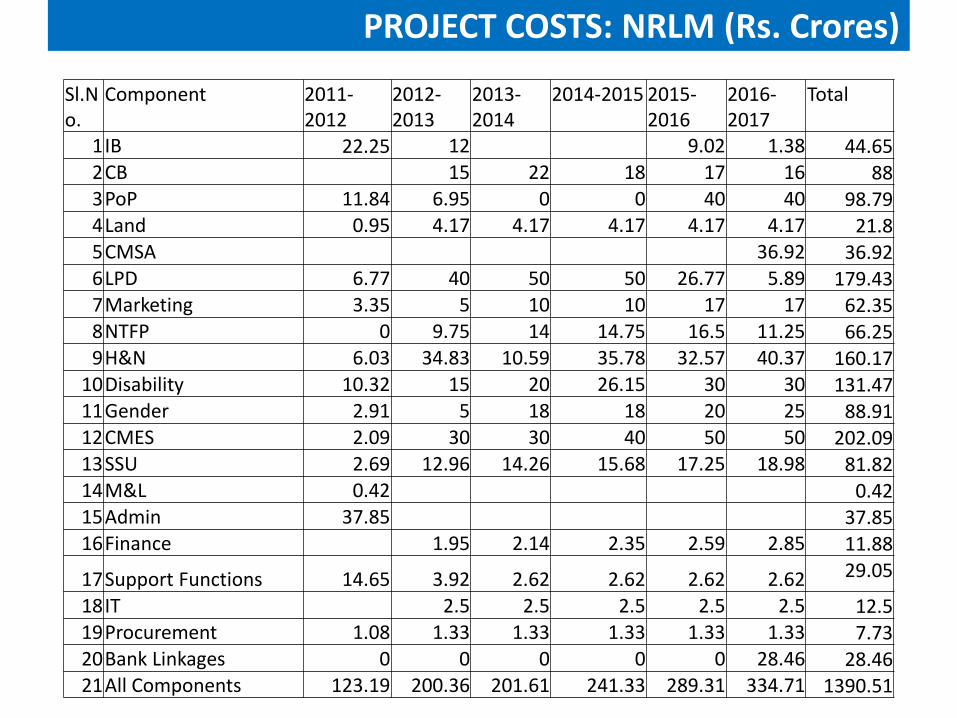
PROJECT COSTS: NRLM (Rs. Crores)
Sl.No.
Component 2011-2012
2012-2013
2013-2014
2014-2015 2015-2016
2016-2017
Total
1 IB 22.25 12 9.02 1.38 44.65 2 CB 15 22 18 17 16 88 3 PoP 11.84 6.95 0 0 40 40 98.79 4 Land 0.95 4.17 4.17 4.17 4.17 4.17 21.8 5 CMSA 36.92 36.92 6 LPD 6.77 40 50 50 26.77 5.89 179.43 7 Marketing 3.35 5 10 10 17 17 62.35 8 NTFP 0 9.75 14 14.75 16.5 11.25 66.25 9 H&N 6.03 34.83 10.59 35.78 32.57 40.37 160.17
10 Disability 10.32 15 20 26.15 30 30 131.47 11 Gender 2.91 5 18 18 20 25 88.91 12 CMES 2.09 30 30 40 50 50 202.09 13 SSU 2.69 12.96 14.26 15.68 17.25 18.98 81.82 14 M&L 0.42 0.42 15 Admin 37.85 37.85 16 Finance 1.95 2.14 2.35 2.59 2.85 11.88
17 Support Functions 14.65 3.92 2.62 2.62 2.62 2.62 29.05
18 IT 2.5 2.5 2.5 2.5 2.5 12.5 19 Procurement 1.08 1.33 1.33 1.33 1.33 1.33 7.73 20 Bank Linkages 0 0 0 0 0 28.46 28.46 21 All Components 123.19 200.36 201.61 241.33 289.31 334.71 1390.51
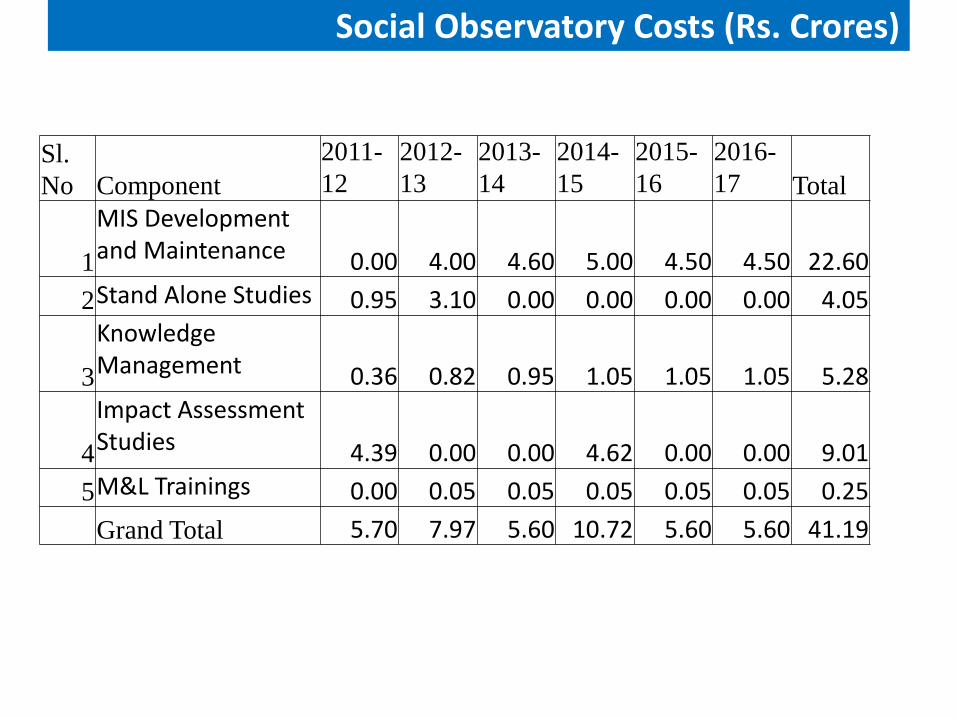
Social Observatory Costs (Rs. Crores)
Sl.
No Component
2011-
12
2012-
13
2013-
14
2014-
15
2015-
16
2016-
17 Total
1
MIS Development and Maintenance 0.00 4.00 4.60 5.00 4.50 4.50 22.60
2 Stand Alone Studies 0.95 3.10 0.00 0.00 0.00 0.00 4.05
3
Knowledge Management 0.36 0.82 0.95 1.05 1.05 1.05 5.28
4
Impact Assessment Studies 4.39 0.00 0.00 4.62 0.00 0.00 9.01
5 M&L Trainings 0.00 0.05 0.05 0.05 0.05 0.05 0.25
Grand Total 5.70 7.97 5.60 10.72 5.60 5.60 41.19
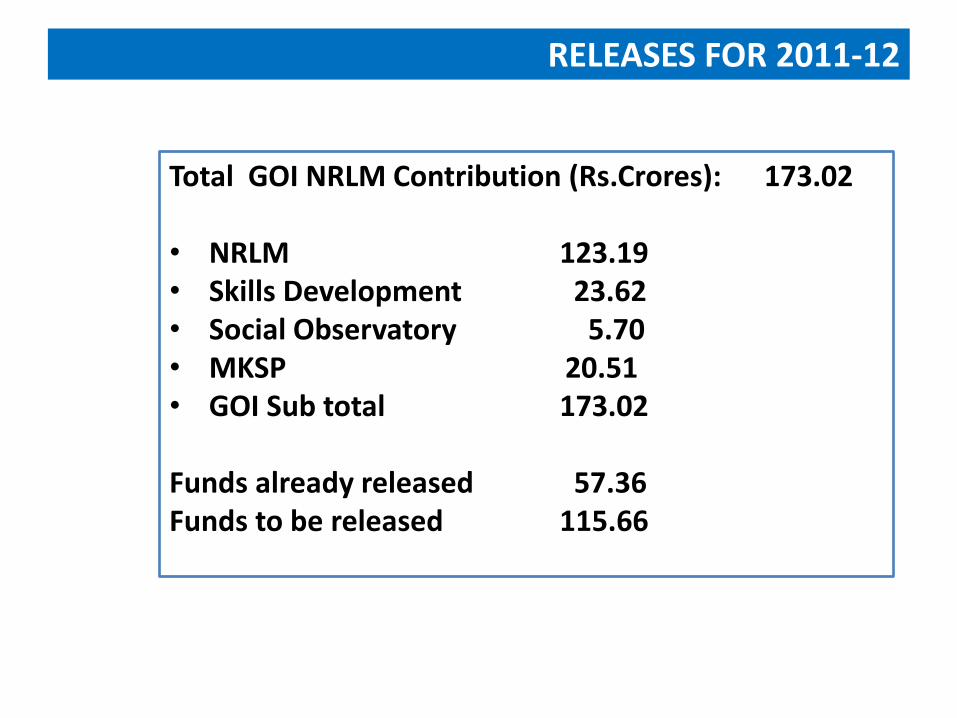
RELEASES FOR 2011-12
Total GOI NRLM Contribution (Rs.Crores): 173.02 • NRLM 123.19 • Skills Development 23.62 • Social Observatory 5.70 • MKSP 20.51 • GOI Sub total 173.02 Funds already released 57.36 Funds to be released 115.66