
AND
46
Slide 12 - 1 Copyright © 2009 Pearson Education, Inc. AND Active Learning Lecture Slides For use with Classroom Response Systems Chapter 12 Probability
description
AND. Active Learning Lecture Slides For use with Classroom Response Systems Chapter 12 Probability. Of 12 children playing at the playground, 4 are playing on the swing set. Determine the empirical probability that the next child to the playground will play on the swing set. a. c. b. d. - PowerPoint PPT Presentation
Transcript of AND

Slide 12 - 1Copyright © 2009 Pearson Education, Inc.
AND
Active Learning Lecture SlidesFor use with Classroom Response Systems
Chapter 12
Probability

Slide 12 - 2Copyright © 2009 Pearson Education, Inc.
Of 12 children playing at the playground, 4 are playing on the swing set. Determine the empirical probability that the next child to the playground will play on the swing set.
a.
c.
1
2
1
3b.
d.
1
4
1
6

Slide 12 - 3Copyright © 2009 Pearson Education, Inc.
Of 12 children playing at the playground, 4 are playing on the swing set. Determine the empirical probability that the next child to the playground will play on the swing set.
a.
c.
1
2
1
3b.
d.
1
4
1
6

Slide 12 - 4Copyright © 2009 Pearson Education, Inc.
Each of the numbers 0-9 is written on a sheet of paper and the ten sheets of paper are placed in a box. If one sheet of paper is selected at random from the box, determine the probability that the number selected is odd.
a.
c.
1
2
1
3b.
d.
1
4
1
6

Slide 12 - 5Copyright © 2009 Pearson Education, Inc.
Each of the numbers 0-9 is written on a sheet of paper and the ten sheets of paper are placed in a box. If one sheet of paper is selected at random from the box, determine the probability that the number selected is odd.
a.
c.
1
2
1
3b.
d.
1
4
1
6

Slide 12 - 6Copyright © 2009 Pearson Education, Inc.
Each of the numbers 0-9 is written on a sheet of paper and the ten sheets of paper are placed in a box. If one sheet of paper is selected at random from the box, determine the probability that the number selected is less than 3.
a.
c.
1
2
1
3b.
d.
3
10
7
10
Slide 12 - 7Copyright © 2009 Pearson Education, Inc.
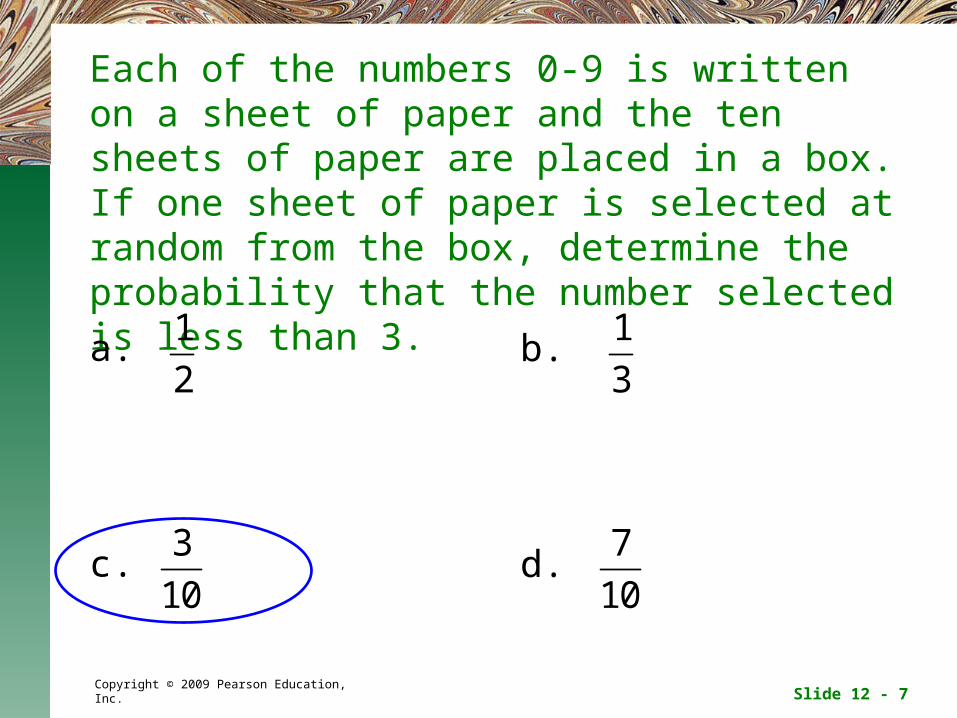
Each of the numbers 0-9 is written on a sheet of paper and the ten sheets of paper are placed in a box. If one sheet of paper is selected at random from the box, determine the probability that the number selected is less than 3.
a.
c.
1
2
1
3b.
d.
3
10
7
10

Slide 12 - 8Copyright © 2009 Pearson Education, Inc.
Each of the numbers 0-9 is written on a sheet of paper and the ten sheets of paper are placed in a box. If one sheet of paper is selected at random from the box, determine the probability that the number selected is greater than 5 or even.
a.
c.
1
2
1
3b.
d.
3
10
7
10
Slide 12 - 9Copyright © 2009 Pearson Education, Inc.
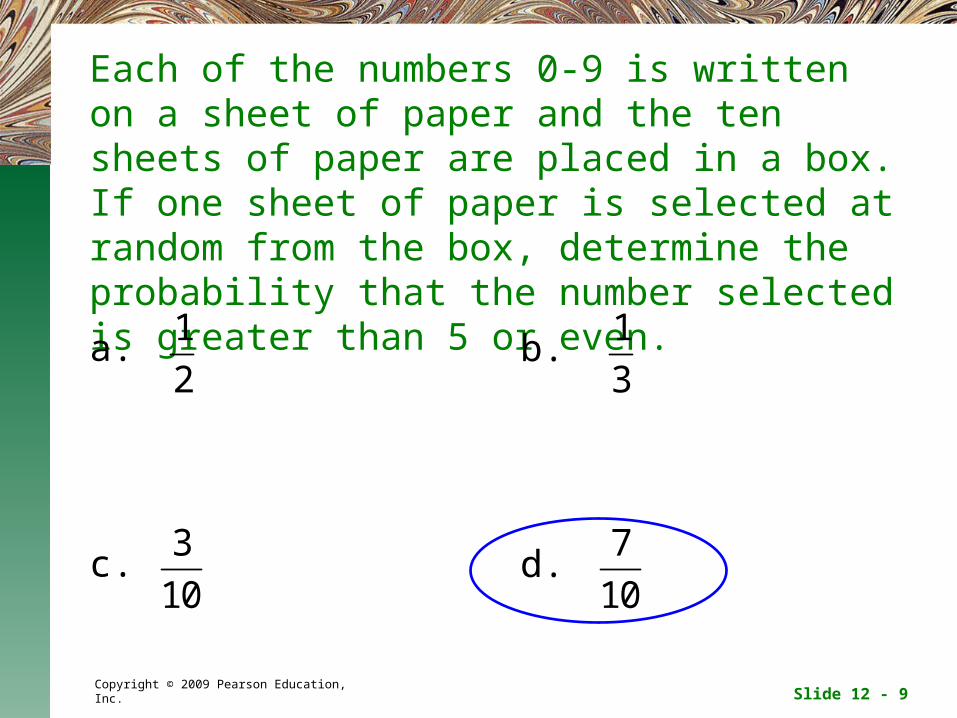
Each of the numbers 0-9 is written on a sheet of paper and the ten sheets of paper are placed in a box. If one sheet of paper is selected at random from the box, determine the probability that the number selected is greater than 5 or even.
a.
c.
1
2
1
3b.
d.
3
10
7
10

Slide 12 - 10Copyright © 2009 Pearson Education, Inc.
Each of the numbers 0-9 is written on a sheet of paper and the ten sheets of paper are placed in a box. If one sheet of paper is selected at random from the box, determine the probability that the number selected is odd and less than 4.
a.
c.
1
2
1
3b.
d.
2
5
1
5

Slide 12 - 11Copyright © 2009 Pearson Education, Inc.
Each of the numbers 0-9 is written on a sheet of paper and the ten sheets of paper are placed in a box. If one sheet of paper is selected at random from the box, determine the probability that the number selected is odd and less than 4.
a.
c.
1
2
1
3b.
d.
2
5
1
5

Slide 12 - 12Copyright © 2009 Pearson Education, Inc.
Each of the numbers 0-9 is written on a sheet of paper and the ten sheets of paper are placed in a box. If two sheets of paper are selected at random, without replacement, from the box, determine the probability that both numbers are odd.
a.
c.
2
9
1
5b.
d.
1
9
1
4
Slide 12 - 13Copyright © 2009 Pearson Education, Inc.
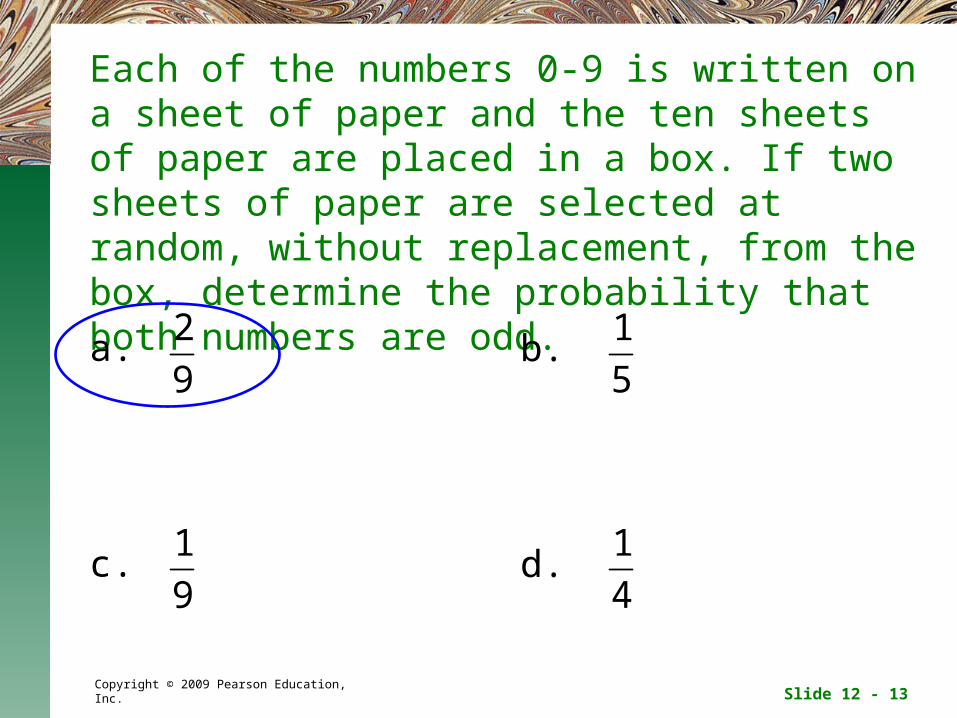
Each of the numbers 0-9 is written on a sheet of paper and the ten sheets of paper are placed in a box. If two sheets of paper are selected at random, without replacement, from the box, determine the probability that both numbers are odd.
a.
c.
2
9
1
5b.
d.
1
9
1
4

Slide 12 - 14Copyright © 2009 Pearson Education, Inc.
Each of the numbers 0-9 is written on a sheet of paper and the ten sheets of paper are placed in a box. If two sheets of paper are selected at random, without replacement, from the box, determine the probability that both numbers are greater than 7.
a.
c.
1
50
2
45b.
d.
1
25
1
45
Slide 12 - 15Copyright © 2009 Pearson Education, Inc.
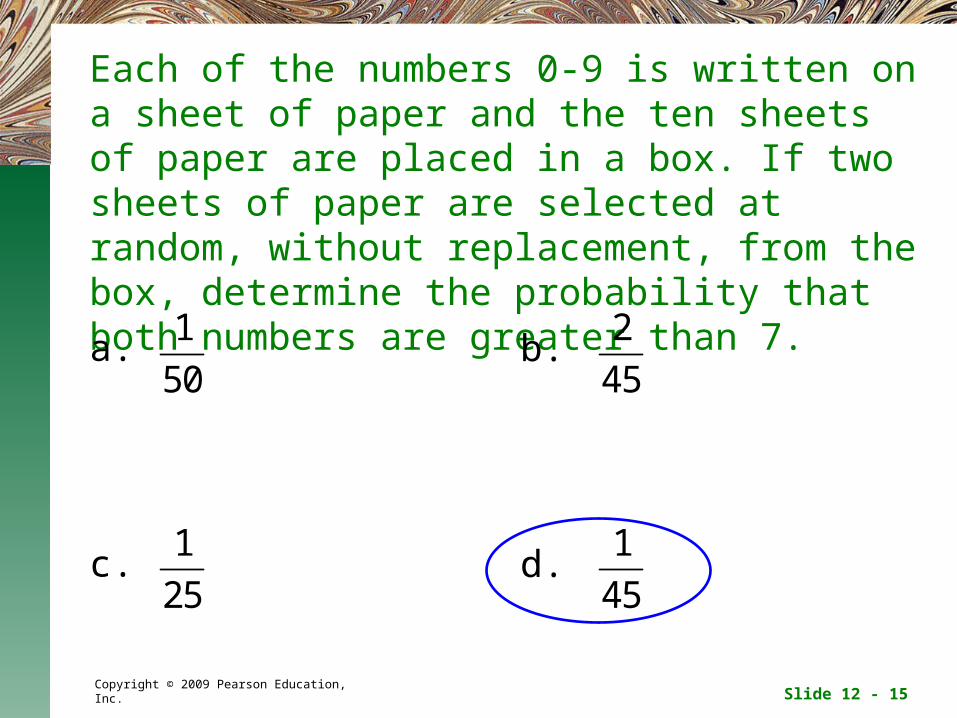
Each of the numbers 0-9 is written on a sheet of paper and the ten sheets of paper are placed in a box. If two sheets of paper are selected at random, without replacement, from the box, determine the probability that both numbers are greater than 7.
a.
c.
1
50
2
45b.
d.
1
25
1
45

Slide 12 - 16Copyright © 2009 Pearson Education, Inc.
Each of the numbers 0-9 is written on a sheet of paper and the ten sheets of paper are placed in a box. If two sheets of paper are selected at random, without replacement, from the box, determine the probability that the first number is even and the second number is odd.
a.
c.
1
4
1
5b.
d.
5
18
2
9

Slide 12 - 17Copyright © 2009 Pearson Education, Inc.
Each of the numbers 0-9 is written on a sheet of paper and the ten sheets of paper are placed in a box. If two sheets of paper are selected at random, without replacement, from the box, determine the probability that the first number is even and the second number is odd.
a.
c.
1
4
1
5b.
d.
5
18
2
9

Slide 12 - 18Copyright © 2009 Pearson Education, Inc.
Each of the numbers 0-9 is written on a sheet of paper and the ten sheets of paper are placed in a box. If two sheets of paper are selected at random, without replacement, from the box, determine the probability that the first number is greater than 3 and the second number is less than 3.
a.
c.
1
3
3
10b.
d.
4
15
1
5

Slide 12 - 19Copyright © 2009 Pearson Education, Inc.
Each of the numbers 0-9 is written on a sheet of paper and the ten sheets of paper are placed in a box. If two sheets of paper are selected at random, without replacement, from the box, determine the probability that the first number is greater than 3 and the second number is less than 3.
a.
c.
1
3
3
10b.
d.
4
15
1
5
Slide 12 - 20Copyright © 2009 Pearson Education, Inc.
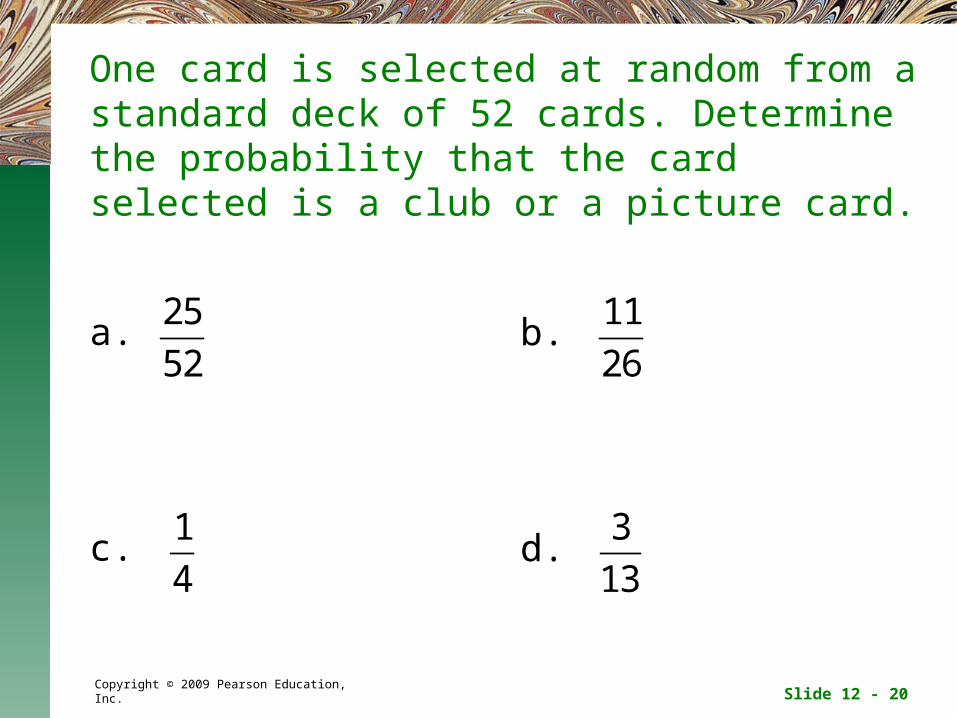
One card is selected at random from a standard deck of 52 cards. Determine the probability that the card selected is a club or a picture card.
a.
c.
25
52
11
26b.
d.
1
4
3
13
Slide 12 - 21Copyright © 2009 Pearson Education, Inc.
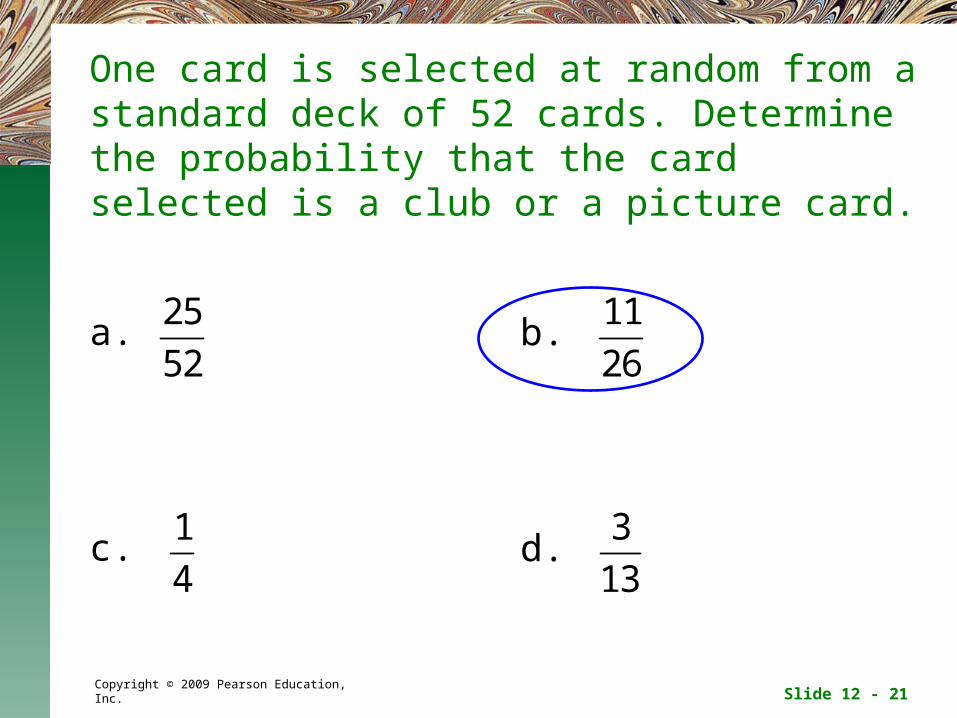
One card is selected at random from a standard deck of 52 cards. Determine the probability that the card selected is a club or a picture card.
a.
c.
25
52
11
26b.
d.
1
4
3
13

Slide 12 - 22Copyright © 2009 Pearson Education, Inc.
One die is rolled and one colored chip - black or white - is selected at random. Use the counting principle to determine the number of sample points in the sample space.
a. 6
c. 12
b. 8
d. 10
Slide 12 - 23Copyright © 2009 Pearson Education, Inc.
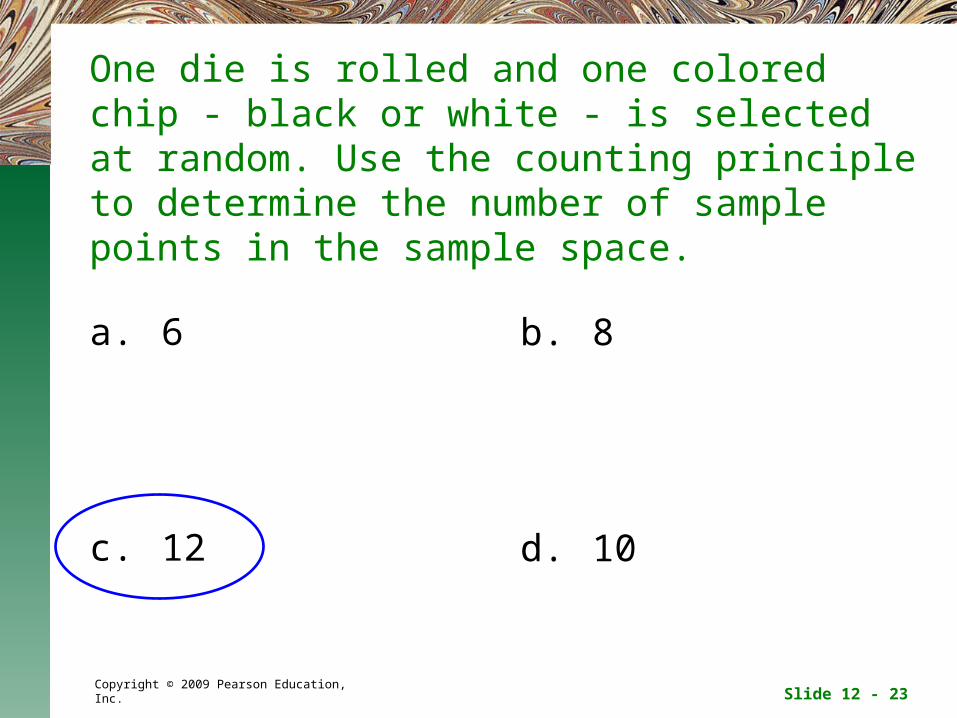
One die is rolled and one colored chip - black or white - is selected at random. Use the counting principle to determine the number of sample points in the sample space.
a. 6
c. 12
b. 8
d. 10

Slide 12 - 24Copyright © 2009 Pearson Education, Inc.
One die is rolled and one colored chip - black or white - is selected at random. Determine the probability of obtaining the number 3 and the color black.
a.
c.
1
12
1
24b.
d.
1
6
1
2
Slide 12 - 25Copyright © 2009 Pearson Education, Inc.
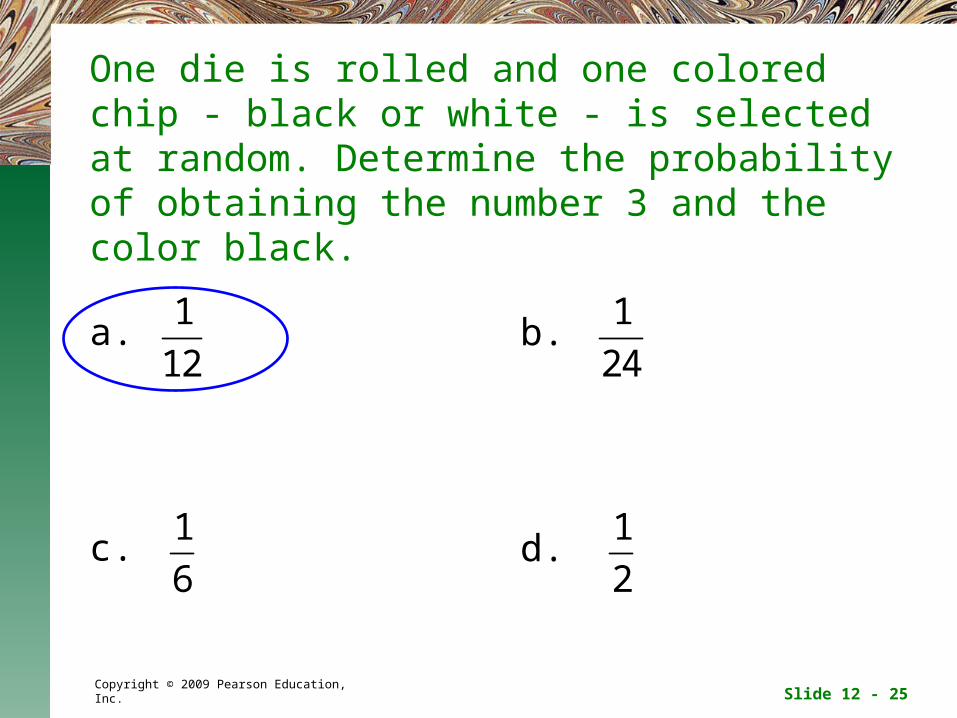
One die is rolled and one colored chip - black or white - is selected at random. Determine the probability of obtaining the number 3 and the color black.
a.
c.
1
12
1
24b.
d.
1
6
1
2

Slide 12 - 26Copyright © 2009 Pearson Education, Inc.
One die is rolled and one colored chip - black or white - is selected at random. Determine the probability of obtaining an even number and the color white.
a.
c.
1
2
1
3b.
d.
1
6
1
4

Slide 12 - 27Copyright © 2009 Pearson Education, Inc.
One die is rolled and one colored chip - black or white - is selected at random. Determine the probability of obtaining an even number and the color white.
a.
c.
1
2
1
3b.
d.
1
6
1
4

Slide 12 - 28Copyright © 2009 Pearson Education, Inc.
One die is rolled and one colored chip - black or white - is selected at random. Determine the probability of obtaining a number less than 3 and the color white.
a.
c.
1
2
1
3b.
d.
1
6
1
4

Slide 12 - 29Copyright © 2009 Pearson Education, Inc.
One die is rolled and one colored chip - black or white - is selected at random. Determine the probability of obtaining a number less than 3 and the color white.
a.
c.
1
2
1
3b.
d.
1
6
1
4

Slide 12 - 30Copyright © 2009 Pearson Education, Inc.
A serial number is to consist of seven digits. Determine the number of serial numbers possible if the first two numbers cannot be 0 or 1 and repetition is permitted.
a. 376,320
b. 2,83,401
c. 6,400,000
d. 10,000,000

Slide 12 - 31Copyright © 2009 Pearson Education, Inc.
A serial number is to consist of seven digits. Determine the number of serial numbers possible if the first two numbers cannot be 0 or 1 and repetition is permitted.
a. 376,320
b. 2,83,401
c. 6,400,000
d. 10,000,000
Slide 12 - 32Copyright © 2009 Pearson Education, Inc.
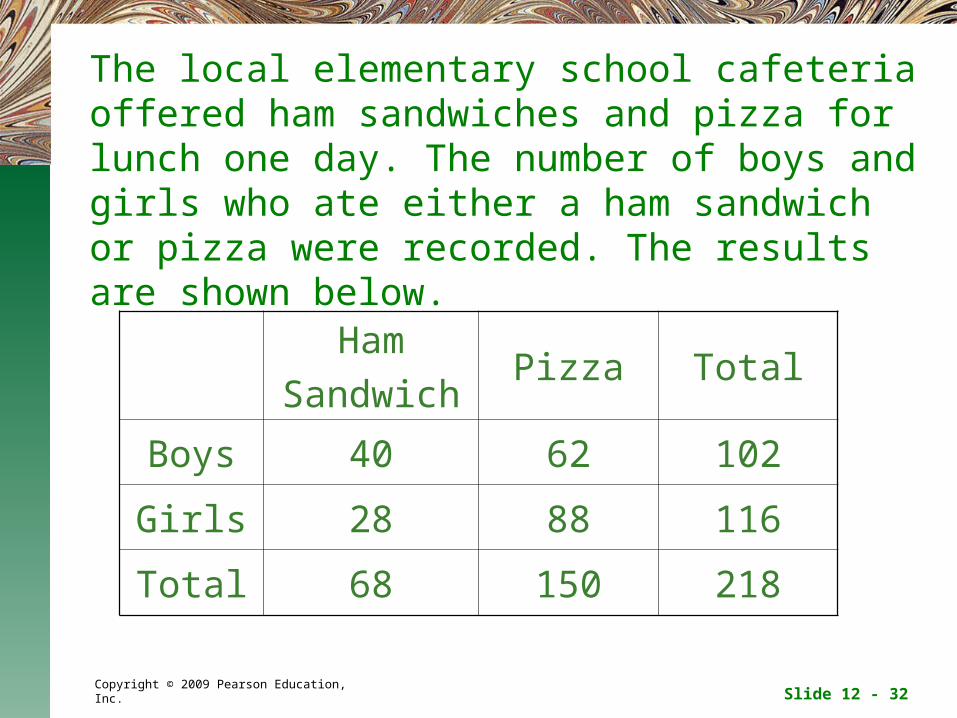
The local elementary school cafeteria offered ham sandwiches and pizza for lunch one day. The number of boys and girls who ate either a ham sandwich or pizza were recorded. The results are shown below.
Ham
SandwichPizza Total
Boys 40 62 102
Girls 28 88 116
Total 68 150 218

Slide 12 - 33Copyright © 2009 Pearson Education, Inc.
If one of these students is selected at random, determine the probability that the student is a boy.
a. b. c. d.
51
109
7
10
10
17
31
75
Ham
SandwichPizza Total
Boys 40 62 102
Girls 28 88 116
Total 68 150 218

Slide 12 - 34Copyright © 2009 Pearson Education, Inc.
If one of these students is selected at random, determine the probability that the student is a boy.
a. b. c. d.
51
109
7
10
10
17
31
75
Ham
SandwichPizza Total
Boys 40 62 102
Girls 28 88 116
Total 68 150 218
Slide 12 - 35Copyright © 2009 Pearson Education, Inc.
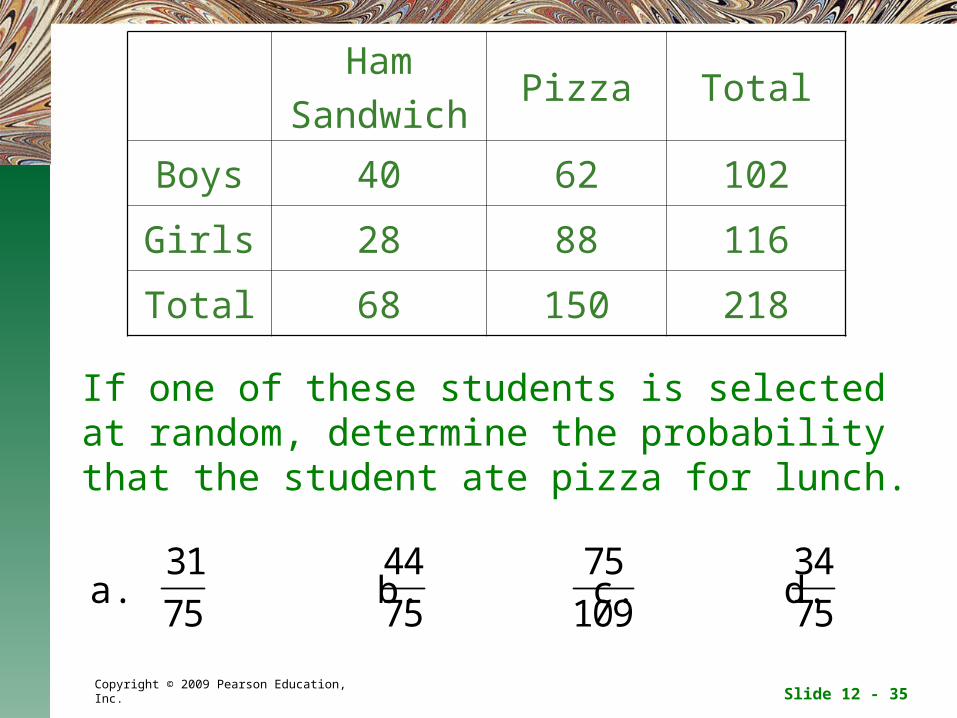
If one of these students is selected at random, determine the probability that the student ate pizza for lunch.
a. b. c. d.
31
75
34
75
44
75
75
109
Ham
SandwichPizza Total
Boys 40 62 102
Girls 28 88 116
Total 68 150 218

Slide 12 - 36Copyright © 2009 Pearson Education, Inc.
If one of these students is selected at random, determine the probability that the student ate pizza for lunch.
a. b. c. d.
31
75
34
75
44
75
75
109
Ham
SandwichPizza Total
Boys 40 62 102
Girls 28 88 116
Total 68 150 218

Slide 12 - 37Copyright © 2009 Pearson Education, Inc.
If one of these students is selected at random, determine the probability that the person ate a ham sandwich for lunch, given that they are a girl.
a. b. c. d.
7
17
7
29
10
17
14
109
Ham
SandwichPizza Total
Boys 40 62 102
Girls 28 88 116
Total 68 150 218

Slide 12 - 38Copyright © 2009 Pearson Education, Inc.
If one of these students is selected at random, determine the probability that the person ate a ham sandwich for lunch, given that they are a girl.
a. b. c. d.
7
17
7
29
10
17
14
109
Ham
SandwichPizza Total
Boys 40 62 102
Girls 28 88 116
Total 68 150 218

Slide 12 - 39Copyright © 2009 Pearson Education, Inc.
If one of these students is selected at random, determine the probability that the person is a boy, given that they ate pizza for lunch.
a. b. c. d.
44
75
20
109
31
75
4
15
Ham
SandwichPizza Total
Boys 40 62 102
Girls 28 88 116
Total 68 150 218

Slide 12 - 40Copyright © 2009 Pearson Education, Inc.
If one of these students is selected at random, determine the probability that the person is a boy, given that they ate pizza for lunch.
a. b. c. d.
44
75
20
109
31
75
4
15
Ham
SandwichPizza Total
Boys 40 62 102
Girls 28 88 116
Total 68 150 218
Slide 12 - 41Copyright © 2009 Pearson Education, Inc.
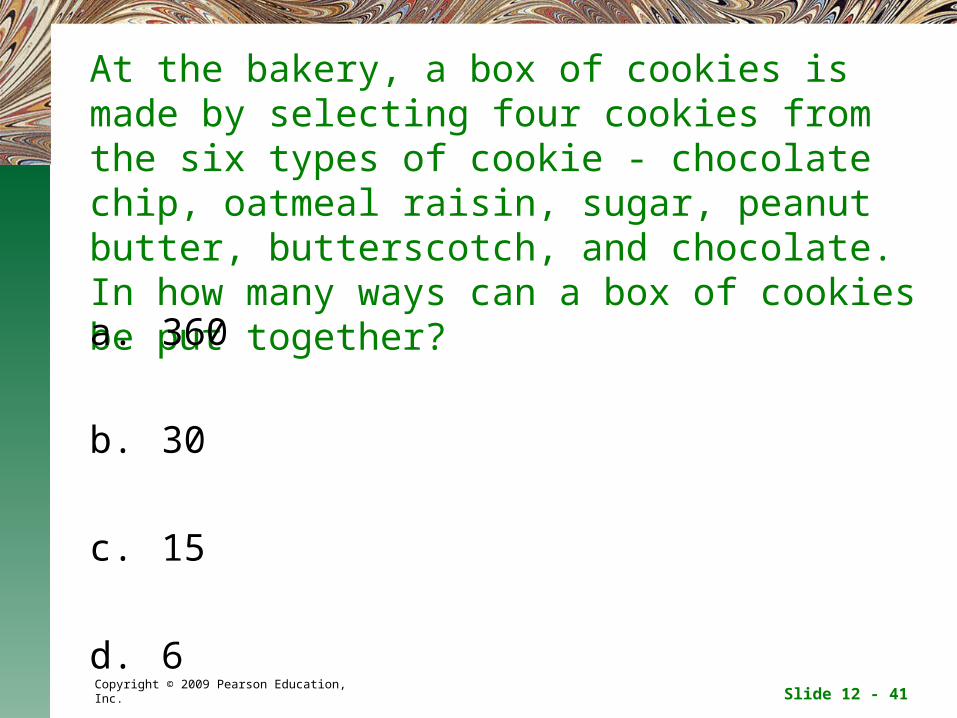
At the bakery, a box of cookies is made by selecting four cookies from the six types of cookie - chocolate chip, oatmeal raisin, sugar, peanut butter, butterscotch, and chocolate. In how many ways can a box of cookies be put together?
a. 360
b. 30
c. 15
d. 6
Slide 12 - 42Copyright © 2009 Pearson Education, Inc.
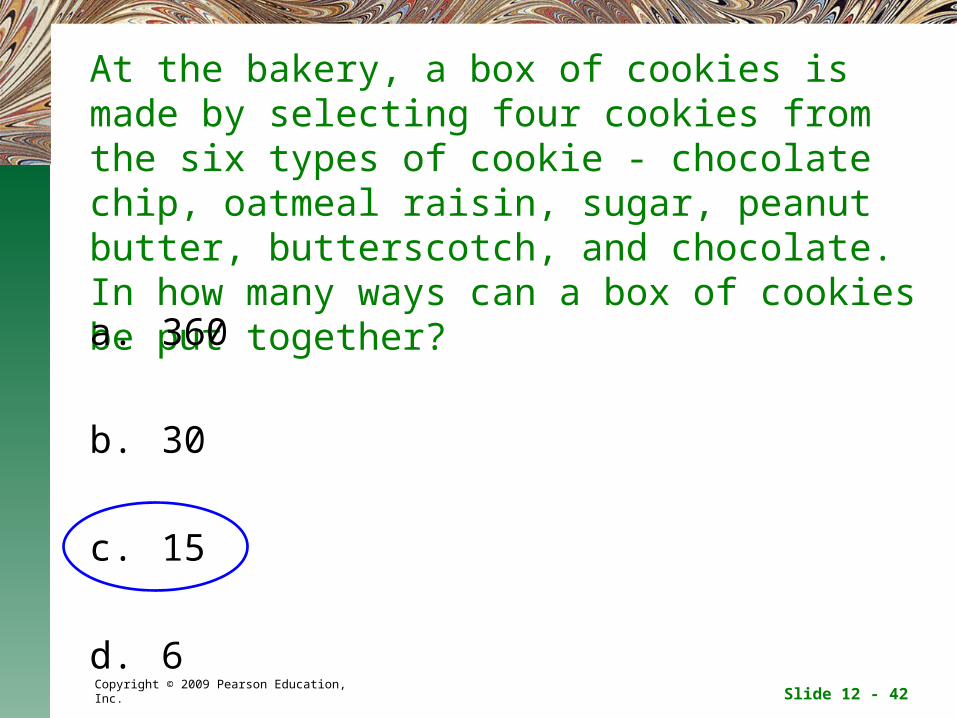
At the bakery, a box of cookies is made by selecting four cookies from the six types of cookie - chocolate chip, oatmeal raisin, sugar, peanut butter, butterscotch, and chocolate. In how many ways can a box of cookies be put together?
a. 360
b. 30
c. 15
d. 6

Slide 12 - 43Copyright © 2009 Pearson Education, Inc.
A box contains a total of 120 folders, of which 30 are red. If you select 2 at random, determine the probability that both folders are red.
a.
c.
1
16
29
480b.
d.
1
4
29
476

Slide 12 - 44Copyright © 2009 Pearson Education, Inc.
A box contains a total of 120 folders, of which 30 are red. If you select 2 at random, determine the probability that both folders are red.
a.
c.
1
16
29
480b.
d.
1
4
29
476

Slide 12 - 45Copyright © 2009 Pearson Education, Inc.
A box contains a total of 120 folders, of which 30 are red. If you select 2 at random, determine the probability that at least one folder is not red.
a.
c.
15
16
447
476b.
d.
9
16
3
8

Slide 12 - 46Copyright © 2009 Pearson Education, Inc.
A box contains a total of 120 folders, of which 30 are red. If you select 2 at random, determine the probability that at least one folder is not red.
a.
c.
15
16
447
476b.
d.
9
16
3
8