and Shelf Science - VLIZ
37
This is a postprint of: Le Guitton, M.; Soetaert, K.; Sinninghe Damsté, J.S. & Middelburg, J.J. (2017). Biogeochemical consequences of vertical and lateral transport of particulate organic matter in the southern North Sea: A multiproxy approach. Estuarine, Coastal and Shelf Science, 165, 117-127 Published version: https://dx.doi.org/10.1016/j.ecss.2015.09.010 Link NIOZ Repository: www.vliz.be/imis?module=ref&refid=251130 [Article begins on next page] The NIOZ Repository gives free access to the digital collection of the work of the Royal Netherlands Institute for Sea Research. This archive is managed according to the principles of the Open Access Movement, and the Open Archive Initiative. Each publication should be cited to its original source - please use the reference as presented. When using parts of, or whole publications in your own work, permission from the author(s) or copyright holder(s) is always needed.
Transcript of and Shelf Science - VLIZ

This is a postprint of: Le Guitton, M.; Soetaert, K.; Sinninghe Damsté, J.S. & Middelburg, J.J. (2017). Biogeochemical consequences of vertical and lateral transport of particulate organic matter in the southern North Sea: A multiproxy approach. Estuarine, Coastal and Shelf Science, 165, 117-127 Published version: https://dx.doi.org/10.1016/j.ecss.2015.09.010
Link NIOZ Repository: www.vliz.be/imis?module=ref&refid=251130
[Article begins on next page]
The NIOZ Repository gives free access to the digital collection of the work of the Royal
Netherlands Institute for Sea Research. This archive is managed according to the principles
of the Open Access Movement, and the Open Archive Initiative. Each publication should be
cited to its original source - please use the reference as presented.
When using parts of, or whole publications in your own work, permission from the author(s)
or copyright holder(s) is always needed.

1
Biogeochemical consequences of vertical and lateral transport of 1
particulate organic matter in the southern North Sea: a multiproxy 2
approach. 3
4
M. Le Guitton1a, K. Soetaert1, J. S. Sinninghe Damsté2, 3 and J. J. Middelburg1, 3 5
6
1. NIOZ Royal Netherlands Institute for Sea Research, Department of Ecosystem Studies, 7
P.O. Box 140, 4400 AC Yerseke, The Netherlands 8
2. NIOZ Royal Netherlands Institute for Sea Research, Department of Marine Organic 9
Biogeochemistry, P.O. Box 59, 1790 AB Den Burg, Texel, The Netherlands 10
3. Department of Earth Sciences, Faculty of Geosciences, Utrecht University, P.O. Box 11
80021, 3508 TA Utrecht, The Netherlands 12
13
a. Corresponding author: [email protected] 14
15
Abstract 16
Vertical and lateral transports are of importance in continental shelf systems such as the North 17
Sea and play a major role in the processing of organic matter. We investigated the 18
biogeochemical consequences of these transports on particulate organic matter at the 19
molecular level in the southern North Sea. We analysed suspended particulate matter and 20
surface sediments for organic carbon, pigments and phospholipid derived fatty acids at 10 21
stations sampled in September 2011 along the particle transport route. The particulate organic 22
matter in both suspended particulate matter and surface sediment was mainly from marine 23
phytoplankton origin but of fresher quality in the water column. Particulate organic matter 24
quality did not change from south to north in the suspended particulate matter, whereas it 25

2
clearly decreased towards the north in the surface sediments, reflecting a decreased intensity 26
of benthic-pelagic coupling. However, we also observed strong deposition of fresh organic 27
matter in the northern station denoting that occasionally, intense benthic-pelagic coupling can 28
occur. Finally, our study highlights the necessity to use a multiproxy approach covering 29
multiple characteristic time scales, when investigating both suspended particulate matter and 30
surface sediments. 31
32
Keywords: Particulate organic matter; biogeochemistry; biomarkers; transport processes; 33
benthic-pelagic coupling; North Sea. 34
35
1. Introduction 36
Continental shelves account for more than 20% of the total marine organic matter primary 37
production and are thus highly productive ecosystems (Gattuso et al., 2005). Part of this 38
produced carbon is respired on the continental shelf, a small part is buried and the remainder 39
is exported to the open ocean. Continental shelves also receive relatively large amounts of 40
terrestrially-derived organic matter from rivers and estuaries (Bianchi, 2011), such as in the 41
southeastern part of the North Sea (Rhine-Meuse-Scheldt rivers outflow) (e.g. Eleveld et al., 42
2008). In addition, continental shelf systems in temperate areas, such as the North Sea, 43
account for a significant part of oceanic carbon dioxide uptake (e.g. Thomas et al., 2005; 44
Borges, 2005) and global denitrification (Codispoti et al., 2001). Moreover these ecosystems 45
are important with respect to harvestable resources but are also subject to major 46
anthropogenic disturbances, especially in the North Sea (Halpern et al., 2008). 47
Continental shelves are characterized by substantial vertical and horizontal transport vectors. 48
Due to their shallow depths, continental shelf systems are characterised by an intense benthic- 49
pelagic coupling, where the benthic compartment receives detritus and biological particles 50

3
settling out of the water column and returns, with some delay, dissolved material in the form 51
of dissolved inorganic carbon and nutrients, consuming significant quantities of oxygen in the 52
process (Soetaert et al., 2000). Another mode of benthic-pelagic coupling consists of the 53
temporary retention of pelagically produced organic matter particles in the sediments, by 54
successive deposition and erosion cycles, e.g. as induced by tidal currents. 55
In addition to vertical interactions, continental shelf systems such as the North Sea are also 56
characterized by across and along shelf exchange of water and material (De Haas, 1997). In 57
the North Sea, the residual currents are directed from the southern North Sea via the frontal 58
systems and the German Bight to the Skagerrak area (Otto et al., 1990). Particles are 59
transported along this residual current and most accumulation eventually occurs in the 60
Skagerrak, the depositional area of the North Sea (De Haas, 1997; Dauwe and Middelburg, 61
1998). The combination of the residual flow and the repeated cycles of deposition of particles 62
and resuspension of sediment is called organic matter spiralling, a concept that has been 63
extensively investigated in rivers and estuaries (Newbold et al., 1981; Newbold et al., 1982; 64
Newbold, 1992), but to date has not received focus in shelf areas. If important, then particle 65
transport is significantly delayed relative to residual current velocities because of temporary 66
deposition and retention in the sediments, and as a result extensive processing of organic 67
matter will occur, with major consequences for its molecular composition, its availability to 68
organisms and the functional biodiversity of its heterotrophic consumers. 69
In the present study, we investigated the composition of particulate organic matter (POM) in 70
surface seawater and surface sediments to assess the biogeochemical consequences of POM 71
transport (both vertical and lateral) in the southern North Sea. Degradation rates differ 72
consistently among organic compounds (Cowie and Hedges, 1994, Veuger and van Oevelen, 73
2011; Veuger et al., 2012), and the quality of POM can thus be studied over a wide spectrum 74
of organic matter degradation states, by analysing multiple levels of the ‘biomarkers pyramid’ 75

4
(see Bianchi and Canuel, 2011), i.e. bulk organic carbon, elemental composition (CN-molar 76
ratio) and biomarker composition (pigments and phospholipid derived fatty acids). Linking 77
the biochemical composition to calculated indicators of organic matter quality, our results are 78
interpreted in terms of the intensity and predominant mode of benthic-pelagic coupling. 79
80
2. Material and methods 81
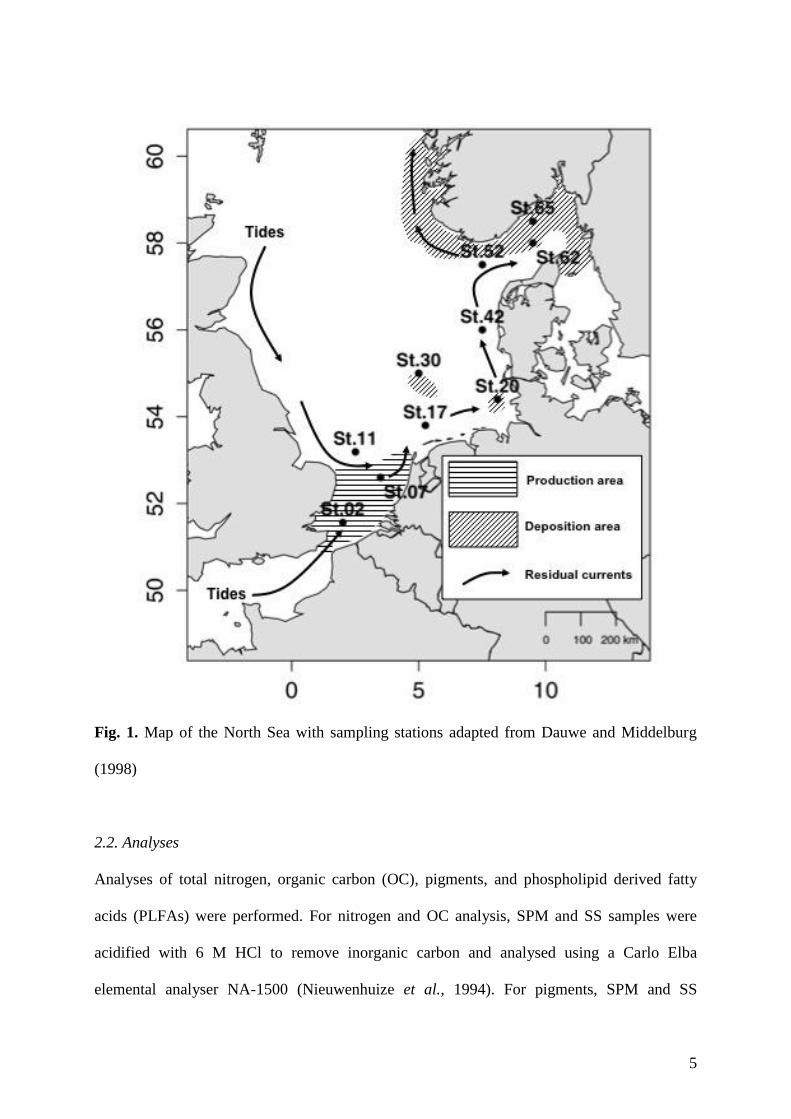
2.1. Study area and sampling strategy 82
Ten stations were sampled in the Southern North Sea in September 2011 with R.V. Pelagia 83
(Tab.1). The stations were chosen to study the gradient in POM quality along the general 84
transport route of sedimentary organic matter in the southern North Sea (Lohse et al., 1995; 85
Van Raaphorst and Malschaert, 1996; Dauwe and Middelburg, 1998; Fig.1). Stations (St.) 02 86
and 07 were located in the primary production area (sensu Dauwe and Middelburg, 1998), 87
whereas St. 20 in the German Bight, St. 30 in Oyster Grounds and St. 62 and 65 in the 88
Skagerrak, were located in deposition areas (Fig. 1). 89
Water samples were taken at 5 m depth using the ship’s non-toxic pumping device 90
(Aquaflow) and filtered to collect Suspended Particulate Matter (SPM) on GF/6 filters (1-3 91
μm pore size) for pigment analysis and 0.70 μm GF/F filters for bulk and PLFA analyses. For 92
sediment samples, a multi-corer (Octopus type) with four cores of 100 mm diameter was 93
deployed. The sediment cores were directly sliced onboard, per cm down to 10 cm deep, 94
using a manual core slicer. In this study, we focused on the first layer (0-1 cm) of surface 95
sediment (SS) for the analyses. The SPM and SS samples were stored at -20°C prior analyses, 96
except SPM and SS pigment samples, which were stored at -80°C. 97
98
99
5
100 Fig. 1. Map of the North Sea with sampling stations adapted from Dauwe and Middelburg 101
(1998) 102
103
2.2. Analyses 104
Analyses of total nitrogen, organic carbon (OC), pigments, and phospholipid derived fatty 105
acids (PLFAs) were performed. For nitrogen and OC analysis, SPM and SS samples were 106
acidified with 6 M HCl to remove inorganic carbon and analysed using a Carlo Elba 107
elemental analyser NA-1500 (Nieuwenhuize et al., 1994). For pigments, SPM and SS 108

6
samples were freeze-dried and extracted with 10 ml acetone/water (90/10; v/v). After 109
centrifugation, 50 μl of this extract was analyzed for pigments on a C18-column with use of 110
reversed phase chromatography (Jeffrey et al., 1997). The pigments were detected by a 111
Photodiode Array and Fluorescence detector and identified based on their retention times and 112
by comparison of their absorption spectra to a homemade library of absorption spectra of pure 113
pigments standards (DHI, Denmark). The PLFAs were extracted from SPM and SS samples 114
using the method described in Boschker et al. (1999) modified from Bligh and Dyer (1959). 115
Porosity was determined by weight loss after freeze-drying, accounting for salt precipitation 116
in the saline pore water. Grain size distribution was determined using a Malvern Mastersizer 117
2000 particle analyzer. The SPM values are reported as the mean of two samples collected in 118
the same area at the same time with standard deviation, for pigments and PLFAs at all stations 119
and for Particulate Organic Carbon (POC) and CN ratio (CN-r) at St. 20. The results for 120
surface sediments are for single samples. SS values for pigments and PLFAs are expressed in 121
μg.gdw-1 with gdw for gram dry weight. 122
123
2.3. PLFA nomenclature 124
Each identified individual PLFA compound is expressed using the notation CA:Bωx, where A 125
is the number of carbons, B is the number of double bonds, and x is the position of the first 126
double bond relative to the terminal methyl group. Saturated fatty acid (SFA) concentrations 127
were calculated as the sum of all individual compounds with no double bonds (notation 128
CA:B), mono-unsaturated fatty acids (MUFA) as the sum of all individual compounds with 129
one double bond (notation CA: Bω1) and poly-unsaturated fatty acids (PUFA) as the sum of 130
all individual compounds with two or more double bonds (notation CA: Bωx with x ≥ 2) 131
(Budge et al., 2006). Branched fatty acid (Br-FA) concentration was calculated as the sum of 132
all individual PLFAs with the notation i- or ai-CA:Bωx, for iso- and anteiso-, respectively. 133

7
Finally the total PLFA concentration was calculated as the sum of all identified individual 134
PLFAs in both SPM and SS samples. SFA, MUFA, PUFA and Br-FA are expressed as the 135
percentage of total PLFAs (%-total PLFAs). 136
137
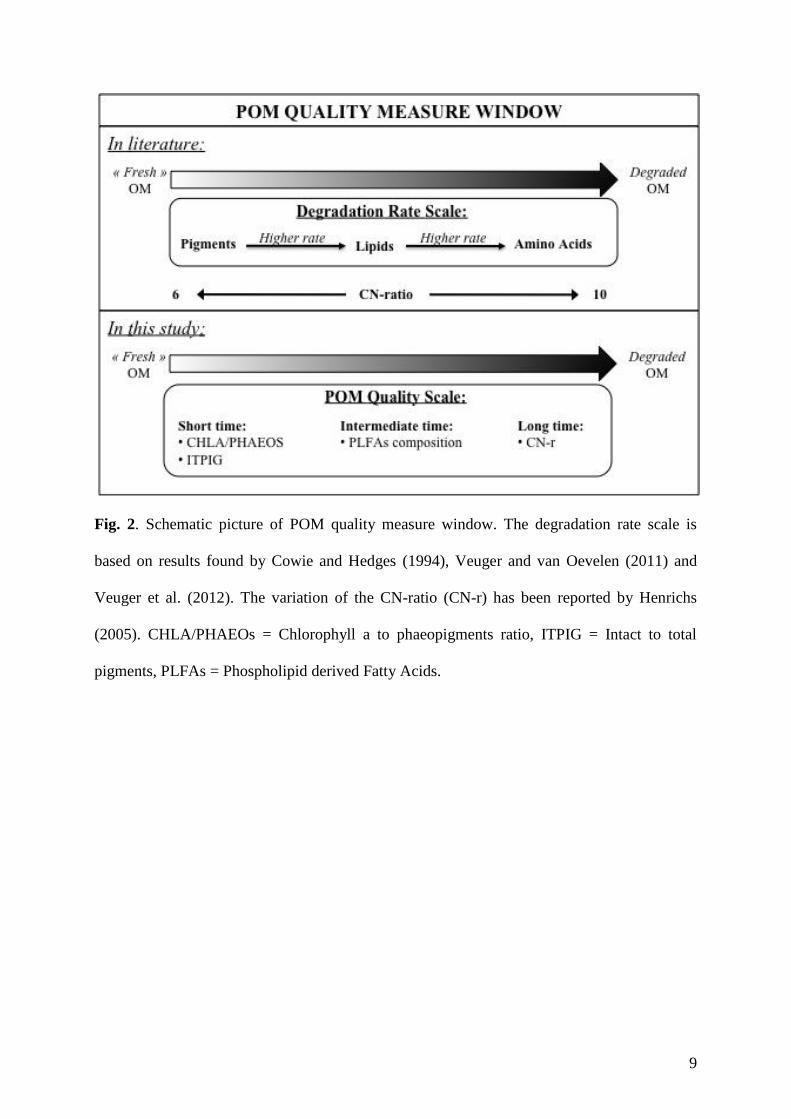
2.4. POM quality derived parameters 138
The North Sea is a complex system, where transport of water and matter varies spatially and 139
temporally (e.g. Eleveld et al., 2008; Dobrynin et al., 2010; Tiessen et al., 2014). Therefore 140
quantifying the timescales on which organic matter transport and degradation processes occur, 141
remains a challenge. Nevertheless based on the timescales of molecule degradation rates 142
(Cowie and Hedges, 1994, Veuger and van Oevelen, 2011; Veuger et al., 2012), we explore 143
POM quality in terms of OM degradation and microbial reworking by POM quality 144
parameters as follows (Fig. 2): 145
i. Short time scales – Pigments have higher degradation rates compared to lipids and 146
we used pigments derived parameters to assess the freshness of POM. Therefore 147
the chlorophyll a to phaeopigment ratio (CHLA/PHAEOs), with the 148
phaeopigments defined as the sum of pheophytin and phaeophorbide, and the 149
intact to total pigments ratio (ITPIG) (Woulds and Cowie, 2009), where intact 150
pigments are the sum of chlorophyll a, alloxanthin, diatoxanthin, zeaxanthin and β 151
carotene were calculated. High ratios indicate fresh OM. 152
ii. Intermediate time scales – Lipids have a lower degradation rate compared to 153
pigments, but a higher one compared to bulk organic matter and amino acids 154
(Veuger et al., 2012). Thus, the composition of the PLFA pool in terms of SFA, 155
MUFA, PUFA and Br-FA was used to investigate POM quality and to assess 156
bacterial biomass (Bechtel and Schubert, 2009; Christodoulou et al., 2009). Low 157
percentage of PUFA and high percentage of SFA indicate more extensive OM 158

8
degradation and high percentages of MUFA and Br-FA indicate higher bacterial 159
biomass. 160
iii. Long time scales – The CN-ratio was used to represent POM quality on the long 161
time scale. Indeed the CN-ratio increases from Redfield up to values as high as 10 162
with ongoing marine OM decomposition (Henrichs, 2005). 163
To investigate the degree of benthic-pelagic coupling, the difference between SPM and SS 164
values were calculated for each POM quality parameters as follows: 165
Difference of i = SPM value of i – SS value of i 166
where i represents the POM quality parameters. The closer to 0, the more intense is the 167
benthic-pelagic coupling. 168
169
2.5. Principal Component Analysis (PCA) 170
To examine whether POM quality was influenced and/or controlled by the same factors in 171
SPM and SS samples, a Principal Component Analysis was carried out using the software R 172
(R Development Core Team, 2008). The PCA was performed based on POM quality 173
parameters calculated for SPM and SS samples, i.e. chlorophyll a to phaeopigments ratio and 174
intact to total pigments ratio for the short time scale; saturated fatty acid, mono-unsaturated 175
fatty acid, poly-unsaturated fatty acid and branched fatty acid for the intermediate time scale; 176
and the CN-ratio for the long time scale. 177
9
178
Fig. 2. Schematic picture of POM quality measure window. The degradation rate scale is 179
based on results found by Cowie and Hedges (1994), Veuger and van Oevelen (2011) and 180
Veuger et al. (2012). The variation of the CN-ratio (CN-r) has been reported by Henrichs 181
(2005). CHLA/PHAEOs = Chlorophyll a to phaeopigments ratio, ITPIG = Intact to total 182
pigments, PLFAs = Phospholipid derived Fatty Acids. 183
184
185

10
3. Results 186
3.1. Station main characteristics 187
The characteristics of the stations are listed in Tab. 1. From St. 02 to 42, the water depth was 188
relatively shallow (< 60 m) whereas St. 52, 62 and 65 were > 200 m deep. The surface water 189
temperature and salinity varied between stations. The highest temperature (18°C) and salinity 190
(35) were found at the southernmost St. 02. The northern stations St. 52 and 65 had the lowest 191
temperature (14°C). Station 20 had the lowest salinity (29), probably due to its location close 192
to the Elbe estuary. The organic carbon in SPM ranged from 0.11 mg-C.l-1 at St. 30 and 52 to 193
0.58 ± 0.16 mg-C.l-1 at St. 20. In SS samples, total organic carbon increased from St. 02 194
(0.02%) to St. 65 (2.28%). Porosity was relatively constant in the shallowest stations (from St. 195
02 to 42), averaging 0.3 ± 0.1 and was higher in the deepest stations (St. 52, 62 and 65), 196
averaging 0.7 ± 0.1. At St. 02, coarse (50%) and medium sand (44%) particles dominated the 197
composition of the sediment. From St. 07 to 42, the sediment consisted predominantly of 198
medium and fine sand (around 30-70%), except for St. 30, where the grain size was 199
dominated by fine and very fine sand (68% and 24%, respectively). At St. 52, 62 and 65, the 200
silt content was the highest (≥ 50%). 201
202
3.2. Particulate Organic Matter composition 203
In SPM samples, the pigment composition was dominated by chlorophyll a (1.10 μg.l-1 ± 0.27 204
on average) (Tab. 2). Other chlorophylls (sum of Chlorophyll b, c and c3), fucoxanthin and 205
peridinin were found in lower concentration (0.35 μg.l-1 ± 0.14, 0.27 μg.l-1 ± 0.14 and 0.04 206
μg.l-1 ± 0.03, on average, respectively). Chlorophyll c3 was not detected (below detection 207
limit) at St. 20, and neither was peridinin at St. 07. The degradation products of chlorophyll. 208
a, i.e. phaeophytin a and phaeophorbide a, showed high concentrations at St. 20 (0.15 μg.l-1 ± 209
0.03 and 0.27 μg.l-1 ± 0.04, respectively). The PLFAs were dominated at all stations by 210

11
C22:6ω3 and C20:5ω3 (0.67 μg-C.l-1 ± 0.38 and 0.34 μg-C.l-1 ± 0.13, on average 211
respectively). The PLFAs C16:1ω7c and C18:1ω7c were also present at concentrations of 212
0.18 μg-C.l-1 ± 0.07 and 0.11 μg-C.l-1 ± 0.04, on average respectively. The PLFA C16:4ω1 213
was only detected at St. 02, 11, 17 and 42 at low concentrations (≤ 0.05 μg-C.l-1). The 214
branched fatty acids, such as i-C14:0, i-C15:0, ai-C15:0, i-C17:0 and ai-C17:0 were also 215
found in low concentrations (≤ 0.05 μg-C.l-1) and not at all stations. 216
In SS samples, both pigments and PLFA concentrations increased from St. 02 to 65 (Tab.3). 217
The pigment composition was dominated by chlorophyll a in the southernmost stations (St. 218
02, 07 and 11), while the phaeopigments dominated the pigment composition from St. 20 to 219
65. At St. 17, the concentrations of chlorophyll a and phaeopigments were similar (0.16 220
μg.gdw-1). The concentration of fucoxanthin was also relatively high in the SS samples, 221
ranging from 0.03 μg.gdw-1 at St. 02 to 0.81 μg.gdw-1 at St. 65. Chlorophyll c3 and peridinin 222
were not detected in the SS samples and chlorophyll b was only detected at St. 30, 52 and 65 223
in relatively low concentrations (≤ 0.2 μg.gdw-1). The PLFAs showed relatively high 224
concentrations of C16:1ω7c and C18:1ω7c at all stations, followed by ai-C15:0, C22:6ω3 and 225
C20:5ω3. The branched fatty acids, such as i-C14:0, i-C15:0, ai-C15:0, i-C17:0 and ai-C17:0 226
were also found in high concentrations, even if some, like i-C17:0, were not detected at all 227
stations. 228
229

12
Tab. 1. Main characteristics of the stations. 230
St.02 St.07 St.11 St.17 St.20 St.30 St.42 St.52 St.62 St.65
Latitude °N 51.56 52.60 53.19 53.80 54.40 55.00 56.00 57.50 58.00 58.50
Longitude °E 2.01 3.50 2.51 5.26 8.10 5.00 7.50 7.50 9.50 9.50
Depth m 55 33 32 35 21 41 24 213 304 546
Temperature °C 18 17 16 17 17 15 17 14 15 14
Salinity 35 35 34 34 29 35 34 32 32 31
SPM
POC mg-C.l-1 0.15 0.13 0.14 0.22 0.58 ±0.16 0.11 0.15 0.11 0.14 0.14
SS
TOC %wt 0.02 0.03 0.06 0.10 0.11 0.12 0.07 1.17 1.42 2.28
Porosity 0.2 0.3 0.3 0.3 0.3 0.4 0.3 0.6 0.6 0.7
Coarse sand % 500-1000 μm 50 3 3 1 0 0 1 0 0 0
Medium sand % 250-500 μm 44 68 64 43 31 4 36 0 1 0
Fine sand % 125-250 μm 2 30 33 49 62 68 55 14 5 6
Very fine sand % 63-125 μm 1 0 0 3 7 24 7 36 21 18
Silt % < 63 μm 4 0 0 4 0 4 0 50 73 75
231
232

13
Tab. 2. Pigments and PLFAs in SPM samples. Results are presented as mean ± standard deviation. ND = not detected 233
St.02 St.07 St.11 St.17 St.20 St.30 St.42 St.52 St.62 St.65
Pigments μg.l-1
Chl.a 1.16 ±0.02 0.59 ±0.01 1.09 ±0.00 1.35 ±0.05 1.22 ±0.12 1.09 ±0.01 1.51 ±0.05 0.90 ±0.03 1.28 ±0.03 0.82 ±0.00
Chl.b 0.14 ±0.00 0.09 ±0.00 0.09 ±0.00 0.05 ±0.00 0.20 ±0.01 0.12 ±0.00 0.14 ±0.00 0.10 ±0.00 0.11 ±0.01 0.15 ±0.00
Chl.c 0.13 ±0.00 0.06 ±0.00 0.14 ±0.00 0.25 ±0.01 0.14 ±0.01 0.14 ±0.00 0.20 ±0.00 0.11 ±0.00 0.16 ±0.01 0.09 ±0.00
Chl.c3 0.04 ±0.00 0.03 ±0.00 0.05 ±0.00 0.05 ±0.00 ND 0.10 ±0.01 0.07 ±0.01 0.05 ±0.00 0.08 ±0.01 0.05 ±0.00
Feo 0.04 ±0.00 0.02 ±0.00 0.03 ±0.00 0.03 ±0.00 0.15 ±0.03 0.02 ±0.00 0.04 ±0.00 0.01 ±0.00 0.02 ±0.00 0.02 ±0.00
Fuco 0.33 ±0.00 0.13 ±0.01 0.35 ±0.00 0.34 ±0.02 0.33 ±0.04 0.20 ±0.01 0.55 ±0.01 0.15 ±0.00 0.23 ±0.01 0.10 ±0.00
Peri 0.02 ±0.00 ND 0.03 ±0.00 0.36 ±0.01 0.04 ±0.01 0.04 ±0.00 0.04 ±0.00 0.06 ±0.00 0.10 ±0.00 0.06 ±0.00
Pheo 0.04 ±0.01 0.01 ±0.00 0.02 ±0.00 0.02 ±0.02 0.27 ±0.04 0.01 ±0.00 0.09 ±0.08 0.01 ±0.00 0.01 ±0.00 0.01 ±0.00
PLFAs μg-C.l-1
i-C14:0 ND ND ND ND ND ND ND ND ND ND
i-C15:0 0.03 ±0.00 0.02 0.02 0.04 ±0.02 0.03 ±0.00 ND 0.01 ND 0.02 0.02 ±0.01
ai-C15:0 0.02 ND ND 0.02 0.03 ±0.00 ND ND ND 0.02 0.02
C16:1w7
c 0.26 ±0.05 0.14 ±0.06 0.15 ±0.14 0.25 ±0.11 0.21 ±0.01 0.08 ±0.00 0.14 ±0.05 0.11 ±0.01 0.21 ±0.13 0.26 ±0.09
C16:4ω1 0.02 ±0.01 ND 0.02 0.05 ND ND 0.03 ND ND ND
i-C17:0 0.01 ND ND 0.02 0.02 ±0.00 ND ND ND 0.02 0.02
ai-C17:0 ND ND ND ND ND ND ND ND ND ND
C18:1ω7c 0.15 ±0.02 0.08 ±0.02 0.08 ±0.07 0.19 ±0.08 0.15 ±0.01 0.06 ±0.01 0.09 ±0.04 0.07 ±0.01 0.13 ±0.07 0.14 ±0.05
C20:5ω3 0.41 ±0.11 0.27 ±0.02 0.25 ±0.20 0.59 ±0.26 0.33 ±0.05 0.39 ±0.24 0.46 ±0.11 0.14 ±0.00 0.26 ±0.12 0.28 ±0.12
C22:6ω3 0.64 ±0.18 0.52 ±0.12 0.38 ±0.29 1.60 ±0.77 0.25 ±0.00 0.51 ±0.03 0.77 ±0.34 0.40 ±0.06 0.76 ±0.28 0.84 ±0.24
234
235

14
Tab. 3. Pigments and PLFAs in SS samples. Results are from single value. ND = not detected. 236
237
St.02 St.07 St.11 St.17 St.20 St.30 St.42 St.52 St.62 St.65
Pigments μg.gdw-1
Chl.a 0.04 0.12 0.28 0.16 0.16 0.17 0.09 0.64 1.16 1.44
Chl.b ND ND ND ND ND 0.01 ND 0.01 ND 0.02
Chl.c 0.01 0.02 0.03 0.02 0.02 0.02 0.01 0.07 0.10 0.14
Chl.c3 ND ND ND ND ND ND ND ND ND ND
Feo 0.01 0.01 0.04 0.05 0.04 0.09 0.04 0.40 0.94 0.93
Fuco 0.03 0.07 0.18 0.09 0.09 0.07 0.05 0.30 0.44 0.81
Peri ND ND ND ND ND ND ND ND ND ND
Pheo 0.01 0.01 0.07 0.11 0.19 0.18 0.11 1.42 1.44 2.07
PLFAs μg-C.gdw-1
i-C14:0 ND 0.01 0.01 0.03 0.03 0.03 0.03 0.07 0.09 0.13
i-C15:0 0.01 0.03 0.06 0.13 0.17 0.13 0.12 0.26 0.29 0.58
ai-C15:0 ND 0.04 0.10 0.20 0.31 0.29 0.27 0.40 0.49 0.72
C16:1w7c 0.01 0.10 0.20 0.38 0.54 0.52 0.64 1.02 1.09 1.82
C16:4ω1 ND 0.01 0.01 0.03 0.04 0.03 0.03 0.09 0.04 0.16
i-C17:0 0.02 0.02 0.01 ND 0.01 ND ND ND ND ND
ai-C17:0 0.02 0.03 0.01 0.01 0.02 0.02 0.02 0.09 0.08 0.10
C18:1ω7c 0.01 0.09 0.22 0.36 0.47 0.43 0.56 1.18 0.98 1.81
C20:5ω3 ND 0.08 0.17 0.11 0.07 0.10 0.25 0.47 0.46 0.43
C22:6ω3 0.02 0.01 0.01 0.10 0.04 0.07 0.18 0.41 0.35 0.28
238
239

15
3.3. Particulate Organic Matter quality 240
Pigment-derived parameters, CHLA/PHAEOs and ITPIG are presented in Fig. 3, the PLFA 241
composition in Fig. 4 and the CN-ratio in Fig. 5. 242
In SPM samples, the chlorophyll a to phaeopigments ratio (CHLA/PHAEOs) was quite 243
variable, the highest value was found at St. 30 (44.2 ± 2.5) and the lowest at St. 20 (2.9 ± 0.3). 244
At St. 02, 11 and 17, this ratio was around 18.4 ± 1.0 on average, while at St. 52, 62 and 65, it 245
was around 32.0 ± 1.2. Contrary to CHLA/PHAEOs, the intact to total pigments ratio (ITPIG) 246
was relatively constant over the stations, with an average value of 0.59 ± 0.05. 247
The PLFA composition was relatively constant between stations and characterised by a high 248
percentage of PUFA (58% on average). SFA and MUFA contributed 26 and 15% to total 249
PLFAs on average, while Br-FA contributed less than 1%, except at St. 20 where it accounted 250
for 4% to total PLFAs. The CN-ratio was relatively constant, averaging 6.1 ± 0.4. The highest 251
value was found at St. 20 (6.9). 252
In SS samples, the chlorophyll a to phaeopigments and the intact to total pigments ratio 253
showed low values, especially the former (Fig. 3). Both pigment-derived parameters 254
decreased from St. 02 to St. 65 (Fig. 3). The composition of the PLFA pool was dominated by 255
MUFA (40% on average) at all stations, except St. 02, where it was characterised by PUFA 256
and SFA (44% and 41% of the total PLFA pool, respectively) (Fig. 4b). At the other stations, 257
the percentages of SFA were relatively constant (25% on average). The percentages of MUFA 258
and Br-FA were the highest at St. 20 (43% and 24%, respectively) and St. 30 (43% and 22% 259
respectively) and the percentages of PUFA, the lowest (10% and 11%, respectively). The 260
CN-ratio increased from St. 02 (6.2) to St. 65 (9.8) (Fig. 5). 261
The difference between SPM and SS samples varied between stations and between parameters 262
(Fig. 6). For the pigment derived parameters (CHLA/PHAEOs and ITPIG), the difference 263
between SPM and SS samples was positive and higher in the northernmost stations (St. 30, 264

16
52, 62 and 65) compared to the southernmost stations (from St. 02 to 20) and St. 42. A similar 265
trend was observed for the CN-ratio but the difference between SPM and SS was negative. 266
The difference of PUFA was positive and increased from St. 02 to St. 30, followed by a 267
decrease to St.52 and a slight increase to St. 65. The difference of MUFA was positive at St. 268
02 and negative at the other stations, and decreased from St. 02 to St. 30 before it slightly 269
increased to St. 52 and decreased again to St. 65 as did the difference of Br-FA. The 270
difference of SFA between SPM and SS samples varied between stations and was positive at 271
St. 07, 11, 17, 52 and 65, and negative at the other stations (< -5% at St. 20, 30, 42 and 62, 272
and about -15% at St. 02). 273
274
3.4. Principal Component Analysis 275
The PCA results on POM quality parameters are presented in Fig. 7. The first PCA axis 276
explains 81% of total variation. This axis separates the SPM samples on the left, scoring 277
negatively on this axis and the SS samples on the right, scoring positively on this axis except 278
for SS of St. 02 and 07. The SPM samples are characterised by higher values of chlorophyll a 279
to phaeopigments and intact to total pigments ratios (A and B), whereas the SS samples are 280
characterised by higher values of SFA (C), MUFA (D), PUFA (E), Br-FA (F) and CN-molar 281
ratio (G). The second axis of the PCA explains another 10% of the variation. The chlorophyll 282
a to phaeopigments ratio (A) and the PUFAs (E) scored positively for SPM of St. 30, 62, 65, 283
17 and 52 and for SS of St. 52, 62 and 65. 284
285

17
286 Fig. 3. (a) Chlorophyll a to phaeopigments (CHLA/PHAEOs) and (b) intact to total pigments 287
(ITPIG) ratios for SPM (white bars) and SS (black bars) samples. Note the different scale 288
between SPM (left axis) and SS samples (right axis) for CHLA/PHAEOs. 289
290

18
291 Fig. 4. Cumulative contribution of saturated fatty acid (SFA), mono-unsaturated fatty acid 292
(MUFA), branched fatty acid (Br-FA) and poly-unsaturated fatty acid (PUFA) to total 293
phospholipid derived fatty acid (PLFAs) in SPM (a) and SS (b) samples. 294
295

19
296 Fig. 5. Carbon to nitrogen molar ratio (CN-r) in SPM (white bars) and SS (black bars) 297
samples. 298
299

20
300 Fig. 6. Difference between SPM and SS values for each POM quality parameters (i.e. 301
CHLA/PHAEOs, ITPIG, SFA, MUFA, PFA, Br-FA and CN-r). 302
303

21
304 Fig. 7. Plot of the Principal Component Analysis (PCA) for SPM (white squares) and SS 305
(black squares) samples. Arrows represent the different POM quality derived parameters 306
calculated for SPM and SS samples over various time scales: A = chlorophyll a to 307
phaeopigments ratio and B = intact to total pigments ratio (‘short time scale’, dashed line); C 308
= saturated fatty acid, D = mono-unsaturated fatty acid, E = poly-unsaturated fatty acid and F 309
= branched fatty acid (‘intermediate time sale’, dotted line); and G = carbon to nitrogen ratio 310
(‘long time scale’, solid line). 311
312
4. Discussion 313
Although the North Sea is a well-studied area, previous investigations usually focused either 314
on OM transport at specific sites (e.g. Kattegat and Skagerrak – De Haas and Van Weering, 315
1999; Oyster Grounds – Van Raaphorst et al., 1998) or OM degradation in the sediment using 316
one or two classes of specific biomarkers (e.g. amino acids and hexosamines – Dauwe and 317
Middelburg, 1998; phytopigments – Boon et al., 1998; phospholipid fatty acids – Stoeck et 318
al., 2002). To our best knowledge, this is the first time that several molecular biomarkers in 319

22
both SPM and SS samples are analysed at 10 stations located along the transport route of OM 320
in the North Sea. Our results are discussed in terms of POM composition, POM quality, and 321
the factors controlling POM quality both in the water column and the surface sediment. 322
323
4.1. Particulate Organic Matter composition. 324
4.1.1. In the surficial seawater 325
Our SPM samples, taken at 5 m depth, showed a mean organic carbon concentration of 0.19 326
mg.l-1 ± 0.14, which was consistent with data found by Kuerten (2010) during the same period 327
(Tab. 2). At St. 20, the POC concentration was relatively high (0.58 mg.l-1 ± 0.16) due to its 328
location close to the Elbe estuary (Middelburg and Herman, 2007). The individual pigment 329
and PLFA concentrations indicated the presence of diatoms in our SPM samples. At all 330
stations, chlorophyll a and fucoxanthin, biomarkers for diatoms (Wright and Jeffrey, 1987; 331
Wright et al., 1991) were found in high concentrations as well as C20:5ω3, a known diatom 332
biomarker (Volkman et al., 1989; Ahlgren et al., 1992; Dunstan et al., 1993) (Tab. 2). The 333
PLFA C16:4ω1, also a diatom biomarker (Dunstan et al., 1993; Viso and Marty, 1993) 334
supported this at St. 02, 11, 17 and 42. Furthermore, peridinin in pigments and C22:6ω3 in 335
PLFAs indicated the presence of dinoflagellates (Jeffrey, 1974; Dalsgaard et al., 2003) while 336
the chlorophylls b, c and c3 were attributed to the presence of chlorophytes (Jeffrey, 1976). 337
These results, reinforced by a CN-molar ratio of on average 6.1 ± 0.4 (Fig. 5) were consistent 338
with the typical organic matter composition in marine phytoplankton (Henrichs, 2005) and a 339
clear reflection of basin-wide primary production. Our SPM samples also contained the PLFA 340
C18:1ω7c and in lower concentrations at some stations the PLFAs i-C15:0, ai-C15:0 and i- 341
C17:0. These PLFAs are known biomarkers for bacteria: the first denoting the presence of 342
Gram-negative Proteobacteria (Braeckman et al., 2012), the latter indicative for Cytophaga- 343
Flavobacteria and Gram-positive bacteria (Dalsgaard et al., 2003). The PLFA C16:1ω7c was 344

23
also found in our SPM samples in relatively high concentrations (0.18 μg-C.l-1 ± 0.07). This 345
PLFA can be attributed either to diatoms or bacteria (Dalsgaard et al., 2003). Compound 346
specific carbon isotope analysis of C16:1ω7c indicated that this PLFA was dominantly from 347
bacterial origin (data not shown). 348
349
4.1.2. Surface sediment 350
Pigment and PLFA composition in SS samples reflected findings in the SPM samples. Here 351
also, chlorophyll a and fucoxanthin exhibited relatively large concentrations at all stations, 352
indicating a diatom-source, which was corroborated by PLFAs (C20:5ω3 and C16:4ω1; Tab. 353
3). The absence of peridinin and the other chlorophylls (chlorophylls b and c3) however, 354
suggested either that dinoflagellates and chlorophytes did not reach the seafloor or degraded 355
faster than diatom-derived material. Pigment composition in SS samples was also 356
characterised by increasing concentrations of chlorophyll a degradation products, i.e. 357
pheophytin a and phaeophorbide a, from St. 02 to St. 65 (Tab. 3). Moreover, SS samples 358
contained high concentrations of C16:1ω7c. Like in SPM, δ13C-C16:1ω7c indicated that this 359
PLFA was from bacterial origin (data not shown). This was reinforced by the relatively high 360
concentrations of individual PLFA biomarkers typical for bacteria, such as C18:1ω7c (Tab. 3) 361
and by the increase of MUFA in SS samples compared to SPM samples (Fig. 4). Bechtel and 362
Schubert (2009) attributed high percentages of MUFA to enhanced contributions from 363
bacterial lipids. Summarising, the POM composition in SS was a mixture of OM of 364
phytoplankton and bacterial origin. 365
No evidence of terrestrial-derived POM was found, even in the stations receiving freshwater 366
input (lower salinity at St. 20, 52, 62 and 65). This may partly be due to the choice of 367
biomarkers analysed, but our unpublished stable carbon and nitrogen isotope analysis of bulk 368

24
organic matter, and compound specific isotope analyses of PLFAs indicate that the POM in 369
this study was primarily from marine origin. 370
371
4.2. Particulate Organic Matter transport processes 372
4.2.1. Vertical transport of POM 373
The similarity in POM composition of surface waters and underlying sediments clearly 374
indicate that POM from the surface seawater was deposited on the sediments. The organic 375
compounds analysed have different rates of degradation (Cowie and Hedges, 1994; Dauwe 376
and Middelburg, 1998; Woulds and Cowie, 2009, Veuger et al., 2012) and this allows to 377
assess the degradation state of POM in the water column and in surface sediments over 378
several time scales. 379
The results indicate that POM was fresher in SPM than in SS samples at all stations. In short, 380
CHLA/PHAEOs and ITPIG were higher in SPM than SS samples (Fig. 3), while also the 381
PLFA composition changed, with lower concentrations of PUFA and higher concentrations of 382
MUFA and SFA in SS samples (Fig. 4). Since PUFA are less resistant to diagenetic 383
degradation than MUFA and SFA (Farrington et al., 1988; Wakeham and Canuel, 1990), this 384
indicates more degraded POM on the top of the sediments. In addition, Br-FA in sediments 385
increased at all stations suggesting a higher contribution of bacterial OM (Bechtel and 386
Schubert, 2009) (Tab. 3, Fig. 4b). Moreover, during initial stages of OM degradation, the CN- 387
molar ratio of POM from marine origin usually increases due to the preferential degradation 388
of N-rich components (Middelburg and Herman, 2007); and higher CN ratios were observed 389
at all stations in SS compared to SPM samples (Fig. 5). 390
However, the difference between SPM and SS samples varied between stations and between 391
POM quality parameters (Fig. 6). On average, the highest differences between SPM and SS 392
samples were found at St. 30, 62 and 65, where organic matter was in a more advanced 393

25
degraded state compared to the suspended organic matter. Such results were expected as St. 394
30 is located in the Oyster Grounds, a semi-depositional area (Otto et al., 1990) and St. 62 395
and 65, the deepest stations are at the end of the sedimentary OM transport route (Lohse et al., 396
1995; Van Raaphorst and Malschaert, 1996; Dauwe and Middelburg, 1998; Fig.1). The large 397
difference between SPM and SS samples for the CN-molar ratio at St. 62 and 65 can be 398
explained by the importance of an older fraction in the SS samples (Fig. 5 and 6). Indeed it 399
has been reported that the major fraction (53 to 63%) of the total suspended matter of the 400
North Sea is deposited in the Skagerrak (Eisma, 1990; Dauwe and Middelburg, 1998) and this 401
is highly degraded. Particulate organic matter undergoes remineralisation while settling 402
vertically through the water column, therefore the deeper is the water column, the more 403
degraded the POM reaching the seafloor. Furthermore these stations (St. 62 and 65) seemed 404
to receive a larger share of freshwater inputs (lower salinity, Tab. 1), although no evidence of 405
substantial quantities of terrestrial-derived OM was observed. 406
For the other parameters, except SFA and ITPIG, the highest difference between SPM and SS 407
samples were found at St. 30. Rapid remineralisation of recently-deposited organic matter 408
(Van Raaphorst et al., 1998) and the deposition of POM from the upstream stations might 409
explain this. In addition, St. 30 may also receive POM from the East Anglian Plume, 410
transporting matter from river discharge and seafloor erosion, thus with an advanced 411
degradation state (Dyer and Moffat, 1998). 412
The small difference of CHLA/PHAEOs between SPM and SS samples at St. 20 might be 413
explained by the stormy weather the day of the sampling. Indeed stormy weather promotes 414
the resuspension of the sediment especially at shallow depths (Tab. 1) (Gerritsen et al., 2001), 415
and the water sampled at this station was turbid. This result might also be explained by river 416
input as St. 20 is located in the German Bight, a region receiving freshwater from the Rhine, 417
the Meuse and the Scheldt rivers (Eleveld et al., 2008). 418

26
4.2.2. Lateral transport of POC 419
The decreasing OM quality in the sediments from the primary productive area (St. 02 and St. 420
07) to the main deposition area (St. 65) was already demonstrated by Dauwe and Middelburg 421
(1998) based on samples taken in 1994 and 1996. These authors investigated the sediment 422
OM degradation state using amino acids and hexosamines and developed the Degradation 423
Index (DI), an amino acid based index used as OM quality indicator. Our samples, taken more 424
than 10 years later show similar trends. All our POM quality parameters, i.e. the decrease in 425
pigments derived parameters (Fig. 3), the decrease of PUFA and SFA and the increase MUFA 426
and Br-FAs (Fig. 4b) and the increase in CN-molar ratio (Fig. 5) from St. 02 to 65 427
corroborated Dauwe and Middelburg (1998) results. All our parameters indicate increasingly 428
higher relative contributions of degraded material from the primary production (St. 02 and 07) 429
to the main deposition area at St. 65, and thus confirmed the degradation gradient in OM 430
quality along the general transport route of sedimentary organic matter in the southern North 431
Sea (Lohse et al., 1995; Van Raaphorst and Malschaert, 1996; Dauwe and Middelburg, 1998). 432
In contrast, it appears that there is no degradation gradient in the sea surface water from St. 02 433
to 65. Most of the POM quality parameters, such as ITPIG (Fig. 3b), the composition of the 434
PLFA pool (Fig. 4a) and the CN-molar ratio (Fig. 5), were relatively constant in SPM and 435
indicative of relatively fresh POM, i.e. a consistently lack of evidence for a substantial 436
resuspended organic matter contribution. This was not true at St. 20, where evidence of 437
resuspension was observed as mentioned above. The variation of CHLA/PHAEOs between 438
stations (Fig. 3a) and especially its high values at St. 30, 52 and 62 can be attributed either to 439
a rapid lateral transport from the primary production area (St. 02 and 07) to the main 440
deposition area (St. 65) or to local primary production, which is more important than the 441
possible advection of older material. 442
443

27
4.3. Factors controlling POM quality in the southern North Sea 444
The above discussed results are summarised in the principal component analysis (PCA) 445
presented in Fig. 7. Results clearly show a distinction between SPM and SS samples, 446
indicating that OM quality in SPM and SS are not controlled by the same factors. The 1st axis 447
of the PCA separates OM with a fresh signature, mainly SPM samples, from those that 448
harbour more degraded material, mainly SS. The SS samples from St. 02 and St. 07 are 449
positioned near to the SPM samples, indicating their relatively fresh signature. The PCA 450
confirms that POM quality was relatively constant in the surface seawater, or did not provide 451
consistent results from the productive area (St. 02 and 07) to the main deposition area (St. 62) 452
(Fig. 1). The 2nd axis of the PCA, which explains another 10% of the variance in the data, 453
relates to increasing CHLA/PHAEOs and PUFA for SPM at St. 17 and 30, and for both SPM 454
and SS at St. 52, 62 and 65, indicating fresher OM in these samples compared to the others. 455
Therefore the PCA also confirms (i) either a rapid lateral transport from the primary 456
production area (St. 02 and 07) to the main deposition area (St. 65) or local primary 457
production, which is more important than the possible advection of older material in SPM at 458
St. 17, 30, 52, 62 and 65 and (ii) the deposition of relatively fresh OM on the surface 459
sediments at St. 52, 62 and 65. Nevertheless, the first and second axes together position the 460
SS according to the sedimentary OM transport route, from relative labile OM in the South 461
(lower-left part of PCA) to more refractory in the North (upper-right PCA corner). The PCA 462
clearly reveals the degradation gradient of POM quality in the sediments along the 463
sedimentary OM transport route, where stations can be arranged in three groups: (i) the main 464
primary productive area, i.e. St. 02 and 07, (ii) the conduit zone, comprising St. 11, 17, 20, 30 465
and 42, and (iii) the deposition area at the end of the transport route (St. 52, 62 and 65) with 466
more degraded OM. It is remarkable that the indices that represents the shortest time-scales, 467
CHLA/PHAEOs and ITPIG, are designated to be most distinguishing between water-column 468

28
and sedimentary POM, while the composition of the PLFA pool (SFA, MUFA, PUFA and 469
Br-FA) and the CN-molar ratio, which averages over intermediate and longer time scales sets 470
apart the sedimentary samples. 471
472
5. Conclusion 473
We investigated the biogeochemical signatures of POM in the waters and surface sediments 474
in the southern North Sea via a multiproxy approach. Our study showed that POM quality is 475
not controlled by the same factors in the water column and in the sediments. There is 476
consistent ageing of OM both from the water towards the sediment, and in the sediment, 477
along the sedimentary OM transport route (Fig. 8). 478
Our findings also show that exchange of material between the water column and the 479
underlying sediment is important especially in the productive area. The divergence in quality 480
of OM in water and sediment from the southwest to the northeast of the North Sea seem to 481
indicate a lower degree of benthic-pelagic coupling along the transport axis (Fig. 8). 482
However, occasionally, intense benthic-pelagic coupling can be observed, as is the case for 483
the Skagerrak stations where strong deposition of diatoms was observed, and for a station in 484
the German Bight where storm-induced resuspension significantly diluted the pelagic POM 485
with sedimentary material (Fig.8). If lateral transport rather than in situ production would be 486
of increasing importance along the transport route, we would expect to see a difference 487
between the POM quality from the primary production to the main deposition area for both 488
SPM and SS samples. Our results for the water column are not in line with this, as the quality 489
does not display a clear spatial signal (Fig. 8). 490

29
491
Fig. 8. Conceptual pictures of the main conclusions of this study. The arrows represent the 492
quality of POM. The light gray means fresh, dark means degraded POM. The triangle shows 493
the intensity of benthic-pelagic coupling, the dashed line rectangle represents the occasional 494
event of intense benthic-pelagic coupling, which can occur along the sedimentary OM 495
transport route, such as the deposition of fresh POM in the depositional area. SW = Sea 496
Water, SED = Sediment. 497
498
6. Acknowledgement 499
We thank the officers, crew and scientific party of the R.V. Pelagia for their support during 500
the cruise and the analytical laboratory of NIOZ-YE for their advices and for performing the 501
analyses. We are also grateful to Thomas Bianchi and two anonymous reviewers for their 502
constructive comments on this manuscript. This project is part of the FOKUZ program and is 503
a contribution of the Netherlands Center for Earth System Sciences. 504
505
7. Terms and acronyms 506
Br-FA – Branched fatty acid 507
CHLA/PHAEOs – Chlorophyll a to phaeopigments ratio 508
CN-r – Carbon to nitrogen ratio 509

30
ITPIG – Intact to total pigments ratio 510
MUFA - Monounsaturated fatty acid 511
OM – Organic matter 512
PCA – Principal component analysis 513
PLFA – Phospholipid derived fatty acid 514
POC – Particulate organic carbon 515
POM – Particulate organic matter 516
PUFA – Polyunsaturated fatty acid 517
SFA – Saturated fatty acids 518
SPM – Suspended particulate matter 519
SS – Surface sediment 520
St. – Station 521
522
523

31
8. References 524
Ahlgren, G., Gustafsson, I.B., Boberg, M., 1992. Fatty acid content and chemical composition 525
of freshwater microalgae. Journal of Phycology 28, 37–50. 526
Bechtel, A., and Schubert, C.J., 2009. Biogeochemistry of particulate organic matter from 527
lakes of different trophic levels in Switzerland. Organic Geochemistry 40, 441-454. 528
Bianchi, T.S., 2011. The role of terrestrially derived organic carbon in the coastal ocean: A 529
changing paradigm and the priming effect. Proceedings of the National Academy of 530
Sciences 108 (49), 19473-19481. 531
Bianchi, T.S., Canuel, E.A., 2011. Chemical Biomarkers in Aquatic Ecosystems. Princeton 532
University Press, pp.396. 533
Bligh, E.G., Dyer, W.J., 1959. A rapid method for total lipid extraction and purification. 534
Canadian Journal of Biochemistry and Physiology 37, 911-917. 535
Boon, A.R., Duineveld, G.C.A., Berghuis, E.M., van der Weele, J.A., 1998. Relationships 536
between benthic activity and the annual phytopigment cycle in near-bottom water and 537
sediments in the southern North Sea. Estuarine, coastal and shelf science 46, 1-13. 538
Borges, A.V., 2005. Do we have enough pieces of the jigsaw to integrate CO2 fluxes in the 539
coastal ocean? Estuaries 28 (1), 3-27. 540
Boschker, H.T.S., De Brouwer, J.F.C., Cappenberg, T.E., 1999. The contribution of 541
macrophyte derived organic matter in microbial biomass in salt marsh sediments: Stable 542
carbon isotope analysis of microbial biomarkers. Limnology and Oceanography 44, 309– 543
319. 544
Braeckman, U., Provoost, P., Sabbe, K., Soetaert, K., Middelburg, J.J., Vincs, M., 545
Vanaverbeke, J., 2012. Temporal dynamics in the diet of two marine polychaetes as 546
inferred from fatty acid biomarkers. Journal of Sea Research 68, 6-19. 547
Budge S.M., Iverson S.J., Koopman H.N., 2006. Studying trophic ecology in marine 548

32
ecosystems using fatty acids: a primer on analysis and interpretation. Marine Mammal 549
Sciences 22, 759−801. 550
Christodoulou, S., Marty, J.-C., Miquel, J.-C., Volkman, J.K., Rontani, J.-F., 2009. Use of 551
lipids and their degradation products as biomarkers for carbon cycling in the 552
northwestern Mediterranean Sea. Marine Chemistry 113, 25-40. 553
Codispoti, L.A., Brandes, J.A., Christensen, J.P., Devol, A.H., Naqvi, S.W.A., Paerl, H.W., 554
Yoshinari, T., 2001. The oceanic fixed nitrogen and nitrous oxide budgets: moving 555
targets as we enter the anthropocene? Sciences Marine 65, 85–105. 556
Cowie, G.L., Hedges, J.I., 1994. Biochemical indicators of diagenetic alteration in natural 557
organic-matter mixtures. Nature 369 (6478), 304–307. 558
Dalsgaard, J., St John, M., Kattner, G., Muller-Navarra, D., Hagen, W., 2003. Fatty acid 559
trophic markers in the pelagic marine environment. Advances in Marine Biology 46, 560
225–340. 561
Dauwe, B., Middelburg, J.J., 1998. Amino acids and hexosamines as indicators of organic 562
matter degradation state in North Sea sediments. Limnology and Oceanography 43, 782- 563
798. 564
De Haas, H., 1997. Transport, preservation and accumulation of organic carbon in the North 565
Sea. Thesis. Utrecht University. pp. 149. 566
De Haas, H., Van Weering, T.C.E., 1999. Recent sediment accumulation, organic carbon 567
burial and transport in the northeastern North Sea. Marine geology 136, 173-187. 568
Dobrynin, M., Gayer, G., Pleskachevsky, A., Günther, H., 2010. Effect of waves and currents 569
on the dynamics and seasonal variations of suspended particulate matter in the North Sea. 570
Journal of Marine Systems 82, 1-20. 571
Dunstan, G.A., Volkman, J.K., Barrett, S.M., Leroi, J., Jeffrey, S., 1993. Essential 572
polyunsaturated fatty acids from 14 species of diatom (Bacillariophyceae). 573

33
Phytochemistry 35, 155–161. 574
Dyer, K.R., Moffat, T.J., 1998. Fluxes of suspended matter in the East Anglian Plume 575
Southern North sea. Continental Shelf Research 18, 1311-1331. 576
Eisma, D., 1990. Transport and deposition of suspended matter in the North Sea and relation 577
to coastal siltation, pollution, and bottom fauna distribution. Review of Aquatic Science 578
3, 181-216. 579
Eleveld, M.A., Pasterkamp, R., van der Woerd, H.J., Pietrzak, J.D., 2008. Remotely sensed 580
seasonality in the spatial distribution of sea-surface suspended particulate matter in the 581
southern North Sea. Estuarine, Coastal and Shelf Science 80, 103-113. 582
Farrington, J.W., Davis, A.C., Sulanowski, J., McCaffrey, M.A., McCarthy, M., Clifford, C. 583
H., Dickinson, P., Volkman, J.K., 1988. Biogeochemistry of lipids in surface sediments 584
of the Peru upwelling area at 15°S. In: Mattavelli, L., Novelli, L. (Eds.), Advances in 585
Organic Geochemistry 1987. Pergamon Press, Oxford, 607–617. 586
Gattuso, J.-P., Dawson, N.A., Duarte, C.M., Middelburg, J.J., 2005. Patterns of publication 587
effort in coastal biogeochemistry: a bibliometric survey (1971 to 2003). Marine Ecology 588
Progress Series 294, 9-22. 589
Gerritsen H., Boon, J.G., Van der Kaaij, T., Vos, R.J., 2001. Integrated modelling of 590
suspended matter in the North Sea. Estuarine, Coastal and Shelf Science 53, 581-594. 591
Halpern, B.S., Walbridge, S., Selkoe, K.A., Kappel, C.V., Micheli, F., D’Agrosa, C., Bruno, 592
J.F., Casey, K.S., Ebert, C., Fox, H.E., Fujita, R., Heinemann, D., Lenihan, H.S., Madin, 593
E.M.P., Perry, M.T., Selig, E.R., Spalding, M., Steneck, R., Watson, R., 2008. A global 594
map of human impacts on marine ecosystems. Science 319, 948. 595
Henrichs, S.M., 2005. Organic matter in coastal marine sediments. In: Robinson, A.R., Brink, 596
K.H. (eds), 2005. The global coastal ocean: multiscale interdisciplinary processes. The 597
Sea (13), Chap. 5: 129-163. 598

34
Jeffrey, S.W., 1974. Profiles of photosynthetic pigments in the ocean using thin-layer 599
chromatography. Marine Biology 26, 101-119. 600
Jeffrey, S.W., 1976. A report of green algal pigments in the central Atlantic Ocean. Marine 601
Biology 37, 33-37. 602
Jeffrey, S.W., Mantoura, R.F.C., Wright, S.W., (Eds), 1997. Phytoplankton pigments in 603
oceanography: guidelines to modern methods. Monographs on Oceanographic 604
Methodology 10. UNESCO Publishing: Paris. ISBN 92-3-103275-5. 661 pp. 605
Kuerten, B., 2010. An end-to-end study of spatial differences in North food webs. Ph. D. 606
thesis. University of Newcastle upon Tyne. 607
Lohse, L., Malschaert, J.F.P., Slomp, C.P., Helder, W., Van Raaphorst, W., 1995. Sediment- 608
water fluxes of inorganic nitrogen compounds along the transport route of organic matter 609
in the North Sea. Ophelia 41, 173-197. 610
Middelburg, J.J., Herman, P.M.J., 2007. Organic matter processing in tidal estuaries. Marine 611
Chemistry 106, 127-147. 612
Newbold, J.D., Elwood, J.W., O’Neill, R.V., Van Wiekle, V., 1981. Measuring nutrients 613
spiralling in streams. Canadian Journal of Fisheries and Aquatic Science 38, 860-863. 614
Newbold, J.D., Mulholland, P.J., Elwood, I.W., O’Neill, R.V., 1982. Organic carbon 615
spiralling in stream ecosystems. Oikos 38, 266-272. 616
Newbold, J.D., 1992. Cycles and spirals of nutrients. Chap.18 – p.379-408 in “The Rivers 617
Handbook: hydrological and ecological principles”. Calow P. and Petts G.E., 1992. Ed. 618
Oxford 619
Nieuwenhuize J., Maas, Y.E.M., Middelburg, J.J., 1994. Rapid analysis of organic carbon and 620
nitrogen in particulate materials. Marine Chemistry 45, 217-224. 621
Otto, L., Zimmerman, J.T.F., Furnes, G.K., Mork, M., Saetre, R., Becker, G., 1990. Review 622
of the physical oceanography of the North Sea. Netherlands Journal of Sea Research 26, 623

35
161-238. 624
R Development Core Team, 2008. R: A language and environment for statistical computing. 625
R Foundation for Statistical Computing, Vienna, Austria. ISBN 3-900051-07-0. URL: 626
http://www.R-project.org. 627
Soetaert, K., Middelburg, J.J., Herman, P.M.J., Buis, K., 2000. On the coupling of benthic 628
and pelagic biogeochemical models. Earth-Science reviews 51, 173-201 . 629
Stoeck, T., Kröncke, I., Duineveld, G.C.A., Palojärvi, A., 2002. Phospholipid fatty acid 630
profiles at depositional and non-depositional sites in the North Sea. Marine Ecology 631
Progress Series 241, 57-70. 632
Thomas, H., Bozec, Y., de Baar, H.J.W., Elkalay, K., Frankignoulle, M., Schiettecatte, L.-S., 633
Kattner, G., Borges, A.V., 2005. The carbon budget of the North Sea. Biogeosciences (2), 634
87-96. 635
Tiessen, M.C.H., Fernard, L., Gerkema, T., van der Molen, J., Ruardij, P., van der Weer, 636
H.W., 2014. Numerical modelling of physical processes governing larval transport in the 637
southern North Sea. Ocean Science 10, 357-376. doi:10.5194/os-10-357-2014. 638
Van Raaphorst, W., Malschaert, J., 1996. Ammonium adsorption in superficial North Sea 639
sediments. Continental Shlef Research 16 (11), 1415-1435. 640
Van Raaphorst, W., Malschaert, J., Van Haren, H., 1998. Tidal resuspension and deposition 641
of particulate matter in the Oyster Grounds, North Sea. Journal of Marine Research 56, 642
257-291. 643
Veuger, B., van Oevelen, D., 2011. Long-term pigment dynamics and diatom survival in dark 644
sediment. Limnology and Oceanography 56 (3), 1065-1074. 645
Veuger, B., van Oevelen, D., Middelburg, J.J., 2012. Fate of microbial nitrogen, carbon, 646
hydrolysable amino acids, monosaccharides, and fatty acids in sediment. Geochimica et 647
Cosmochimica Acta 83, 217-233. 648
36
Viso, A.C., Marty, J.C., 1993. Fatty acids from 28 marine microalgae. Phytochemistry 34, 649
1521–1533. 650
Volkman, J.K., Jeffrey, S.W., Nichols, P.D., Rogers, G.I., Garland, C.D., 1989. Fatty acid and 651
lipid composition of 10 species of microalgae used in marine culture. Journal of 652
Experimental Marine Biology and Ecology 128, 219–240. 653
Wakeham, S.G., Canuel, E.A., 1990. Fatty acids and sterols of particulate matter in a brackish 654
and seasonally anoxic coastal salt pond. Organic Geochemistry 16, 703–713. 655
Woulds, C., Cowie, G.L., 2009. Sedimentary pigments on the Pakistan margins: Controlling 656
factors and organic matter dynamics. Deep-Sea Research II (56), 347-357. 657
Wright, S.W., Jeffrey, S.W., 1987. Fucoxanthin pigment markers of marine phytoplankton 658
analysed by HPLC and HPTLC. Marine Ecology Progress Series 38, 259-266. 659
Wright, A., Wright, S.W., Jeffrey S. W., Mantoura, R.F.C., Llewellyn, C.A., Bjornland, T., 660
Repeta, D., Welschmeyer, N., 1991. Improved HPLC method for the analysis of 661
chlorophylls and carotenoids from marine phytoplankton. Marine Ecology Progress 662
Series 77, 183-196. 663