AND PROSPECTS OF SINGAPORE - World Bank
66
RETURN TO REPORTS DESK wIrTHIN FE-52 ONE WEEK This report was prepared for use within the Bank and its affiliated organizations. They do not accept responsibility for its accuracy or completeness. The report may not be published nor may it be quoted as representing their views. INTERNATIONALBANK FOR RECONSTRUCTION AND DEVELOPMENT INTERNATIONALDEVELOPMENT ASSOCIATION CURRENT ECONOMIC POSITION AND PROSPECTS OF SINGAPORE February 10, 1966 Far East Department Public Disclosure Authorized Public Disclosure Authorized Public Disclosure Authorized Public Disclosure Authorized Public Disclosure Authorized Public Disclosure Authorized Public Disclosure Authorized Public Disclosure Authorized
Transcript of AND PROSPECTS OF SINGAPORE - World Bank

RETURN TOREPORTS DESK
wIrTHIN FE-52ONE WEEK
This report was prepared for use within the Bank and its affiliated organizations.They do not accept responsibility for its accuracy or completeness. The report maynot be published nor may it be quoted as representing their views.
INTERNATIONAL BANK FOR RECONSTRUCTION AND DEVELOPMENT
INTERNATIONAL DEVELOPMENT ASSOCIATION
CURRENT ECONOMIC POSITION
AND PROSPECTS
OF
SINGAPORE
February 10, 1966
Far East Department
Pub
lic D
iscl
osur
e A
utho
rized
Pub
lic D
iscl
osur
e A
utho
rized
Pub
lic D
iscl
osur
e A
utho
rized
Pub
lic D
iscl
osur
e A
utho
rized
Pub
lic D
iscl
osur
e A
utho
rized
Pub
lic D
iscl
osur
e A
utho
rized
Pub
lic D
iscl
osur
e A
utho
rized
Pub
lic D
iscl
osur
e A
utho
rized

CURRENCY EQUIVALENTS
Currency Unit = Malayan dollar
1 Malayan dollar = U.S. $0. 3271 U.S. $ = M$ 3.06M$ 1 million = U. S. $327, 000

TABLE OF CONTENTS
Page No.
BAS IC DATA
SUMMANRY AND CONCLUSIONS i
I. Background ..................... ................ 1
II. Recent Economic Developments .................... 3
Over-all Growth .. ......... . .. . . . .... . 3
Public Sector Finance .......... ........ 5Money and Prices . ........................... . 6Balance of Payments . * .................... ... . 7
Development by Sectors ......... 0*.. .... ....... 9
III. Public Development Programs ..................... 15
The First Development Plan ............... .. ... 15The 1966-70 Plan .......... ................... 16
IV. The Financial Outlook ............. ...........*. 22
A. The Public Sector ..... ................... 22B. Balance of Payments ............... ...... 24C. The Over-all Financial Outlook ........... 27D. Creditworthiness .......................... 28
STATISTICAL APPENDIX: Tables 1-24
MAP OF SINGAPORE
This report is based on the findings of a mission inSeptember 1965 to Singapore composed of Messrs. HowardE. Tolley and Maurice F. Perkins of the Bank.

BASIC DATA
Area (including small islands) 225 sq. milesAgricultural area T sq. milesBuilt up area 64 sq. milesMarshes and swamps 24 sq. milesOther 74 sq. miles
Population (mid-1964) 1.82 millionOf which: Chinese 1.37 million
Malays 0.26 million
Natural increase: 1960-64 average 2.9% p.a.1964 2.6%
Political Status: Newly independent country (as of August 9, 1965).
Gross National Product: (196h) M$2,724 million
Rate of growth: (1960-6h) 7.0%(1964) o.6%
Per capita (1964) M$1,500 (US$5oo)
Gross Domestic Product at Factor Cost (1964): M$2,536Of which:
Agriculture and Fisheries 5%Entrepot Trade 14%Manufacturing and Construction 13%Retail and lVholesale Trade 21%U.K. Armed Forces 16%All Other 31%
Percent of GDP at Market Prices: 1961-64average
Gross Investment 12.3Gross Savings 10.0Balance of Payments Current Account Deficit 2.6Investment Income Receipts (net) 0.4Public Sector Current Revenue (including
accumulation in provident funds) 20.1
Consumer Price Index (April/May 1960 = 100):
August 1965 l0o.6

Public Finance, 1964 (million M$)
Current Revenue plus net interest 315Current Expenditure 272
Current Surplus 73Surplus of Commercial Undertakings 88Accumulations of Provident Funds 50Other Sources 4
Total Surplus 17Capital Expenditure 285
Overall Deficit Y-JiD
External Public Debt: (mil]Jon -US$)
Total Debt (June 30, 1965) 26.7Total Annual Debt Service (1965) 0.9Debt Service Ratio (1965 estimate) 0.2%
Foreign Trade: 1964 (excludes Indonesia): (million M$)
Exports 2,772of which to Malaysia 1,159
Imports 3,479of which from Malaysia 977
Balance of Payments, 1964I: (milIJon M$)
Domestic Trade Exports 311Imports -1,606
Entrepot Trade (net) 588Services and Transfers 518
Current Account -189
Foreign Exchange Reserves, end 196h: (million M$)
Public Authorities 706Banks 98Singapore Share of Currency Board Assets (estimated) 285
Total

SUMIARY AND CONCLUSIONS
1. During the 1950's the growth in Singapore's main economic activity,entrepot trade with neighboring countries, began to taper off while the popu-lation and labor force continued to increase rapidly. In order to maintaina reasonable growth in incomes and provide additional Job opportunities,the Government in the early 1960's embarked on a program to encourage de-velopment of industry. With a total population of less than two million,Singapore sought a merger with the Pederation of Malaya in order to form alarger domestic market for manufactured goods. This desire culminated inthe formation of Malaysia in September 1963 through the merger of Singapore,Sarawak and Sabah into the Federation of Malaya; the merger agreement pro-vided for the establishment of a tariff-protected, Malaysia-wide commonmarket.
2. With the Government providing facilities and incentives forindustry and with the approach and realization of merger, economic activityrose rapidly during 1961-63, buoyed by rising private and public investment.The surge was halted in 1964, however, as Indonesia's policy of confronta-tion brought a sharp drop in Singapore's entrepot trade, and other tradedeclined somewhat following the 1963 boom. On the other hand, even thougharrangements for the common market proceeded slowly after merger, bothpublic and private investment continued to increase in anticipation of itsestablishment in the near future. These hopes received a sharp setbackwhen tensions arising from both political and economic factors led to these'paration of Singapore from Malaysia on August 9, 1965. Singapore there-by became an independent nation.
3. While separation does not necessarily preclude Singapore'sparticipation in a Malaysian common market, the prospects for an earlytrading arrangement of this kind do not appear bright. Without a commonmarket the development of industry is likely to be somewhat more difficultand take somewhat longer than previously anticipated.
4. Singapore's first five year plan covering 1961-65 has just endedand a new 1966-70 plan has been recently announced. Both of the plans con-centrate on (1) expansion of infrastructure facilities such as electricpower, transportation facilities and industrial estates, and (2) expansionand improvement of social amenities, particularly education and housing.ALthough the first plan got off to a slow start and administrative weak-nesses remain in the planning mechanism, Government performance has beengenerally satisfactory during the last five years. The pattern of actualcapital expenditures was appropriate for an urban economy seeking to de-velop industry. Moreover, performance has improved over time; capitaloutlays rose from about M$100 million in 1961 to the order of M$250 mil-lion in 1965. The outstanding successes have been in those activitiesconcerned with physical construction, such as the expansion of publicutility and Singapore harbor facilities, the housing program and indus-trial estates. The increase in public investment was accomplished whilefollowing sound finaivaic pol i vhieh. hoo - t i am-sd iuoicntavy or price
instability.
-1i-

5. The size and composition of proposed public investment expendi-tures in 1966-70 appear reasonably well planned. Although the expendituretarget (M$1,522 million) is about 60 percent higher than capital expen-ditures in the last five years, it would require an annual average ex-penditure (about M$300 million) only moderately above actual capital out-lays of the last year or two. The targeted sum should ti2erefore be withinthe Government's administrative capability to spend reasonably efficiently.Moreover, there is justification for a relatively high level of governmentinvestment in order to help maintain economic growth and provide employmentopportunities. This is particularly true in the immediate future whenprivate investment is likely to be somewhat sluggish until greater con-fidence is gained in developing industry without the advantages of acommon market.
6. In order to finance the projected level of public sector capitaloutlays, it is estimated that the Government will have to obtain aboutM$330 million (US$110 million) from external sources or from a drawdownof reserves. In view of the uncertainties in Singapore's balance of pay-ments prospects - e.g., the future of trading relations with Indonesiaand Malaysia; the future of U.K. military expenditures in Singapore; andwhether or not Singapore will be able to develop successfully its exportsof manufactured goods - it would be prudent to conserve most of the coun-try's reserves to meet unforeseen contingencies. The Government wouldtherefore be justified in seeking external assistance for as much as pos-sible of the M$330 million needed over the next five years. Service pay-ments on Singapore's present external debt are small. Even if the entirerequirement of M$330 million were borrowed on conventional terms, debtservice payments would rise only to slightly more than 2.0 percent ofestimated current account earnings in 1970, which would still leave asubstantial margin of creditworthiness.
- ii -

THE CURRENT ECONOMIC POSITION AND PROSPECTS
OF SINGAPORE
I. BACKGROUND
1. During the century prior to World War II, Singapore developedinto the largest commercial and shipping center in Southeast Asia on thebasis of an extensive entrepot trade with nearby countries, particularlythe States of Malaya and Indonesia. After the war, the growth in entrepottrade began to taper off under the influence of economic development andgrowing national consciousness in nearby areas. However, the continuedhigh rates of growth in Singapore's population and labor force made itmandatory to find another source of income and employment to supplementthe traditional trading activities. For this purpose the development ofindustry appeared to hold the best promise.
2. Proposals for the merger of Singapore with the States of Malaya,which had gained independence in 1957, were made on several occasions duringthe late 1950's. The larger domestic market resulting from such a mergerwouild have facilitated industrialization, but the proposals were turneddown mainly because of concern in Malaya that the addition of Singapore'spredominantly Chinese population to that in Malaya would have given theChinese a majority in the total population. Singapore remained a Britishcolony.
3. In 1959, however, a constitutional change gave Singapore autonomyin all matters except defense, internal security and external relations.The Peoples Action Party (PAP) secured a large majority in the electionshe:Ld in the same year and formed the first government under the new consti-tution. The PAP was a predominantly moderate leftest party but with ast:rong far left minority. Both elements had close links with similar divi-sions in the trade unions. The economic policy of the PAP was one of activepromotion of economic development through encouragement of and assistanceto private enterprise.
4. After the elections internal dissension developed withinthe PAP between the moderate group, which favored merger with the Federa-tion, and the extremist faction, which wanted complete independence forSingapore and closer ties with Communist China. This was accompanied bya great deal of labor unrest. The Federation Government, fearing theapparent leftward drift in Singapore, announced in 1961 its willingnessto include Singapore in the Federation along with the North Borneo colonies,as the North Borneo native populations would counterbalance the SingaporeChinese. This turn of events precipitated a split in the PAP, but the pro-merger faction retained a slim majority and remained in control of thegovernment. The Government's position was strengthened by strong publicsupport for merger in a referendum and a subsequent election which re-tLurned the pro-merger faction to power with a strong majority.

- 2 -
5. Merger took place on September 16, 1963 with Singapore occupyinga special position in the Federation. It retained greater autonomy thanthe other States in such matters as education, health, social welfare andlabor. It also retained a large degree of financial autonomy under thefinancial arrangements in the merger agreement. On the other hand, Singa-pore was allowed considerably less than proportional representation in thefederal legislature and federal government posts so that the Malays keptpolitical control of Mfalaysia.
6. The most important economic provision of the merger agreementcalled for the establishment of a common market with a common protectivetariff to encourage industrial development. Establishment of a free tradezone in Singapore was envisaged in order to permit the continuation ofentrepot trade. A Tariff Board was to be appointed to work out the de-tai:Ls and administrative procedures for the common market.
7. However, political and economic integration did not proceedsmooDthly after merger. Indonesia immediately announced "Iconfrontation"and a severance of trade with the new Malaysian Federation, which broughta sharp reduction in Singapore's entrepot trade. Arrangements for estab-lishing the common market proceeded very slowly indeed; the Tariff Boarddid not begin its work for a year after the merger. There was oppositionin Singapore to new tax proposals of the central government; and dissatis-faction was voiced on both sides concerning the merger agreement for divi-sion of revenue between Singapore and the Federal Government.
8. On the political front, in the state elections held in Singaporeafter the merger, some members of the Alliance Party from Kuala Lumpuractively supported the opposition to the PAP (with little result). Later,when elections were held in the rest of Malaysia, the PAP backed candidatesin some of the other states but with little success. However, the PAP con-tinued to expand its political activity on the federal level and announcedthat it would join with all other opposition groups to form the "loyalopposition" to the ruling Alliance Party. The PAP pressed a campaign of"Malaysia for the Malaysians": that all citizens of the Federation shouldhave equal rights and privileges regardless of race. The Alliance Partyaccepted this concept as a long-term national goal, but felt strongly thatin the short run the political dominance of the Malay should be protectedto balance the economic advantage of the Chinese.
9. Antagonisms, fears and misunderstandings arising out of bothpolitical and economic factors finally led to a decision by the FederalGovernment to separate Singapore from Malaysia. This occurred on August 9,1965, and Singapore became a sovereign nation.
10. In the period since independence, except for a few cabinet changesrelated to the assumption of responsibility for defense, internal securityandl external relations, there have been no apparent political repercussionsinside Singapore. Regarding external relations, Singapore has become amember of the TJnited Nations; the Government has announced a policy ofnon-alignment with the major powers and has expressed a desire to be amember of the Afro-Asian bloc of developing countries; the latter desirehas received support from members of the Afro-Asian bloc.

- 3 -
11. Shortly after separation, Singapore approached Indonesia regard-ing the possibility of a limited resumption of trade between Singapore andIndonesia. However, this evoked strong criticism from Malaysia on securitygrounds, because of the experience in the early days of confrontation whensmall trading boats were used to smuggle explosives and saboteurs intoSingapore and the Malaysian mainland. As a result of this criticism, aswell as the unsettled conditions in Indonesia, the two year old suspensionof Singapore-Indonesia trade continues.
12. The tension between Singapore and Malaysia which existed priorto separation appears to have eased somewhat. There have been a few criti-cal exchanges reported in the press, but there have also been a number ofconciliatory statements by the political leaders of the two countries. InDecember 1965, following a suggestion by the Singapore Minister of Finance,the two governments agreed to establish a committee of officials to workout arrangements for closer economic cooperation. In this connectionhopes have been voiced for an arrangement approximating a common market.It remains to be seen whether these hopes will prove to be better basedthan similar hopes during the last several years. While the agreement toform the above mentioned committee is an encouraging step, there does notappear to be any basic change in conditions which would justify optimismabout the establishment of a common market, or similar arrangement, inthe foreseeable future.
13. The last few years have seen historic changes in Singapore'sstatus - changes from a Crown Colony to a semi-autonomous colony to aState in the Malaysian Federation and finally to complete independence inAugust 1965. However, the political and constitutional changes have notaltered the basic economic problem - to provide employment for the newadditions to the labor force and to reduce unemployment. The best chancefor providing the new job opportunities still appears to be through devel-opment of manufacturing industry to supplement traditional trading andprocessing activities. Prospects for this are promising. However, thedevelopment of industry will be somewhat more difficult and will takesomewhat longer than would have been the case if Singapore could haveparticipated in a Malaysia-wide common market.
II. RECENT ECONOMIC DEVELOPMENTS
Over-all Growth 1/
14. During the five years 1960-64, Singapore's GNP rose at an averageannual rate of approximately 7 percent, reaching an estimated M$2.7 billionin 1964. At the same time the rate of natural population growth declinedfrom 3.2 percent in 1960 to 2.6 percent in 1964; and there appears to havebeen a small net emigration during the period. It is estimated thereforethat total population increased at an average rate of about 2.75 percent
1/ Complete national accounts data for Singapore are not available. Thediscussion which follows is based partly on estimates prepared by theBank and partly on national expenditure data provided by the Govern-ment of Singapore.
- 4 -
and that per capita GNP rose at about 4.25 percent per annum. Per capitaGIEP in 1964 is estimated at M$i,500, equivalent to US$500, which isprobably the highest in Asia except for Japan.
15. This progress did not develop smoothly over the period, however.Public investment fell to a low level in 1959 and 1960 due to the constitu-tional change and the change of government. Thereafter it rose steadilyas the new government formulated and implemented its policy to assist indus-trial development and provide improved social amenities (particularlyhousing and education) for the population. Public capital formation isestimated at M$212 million in 1964, compared to about M$50 million in 1960.Private investment was relatively low from 1959 through 1961 due to un-certainties associated with the constitutional change and change in govern-ment, the 1959 recession, and the political and labor problems duringintra-party disputes within PAP. The investment climate improved in 1962as political stability and labor tranquility were restored and as theprospect of merger with the Federation of Malaya brightened. In 1963 withthe merger becoming a reality, the atmosphere continued to improve. Publicand private investment rose, trade increased and the economy surged ahead.In 1964, the surge was halted by the loss of the Indonesian trade resultingfrom Indonesia's confrontation policy and some levelling off in othertracLe following the 1963 boom. However, government investment continuedto rise and so did private investment as investors continued to anticipateestablishment of a common market. The increase in investment activitymore than offset the trade losses and, on balance, GNP is estimated tohave increased slightly during the year.
16. There was probably a modest growth in GNP in 1965 - larger thanin 1L964 but less than the 7 percent average of the preceding five years.Data covering part of the year indicate an increase in trade as comparedto the similar period of 1964. Government investment is estimated tohave increased. Private investment, however, was no doubt affected bythe change in the investment climate which came with separation. Thelat-ter brought a feeling of disappointment and frustration at losing thecomnon market at the last moment after years of hope and striving for it.Moreover, uncertainties were raised regarding such matters as findingalternative markets, possible changes in government policies, etc. Thusthe probable pattern of private investment was a continued rise in thefirst seven months of 1965, with a drop thereafter. For the year as awhole, it was probably somewhat lower than in 1964.
17. During the five years 1960-64, slightly more than one-half ofgross investment was undertaken by the private sector and slightly lessthan one-half by the public sector. Estimated total gross capital forma-tion increased from a low of about 6.5 percent of GNP in 1960 to just over15 percent of GNP in 1964.
18. There are no official savings data for Singapore and indirectestimates are difficult because of shortcomings in the balance of paymentsstatistics. However, it is estimated very roughly that total savingsaveraged about 10 percent of GNP during 1960-64, or slightly less than
- 5 -
average gross capital formation. Information on the public sector indi-cates that during 1960-64 public savings were more than sufficient to fi-nance public investment undertaken during the period. Private savings,on the other hand, were probably not sufficient to finance private capitalformation, the shortfall being made up by foreign private capital inflowsand some transfers from the public sector.
Public Sector Finance
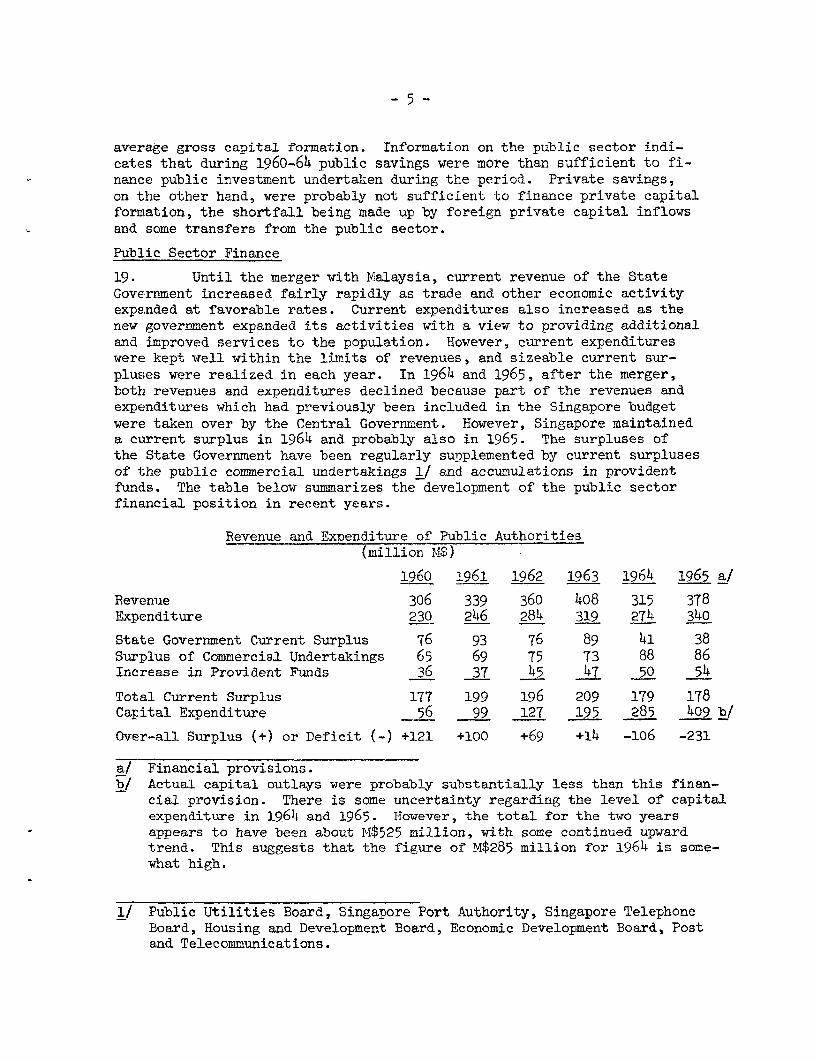
19. Until the merger with Malaysia, current revenue of the StateGovernment increased fairly rapidly as trade and other economic activityexpanded at favorable rates. Current expenditures also increased as thenew government expanded its activities with a view to providing additionaland improved services to the population. However, current expenditureswere kept well within the limits of revenues, and sizeable current sur-pluses were realized in each year. In 1964 and 1965, after the merger,both revenues and expenditures declined because part of the revenues andexpenditures which had previously been included in the Singapore budgetwere taken over by the Central Government. However, Singapore maintaineda current surplus in 1964 and probably also in 1965. The surpluses ofthe State Government have been regularly supplemented by current surplusesof the public commercial undertakings 1/ and accumulations in providentftLnds. The table below summarizes the development of the public sectorfinancial position in recent years.
Revenue and Expenditure of Public Authorities(million M$)
1960 1961 1962 1963 1964 1965 al
Revenue 306 339 360 408 315 378Expenditure 230 246 284 319 274 340
State Government Current Surplus 76 93 76 89 41 38Surplus of Commercial Undertakings 65 69 75 73 88 86Increase in Provident Funds 36 37 45 47 50 54
Total Current Surplus 177 199 196 209 179 178Capital Expenditure 56 99 127 195 285 409 b/
Over-all Surplus (+) or Deficit (-) +121 +100 +69 +14 -106 -231
a/ Financial provisions.b/ Actual capital outlays were probably substantially less than this finan-
cial provision. There is some uncertainty regarding the level of capitalexpenditure in 1964 and 1965. However, the total for the two yearsappears to have been about M$525 million, with some continued upwardtrend. This suggests that the figure of M$285 million for 1964 is some-what high.
1/ Public Utilities Board, Singapore Port Authority, Singapore TelephoneBoard, Housing and Development Board, Economic Development Board, Postand Telecommunications.

- 6 -
20. While the total current surplus of the public sector was main-tained quite consistently in a range of about M$180-200 million per year,capital expenditures rose sharply with the result that the over-all annualsurpluses dwindled steadily and changed to a deficit in 1964. An over-alldeficit is also likely in 1965, although it will probably be considerablysmaller than indicated above because, as is usually the case, capital out-lays will most likely be well below the amount provided in the originalbudget estimate.
Money and Prices
21. Singapore shares a common currency, the Malayan dollar, withMalaysia and Brunei. It is issued and redeemed freely and exclusively inexchange for sterling at the rate of 2 shillings and h pence by a Boardof Commissioners of Currency. The sterling backing for the currency ismaintained between 100 percent and 110 percent. Profits of the CurrencyBoard (derived from interest on sterling securities and commissions) whichare not retained as currency backing are distributed among the partici-pating governments according to a formula based mainly on the amount ofcash held by banks and the population of each territory. Singapore'sshare of the profits in recent years has ranged between 18 percent and21 percent.
22. In order that the Malaysian Central Bank may take over manage-ment of Malaysia's currency, Mlalaysia under the terms of the CurrencyAgreement has given 18 months' notice that it intends to withdraw from theCurrency Board; the 18 months's period expires June 12, 1966. However,the Agreement provides that the notice could be extended by six months ifMa'Laysia chooses. Both Singapore and Malaysia have recently held discus-sions with a team of officials from the International Monetary Fund con-cerning the possibility of continuing to have a common currency after thepresent arrangements are terminated. Continuation of a common currencyappears feasible and desirable, but it remains to be seen whether thenecessary new arrangements will be agreed upon between the two countries.Meanwhile the Minister of Finance of Singapore stated recently that ifSingapore and Malaysia should cease to have a common currency, Singaporecurrency would continue to be backed by 100 percent or more in externalassets.
23. Under the present system, movements in the money supply arehighly dependent on the balance of payments and, through the money supplymechanism, any disequilibrium in the balance of payments - whether towardsurplus or dificit - tends to be self-corrective. The tendency towardcorrecting a balance of payments deficit could be offset by expanding bankcredit on the basis of external assets or advances or by government deficitsfinanced from external balances held by the Government. In practice, how-ever, the banks follow conservative policies which are strongly influencedby movements in export prices, and bank credit tends to follow the course ofexport earnings. As noted above, the Government also follows sound finan-cial policies which have not had large monetary effects.

- 7 -
24. With the above institutional arrangements, and given the opennature of Singapore's economy, prices tend to be fairly stable since sup-plies of goods can change quickly in response to demand. Singapore importsa large proportion of its consumer goods as well as most raw materials andcapital goods, and the price level in practice tends to be more affectedby changes in external markets than by internal price pressures. The rela-tive price stability which has prevailed recently is indicated by the factthat during the last five years the Consumer Price Index has fluctuatedwithin a 6 percent margin. In August 1965 the index stood at lo4.6(April/May 1960 = lOO).
Balance of Payments l/
25. Reflecting the heavy dependence on imports noted above, retainedimports are equivalent to about 60 percent of GNP, end they usually followclosely rises and falls in incomes. Earnings from domestic exports amountto only about 15-20 percent of retained imports. The bulk of foreign ex-change income is derived from services, the most important of which areprocessing, sorting, packaging and other entrepot services for neighbor-ing countries. Other important sources are military expenditures bythe United Kingdom in Singapore, ship repairing, harbor services andtouArism.
26. During the last several years the balance of payments estimateshave shown current account deficits in the range of M$200 to M$300 millionper year. However, "errors and omissions" have been consistently positiveand, except for 196h, have been larger than the current account deficit.In the preliminary balance of payments estimate for 1964, "errors and omis-sions" are indicated at only M$50 million compared to about M$360 millionin 1963 (see summary table below). This drop is probably explained to alarge extent by the suspension of trade with Indonesia following confronta-tion.
27'. While the composition is unknown, an arbitrary assumption ismeLde that a minor part of `errors and cmissions" arises from unrecordedcapital transactions and a major part (well over half) from unrecordedcurrent transactions, particularly on the credit side. For instance, aconsiderable volume of unrecorded exports most likely leaves the free portcity on small boats bound for neighboring countries, particularly Malaysiaand Indonesia (until confrontation). A large amount of goods doubtlessalso goes out unrecorded via the Causeway to Malaysia. Another item whichis probably underestimated is tourist expenditures in Singapore. It istherefore probable that the current account balance i4s more favorable thanindicated in the following table.
1/ Singapore balance of payments estimates are incomplete and indicateonly rough orders of magnitude.

- 8 -
Balance of Paymients Summary(million M$)
1961 1962 1963 1964(Prelim.)
Domestic TradeExports 225 252 277 311Imports 1369 1435 1737 1606Balance -1144 -1183 -1460 -1295
Entrepot Trade (net) + 490 + 564 + 655 + 588
Services (net) + 408 + 429 + 495 + 597
Total Current Account - 277 - 215 - 342 - 188
Cap:ital Account + 42 + 27 + 16 + 33
Net Change in Foreign Assets (increase -) - 76 - 181 - 36 + 106
Errors and Omissions + 311 + 368 + 363 + 50
28. For working purposes "errors and omissions" may be allocatedbetween the current and capital accounts as folloivs. It is assumed thatprivate capital inflows are closely related to the level of private in-vestment and that in Singapore a substantial part of private investmentis financed by capital inflow. On this basis net private capital inflow(including reinvested earnings of foreign-owned enterprises) is estimatedvery roughly at 50 percent of total private investment. This would addan average of M$50 million per year, or M$200 million during 1961-64, tothe inflow recorded in the balance of payments. Assigning this sum from"errors and omissions" to the capital account and the remainder of "errorsand omissions" to the current account, the total 1961-64 current accountdeficit would be reduced to about M$125 million.
29. Aside from the above comments on the current balance and "errorsand omissions", a number of other observations may be made on the recenttrade and balance of payments position.
(1) Domestic exports, though still relatively small, have risensteadily and rapidly in recent years. Increases have been registered ina fairly wide variety of light manufactures (clothing, metal containers,ceMent, glassware, cigarettes, printed matter) as well as agricultural andlivestock products (live pigs, meat, animal feedstuffs, fresh and cannedvegletables, fresh fish and preparations).

- 9 -
(2) Retained imports showed an unusually sharp increase in 1963,apparently due to speculative imports to build stocks prior to the mergerwith Malaysia. The most important categories are food, textiles, petroleum,chermicals and capital goods. Except for petroleum, practically all cate-gor-ies increased in 1963.
(3) During 1960-64, entrepot trade increased at an average rateof 2.5 percent per annum, although the last two years, 1963 and 1964, sawfirst a sharp increase and then, with confrontation, a sharp decline.
(4) Earnings from harbor services, ship repair, tourism andother services have risen steadily in recent years. However, the main itemwhich contributed to the large increase in income from services in 1963 and1964 was the increased U.K. military expenditures in Singapore follow-ing Indonesian confrontation. These are now equivalent to about 15 percentof Singapore GNP.
Development by Sectors
30. The relative performance of the various economic sectors is indi-cated in the table below.
Gross Domestic Product at Factor Cost
PercentageIncrease Annual Proportion
Million M $ (1963-64 Rate of GDPAverage Average over of Growth 1963-64
Sector 1959-60 1963-64 1959-60) (percent) (percent)
Agriculture and Fisheries 105 123 17 4.0 4.9Manufacturing a/ 125 217 78 15.5 8.5Entrepot Trade 379 418 10 2.5 16.5Building and Construction 44 104 136 24.0 4.1Ownership 94 114 21 4.9 4.5Tourism 30 58 93 17.9 2.3Retail and lTholesale Trade 403 536 33 7.4 21.2Military Services 275 368 34 7.6 14.6Public Administration 103 211 105 19.6 8.3Other 315 381 24 4.9 15.1
Total 1871 2530 35 7.8 100.0
a/ Includes small amounts for quarrying.
Source: IBRD calculations.
- 10 -
31. Agriculture and fisheries provide a means of livelihood for 9 per-cent of the population of Singapore but account for only 5 percent of GDP.The orientation of agriculture has changed rapidly since the war as therubber and coconut plantations diminished in number and acreage. Attentionhas turned to production of vegetables, fresh fruit and animal products(chiefly pork, poultry and eggs) for the domestic and nearby markets.Singapore has been the leader in the area in adopting more intensive produc-tion methods in animal products and has become a net exporter with a sizeabletrade with Malaysia. Recently, however, similar improvements have beenadopted in the States of Malaya and Borneo so that exports have slowed. Pigslaughter in public abatoirs has declined. Fishing ahs been stagnant; land-ings by Singapore registered vessels declined 8 percent between 1960 and1964. Public investment expenditures in the agricultural and fisheriessector have been minimal.
32. Singapore's entrepot trade with adjacent countries, to which itsup:plies commercial and processing services, has been primarily with Malaysia(States of Malaya, Sarawak and Sabah) and Indonesia, which together haverepresented about 88 percent of Singapore's trade with entrepot countries.The expansion of this trade during 1960-64 was considerably slower than thegrowth in total national product, with the result that its contribution toGDP declined from about 20 percent to 14 percent. In absolute terms, how-ever, the trade exceeds that of the annual average of the 1950's even after"1confrontation" and increased slightly in the first six months of 1965 ascompared with 1964.
33. The labor directly employed by the entrepot trade and tourismapproximates 70,000 persons or 12 percent of the labor force. The effectof confrontation was to eliminate jobs for some 5,000 workers who, however,are believed to have found alternative employment.
34. Tourism is a small but strongly expanding field with an annualrate of growth of 18 percent in the past five years. Although Singapore issomewhat off the beaten path of international tourist travel it has begunto acquire some reputation as a shopping center similar to Hong Kong.Hotel accommodations of western standards are expanding to meet a growingdemand and the Government is taking measures to publicize Singapore'sattractions.
35. Building and construction has had the largest growth of anysector in the economy. This is mainly attributable to the adoption of alarge-scale, low cost, subsidized housing program by the State Governmentdesigned to relieve the acute shortage of housing in the low income groups.The program accounted for almost 30 percent of total public capital expen-diture in 1961-65. The private sector participated in this program byproviding contractors and materials, such as brick, cement and structuralsteel, but it played a minor role in initiating new housing. Private con-struction was concentrated in the middle- and upper-income fields, wherethe supply of housing is relatively adequate, and in commercial construction.

- 11 -
36. The Housing and Development Board (HDB), which is in charge ofconstruction and management of public housing, began operations in February1960. Prior to this time the government housing agency was the SingaporeImprovement Trust. A new five-year housing program was initiated by HDB inmid-1960. Total units constructed in 1960-64 for the economy as a wholeapproximated 50,000 units of which 44,345 units were completed under thepublic low-cost program. This compares with 11,326 units completed in theprevious five years, 1955-59, by the Singapore Improvement Trust and largelyexplains the high growth rate of this sector.
37. Completion of the five-year public program in 1965 will effec-tively reduce the low-income housing shortage. This has proven to be oneof the outstanding sector programs admiristered by government. Constructioncosts have been kept low without sacrificing standards, a fact which re-flects favorably on the administration of the HDB and on Singapore con-struction and labor efficiency. The management of the estates has alsobeen good.
38. Education facilities and operations have shown a considerable ex-pansion and improvement in the past five years. Current expenditure aver-aged about M$70 million in 1960-62 or 22 percent of the state budget. Theaverage was increased to over M$400 million in 1963-65. Capital expenditureon new facilities at M$49 million during 1960-64 lagged due to administrativeproblems and inexperience in the Public Works Department, changes in policyand programs, and delays in clearing sites of squatters.
39. Despite these difficulties, the shortage of capacity for elemen-tary education has been largely overcome. However, there is still asubstantial shortage of facilities for secondary education, includingvocational and technical education. The vocational and technical enroll-ment, however, lags relative to secondary school enrollment. In spite ofa tenfold increase in vocational and technical enrollment in the last fewyears, education at the secondary level is still predominantly academic.
4o. There is a shortage of adequately trained teachers and teacher-training facilities for general as well as technical subjects. Trainingis rather broadly based in the absence of adequate information on skillsrequired for industrialization and general development.
41. Capital expenditure on health services was only one-third of theplanned amount during 1961-65, although current expenditure increased some30 percent from 1961 to 1964. The main reasons for the slowness of expan-sion in facilities was the shortage of physicians, surgeons and nurses.MeaLnwhile the chronic shortage of facilities continues with four beds perthousand inhabitants and a ratio of 1:2,000 for physicians and surgeons.The public health program is good and the more common tropical diseaseshavre been all but eradicated. TB remains a grave problem. The marked de-cl.ne in the birth rate from about 40 per thousand in 1959 to 32 perthousand in 1964 has taken place spontaneously in the environment of alarge urban society with rising incomes and a rising level of education.A frew family planning clinics have been operated under private auspices.

- 12 -
42. Manufacturing is still a relatively small contributor to totalGNP: 6.5 percent in 1959-60 and 8.7 percent in 1963-64. The annual aver-age rate of growth of 15.5 percent, however, reflects a healthy expansionduring the last five years and a shift in emphasis in the private sectoras compared with the traditional concentration on commercial and entrepotactivities.
43. The Census of Industrial Production for 1963 enumerates 1,542establishments engaged in manufacturing, processing, service and repairing;of the total, 858 establishments employed 10 or more workers and the re-maining 684 employed 5 to 9 workers. Among those employing 10 or moreworkers, 633 were in manufacturing proper, including food, beverage andtobacco manufactures, petroleum refining and chemical products, woodenveneer, plywood and furniture, light metal products and electrical machin-ery and appliances. A large proportion of the establishments employing 5to 9 workers were concentrated in food manufacturing, tailoring, metalproducts and the repair of transport equipment.
44. Government provision of basic services for industry and for theeconomy as a whole has been generally satisfactory during the last fiveyears. Production of electricity has increased from 654 million k.w.h. in1960 to 1,135 million in 1965 and gas, fromn 605 million cu. ft. in 1961to L,300 million in 1965. The number of direct telephone exchange linesinc]^eased by 50 percent from 1960 to 1964. A total of 78,420 telephoneswere connected at the end of 1964, but the backlog of telephone applica-tions had increased. The Singapore Port Authority completed four newdeepwater berths in the East Lagoon in 1962. These are now being utilizedto capacity and more are being constructed.
45. Government activity in support of industrial development isorganized through the Economic Development Board (EDB), established in1961. It has manifold functions in support of private sector industrialdevelopment: finance (loans and equity participation); industrial facili-ties development (planning, development and management of industrial es-tates); project evaluation (identification and feasibility studies ofsuitable industries and evaluation of proposals for pioneer status, loansand tariff protection); investment promotion (encouragement, publicityand representation to encourage private investment); technical services(research and testing of techniques, materials and products, extensionservices to light industry and management development).
46. Pioneer certificates, which exempt new industries from corporateincome taxes (40 percent) for five years from the start of production, hadbeen granted to 113 industrial firms by EDB as of the end of 1964. Anadditional 32 certificates were issued in October 1965. Fifty-six firmshad commenced production by end-1964 and 30 more were scheduled to beginoperations in 1965. These firms produce, to varying degrees, 165 out ofthe 301 industrial products which have been declared eligible for con-sideration as pioneer industries. Value added by pioneer firms in 1964amcounted to 19 percent of total value added by industry, including proc-essing and maintenance and repair services. The 56 firms in production at

- 13 -
end-1964 employed 5,400 workers as compared with total employment createdin all industry during 1961-64 of 14,000. Of the 113 pioneer firms atend-1964, TO had foreign capital participation. Foreign capital sub-scribed amounted to approximately M$89 million, or 41 percent of totalsubscribed capital of M$217 million.
47. During 1961-64 the Government provided EDB with a capital fundof M$100 million with which to make loans and participate in equity finan-cing of new industries. By the end of August 1965 loan commitments amountedto M$67.0 million of which M$33.6 million had been disbursed. Equity hold-ings at the same date amounted to M$21.4 million committed with M$12.3million paid up. The Government will provide EDB with additional capitalfunds in 1966.
48. The Industrial Estates Development Fund for estate developmentis administered by EDB for the Government. Expenditure to end-1964 amountedto Y,$43.6 million. This has been largely invested in the Jurong IndustrialEstate but investment has also been made in several small estates locatedad.Jacent to major public housing schemes. The Jurong project comprises anarea of 15,000 acres located at the southwest corner of the island. A totalof 2,020 acres was available for allocation for industrial and other usesat end-1964. Seven hundred eighty acres were leased or earmarked on optionto industries and a balance of 635 acres remained for industrial uses afteral'Location of the remainder for roads, reserves, wharfage, drainage, housingand public utilities. A survey has been made in preparation for furtherdevelopment.
49. In a number of respects Singapore is not an ideal place in whichto develop industry. The island lacks raw materials, and sources of power;is short of industrially experienced entrepreneurial and administrativetalent; and, with a population of just under 2 million, it has a smalldomestic market. On the other hand, there are several favorable factorsincluding the good quality and supply of labor; a government which isactively pursuing policies to provide excellent facilities and a favorableclimate for private investment; a domestic market where consumers thoughrather small in number have relatively high average incomes; efficientshipping, financial and commercial services; and a large number of ex-perienced traders with close connections in other markets, particularlythe entrepot countries.
50. Singapore has a labor force which is energetic, intelligent andbetter educated than labor in most other Asian countries. It is adaptableand easily trained. Moreover, there is considerable unemployment and, asa result of the high birth rates of the late 1940's and early 1950's, newworkers are entering the labor force at a rapid rate. Thus the supply oflabor, at least of unskilled and semi-skilled workers, is ample.

- 14 -
51. Moreover, in contrast with the labor troubles of the late 1950'sand early 1960's, there has been very little labor unrest in recent years.The labor strife which has occurred occasionally in Singapore has usuallybeen associated with political tensions, such as those durng the intra-party struggle in the PAP in 1961. The number of industrial stoppagesdeclined from 116 with 411,000 man-days lost in 1961 to 39 with 36,000man-days lost in 1964. Experience has been gained with collective bargain-ing practices and procedures, and the creation of an Industrial ArbitrationCourt has provided machinery for the peaceful settlement of disputes. Thefonnation of the Pioneer Industries Union to provide for the negotiationof long-term agreements with new industrial enterprises prior to the estab-lislhment of plants is a new and important measure.
52. With the abundant labor supply and relative tranquility, wageshave remained quite stable in recent years, as compared to rising trendsin other manufacturing centers, such as Hong Kong and Japan. As a conse-quence, labor costs and productivity of unskilled and semi-skilled workershave improved relative to other manufacturing centers. Opinions in Singa-pore are that they are competitive. Barring political upheaval, thegeneral wage level in Singapore should remain relatively stable in theforeseeable future.
53. There is, however, a shortage of experienced foremen and skilledworkers. This has been overcome in part by bringing foremen and key tech-nicians from abroad; these personnel provide supervision and on-the-jobtraining for the indigenous labor force. These arrangements, which havebeen used especially in firms with foreign participation in capital andmanagement, have proved successful in imparting the necessary skills andraising labor productivity within a fairly short period of time. Anotherapproach has been to set up "crash'" training programs at vocational train-ing schools and the Polytechnic Institute to provide skills when and whereneeded. In 1963 this scheme was begun for the shipbreaking industry andwas later extended to woodworking, electroplating, foundry, welding andother trades. EDB has organized short courses for industrial techniciansand managers with local and foreign instructors. The Singapore Instituteof Management was established in late 1964 to take over this function fromED13. These arrangements leave a considerable amount to be desired in termsof training and experience of instructors, improvements in curriculum, etc.However, they represent steps in the right direction and, given time andenergetic application, should produce useful results.
54. In summary, Singapore has done all that could be expected tomate the most of its advantages and overcome its disadvantages as a poten-tial industrial center. With strong efforts by both the private and publicsectors, a great deal of progress in developing manufacturing industry hasbeen made within a period of a very few years. However, there is no doubtthat one of the most important factors in the recent progress was the ex-pectation that Singapore would participate in a tariff-protected Malaysian

- 15 -
common market. As already noted, the sudden and unexpected separationfrom Malaysia adversely affected the private investment climate. Plansfor establishment of new factories have been shelved and the level of in-vestment activity has undoubtedly declined.
55. It remains to be demonstrated whether Singapore, without theadvantage of the common market, will be able to establish an efficient andcompetitive industrial complex capable of creating a niche for itself ininternational trade. This may take some time to accomplish, as potentialinvestors wait to observe the experience of firms already in operation.While private investment pauses, however, the Governmert has already demon-strated its determination to forge ahead regardless of the loss of thecommon market. For instance, since separation the Government has estab-lished protective tariffs for some 150 manufactured items; new pioneercertificates have been issued to more than 30 firms; tax deductions havebeen granted for expenses incurred by private firms in developing overseasmarkets; trade missions from several countries have visited Singapore andothers have been invited; and Singapore has sent delegations abroad andis opening embassies and legations abroad for the purpose of promotingclose economic as well as diplomatic relations with many countries. More-over, further industrial development is one of the prime goals in thesecond five-year development plan recently announced by the Government.
II1. PUBLIC DEVELOPMENT PROGRAMS
The First Development Plan
56. Singapore's first five-year plan covering 1961-65 has just endedand a new five-year plan covering 1966-70 has recently been announced.
57. The first plan was formulated originally for four years, 1961-64,and envisaged public capital outlays of M$871 million. Numerous changeswere made during the plan period as new schemes were added, some schemeswere dropped and others altered. Finally, after merger with Malaysia, theperiod of the plan was extended by one year in order to make the timing ofSingapore's planning dovetail with Malaysia's. As a result of all thesechanges, the expenditure target became M$1,149 million for the five years,1961-65.
58. The many changes make it difficult to compare actual performancewith the targets. Moreover, very little information is available as yeton 1965 expenditures. Public sector capital outlays for 1961-64 were aboutM$700 million, which is equivalent to about 80 percent of the originalM$871 million target for that period. A preliminary estimate indicatesthat total outlays in the five years, 1961-65 amounted to about M$950 mil-lion or about 82 percent of the target for this period.

- 16 -
59. While a comparison of actual expenditures with targets is notvery meaningful, it is fair to say from a general point of view that govern-ment; development performance was good during the last five years. As a newgovernment completely inexperienced in planning, it formulated and launcheda program within a short period of time. Although numerous changes weremade in the original plan, available information indicates that the patternof actual capital expenditures was well suited to economic needs. Theconcentration on expansion of infrastructure and social services was appro-priate for an urban economy seeking to develop industry. Moreover, theperformance improved over time. Capital outlays rose substantially fromabout M$100 million in 1961 to the order of M$250 million in 1965. Overthe five years, public sector investment was roughly equal to private in-ves-tment. The rapid increase in both public ard private investment was oneof the key elements which contributed to the favorable over-all growth ofthe economy during this period despite the lag in the entrepot trade.
The 1966-70 Plan
60. The development plan for 1966-70 calls for total public capitalexpenditures of M$1,522 million. This figure, however, includes someM$250 million in transfer payments to the private sector for purchase ofland, expropriation compensation, etc. Gross capital formation in thepublic sector is therefore estimated at about M$1,270 million. The planenvisages private gross capital formation at nearly the same level, orM$1,250 million.
61. Because of the recent setback to private investment, from whichit may take some time to recover, there is likely to be a shortfall on thetarget for private investment. It is assumed that this shortfall may bein the range of 15-20 percent or, say, M$200 million. On this basis,private gross capital formation in the next five years would be M$1,050million, or roughly 30 percent higher than the last five years.
62. The public sector, on the other hand, is likely to reach itsexpenditure target of M$1,522 million. Although this figure representsan increase of some 60 percent over expenditures during the last fiveyears, it would require an annual average expenditure (about M$300 million)on:Ly moderately above actual government capital outlays of the last yearor two.
63. The 1966-70 public capital expenditure program by sector withcomnparable data for 1961-65 is given below. The sectoral allocations for1966-70 are preliminary; final alloeations rex seheduled to be made some-tine during 1966.

- 17 -
Public Capital Expenditure Program(million M$)
Percent1961-65 a/ 1966-70 1961-65 1966-70
I. Economic DevelopmentLand and Rural Development 47 131 5.0 8.6Industry and Commerce 97 343 10.2 22.5Public Utilities 239 316 25.3 20.8Transport and Communications 166 187 17.5 12.3
Total 549 977 58.0 64.2
II. Social DevelopmentHousing 272 170 28.8 11.1Urban Renewal - 100 - 6.6Sewage 33 55 3.5 3.6Education 64 118 6.8 7.8Health 10 18 1.1 1.2Other 7 23 0.8 1.5
Total 386 484 41.0 31.8
III. Other Government Services 10 61 1.0 4.0
Total Capital Expenditure 945 1,522 100.0 100.0
a/ Based on information provided by the Government of Singapore for1961-64 plus Bank mission estimates for 1965.
64. As compared to 1961-65, the new program indicates increases inproportion to expenditures allocated to "Economic Development" and "OtherGovernment Services" and a decline in the proportion allocated to "SocialServices." However, the 1966-70 industry and commerce category under"Economic Development" includes funds for housing at the Jurong IndustrialEstate (believed to be about M$50 million). If this sum were transferredto the housing category, the proportion allocated to "Economic Development"would fall from 64.2 percent to about 61 percent and the "Social Develop-ment" allocation would rise to about 35 percent. The allocation for "OtherGovernment Services" includes capital outlays for defense and establishmentof embassies abroad, which are new responsibilities since independence. Itis understood that policies with respect to both subjects are still beingformulated, and the allocations in the new plan may therefore be revised.Officials have indicated informally that, should these expenditures increaseappreciably, it is intended to cut back on "Social Development" outlays inorder to maintain the over-all level of expenditure close to M$1,500 mil-lion.

- 18 -
65. Proposed expenditure on land and rural development is largelynon-agricultural for drainage, road construction, etc. The proportional:Located to agriculture is, however, greater than in 1961-65, and is tobe spent largely on new marketing and processing facilities, research andextension services. These are required in order to further the trendtowTards intensification now developing in agriculture,
66. The M$343 million allocated to industry and commerce, besidesthe sum for housing noted above, includes a substantial additional sum forfurther development of the Jurong Industrial Estate. However, a consider-able amount of the industrial land developed under the first developmentplan has not yet been taken up. It is also quite possible that utilizationof available industrial land, at least in the immediate future, will beslower than in the past. If a slowing down in land utilization does takeplace, some slowing down in the rate of new land development would be inorder.
67. The allocation for public utilities is mainly for increasingsupplies of electricity and water; a relatively small provision is madefor increasing the supply of gas for domestic use. The largest provisionis for electricity, for which demand is estimated to increase at 16 percentper annum during 1966-70 compared to 11.5 percent per annum increase insales during 1961-64. It is proposed to increasa total inst&allea capacityfrom 344,000 kw. at the end of 1965 to 704,000 kw. at the end& cf `70.The additional 360,000 kw. would be obtained by adding 1210 ,&00 k3-k- (thirdand fourth units) to the recently inaugurated Pasir Panjang ! TWnrmalStation (for which the Bank made a loan in Mlay 1963) and by the crnstruc-tion of a new 240,000 kw. thermal station at Jurong. The prc;ected growthin demand of 16 percent appears rather high compared to the rast growth insales. However, if the projected rate of growth does not materialize, theschedule for installation of generators at the Jurong station (scheduledfor 1969 and 1970) could be stretched out.
63. The main provision for water is for construction of the JohoreRiver Water Supply Project, which was started under the first plan and forwhich the Bank made a loan in February 1965. This project would increasethe reliable water production capacity of Singapore's Public Utility Boardby some 30 percent, sufficient to meet estimated requirements until aboutthe mid-1970's.
69. The transport_and-communications category includes provisionfor improvement of the Singapore International Airport, further expansioncf the telephone system (to eliminate the existing backlog and meet newdemand), and expansion of international telecommunication facilities. Thelargest items, however, are for land transportation and port development.These represent to a large extent continuation of programs started duringthe first plan. The land transport plan includes a 3-1/2 mile extensionto the recently completed Jurong railway link; improved highways betweenindustrial areas and ports, between urban and rural areas and within thecity; and additional multi-story car parks.

- 19 -
70. Regarding port facilities, it is planned to carry out a secondphase development at the East Lagoon; this will include four additionalberths totalling approximately 2,600 feet in length together with a break-water, godowns and other related facilities. It is also planned in thepresent port area to extend facilities for coastal shipping and to improvefacilities at the recently established free trade zone. At the same time,it is planned to carry out a major port development scheme at Jurong.This scheme, which was begun during the first plan, will provide specialfacilities for individual factories, as well as facilities for ocean generalcargo and coastal shipping. W@hile there is good justification for buildingport facilities to serve the industries at Jurong, construction should becarefully geared to the industrial development which actually takes place,so that the new port facilities are not completed long before they areneeded. Moreover, construction should be closely coordinated with thedevelopment of facilities at the existing main port in order to avoid de-veloping excess capacity. Planned port expansion at Jurong appears likelyto outrun requirements in the next five years but it is the stated inten-tion of the EDB to adjust their port development activities to a slowerpace if this is indicated by the actual course of industrial growth atJurong.
71. The housing program is to be continued on a sizeable scale,particularly if adjustments are made for housing in Jurong, which is in-cluded in the plan under industry and commerce. As noted earlier, the1961-65 program has substantially reduced the low-income housing shortage.Extension of the program in 1966-70 will eliminate it, and the emphasiswill shift to expansion of housing to meet the requirements of an increas-ing population.
72. The 1966-70 plan includes M$100 million for urban renewal. Themain scheme under this heading relates to a two square mile area in thecenter of Singapore where 290,000 people live and work under unsatisfactoryconditions. The renewal scheme aims at removal of slums and relocation ofdisplaced population to outlying housing development areas; industrieswould be removed to industrial estates. The renewal area will eventuallybe used for commercial and residential purposes. Two other importantschemes included under this heading are the East Coast Foreshore Reclama-tion Scheme, covering some 1,000 acres along the coast, and the KallangBasin Scheme, involving reclamation of some 400 acres of swamp land. Mean-while, Singapore has requested the U.N. Special Fund to undertake a compre-hensive study of the urban renewal and transit problems as a basis forinvestment programs in these fields in the 1970's.
73. The main emphasis in the 1966-70 education program is on second-ary general education and secondary vocational education. Enrollment insecondary comprehensive schools is expected to increase from approximately113,000 in 1965 to 203,000 in 1970, or by about 80 percent. Fifteen newschools are under construction and an additional 25 are scheduled for con-struction during the next five years, plus extensions to existing schools.

- 20 -
On -the vocational side, enrollment at the Singapore Vocational Institutewil:L be increased from 1,600 to 2,500; a new Jurong Vocational Institute ofEngineering will be completed to accommodate 2,000 students in engineeringand building construction, and the Queenstown Vocational Institute is beingconstructed to have a capacity of 2,000 in manual and applied arts.
74. For higher technical education Singapore Polytechnic, which nowhas an enrollment of 2,500, will be developed into a full-fledged techno-logical university for 1,000 undergraduates and graduate students, and aseparate technical college with a capacity of 3,000 students is proposedto train to the diploma level.
75. Facilities at the University of Singapore will also be expandedsince enrollment, which rose from 1,600 in 1961 to 2,500 in 1965, is ex-pected to increase by a further 50 percent to 3,800 by 1970.
76. Enrollment in the free, six-year primary schools is estimatedto decline from 366,000 in 1966 to 358,000 in 1970 as a result of the fall-ing birth rate. Six new schools are under construction and two more arescheduled for 1966-67, but thereafter no new primary schools are plannedin the period to 1970.
77. Teacher training facilities are to be increased by constructionof a new teachers training college. With this addition, it is estimatedthat the shortage of teachers for primary ard secondary schools will belargely overcome by 1970.
78. The 1966-70 health program will be handicapped by the continuedshortage of physicians and surgeons. However, an expansion in nursestraining facilities should ease the shortage of trained nurses. A new680-bed hospital will be constructed in the later years of the plan.Maternal and child health centers, sewage and garbage disposal facilitiesand additional sanitary market facilities are also included in the plan.The family planning clinics heretofor operated privately are to be takenover and expanded in number and size by the Government.
79. Considered as a whole, the size and composition of the 1966-70development plan is good. The proposed level of expenditure is fairly highcomnpared to the last five years, but not unreasonably so. The sum ofM$1,520 million should be within the Governnent's administrative capa-bility to spend reasonably efficiently, and the Government should not haveany great difficulty finding the necessary finances. There is justifica-tion for a relatively high level of government investmen.t in order to helpmaintain economic growth and provide employment opportunities. This isparticularly true in the immediate future since private investment islikely to be sluggish until greater confidence is gained in developingindustry without the advantages of a common market.

- 21 -
80. The broad composition appears appropriate with emphasis ondevelopment of general infrastructure facilities (e.g., electric powerand transportation facilities), specific infrastructure facilities forindustry (e.g., industrial estates), education and housing. In fact, theGovernment appears, within the limits of sound financial management, tobe making adequate provision for the economic and social requirements ofa large municipality and at the same time effectively fostering thegrowth of the economy with facilities and inducements for private indus-trial and commercial expansion.
Bi. The main problems in Singapore's economic planning and plan im-plementation are of an administrative nature. They derive from the factsthat the limited number of good administrators are spread too thinly andthat the government structure and procedures are in some respects outmodedand not suited to the tasks now being undertaken. As a result, performanceis uneven and coordination among the various agencies is sometimes ratherpoor. Some agencies are inadequately staffed and, with extended responsi-bilities, are overworked and called upon to perform newT functions forwhich the staff are inadequately trained or lack the necessary experience.The result is that there is often an inadequate technical and economicbasis for project evaluation (as seems to be the case in much of the roadimprovement and traffic handling programs) while execution has fallenshort of objectives in many cases or has been accomplished only afterprolonged delay.
82. The Economic Planning Unit itself, which is attached to theMinistry of Law and National Development, is still relatively weak andnot very effective. Its staff is very small, composed mainly of youngmen who are capable but not yet very experienced. Contacts and coordina-tion between the Planning Unit and the executing agencies are limited,and there is little effective screening or evalutation of projects by theEconomic Planning Unit. As a consequence, the plan consists essentiallyof a compilation of projects prepared by the various executing agenciesanid screened in a budget-like exercise. A ministerial committee headedby the Prime Minister has recently been set up to coordinate planningpolicy, and it has been announced that expert assistance will be obtainedto help with the reorganization and expansion of the planning organization.Another place which needs strengthening is the statistical and accountingservices of the Government, which are overworked and not organized to pro-vide data which are adequate in amount or form for national planning. Inaddition, improved coordination is needed between the agencies concernedwith industrial development and the education authorities. Little hasbeen done to guide professional and vocational training and careful, sys-tematic assessment of manpower requirements should be made; the educationauthorities could then tailor the education program more closely to thespecific requirements of the economy.

- 22 -
83. On the other hand, some agencies are relatively well staffed andorganized and return a good performance. The outstanding successes of theGovernment have been in those activities concerned with physical construc-tion, such as the housing program, the Jurong Industrial Estate and theexpansion of public utility and Singapore harbor facilities.
IV. THE FIAIMNCIAL OUTLOOK
A. The Public Sector
84. With capital expenditures in 1966-70 estimated at M$1,520 mil-lion, or about 60 percent higher than in 1961-65, the Government's finan-cial position is likely to be tighter than in the past. While the publicsector should be able to generate somewhat larger current surpluses thanin the last five years, such surpluses are not likely to increase as fastas capital outlays.
85. At present, public sector revenues (state go-vernment revenuesplus current surpluses of the commercial undertakings) are fairly high atabout 18 percent of GNP (20 percent of GNP if accumulations of publicprovident funds are included). On the basis of the revenue prospects dis-cussed below, and given reasonably strong efforts by the Government, it isestimated that this ratio would increase during 1966-70 to 19 percent (21percent including provident funds).
86. The scope for additional taxation is not great. However, withrespect to indirect taxes it should be feasible to add scme excise taxeson manufactured goods. Because of the small production base, yields wouldbef modest but should increase over the years. Considering the necessityfor keeping down prices of imported raw materials and capital goods, thepossibilities of extending import duties for revenue purposes are somewhatlimited. Fairly high duties are already levied on alcoholic beverages,tobacco and petroleum products. Moreover, since independence importduties have been imposed on a variety of manufactured items, but thesewere imposed for protective purposes and revenues are likely to be small.However, with the recent establishment of the free trade zone which willhandle entrepot trade, there should be possibilities of extending importduties on some additional commodities which are retained for consumptionin Singapore. The scope for increasing direct taxes appears more limitedthan for indirect taxes. The rate of personal income tax on higher in-comes (M$100,000 or more), which was reduced from 55 percent to 50 per-cent after merger with Malaysia, is being restored to 55 percent witheffect from January 1, 1966. The corporate income tax rate (40 percent)is already fairly high considering Singapore's pressing need to attractprivate investment in competition with other growing industrial centers.However, the five year tax holiday extended to industries in the pastperiod will gradually expire during 1966-70 with a resulting increase intax collection.

- 23 -
87. An estimate by the Ministry of Finance envisages a rise in stategovernment revenue of between 4.5 and 5.0 percent per year during the nextfive years. Assuming a 5 percent growth in GNP, the Government should beable to realize this estimate of revenue with no difficulty. In fact,considering the possibilities for extending taxes and for improving taxcollections, the Government should be able to achieve a faster growth inrevenue than estimated above. A growth of between 5.5 and 6.0 percent peryear would be a reasonable expectation. In view of the projected increasein capital outlays and the prospects for current expenditures discussedbelow, it is important that no revenue possibilities be overlooked.
88. Current expenditures of the Government are likely to increasesomLewhat faster than current revenue, even under favorable assumptions forrevenue. The continued expansion of social services, particularly educa-tion and health, will lead to a fairly rapid increase in recurrent expen-diture. Moreover, as a newly independent nation, Singapore will beestablishing and operating embassies and consulates abroad for the firsttiime. With regard to defense expenditures, the policies of the Govern-ment are reported to be still under consideration. However, an increasein these expenditures cannot be ruled out. Over-all, considering the ex-pansion of the traditional government services and the assumption of newresponsibilities, current expenditures will tend to rise rapidly in thenext few years, perhaps as high as 10 percent per year. This reinforcesthe statement above concerning the need for a strong effort to increaserevenues.
89. The Government has estimated that it will generate a currentbudget surplus over the five years, 1966-70, of between M$175 million andM$250 million. This estimate appears reasonable although, on the basisof the above discussion, the achievement should be closer to M$250 mil-lion than M$175 million. Such achievement would still be somewhat belowthe surplus of the last five years which is estimated at over M$300 mil-lion.
90. The financial outlook of the commercial undertakings is morefeLvorable than that of the State Government, and their current surplusesare expected to continue to increase during the next five years. In thisconnection it should be noted that the surpluses achieved by these under-takings result in part from the fact that they are not subject to incometax. The Government estimates that these bodies will be able to makeavailable for the 1966-70 plan between M$525 million and M$575 millionfrom current surpluses and reserves. Judging from past performance andestimates of their future prospects, the current surpluses of these under-takings alone may well reach M$575 million. Thus no drawing on reserveswould be necessary in order to meet the Government's estimate. The esti-mated gradual growth in accumulations of provident funds as estimated bythe Government also appears reasonable.
- 24 -
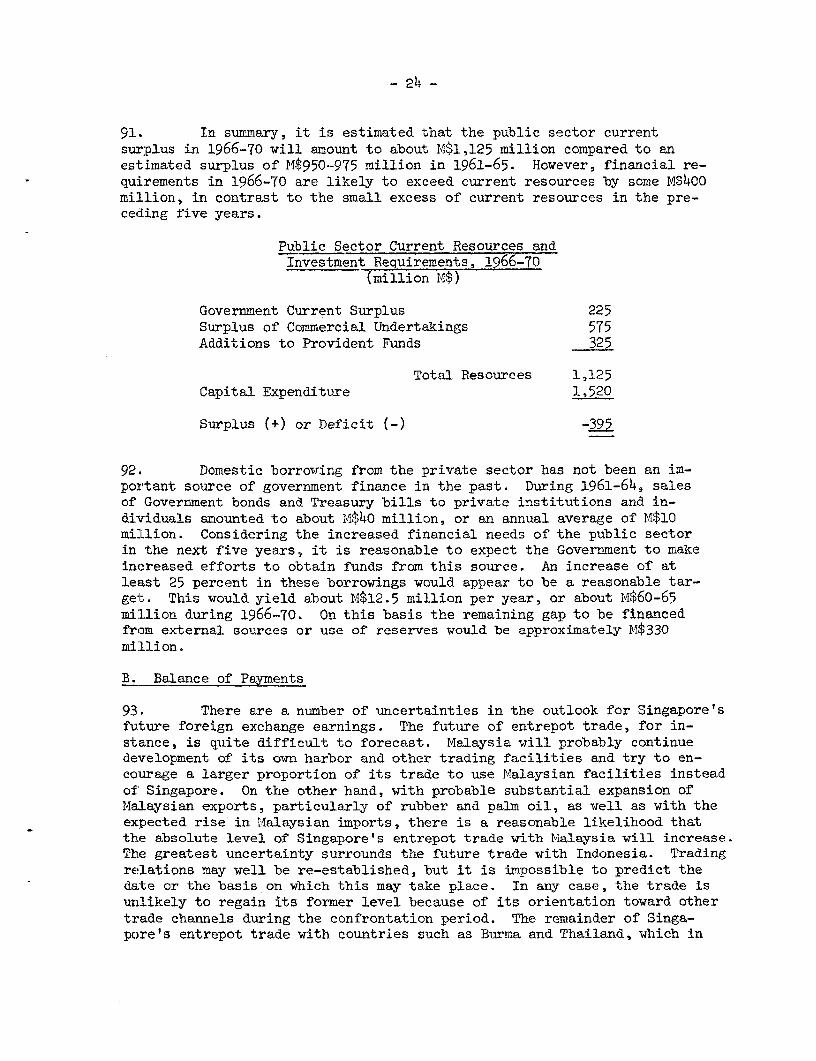
91. In summary, it is estimated that the public sector currentsurplus in 1966-70 will amount to about M$1,125 million compared to anestimated surplus of M$950-975 million in 1961-65. However, financial re-quirements in 1966-70 are likely to exceed current resources by some M$400million, in contrast to the small excess of current resources in the pre-ceding five years.
Public Sector Current Resources andInvestment Requirements, 1966-70
(million M$)
Government Current Surplus 225Surplus of Commercial Undertakings 575Additions to Provident Funds 325
Total Resources 1,125Capital Expenditure 1,520
Surplus (+) or Deficit (-) -395
92. Domestic borrowing from the private sector has not been an im-portant source of government finance in the past. During 1961-64, salesof Government bonds and Treasury bills to private institutions and in-divriduals amounted to about M$40 million, or an annual average of M$10million. Considering the increased financial needs of the public sectorin the next five years, it is reasonable to exDect the Government to makeincreased efforts to obtain funds from this source. An increase of atleast 25 percent in these borrowings would appear to be a reasonable tar-get. This would yield about M$12.5 million per year, or about M$60-65miLlion during 1966-70. On this basis the remaining gap to be financedfrom external sources or use of reserves would be approximately M$330million.
B. Balance of Payments
93. There are a number of uncertainties in the outlook for Singapore'sfuture foreign exchange earnings. The future of entrepot trade, for in-stance, is quite difficult to forecast. Malaysia will probably continuedevelopment of its own harbor and other trading facilities and try to en-courage a larger proportion of its trade to use Malaysian facilities insteadof Singapore. On the other hand, with probable substantial expansion ofMalaysian exports, particularly of rubber and palm oil, as well as with theexpected rise in lMalaysian imports, there is a reasonable likelihood thatthe absolute level of Singapore's entrepot trade with Malaysia will increase.The greatest uncertainty surrounds the future trade with Indonesia. Tradingrelations may well be re-established, but it is impossible to predict thedeLte or the basis on vhich this may take place. In any case, the trade isunlikely to regain its former level because of its orientation toward othertrade channels during the confrontation period. The remainder of Singa-pore's entrepot trade with countries such as Burma and Thailand, which in
- 25 -
the past has been much less important than the trade with Malaysia andIndonesia, is likely to grow very little. Trade with Burma, where economicgrowth is likely to be modest and where foreign trade has been nationalized,is likely to decline from its already low level. Trade with Thailand, withbetter economic growth prospects, may show a modest increase over the nextfewi years.
94. Taking the entrepot trade as a whole, it is assumed that it willincrease slowly at about 2 percent per year on the average over the nextfew years. If trade with Indonesia is resumed, there would be a rathersharp increase for a short period of time with the rate of growth fallingback to around 2 percent thereafter. On these assumptions, entrepot tradewill gradually become a less important component of Singapore's foreignexchange earnings and its contribution to GNP, about 14 percent at present,will gradually decline.
95. A second uncertainty is the future of U.K. military expendituresirL Singapore. In the immediate future the level depends largely on develop-ments in relations between Indonesia and Singapore/Malaysia. In the longerrum, the level of such expenditures probably depends mainly on politicaland strategic considerations of the U.K. and other western powers.
96z. Another uncertain element is the future trend of Singapore'sdomestic exports. Considering the limited prospects for entrepot tradeand the doubtful possibilities for establishing a common market withMalaysia in the near future, the finding and exploitation of export marketsis crucial to Singapore's industrialization efforts. Although it is toosoon to say that Singapore has proved its ability to compete on a sizeablescale in world markets for manufactured goods, significant progress towardsthis goal has been made. This is indicated by the growth of domestic ex-ports over the last few years. Although still relatively small in abso-lute terms, they increased during 1961-64 on the average more than 10percent per year; from 1955 to 1964 the average annual increase was aboutT.5 percent. A large part of these increases came from new exports ofnumerous small manufactures.
97. Considering the past performance; considering that both theGovernment and private industrialists are very much aware of the necessity-to export; considering the experience of Singapore traders and their closecontacts in a number of foreign markets; considering the incentives offeredby the Government to industrialists; and considering the efforts being madeby both the Government and the private sector to promote trading relationswith additional countries, it seems a reasonable assumption that Singaporewill have the capability and will take whatever steps are necessary tocompete in world markets and that exports will continue to rise at a goodrate in the future.
- 26 -
98. For illustrative purposes, a balance of payments projection hasbeen. made for the period 1966-70 based on the following assumptions:
(1) Domestic exports will increase at 7.5 percent per year;
(2) Retained imports will increase at approximately 5.5 percentper year, or slightly faster than the estimated 5 percentgrowth in GNP (in the past the increase in imports on theaverage has been just equal to the growth in GNP, and con-sidering the prospects for import substitution the importprojection may be somewhat high);
(3) Entrepot earnings will increase slowly by about 2 percentper year from the present level; this makes no allowancefor resumption of Indonesian trade;
(4) Net income from services will probably continue upward butthe trend is difficult to forecast, especially because ofthe uncertainty about the future of U.K. military expendi-ture. An increase in net service earnings during 1966-70of about 20 percent is assumed although it could be moreor less depending on the U.K. military expenditures. Inthe last several years these have represented about 75 per-cent of Singapore's net earnings from services and around23 percent of total current account earnings;
(5) Private capital inflow will be equLivalent to 50 percentof total private investment (which has been estimatedindependently);
(6) Average "errors and omissions" in 1966-70 will be the sameas in the last five years; errors and omissions are allo-cated between capital and current account on the basisexplained above (paragraph 28).
99. The projection is shown below, together with comparative datafor 1961-65.

- 27 -
Illustrative Balance of P ments Projection(million M$)
1961-65 a/ 1966-70
Domestic Exports 1,400 2,o85Retained Imports 7,840 9,955
Balance -6,440 -7,870
Entrepot Earnings (net) +2,900 +3,185Services (net) +2,365 +2,845Other Invisibles (net) bf +1,o45 + 985
Total Current Account - 130 - 855
Private Capital Inflow b/ + 395 + 525
Gap c/ - 265 + 330
a! Based on data supplied by the Government for 1961-64 plusestimates for 1965.
b/ Includes portions of "errors and omissions."e! (-) indicates increase in reserves; (+) indicates gap to
be financed by foreign borrowing or drawdown of reserves.
10(. This projection, which is consistent With the assumptions madeabove for the public sector, indicates probable future trends under reason-ably favorable conditions. The projection indicates that even with fairlyfavorable assumptions there will be a substantial increase in the currentaccount deficit in 1966-70 and a sizeable resource gap to be financed fromexternal borrowing or use of reserves, in contrast to the last five yearswhen there was an over-all surplus of resources and an increase in reserves.
C. The Ov-er-all Financial Outlook
101. Total gross capital formation in 1966-70 is estimated at M$2,320million compared to estimated actual investment of around M$1,620 millionin 1961-65. Of the 1966-70 total, the public sector would undertakeM$1,270 million and the private sector M$1,050 million. Public investmentwould thus be about 60 percent larger than in 1961-65 and private invest-ment some 30 percent larger. As previously indicated, the slower growthof private investment assumes a rather slack period in the immediatefiture with a later catching up. If Singapore and Malaysia could expediteprogress toward closer economic cooperation, which would be greatly to theeconomic advantage of both, the prospects for faster expansion of privateinivestment would be much brighter.
- 28 -
102. GNP is estimated to increase at an average rate of 5 percent perannum. Government revenue (state government current revenue, current sur-pluses of the commercial undertakings and additions to provident funds) isestimated to increase slightly faster than GNP with the result that thegovernment share in Gi7P will increase somewhat. Private disposable incomeis therefore estimated to rise at a slightly slower rate than GNP, orabout 4.0 to 4.5 percent per year. With a population growth at the presentrate of about 2.5 percent or slightly lower (official estimates indicate afurther gradual fall in the rate to about 2.1 percent), average per capitaincome would rise by approximately 1.5 to 2.0 percent per year. It isassumed that the past relationship between private disposable income andsavings will be maintained; private savings is thus estimated to increaseat the same rate as private disposable income, or 4.0 to 4.5 percent peryear.
103. Public savings, after deducting a higher allowance for transfersto the private sector, is estimated at approximately the same level as in19651-65. Total public and private savings are estimated at about M$1,465million.
104. With total investment estimated at M$2,320 million and totalsavings at M$1,465 million, a gap of M$855 million would remain to be fi-nanced from external sources or use of reserves. On the assumption thatforeign private capital inflow will approximate 50 percent of total pri-vate investment (paragraphs 28 and 98), private capital inflow wouldamount to M$525 million. This would reduce the gap to about M$330 mil-lion.
105. The Government should consider carefully the question whetherto finance this gap by drawing down reserves or by seeking foreign loans.Singapore is in a fairly comfortable reserve position, with over M$700million of foreign assets held by public authorities alone at the end of1964. Adding the foreign assets of banks and Singapore's share of theCurrency Board assets, total reserves probably exceed M$1,000 million, oraround 60 percent of one year's imports at recent levels.
106. A modest use of reserves to finance sound development projectswould certainly not jeopardize her financial position. However, in viewof the major uncertainties in the balance of payments prospects, it wouldbe prudent for the country to conserve most of its reserves to meet un-foreseen contingencies and to seek external financing for as much as pos-sible of the M$330 million needed over the next five years.
D. Creditworthiness
107. Singapore&s basic economic problem is to maintain a reasonablegrowth in incomes and to provide job opportunities for the rapidly growinglabor force and the unemployed. In the long run, by the late 1970's, theemployment problem should ease somewhat when the growth in the labor force

- 29 -
slows down as a result of the decline in the birth rate which has takenplace in the last few years. However, in the next five to ten years, everyeffort must be made to increase the number of available jobs.
108. A satisfactory solution to the income and employment problemhinges on the success or failure of the effort to industrialize, includingthe development of competitive exports. The task will be more difficultthan it would have been if Singapore were participating in a common marketwith Malaysia. Moreover, the problem would become even more difficult ifsome of the uncertainties in Singapore's outlook develop unfavorably - forinstance, a halt in U.K. military expenditures in Singapore withoutreplacement of such expenditures from another service; or a serious deteri-oration in relations with Malaysia. However, considering the resourceful-ness, good judgment and past performance of the Government and people, itis reasonable to expect that the difficulties will be overcome and thatSingapore will succeed in its industrialization effort.
109. Singapore's external public debt is small. It amounts to approxi-mately US$27 million equivalent, of which about US$22 million consists ofBank loans. Annual service payments on this debt will rise to approximatelyU'S$2.8 million in 1969. It will remain at that level through 1975 and thendecline. This figure is about 0.5 percent of recent current account earn-ings. Even if Singapore borrowed its entire requirement of M$330 million(US$110 million) on conventional terms, it would raise debt service onlyto slightly more than 2.0 percent of estimated current account earningsin 1970.

STATISTICAL APPENDIX
Table of Contents
1. External Medium- and Long-Term Public Debt Outstanding as ofJune 30, 1965
2.. Estimated Contractual Service Payments on External Medium- andLong-Term Public Debt Outstanding Including Undisbursed as ofJune 30, 1965
3. Population Data4. Gross National Expenditure and Illustrative Calculation of Gross
Mational Product5. Output of Selected Industrial Products and Energy6. Output of Selected Agricultural Products7. External Trade by Major Countries of Origin and Destination8. Exports and Imports by Commodity Sections9. Exports of Domestic Products'A. Retained Imports
10. Singapore's Trade with Entrepot Countries - Exports of Singapore11. Singapore's Trade with Entrepot Countries - Imports of Singapore12. Singapore's Share in Exports and Imports of the States of Malaya13. Singapore's Share in Exports and Imports of Indonesia1h. Singapore's Share in Exports and Imports of its Traditional
Entrepot Countries1S. Balance of Payments Estimates16. Gross National Expenditure by Major Categories17. Consolidated Accounts of Public Authorities - Current Revenue of
State Government and Surpluses of Commercial Undertakings18. Accounts of State Government - Current Expenditures and Surplus19. Consolidated Accounts of Public Authorities - Capital Expenditure20. Flow of Funds for the Financing of Capital Expenditure21. Foreign Financial Assets of Public Authorities and Banks22. Commercial Banks - Assets and Liabilities23. Currency Board Data on Singapore - Assets and Profit Sharing2h. Consumer Price Index
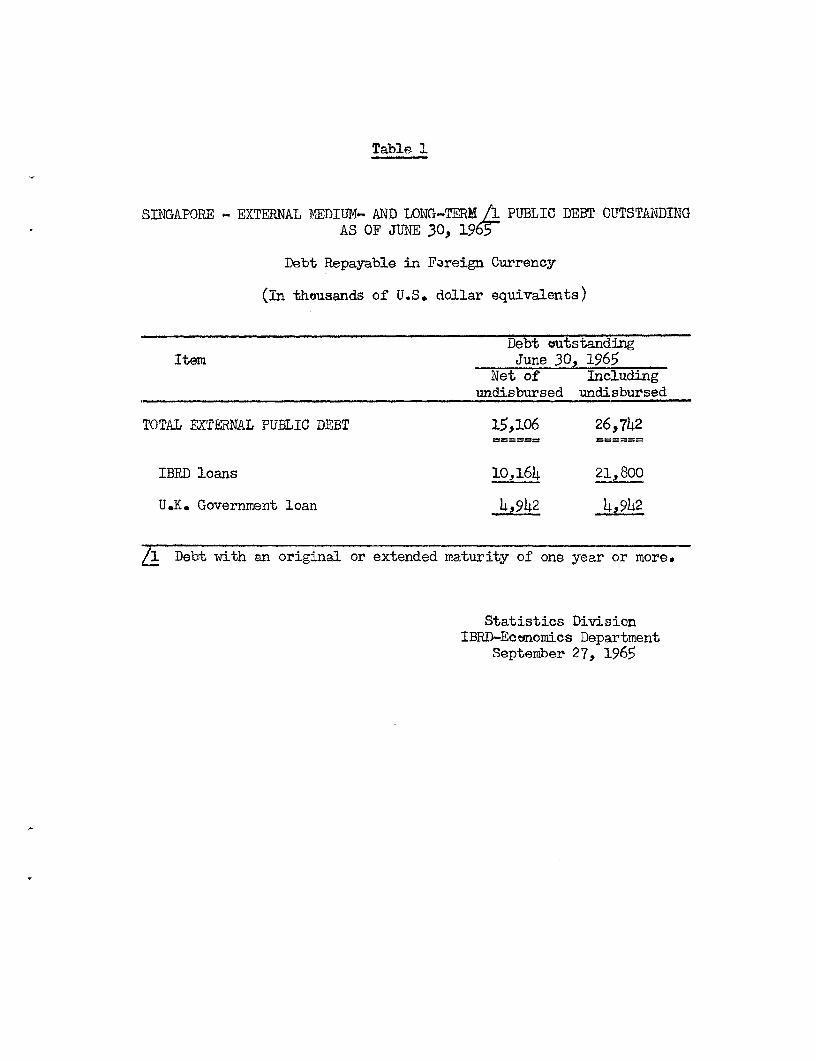
Table 1
SINGAPORE - EXTERNAL MEDIUM- AND LONG-TERM A PUBLIC DEBT OUTSTANDINGAS OF JUNE 30, 196W
Debt Repayable in Fareign Currency
(In thousands of U.S. dollar equivalents)
Debt outstandingItem June 30, 1965
Net of Includingundisbursed undisbursed
TOTAL EXTERNAL PUBLIC DEBT 15,106 26,742
IBRD loans 10,164 21,800
U.K. Government loan 4,942 4,9h2
A Debt with an original or extended maturity of one year or more.
Statistics DivisionIBRD-Ecmnomics Department
September 27, 1965

Table 2
SINGAPORE _ ESTIM'ATED CONTRACTUAL SERVICE PAYMENTS ON EXTERNAL MEDIUM_ AND LONG-TERM PUBLIC DEBT OUTSTANDINGINCLUDING UNDISBURSED AS OF JUNE 30, 1965 /|
Debt Repayable in Foreign Currency
(In thousands of U.S. dollar equivalents)Debt outstanding Payments during Period Debt outstanding Payments during Period
Year (Beginning of Period) Amorti- In- Year (Beginning of Period) Amorti. In-Including Undisbursed zation terest Total Including Undisbursed zation terest Total
Grand Total Loans from U.K.
1965 26,742 L.- 528 349 877 1965 4,942 /2 528 - 5281966 26,704 776 928 1,704 1966 4,904 506 _ 5061967 25,928 1,071 1,026 2,097 1967 4,398 506 - 5061968 24,858 1,106 1,115 2,221 1968 3,893 506 5061969 23,752 1,401 1,373 2,774 1969 3t387 506 5061970 22,352 1,451 1,334 2,785 1970 2,882 506 _ 5061971 20,901 1,506 1,300 2,806 1971 2,376 506 - 5061972 19,395 1,513 1,255 2,768 1972 1,870 468 - 4681973 17,883 1,578 1,217 2,795 1973 1,403 468 _ 4681974 16,305 1,643 1 175 2,818 1974 935 468 4681975 14,663 1,708 1,128 2,836 1975 468 468 - 4681976 12,955 1,310 1,080 2,3901977 11,645 1,380 1,027 2,4071978 10,265 1,455 970 2,4251979 8,810 1,535 915 2,450
IBRD Loans1965 21,800 /2 - 349 3491966 21,800 270 928 1,198 /1 Includes service on all debt listed1967 21,530 565 1,026 1,591 in Table 1 prepared September 27,1968 20,965 600 1,115 1,715 1965.1969 20,365 895 1,373 2,2681970 19,470 945 1,334 2,279 /2 Amount outstanding is as of June 30,1971 18,525 1,000 1,300 2,300 1965; payments are for the entire1972 17,525 1,045 1,255 2,300 year.1973 16,480 1,110 1,217 2,3271974 15,370 1,175 1,175 2,3501975 14,195 1,240 1,128 2,368 Statistics Division1976 12,955 1,310 1,080 2,390 IBRD_Economics Department1977 11,645 1,380 1,027 2,407 September 27, 19651978 10,265 1,455 970 2,4251979 8,810 1,535 915 2,450

Table 3
Population Data
1958 1959 1960 1961 1962 1963 1964
1. Population (000ts) g
Males 796 829 856 881 903 923 945Females 718 751 779 806 930 852 875
Total 1514 1580 1635 1687 1733 1775 1820
2. Crude Rates
Births (per 000 population) 41.3 39.5 37.8 35.5 34.0 33.5 32.0Deaths (per 000 population) 7.0 6.4 6.2 5.9 5.9 5.7 5.7Population Increase (percent) 3.4 3.3 3.2 3.0 2.8 2.8 2.6
3. Racial Composition (000's) 1/
Chinese 1142 1190 1231 1269 1303 1335 1366Malays 207 217 228 236 243 249 258Indian 130 135 138 142 144 146 150Other 35 38 38 40 43 45 46
Total 1514 1550 1635 1657 1733 1775 1520
1/y Mid-year Estimates.
Source: Monthly Digest of Statistics

Table 4
Gross National Ependiture and Illustrative Calculation
of Gross Natie,nal Product ,(in million M$)
1959 1960 1961 1962 1963 1964
1. Value Added In:Agriculture and Fisheries 103 107 115 118 126 120Quarrying 2 4 4 5 6 6Manufacturing 119 125 156 182 202 220Entrepot Trade: 367 390 392 418 490 347
Processing 190 T3 191 W7- 279 7Other 177 207 201 171 211 169
Building and Construction 1T2 T7 )6. 71 9 114Ownership of Dwellings 90 97 102 106 110 119Tourism 30 31 32 40 55 61Retail and Wholesale Trade 387 418 464 475 545 527Militar.y ServLces 271 279 281 301 323 412Public: nt* 3tration 100 106 145 165 201 220Other &Srvices 304 325 344 356 372 390
2. GDP at Factor Cost 1818 1924 2101 2237 2525 2536Plus Indirect Taxes 105 115 124 130 136 1441
3. GDP at Market Prices 1923 2039 2225 2367 2661 2677Net factor income to abroad 34 35 33 38 48 47
4. GINP at Market Prices 1957 2074 2258 2405 2709 2724Current Account trade balance 62 -203 -277 -215 -342 -188
5. GNE at Market Prices I 2019 2277 2535 2620 3051 2912Variation -- 18 7 7 +107 +170 45
6. G3NE at Market Prices II 2037 2130 2428 2536 2881 2957Consumption Expenditure 193 1993 -2251 7 2542
Public 1T7 196 215 -212 289 290Private 1695 1795 1987 2039 2269 2252
Capital Formation 147 137 226 T 323Public n.a. na. 92 UT0 -165 212Private n.a. n.a. 134 135 158 203
Source: Department of Statistics for GNE and IBRD Calculations for GNP basedon official data.
(see footnote on next page)

Footnote to Table h
/ g Singapore does not produce data on GNP; accordingly an illustrativecalculation was made by IBRD on the following basis.
Agriculture and Fisheries: production less 25% to obtain farm valuesless 25% for inputs.
Quarrying: value added from Census of Industrial Production.
Manufacturing: value added from Census of Industrial Production lessprocessing in entrepot trade plus adjustments for value added insmall establishments and under enumeration in the Census.
Entrepot Trade: value added on imports for re-export and processingof imports.
Building and Construction: value of construction less 5G% for costof inputs.
Ownership of Dwellings: 50% of private expenditure on housing (rent,water, fuel and light).
Tourism: Department of Statistics estimate of expenditure on tourism.
Retail and Wholesale Trade: 35% of private consumption expenditure ongoods.
Military Services: expenditure by U.K. Forces.
Public Administration: compensation of Government employees and armedforces plus 25% of expenditure on other goods and services withallowances for Malaysian Federal Government expenditure during Merger.
Other Services: private consumer expenditure on services discounted40.

Table S
Output of Selected Industrial Products and Energy
Units 1960 1961 1962 1963 1964
1. ManufacturingSoft Drinks mwl. oz. 1184 1422 1416 1706 1536Soya Bean Sauce 000 gals. 2325 2310 2457 2648 2731Biscuits 000 cwt. 8887 8090 8056 7722 7065Tobacco 000 lbs. 3562 4349 4738 5444 5786
Soap 000 cwt. 10690 9810 8771 7706 7924Rubber Sheeting 000 lbs. 55 64 20 28 26Rubber Hose linear feet 42 35 25 16 22Rubber Footwear 000 pairs 1789 2178 1875 2538 1923Rubber Compound 000 lbs. 645 454 202 477 573Bricks millions 44 47 71 72 77
2. ProcessingCoconut Oil 000 tons. 25 29 24 22 20Sawn Timber 000 tons.of 50 cu.ft. 178 188 188 216 252Remilled Rubber 000 tons. 83 111 131 118 34Sago Flour and Pearl 000 tons. 21 23 23 25 n.a.
3. QuarryingBroken Granite 000 cu. yds. 496 595 648 865 1100
4. Public UtilitiesElectricity Sold million Kwh 578 637 690 734 824Gas Produced million cu.ft. 616 682 825 957 1146
Source: Monthly Digest of Statistics.

Table 6
Output of Selected Agricultural Products
Units 1959 1960 1961 1962 1963 1964
Rubber Production 000 tons 2.3 2.4 2.1 2.1 1.8 n.a*
Vegetables 000 tons 34.7 39.4 39.7 39.8 40.0 n,a.Fruits 000 tons 1.8 3.3 3.4 3.8 3.7 n.a.
Domestic Slaughter: 000 head7Swine 26 418 450 432 393 363Other (excluding sheep) 3 2 2 4 4 4
Fish Landings bySingapore RegisteredVessels tons 5157 5220 4611 4453 4791 4834
Source: Ministry of National De.velopment, Primary Production Department,
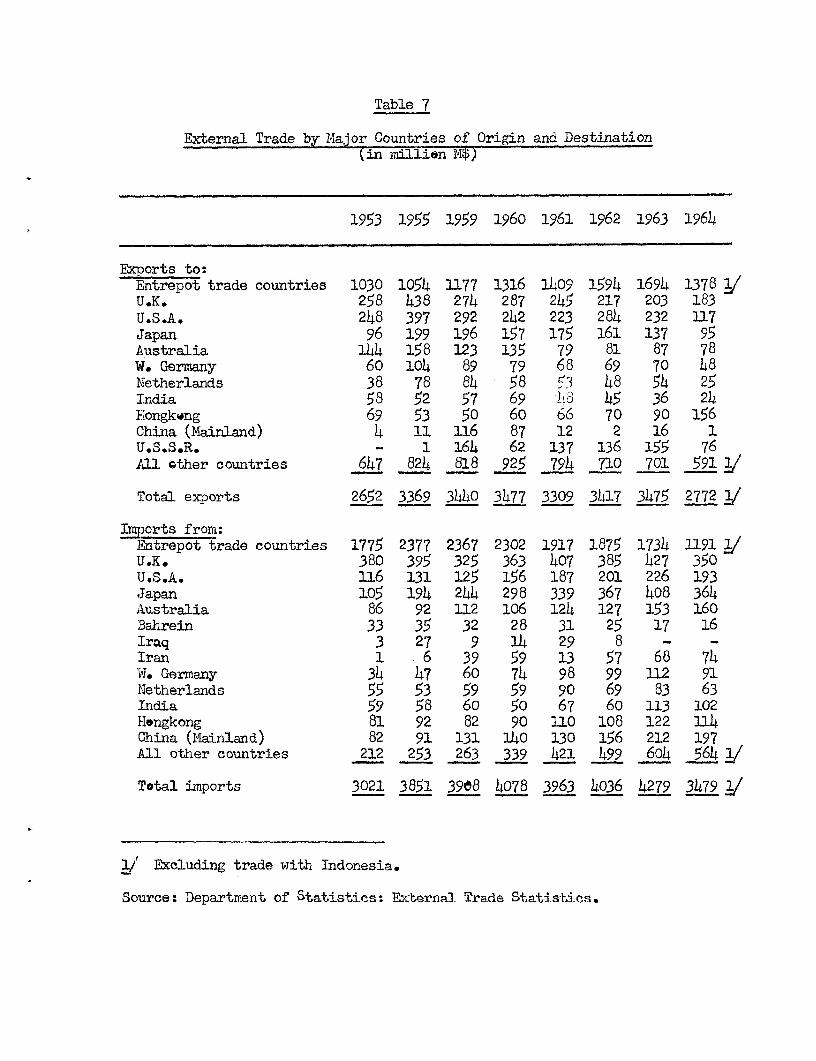
Table 7
External Trade by Major Countries of Origin and Destination(in million 14$)
1953 1955 1959 1960 1961 1962 1963 1964
Exports to:Entrepot trade countries 1030 1054 1177 1316 1409 1594 1694 1378 1/U.K. 258 438 274 287 245 217 203 183U.S.A. 248 397 292 242 223 284 232 117Japan 96 199 196 157 175 161 137 95Australia 144 158 123 135 79 81 87 78W. Germany 60 104 89 79 68 69 70 48Netherlands 38 78 84 58 53 48 54 25India 58 52 57 69 13 45 36 24Hongkong 69 53 50 60 66 70 90 156China (Mainland) 4 11 116 87 12 2 16 1U.S.S.R. - 1 164 62 137 136 155 76.al other countries 647 824 818 925 794 710 701 591 1/
'Total exports 2652 3369 3440 3477 3309 3417 3475 2772J
Imports from:Entrepot trade countries 1775 2377 2367 2302 1917 1875 1734 1191 /U.K 380 395 325 363 407 385 427 350U.S.A. 116 131 125 156 187 201 226 193Japan 105 194 244 298 339 367 408 364Akustralia 86 92 112 106 124 127 153 160:Bahrein 33 35 32 28 31 25 17 16.Iraq 3 27 9 14 29 8 - -
.Iran 1 6 39 59 13 57 68 74W. Germany 34 47 60 74 98 99 112 91Netherlands 55 53 59 59 90 69 83 63India 59 58 60 50 67 60 113 102Hongkong 81 92 82 90 110 108 122 114China (Mainland) 82 91 131 140 130 156 212 197All other countries 212 253 263 339 421 499 604 564 /
Total imports 3021 3851 39g8 4078 3963 4036 4279 3479g/
y' Excluding trade with Indonesia.
Source: Department of Statistics: External Trade Statistics.

Table 8
Exports and Imports by Commodity Sections
(in Million M$)
SITCClassi-fication Exports 1953 1955 1959 1960 1961 1962 1963 1964
0 Food 454 406 428 462 466 495 579 4211 Beverages and tobacco 58 68 63 70 68 61 52 422 Crude material inedible 858 1521 1669 1558 1261 1215 1115 7813 Mineral fuels 375 408 388 392 373 416 433 3624 Oils, animal, vegetable 35 48 42 50 47 39 41 445 Chemicals 60 61 76 86 101 94 104 1006 Mfd. goods by material 476 478 292 315 374 381 410 3597 Machinery and transport 119 127 183 235 266 335 341 2848 Misc. Mf. f i.-ticles 76 86 87 9? 108 119 139 1389 Misc. transactions n.e.s./ 141 166 212 210 245 263 262 240
Total exports 2652 3369 3440 3477 3309 3417 3475 2772
Imports
O Food 667 604 650 676 727 725 849 7051 Beverages and tobacco 72 79 70 71 77 71 79 622 Crude material inedible 950 1576 1535 1521 1143 1100 968 6323 Mineral fuels 536 601 600 591 574 601 585 4704 Oils, animal, vegetable 32 32 33 39 35 37 39 375 Chemicals 70 97 115 127 155 149 174 1646 Mfd. goods by material 368 1428 1435 1469 557 573 659 5567 Machinery and transport 171 204 225 288 376 14148 523 4958 Misc. Mfd. articles 127 16[ 172 215 238 254 314 2839 Misc. transactions n.e.s.2J 28 66 73 81 81 77 89 76
Total imports 3021 3851 3908 4078 3963 4036 4279 3479
%/ Includes bunker and stores.
Source: Department of Statisticst External Trade Statistics.

Table 9
Exports of Domestic Products
(in million M$)
1960 1961 1962 1963 1964
Live Animals / 8.5 7.3 8.1 8.0 11.3Meat Products 1.1 1.3 1.7 2.1 2.4Eggs 7f2 7.9 7.0 5.9 5.5Fresh Fish and Preparations 2.7 2.6 2.6 3.3 5.3Cereals and Preparations 5.5 4.4 4.3 4.5 6.5Fruits, Fresh, Dried, Preserved 11.8 7.6 9.1 9.8 8.3Vegetables, Fresh, Dried, Preserved 1.5 0.9 5.0 7.2 7.9Animal Feedingstuffs 7.6 11.5 18.2 16.5 18.6Beverages 20.3 20.4 18.2 9.6 11.5Tobacco Manufacture o.6 1.0 2.0 2.7 2.1Crude Rubber 5.7 3.9 3.7 2.7 n.a.Vegetable Oils 2/ 20.3 19.9 16.1 15.2 15.4Chemical Products 26.7 28.4 22.6 23.5 22.6Lime, Cement and Stone 6.o 7.8 10.8 12.0 11.8Glassware 3.8 6*3 - 6.7 8.0Metal Containers 13.7 9.1 18,7 13.5 15.5Electrical Equipment and Industrial Machinery 16.2 12.5 13.9 16.6 14.3Furniture 2.5 3.5 3.6 4.6 3.3Clothing 5.1 5.4 5.0 9.5 16.2Footwear 6.9 6.2 5.9 6.6 5.1Printed Matter 7.4 6.5 9.1 10.4 11.2Othier 36.0 50.4 66.2 86.2 lo6.5
217.1 224.8 251.8 277.1 309,3
y' Chiefly pigs../ Mainly coconut oil.
Source: Department of Statistics.

Table 9A
Retained Imports
(in million M$)
1960 1961 1962 1963 1964
Food 373 397 392 463 445
Live animals and meat 26.7 26.3 30.0 36.8 38.2Dairy Products 37.3 37.9 38.7 39.0 39.9Fish, fresh and prepared 33.1 30.9 28.5 32.3 35.8Cereals, flour and preparations 87.7 117.1 122.1 157.0 136.0Fruits, fresh and preserved 48.3 41.7 36.7 43.4 44.1Vegetables, fresh, dry and pres. 28.0 30.5 33.4 35.0 36.9Sugar and preparations 23.9 21.6 25.8 44.7 40.0Animal feedstuffs 48.8 47.6 48.8 51.2 53.7Other 39.0 43.8 28.4 24.0 20.5
Beverages and Tobacco 29 38 39 46 38
Crude Material Inedible 118 91 69 79 60
Oilseeds, nuts and kernels 59.9 17.0 24.2 24.5 20.2Other 57.6 74.1 38.1 54.8 39.9
Mineral Fuels 96 75 98 72 58
Oi.ls - Animal and Vegetable 30 11 16 15 10
Ckhemicals 81 97 94 112 106
Paints, varnishes, etc. 11.0 13.1 10.6 11.6 10.8Medicinal products 18.1 22.9 23.0 24.8 23.3Perfumes, cosmetics, etc. 17.0 21.8 21.7 15.2 13.1Organic and inorganic chemicals 11.3 14.1 14.3 12.7 12.6Other 24.1 25.5 23.9 47.5 45.8
Manufactured Goods 258 319 317 393 347
Paper and paperboard and mfrs. 31.5 38.2 37.9 38.9 38.8Textile fabrics - woven 75.8 107.0 85.6 118.4 96.1Other textile manufactures 22.5 24.0 23.5 28.7 22.8Iron and Steel 3403 43.4 60.1 66.8 65.6Metal manufactures 27.9 37.7 37.6 46.7 37.8Other 65.8 68.9 71.8 93.9 86.2
(Continued on Page 2)

Table 9A
Page 2.
1960 1961 1962 1963 1964
Machinery and Transport 124 178 209 305 311
Power generators 9.9 12.6 13.5 15.0 15.3Industrial machinery 25.6 35.4 49.1 69.6 86.5Electrical equipment 36.3 51.6 66.5 112.7 120.8Road motor vehicles 34.9 65.5 60.4 91.5 72.2Other 17.4 13.1 19.6 16.6 16.3
Miscellaneous Manufactures 151 173 180 23l 209
Clothing 29.6 36.2 39.6 68.6 63.5Footwear 10.8 9.8 10.7 12.3 10.6Scientific apparatus 10.4 11.6 13.6 16.9 14.0Watches and clocks 37.0 34.8 32.5 35.7 34.4Musical instruments 7.0 10.5 11.0 12.0 10.9Printed matter 8.2 10.6 11.2 14.6 13.9Other 47.9 59.0 54.7 73.8 61.9
Miscellaneous n.e.s. n.a, n.a. 20 18 21
Total 1260 1379 1435 1737 1605
Source: Department of Statistics.

Table 10
Singapore's Trade with Entrepot Countries - Exports of Singapore
Average Average First 6 First 61950_54 1955-59 1960 1961 1962 1963 1964 months months
_ _ ~~~~~~~~~~~~1964 1965__
Value (in million M$)
Brunei 15.3 25.9 20.6 20.6 20.0 26.2 35.1 17.3 20.1Sabah 37.7 58.1 73.9 75.2 83.7 116.4 118.3 59.3 60.9Sarawak 69.3 80.7 85.6 88.2 87.6 97.9 115.6 53.2 67.6Burma 27.3 25.1 10.9 11.3 11.8 10.0 11.8 3.9 8.1Indo-China 2 24.2 45.0 53.2 49.7 65.4 75.7 80.6 34.8 47.4Republic of Indonesia 288.1 228,5 121.1 194.3 292.5 261.3 n.a. n.a. n.a.Thailand 66.0 75.4 107.3 83.7 91.1 95.8 91.2 54.1 34.7States of Malaya 673.4 843.0 886.2 941, 1,011.1 925.5 451.6 442.5Total 1.124.5 1.212.1 1.315.6 1,409.2 1.593.7 1.694,4 1.378.1/ 674.2 a/6813 /
Total Exports ofSingapore 3,309.7 2.771.3 3.477.1 3.308.5 3.416.8 3.474.5 2.771.9,a/ 1.337.7 /i1.438.6 "
Percent of Total Exports
Brunei 0.5 0.9 o.6 o.6 o.6 0.8 1,3 1.3 1.4Sabah 1.1 2.1 2.1 2.3 2.4 3.3 4.3 4.4 4.2Sarawak 2.1 2.9 2.5 2.7 2.6 2.8 4.2 4.0 4.7Burma 0.8 0.9 0.3 o.3 0.3 0.3 0.4 0.3 o,6Indo-China / 0.7 1.6 1.5 1.5 1.9 2.2 2.9 2.6 3.3Republic of Indonesia 8.7 8.2 3.5 5.9 8.6 7.5 n.a. n.a. n.a.Thailand 2.0 2.7 3.1 2.5 2.7 2.8 3.3 4.0 2.4States of Malaya 18.0 24.9 24.2 26.8 27.5. 29.1 52L4 33.8 30.8Total 33.9 43.6 37.8 42.6 46.6 48.8 49.8 aj 50.4 a/ 47.4 a/
-Laoas Cambodia, North and South Viet Nam./ Excludes Indonesia.
Source: Department of Statistics "External Trade Statistics".
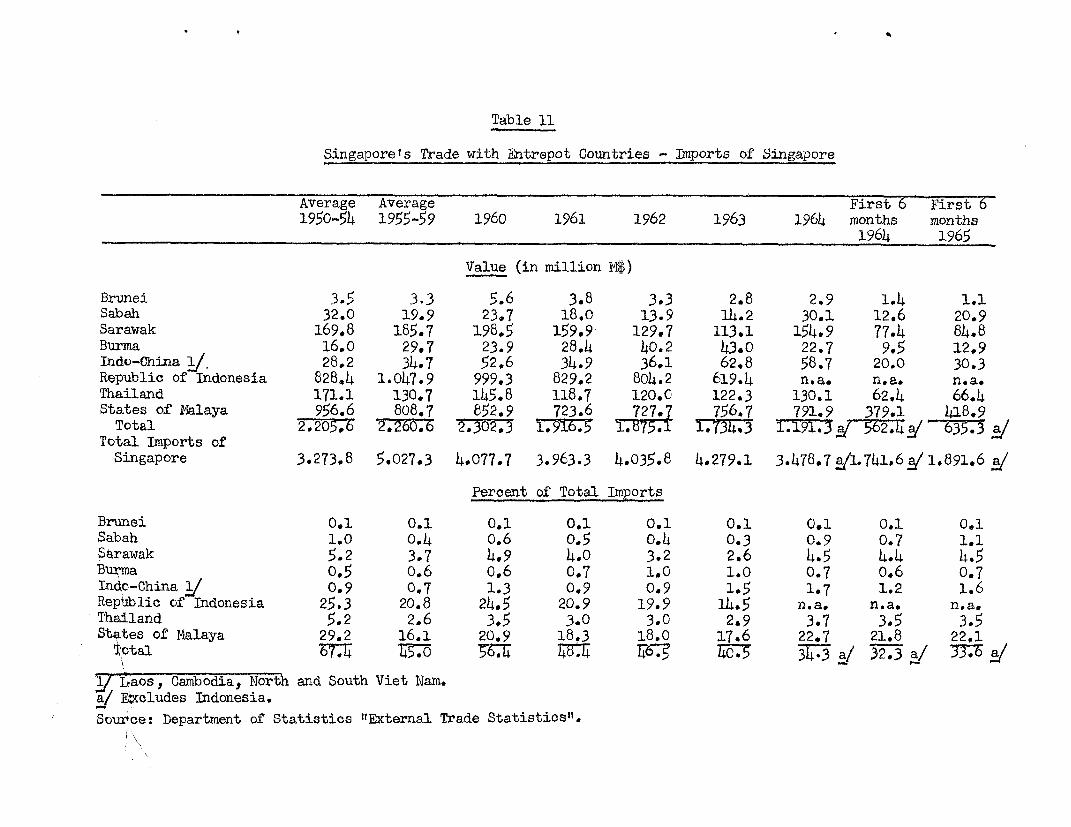
Table 11
Singaporels Trade with Entrepot Countries - Imports of Singapore
Average Average First 6 First 6
1950-54 1955-59 1960 1961 1962 1963 1964 months months1964 1965
Value (in million M$)
Brunei 3.5 3.3 5.6 3.8 3.3 2.8 2.9 1.4 1.1
Sabah 32.0 19.9 23.7 18.o 13.9 14.2 30.1 12.6 20.9
Sarawak 169.8 185.7 198.5 159.9 129.7 113.1 154.9 77.4 84.8
Burma 16,0 29.7 23.9 28.4 40.2 43.0 22,7 9.5 12.9
Indo-China 1J 25.2 34.7 52.6 34.9 36.1 62.8 58.7 20.0 30.3
Republic of Indonesia 828.4 1.047.9 999.3 829,2 804.2 619.4 n.a. n.a. n.a.
Thailand 171.1 130.7 145.8 118.7 120,0 122.3 130.1 62.4 66.4States of Malaya 956.6 808.7 852.9 723.6 727^7 756.7 791.9 379.1 418.9
Total 2.205.6 2.26. 3 T9 16 .5 T751j775 i 91. 3 1 635.3 a / 2Total Imports ofSingapore 3.273.8 5.027,3 4.077.7 3.963.3 4.035.8 4.279.1 3.478.7 y/L 741.6 / 1.891.6 2
Percent of Total Imports
Brunei 0.1 0.1 0.1 0.1 0.1 0.1 0.1 0.1 0.1
Sabah 1.0 0.4 0.6 0.5 °.4 0.3 0.9 0.7 1.1
Sarawak 5.2 3.7 4.9 4.0 3.2 2.6 4.5 4.4 4.5Burma 0.5 o.6 0.6 0.7 1.0 1.0 0.7 0.6 0.7Indo-China g 0.9 0,7 1.3 0.9 0.9 1.5 1.7 1.2 1.6
Reptiblic of Indonesia 25.3 20.8 24.5 20.9 19.9 14.5 n.a, n.ae n.a.
Thailand 5.2 2.6 3.5 3.0 3.0 2.9 3.7 3.5 3.5
States of Malaya 29.2 16.1 20,9 18,3 18.0 17.6 22*7 21.8 22.1
Total T7T 140 546O § 3I a/ 32.3 2 37 a/
/ Laos, Cambodia, North and South Viet Nam.E/ &cludes Indonesia.
Source: Department of Statistics "External Trade Statistics".

Table 12
Singapore's Share in Exports and Imports of the States of Malaya
1950 1955 1959 1960 1961 1962 1963 1964
Exports of the States of MalayaTotal exports (in milli.n US$) 852 774 808 956 856 858 884 909
Index (1950Ql00) 100 91 95 112 100 101 104 107
Exports to Singapore-/ (in million US$) 369 326 262 278 236 238 248 260Index (1950-100) 100 88 71 75 64 64 67 70
Exports to Singapore as a percentage oftotal exportsf - 3.3 42.1 32.5 29.1 27.6 27.8 28.1 28.6
Imports of the States of MalayaTotal imports (in million US$) 28 504 568 702 729 800 828 819
Index (1950=100) 100 118 133 164 170 187 193 191
Imports from Singapore (in million US$) 177 192 235 275 290 308 331 297Index (1950-100) 100 108 132 155 164 174 187 168
Imports from Singapore as a percentageof total imports 41.4 38.0 41.4 39.2 39.8 38.5 40.0 36.3
1/ Includes transit trade through Singapore.
Source: Monthly Statistical Bulletin of the States of Malaya.

Table 13
Singpore's Share in Exports and Imports of Indonesiat
1950 1955 1959 1960 1961 1962 1963 1964
Exports of IndonesiaTotal exports (in million US$) 800 1057 934 839 783 711 616 672
Index (1950-100) 100 132 117 105 98 89 77 84
Exports to Singapore (in million Us$) 206 333 371 327 271 263 202 2/Index (1950-100) 100 162 180 159 131 128 98
Exports to Singapore as a percentageof total exports 25.8 32.5 39.7 39.0 34.6 37.0 32.8 2/
,Imorts cf IndonesiaTotal imports (in million US$) 402 631 459 574 793 736 527 570
Index (1950-100) 100 157 114 143 197 182 131 142
Imports from Singapore (in million U3$) 75 62 43 40 64 96 85 2/Index (1950=100) 100 82 57 53 85 128 113 l
Imports from Singapore as a percentageof total imports 18.6 9.7 9.3 7.0 8.1 13.0 16.1 2/
1/ Trade with Singapore is based on Singapore data; no adjustment was made for cif/fob differences.2/ Official trade with Indonesia terminated with Confrontation.
Sources: IFS, DIT,UN Monthly Bulletin of Statistics, Singapore External Trade Statistics.

Table 14
Singapore's Share in Exports and Lmports of its Traditional Entrepot Countries./ 2
1950 1955 1959 1960 1961 1962 1963 1964
Exports of Entrepot CountriesTotal Exports (in million US$) 2414 2793 2791 2911 2739 2666 2668 2771
Index (1950=100) 100 116 116 121 113 ll 111 115
Exports to Singapore (in mtillion US$) 707 780 775 752 626 611 565 390 3/Index (1950-100) 100 110 110 106 89 86 80 55
Exports to Singapore as a percentageof total exports 29.3 27.9 27.8 25.2 22.4 22.9 22.0 13.0
Imports of Entrepot CountriesTotal Imports (in nillion US$) 1468 2185 2196 2569 2794 2818 2853 2963
Index (1950=100) 100 149 150 175 190 192 194 202
Imports from Singapore (in million US$) 305 344 334 430 453 511 543 440 3/Index (1950=100) 100 113 126 141 1149 168 178 177
Imports from Singapore as a percentageaf total imports 20.8 15.8 17.5 16.7 16.4 18.1 19.1 14.8
1/ Entrepot countries: States of Malaya, Brunei, Burma, Indochina (since 1955: Cambodia, Laos,Vietnam), Indonesia, Sabah, Sarawak, Thailand.
2/ Trade with Singapore is based on Singapore trade data. No adjustment was made for cif/fobdifferences.
3/ Excludes trade with Indonesia.
Sources: IFS, DIT, UN Monthly Bulletin of Statistics, Singapore External Trade Statistics.

Table 15
Balance of Payments Estimates
(in million M$)
1 9 6 0 1 9 6 1 1 9 6 2 1 9 6 3 1 9 6 4 (Prelim.)
Credit Debit Balance Credit Debit Balance Credit Debit Balance Credit Debit Balance Credit Debit Balance
Io Domestic Trade 217 1293 -1076 225 1369 -1144 252 1435 -1183 277 1737 -1460 311 1606 -1295
II. Ehtrepot Trade 3261 2785 + 476 3084 2594 + 490 3165 2601 + 564 3197 2542 + 655 2461 1873 + 5881. Inci. Processing ThI 1389 + 219 +27 1121 - 233 1 9i1 i1Mi + 339 0 Th2 TE Mf iO91 3212. Excl. Processing 1653 1395 + 258 1727 1470 + 257 1185 960 + 225 1269 1000 + 269 1049 782 + 267
III. Total Merchandise Ace. 3 3477 4078 - 601 3309 3963 - 655 3417 4036 - 619 3475 4279 - 805 2772 3479 - 707
IV. Services 566 119 + 447 566 158 + 408 594 165 + 429 576 81 + 495 671 74 + 5971. Transportation i iR -77 -T-7S 106 7: 7~-7m ICY -)IT'5IT -+79 M7 + o6 m 35 7--72. Tourism 31 15 + 16 35 16 + 19 44 17 + 27 59 14 + 45 65 14 + 513. Publio Invest. Income 33 - + 33 35 - + 35 42 - + 42 47 - + 47 46 - + 464. Gov't. Transactions NIE / 291 3 + 288 293 3 + 290 302 3 + 298 334 5 + 329 423 3 + 4205. Other Services 90 74 + 16 97 109 - 12 97 114 - 17 23 35 - 12 20 27- 7
V. Transfers 3 52 - 49 5 35 - 30 8 32 - 24 10 42 - 32 85 164 -79
VI. Total Current Acc. 4046 4249 - 203 3879 4156 - 277 4018 4233 - 215 4060 4402 - 342 3528 3717 - 189
VII. Capital Account W + 18 + 42 + 27 + 16 + 33
VIII. Net Change in Assets jIo Bankcs + 47 + 50 - 71 + 20 t 702. Public Authorities - 113 - 126 - 110 - 57 + 36
IX. Errors and Omissions + 251 + 311 + 368 + 363 + 50
Source: Based on data supplied by Department of Statistics) Ministry of Finance
(see footnotes on next page)

Footnotes to Table 15
1/ Present balance of payments estimates indicate only very roughorders of magnitude. Unregistered transactions on current accountare presumably substantial, especially on the credit side:smuggling out of the free port city, services provided by Singaporefor the Federation, tourist expenditure and investment income ofSingapore residents are probably underestimated here. The currentaccount balance presented in this table is, therefore, likely to betoo unfavorable. There are also gaps in the capital account.
2/ These data, which are based in official trade statistics, indicatelarger value added by entrepot activities than unofficial calcula-tions of value added made by the Department of Statistics.
Official trade figures: exports f.o.b., imports c.i.f.
h/ Excludes (a) freight and insurance on imports which are includedabove in the Merchandise Account and (b) bunkers and steres forships and aircraft which are included above under Entrepot Trade.
2/ Mainly United Kingdom military expenditures in Singapore.
h-/ Consists of identifiable private capital inflow (mainly retainedprofits) of a few major enterprises.
7/ Excludes changes in assets of Currency Board which should beattributed to Singapore.
Note: Sum of individual items may not add to ttotals due to rounding.

Table 16
Gross National Expenditure by Major Categories
(in million M$)
1959 1960 1961 1962 1963 1964
I PrLvate Consumption 1695 1795 1987 2039 2269 2252
Food 576 588 638 652 702 687Beverages and Tobacco 131 135 159 164 177 189Clothing and Other Personal Effects 207 230 267 251 327 312Durable Household Goods 87 100 118 136 175 154Non-Durable Household Goods 32 32 45 43 45 47Other Goods 72 82 98 110 129 120Housing 129 139 146 151 158 170Transport and Communication 168 188 208 217 235 246Other Services 213 221 228 235 241 247Omissions and Undercoverage 80 80 80 80 80 80
II PuLblic Consumption 198 198 215 242 289 290
III Gross Investment 144 137 226 255 323 415
Machinery and Equipment 70 72 110 128 148 206Transport Equipment 7 1 2-2 22§ 20 -22Machinery 42 32 58 63 77 129Industrial Electrical Equipment 10 13 17 20 19 26Communications Equipment 5 4 2 7 14 12Implements and Tools 6 8 10 11 16 15Miscellaneous - 1 1 1 2 2
Building and Construction 71 62 :S6 7 175 0Dwellings 31 2 m 6 -ro 7Non-Residential Buildings 17 14 41 23 47 55Other Construction and Works 26 26 24 39 48 7b
IV Crross National Expenditure at M4arket Prices 2037 2130 2428 2536 2881 2957
Source: Department of Statistics.
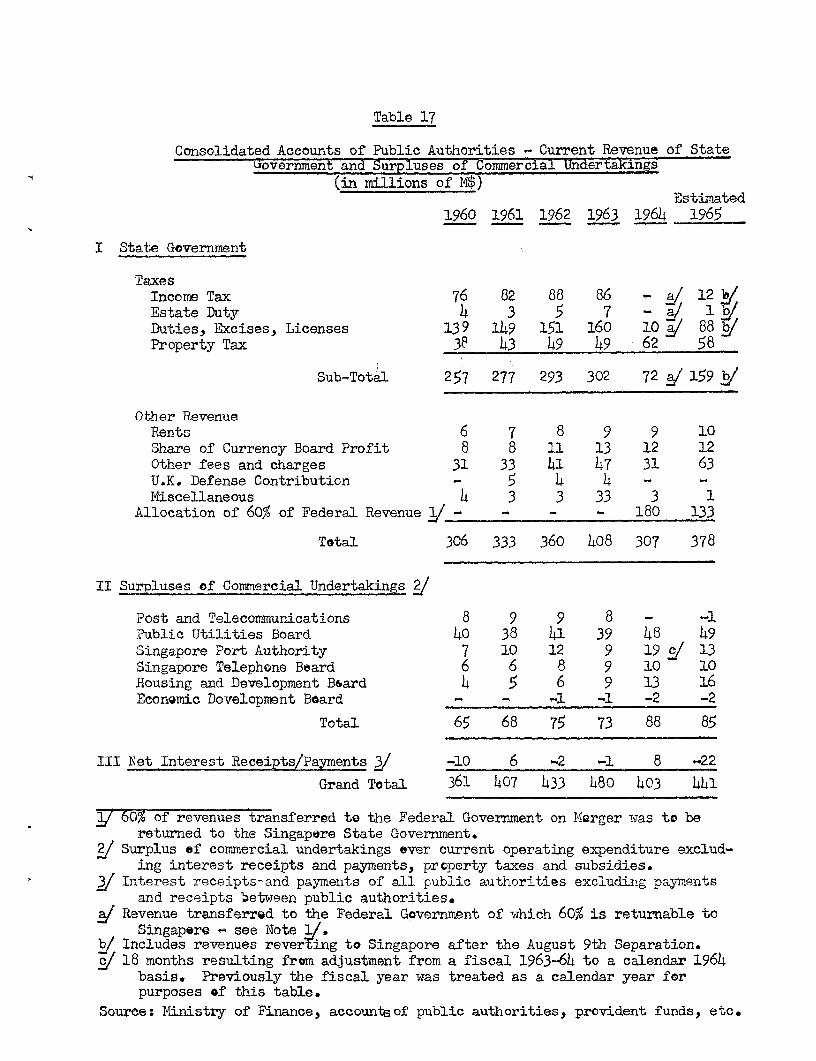
Table 17
Consolidated Accounts of Public Authorities - Current Revenue of StateL*overnment an .Surpluses of Commercial Undertakings
(in millions of M$)Estimated
1960 1961 1962 1963 1964 i965
I State Government
TaLxesIncome Tax 76 82 88 86 - a/ 12 b/Estate Duty 4 3 5 7 - a/ iDuties, Excises, Licenses 139 149 151 160 10 a/ 88 iProperty Tax 38 43 49 49 62 58
Sub-Total 257 277 293 302 72 i/ 159 /
Other RevenueRents 6 7 8 9 9 10Share of Currency Board Profit 8 8 11 13 12 12Other fees and charges 31 33 41 47 31 63U.K. Defense Contribution - 5 4 4 - -Miscellaneous 4 3 3 33 3 1
Allocation of 60% of Federal Revenue j - - - - 180 133
Total 306 333 360 408 307 378
II Surpluses of Commercial Undertakings /Post and Telecommunications 8 9 9 8 - -1P.ublic Utilities Board 40 38 41 39 4 49Singapore Port Authority 7 10 12 9 19 j 13Singapore Telephone Beard 6 6 8 9 10 10Housing and Development Bsard 4 5 6 9 13 16Economic Development Board - - -1 -1 -2 -2
Total 65 68 75 73 88 85
III Net Interest Receipts/Payments j -10 6 -~2 -l 8 -22
Grand Total 361 407 433 480 403 441
of revenues transferred to the Federal Government on J4orger was to bereturned to the Singapore State Government.
/ Surplus of commercial undertakings ever current operating expenditure exclud-ing interest receipts and payments, property taxes and subsidies.
Interest receipts-and payments of all public authorities excluding paymentsand receipts between public authorities.
Revenue transferred to the Federal Government of wxhich 60% is returnable toSingapore - see Note 1/.
b/ Includes revenues reverfing to Singapore after the August 9th Separation.c/ 18 months resulting frwm adjustment from a fiscal 1963-64 to a calendar 1964
basis. Previously the fiscal year was treated as a calendar year forpurposes of this table.
Source: Ministry of Finance) accountsof public authorities, provident funds, etc.

Table 18
Accounts of State Government - Current Expenditure and Surplus
(in millions of M$)Estimated
1960 1961 1962 1963 1964 1965
I Economic ServicesAgriculture, Fisheries 1 1 1 2 2 2Civil Aviatien, Marine, etc. 5 5 5 5 1 a/ 5 b/
Total 6 6 6 7 3 7
II Social Services 1/Education 56 66 83 95 102 108Health 29 49 56 61 63 68Social Welfare and Other 12 13 15 18 16 18
Total 97 128 154 174 182 194
III Other Government ServicesCity Services y. 3 - - -
Roads and Waterways 2 4 6 6 6 6Defense 7 9 11 13 - -,Justice, Police 23 28 31 35 - 21 :Administration 4/ 62 57 59 71 67 75
Total 97 98 107 125 73 102
IV Current Transfers yPensions, Gratuities 20 14 14 13 14 15
Total Current Expenditure 220 2h6 281 319 272 318
V Current Surplus / 86 87 79 90 33 60
3/ Excludes social services rendered by the City Council to 1960.E Excludes post and telecommunications and sinking fund provisions.3 Integrated into the State Government in 1961.( Excluding allocations to the Development Fund.
Excludes contributions to provident funds, interest payments and subsidiesto government agencies.
Current revenue of State Government in Table 17 less current expenditure.
J Excludes Civil Aviation.Includes five months!provision for former Federal departments.
Source: Ministry of Finance.

Table 19
Cgnsolidated Acceunts of Public Authorities - Capital Expenditure
(in million M$) FinancialProvisions
1961 1962 1963 1964 1965
I Ecoromic Development
1. Agriculture and Fisheries - 1 1 1 62. Land Development 4 4 6 7 363. Industry and Commerce 5 13 24 29 44
a) Economic Development Board / - 5 a 10 12b) Industrial Estates (including Jurung) 5 8 16 19 32
4. Public Utilities (electricity,water, gas) 20 25 53 84 985. Transportation 15 17 20 37 436. Communications / 5 6 14 12 25
Total Economic 49 66 118 170 252
II Social Development
1. Housing 34 41 51 81 a/ 110 /2. Sewage 5 4 7 10 113. Education 7 12 13 17 264, Health 1 2 3 2 45. Other 1 I - 1 3 3
T'tal Social 48 59 75 113 154
III Other Gcvernment Services 2 2 2 2 3
IV Total Capital Expenditure 99 127 195 285 409
g Industrial financing.E Includes Post and Telecommunications and Telephone Board.3 Culture, community services, social welfare and Trade Union House.$ Customs, prisons, fire brigadep printing office, public works, statistics,
judicial.
a/ Includes urban renewal of 0.2 million in 1964 and 20 million in 1965.;/ Estimated.
Source: Economic Planning Unit except for capital expenditure attributed to thePublic Utilities Board, Economic Development Board, Telephone Board andHousing and Development Board whose estimates of capital expenditurewere used.

Table 20
Elow of Funds for the Financing of Capital Expenditure
(in million M$)
1961 1962 1963 1964_ _
I Sources of Funds
Current State Government Surplus 87 79 89 35Current Public Authorities' Surpluses 68 75 73 88Net Interest 6 -2 -1 8Land Sales - 1 12 1G.rants - 1 2 3Accumulations of Provident Funds, etc. 37 45 7 50Loan Repayments and Net Borrowing 18 34 13 28
Total Funds 216 233 235 213
II Utilization of Funds
Capital Expenditure 99 127 195 285Changes in AssetsCash and Deposits 2 38 -4O 4Foreign Investments j 128 91 101 -62
Total Accountable Utilization 229 256 256 227Errors and Omissions +13 +23 +21 +14
Total Utilization 216 233 235 233
/ Generally at book value but in the case of the State Government, marketvalue adjusted for capital gains/16sses. In 1963 and 1964 some itemsare estimated.
Source,: Accounts of the State Government, public authorities, providentfunds and P. 0. Savings Bank.
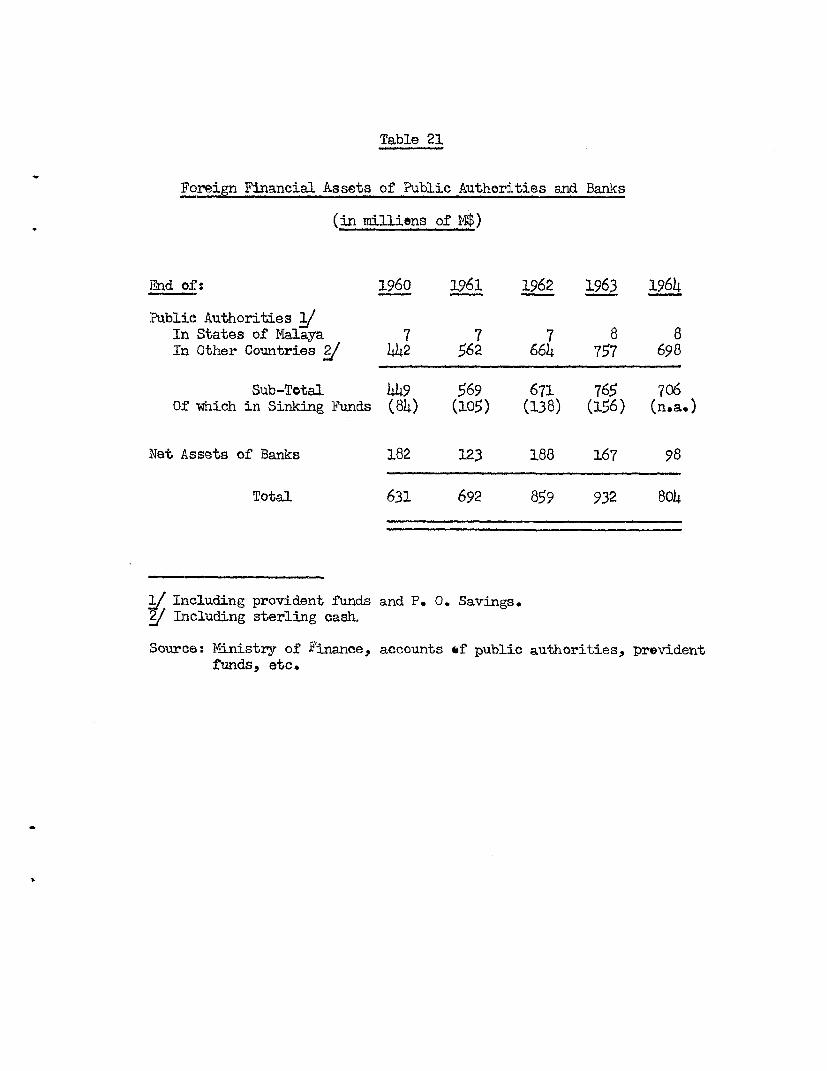
Table 21
Foreign Financial Assets of Public Authorities and Banks
(in milliens of M$)
D]nd of: 1960 1961 1962 1963 1964
'Public Authorities /In States of Malaya 7 7 7 8 8In Other Countries / 442 562 664 757 698
Sub-Total 449 569 671 765 706Of which in Sinking Funds (84) (105) (138) (156) (n.a.)
Net Assets of Banks 182 123 188 167 98
Total 631 692 859 932 804
M BIcluding provident funds and P. 0. Savings./ Including sterling cash.
Source: iMinistry of Finance, accounts of public authorities, providentfunds, etc.

Table 22
Commercial Banks - Assets and Liabilities
(in millions of 14$)
December 31 1960 1961 1962 1963 1964
I. Assets
1. Cash and money on call (N$) 55 50 54 63 572. Loans and Advances 2/ 60,4 645 752 810 8923. Foreign Balances Due / 339 325 379 346 3474. Investments 3
a) in Singapore 65 74 89 98 110b) in States of Malaya 10 10 25 23 106c) in Other Countries 137 116 113 108 100
5. Bills Receivable 101 131 101 113 1166. Other Assets v 287 327 314 329 354
II. 'Total Assets/Liabilities 1598 1678 1827 1890 2082
III. Liabilities
1. Domestica) Demand Deposits 386 367 418 443 424b) Fixed Deposits 304 351 415 438 484c) Savings Deposits 158 175 187 212 230
2. Foreign 5/ 304 328 329 310 455:3. Bills Payable 18 16 15 14 1614. Other Liabilities 6/ 428 441 463 473 473
To customers other than banks plus bills discounted and payable inSingapore.
g Balances with banks plus bills discounted and payable and loans andadvances outside Singapore.
1 Treasury bills, other government securities and other securities.1f Balances and loans and advances to Singapore banks plus other assetsincluding buildings and equipment.Balances due and borrowings from banks ex Singapore.
l/ Balances due and borrowings from Singapore banks plus other liabilitiesincluding capital and reserve funds.
Source: Department of Statistics.

Table 2 3
Currency Board Data on Singapore
Assets and Profit Sharing
1958 1959 1960 1961 1962 1963 1964
Assets (in millionM$) at rmarket prices(end of period) 1081 1240 1275 1307 1443 1489 1529
Share of Singapore in
prfits of CurrencyBoard (in $) 21.26 19.13 20.30 19.73 18.63 n.a. n.a.
Sources: Reports of the Commissioners of Currency, Malaya and British Borneo.

Table 24
Consumer Price Index
(April/May 1960 = 100)
Period Total Food Housing Clothing Misc.
December 1960 100.9 101.7 100.0 lO.6 100.0December 1961 100.8 100.9 100.5 99.6 100.9December 1962 101.7 102.4 101.3 99.5 101.0December 1963 105.3 109.0 102.0 100.2 101.4December 1964 105.7 106.7 105.4 100.7 105.1
1964 January 105.1 106.9 102.0 100.3 104.5February 105.5 107.8 102.0 100.1 104.4March 105.1 107.0 102.2 100.1 104.4April 103.7 104.3 102.2 100.1 104.3May 103.8 104.5 101.8 100.2 104.3June 103.5 103.9 101.8 100.1 104.3July 104.0 104.8 101.8 100.3 104.3August 105.7 107.8 103.1 100.2 104.4September 105.4 106.9 104.2 100.3 104.4October 104.7 105.5 104.6 100.3 104.3Novrember 104.7 105.0 105.4 100.6 104.5December 105.7 106.7 105.4 100.7 105.1
1965 January 105.9 107.2 105.4 101.3 104.9February 105.7 106.6 105.4 101.3 104.9March 104.9 105.4 105.0 100.8 104.8April 103.4 102.4 105.1 100.9 104.8May 104.3 104.1 105.1 100.8 104.8June 104.6 104.9 105.0 100.8 104.8July 104.0 103.6 105.0 100.2 104.9August 104.6 105.0 104.7 99.8 104.9
Source: Monthly Digest of Statistics.

m A~~~~~
M A A ~~~~s .. Y S I A~JO
c use''-'--o -
~ /-/orbor ______SINGAPOREAIISNLASNDA
\TH/AILAND~ ' 0 ie
BE~~~JANUARY 1966
IBRD 1760~~~~~~~~~~~~~~~~~~~~~~~~~~~~PINIPLROD