and Performing Arts Facilities - Wichita, Kansas of Wichita's Convention...City Council Workshop...
113
City Council Workshop September 12, 2017 Analysis of Wichita’s Convention Center and Performing Arts Facilities
Transcript of and Performing Arts Facilities - Wichita, Kansas of Wichita's Convention...City Council Workshop...
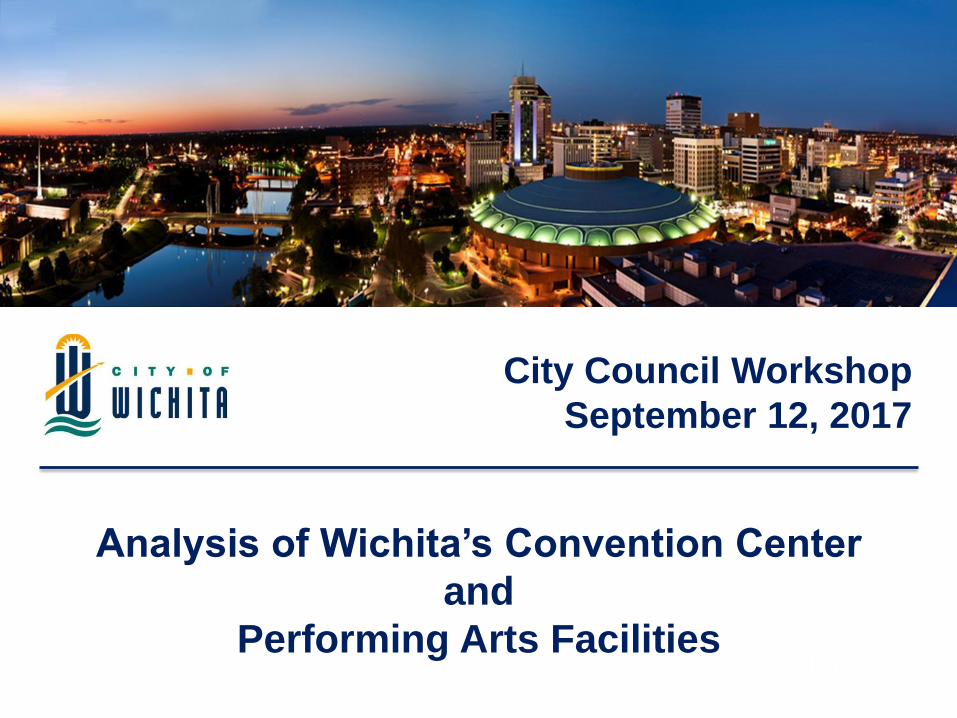
City Council Workshop
September 12, 2017
Analysis of Wichita’s Convention Center
and
Performing Arts Facilities

Research Information
Timeline of studies:
• Market and Economic Assessment of Wichita’s Convention Center Product November 2013 Conventions, Sports & Leisure (CSL)
- Visit Wichita Commissioned
• Century II Performing Arts & Convention Center Assessment May 2014 AMS & Fisher DachsAssociates (FDA)
- Arts Council, Music Theater of Wichita, Wichita Symphony
Orchestra Wichita Grand Opera Commissioned
2

Research Information
Timeline for studies:
• Century II Complex Renovation and Expansion Concept Design September 2014 Populous and GMLV
• Century II Complex Facility Assessment May 2016 Populous and GMLV and FDA
• Cost/Benefit Analysis of Wichita’s Performing Arts and Convention Center Product July 2016 AMS and CSL
• Funding and Delivery Options Analysis for the Century II Facility Expansion September 2017 ARUP
3

The History 4

CONVENTION
CENTER
5
“THE CURRENT CONVENTION
FACILITIES IN WICHITA
PUT THE COMMUNITY AT A
COMPETITIVE DISADVANTAGE”
BILL KRUEGER CS&L 2013 STUDY (ALSO FROM 2013
BILL KRUEGER PRESS RELEASE)
6

Number of critical deficiencies pertaining to
functionality, event logistics, space levels and
apportionment, aesthetics and marketability
to exhibitors/attendees.
• Critical exhibit space issues not being able to sub-
divide the large hall
• Critical issue with functionality and aesthetics
• Challenges associated with CII that serve to
significantly weaken its competitiveness in the
national convention and event marketplace
• The “pie slice” layout, apportionment and
configuration of event spaces in the original “round
building” are atypical—if not completely unique—in
the overall event industry
Current ChallengesConvention Center
Market and Economic assessment of Wichita’s convention center product November 6th 2013 CSL
7

City Benefits
Negative
Response
62%Positive
Response
38%
428 = extrapolated number
of events that represent
Wichita’s key national
convention market
opportunity
Specifically, using the 2,500 conventions and tradeshows targeted
through the MINT database, the survey positive response percentage,
and the weak link analysis, a hypothetical extrapolation would suggest
that, should new facilities be developed in Wichita, a market
opportunity exists relating to nearly 430 national events.
Market and Economic assessment of Wichita’s convention center product November 6th 2013 CSL
8
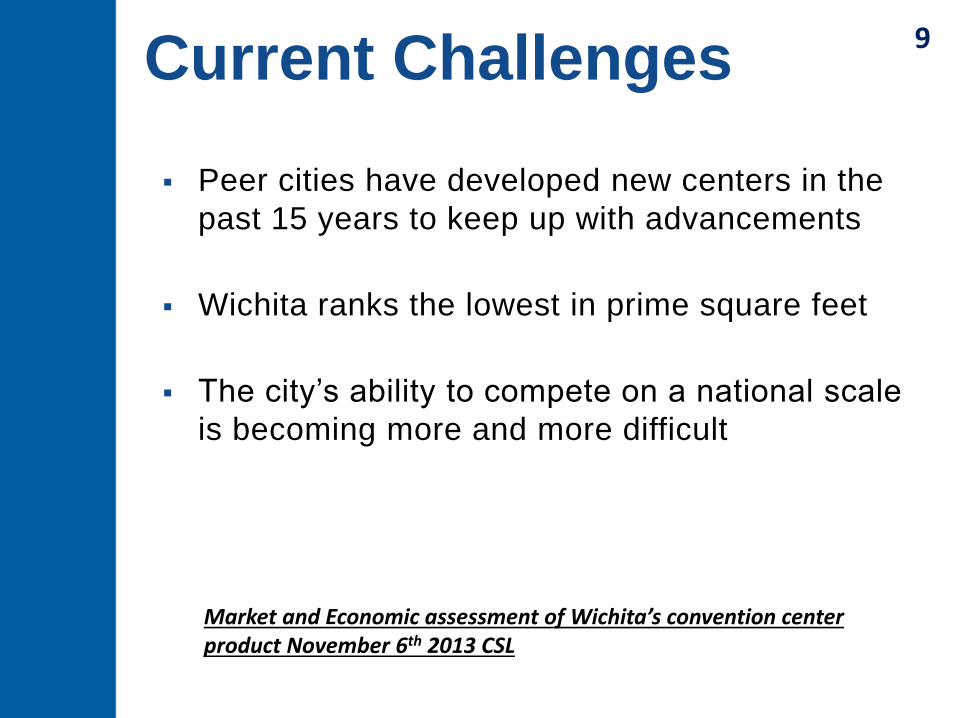
Peer cities have developed new centers in the
past 15 years to keep up with advancements
Wichita ranks the lowest in prime square feet
The city’s ability to compete on a national scale
is becoming more and more difficult
Current Challenges
Market and Economic assessment of Wichita’s convention center product November 6th 2013 CSL
9

The total ballroom and exhibition space in Wichita is not enough to make the city a competitive convention center destination on a national level.
Ballroom Space Exhibit Space
Convention Center
Market and Economic assessment of Wichita’s convention center product November 6th 2013 CSL
10

The ability to divide the larger space via movable air walls, with public access and
for each space, allowing simultaneous events and enhancing the marketability to
events needing a smaller space
Modern Characteristics
Market and Economic assessment of Wichita’s convention center product November 6th 2013 CSL
11

State-of-the-industry Convention Center Characteristics:
• Column-free, contiguous, concrete floor space.
• Ceiling heights in excess of 30 ft.
• A rectangular hall shape with a length to-width ratio that approximates 2:1.
• Sub divisibility of the space into several individual spaces via modern movable air walls, with public access and service access possible for each subdivided space. This importantly allows for the accommodation of concurrent events and enhances marketability to events with exhibitions of a size smaller than the entire available hall.
Convention Center
Market and Economic assessment of Wichita’s convention center product November 6th 2013 CSL
12

State-of-the-industry Convention Center Characteristics:
• Floor utility boxes on a 30-by-30-foot matrix.
• Significant pre-function space leading into the exhibit halls.
• Back of house service into the exhibit hall to allow for event set up without working through public spaces.
• Covered loading docks for exhibit halls separate from docks for other facility operating needs.
• State-of-the-industry capabilities with respect to wireless
internet, audiovisual, telecommunications, electrical, etc.
Convention Center
Market and Economic assessment of Wichita’s convention center product November 6th 2013 CSL
13
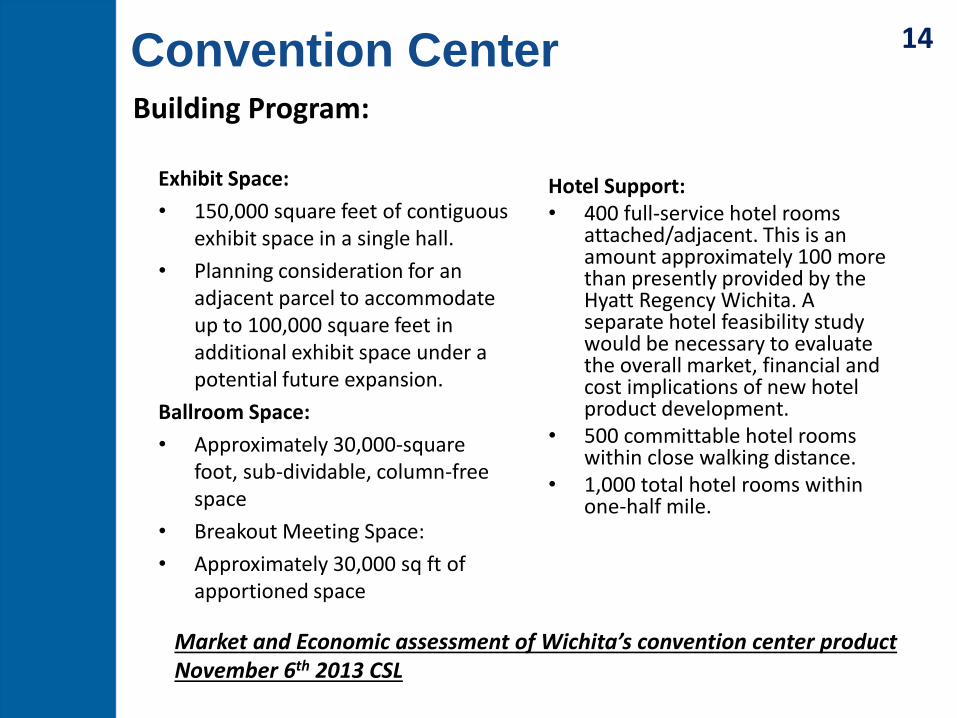
Building Program:
Exhibit Space:
• 150,000 square feet of contiguous exhibit space in a single hall.
• Planning consideration for an adjacent parcel to accommodate up to 100,000 square feet in additional exhibit space under a potential future expansion.
Ballroom Space:
• Approximately 30,000-square foot, sub-dividable, column-free space
• Breakout Meeting Space:
• Approximately 30,000 sq ft of apportioned space
Hotel Support: • 400 full-service hotel rooms
attached/adjacent. This is an amount approximately 100 more than presently provided by the Hyatt Regency Wichita. A separate hotel feasibility study would be necessary to evaluate the overall market, financial and cost implications of new hotel product development.
• 500 committable hotel rooms within close walking distance.
• 1,000 total hotel rooms within one-half mile.
Market and Economic assessment of Wichita’s convention center product November 6th 2013 CSL
Convention Center 14

PERFORMING
ARTS
15

Performing Arts Center
• Over 85% of respondents believe there is a need for new or renovated performing arts facilities in Wichita.
• The majority of respondents stated their utilization of Century II would increase if it met their needs.
• Wing space, stage size, sound bleed, and loading are some of the most needed areas of improvement in the current Century II facilities.
• Unmet needs include smaller flexible use performance and rehearsal spaces.
• 63% of current users would use CII more if it was upgraded to met their needs.
• 57% of potential users would use CII if it was upgraded to met their needs.
• Classical music, youth and family programming, and musical theatre are the most popular programs among current and potential users. There may be a need for space for festivals, film, and non-musical stage plays.
A survey was taken by potential and current users of CII.
Century II Performing Arts & Convention Center Assessment March 6th 2014 AMS & FDA
16

Current ChallengesPerforming Arts
Wichita’s arts organizations have learned how to adapt and adjust to some of the unique attributes of CII.The facility does not provide some functionality that is essential for long-term success.• Wing space• Stage size• Sound bleed • Loading docks• Number and condition of dressing rooms• New shell is needed• Too few fly lines • Number of rehearsal rooms • A/V Equipment • Union labor costs • Accessibility in theaters and other spaces
Century II Performing Arts & Convention Center Assessment March 6th 2014 AMS & FDA
17
Current ChallengesPerforming Arts
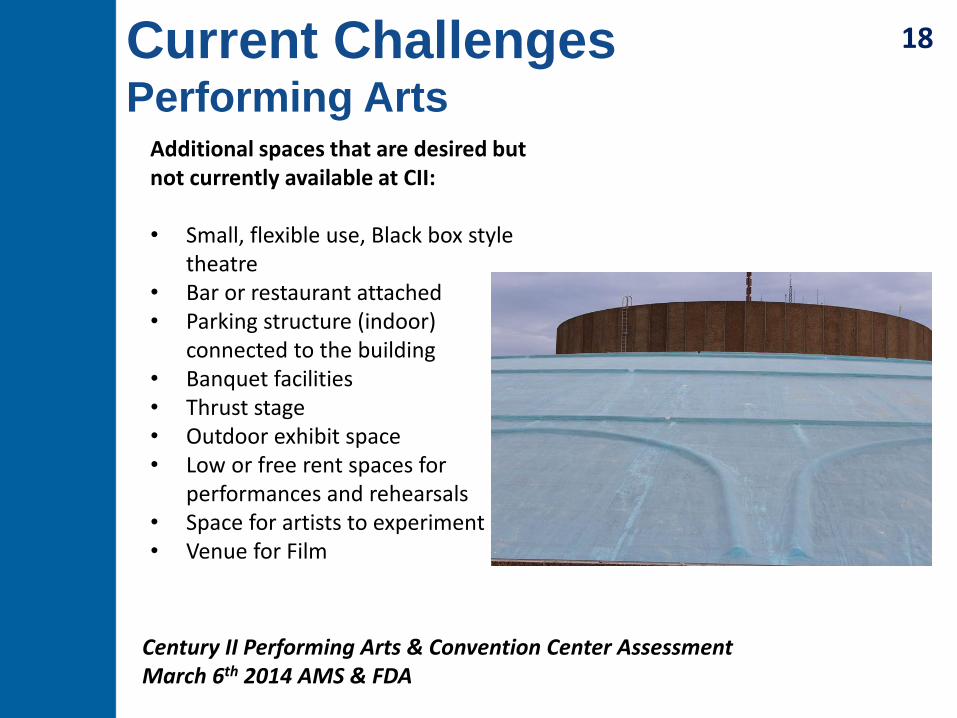
Additional spaces that are desired but not currently available at CII:
• Small, flexible use, Black box style theatre
• Bar or restaurant attached • Parking structure (indoor)
connected to the building • Banquet facilities • Thrust stage • Outdoor exhibit space • Low or free rent spaces for
performances and rehearsals • Space for artists to experiment • Venue for Film
Century II Performing Arts & Convention Center Assessment March 6th 2014 AMS & FDA
18

Performing Arts Center
• 2,200-seat Multipurpose Hall (lowest count acceptable for touring Broadway and MTW)
• Stage and backstage areas are sized for Broadway touring and MTW
• Trap room; included for MTW and/or Opera.
• Orchestra Pit: two sizes (Broadway, up to 35 musicians, and Opera, up to 45 musicians).
• Larger lobby – 15nsf per person
• Patron Lounge -- 100 standing; 60 sit down
• Multipurpose / Events room
– Sized for large music ensemble
– Receptions, dinners, small performance, rental opportunities
– Seats 200-240
– Located adjacent to public lobby and FOH support
– Not for black box theatre
• Catering warming rooms; not a full kitchen
• Rehearsal spaces
• Multi-tenant use; appropriate for both MTW & Symphony
• One large, two medium, one small rehearsal room
• Storage, including dedicated musical instrument
• Could be rented to outside groups
• Production spaces
• Scene shop, paint shop, costumes, props, tools, storage, offices
• Shops would be adjacent to stage and loading; not adjacent to public spaces
• Administration
• Offices for the PAC and current major tenants
Building Program:
Century II Performing Arts & Convention Center Assessment March 6th
2014 AMS & FDA
19

SCHEME 1
20

SCHEME 1$271.8 M
21

Meets ADA requirements
Keeps the current building in Wichita’s skyline
Brings spaces to base operation and safety standards through 2030
Keeps all operations in one space
PROS
CONS Does not add space or create ideal structure for
convention center
Does not add parking
Reduces the amount of space for the convention center
Would not bring performing arts and convention center spaces to national standards
22

23
SCHEME 2
24

SCHEME 2$349.5M
25

Keeps the current building in Wichita’s skyline
Adds additional space to the convention center
Adds additional parking
Performing Arts building would be completely new and up to national standards to support high-profile shows
PROS
CONS
Separates operations to support two buildings
Provides limited parking for new Performing Arts building
Does not allow for continuous convention center which limits marketability
The convention center would not be up to industry standards
26

27

SCHEME 3
28

SCHEME 3$491.7M
29

Completely redesigns both facilities to compete nationally
Keeps operations in one space
Adds integration with the Hyatt Hotel
Adds parking
Creates space for an urban park
Pays respect to current architecture
Furthers the plan outlined in Project Downtown: The Master Plan for Wichita
PROS
Removes the current building from Wichita’s skyline
Would have to be phased construction
CONS
30
31
SCHEME 4
32
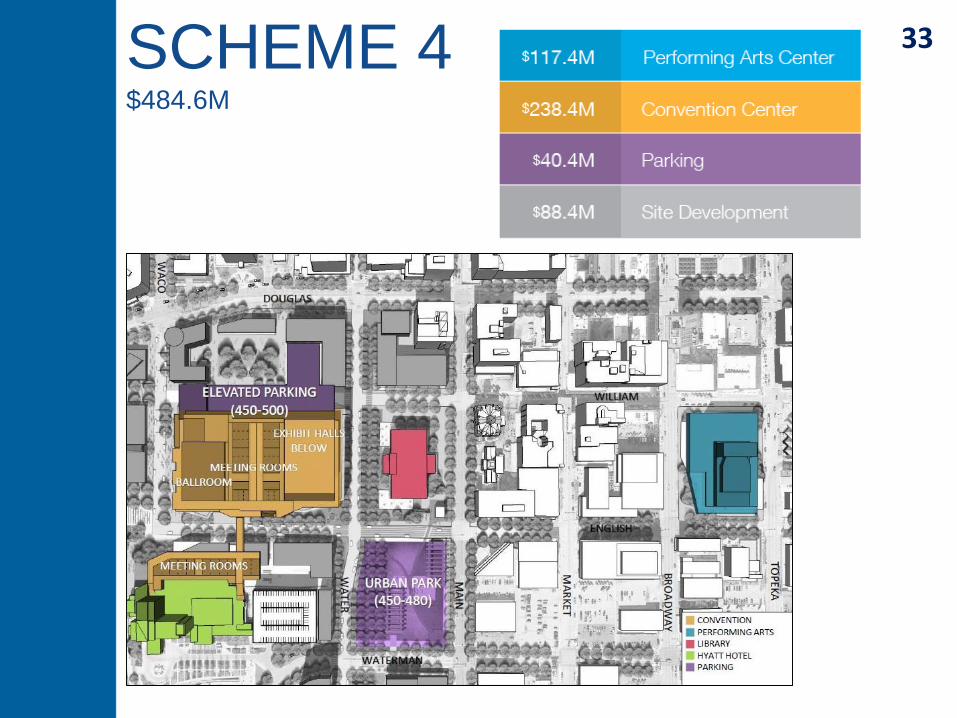
SCHEME 4$484.6M
33
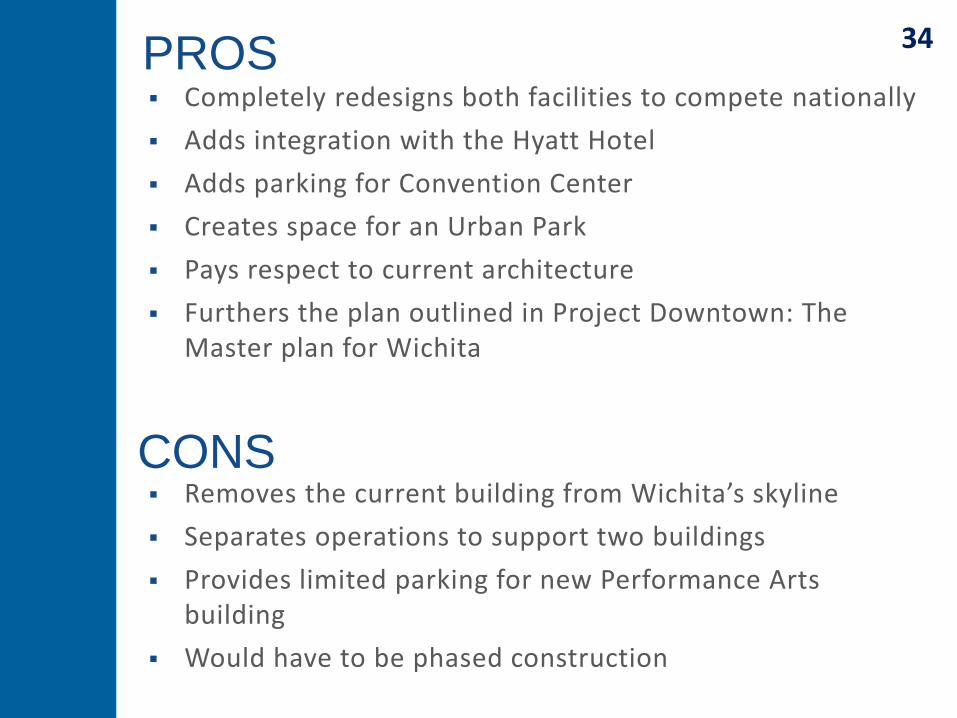
Completely redesigns both facilities to compete nationally
Adds integration with the Hyatt Hotel
Adds parking for Convention Center
Creates space for an Urban Park
Pays respect to current architecture
Furthers the plan outlined in Project Downtown: The Master plan for Wichita
PROS
CONS Removes the current building from Wichita’s skyline
Separates operations to support two buildings
Provides limited parking for new Performance Arts building
Would have to be phased construction
34
35

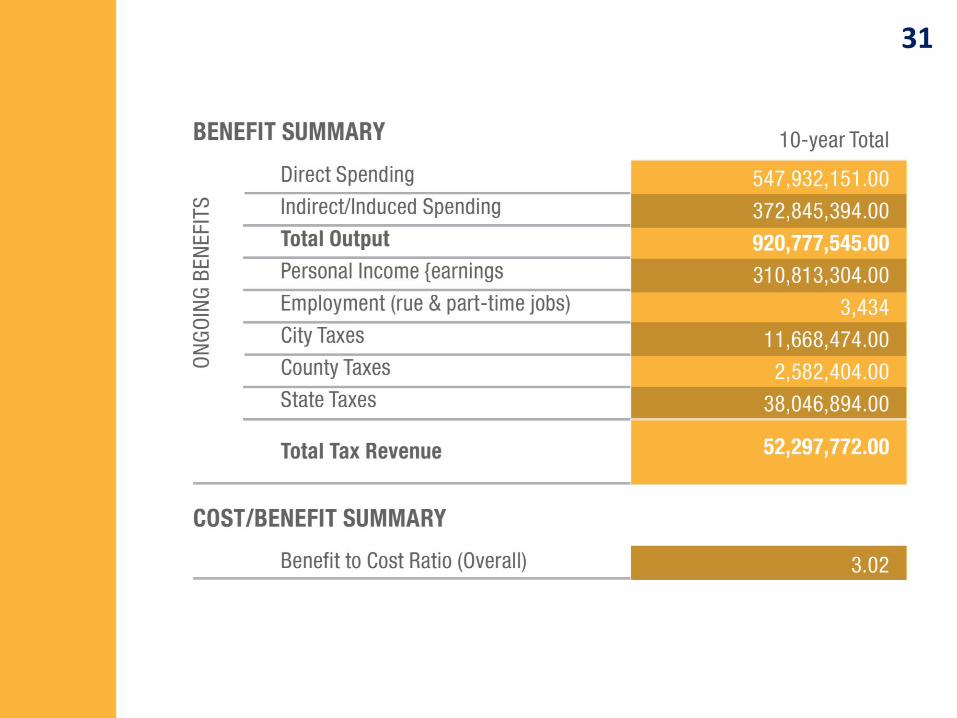
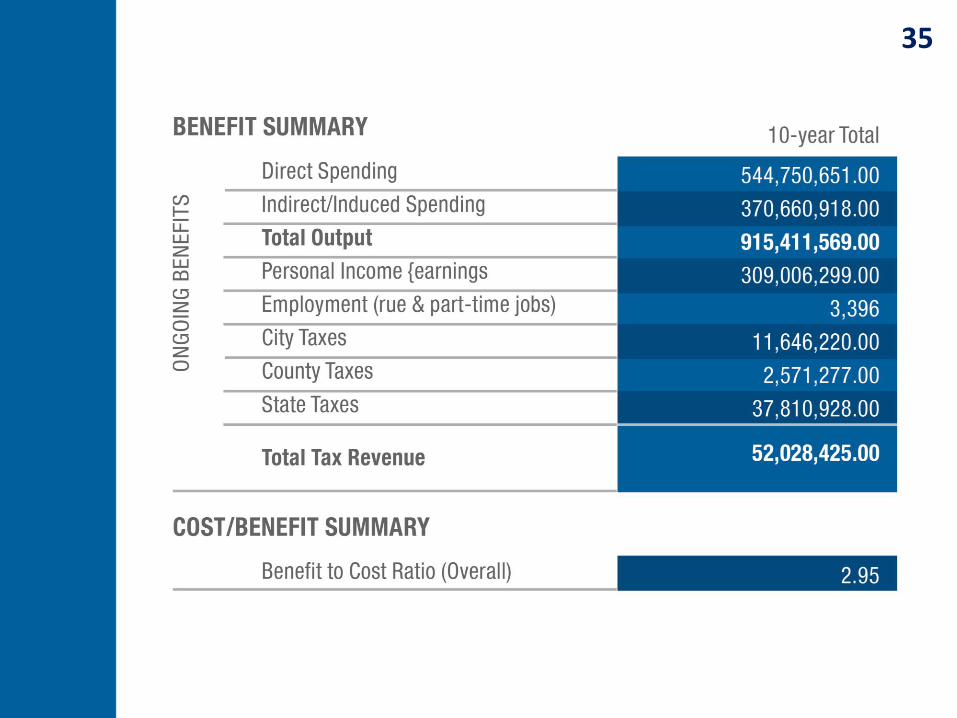
Benefits of New Building
It is estimated that a New Building would generate $57 million in
annual economic output (direct, indirect, and induced spending),
annually supporting 781 full and part-time jobs that generate
$19 million in personal income.
• This spending is estimated to generate approximately
$1.2 million in annual City and County tax revenue.
• Over a 10-year period, it is estimated that it would generate $921
million in cumulative economic output (direct, indirect, and
induced spending), supporting 3,434 full and part-time jobs (in a
peak year) that generate $311 million in cumulative personal
income.
• This spending is estimated to generate approximately
$14 million in net new City and County tax revenue.
Cost/benefit analysis of Wichita’s performing arts and convention center product April 20th 2016 AMS and CSL
36
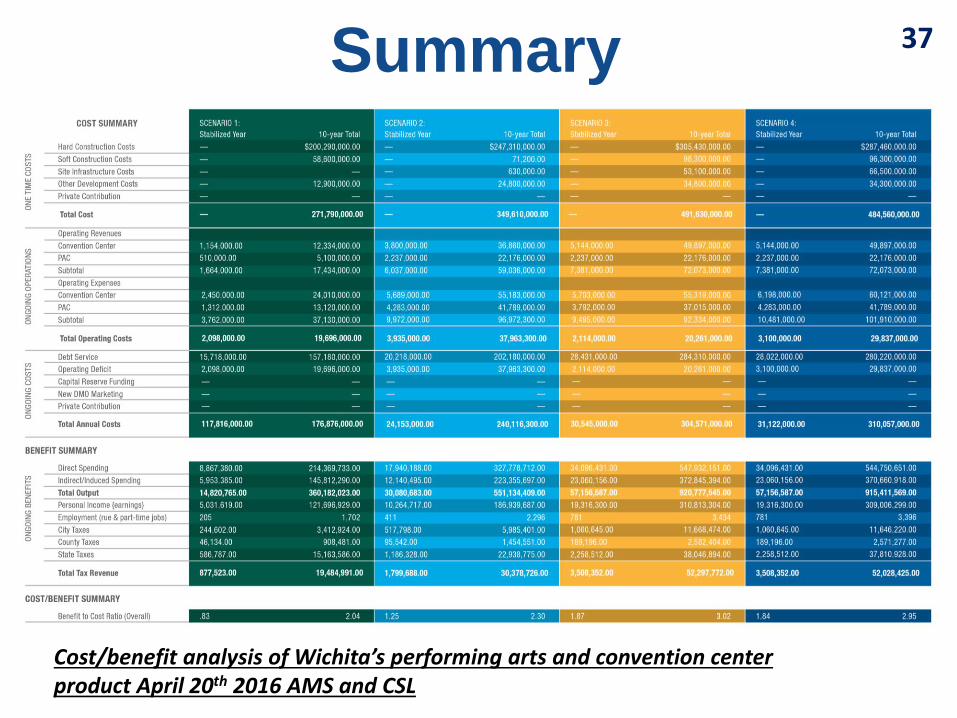
Summary
Cost/benefit analysis of Wichita’s performing arts and convention center product April 20th 2016 AMS and CSL
37

Current 5 Year Trend
0
50
100
150
200
250
300
350
2012 2013 2014 2015 2016
Annual Conventions, Performing Arts & In-TownEvents
Conventions Performing Arts In-Town Events
38
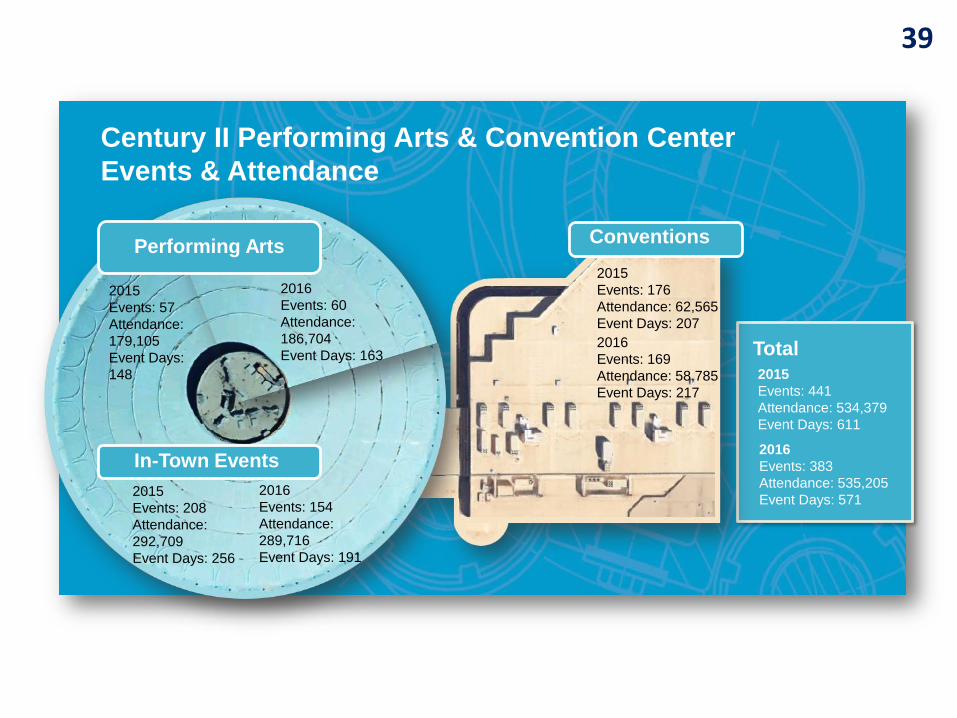
2015
Events: 441
Attendance: 534,379
Event Days: 611
2016
Events: 383
Attendance: 535,205
Event Days: 571
2015
Events: 57
Attendance:
179,105
Event Days:
148
2016
Events: 60
Attendance:
186,704
Event Days: 163
2015
Events: 208
Attendance:
292,709
Event Days: 256
2016
Events: 154
Attendance:
289,716
Event Days: 191
2015
Events: 176
Attendance: 62,565
Event Days: 207
2016
Events: 169
Attendance: 58,785
Event Days: 217
Century II Performing Arts & Convention Center
Events & Attendance
Total
Performing Arts
In-Town Events
Conventions
39

40

Funding and Delivery Options Analysis for the Century II Facility Expansion
Presentation by Ignacio Barandiaran, PrincipalSeptember 12, 2017
41

42
• Introduction to the Arup Team
• Background and Scope of the Study
• Summary of Key Findings
• Evaluation of City’s Net Cost to Procure the Project
• CII Operational Improvement Opportunities
• Options for Project’s Development Strategy
• Conclusions and Next Steps
Agenda 42

Introduction to the Arup Team
43

Our founder, Ove Arup
44

Over 13,000 people in more than 80 offices around the world
45

4
6
46 Sydney Opera House, LA Convention Center, Kauffman Center for the Arts, Tempe PAC
© T
imo
thy H
url
ey©
Jo
hn L
inden
© M
arce
l L
am
46
47
• Conventional Wisdom Corp provides strategic planning, marketing, operational and management consulting services on all aspects of convention, conference, exhibition and event centers worldwide
• Webb Management Services is North America's leading provider of development, planning and consulting services for arts and creative entities
• Newmark Grubb Zimmer is a full-service commercial real estate company headquartered in Kansas City, providing a range of services including real estate consulting services
Our Partners 47

Background and Scope of the Study
48

Background
• Continued commitment to revitalize downtown Wichita
• Over $1 billion in public and private investments in downtown in the past 10 years
• Century II (CII) is a critical part of the City’s revitalization efforts
• CII’s stagnating attendance and role as economic engine need to be addressed
• Physical and operational challenges
Annual Visitors to CII, INTRUST Arena, & Orpheum (2012-2016)
Nu
mb
er o
f V
isit
ors
(an
nu
al)
49
Scope of this Study
1) Assess City’s net cost to procure two design Concepts under
different delivery methods and considering alternative funding
sources
2) Identify and evaluate opportunities to improve CII’s
operational performance
3) Provide recommendations on Project development strategy
50

2016 Design Concepts Evaluated
Design Concept 1 Design Concept 3
• Extensive renovation
• Maintain existing layout and blue dome building
• Remain at current site
• Would improve operational and deferred
maintenance issues, but still not on par with
industry
• Completely new facility
• Remain at current site
• One integrated facility that meets industry
standards
• New meeting rooms, ballrooms, exhibition halls,
etc
Estimated Cost
$272 million
Estimated Cost
$492 million
Source: AMS & CSL report dated July 2016
51

Summary of Key Findings
52

53
• Concept 1 procurement as P3 is not viable
• Delivery of the 2016 design Concepts 1 and 3 plans for CII would
require a substantial new tax revenue commitment over 30 years:
- Concept 1 – renovation, DBB delivery: $27m/year
- Concept 3 – new build, P3 delivery: $42m/year
• Joint real estate development opportunities can generate up to $30m in
up-front funding and can create beneficial synergies for CII
Summary of Key Findings 53

54
• Operational improvements to substantially reduce or eliminate current
operating deficits are feasible and can generate up to an additional
$55m in up-front funding
• Without new tax revenues, a market-driven phased development
strategy with up to $85m in up-front funding is feasible:
- Relocate PAC
- Repurpose or demolish the blue dome
- Partnership with private developer to expand and operate Bob Brown Hall
Summary of Key Findings 54

1) Evaluation of City’s Net Cost to Deliver Concepts 1 and 3
55
Method for the Analysis
1. Assess suitability of different delivery methods
2. Estimate alternative funding sources
3. Estimate Net City Payment
56

Delivery Method and Risk Allocation
Key comparison question:
Does transferring risk to the private sector yield greater cost benefits with a P3
delivery method than with a traditional Design-Bid-Build (DBB) procurement?
57
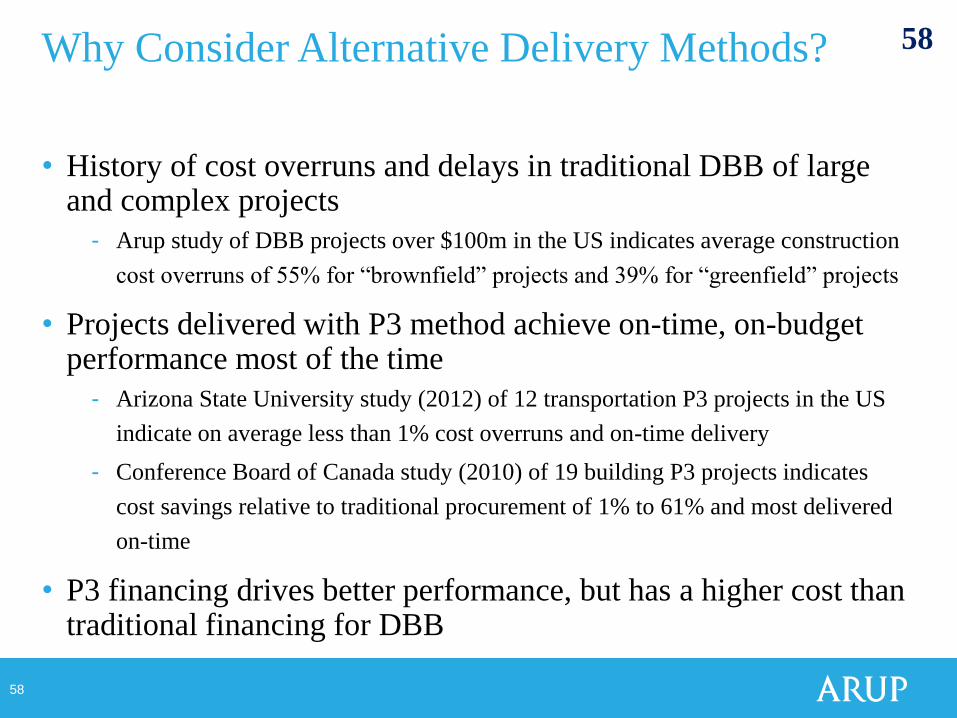
58
• History of cost overruns and delays in traditional DBB of large and complex projects
- Arup study of DBB projects over $100m in the US indicates average construction
cost overruns of 55% for “brownfield” projects and 39% for “greenfield” projects
• Projects delivered with P3 method achieve on-time, on-budget performance most of the time
- Arizona State University study (2012) of 12 transportation P3 projects in the US
indicate on average less than 1% cost overruns and on-time delivery
- Conference Board of Canada study (2010) of 19 building P3 projects indicates
cost savings relative to traditional procurement of 1% to 61% and most delivered
on-time
• P3 financing drives better performance, but has a higher cost than traditional financing for DBB
Why Consider Alternative Delivery Methods? 58

Risk Sharing: DBB delivery method
SHAREDDesign
Changes in Scope
Property rights
Enviro. & Historical
Preservation
Contractor Failure
Long term O&M
Financing
Cost overrun
Quality
Timely
Completion
Site Construction
PUBLIC PRIVATE
59

Risk Sharing: P3 delivery method
PUBLIC PRIVATE
Changes in Scope
Property rightsEnviro. &
Historical
Preservation
Design
Timely Completion
Cost overrun
Site Construction
Contractor Failures
Long term O&M
Quality
Financing
SHARED
60

Summary of Delivery Method Assessment
Concept 1 (renovation) Concept 3 (new build)
61
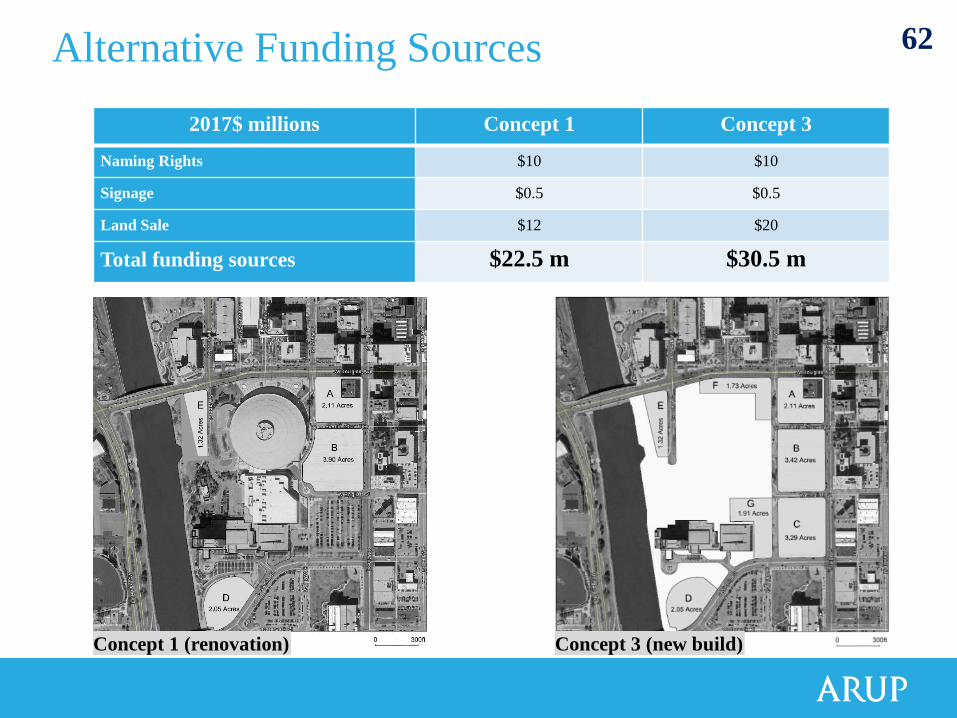
Alternative Funding Sources
2017$ millions Concept 1 Concept 3
Naming Rights $10 $10
Signage $0.5 $0.5
Land Sale $12 $20
Total funding sources $22.5 m $30.5 m
Concept 1 (renovation) Concept 3 (new build)
62

Financial Analysis Results
• NCP’s over thirty years range from $27 m to $45 m depending on the Concept and
delivery method
• Alternative revenues considered reduce the NCP’s, but the burden on the City’s general
fund for large projects such as Concept 1 or 3 would be substantial
• P3 delivery for new-build project (Concept 3) generates cost savings of ~$3m per year
Construction Phase (2017$ millions) Concept 1 Concept 3
DBB DBB P3
Net City Payment (NCP), per year $27 m $45 m $42 m
63
64
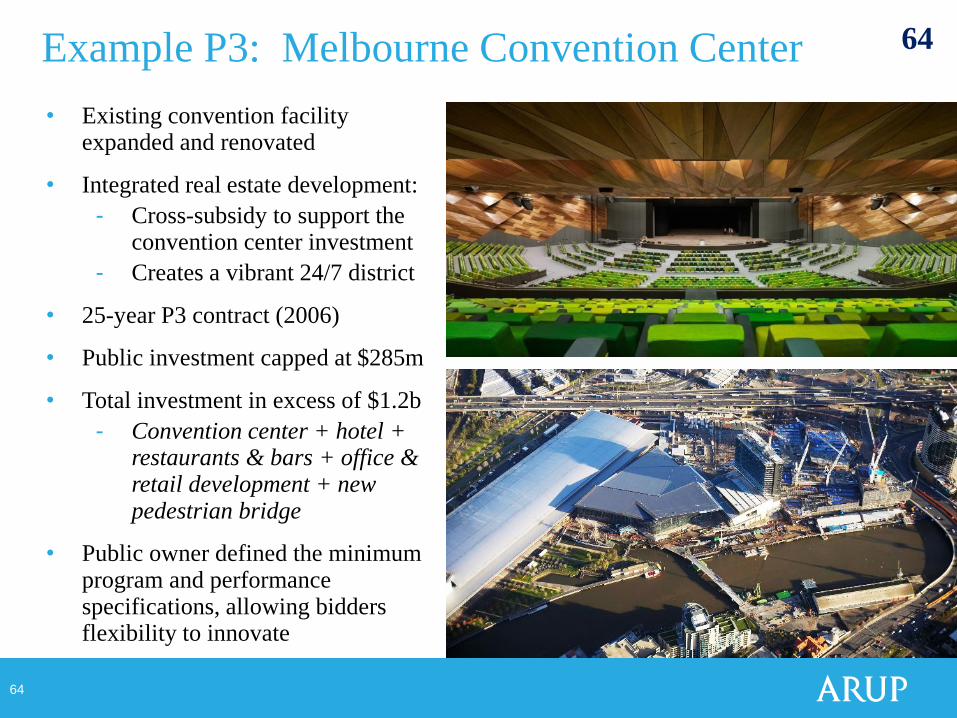
• Existing convention facility expanded and renovated
• Integrated real estate development:
- Cross-subsidy to support the convention center investment
- Creates a vibrant 24/7 district
• 25-year P3 contract (2006)
• Public investment capped at $285m
• Total investment in excess of $1.2b
- Convention center + hotel + restaurants & bars + office & retail development + new pedestrian bridge
• Public owner defined the minimum program and performance specifications, allowing bidders flexibility to innovate
Example P3: Melbourne Convention Center 64

2) Operational improvement opportunities for CII
65

Operations Review
Key Challenges• CII has physical limitations: inefficient layout, deficiencies in building systems
• Lack of human resources
• Key revenue sources are limited or not available
Resulting in• Declining/ stagnating attendance
• CII has been running an operational deficit since at least 1999
Nu
mb
er o
f V
isit
ors
(an
nu
al)
CII Visitors by event type (2012-2016)
66

Opportunities for Operational Improvement
Overall Project• Separate the PAC and the CC operations: each would benefit from being
operated separately with specialized expertise and tailored performance metrics
Convention Center• Broaden Governance Entity: Creation of a larger city-wide or county-wide entity
to manage and coordinate all public assembly, events, and entertainment venues.
Successful examples include:
• Metropolitan Pier & Exposition Authority (MEPA); Chicago, IL
• Cuyahoga County Convention Facilities Development Corporation
(CCCFDC); Cleveland, OH
• Managing Multiple Facilities: Operations of similar venues to gain economies of
scale and achieve better and more coordinated marketing and programming
• Management structure: Simplified structure with dedicated departments aligned
with the way that event planner and users interact with CII
• Renegotiate Food and Beverage Contract: with an expansion of Bob Brown
Expo Hall there may be an opportunity to improve F&B revenues
67

Opportunities for Operational Improvement
Case Study: Five Sullivan Brother Convention Center,
Waterloo, Iowa
• Example of how municipalities are seeking to attract private investment to turn
public facilities from operating deficits to enhanced economic development assets
• City Council of Waterloo, Iowa approved in July 2017 the sale of the Five Sullivan
Brothers Convention Center to Omaha, Nebraska-based Leslie Hospitality
• Waterloo’s goal was to address
deferred maintenance, eliminate
operational deficits, and to improve
marketability to drive visitors and
their associated spending
• Private investment totaling $20m in
the convention center and adjacent
hotel in exchange for a package of
tax incentives
Source: Leslie Hospitality
68

Opportunities for Operational Improvement
Performing Arts Center• Bring in a third-party Operator: contracting operations of the facility to a third
party:
• Allows the facility to more effectively compete for programming and rentals
• Allows Arts and Cultural Services to better maximize cultural development
• Could require operator to make capital improvements and increase
programming
• Could include contract clause to provide preferential access to accommodate
local arts groups
• Develop complementary revenue-generating uses: as part of a broader
renovation project, develop ancillary pre-function and retail/commercial spaces
69
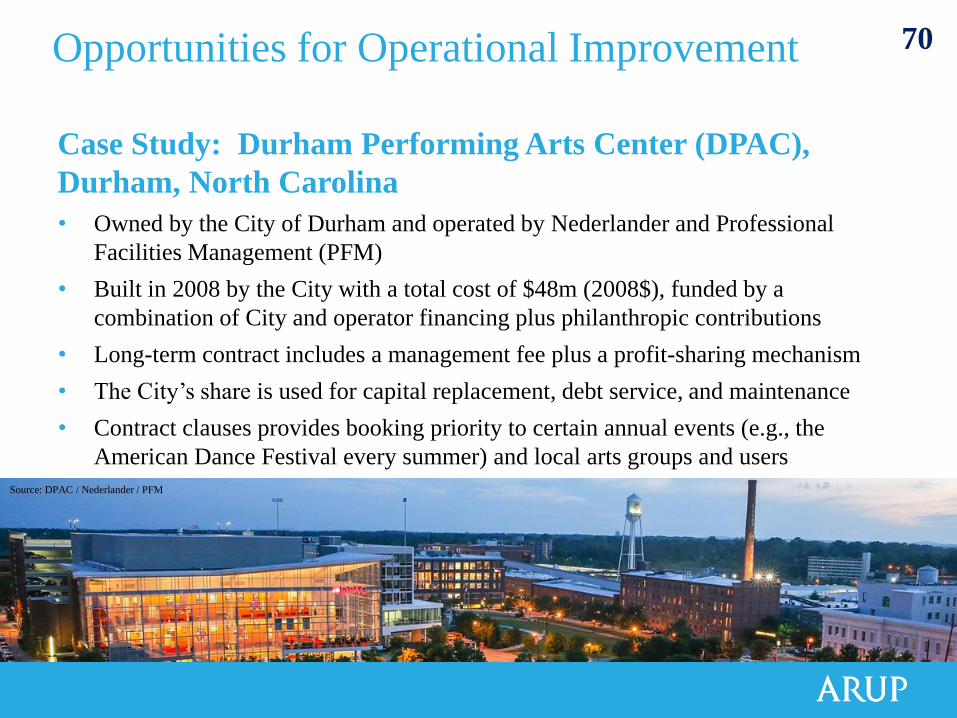
Opportunities for Operational Improvement
Case Study: Durham Performing Arts Center (DPAC),
Durham, North Carolina
• Owned by the City of Durham and operated by Nederlander and Professional
Facilities Management (PFM)
• Built in 2008 by the City with a total cost of $48m (2008$), funded by a
combination of City and operator financing plus philanthropic contributions
• Long-term contract includes a management fee plus a profit-sharing mechanism
• The City’s share is used for capital replacement, debt service, and maintenance
• Contract clauses provides booking priority to certain annual events (e.g., the
American Dance Festival every summer) and local arts groups and users
Source: DPAC / Nederlander / PFM
70

71
• Current deficit of ~$1.8m/year could be significantly reduced or even eliminated with a market-driven strategy focusing on:
- Separating PAC and CC management
- Broadening governance of the CC and improving management structure
- Private / third-party marketing and operations
- Enhancements from capital investments (renovation and expansion project)
• City staff have indicated that eliminating this deficit could generate one-time, up-front CIP funding of up to ~$55m to support construction costs
Operating Savings Implications for Capital Project71

3) Options for CII’s development strategy
72
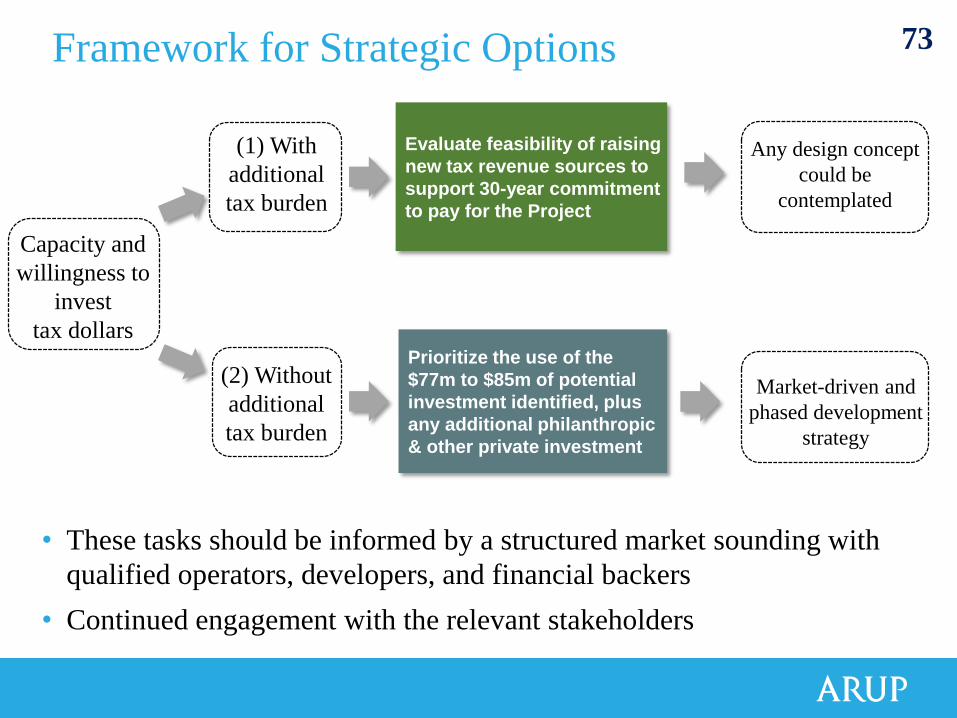
Framework for Strategic Options
Capacity and
willingness to
invest
tax dollars
(2) Without
additional
tax burden
(1) With
additional
tax burden
Evaluate feasibility of raising
new tax revenue sources to
support 30-year commitment
to pay for the Project
Prioritize the use of the
$77m to $85m of potential
investment identified, plus
any additional philanthropic
& other private investment
Any design concept
could be
contemplated
Market-driven and
phased development
strategy
• These tasks should be informed by a structured market sounding with
qualified operators, developers, and financial backers
• Continued engagement with the relevant stakeholders
73
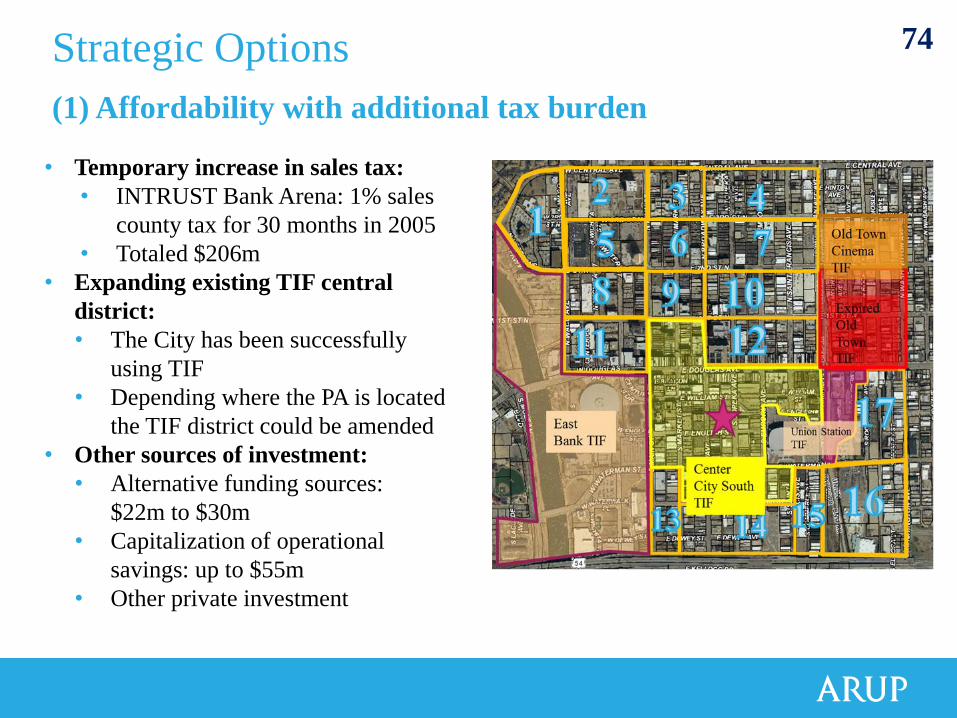
Strategic Options
• Temporary increase in sales tax:
• INTRUST Bank Arena: 1% sales
county tax for 30 months in 2005
• Totaled $206m
• Expanding existing TIF central
district:
• The City has been successfully
using TIF
• Depending where the PA is located
the TIF district could be amended
• Other sources of investment:
• Alternative funding sources:
$22m to $30m
• Capitalization of operational
savings: up to $55m
• Other private investment
(1) Affordability with additional tax burden
74
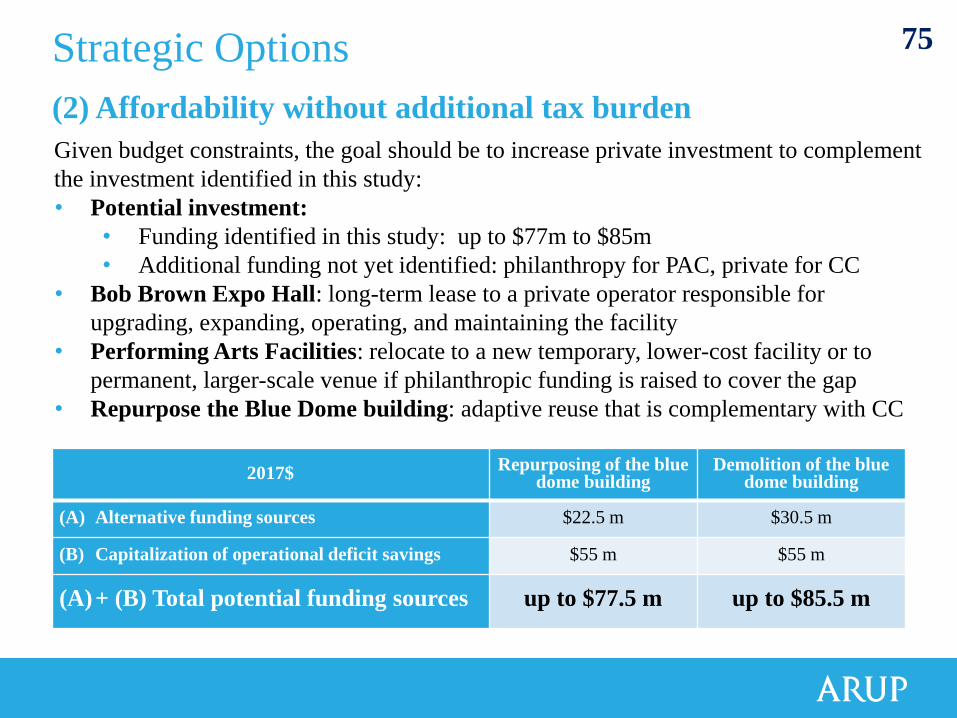
Strategic Options
Given budget constraints, the goal should be to increase private investment to complement
the investment identified in this study:
• Potential investment:
• Funding identified in this study: up to $77m to $85m
• Additional funding not yet identified: philanthropy for PAC, private for CC
• Bob Brown Expo Hall: long-term lease to a private operator responsible for
upgrading, expanding, operating, and maintaining the facility
• Performing Arts Facilities: relocate to a new temporary, lower-cost facility or to
permanent, larger-scale venue if philanthropic funding is raised to cover the gap
• Repurpose the Blue Dome building: adaptive reuse that is complementary with CC
(2) Affordability without additional tax burden
2017$ Repurposing of the blue
dome building Demolition of the blue
dome building
(A) Alternative funding sources $22.5 m $30.5 m
(B) Capitalization of operational deficit savings $55 m $55 m
(A)+ (B) Total potential funding sources up to $77.5 m up to $85.5 m
75

Strategic Options
21 Acres
CC expansion
9 Acres
Repurposing of the blue dome scenario
• Phased program for a new PAC
• Adaptive re-use of the blue dome building
• Bob Brown Hall improved and privately
operated
• 9 acres of land for redevelopment
• Affordability without CII operational
savings: $22 million
• Affordability with CII operational savings:
$77 million
Demolition of the blue dome scenario
• Phased program for a new PAC
• Bob Brown Hall improved and privately
operated
• 4 acres reserved for CC expansion
• 21 acres of land for redevelopment
• Consider appropriate forms of P3 delivery
• Affordability without CII operational
savings: $30 million
• Affordability with CII operational savings:
$85 million
(2) Scenarios for affordability without additional tax burden
76

Container Globe, multiple locations
Illustrative Scenarios: facilities less than $20M
The Container Globe
77

National Theatre Shed, London, UKNational Theatre Shed, London, UK
Illustrative Scenarios: facilities less than $20M 78
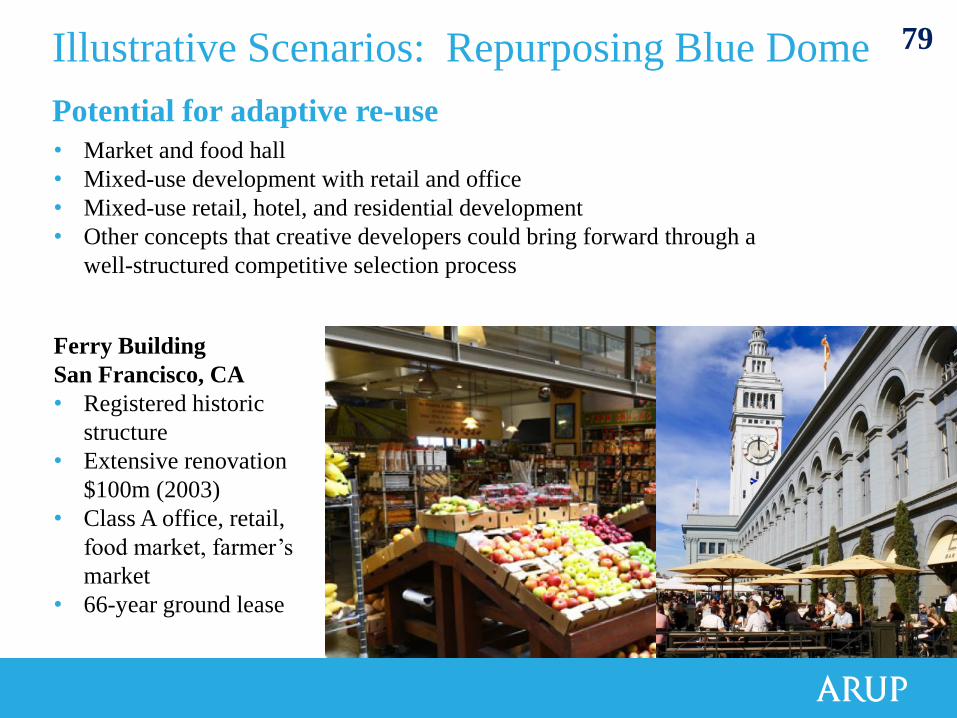
Illustrative Scenarios: Repurposing Blue Dome
• Market and food hall
• Mixed-use development with retail and office
• Mixed-use retail, hotel, and residential development
• Other concepts that creative developers could bring forward through a
well-structured competitive selection process
Potential for adaptive re-use
Ferry Building
San Francisco, CA
• Registered historic
structure
• Extensive renovation
$100m (2003)
• Class A office, retail,
food market, farmer’s
market
• 66-year ground lease
79

Illustrative Scenarios: Repurposing Blue Dome
Palace of Fine Arts
San Francisco, CA
• Competitive procurement process
resulting in 7 proposals
• Registered historic structure
• Preferred proposal extensive renovation
$120m (2017)
• Preserves existing theater, creates a new
“STEAM” museum, and a new 60,000
sq.ft. retail and food hall
• Self-sustaining financial plan, no subsidy
or investment from the City required
• Uses mix of state historic preservation tax
credits, philanthropic contributions, and
private financing for the construction
Source: Skidmore Owings Merrill / SFMAP Consortium
Potential for adaptive re-use
80

Conclusions and Next Steps
81

82
• Alternative funding streams can generate up to $30m but are not
sufficient to meaningfully reduce the new tax revenue commitment that
would be needed to build either Concepts 1 or 3
• Changes to governance, management, and operations can position the
CC and the PAC to better serve Wichita and better support major
capital improvements
• Joint real estate development plus operational improvement
opportunities can generate up to $77m to $85m in investment for
much-needed upgrades to CII
• This creates a once-in-a-generation opportunity to re-envision CII
without the need for substantial new tax revenue commitments while
also attracting additional private investment
Conclusions 82

83
• Initiate a process to consider alternative governance and management
models for both the CC and PAC with the goal of improving their
operations and marketing
• Conduct a market sounding of qualified CC and PAC operators &
developers gauge interest in:
- Bob Brown Expo Hall: long-term leasing options including making investments
in capital improvements and expansion
- Performing Arts Center: management of the PAC to improve programming and
lower costs, in the context of the capital improvement project
- Blue Dome building: adaptive re-use concepts, including keeping PAC in it
• Engage with the key stakeholders to provide guidance to the City
• Based on the above develop a comprehensive business plan, including:
- Prioritized Project definition, facility program, funding plan, and delivery method
Recommendations for Next Steps 83

Q&A
84

Preliminary Recommendations for
Convention Center
and
Performing Arts Facility
85
Bob Brown
Convention Center
86

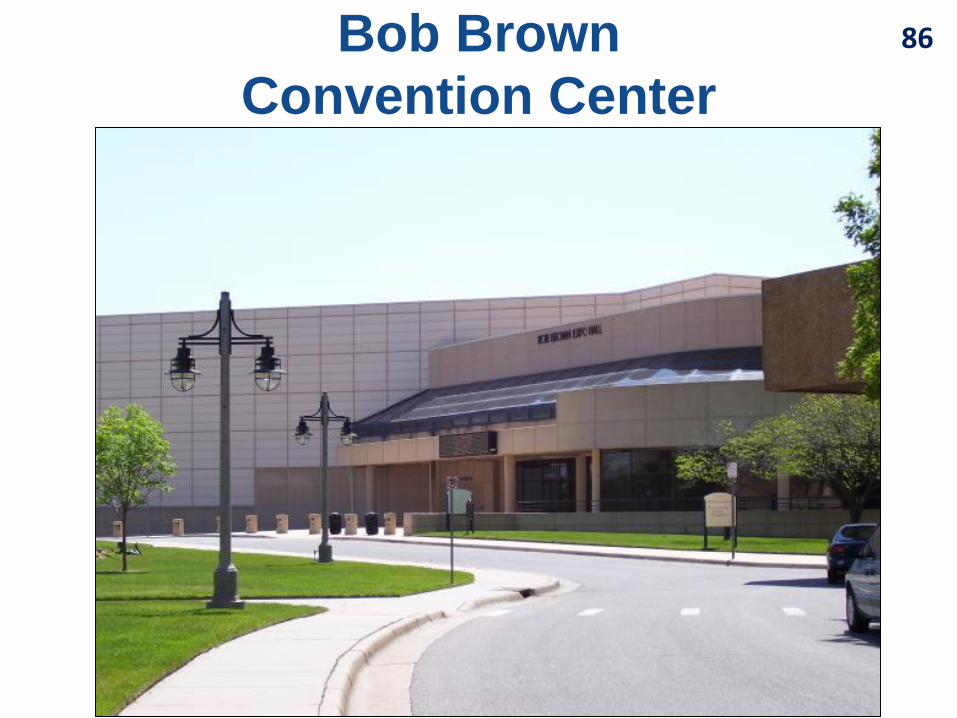
Bob Brown Convention Center
• Expand the Bob Brown facility to better accommodate current and future needs for conventions and consumer shows.
– Initial goal would be to supply 150,000 square feet of prime space, with additional meeting, banquet and support space.
– To control construction costs, Construction Manager at Risk and Design/Build/Operate delivery methods will be compared to the traditional Design/Bid/Build method.
– Explore long-term leasing option
87

Bob Brown Convention Center
• Identify a new model for the marketing and operations of the convention center.
• Options will include:
1. Contract for private management
2. Long-term lease
3. City/County partnership for joint management of the convention center and Intrust Bank Arena
4. Contract with Visit Wichita for marketing and management services
88

Bob Brown Convention Center
• Determine if the existing Central Library building can be incorporated into the expansion project, perhaps meeting some of the auxiliary space requirements for the convention center.
89
Bob Brown Convention Center
• Develop a funding plan and construction schedule for the expansion project.
– Planning effort to include City Council adoption of long term CIP and debt goals and analysis of the Transient Guest Tax rate.
90

CII Performing Arts Facility• Preserve the current CII facility as a
home for the performing arts.
91

CII Performing Arts Facility
• Form an advisory committee to guide the restoration and remodeling process for the facility.
92
CII Performing Arts Facility• Identify compatible uses for the non-
theater spaces to optimize the value of the remodeled building.
• Possible reuses could include:
1. Cultural arts spaces
2. Associated retail and office spaces
• Reuse projects to study could include the Ferry Building and Palace of Fine Arts in San Francisco.
93

Palace of Fine ArtsSan Francisco
94
Palace of Fine ArtsSan Francisco
95
• Theatre renovation
• New museum
• Retail and food hall
• Historic preservation tax credits, philanthropic contributors, private financing
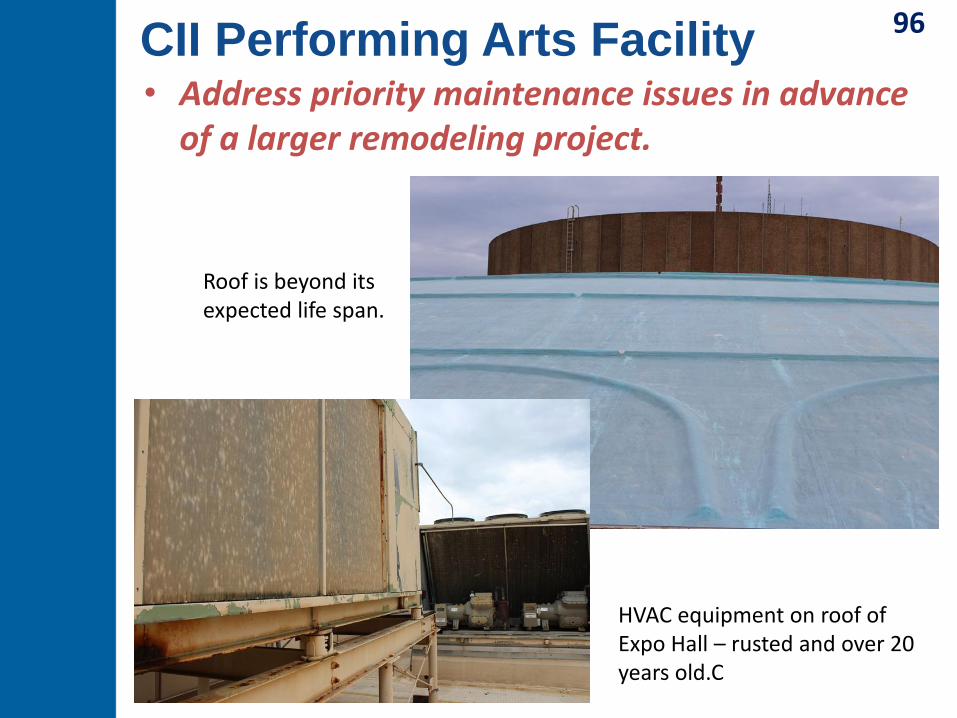
CII Performing Arts Facility• Address priority maintenance issues in advance
of a larger remodeling project.
Roof is beyond its expected life span.
HVAC equipment on roof of Expo Hall – rusted and over 20 years old.C
96
CII Performing Arts Facility
• Develop a long term funding plan to implement the recommendations of the advisory committee.
– The planning effort will include an analysis of alternative funding sources, including a temporary sales tax.
97

Associated Issues
• Negotiate naming rights for the convention center and CII buildings and interior spaces to partially offset the project construction costs.
• Competitively sell surplus City-owned property adjacent to the convention center and CII buildings after the reconstruction plans are finalized.
98

Community Engagement
• Initiate a community engagement process to obtain feedback on preliminary recommendations for performing arts/renovation of CII.
– Process will be led by an independent third party to ensure neutral framing of the issue.
– Begin in fourth quarter of 2017.
99

QUESTIONS?
100

Additional Supporting Information
Examples of performing arts venues with varying ranges of size, type & cost
101

Performing Arts Pavilions Construction cost < $10M
102
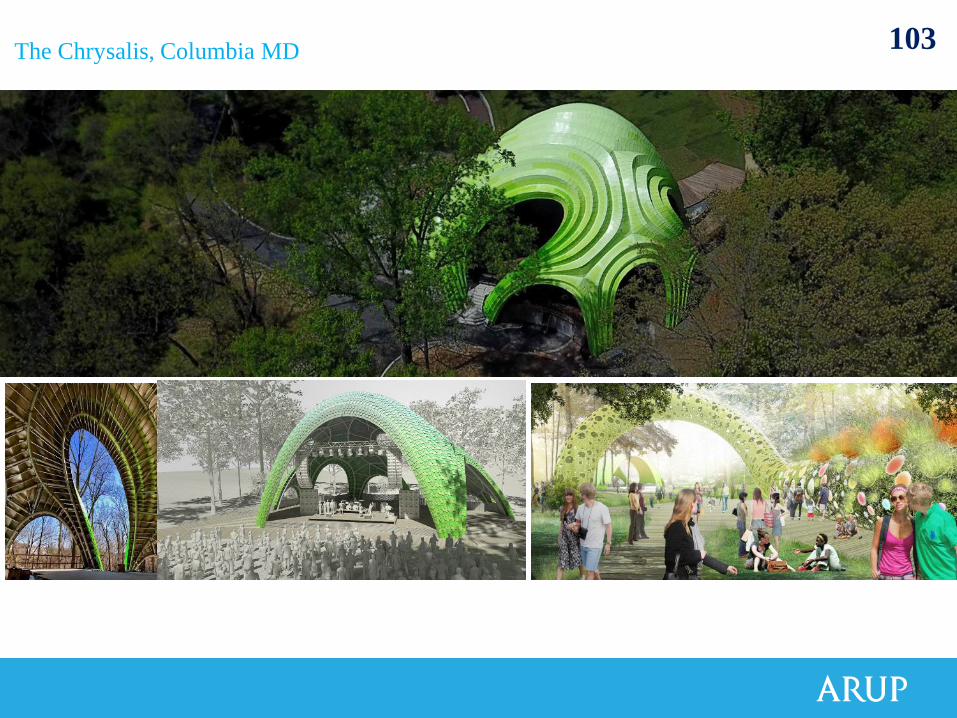
The Chrysalis, Columbia MD
The Chrysalis, Columbia MD 103

Lebauer Park, Greensboro NC
Lebauer Park, Greensboro NC 104

OMS, Winnipeg MB, Canada
OMS, Winnipeg MB, Canada 105

Low-cost & Temporary PA VenuesConstruction cost ~$10m to $20m
106

Container Globe, multiple locations
The Container Globe: Michigan Station, NJ; Wellington, NZ; 107
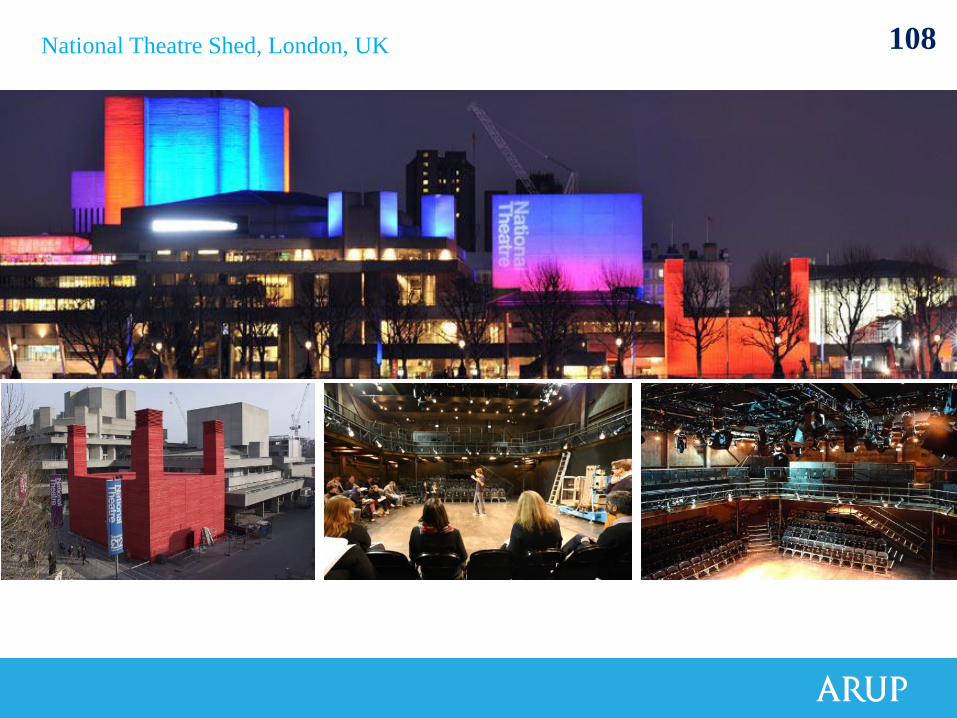
National Theatre Shed, London, UK
National Theatre Shed, London, UK 108
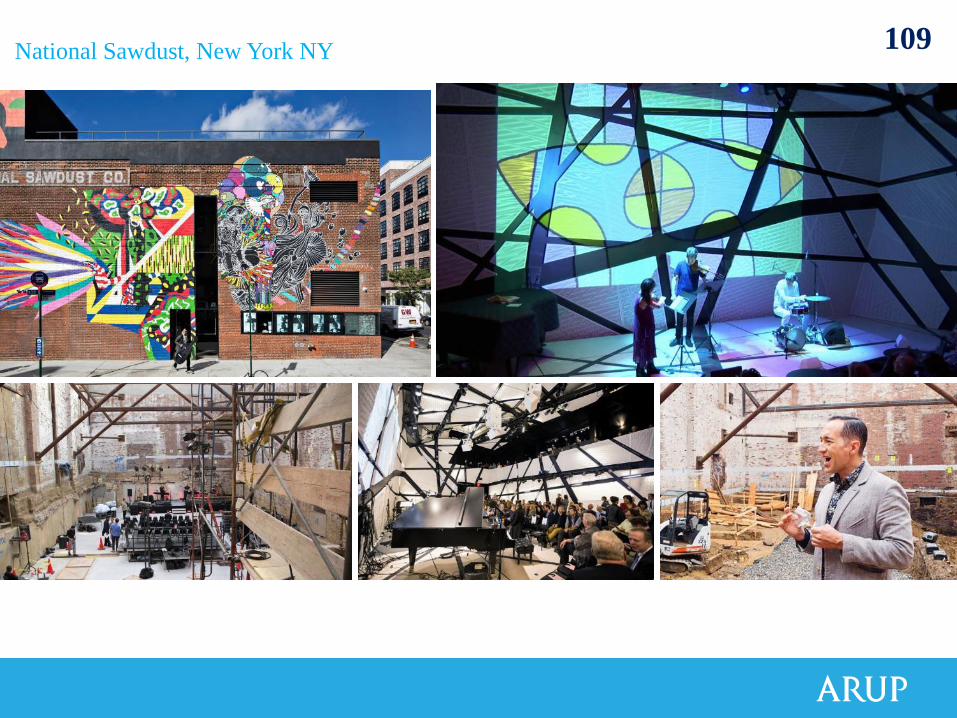
National Sawdust, New York NY
National Sawdust, New York NY 109

(Temporary) RSC Courtyard Theatre, Stratford-upon-Avon, UK
(Temporary) RSC Courtyard Theatre, Stratford-upon-Avon, UK 110

Large-scale & Permanent PA VenuesConstruction cost ~$60m to $100m
111

Fox Cities Performing Arts Center, Appleton, WI 112

Lurther F. Carson Center, Paducah, KY 113