and h/e Apparatus Accessory Kit - Texas A&M...
22
012-04049J 08/98 © 1989 PASCO scientific $5.00 h/e Apparatus and h/e Apparatus Accessory Kit Instruction Manual and Experiment Guide for the PASCO scientific Model AP-9368 and AP-9369 Includes Teacher's Notes and Typical Experiment Results
Transcript of and h/e Apparatus Accessory Kit - Texas A&M...

012-04049J08/98
© 1989 PASCO scientific $5.00
h/e Apparatusand
h/e Apparatus Accessory Kit
Instruction Manualand Experiment Guidefor the PASCO scientificModel AP-9368 and AP-9369
IncludesTeacher's Notes
andTypical
Experiment Results


012-04049J h/e Apparatus and h/e Apparatus Accessory Kit
i®
Table of Contents
Section Page
Copyright, Warranty, and Equipment Return .................................................. ii
Introduction ..................................................................................................... 1
Background Theory ......................................................................................... 2
Equipment and Setup ....................................................................................... 3
Equipment List .......................................................................................... 3
Installing the Batteries ............................................................................... 3
Battery Voltage Check............................................................................... 3
Equipment Setup ....................................................................................... 4
Using the Accessory Kit Filters ................................................................. 6
Experiments:
Experiment 1: Wave Model vs Quantum Model ................................. 7
Experiment 2: The Relationship of Energy, Wavelength and Frequency............................................................ 11
Technical Information .................................................................................... 13
Theory of Operation ................................................................................. 13
Schematic Diagram................................................................................... 14
Teacher’s Guide .............................................................................................. 15
Technical Support ................................................................. Inside Back Cover

h/e Apparatus and h/e Apparatus Accessory Kit 012-04049J
ii®
Equipment Return
Should the product have to be returned to PASCOscientific for any reason, notify PASCO scientific byletter, phone, or fax BEFORE returning the product.Upon notification, the return authorization and ship-ping instructions will be promptly issued.
NOTE: NO EQUIPMENT WILL BEACCEPTED FOR RETURN WITHOUT ANAUTHORIZATION FROM PASCO.
When returning equipment for repair, the units must bepacked properly. Carriers will not accept responsibilityfor damage caused by improper packing. To be certainthe unit will not be damaged in shipment, observe thefollowing rules:
➀ The packing carton must be strong enough for theitem shipped.
➁ Make certain there are at least two inches of pack-ing material between any point on the apparatus andthe inside walls of the carton.
➂ Make certain that the packing material cannot shiftin the box or become compressed, allowing theinstrument come in contact with the packing carton.
Address: PASCO scientific
10101 Foothills Blvd.
Roseville, CA 95747-7100
Phone: (916) 786-3800
FAX: (916) 786-3292
email: [email protected]
web: www.pasco.com
Copyright Notice
The PASCO scientific 012-04049J h/e Apparatus andh/e Apparatus Accessory Kit manual is copyrightedand all rights reserved. However, permission is grantedto non-profit educational institutions for reproductionof any part of the manual providing the reproductionsare used only for their laboratories and are not sold forprofit. Reproduction under any other circumstances,without the written consent of PASCO scientific, isprohibited.
Limited Warranty
PASCO scientific warrants the product to be free fromdefects in materials and workmanship for a period ofone year from the date of shipment to the customer.PASCO will repair or replace at its option any part ofthe product which is deemed to be defective in materialor workmanship. The warranty does not cover damageto the product caused by abuse or improper use.Determination of whether a product failure is the resultof a manufacturing defect or improper use by thecustomer shall be made solely by PASCO scientific.Responsibility for the return of equipment for warrantyrepair belongs to the customer. Equipment must beproperly packed to prevent damage and shippedpostage or freight prepaid. (Damage caused by im-proper packing of the equipment for return shipmentwill not be covered by the warranty.) Shipping costsfor returning the equipment after repair will be paid byPASCO scientific.
Copyright, Warranty, and Equipment Return
Please—Feel free to duplicate this manualsubject to the copyright restrictions below.
CreditsThis manual edited by: Dave Griffith
Teacher’s guide written by: Eric Ayar

012-04049J h/e Apparatus and h/e Apparatus Accessory Kit
1®
Experimental data for the radiation of light by a hot,glowing body showed that the maximum intensity ofemitted light also departed dramatically from the clas-sically predicted values (Wien's Law). In order to rec-oncile theory with laboratory results, Planck wasforced to develop a new model for light called thequantum model. In this model, light is emitted insmall, discrete bundles or quanta.
The relationship between the classical and quantum theo-ries for the emission of light can be investigated using thePASCO scientific h/e Apparatus. Using the Apparatus incombination with the PASCO Mercury Vapor LightSource (Model OS-9286) allows an accurate determina-tion of the h/e ratio and thus a determination of h,Planck's constant.
The emission and absorption of light was an early subjectfor investigation by German physicist Max Planck. AsPlanck attempted to formulate a theory to explain thespectral distribution of emitted light based on a classicalwave model, he ran into considerable difficulty. Classicaltheory (Rayleigh-Jeans Law) predicted that the amount oflight emitted from a black body would increase dramati-cally as the wavelength decreased, whereas experimentshowed that it approached zero. This discrepancy becameknown as the ultraviolet catastrophe.
Introduction
Figure 1. The h/e Apparatus Shown With the Accessory Kit and Mercury Vapor Light Source

h/e Apparatus and h/e Apparatus Accessory Kit 012-04049J
2®
Planck's Quantum TheoryBy the late 1800's many physicists thought they had ex-plained all the main principles of the universe and discov-ered all the natural laws. But as scientists continued work-ing, inconsistencies that couldn't easily be explained be-gan showing up in some areas of study.
In 1901 Planck published his law of radiation. In it hestated that an oscillator, or any similar physical system,has a discrete set of possible energy values or levels; en-ergies between these values never occur.
Planck went on to state that the emission and absorptionof radiation is associated with transitions or jumps be-tween two energy levels. The energy lost or gained by theoscillator is emitted or absorbed as a quantum of radiantenergy, the magnitude of which is expressed by the equa-tion:
E = h νwhere E equals the radiant energy, ν is the frequency ofthe radiation, and h is a fundamental constant of nature.The constant, h, became known as Planck's constant.
Planck's constant was found to have significance beyondrelating the frequency and energy of light, and became acornerstone of the quantum mechanical view of the suba-tomic world. In 1918, Planck was awarded a Nobel prizefor introducing the quantum theory of light.
The Photoelectric Effect
In photoelectric emission, light strikes a material, causingelectrons to be emitted. The classical wave model pre-dicted that as the intensity of incident light was increased,the amplitude and thus the energy of the wave would in-crease. This would then cause more energetic photoelec-trons to be emitted. The new quantum model, however,predicted that higher frequency light would producehigher energy photoelectrons, independent of intensity,while increased intensity would only increase the numberof electrons emitted (or photoelectric current). In theearly 1900s several investigators found that the kineticenergy of the photoelectrons was dependent on the wave-length, or frequency, and independent of intensity, whilethe magnitude of the photoelectric current, or number ofelectrons was dependent on the intensity as predicted bythe quantum model. Einstein applied Planck's theory andexplained the photoelectric effect in terms of the quantummodel using his famous equation for which he receivedthe Nobel prize in 1921:
E = h ν = KEmax
+ WO
where KEmax
is the maximum kinetic energy of the emit-ted photoelectrons, and W
O is the energy needed to re-
move them from the surface of the material (the workfunction). E is the energy supplied by the quantum oflight known as a photon.
The h/e Experiment
A light photon with energy hν is incident upon an elec-tron in the cathode of a vacuum tube. The electron uses aminimum W
O of its energy to escape the cathode, leaving
it with a maximum energy of KEmax
in the form of kineticenergy. Normally the emitted electrons reach the anode ofthe tube, and can be measured as a photoelectric current.However, by applying a reverse potential V between theanode and the cathode, the photoelectric current can bestopped. KE
max can be determined by measuring the mini-
mum reverse potential needed to stop the photoelectronsand reduce the photoelectric current to zero.* Relatingkinetic energy to stopping potential gives the equation:
KEmax
= VeTherefore, using Einstein's equation,
h ν = Ve + WO
When solved for V, the equation becomes:
V = (h/e) ν - (WO/e)
If we plot V vs ν for different frequencies of light, thegraph will look like Figure 2. The V intercept is equal to -W
O/e and the slope is h/e. Coupling our experimental de-
termination of the ratio h/e with the accepted value fore, 1.602 x 10⁻¹⁹ coulombs, we can determine Planck'sconstant, h.
Background Theory
*NOTE: In experiments with the PASCO h/e Ap-paratus the stopping potential is measured directly,rather than by monitoring the photoelectric current.See the Theory of Operation in the Technical Infor-mation section of the manual for details.
Figure 2. The graph of V vs. ννννν
Stopping
Potential V
Frequency ν
Slope= h/e

012-04049J h/e Apparatus and h/e Apparatus Accessory Kit
3®
Equipment and Setup
Coupling Bar Assembly
Light ApertureAssembly
Lens/GratingAssembly
Support Base Assembly
Light Block (forLight Source)
h/e Apparatus AP-9368
Mercury Vapor lightSource OS-9286
h/e Apparatus Accessory Kit AP-9369
Figure 3. h/e Equipment Identification
Equipment Required:
– Digital voltmeter (SE-9589)– h/e Apparatus, (AP-9368*)– h/e Apparatus Accessory Kit, (AP-9369*)– Mercury Vapor Light Source, (OS- 9286*)
Installing the Batteries
The h/e Apparatus requires two 9-volt batteries (suppliedbut not installed). The battery compartment is accessed byloosening the thumbscrew on the rear end panel, and re-moving the cover plate.
NOTE: The h/e Apparatus can also be poweredusing a ±9 V dual power supply. Just remove thebatteries and connect +9 V to the "+6 V MIN" bat-tery test terminal and -9 V to the "-6 V MIN" bat-tery test terminal.
Battery Voltage Check
Although the h/e Apparatus draws only a small amount ofcurrent and batteries normally last a long time, it's a goodidea to check the output voltage before each use. Batterytest points are located on the side panel of the Apparatusnear the ON/OFF switch. Batteries functioning below therecommended minimum operating level of 6 volts maycause erroneous results in your experiments.
To check the batteries, use a voltmeter to measure be-tween the OUTPUT ground terminal and eachBATTERY TEST terminal (-6V MIN and +6V MIN).If either battery tests below its minimum rating, it shouldbe replaced before running experiments.
Figure 4. Battery Test Points
Battery TestTerminals
GroundTerminal
ON/OFFSwitch* These items may be purchased separately from PASCO
scientific, or together as an AP-9370 h/e System.
Filters

h/e Apparatus and h/e Apparatus Accessory Kit 012-04049J
4®
Equipment Setup
The standard setup for h/e experiments is shown inFigure 5. Details for setting up the apparatus aredescribed below.
1. The Light Source design allows simultaneous connec-tion of two Light Aperture assemblies: one on thefront and one on the back. If you are using only oneLight Aperture and h/e Apparatus, install the LightBlock (supplied with the Accessory Kit) in the mount-ing groove closest to the body of the housing on theback of the Light Source (see Figure 6).
2. Slide the Light Aperture Assembly into the centermounting groove on the front of the Light Source.Secure it in place by finger-tightening the two thumb-screws against the front of the Light Sourcehousing.
3. The Lens/Grating Assembly mounts on the supportbars of the Light Aperture Assembly (Figure 7).Loosen the thumbscrew, slip it over the bars, and finger-tighten the thumbscrew to hold it securely.
NOTE: The grating is blazed to produce thebrightest spectrum on one side only. During yourexperiment, you may need to turn the Lens/GratingAssembly around in order to have the brightestspectrum on a convenient side of your lab table.
Coupling Bar Assembly
Light ApertureAssembly
Lens/GratingAssembly
Support Base Assembly
h/e Apparatus
Light Block
LightSource
Press to discharge theinstrument.
ON/OFF Switch
THE CONTROLS
Connect to a digitalvoltmeter (the output is adirect measurement ofthe stopping potential).
Figure 7. Lens/Grating Mounting Detail
Rear Channelof MercuryLight Source
Light Block
Figure 6. Installing the Light Block
Figure 5. Equipment Setup Using a Mercury Vapor Light Source and the h/e Apparatus

012-04049J h/e Apparatus and h/e Apparatus Accessory Kit
5®
4. Turn on the Light Source and allow it to warm up forfive minutes. Check the alignment of the Light Sourceand the Aperture by looking at the light shining on theback of the Lens/Grating assembly. If necessary, adjustthe back plate of the Light Aperture Assembly by loos-ening the two retaining screws (Figure 8) and slidingthe aperture plate left or right until the light shines di-rectly on the center of the Lens/Grating Assembly.
5. Insert the Coupling Bar assembly into the lowermounting groove of the Light Source (Figure 5). Se-cure in place by tightening the thumbscrew against thefront of the Light Source housing.
6. Remove the screw from the end of the Support Baserod. Insert the screw through the hole in the SupportBase plate and attach the rod to the Support Base plateby tightening the screw (use Phillips drive screwdriver).
7. Place the h/e Apparatus onto the Support BaseAssembly.
8. Place the Support Base assembly over the pin on theend of the Coupling Bar assembly.
9. Connect a digital voltmeter (DVM) to the OUTPUTterminals of the h/e Apparatus. Select the 2V or 20Vrange on the meter.
10.Set the h/e Apparatus directly in front of the MercuryVapor Light Source. By sliding the Lens/Grating as-sembly back and forth on its support rods, focus thelight onto the white reflective mask of the h/e Appara-tus (Figure 9).
11.Roll the light shield of the Apparatus out of the way toreveal the white photodiode mask inside the Appara-tus. Rotate the h/e Apparatus until the image of theaperture is centered on the window in the photodiodemask. Then tighten the thumbscrew on the basesupport rod to hold the Apparatus in place.
12.As in step 9, slide the Lens/Grating assembly back andforth on its support rods, until you achieve the sharpestpossible image of the aperture on the window in thephotodiode mask. Tighten the thumbscrew on the Lens/Grating assembly and replace the light shield.
13.Turn the power switch ON. Rotate the h/e Apparatusabout the pin of the Coupling Bar Assembly until oneof the colored maxima in the first order shines directlyon the slot in the white reflective mask. Rotate the h/eApparatus on its support base so that the same spectralmaxima that falls on the opening in the White Reflec-tive Mask also falls on the window in the photodi-ode mask.
NOTE: The white reflective mask on the h/eapparatus is made of a special fluorescent material.This allows you to see the ultraviolet line as a blueline, and it also makes the violet line appear moreblue. You can see the actual colors of the light ifyou hold a piece of white non-fluorescent materialin front of the mask. (The palm of your hand worksin a pinch, although it fluoresces enough that theUV line will still be visible.)
When making measurements it is important thatonly one color falls on the photodiode window.There must be no overlap from adjacent spectralmaxima.
Figure 9. h/e Light Shield
Figure 8. Light Aperture Adjustment
Light Shield(shown tilted tothe open position)
Window toWhite PhotodiodeMask
Base Support Rod
WhiteReflectiveMask

h/e Apparatus and h/e Apparatus Accessory Kit 012-04049J
6®
14.Press the “PUSH TO ZERO” button on the side panelof the h/e Apparatus to discharge any accumulated po-tential in the unit's electronics. This will assure the Ap-paratus records only the potential of the light you aremeasuring. Note that the output voltage will drift withthe absence of light on the photodiode.
15.Read the output voltage on your digital voltmeter. It isa direct measurement of the stopping potential for thephotoelectrons. (See Theory of Operation in the Tech-nical Information section of the manual for an expla-nation of the measurement.)
NOTE: For some apparatus, the stopping poten-tial will temporarily read high and then drop downto the actual stopping potential voltage.
All values except wavelength for yellow line arefrom Handbook of Chemistry and Physics, 46th ed.The wavelength of the yellow was determined ex-perimentally using a 600 line/mm grating.
NOTE: The yellow line is actually a doubletwith wavelengths of 578 and 580mm.
Yellow 5.18672E+14 578
Green 5.48996E+14 546.074
Blue 6.87858E+14 435.835
Violet 7.40858E+14 404.656
Ultraviolet 8.20264E+14 365.483
Color Frequency (Hz) Wavelength (nm)
Figure 10. The Three Orders of Light Gradients
Using the Filters
The (AP-9368) h/e Apparatus includes three filters: oneGreen and one Yellow, plus a Variable Transmission Filter.The filter frames have magnetic strips and mount to the out-side of the White Reflective Mask of the h/e Apparatus.
Use the green and yellow filters when you're using thegreen and yellow spectral lines. These filters limit higherfrequencies of light from entering the h/e Apparatus. Thisprevents ambient room light from interfering with thelower energy yellow and green light and masking the trueresults. It also blocks the higher frequency ultraviolet lightfrom the higher order spectra which may overlap withlower orders of yellow and green.
The Variable Transmission Filter consists of computer-generated patterns of dots and lines that vary the intensity(not the frequency) of the incident light. The relative trans-mission percentages are 100%, 80%, 60%, 40%, and 20%.
1st Order
2nd Order
Ultraviolet
3rd Order
VioletBlue
GreenYellow
White
Green & Yellow Spectral linesin 3rd Order are not Visible.
2nd and 3rd Order Overlap

012-04049J h/e Apparatus and h/e Apparatus Accessory Kit
7®
According to the photon theory of light, the maximum kinetic energy, KE max
, of photoelectronsdepends only on the frequency of the incident light, and is independent of the intensity. Thusthe higher the frequency of the light, the greater its energy.
In contrast, the classical wave model of light predicted that KE max
would depend on light inten-sity. In other words, the brighter the light, the greater its energy.
This lab investigates both of these assertions. Part A selects two spectral lines from a mercurylight source and investigates the maximum energy of the photoelectrons as a function of theintensity. Part B selects different spectral lines and investigates the maximum energy of thephotoelectrons as a function of the frequency of the light.
Setup
Set up the equipment as shown in the diagram below. Focus the light from the Mercury VaporLight Source onto the slot in the white reflective mask on the h/e Apparatus. Tilt the LightShield of the Apparatus out of the way to reveal the white photodiode mask inside the Appara-tus. Slide the Lens/Grating assembly forward and back on its support rods until you achieve thesharpest image of the aperture centered on the hole in the photodiode mask. Secure theLens/Grating by tightening the thumbscrew.
Align the system by rotating the h/e Apparatus on its support base so that the same color lightthat falls on the opening of the light screen falls on the window in the photodiode mask, with nooverlap of color from other spectral lines. Return the Light Shield to its closed position.
Check the polarity of the leads from your digital voltmeter (DVM), and connect them to theOUTPUT terminals of the same polarity on the h/e Apparatus.
Experiment 1: The Wave Model of lightvs. the Quantum Model
Experiment 1. Equipment Setup

h/e Apparatus and h/e Apparatus Accessory Kit 012-04049J
8®
Procedure
Part A1. Adjust the h/e Apparatus so that only one of the spectral colors falls upon the opening of the mask
of the photodiode. If you select the green or yellow spectral line, place the corresponding coloredfilter over the White Reflective Mask on the h/e Apparatus
2. Place the Variable Transmission Filter in front of the White Reflective Mask (and over the coloredfilter, if one is used) so that the light passes through the section marked 100% and reaches the pho-todiode. Record the DVM voltage reading in the table below.
Press the instrument discharge button, release it, and observe approximately how much time is re-quired to return to the recorded voltage.
3. Move the Variable Transmission Filter so that the next section is directly in front of the incominglight. Record the new DVM reading, and approximate time to recharge after the discharge buttonhas been pressed and released.
Repeat Step 3 until you have tested all five sections of the filter.
Repeat the procedure using a second color from the spectrum.
Color #1(name)
Color #2(name)
%Transmission Stopping Potential Approx. ChargeTime
100
80
60
40
20
%Transmission Stopping Potential Approx. ChargeTime
100
80
60
40
20
012-04049J h/e Apparatus and h/e Apparatus Accessory Kit
9®
Light Color
Yellow
Green
Blue
Violet
Ultraviolet
Stopping Potential
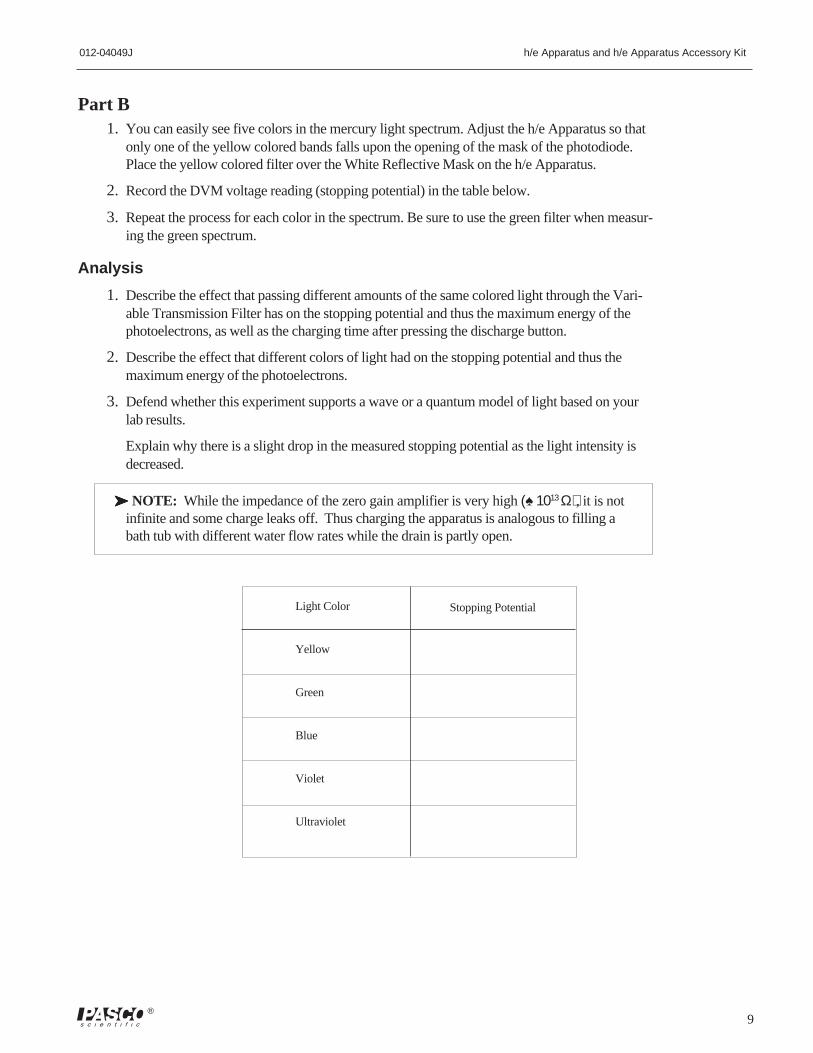
Part B1. You can easily see five colors in the mercury light spectrum. Adjust the h/e Apparatus so that
only one of the yellow colored bands falls upon the opening of the mask of the photodiode.Place the yellow colored filter over the White Reflective Mask on the h/e Apparatus.
2. Record the DVM voltage reading (stopping potential) in the table below.
3. Repeat the process for each color in the spectrum. Be sure to use the green filter when measur-ing the green spectrum.
Analysis
1. Describe the effect that passing different amounts of the same colored light through the Vari-able Transmission Filter has on the stopping potential and thus the maximum energy of thephotoelectrons, as well as the charging time after pressing the discharge button.
2. Describe the effect that different colors of light had on the stopping potential and thus themaximum energy of the photoelectrons.
3. Defend whether this experiment supports a wave or a quantum model of light based on yourlab results.
Explain why there is a slight drop in the measured stopping potential as the light intensity isdecreased.
NOTE: While the impedance of the zero gain amplifier is very high (♠1013 Ω), it is notinfinite and some charge leaks off. Thus charging the apparatus is analogous to filling abath tub with different water flow rates while the drain is partly open.
h/e Apparatus and h/e Apparatus Accessory Kit 012-04049J
10®
Notes

012-04049J h/e Apparatus and h/e Apparatus Accessory Kit
11®
According to the quantum model of light, the energy of light is directly proportional to itsfrequency. Thus, the higher the frequency, the more energy it has. With careful experimentation,the constant of proportionality, Planck's constant, can be determined.
In this lab you will select different spectral lines from mercury and investigate the maximum en-ergy of the photoelectrons as a function of the wavelength and frequency of the light.
Setup
Set up the equipment as shown in the diagram below. Focus the light from the Mercury VaporLight Source onto the slot in the white reflective mask on the h/e Apparatus. Tilt the Light Shieldof the Apparatus out of the way to reveal the white photodiode mask inside the Apparatus. Slidethe Lens/Grating assembly forward and back on its support rods until you achieve the sharpest im-age of the aperture centered on the hole in the photodiode mask. Secure the Lens/Grating by tight-ening the thumbscrew.
Align the system by rotating the h/e Apparatus on its support base so that the same color light thatfalls on the opening of the light screen falls on the window in the photodiode mask with no overlapof color from other spectral bands. Return the Light Shield to its closed position.
Check the polarity of the leads from your digital voltmeter (DVM), and connect them to the OUT-PUT terminals of the same polarity on the h/e Apparatus.
Experiment 2: The Relationship between Energy,Wavelength, and Frequency
Experiment 2. Equipment Setup

h/e Apparatus and h/e Apparatus Accessory Kit 012-04049J
12®
Procedure
1. You can see five colors in two orders of the mercury light spectrum. Adjust the h/e Apparatuscarefully so that only one color from the first order (the brightest order) falls on the opening ofthe mask of the photodiode.
2. For each color in the first order, measure the stopping potential with the DVM and record thatmeasurement in the table below. Use the yellow and green colored filters on the ReflectiveMask of the h/e Apparatus when you measure the yellow and green spectral lines.
3. Move to the second order and repeat the process. Record your results in the table below.
Analysis
Determine the wavelength and frequency of each spectral line. Plot a graph of the stoppingpotential vs. frequency.
Determine the slope and y-intercept. Interpret the results in terms of the h/e ratio and the WO/e
ratio. Calculate h and WO.
In your discussion, report your values and discuss your results with an interpretation based ona quantum model for light.
First Order Wavelength Frequency Stopping PotentialColor nm x10 14 Hz volts
Yellow
Green
Blue
Violet
Ultraviolet
Second Order Wavelength Frequency Stopping PotentialColor nm x10 14 Hz volts
Yellow
Green
Blue
Violet
Ultraviolet

012-04049J h/e Apparatus and h/e Apparatus Accessory Kit
13®
Theory of Operation
In experiments with the h/e Apparatus, monochromaticlight falls on the cathode plate of a vacuum photodiodetube that has a low work function, W
0. Photoelectrons
ejected from the cathode collect on the anode.
The photodiode tube and its associated electronics have asmall capacitance which becomes charged by the photo-electric current. When the potential on this capacitancereaches the stopping potential of the photoelectrons, thecurrent decreases to zero, and the anode-to-cathode volt-age stabilizes. This final voltage between the anodeand cathode is therefore the stopping potential of thephotoelectrons.
To let you measure the stopping potential, the anode isconnected to a built-in amplifier with an ultrahigh inputimpedance (> 1013 Ω), and the output from this amplifieris connected to the output jacks on the front panel of theapparatus. This high impedance, unity gain (Vout/Vin = 1)amplifier lets you measure the stopping potential with a digi-tal voltmeter.
Due to the ultra high input impedance, once the capacitorhas been charged from the photodiode current it takes along time to discharge this potential through some leak-age. Therefore a shorting switch labeled “PUSH TOZero” enables the user to quickly bleed off the charge.However, the op-amp output will not stay at 0 volts afterthe switch is released since the op-amp input is floating.
Due to variances in the assembly process, each appara-tus has a slightly different capacitance. When the zeroswitch is released, the internal capacitance along withthe user's body capacitance coupled through the switchis enough to make the output volatge jump and/or os-cillate. Once photoelectrons charge the anode the inputvoltage will stabilize.
Technical Information

h/e Apparatus and h/e Apparatus Accessory Kit 012-04049J
14®
2
R11K
J1
J2
OUTPUT
+9V
D11N914
D21N914
7
4
6
8
U1AD549JH
3
-9V
PD1VACUUMPHOTODIODE1P39
84
S2PUSH TOZERO
P3-3 J3-3
J3-4 P3-4
J3-4 P1-4
J3-4 P1-4
J3-5P3-5
BAT 1
BAT 2
+_
+_
J1-5 P1-5 P2-1
J1-1 P1-1 P2-2
J2-1
J2-2
S1ON/OFF
J2-5
J2-4 P2-4
P2-5
-9V
+9VR21K
R31K
P3-1 J3-1
P3-2 J3-2
J3
J4
+6V MIN
-6V MIN
BATTERY TEST
ON OFF
–
+
Schematic Diagram
012-04049J h/e Apparatus and h/e Apparatus Accessory Kit
15®
Teacher’s Guide
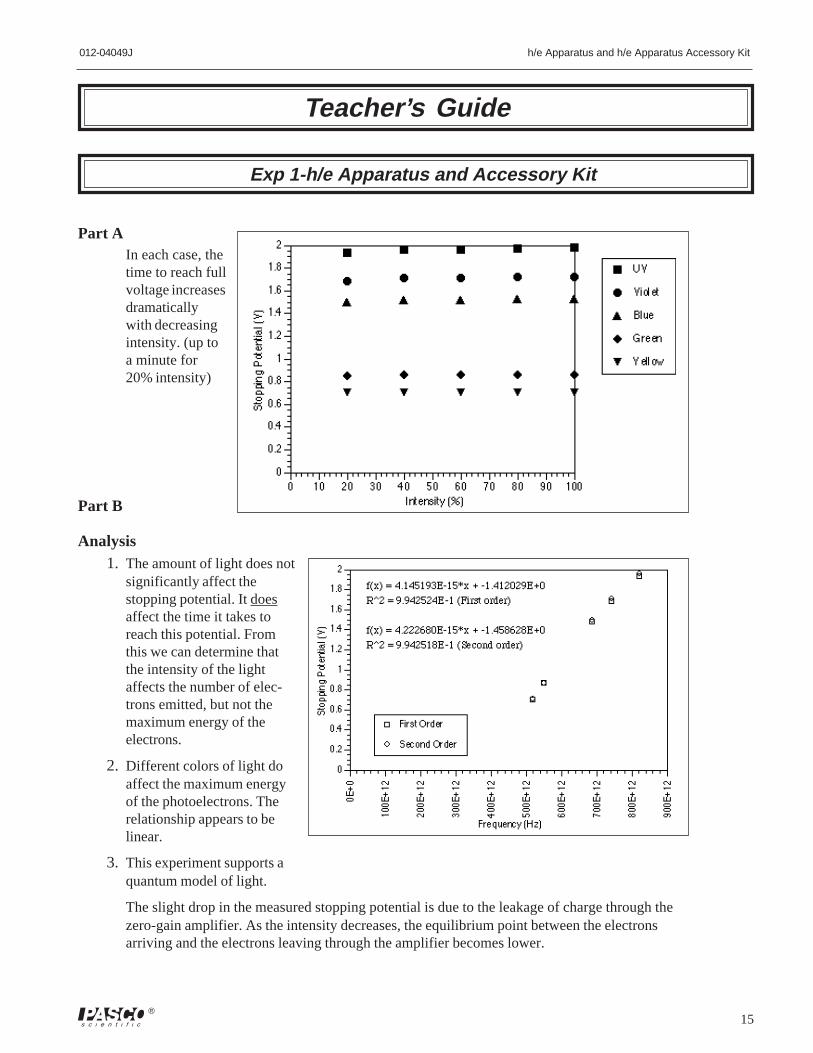
Part AIn each case, thetime to reach fullvoltage increasesdramaticallywith decreasingintensity. (up toa minute for20% intensity)
Part B
Analysis1. The amount of light does not
significantly affect thestopping potential. It doesaffect the time it takes toreach this potential. Fromthis we can determine thatthe intensity of the lightaffects the number of elec-trons emitted, but not themaximum energy of theelectrons.
2. Different colors of light doaffect the maximum energyof the photoelectrons. Therelationship appears to belinear.
3. This experiment supports aquantum model of light.
The slight drop in the measured stopping potential is due to the leakage of charge through thezero-gain amplifier. As the intensity decreases, the equilibrium point between the electronsarriving and the electrons leaving through the amplifier becomes lower.
Exp 1-h/e Apparatus and Accessory Kit

h/e Apparatus and h/e Apparatus Accessory Kit 012-04049J
16®
Analysis
First order:
h = 6.6406E-34(0.22% off)
Wo = 1.412 eV
Second order:
h = 6.7647E-34(2.1% off)
Wo = 1.459 eV
Exp 2-h/e Apparatus and Accessory Kit

012-04049J h/e Apparatus and h/e Apparatus Accessory Kit
17®
Contacting Technical Support
Before you call the PASCO Technical Support staff, itwould be helpful to prepare the following information:
If your problem is with the PASCO apparatus, note:
- Title and model number (usually listed on thelabel);
- Approximate age of apparatus;
- A detailed description of the problem/sequence ofevents (in case you can’t call PASCO right away,you won’t lose valuable data);
- If possible, have the apparatus within reach whencalling to facilitate description of individual parts.
If your problem relates to the instruction manual,note:
- Part number and revision (listed by month andyear on the front cover);
- Have the manual at hand to discuss yourquestions.
Technical Support
Feed-Back
If you have any comments about this product or thismanual please let us know. If you have any suggestionson alternate experiments or find a problem in themanual please tell us. PASCO appreciates any cus-tomer feed-back. Your input helps us evaluate andimprove our product.
To Reach PASCO
For Technical Support call us at 1-800-772-8700(toll-free within the U.S.) or (916) 786-3800.
ax: (916) 786-3292
e-mail: [email protected]
web: www.pasco.com