And Existing Challenges Restrain Sub-Saharan Africa Recovery
22
S&P Global Ratings 1 Emerging Markets: And Existing Challenges Restrain Sub-Saharan Africa Recovery June 16, 2021 Key Takeaways Sub-Saharan Africa (SSA) will likely be the among s in 2021. The size of the economies of five key SSA countries (Ethiopia, Ghana, Kenya, Nigeria, and South Africa) will be 6.6% smaller than the pre-pandemic long-run trend- based estimate by the end of 2024. Pandemic-induced GDP growth shock has hit the SSA sovereigns' fiscal metrics; an expected slow recovery will continue to contribute to existing challenges in the region. SSA corporations are recovering, but remain subject to longstanding red tape and government failures, which have been amplified by the pandemic and are sources of operational friction. SSA b due to the pandemic's lingering impact, profitability levels may recover to pre-crisis levels after 2022, while credit losses moderate. Contents Macroeconomic Environment 2 Sub-Saharan Africa Sovereigns 7 Sub-Saharan Africa Corporations 13 Sub Saharan Africa Banks 17 Contacts Satyam Panday New York satyam.panday @spglobal.com Ravi Bhatia London ravi.bhatia @spglobal.com Samira Mensah Johannesburg samira.mensah @spglobal.com Omega Collocott Johannesburg omega.collocott @spglobal.com Jose Perez Gorozpe Madrid jose.perez-gorozpe @spglobal.com
Transcript of And Existing Challenges Restrain Sub-Saharan Africa Recovery

S&P Global Ratings 1
Emerging Markets:
And Existing Challenges Restrain Sub-Saharan Africa Recovery June 16, 2021
Key Takeaways
Sub-Saharan Africa (SSA) will likely be the among s in 2021. The size of the economies of five key SSA countries (Ethiopia, Ghana, Kenya, Nigeria, and South Africa) will be 6.6% smaller than the pre-pandemic long-run trend-based estimate by the end of 2024.
Pandemic-induced GDP growth shock has hit the SSA sovereigns' fiscal metrics; an expected slow recovery will continue to contribute to existing challenges in the region.
SSA corporations are recovering, but remain subject to longstanding red tape and government failures, which have been amplified by the pandemic and are sources of operational friction.
SSA b due to the pandemic's lingering impact, profitability levels may recover to pre-crisis levels after 2022, while credit losses moderate.
Contents
Macroeconomic Environment
2
Sub-Saharan Africa Sovereigns
7
Sub-Saharan Africa
Corporations
13
Sub Saharan Africa Banks
17
Contacts
Satyam Panday
New York
satyam.panday @spglobal.com
Ravi Bhatia
London
ravi.bhatia @spglobal.com
Samira Mensah
Johannesburg
samira.mensah @spglobal.com
Omega Collocott
Johannesburg
omega.collocott @spglobal.com
Jose Perez Gorozpe
Madrid
jose.perez-gorozpe @spglobal.com

Emerging Markets Sub Saharan Africa
S&P Global Ratings June 16, 2021 2
Macroeconomic Environment
Pandemic Impact, A Deceptive Appearance (Editor's Note: The views expressed in this section are those of S&P Global Ratings' economics team. While these views can help to
inform the rating process, sovereign and other ratings are based on the decisions of ratings committees, exercising their analytical
judgment in accordance with publicly available ratings criteria.)
Although reports of the death toll of the COVID-19 pandemic in SSA have to date been generally
lower than in other regions (especially excluding South Africa, see chart 1), the countries in the
region didn't avoid the economic fallout from the worldwide recession and lockdowns. Many
implemented lockdowns (at varying degrees) after the first wave of COVID infections and
subsequent spikes, which spared the region from the worst of the health crisis but also led to
changes in mobility patterns that induced economic losses (see chart 2). The SSA economy shrank
an estimated 1.9% in 2020 (IMF, 2021).
Chart 1 Chart 2
Daily New Cases Per Million Population Retain And Recreation Mobility
(Seven-day moving average). Data as of May 25, 2021. Source: Ourworldindata.org and S&P Global Ratings.
(Percentage change from pre-pandemic level, seven-day moving average) Data as of May 22, 2021. Source: Ourworldindata.org and S&P Global Ratings.
At first glance, a 1.9% decline may not seem dramatic, even though it was one of the worst single-
year performance in the region's history. In comparison with countries outside the region, it looks
mild. But simply comparing the decline wouldn't be a fair comparison. A better comparison would
be of the overall loss of growth experience or growth shortfall--which one can derive by adding
the growth that was expected, had it not been for the pandemic to the absolute value of the actual
decline. Kenya, for instance, experienced a mere 0.1% contraction in 2020. However, once you add
the missed expected growth of 6.1% (as of late 2019, before the pandemic), the growth shortfall for
Kenya was 6.2%. In comparison, the outcome was worse than that for the U.S., which saw its real
GDP decline more than 3.5%, with its overall growth shortfall a smaller 5.4%, given that growth
expectations were smaller to begin with (consisting of a 1.9% expected growth pre-pandemic for
2020 and a 3.5% actual decline).
Among the countries in the SSA region, the mean growth shortfall in 2020 was 6.9%, with maximum
of 19.6% for Mauritius and the minimum at 0.7% for Guinea. Based on a standard two-sample t-
test, there's no statistically significant difference between the means of resource-intensive versus
non-resource-intensive country groups in the region (grouping according to the IMF):
• For oil exporters (6.8%) versus non-exporters (6.9%), or
• Resource-intensive including oil (6.1%) versus non-resource (7.6%).
We did, however, find a statistically significant difference in the means between low-income (5.9%)
versus middle-income (8%) countries in the region.
0
100
200
300
400
500
600
700
800
900
Mar-20 May-20 Jul-20 Sep-20 Nov-20 Jan-21 Mar-21 May-21
India U.S. South Africa U.K. Kenya Ethiopia Ghana Nigeria
(90)
(60)
(30)
0
30
Fe
b-2
0
Ma
r-2
0
Ap
r-2
0
Ma
y-2
0
Jun
-20
Jul-
20
Au
g-2
0
Se
p-2
0
Oc
t-2
0
No
v-2
0
De
c-2
0
Jan
-21
Fe
b-2
1
Ma
r-2
1
Ap
r-2
1
Ma
y-2
1
Ghana India South Africa Kenya U.S. Cote d'Ivoire
Economists
Satyam Panday
New York
satyam.panday
@spglobal.com
+ 1 (212) 438 6009
Tatiana Lysenko
Paris
tatiana.lysenko @spglobal.com
+ 33 14 420 6748
Research Contributor
Debabrata Das
Mumbai
debabrata.das
@spglobal.com

Emerging Markets Sub Saharan Africa
S&P Global Ratings June 16, 2021 3
One recurring theme during the pandemic has been lockdowns, which brings up an important
question if lockdown stringency (maximum recorded for each country in 2020) explains the growth
shortfall for the region and the variation of growth shortfalls across countries in the region. A
simple OLS regression analysis tells us that lockdown stringency plays a statistically significant
role, albeit with a small coefficient determining the growth shortfall. An additional 10 points
increase in stringency was related to a 1 percentage point additional growth shortfall. While the
stringency effect was statistically significant after controlling for categorical country groups of
resource-intensive/non-resource intensive, middle income/low income, and fragile state/non-
fragile state, this simple approach still only explained a little more than a fifth of the variation
between countries. This suggests there are other reasons to consider beyond lockdown
stringency role in determining the growth shortfall.
Chart 3
GDP Growth Percentage Shortfall In 2020
Note: Shortfall calculated as the forecast of 2020 real GDP growth in Fall 2019 minus the actual 2020 growth experience. Source: IMF and S&P Global Ratings.
Chart 4
GDP Shortfall Versus Maximum Lockdown Stringency In 2020
Source: IMF, Ourworldindata.org, and S&P Global Ratings.
ETH
GHA
KENNGA
ZAF
(20)
(18)
(16)
(14)
(12)
(10)
(8)
(6)
(4)
(2)
0
0 10 20 30 40 50 60 70 80 90 100
Re
al
GD
P g
row
th s
ho
rtfa
ll (
pe
rce
nta
ge
po
ints
)
Lockdown Stringency Index (maximum)

Emerging Markets Sub Saharan Africa
S&P Global Ratings June 16, 2021 4
Prominent studies using data for advanced as well as emerging countries (where data is available) tell us that it could be that health risk, captured by COVID-19 fatality rate, led to voluntary social distancing, and consequently, lower levels of economic activity. As a result, the economic impact of government-imposed measures is likely to be smaller than commonly assumed because the counterfactual is not the smooth pre-pandemic environment, but an economy operating under substantial voluntary social distancing. It could also be that the stringency index, although well designed, doesn't fully capture the severity of the restrictions on the ground. It's also very likely that the effectiveness of the same measures differed among countries for country-specific reasons. And with some tourism-dependent economies that saw the worst shortfall (Seychelles, Cape Verde, and Mauritius at the bottom in chart 4), the shortfall had to be a function of restrictions in source countries more than local restrictions at the destination. Another complexity to consider is that tighter government measures have impaired economic activity, but by keeping fatality rates low, they might also have supported economic activity.
Slow And Uneven Recovery Ahead
SSA will likely be among key SSA countries (out of the 18 that we rate in SSA) are likely to grow 2.7% on average this year and 3.1% the next year (S&P forecasts as of April, see table 1).
Table 1
Real GDP Growth
Note: Aggregate growth is based on PPP weighted GDP share. India GDP (fiscal year), f--S&P Global Ratings forecasts as of Q1 2021, *Ethiopia's GDP reported on fiscal year basis, for example, 2020 represents July 2019 to June 2020. Source: S&P Global Ratings, IMF.
Kenya and Ghana will lead the way as growth rebounds to 4.4% and 4.5%, respectively, in 2021,
before inching past 5% on average in the next two years. Ethiopia, which was a growth leader prior
to the pandemic, will see a 5.1% expansion in fiscal 2021-2022 (July 2021 to June 2022) following a
mere 0.7% growth in fiscal 2020-2021, before picking up steam above 5% for the next couple of
years. Nigeria and South Africa round out with average growth rates in our forecast horizon that are
respectively below and barely matching their population growth rates. On a per capita basis, the
post-pandemic growth looks to extend the six-year economic malaise prior to the pandemic for
resource-rich South Africa and Nigeria (see chart 5). Nigeria stands out as even more challenged
given its vulnerability to terms of trade (the ratio between the index of export prices and the index of
import prices) headwinds to investment and growth not only by volatility of terms of trade, but
also by a more problematic deterioration of terms of trade in the last decade (see chart 6).
2018 2019 2020 2021f 2022f 2023f
Ethiopia* 7.7 9.0 6.1 0.7 5.1 6.0
Kenya 6.3 5.4 (0.1) 4.4 5.4 5.6
Nigeria 1.9 2.2 (1.8) 1.9 2.2 2.3
Ghana 6.3 6.5 0.9 4.5 5.1 5.1
South Africa 0.8 0.2 (7.0) 3.6 2.5 1.3
Sub-Saharan
Five 2.9 2.9 (2.2) 2.7 3.1 2.9
Four (excluding South
Africa) 3.8 4.1 (0.1) 2.3 3.4 3.6
Selected Other
U.S. 3.0 2.2 (3.5) 6.5 3.1 1.7
Eurozone 1.9 1.3 (6.8) 4.2 4.4 2.1
China 6.7 6.0 2.3 8.0 5.1 5.0
India 6.0 4.1 (8.0) 11.0 6.1 6.3
World 3.8 3.0 (3.2) 5.6 4.1 3.5
EM excluding China 4.1 2.6 (5.4) 6.4 4.3 4.1
Real GDP Growth

Emerging Markets Sub Saharan Africa
S&P Global Ratings June 16, 2021 5
Chart 5 Chart 6
Per Capita Real GDP: Resource Intensive Nigeria And South Africa Are Worse Off Today
Terms of Trade
Source: Oxford Economics, IMF, and S&P Global Ratings calculations.
import prices. It shows the quantity of import goods the country can purchase per unit of export goods. . Source: Oxford Economics, S&P Global Ratings.
Year-to-date data indicate a some upside risk to our GDP forecasts for Kenya, Ghana, Nigeria, and
South Africa. In Ethiopia, the real GDP recovery appears to be more challenged by a drought and
issues around the Tigray conflict.
Even with an upward revision to its GDP growth forecast, the Sub-Saharan five (South Africa,
Nigeria, Ghana, Ethiopia, and Kenya) will remain recovery laggards relative to much of the rest of
the world with potential downside risks to growth in the second half of the year. Their vaccination
rates are lagging the rest of the world, with the region perhaps at the end of the queue when it
comes to vaccine access. The latest experience from the virus wave in India, where deaths
skyrocketed and forced states to lockdown, hurting the economy that was beginning to recover,
serves as a stark reminder that the risk of falling behind the growth curve from the pandemic
continues to loom large for emerging and SSA economies even as the global economy rebounds.
Besides the ongoing pandemic risk, the overall risk to the region stems primarily from a lackluster
global economic recovery and adverse agricultural conditions.
The pace of rebound is nowhere enough to bring the economies back to their pre-pandemic GDP
trajectories (see chart 7). The size of the economy of Sub-Saharan five will be 6.6% smaller than
the pre-pandemic long-run trend-based forecast by the end of 2024 (forecast horizon).
Chart 7
GDP Trajectory: Five Sub-Saharan Countries
Source: Oxford Economics, IMF, and S&P Global Ratings.
90
100
110
120
130
140
150
160
170
180
190
200
210
2010 2011 2012 2013 2014 2015 2016 2017 2018 2019 2020 2021f 2022f 2023f 2024f
ind
ex,
20
10
=1
00
Ethiopia Ghana Kenya Nigeria South Africa
0
20
40
60
80
100
120
2010 2011 2012 2013 2014 2015 2016 2017 2018 2019 2020
Le
vel
Ethiopia Ghana Kenya Nigeria South Africa
900
950
1,000
1,050
1,100
1,150
1,200
2017 2018 2019 2020 2021 2022 2023 2024
GD
P L
evel
US
$ B
il. (C
onst
ant d
olla
r)
Baseline growth Counterfactual: Average growth rate (2011-19)
Permanentloss: 6.6%
Emerging Markets Sub Saharan Africa
S&P Global Ratings June 16, 2021 6
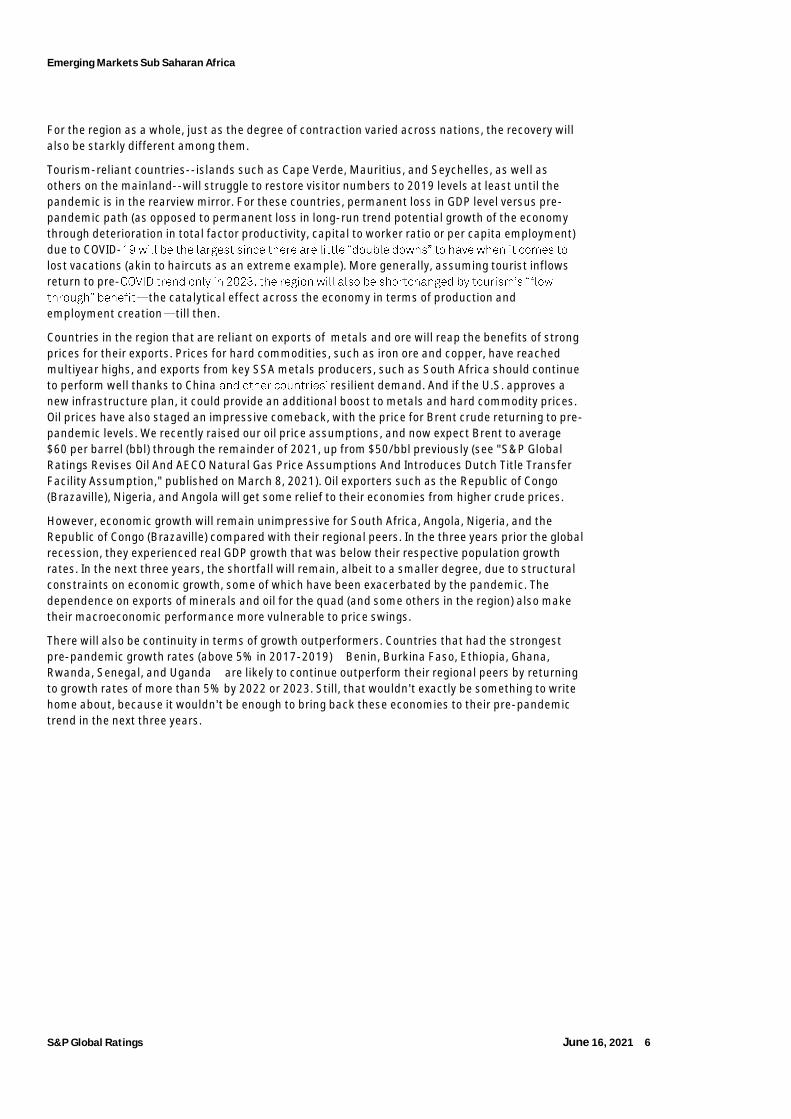
For the region as a whole, just as the degree of contraction varied across nations, the recovery will
also be starkly different among them.
Tourism-reliant countries--islands such as Cape Verde, Mauritius, and Seychelles, as well as
others on the mainland--will struggle to restore visitor numbers to 2019 levels at least until the
pandemic is in the rearview mirror. For these countries, permanent loss in GDP level versus pre-
pandemic path (as opposed to permanent loss in long-run trend potential growth of the economy
through deterioration in total factor productivity, capital to worker ratio or per capita employment)
due to COVID-
lost vacations (akin to haircuts as an extreme example). More generally, assuming tourist inflows
return to pre-
the catalytical effect across the economy in terms of production and
employment creation till then.
Countries in the region that are reliant on exports of metals and ore will reap the benefits of strong
prices for their exports. Prices for hard commodities, such as iron ore and copper, have reached
multiyear highs, and exports from key SSA metals producers, such as South Africa should continue
to perform well thanks to China resilient demand. And if the U.S. approves a
new infrastructure plan, it could provide an additional boost to metals and hard commodity prices.
Oil prices have also staged an impressive comeback, with the price for Brent crude returning to pre-
pandemic levels. We recently raised our oil price assumptions, and now expect Brent to average
$60 per barrel (bbl) through the remainder of 2021, up from $50/bbl previously (see "S&P Global
Ratings Revises Oil And AECO Natural Gas Price Assumptions And Introduces Dutch Title Transfer
Facility Assumption," published on March 8, 2021). Oil exporters such as the Republic of Congo
(Brazaville), Nigeria, and Angola will get some relief to their economies from higher crude prices.
However, economic growth will remain unimpressive for South Africa, Angola, Nigeria, and the
Republic of Congo (Brazaville) compared with their regional peers. In the three years prior the global
recession, they experienced real GDP growth that was below their respective population growth
rates. In the next three years, the shortfall will remain, albeit to a smaller degree, due to structural
constraints on economic growth, some of which have been exacerbated by the pandemic. The
dependence on exports of minerals and oil for the quad (and some others in the region) also make
their macroeconomic performance more vulnerable to price swings.
There will also be continuity in terms of growth outperformers. Countries that had the strongest
pre-pandemic growth rates (above 5% in 2017-2019) Benin, Burkina Faso, Ethiopia, Ghana,
Rwanda, Senegal, and Uganda are likely to continue outperform their regional peers by returning
to growth rates of more than 5% by 2022 or 2023. Still, that wouldn't exactly be something to write
home about, because it wouldn't be enough to bring back these economies to their pre-pandemic
trend in the next three years.

S&P Global Ratings 7
Selected SSA Sovereigns
South Africa (FC Rating: BB-/Stable/B; LC Rating: BB/Stable/B)
Our ratings are constrained by weak economic growth performance prior to the COVID-19
pandemic, particularly on a per capita basis; wide economic inequality; as well as weak public
finances, including wide fiscal deficits, a high debt burden, and sizable contingent liabilities from
weak state-owned enterprises (SOEs). Our ratings are supported by the country's monetary and
exchange rate flexibility, and credible monetary policy, a well-capitalized and regulated financial
sector, deep capital markets, and moderate external debt--in particular low levels of external debt
denominated in foreign currency.
South Africa's near-term economic performance and current account are currently experiencing a
cyclical uplift because of a combination of base effects following a severe economic contraction in
2020 and improving terms of trade from higher commodity prices. Nevertheless, structural
constraints, a sluggish pace of economic reforms, and low vaccination rates will continue to
constrain medium-term economic growth and the government's ability to contain the debt-to-GDP
ratio. Despite considerable progress in alleviating poverty since the end of apartheid, South Africa
remains one of the most unequal societies in the world, with the poorest 60% of the population
controlling less than 10% of the wealth and facing high unemployment. At above 30% in 2021, the
official unemployment rate is among the highest of all rated sovereigns.
South Africa's public finances remain structurally weak, with wide fiscal deficits, a large debt
burden, and sizable contingent liabilities. Nevertheless, near-term fiscal deficits are narrowing at
slightly faster-than-forecasted pace, owing to recent higher-than-expected revenue. The
improvements stemmed from higher tax revenue from recovering economic activity, including in the
minerals sectors. With a near-term rebound in economic activity (leading to higher tax revenue), we
also estimate that the fiscal deficit for fiscal 2021-2021 (April-March) is likely to be less than 9% of
GDP, within the 9.3% deficit target for fiscal 2021-2022 set in February 2021. Over the medium
term, we forecast that fiscal deficits will fall close to 6% by fiscal 2023-2024. The implementation
of planned economic reforms, along with reforms of governance frameworks--to reduce misuse
and leakage of public funds remains slow.
South Africa's external debt, net of liquid assets, is relatively low, averaging less than 50% of
current account receipts. And in contrast to most emerging markets, the country's overall net
external position (considering all its external assets and liabilities) is likely to be in an average net
asset position of 34% of current account receipts in 2021-2024.
Primary contact
Ravi Bhatia
London
+44 20 7176 7113

Emerging Markets Sub Saharan Africa
S&P Global Ratings June 16, 2021 8
Chart 8 Table 2
South Africa Rating Score Snapshot South Africa Key Risk Indicators
Source: S&P Global Ratings. Source: S&P Global Ratings.
0
1
2
3
4
5
6
Institutionalassessment
Economic assessment
External assessment
Fiscal assessment:budget performance
Fiscal assessment:debt
Monetary assessment
South Africa BB- Average2020 2021F 2022F 2023F 2024F
GDP Per Capita (USD '000) 5.1 5.7 5.8 5.9 6.0
Real GDP Growth -7.0 3.6 2.5 1.3 1.4
Unemployment Rate 29.2 31.1 30.2 29.9 29.5
GG Balance/GDP -11.2 -8.9 -7.2 -6.3 -6.0
GG Interest/Revenues 16.5 17.5 18.6 19.6 20.3
GG Debt/GDP 79.3 80.9 83.7 86.3 88.4
CA/GDP 2.2 1.2 -1.1 -2.1 -2.3
Narrow Net Ext. Debt/CAR 51.3 42.8 45.5 46.7 48.5
Net FDI/GDP 1.7 0.4 0.4 0.4 0.4
Exchange Rate (Year-End, ZAR/$) 14.7 15.9 16.2 16.5 17.0

Emerging Markets Sub Saharan Africa
S&P Global Ratings June 16, 2021 9
Nigeria (B-/Stable/B)
The expected recovery of the global economy and commodity markets, as well as easing of Covid-
related restrictions will cause the economic outlook for 2021 to be slightly more favorable. In line
with S&P Global Ratings' oil price assumptions, improving crude prices in 2021 should support the
recovery, with GDP growth rebounding from -18% to 1.9% in 2021 and averaging 2.3% in 2022-
2024. Thanks to stronger export earnings, the current account deficit will fall to 1.2% of GDP in
2021 from 3.2% in 2020, shifting to a modest surplus of about 1.7% in 2023-2024. On the fiscal
side, the rise in oil prices will help the consolidated general government (center and states) fiscal
deficits to narrow to 5.0% in 2021 from 5.5% in 2020 and to about 4.2% in 2022-2024. External
financing gaps could emerge if economic assumptions weaken or if funding from official lenders or
other sources is not as forthcoming as expected.
Fiscal and external pressure will remain high over the next few years. Nigeria's fiscal flexibility is
constrained by very low levels of revenue, even by regional standards, and a high interest bill as a
percentage of general government revenue. A tightly managed exchange-rate regime and high
inflation limit the effectiveness of monetary policy transmission and constrain growth, while the
banking sector remains vulnerable to asset quality problems, especially in the oil and gas sector.
The government also increased its dependence on the central bank loans to fund the fiscal deficit.
One of the largest constraints on Nigeria's fiscal flexibility is very low tax collection, with general
government revenue as a percentage of GDP averaging around 7% GDP. This highlights the limited
tax-generation capacity, partly due to the high level of informal economy and the two-tiered federal
and state-level tax system. Nonetheless, we note the authorities' recent endeavors to increase
revenue streams, especially non-oil ones.
Nigeria's established democratic and federal system helps distribute wealth and power, but makes
reform implementation and tax collection more difficult. A myriad of security risks also persist.
Chart 9 Table 3
Nigeria Rating Score Snapshot Nigeria Key Risk Indicators
Source: S&P Global Ratings. Source: S&P Global Ratings.
0
1
2
3
4
5
6
Institutionalassessment
Economic assessment
External assessment
Fiscal assessment:budget performance
Fiscal assessment:debt
Monetary assessment
Nigeria B- Average2020 2021F 2022F 2023F 2024F
GDP Per Capita (USD '000) 2.0 1.9 1.9 1.9 1.9
Real GDP Growth -1.8 1.9 2.2 2.3 2.3
Unemployment Rate 27.0 25.0 25.0 25.0 25.0
GG Balance/GDP -5.5 -5.0 -4.5 -4.0 -4.0
GG Interest/Revenues 38.7 29.2 32.9 35.1 35.5
GG Debt/GDP 46.88 48.85 50.03 50.6 51.1
CA/GDP -3.2 -1.2 -0.6 1.4 2.0
Narrow Net Ext. Debt/CAR 60.9 62.6 69.4 71.1 76.6
Net FDI/GDP 0.2 0.2 0.2 0.2 0.2
Exchange Rate (Year-End, NGN/$) 397.8 430.0 440.0 460.0 460.0

Emerging Markets Sub Saharan Africa
S&P Global Ratings June 16, 2021 10
Ethiopia (B-/Watch Neg/B)
We placed our sovereign credit ratings on Ethiopia on Credit Watch negative on February 12,
reflecting the risk that the sovereign could include commercial creditors in its government debt
restructuring plans. We could eventually lower the ratings to 'SD' (selective default) if the
government undertakes a debt exchange offer with commercial creditors, which we could consider
a distressed debt exchange based on our criteria. We would also consider a downgrade if we
conclude that Ethiopia is unwilling or unable to service the interest payments on its commercial
obligations.
Ethiopia intends to restructure its bilateral sovereign debt under the G20's Common Framework for
Debt Treatment Beyond the Debt Service Suspension Initiative (DSSI), and could seek debt relief
from commercial creditors as part of that process. We understand that the Ethiopian government is
finalizing a review of its public debt sustainability, with IMF's assistance, and will then initiate
discussions with official lenders. It remains unclear whether, under the framework, Ethiopia will be
obliged to undertake private-sector debt restructuring.
Exacerbated by the effects of the COVID-19 pandemic, Ethiopia's structurally weak external
balance sheet has deteriorated further. We expect the country's external debt (net of liquid external
assets) to increase to above 270% of current account receipts through 2024 from about 115% in
2014. Overall public-sector external debt, including the National Bank of Ethiopia's (NBE's) foreign
deposit liabilities is about 10x gross foreign exchange reserves. Ethiopia's external liquidity needs
are also high. We expect the country's gross external financing needs to average more than 170% of
current account receipts and usable reserves in 2021-2024.
We expect net government debt will average 30% of GDP over our forecast horizon; however, highly
indebted SOEs pose rising contingent liability risks. We estimate Ethiopia's public debt repayment
needs at about $5.5 billion for 2021-2024, including a $1 billion Eurobond due in 2024. These high
refinancing needs exceed the country's foreign exchange (FX) reserves of about $3 billion. The
quality of the FX reserves is low, reflected by the NBE's external liabilities surpassing foreign assets
by about $1.4 billion, according to official data as of December 2020.
We expect the birr to depreciate at a faster pace than in recent years, as authorities attempt to
reduce its overvaluation, although FX shortages and rationing are likely to continue.
Chart 10 Table 4
Ethiopia Rating Score Snapshot Ethiopia Key Risk Indicators
Source: S&P Global Ratings. Source: S&P Global Ratings.
0
1
2
3
4
5
6
Institutionalassessment
Economic assessment
External assessment
Fiscal assessment:budget performance
Fiscal assessment:debt
Monetary assessment
Ethiopia B- Average2020 2021F 2022F 2023F 2024F
GDP Per Capita (USD '000) 1.1 1.0 1.0 1.0 1.0
Real GDP Growth 6.1 0.7 5.1 6.0 6.5
Unemployment Rate N/A N/A N/A N/A N/A
GG Balance/GDP -2.8 -3.4 -2.0 -1.9 -1.9
GG Interest/Revenues 3.4 3.7 4.3 5.5 5.9
GG Debt/GDP 31.47 34.17 33.44 32.32 31.56
CA/GDP -5.5 -6.7 -5.7 -5.3 -5.0
Narrow Net Ext. Debt/CAR 232.2 286.3 276.5 272.3 271.4
Net FDI/GDP 2.26 2.2 2.5 2.8 2.8
Exchange Rate (Year-End, ETB/$) 34.4 43.0 50.8 58.4 67.1

Emerging Markets Sub Saharan Africa
S&P Global Ratings June 16, 2021 11
Kenya (B/Stable/B)
Our ratings on Kenya are constrained by its low GDP per capita, high fiscal deficits and debt stocks,
and its history of ethnic tensions. The ratings are nevertheless supported by its diversified
economic base, including its larger and more diversified agricultural and services sectors than
those of peers, which should help cushion Kenya's economy and support a rebound. Kenya also
benefits from flexible monetary settings, thanks to its relatively deep and dynamic domestic capital
markets (with local currency debt market capitalization at over 25% of GDP), and relatively
developed institutional framework compared with those of peers.
We estimate that the pandemic-related economic fallout reduced Kenya's real GDP growth to 0.2%
in 2020 from an average of 5.6% in the previous five years. The economic shock also widened
Kenya's fiscal deficits and, despite the support of a new $2.4 billion 38-month IMF program and a
fiscal consolidation plan, fiscal consolidation will likely proceed slowly, in our view. We estimate
that in fiscal 2021 (ending June 2021), the general government deficit will widen to 8.7% of GDP,
and fall slightly to 7.7% in fiscal 2022, and average 6.6% in fiscals 2023-2024. The financing of
these deficits in turn will raise domestic and external debt levels, and external vulnerabilities.
Although external financial support, including through an IMF program, will help fund Kenya's fiscal
and external deficits in 2021-2024, debt levels will continue rising. There are significant risks to the
government's fiscal consolidation plan.
Chart 11 Table 5
Kenya Rating Score Snapshot Kenya Key Risk Indicators
Source: S&P Global Ratings. Source: S&P Global Ratings.
0
1
2
3
4
5
6
Institutionalassessment
Economic assessment
External assessment
Fiscal assessment:budget performance
Fiscal assessment:debt
Monetary assessment
Kenya B Average2020 2021F 2022F 2023F 2024F
GDP Per Capita (USD '000) 1.8 1.8 1.9 2.0 2.0
Real GDP Growth 0.2 4.4 5.4 5.6 5.6
Unemployment Rate N/A N/A N/A N/A N/A
GG Balance/GDP -8.0 -8.7 -7.7 -6.3 -5.8
GG Interest/Revenues 24.9 26.2 26.8 27.3 27.1
GG Debt/GDP 65.1 69.0 71.3 71.5 71.2
CA/GDP -4.6 -5.1 -5.7 -5.5 -5.3
Narrow Net Ext. Debt/CAR 227.1 219.1 233.1 244.8 257.2
Net FDI/GDP 0.4 0.7 0.9 0.7 0.7
Exchange Rate (Year-End, KES/$) 109.2 113.0 118.0 127.0 135.0

Emerging Markets Sub Saharan Africa
S&P Global Ratings June 16, 2021 12
Ghana (B-/Stable/B)
Our ratings are supported by Ghana's fairly strong economic growth prospects--annual real GDP
growth is projected to average 5% in 2022-2024--and its flexible exchange rate regime. Ghana's
diversified commodity base of gold, oil, and cocoa has helped weather volatile patterns of
commodity prices in the international markets through diverging price trends. We expect these
offsetting trends to continue in the medium term.
Nevertheless, the ratings remain constrained by weak public finances. Ghana has wide fiscal
deficits, sizable contingent liabilities, and debt stock of more than 70% of GDP. In addition, the
country is using about half of its fiscal revenues to service debt, while GDP per capita is only slightly
more than $2,000.
Ghana's existing fiscal vulnerabilities have been accentuated by the pandemic. Fiscal consolidation
will likely be slower, given the relatively high burden of debt stock and servicing. The sharp rise in
government expenditure was partially due to Covid-related health care costs and social security
spending for the vulnerable. Rising debt service costs also increased fiscal expenditure pressures.
We project a narrowing of the fiscal deficit to 8.3% of GDP in 2021 and averaging 5.7% over 2022-
2024. The combination of a scaling back of fiscal support packages, a likely pick-up in oil receipts,
and a more rationalized public expenditure program will help narrow the fiscal deficit over the
forecast horizon.
We expect general government debt to peak at close to 74% of GDP in 2021, from 71.8% in 2020,
owing to a slower fiscal consolidation, and to decline only slightly afterwards. We expect interest
costs to eat up about half of government revenue in 2021-2024--one of the highest levels among all
sovereigns we rate. We also estimate that at least 60% of total government debt is external, with at
least 50% denominated in foreign currency, making the debt stock sensitive to the cedi's
depreciation. Ghana has so far not sought any debt relief under the G20 and Paris Club's Debt
Service Suspension Initiative (DSSI) or its successor, Common Framework for Debt Assessment.
Current account deficits are likely to remain moderate at close to 3% of GDP, partially thanks to a
diversified export base.
There's limited scope for commercial banks and the central bank to increase their exposure to the
government, so budgetary financing is likely to be met increasingly via external financing.
Chart 12 Table 6
Ghana Rating Score Snapshot Ghana Key Risk Indicators
Source: S&P Global Ratings. Source: S&P Global Ratings.
0
1
2
3
4
5
6
Institutionalassessment
Economic assessment
External assessment
Fiscal assessment:budget performance
Fiscal assessment:debt
Monetary assessment
Ghana B- Average2020 2021F 2022F 2023F 2024F
GDP Per Capita (USD '000) 2.2 2.3 2.3 2.5 2.6
Real GDP Growth 0.5 4.5 5.1 5.1 5.1
Unemployment Rate 11.9 11.0 11.0 11.0 11.0
GG Balance/GDP -13.5 -8.3 -6.0 -5.5 -5.5
GG Interest/Revenues 55.6 56.5 57.6 56.9 55.7
GG Debt/GDP 71.8 73.8 72.8 71.3 70.0
CA/GDP -2.8 -3.5 -3.2 -3.4 -3.4
Narrow Net Ext. Debt/CAR 124.2 127.4 131.3 137.5 142.0
Net FDI/GDP 1.0 3.8 3.5 3.4 3.5
Exchange Rate (Year-End, GHS/$) 5.8 6.2 6.7 7.1 7.5

Emerging Markets Sub Saharan Africa
S&P Global Ratings June 16, 2021 13
SSA Corporations
Regional Macro Themes Are The Background To Corporate Performance, But Don't Paint The Full Picture
Our macroeconomic overview highlights our expectation that GDP of the SSA region by the end of
2024 will still be 6.6% smaller than the pre-pandemic long-run trend. We also note that
commodity-exporting countries would benefit from higher commodity prices, growth dependence
on exports will be rising, and that red tape and government failures could constrain the impact of
this growth.
These observations influence our view of corporate recoveries. Precious metals exporters have
been the overall winners in terms of earnings, cash flows, and deleveraging. Other industrial
producers and domestically focused companies have been hit harder by the pandemic, and are
likely to recover to pre-pandemic earnings and leverage levels more slowly. This is largely as a
result of differential exposure to global demand dynamics, persistent and broad-based
affordability stress, the slow vaccine rollout, and reduced mobility.
The COVID-19 recovery trajectory for corporations in SSA is largely tracking the broader emerging
market story. However, given the diverse regional and industry exposures among SSA corporations
that we rate -19 journeys deviate from the mean. Around 80% of SSA
corporate issuers are listed and/or headquartered in South Africa, but many South Africa-based
corporations also have pan-African operations and/or end-market exposure to other developing
and developed markets. Companies also range from domestically focused to fully export-oriented.
We assess some of the key drivers affecting SSA corporations through their operations and
geographies, comparison of the paths of various sectors, and country risk impacts which are
common to corporations with material African exposure.
Operational Friction Puts The Brakes On The Pace Of Corporate Recovery
The great leveler across sectors is that all SSA corporations are at least somewhat impacted by red
tape and government failures (both broad indicators of country risk) which existed prior to the
pandemic and have been amplified by it, and are sources of operational friction.
Corporations in SSA continue to deal with local operational constraints that have exacerbated by
COVID-19 and related lockdowns. In our view, the most significant of these factors as: regulatory
stance, quality of regional infrastructure (power and transportation), FX volatility, supply chain
challenges, and cash upstreaming risks. These factors affect corporations to varying degrees, but
on balance could impair their resilience and pace of recovery in 2021 and beyond. They may also
discourage companies from further capital investment in the SSA region, acting as a permanent
drag on GDP growth.
Operational challenges for the rated corporations have been most marked in South Africa and
Nigeria, the two largest markets in SSA.
South Africa experienced a very stringent initial lockdown, which effectively halted all non-
essential business. The harsh impacts of affordability and mobility restrictions on discretionary
spending, along with supply chain disruption impacts on working capital levels and capex planning,
are starting to ease. However, currency volatility and infrastructure failures in the transportation
and power sectors are more perennial issues. Electricity supply remains constrained and
somewhat erratic, and rail and port volumes are below planned and required levels. These factors
are causing corporate recovery to slow through lost production and export sales, and upward
pressure on costs. Regulatory impacts on utilities, telecoms, and miners are also notable. For
example, water utilities didn't receive tariff increases to provide relief to consumers, and telecom
spectrum auctions have been delayed and are currently subject to various legal challenges.
Urgently required clarification on some points of mining legislation have also been delayed.
Primary contact
Omega Collocott
Johannesburg
omega.collocottl @spglobal.com
+27 11 214 4854

Emerging Markets Sub Saharan Africa
S&P Global Ratings June 16, 2021 14
Nigeria was heavily impacted by the decline in oil prices at the start of the pandemic which
diminished consumer affordability, and led to currency volatility and a shortage of hard currency.
including the corporations' inability to freely transfer cash out of Nigeria. Regulatory changes
affecting SIM card registration and delayed mobile money license approvals in telecoms are also
holding back corporate growth in this sector.
More broadly in SSA, we are seeing changes in some political regimes, leading to revisions to
telecoms and mining regulation, tax regimes, and cash transfer rules. Mining companies across the
continent are also facing rising attention to human rights abuses.
Financing conditions have been broadly supportive for large corporations through the pandemic,
with banks taking a pragmatic approach.
Covenant lifts or suspension have been commonplace, and are still available to issuers, although
many companies expect to exit their covenant lift periods within the next two to three quarters.
Public debt raising has been accelerating since the third quarter of 2020, with telecom and
commodities risk being preferred. Longer terms and lower rates than prior to the pandemic have
been achieved by large p
windfalls and favorable market conditions to downsize and term out funding. We're also seeing
deepening domestic markets in selected jurisdictions, notably Nigeria, which bodes well for
corporation y to manage currency and cash transfer risks going forward.
Industry Exposure Is The Dominant Driver Of COVID-19 Impact And Recovery Trajectories
The performance of SSA corporations through the pandemic and early-stage recovery is more a
reflection of global industry trends than of regional ones. Chart 13 illustrates that leverage trends
reflect, more than any other factor, differentials in industry and commodity exposure.
Chart 13
SSA: Average Sector Debt To EBITDA (EBITDA Weighted)
*Other rated corporates excludes Eskom Holding SOC Ltd. Source: S&P Global Ratings.
1.99
2.59
2.95
0.68
2.1
4.2
0.445
2.05
3.75
0.0
0.5
1.0
1.5
2.0
2.5
3.0
3.5
4.0
4.5
Mining & Metals Telecoms Other*
Debt to EBITDA (2019) Debt to EBITDA (2020) Debt to EBITDA Avg. (2021, 2022)

Emerging Markets Sub Saharan Africa
S&P Global Ratings June 16, 2021 15
Rated telecoms and tower companies across the region generally showed robust growth and
moderating leverage despite COVID-19. In 2020, mobile players benefitted from higher demand for
voice, data, and mobile money services, which largely offset the affordability stress of consumers
and SMEs, and constrained IT services demand. Furthermore, the pandemic has highlighted the
, and banking
services, and heightened the urgency of upscaling digital capacity across the continent. This,
together with a more accommodative stance from governments and regulators, given a stark
reminder of the critical nature of communications capacity and infrastructure, could provide a
structural underpin to growth for mobile telecoms and tower companies operating in SSA.
Leverage among more stressed sectors peaked in 2020, but may recover faster than we predict.
Chart 13 is diverse, spanning utilities, pulp/paper, oil, chemicals, cyclical
transportation, and retail. For these sectors, positive surprises have come through in the form of
tight working capital management, cost containment, capex deferral, and in some cases, rapidly-
executed asset disposal programs. As mobility, demand, and broader commodity prices improve,
we may see swifter deleveraging but in general don't expect these sectors to reach pre-COVID
leverage levels before 2023.
Commodity price trends were not uniform during the pandemic, but have been more broadly
supportive since the third quarter of 2020 (Chart 14). Precious metals producers (of gold and
platinum group metals [PGMs], for example), experienced high and rising prices throughout the
pandemic, which largely offset lower production volumes linked to workforce safety-related
restrictions at mining operations during lockdowns. These miners deleveraged swiftly in the past 12
months (off already improving trends) and have entered the pandemic recovery period with vastly
improved leverage and liquidity levels, together with trimmer cost bases. Notably, the three largest
precious metals miners among the rated SSA corporations have positive outlooks.
Chart 14
Selected Commodity Price Trends (2016-2021 YTD)
Source: S&P Global Ratings.
-50%
0%
50%
100%
150%
200%
250%
300%
350%
400%
450%
Jan-16 Aug-16 Mar-17 Sep-17 Apr-18 Oct-18 May-19 Dec-19 Jun-20 Jan-21
Brent Crude Coal (Richards Bay) Gold Platinum Palladium

Emerging Markets Sub Saharan Africa
S&P Global Ratings June 16, 2021 16
On the other hand, the earnings of oil, fuel, and chemicals producers in the region (and elsewhere)
suffered from the severe oil price declines in the first half of 2020, pushing leverage up. The
intensity of the COVID-19 impact on such companies hasn't been uniform, however, as levels of
absolute leverage going into 2020, differential hedging strategies, and relative exposure to currency
volatility influenced creditworthiness through the pandemic.
The post-COVID commodity price boom isn't restricted to metals and oil. Categories within food and
beverage commodities, and wood pulp are also seeing strong price recoveries. Higher commodity
prices are generally supporting corporate, and by extension fiscal, revenues of commodity-rich
countries in SSA.
South Africa derives around 40% of its export revenues from gold, PGMs, iron ore, manganese, and
coal, which is supplemented by rising prices of wood pulp, oil derivatives (chemicals/fuel), and
several agricultural products.
Nigeria is primarily an oil-based economy, with oil accounting for around 10% of GDP and 90% of
exports. The recovery in oil prices will bolster corporate revenues across the value chain.
More broadly in SSA, Ghana has some export diversification across gold, oil, and cocoa, while other
African countries including Zambia, The Democratic Republic of Congo, Mali, and Tanzania are also
metal-rich. Kenya has limited hard commodity resources, and agricultural exports may be unable
to compensate for losses from the pandemic-linked decline in tourism.
Overall, SSA corporations all face country-risk-related externalities to some degree, but industry
quality and prospects for their post-pandemic recovery.

Emerging Markets Sub Saharan Africa
S&P Global Ratings June 16, 2021 17
SSA Banks
The South African Banking Sector's Recovery Still Beset By The Pandemic
GDP shrank an estimated 7.3% in 2020, we expect it to rebound 3.6% in 2021. We forecast that the
growth of credit to the private sector will be subdued in 2021, averaging 6% in the next two years.
Credit losses rose to 2.1% in 2020 and will moderate to about 1.7% in 2021; nonperforming loans
(NPLs) will likely increase to 5% over the same period, reflecting the phaseout of the regulatory
forbearance measures. Households pose a material risk for banks because of their relatively high
leverage and lower wealth levels. Consumer delinquencies rose to 48% in 2020 due to loss of
income, which will likely translate into the underperformance of vehicle asset finance and personal
loans. Household leverage (defined as household debt to disposable income) increased to 77% in
2020 from an average of 72% in the past two years, and we expect it to average about 76% in the
next three years. Household debt metrics, including affordability, will remain under pressure in
2021 despite low interest rates in the short term.
in 2020. Commercial real estate has shown growing signs of stress since 2018. Structural shifts
have caused an increase in office vacancies, which combined with an extension of the current
lockdown measures, could weigh on performance beyond 2021. However, we expect stress in the
commercial real estate sector to marginally ease as economic activity picks up in 2021.
The South African Prudential Authority, in line with other G-20 regulators, has been proactive about
restructuring, capital relief, and liquidity measures to enable banks to provide borrower relief in
2020. Earnings proved resilient in the face of higher i
return on equity to increase to double-digit levels in 2021 after plunging to about 5% in 2020. We
also expect banks to resume dividend payments in 2021. South African banks are unlikely to make
use of their conservation buffer thanks to resilient earnings. We expect capital relief measures to
end by the end of 2021 as banks managed to preserve capital in 2020.
The South African banking sector has made progress in improving its funding base, but the bulk of
it continues to consist of short- and medium-term wholesale funding from nonbank financial
institutions. However, in a crisis, rand liquidity remains in the country because of resident exchange
controls, which mitigate banks' exposure to institutional funding. Additionally, major banks are not
exposed to large-scale refinancing risk thanks to their limited exposure to international funding.
This positively differentiates the South African banking sector from other emerging market banking
sectors.
Chart 15 Chart 16
NPLs Will Rise, While Credit Losses Start To Slip In 2021 Credit Leverage Will Contract But Remain High, While Lending Growth Will Remain Muted
Source: S&P Global Ratings. Source: S&P Global Ratings.
0.0
0.5
1.0
1.5
2.0
2.5
0.0
1.0
2.0
3.0
4.0
5.0
6.0
2018 2019 2020 2021f 2022f
Cre
dit
loss
es/t
ota
l lo
ans
(%)
NP
As/
Sys
tem
wid
e lo
ans
(%)
NPAs/systemwide loans (%) (LHS) Credit losses/Total loans
0.0
1.0
2.0
3.0
4.0
5.0
6.0
7.0
8.0
9.0
50.0
55.0
60.0
65.0
70.0
75.0
80.0
85.0
90.0
95.0
100.0
2018 2019 2020 2021f 2022f
Loan
gro
wth
(%
)
Pri
vate
sec
tor
cred
it t
o G
DP
(%
)
Private sector credit to GDP Loan growth
Primary contact
Samira Mensah
Johanesburg
email @spglobal.com
Phone
Emerging Markets Sub Saharan Africa
S&P Global Ratings June 16, 2021 18
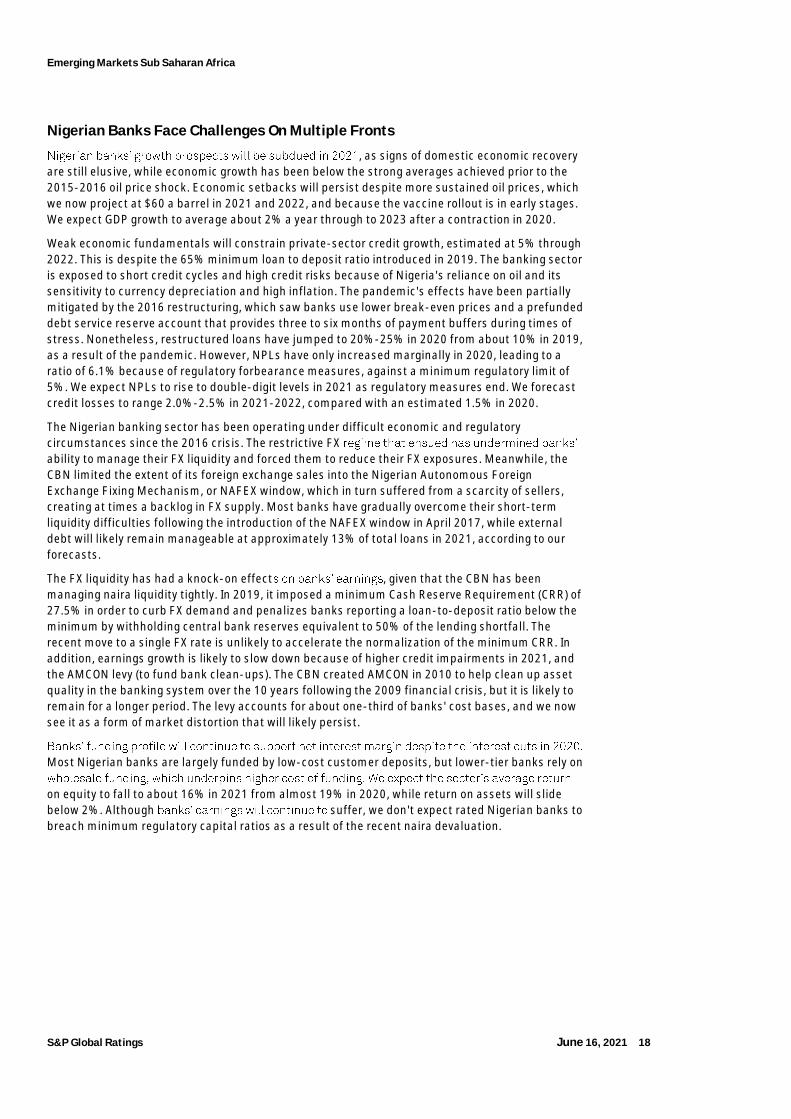
Nigerian Banks Face Challenges On Multiple Fronts
, as signs of domestic economic recovery
are still elusive, while economic growth has been below the strong averages achieved prior to the
2015-2016 oil price shock. Economic setbacks will persist despite more sustained oil prices, which
we now project at $60 a barrel in 2021 and 2022, and because the vaccine rollout is in early stages.
We expect GDP growth to average about 2% a year through to 2023 after a contraction in 2020.
Weak economic fundamentals will constrain private-sector credit growth, estimated at 5% through
2022. This is despite the 65% minimum loan to deposit ratio introduced in 2019. The banking sector
is exposed to short credit cycles and high credit risks because of Nigeria's reliance on oil and its
sensitivity to currency depreciation and high inflation. The pandemic's effects have been partially
mitigated by the 2016 restructuring, which saw banks use lower break-even prices and a prefunded
debt service reserve account that provides three to six months of payment buffers during times of
stress. Nonetheless, restructured loans have jumped to 20%-25% in 2020 from about 10% in 2019,
as a result of the pandemic. However, NPLs have only increased marginally in 2020, leading to a
ratio of 6.1% because of regulatory forbearance measures, against a minimum regulatory limit of
5%. We expect NPLs to rise to double-digit levels in 2021 as regulatory measures end. We forecast
credit losses to range 2.0%-2.5% in 2021-2022, compared with an estimated 1.5% in 2020.
The Nigerian banking sector has been operating under difficult economic and regulatory
circumstances since the 2016 crisis. The restrictive FX
ability to manage their FX liquidity and forced them to reduce their FX exposures. Meanwhile, the
CBN limited the extent of its foreign exchange sales into the Nigerian Autonomous Foreign
Exchange Fixing Mechanism, or NAFEX window, which in turn suffered from a scarcity of sellers,
creating at times a backlog in FX supply. Most banks have gradually overcome their short-term
liquidity difficulties following the introduction of the NAFEX window in April 2017, while external
debt will likely remain manageable at approximately 13% of total loans in 2021, according to our
forecasts.
The FX liquidity has had a knock-on effect , given that the CBN has been
managing naira liquidity tightly. In 2019, it imposed a minimum Cash Reserve Requirement (CRR) of
27.5% in order to curb FX demand and penalizes banks reporting a loan-to-deposit ratio below the
minimum by withholding central bank reserves equivalent to 50% of the lending shortfall. The
recent move to a single FX rate is unlikely to accelerate the normalization of the minimum CRR. In
addition, earnings growth is likely to slow down because of higher credit impairments in 2021, and
the AMCON levy (to fund bank clean-ups). The CBN created AMCON in 2010 to help clean up asset
quality in the banking system over the 10 years following the 2009 financial crisis, but it is likely to
remain for a longer period. The levy accounts for about one-third of banks' cost bases, and we now
see it as a form of market distortion that will likely persist.
Most Nigerian banks are largely funded by low-cost customer deposits, but lower-tier banks rely on
on equity to fall to about 16% in 2021 from almost 19% in 2020, while return on assets will slide
below 2%. Although suffer, we don't expect rated Nigerian banks to
breach minimum regulatory capital ratios as a result of the recent naira devaluation.

Emerging Markets Sub Saharan Africa
S&P Global Ratings June 16, 2021 19
Chart 17 Chart 18
NPLs And Credit Losses Will Increase In 2021 Credit Leverage Will Rise Ro Above Pre-Pandemic Levels By 2022 But Remain Low
Source: S&P Global Ratings. Source: S&P Global Ratings.
High Economic Imbalances Hindered The Kenyan Banking Sector's Recovery
external sector position will likely
average 5.4% of GDP and external debt (net of liquid external assets) to average about 240% of
current account receipts through 2024. The country's GDP growth and fiscal position have also
been hit by the COVID-19 pandemic. The latter, subsequent lockdown, and value-chain disruption
have hurt several economic sectors, in particular, trade and manufacturing. We forecast Kenya's
real GDP growth at 4.4% in 2021 before returning to pre-pandemic levels, averaging 5.4% in 2022-
2024.
We estimate that lending to the private sector grew about 8% in 2020, and only mid-single digit
growth rate in 2021. Loan growth has been undermined in the past five years by the cap on interest
to adequately price risk. Lending growth has averaged less than 5% in 2017-2019. The positive
impact of the lift of the cap on interest rates was short lived because of the 2020 pandemic crisis.
We expect the ratio of domestic credit to private sector and to GDP to remain below 30% in 2021 as
banks will largely focus on recoveries amid rising NPLs. Household leverage to GDP is very low in
Kenya, accounting for less than 5% of GDP in 2020, but lending to households accounted for a
quarter of total loans in the system. This is a source of risk given low wealth levels and their
vulnerability to high interest rate and inflation. At the same time, risks in the commercial real
estate sector have risen, and banks' exposure to this sector is a high 15% of total lending at the end
of end 2020.
We expect asset quality to deteriorate this year following the end of regulatory forbearance
estimate that credit loss ratio rose to 4% of systemwide loans in 2020. We now expect credit losses
to peak at around 3% of systemwide loans in 2021 and moderate to around 2.5% starting in 2022.
We believe this will translate into an increase in stage 3 loans, raising the NPL ratio to 16% in 2021
from about 14% in 2020.
Overall, the banking system's return on equity (ROE) plummeted to about 14% in 2020 from the
22% average in 2017- to edge up to 15% in 2021, while
return on assets to improve to about 2% from a record low of 1.65% in 2020. This is still sufficient
for banks to maintain capitalization well above the minimum regulatory requirements. However, we
don't exclude some capital events for smaller banks. With 55 banks, Kenya appears overbanked
and fragmented. We expect the industry consolidation to continue over the next few years, largely
affecting medium and small banks, which are likely to be those most affected by the current crisis.
0.0
0.5
1.0
1.5
2.0
2.5
3.0
0.0
2.0
4.0
6.0
8.0
10.0
12.0
14.0
2018 2019 2020f 2021f 2022f
Cre
dit
los
se
s/t
ota
l lo
an
s (
%)
NP
As
/ S
yste
mw
ide
lo
an
s (
%)
NPAs/systemwide loans (%) (LHS) Credit losses/Total loans
-6.0
-4.0
-2.0
0.0
2.0
4.0
6.0
8.0
10.0
12.0
14.0
16.0
11.3
11.4
11.5
11.6
11.7
11.8
11.9
2018 2019 2020f 2021f 2022f
Lo
an
gro
wth
(%
)
Pri
vate
se
cto
r c
red
it t
o G
DP
(%
)
Private sector credit to GDP Loan growth

Emerging Markets Sub Saharan Africa
S&P Global Ratings June 16, 2021 20
Furthermore, the sector will likely maintain a broadly stable funding profile with limited external
funding. While the domestic debt market is broadening thanks to the government's active role in
managing its debt program, private-sector issuance is limited. Debt market volume is estimated at
25% of GDP. This limits the options available for banks to lengthen their maturity profile.
Chart 19 Chart 20
NPLs And Credit Losses Will Widen In 2021 Credit Leverage And Lending To Drop In 2021
Source: S&P Global Ratings. Source: S&P Global Ratings.
0.0
0.5
1.0
1.5
2.0
2.5
3.0
3.5
4.0
4.5
0.0
2.0
4.0
6.0
8.0
10.0
12.0
14.0
16.0
18.0
2018 2019 2020 2021f 2022f
Cre
dit
los
se
s/t
ota
l lo
an
s (
%)
NP
As
/ S
yste
mw
ide
lo
an
s (
%)
NPAs/systemwide loans (%) (LHS) Credit losses/Total loans
0.0
1.0
2.0
3.0
4.0
5.0
6.0
7.0
8.0
9.0
24.5
25.0
25.5
26.0
26.5
27.0
27.5
28.0
28.5
29.0
2018 2019 2020 2021f 2022f
Lo
an
gro
wth
(%
)
Pri
vate
se
cto
r c
red
it t
o G
DP
(%
)
Private sector credit to GDP Loan growth

Emerging Markets Sub Saharan Africa
S&P Global Ratings June 16, 2021 21
S&P Global Ratings believes there remains high, albeit moderating, uncertainty about the evolution
of the coronavirus pandemic and its economic effects. Vaccine production is ramping up and rollouts
are gathering pace around the world. Widespread immunization, which will help pave the way for a
return to more normal levels of social and economic activity, looks to be achievable by most
developed economies by the end of the third quarter. However, some emerging markets may only be
able to achieve widespread immunization by year-end or later. We use these assumptions about
vaccine timing in assessing the economic and credit implications associated with the pandemic (see
our research here: www.spglobal.com/ratings). As the situation evolves, we will update our
assumptions and estimates accordingly.
Related Research Emerging Markets Monthly Highligh
Promising Start, June 10, 2021
Sovereign Rating Score Snapshot, June 2, 2021
Bulletin: South Africa Banking Sector Recovery Will Be Gradual Due To Lingering Effects Of The Pandemic; June 1, 2021
Research Update: South Africa Ratings Affirmed At 'BB-/B' Foreign Currency And 'BB/B' Local Currency; Outlook Stable; May 21, 2021
Credit Conditions Emerging Markets Q2 2021: Brighter Prospects Prone To Setbacks; March 30, 2021
Full Analysis: Ethiopia, March 29, 2021
Full Analysis: Ghana, March 15, 2021
Research Update: Ratings On Kenya Lowered To 'B' On Rising Fiscal And External Pressures; Outlook Stable; March 5, 2021
Full Analysis: Nigeria, Feb. 15, 2021
This report does not constitute a rating action.

No content (including ratings, credit-related analyses and data, valuations, model, software or other application or output therefrom) or any part thereof (Content) may be modified, reverse engineered, reproduced or distributed in any form by any means, or stored in a database or retrieval system, without the prior written permission of Standard &
unauthorized purposes. S&P and any third-party providers, as well as their directors, officers, shareholders, employees or agents (collectively S&P Parties) do not guarantee the accuracy, completeness, timeliness or availability of the Content. S&P Parties are not responsible for any errors or omissions (negligent or otherwise), regardless of the cause, for the results obtained from the use of the Content, or for the security or maintenance of any data input by the user.
S&P PARTIES DISCLAIM ANY AND ALL EXPRESS OR IMPLIED WARRANTIES, INCLUDING, BUT NOT LIMITED TO, ANY WARRANTIES OF MERCHANTABILITY OR FITNESS FOR A PARTICULAR PURPOSE OR USE, FREEDOM FROM BUGS,
BE UNINTERRUPTED, OR THAT THE CONTENT WILL OPERATE WITH ANY SOFTWARE OR HARDWARE CONFIGURATION. In no event shall S&P Parties be liable to any party for any direct, indirect, incidental, exemplary, compensatory, punitive, special or consequential damages, costs, expenses, legal fees, or losses (including, without limitation, lost income or lost profits and opportunity costs or losses caused by negligence) in connection with any use of the Content even if advised of the possibility of such damages. Credit-related and other analyses, including ratings, and statements in the Content are statements of opinion as of the
(described below) are not recommendations to purchase, hold, or sell any securities or to make any investment decisions, and do not address the suitability of any security. S&P assumes no obligation to update the Content following publication in any form or format. The Content should not be relied on and is not a substitute for the skill, judgment and experience of the user, its management, employees, advisors and/or clients when making investment and other business decisions. S&P does not act as a fiduciary or an investment advisor except where registered as such. While S&P has obtained information from sources it believes to be reliable, S&P does not perform an audit and undertakes no duty of due diligence or independent verification of any information it receives. To the extent that regulatory authorities allow a rating agency to acknowledge in one jurisdiction a rating issued in another jurisdiction for certain regulatory purposes, S&P reserves the right to assign, withdraw, or suspend such acknowledgement at any time and in its sole discretion. S&P Parties disclaim any duty whatsoever arising out of the assignment, withdrawal, or suspension of an acknowledgment as well as any liability for any damage alleged to have been suffered on account thereof. S&P keeps certain activities of its business units separate from each other in order to preserve the independence and objectivity of their respective activities. As a result, certain business units of S&P may have information that is not available to other S&P business units. S&P has established policies and procedures to maintain the confidentiality of certain nonpublic information received in connection with each analytical process. S&P may receive compensation for its ratings and certain analyses, normally from issuers or underwriters of securities
made available on its Web sites, www.standardandpoors.com (free of charge), and www.ratingsdirect.com and www.globalcreditportal.com (subscription) and www.spcapitaliq.com (subscription) and may be distributed through other means, including via S&P publications and third-party redistributors. Additional information about our ratings fees is available at Copyright © 2019 by STANDARD & POOR'S, S&P and RATINGSDIRECT are registered trademarks of Standard & Poor's Financial Services LLC.
spglobal.com/ratings


