
AND ENVIRONMENTAL IMPACT STATEMENT …...-- B - iii -- Feasibility Report and Environmental Impact...
185
FEASIBILITY REPORT AND ENVIRONMENTAL IMPACT STATEMENT COASTAL STORM DAMAGE REDUCTION PROJECT SURF CITY AND NORTH TOPSAIL BEACH NORTH CAROLINA Appendix B Economic Analysis
Transcript of AND ENVIRONMENTAL IMPACT STATEMENT …...-- B - iii -- Feasibility Report and Environmental Impact...

FEASIBILITY REPORT
AND ENVIRONMENTAL IMPACT
STATEMENT
COASTAL STORM DAMAGE REDUCTION PROJECT
SURF CITY AND NORTH TOPSAIL BEACH NORTH CAROLINA
Appendix B Economic Analysis


-- B - i -- Feasibility Report and Environmental Impact Statement
Appendix B: Economic Analysis
1.0 Introduction. .................................................................................................... 6
1.01 Coastal Storm Damage Study Area. ......................................................... 6 1.02 Recreation Day User Study Area .............................................................. 7 1.03 Regional Economic Impact Area ............................................................... 8
2.0 Existing Economic Conditions: ....................................................................... 8 2.01 Basic Economic Assumptions .................................................................. 8 2.02 Demographics .......................................................................................... 9
In Labor Force ............................................................................................... 9 Employment by Leading Industry .................................................................. 9 Per capita & Household Income .................................................................... 9
2.03 Shoreline Ownership .............................................................................. 10 2.04 Commercial and Recreational Fishing ................................................... 10 2.05 Development Added to Existing Condition ............................................. 11 2.06 Storm Related Emergency Costs ............................................................ 11
2.06.1 Beach Scraping/Pushing ................................................................. 12 2.06.2 Sandbagging Structures ................................................................... 13 2.06.3 NCDOT Emergency Costs ............................................................... 14 2.06.4 Damage to Public Property ............................................................... 14 2.06.5 Damage to Other Private Property ................................................... 14 2.06.6 Post Storm Recovery Costs ............................................................. 14
2.07 Determination of Structure Values ......................................................... 14 2.07.1 Cost of Residential Construction. ..................................................... 15 2.07.2 Commercial Structure Values. .......................................................... 15 2.07.3 Value of Structures by Reach ........................................................... 15 2.07.4 Value of Structures by Type ............................................................. 17
2.08 Land Values ........................................................................................... 19 2.08.1 Ocean front lots ............................................................................... 19 2.08.2 Second row lots ............................................................................... 20 2.08.3 Interior lots ....................................................................................... 20
3.0 Future Economic Conditions (Without Project) ............................................. 21 3.01 Projected Population Growth .................................................................. 21 3.02 Assumed Conditions at beginning of Period of Analysis Without Project Condition ......................................................................................................... 22 3.03 Assumed Replacement of Residential Structures During Period of Analysis .......................................................................................................... 22 3.04 Assumed Replacement of Commercial Structures During Period of Analysis .......................................................................................................... 23 3.05 Summary of Future Without Project Economic Conditions ..................... 23
4.0 Coastal Storm Damages without Project ...................................................... 23 4.01 Damage Categories Defined ................................................................... 24 4.01_Damage Categories Defined (continued) ............................................... 25
4.01.1 Storm Erosion .................................................................................. 25 4.01.2 Flood ................................................................................................ 26

-- B - ii -- Feasibility Report and Environmental Impact Statement
4.01.3 Wave ............................................................................................... 26 4.01.4 Land lost or Long Term Erosion (LTE) ............................................ 26 4.01.5 Summary of Damages ..................................................................... 26
5.0. Economic Variables, Assumptions, and Methodology Applied in COASTAL Storm Damage Model (GRANDUC) ................................................................... 30
5.01 General Global Data .............................................................................. 30 5.02 Base Year .............................................................................................. 30 5.03 Interior Lot Value per Square Foot ......................................................... 30 5.04 Initial Benefits ........................................................................................ 31 5.05 Other Annual Benefits ............................................................................ 31 5.06 Flood Damage Curves ........................................................................... 31 5.07 Erosion Damage Curves ........................................................................ 31 5.08 Variables Specific to Structure File ........................................................ 32
5.08.1 Structure Type – flood damage curve ............................................. 34 5.08.2 Structure Value ............................................................................... 34 5.08.3 Content Value ................................................................................. 34 5.08.4 Elevation at ground ......................................................................... 35 5.08.5 Elevation at First Floor .................................................................... 36 5.08.6 Erosion Type ................................................................................... 36 5.08.7 Erosion Indicator ............................................................................. 38
6.0. Alternatives to Reduce COASTAL Storm Damages .................................... 39 6.01 Structural Plans ..................................................................................... 39 6.02 Non-structural Plans .............................................................................. 41
7.0 Economics of NED Plan (Plan 1550) ............................................................ 41 7.01 Economic Damages – remaining with plan ............................................ 41 7.02 Economic Benefits ................................................................................. 43
7.02.1 Coastal Storm Damage Reduction Benefits ..................................... 43 7.02.2 Reduced Emergency Costs Benefits ................................................ 43 7.02.3 Benefits During Construction ........................................................... 44 7.02.4 Recreation Benefits ......................................................................... 45 7.02.5 Commercial and Recreational Fishing Impacts: .............................. 46 7.02.6 Summary of Benefits to NED Plan ................................................... 46
7.03 Project Costs for NED Plan.................................................................... 46 7.03.1 First Costs ........................................................................................ 47 7.03.2 Interest During Construction ............................................................ 48 7.03.3 Total Investment Cost ...................................................................... 51 7.03.4 Present Value of Future Nourishment Costs .................................... 51
7.04 Average Annual Project Costs for NED Plan ......................................... 52 7.04.1 I&A of Total Investment ................................................................... 52 7.04.2 Annual OMRR&R ............................................................................ 52 7.04.3 Annual Monitoring ........................................................................... 52 7.04.4 I&A of Future Nourishment .............................................................. 52
7.05 Benefit/Cost Comparison for NED Plan ............................................... 53 8.0. Regional Economic Development (RED) Impacts ....................................... 54
8.01 Preserve Tax Base and, Property Values .............................................. 55 8.02 Employment Stability ............................................................................ 55

-- B - iii -- Feasibility Report and Environmental Impact Statement
8.03 Community and Regional Growth .......................................................... 55 8.04 Displacement of People, Businesses, and Farms .................................. 55
9.0 Uncertainty and Sensitivity of analysis to variation of Values and Assumptions ....................................................................................................... 56
9.01 Coastal Storm Damage Reduction ......................................................... 56 9.01.1 Erosion indicators (Topsail Beach example) .................................... 56 9.01.2 Erosion Damage Curves ................................................................. 57
9.02 Exclude Recreation Benefits .................................................................. 57 9.03 Interest Rate ........................................................................................... 57 9.04 Land Values ............................................................................................ 58
List of Tables Table B -1 - North C arolina C ounties w ithin D riving Distance o f Surf C ity and
North Topsail Beach
Table B-2 - Population, Income, Housing Summary for 2000
Table B-3A - Value of Structures by Reach, Surf City, NC
Table B-3B- Value of Structures by Reach, North Topsail Beach, NC
Table B-4 - Description of Four Significant Structure Types
Table B-5 - Value of Structures by Type
Table B-6 - Present Value of Coastal Storm Damages (Without Project)
Table B-7 - Average Annual Coastal Storm Damages (Without Project)
Table B- 8 - Sample Structure File
Table B-9 - Economic Comparisons, Average Annual Amounts
Table B-10 – Present Value of Remaining Damages with NED Plan
Table B -11 - Remaining A verage A nnual Coastal Storm Da mages wit h NED
Plan
Table B-12 - Average Annual Coastal Storm Damage Reduction Benefits w ith
NED Plan
Table B-13 – Benefits During Construction, Plan 1550 (NED Plan)
Table B-14 - Summary of Averge Annual Benefits to NED Plan
Table B-15 – Summary of Expenditures During Construction
Table B-16 - Calculation of Interest during Construction for NED Plan

-- B - iv -- Feasibility Report and Environmental Impact Statement
Table B-17 - Project Annual Costs, Plan 1550 (NED Plan)
Table B- 18 - Summary of Initial Construction & Annual Costs for NED Plan
Table B-19 – Project Annual Benefits, Plan 1550 (NED Plan)
Table B-20 - Annual Benefits, Costs, and Benefit-Cost Ratio – NED Plan
Table B-21 – Sensitivity Analysis - Erosion Indicators
List of Figures
Figure B-1 - Coastal Storm Damage Reduction Study Area
Figure B-2 - Recreation Demand Study Area
Figure B- 3 - Post storm Beach Scraping – Emergency Costs
Figure B-4 – Beach scraping following Hurricane Fran
Figure B-5 – Sandbags in place but threatened
Figure B- 6 - Four typical new structures on Topsail Island
Figure B- 7 - Interior Lot Sales in Dollars per Square Foot
Figure B- 8 - Population Growth Pender and Onslow Counties Actual 1920-2000
and Projected to 2029
Figure B- 9 - Hurricane Surge and Wave Impacts.
Figure B-10 – Coastal storm damage after Hurricane Fran 1996
Figure B- 11 – Present Value of Coastal Storm Damages by Damage Category –
Without Project Condition
Figure B-12 - Erosion curve for Residential 1-story on Short Pilings (#21)
Figure B-13 - Erosion curve for Residential 2-story on Long Pilings (#24)
Figure B-14 - Erosion curve for Residential 1-story Full Enclosure on Short
Pilings (# 2)
Figure B-15 - Erosion curve all commercial, residential on slab foundation, plus
all 2nd and 3rd row structures (# 31)
Figure B-16 - Illustrations of Structure and Lot Distances entered into GRANDUC
model
Figure B-17 - Illustration of Residential Structure Elevations

-- B - v -- Feasibility Report and Environmental Impact Statement
Figure B-18 - Illustration of Shoreline Types (High dune and Low dune)
Figure B-19 – Illustration of Erosion Indicator
Figure B-20 – Topsail Island home raised on piling foundation 2004
Figure B-21 – Distribution of Initial Construction Costs – Plan 1550 (NED) Plan
Figure B-22 – Compare Erosion Distance using Different Indicators
List of Attachments
Attachment B-1 Description of Structure Types
Attachment B-2 Erosion Damage Curves
Attachment B-3 Structure Files
Attachment B-4 Rogers, Spencer, 2002. “Erosion Damage Thresholds in North
Carolina” North Carolina Sea Grant

Surf City and North Topsail Beach, NC Final Feasibility Report and Draft Environmental Impact Statement
6
1.0 INTRODUCTION.
The t otal e conomic i mpact a rea f or Surf Cit y and N orth Topsail B each i s far-reaching. All of Top sail I sland i s i mportant bec ause of the t ransportation system. R esidents a nd v isitors m ust c ross ov er on e of two b ridges o ver the Atlantic Intracoastal Waterway (AIWW) to gain access to the Town of Surf City and the Town of North Topsail Beach. The first is a swing bridge that provides access near the center of Surf City and NC Highways 210 and 50. The second is a high-rise bridge crossing the AIWW in the northern section of North Topsail Beach f or NC Hi ghway 210. The s tudy ar ea for coastal storm d amage reduction, beach r ecreation us e, and regional ec onomic de velopment (RED) are described in the sections below.
1.01 Coastal Storm Damage Study Area. The towns of Surf City and North Topsail Beach, North Carolina are subject to damages f rom hu rricanes and storm r elated e rosion. The study ar ea was limited to the area approximately 500 feet from the shoreline. This area includes commercial and residential structures l ocated on oc ean f ront l ots, a s w ell as two or three rows beyond the shoreline. Streets, highways, and utilities are also included in the area threatened by flood, waves, storm erosion, and l ong-term erosion. The study area begins at the Topsail Beach-Surf City town limits and covers a di stance o f about 17 miles, goi ng t he f ull l ength of t he Surf Cit y shoreline (6 m iles) and the pr imary no n-CBRA p ortion ( 3.8 m iles) of No rth Topsail Beach. The coastal storm damage study area is divided into “reaches” of approximately 1,000 feet as shown in Figure B-1.

Surf City and North Topsail Beach, NC Final Feasibility Report and Draft Environmental Impact Statement
7
Figure B-1 Coastal Storm Damage Reduction Study Area
1.02 Recreation Day User Study Area Overnight visitors come from as far away as 3,000 miles; however, the 46 counties listed in Table B-1 and shown in Figure B-2 were selected as being within a reasonable driving distance of Surf City and North Topsail Beach. The purpose of the survey of potential day users was to collect data that will show the frequency of visits and the total number of trips to Surf City and North Topsail Beach. It is expected that the analysis will show that persons from nearby counties will visit more frequently than persons from the more distant counties.
Table B-1 - North Carolina Counties within Driving Distance of Surf City and North Topsail Beach, NC
Anson Edgecombe Martin Robeson Beaufort Franklin Montgomery Sampson Bertie Granville Moore Scotland Bladen Greene Nash Stanly Brunswick Halifax New Hanover Vance Carteret Harnett Northampton Wake Chatham Hertford Onslow Warren Columbus Hoke Orange Washington Craven Johnston Pamlico Wayne Cumberland Jones Pender Wilson Duplin Lee Pitt Durham Lenoir Richmond

Surf City and North Topsail Beach, NC Final Feasibility Report and Draft Environmental Impact Statement
8
Figure B-2 – Recreation Demand Study Area The recreation demand and methodology recommended for the beach user benefit analysis are presented in Appendix O –Recreation. According to the U. S. Census the population of the forty-five-county area grew from 3,036,000 in 1990 to 3,686,000 in 2000, an increase of more than 20 percent in the decade.
1.03 Regional Economic Impact Area The local economic impact area i ncludes al l of Topsail I sland and t he nearby areas o f b oth P ender C ounty and O nslow C ounty, N orth C arolina. Top sail Island i ncludes no t only Surf City a nd North Top sail B each but al so Topsail Beach on the south end of the island. Highways 50 and 210 connect the island to t he mainland por tion of t he two c ounties. The b oundaries of P ender and Onslow counties are shown in Figure B-2.
2.0 EXISTING ECONOMIC CONDITIONS:
2.01 Basic Economic Assumptions This study is in compliance with the evaluation procedures outlined in the Water Resource Council's Economic and Environmental Principles and Guidelines (P&G) for Water and Related Land Resources Implementation Studies, dated 10 March 1983, and Corps of Engineers policy guidance on Coastal Storm Damage
Surf City & North Topsail Beach, NC

Surf City and North Topsail Beach, NC Final Feasibility Report and Draft Environmental Impact Statement
9
Reduction, ER 1105-2-100, dated 22 April 2000. The following basic economic assumptions were used in the analysis of damages, benefits, and costs.
Interest rate. The FY 2011 Federal interest rate is 4.125 percent. Price level. October 2010 price levels. Period of Analysis. The analysis is based on a 50-year period.
2.02 Demographics Demographics for the existing economic conditions for the two-county study area include census data for population, housing, and personal income, which are shown in Table B-2. The full-time resident population was estimated to be nearly 2236 in 2000. Estimates of peak season population vary. According to the towns of Surf City and North Topsail Beach officials, the estimated peak summer time population of the two towns is greater than 30,000. Table B-2 - Population, Income, Housing Summary Pender Onslow Surf North County County City Topsail Population year-round(2007 estimate) 50,430 169,302 1,766 898 Population year-round (2000 census) 41,082 150,355 1,393 843 Population peak season (Estimated) 15,438 15,000-
20,000 Ave. Household size 2.49 2.72 2.02 1.87 Housing Units 20,798 55,726 2,578 2,085 Occupied year-round 16,054 48,122 689 451 Seasonal or vacant 4,744 7,604 1,889 1,634
In Labor Force 19,087 85,054 754 545 Civilian 18,972 52,670 Unemployed 1,076 3,650 Armed Forces 115 32,384
Employment by Leading Industry
Construction 2,468 5,022 Manufacturing 2,632 2,682 Retail trade 2,367 7,496 Education, health & social services 2,704 10,865
Per capita & Household Income
Per capita money income $17,882 $14,853 $25,242 $33,972 Median Household Income 1999 $35,902 $33,756 $40,521 $45,982

Surf City and North Topsail Beach, NC Final Feasibility Report and Draft Environmental Impact Statement
10
Source: U.S. Census Bureau (http://factfinder.census.gov) and U.S. Dept. of Commerce – Bureau of Economic Analysis (http://bea.doc.gov/bea) Office of State Budget and Management (2007 population estimates)
2.03 Shoreline Ownership Public ownership of the shore in the town of Surf City and North Topsail Beach includes dedicated roads and lands below mean high water (MHW) owned by the State of North Carolina. Other parcels are owned by the towns of Surf City and North Topsail Beach, including the Coastal Area Management Act (CAMA) public access points. The primary ownership of the 828 oceanfront parcels is private. Privately owned properties included in the Project are considered to be in fee simple ownership. Included within the project limits are single family residential units, multi family and condominium units, and commercial properties, including the fishing piers. Other information related to ownership of the shoreline is contained in the Real Estate Report.
2.04 Commercial and Recreational Fishing The North Carolina Division of Marine Fisheries (NCDMF) reported nearly 600,000 pounds of commercial finfish and shellfish landings in the vicinity of New Topsail Inlet in both 2003 and 2004. Significant shellfish landings included over 200,000 pounds reported from Hampstead and over 100,000 pounds reported from Surf City in 2003. Finfish landings reported from Hampstead exceeded 100,000 pounds in both 2003 and 2004. The commercial value of all finfish and shellfish landings reported in the vicinity of New Topsail Inlet was nearly $800,000 in both 2003 and 2004. Recreational fishing includes fishing from head boats, charter boats, private boats, piers, and the surf. Fishing from head boats is best in the winter months for snapper and grouper. Fishing from charter boats is excellent for King mackerel and bottomfish during the winter. Offshore, gulfstream species, like yellowfin tuna and Wahoo are available. Inside fishing has been successful for inshore species such as red drum, speckled trout, and flounder. Private boat anglers can find bluefin tuna in the nearshore area, king mackerel and other bottomfish species in the offshore, and other species such as speckled trout, red drum, and flounder can be found in the inside areas of the creeks and Atlantic Intracoastal Waterway. NCDMF reports that shore fishing activity will be limited in this area.

Surf City and North Topsail Beach, NC Final Feasibility Report and Draft Environmental Impact Statement
11
2.05 Development Added to Existing Condition
The without project structure inventory assumes typical residential structures will be built on the 112 suitable vacant first row lots and an additional other 340 lots. Currently, there are vacant lots existing, but based on the established building patterns and the coastal North Carolina real estate market trends, it is expected that these structures will be built by the end of construction in 2018.
The typical residential structure presently constructed on Topsail Island has the following characteristics: two-story, approximately 2,100 square feet of heated space, built on a piling foundation, and includes no more than a small enclosure on the ground level to provide a staircase or elevator for access.
The value of these additional 450 structures is about $273,000 each, totaling approximately $160 million. This value is based on a typical residential structure of 2,100 square feet and a construction cost of $130.00 per square foot. It is also assumed that all these structures will meet building codes for piling depth and first-floor elevation.
2.06 Storm Related Emergency Costs Information was collected from the officials of the towns, Pender County, Onslow County, state, and federal sources following recent hurricanes and storms. Benefits from prevention of emergency costs are estimated to have an equivalent annual value of $99,000 for Surf City and $235,000 for North Topsail Beach, for a total of $334,000 over the entire project length. This category of benefits is not very precise and is relatively minor compared to CSDR benefits (1 to 2%) and so, is dropped from the total.
Emergency costs prevented refer to expected annual expenditures that residents and governments are experiencing under the without project condition that a project would preclude. Other damages prevented include storm damages that are not covered under the National Flood Insurance Program, but represent financial drains on public and private storm victims that could be prevented. The items in this benefit category called emergency costs and other damages prevented include (1) beach scraping/pushing; (2) sandbagging: (3) emergency costs incurred by the North Carolina Department of Transportation; (4) damages to public property like water and electric utility distribution systems and public access walkways; (5) damages to private property other than structures and contents such as walkways, driveways, and cleanup costs; and, (6) post-storm recovery expenses and storm related expenses from increased police patrolling, inspections, and permits. These categories are described in detail below:
Surf City and North Topsail Beach, NC Final Feasibility Report and Draft Environmental Impact Statement
12
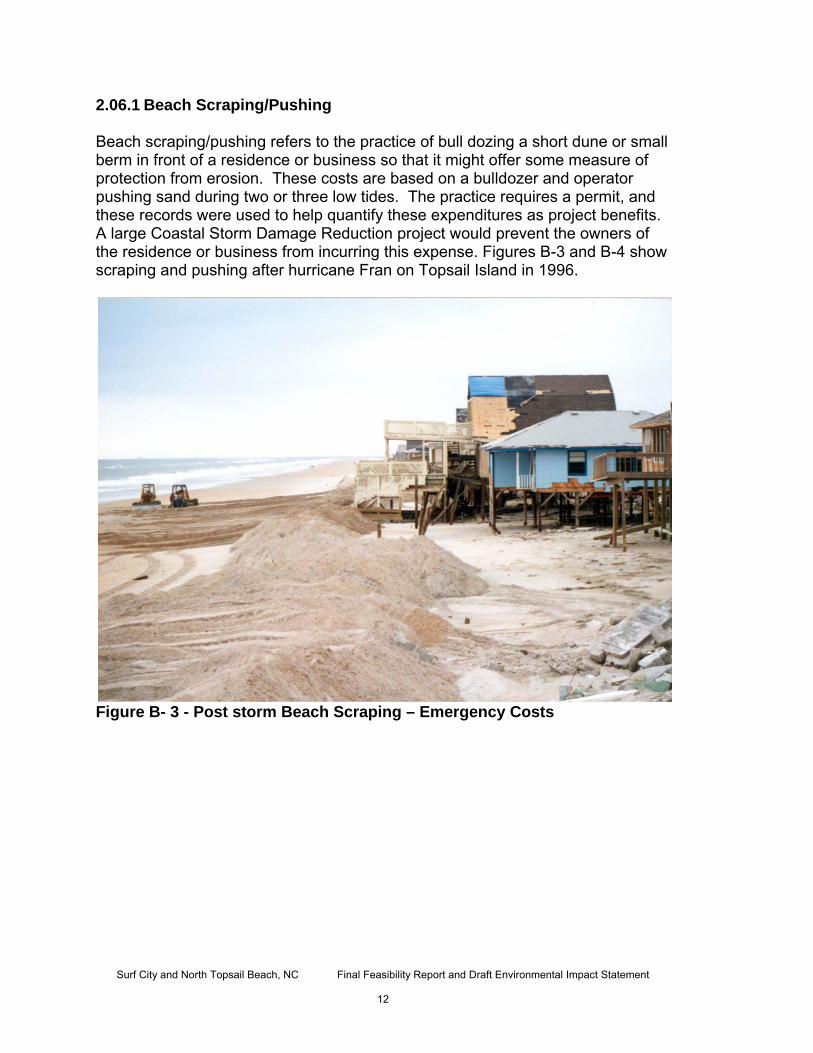
2.06.1 Beach Scraping/Pushing Beach scraping/pushing refers to the practice of bull dozing a short dune or small berm in front of a residence or business so that it might offer some measure of protection from erosion. These costs are based on a bulldozer and operator pushing sand during two or three low tides. The practice requires a permit, and these records were used to help quantify these expenditures as project benefits. A large Coastal Storm Damage Reduction project would prevent the owners of the residence or business from incurring this expense. Figures B-3 and B-4 show scraping and pushing after hurricane Fran on Topsail Island in 1996.
Figure B- 3 - Post storm Beach Scraping – Emergency Costs

Surf City and North Topsail Beach, NC Final Feasibility Report and Draft Environmental Impact Statement
13
Figure B-4 - Beach scraping following Hurricane Fran 2.06.2 Sandbagging Structures Sandbagging structures is another emergency measure that has been fairly commonplace over recent years in this area. An example of sandbagging is shown in Figure B-5. This requires a permit that is only granted if the property is in imminent danger of being lost to erosion.
Figure B-5 - Sandbags in place but threatened February 2005.

Surf City and North Topsail Beach, NC Final Feasibility Report and Draft Environmental Impact Statement
14
2.06.3 NCDOT Emergency Costs Emergency costs incurred by the North Carolina Department of Transportation (NCDOT) represent the average costs to NCDOT for removing sand from the ocean front roads in the study area following the storms. Bulldozers push the sand overwashed from the storms off the roads and deposit it between the ocean front structures. From there, private home and business owners must pay to have the sand redistributed in front of their properties.
2.06.4 Damage to Public Property Damages to public property include things like damages to the water and electric utility distribution systems, and public access walkways, bath houses, and parking lots. Since traditional structural and content damage curves do not apply to these types of damages, this damage prevented category is based on interviews with public works officials concerning storm related damages that could have been prevented by a large Coastal Storm Damage Reduction project. 2.06.5 Damage to Other Private Property Damages to private property other than structures and contents include storm damages that are not covered under the National Flood Insurance Program. These include things like water damage to private walkways, driveways, steps, landscaping, automobiles, and private cleanup costs. 2.06.6 Post Storm Recovery Costs Preventable post-storm recovery expenses are based on data from interviews with public officials regarding preventable debris removal costs incurred over the last five years of storms, and storm related expenses from increased police patrolling, inspections, and permits.
2.07 Determination of Structure Values The value of residential structures is limited to replacement cost less depreciation. Replacement value is the maximum cost to the owner if a structure is destroyed. If a significantly depreciated structure is destroyed and replaced, the difference between the old and new value is a betterment where the additional cost is offset by the additional utility and comfort of the new construction. Other measures of property value include fair market value and the income producing value. These measures are not considered appropriate for

Surf City and North Topsail Beach, NC Final Feasibility Report and Draft Environmental Impact Statement
15
National Economic Development benefits to protection of beach property. Fair market value is influenced by proximity to the ocean or sound, corresponding views of the beach and ocean, and short-term fluctuations in the local real estate market. Basing value on income can also produce significantly higher estimates. It is assumed that rental income lost to the owner will be transferred to some other owner in an alternate location. Therefore, the loss of income is considered a regional economic loss and not a loss to the National Economic Development account. 2.07.1 Cost of Residential Construction. The average cost of residential construction on Topsail Island was determined according to the quality of initial construction. Three quality levels were discussed with local homebuilders. The economy level of quality was estimated to cost $90.00 per heated square foot. Average quality costs approximately $130.00 per square foot. Custom quality costs approximately $140.00 per square foot. No structure was assigned a greater value regardless of the quality. The square footage areas for most structures were available at the Pender County and Onslow County tax offices. 2.07.2 Commercial Structure Values. Values for commercial structures were based on visual surveys and talking to some business managers and owners. Pender County and Onslow County tax data was also used for comparison. 2.07.3 Value of Structures by Reach
The value of structures within the coastal storm damage study area is estimated to be $360,815,000 with a total value, including contents, estimated at $477,542,000. The value of structures by reach is shown in Table B-3A and B-3B. The estimated value of residential and commercial contents is discussed in paragraph 5.08.3 under the topic Variables Specific to Structure File.

Surf City and North Topsail Beach, NC Final Feasibility Report and Draft Environmental Impact Statement
16
Table B-3A – Value of Structures by Reach, Surf City
Reach Structures Contents Combined27 6,081,800$ 1,918,200$ 8,000,000$ 28 4,959,100$ 1,605,500$ 6,564,600$ 29 5,136,500$ 1,751,100$ 6,887,600$ 30 7,759,100$ 2,689,200$ 10,448,300$ 31 7,856,500$ 2,716,900$ 10,573,400$ 32 9,083,700$ 2,919,900$ 12,003,600$ 33 8,077,900$ 2,702,600$ 10,780,500$ 34 8,160,000$ 2,781,500$ 10,941,500$ 35 7,292,600$ 2,545,700$ 9,838,300$ 36 8,305,600$ 2,862,500$ 11,168,100$ 37 6,393,500$ 2,189,900$ 8,583,400$ 38 7,837,000$ 2,682,100$ 10,519,100$ 39 7,344,900$ 2,486,200$ 9,831,100$ 40 8,567,000$ 2,945,500$ 11,512,500$ 41 8,876,600$ 3,085,000$ 11,961,600$ 42 8,785,400$ 3,005,000$ 11,790,400$ 43 10,840,000$ 3,744,200$ 14,584,200$ 44 6,887,600$ 2,410,400$ 9,298,000$ 45 8,894,000$ 3,106,500$ 12,000,500$ 46 13,795,800$ 4,801,200$ 18,597,000$ 47 8,968,900$ 3,104,500$ 12,073,400$ 48 7,555,100$ 2,649,200$ 10,204,300$ 49 9,364,600$ 3,238,800$ 12,603,400$ 50 8,168,200$ 2,815,300$ 10,983,500$ 51 4,081,500$ 1,436,400$ 5,517,900$ 52 11,103,500$ 3,817,000$ 14,920,500$ 53 7,758,100$ 2,679,000$ 10,437,100$ 54 6,839,400$ 2,333,500$ 9,172,900$ 55 6,790,200$ 2,430,900$ 9,221,100$ 56 5,523,000$ 1,913,100$ 7,436,100$ 57 5,670,700$ 1,966,400$ 7,637,100$
58-SC 3,915,400$ 1,281,600$ 5,197,000$ Surf City Total 246,673,200$ 84,614,800$ 331,288,000$
Values October 2010

Surf City and North Topsail Beach, NC Final Feasibility Report and Draft Environmental Impact Statement
17
Table B-3B– Value of Structures by Reach, North Topsail Beach
2.07.4 Value of Structures by Type When the 81 road segments (Type 64) are excluded, there are a total of 1,817 structures in the structure damage database. There are 19 structure types, including roads, in the study area; however, only three structure types (Types 56, 59, and 60) equal or exceed 10 percent of the total value. In addition, single story residences on pilings with small or no enclosure (Type 55), account for 119 structures and 6.27 percent of the total inventory value. Two-story residences on pilings with small or no enclosure (Type 56), account for 540 structures and 28.45 percent, including the 450 structures assumed to be added by 2018. Figure B-6 shows four newly constructed type 56 structures. Types 59 (1-story) and 60 (2-story), on pilings with partial to full enclosures, account for 432 (22.76 %) and 471 structures (24.82 %) respectively. Descriptions of the four predominant structure types follow in Table B-4. For the complete set of structure type definitions see attachment B-1. The value of
Reach Structures Contents Combined58-NTB 1,705,000$ 484,900$ 2,189,900$
59 5,502,500$ 1,603,500$ 7,106,000$ 60 5,530,200$ 1,504,000$ 7,034,200$ 61 5,048,300$ 1,395,400$ 6,443,700$ 62 9,130,900$ 2,533,400$ 11,664,300$ 63 9,172,900$ 2,599,000$ 11,771,900$ 64 7,222,900$ 2,072,000$ 9,294,900$ 65 6,445,700$ 1,832,100$ 8,277,900$ 66 4,917,100$ 1,372,800$ 6,289,900$ 67 3,917,500$ 1,086,800$ 5,004,200$ 68 4,549,000$ 1,413,800$ 5,962,900$ 69 4,646,400$ 1,300,000$ 5,946,500$ 70 7,157,300$ 2,012,600$ 9,169,800$ 71 3,915,400$ 1,071,400$ 4,986,800$ 72 4,922,200$ 1,370,800$ 6,293,000$ 73 4,965,300$ 1,404,600$ 6,369,900$ 74 5,025,800$ 1,392,300$ 6,418,100$ 75 5,261,600$ 1,432,300$ 6,693,900$ 76 4,257,900$ 1,163,700$ 5,421,500$ 77 6,379,100$ 1,835,200$ 8,214,300$ 78 4,470,100$ 1,230,300$ 5,700,400$
North Topsail Beach Total 114,143,100$ 32,110,900$ 146,254,000$
Values October 2010

Surf City and North Topsail Beach, NC Final Feasibility Report and Draft Environmental Impact Statement
18
structures in the study area is presented in Table B-5 by structure type. Table B-5 shows both the value and number of structures in each type Table B-4 – Description of Four Significant Structure Types Structure
Type Description of Significant
Structure Types Percent of Total Value and number
of structures –Surf City & North Topsail Beach
55 Residential – 1-story, r aised
on pi lings, s mall or no enclosure
6.3%
114 56 Residential – 2-story, r aised
on pi lings, s mall or no enclosure
28.8%
520 59 Residential - 1-story, r aised
on pi lings – partial t o f ull enclosure
22.7% 410
60 Residential – 2-story, r aised on pi lings, par tial to f ull enclosure
24.8%
448
Figure B- 6 - Four typical new structures (all Type 56) built in 2004 on
Topsail Island, NC

Surf City and North Topsail Beach, NC Final Feasibility Report and Draft Environmental Impact Statement
19
Table B-5 – Value of Structures by Type In thousand dollars
2.08 Land Values Land values in all North Carolina coastal counties are escalating in general due to increased population growth in the U.S. coastal regions. Lot sales in the Topsail Island portions of Pender and Onslow counties are designated as ocean front, second row, and interior lots. To prevent the influence of water view or proximity to the ocean overriding the value, only the interior lot values are used in the analysis. Following hurricane Ophelia in 2005, the town requested approval from FEMA to haul in approximately 22,000 cubic yards (29,000 tons) of sand to distribute over 7,000 linear feet of beach. This is not considered a long term solution or effective measure against long term erosion or coastal storm damage. Therefore, it is not practical to equate the cost of fill to the land value lost due to long term erosion. A summary of values for ocean front lots, second row lots, and interior lots is presented below. 2.08.1 Ocean front lots Ocean front lots are higher in risk for storm damage and erosion but continue to be highly desirable. These values were not used in the land loss estimates.
Flood_Curve Count Structures Contents Combined1 101 8,492,100$ 2,947,600$ 11,439,700$ 2 76 12,038,500$ 3,981,000$ 16,019,500$ 5 9 1,042,700$ 372,200$ 1,414,800$
11 1 46,100$ 16,400$ 62,500$ 17 1 172,200$ 61,500$ 233,800$ 24 2 310,700$ 110,700$ 421,400$ 25 3 159,900$ 46,100$ 206,100$ 33 1 287,100$ 102,500$ 389,600$ 35 3 470,600$ 168,100$ 638,700$ 38 6 1,124,700$ 532,100$ 1,656,800$ 45 1 35,900$ 18,500$ 54,300$ 49 1 183,500$ 65,600$ 249,100$ 53 3 345,500$ 254,300$ 599,800$ 55 114 13,203,200$ 4,499,800$ 17,703,000$ 56 520 160,540,800$ 51,256,300$ 211,797,200$ 59 410 58,715,000$ 20,073,400$ 78,788,400$ 60 448 96,734,400$ 32,082,100$ 128,816,500$ 62 31 452,100$ 136,400$ 588,500$ 64 75 6,458,000$ -$ 6,458,000$
Totals 1,806 360,815,000$ 116,727,000$ 477,542,000$

Surf City and North Topsail Beach, NC Final Feasibility Report and Draft Environmental Impact Statement
20
2.08.2 Second row lots These values were not used in the land loss estimates. 2.08.3 Interior lots The value and desirability of interior lots vary greatly; however, values based on sold prices, continue to increase. Higher interior lot values may be due to the limited number of all vacant lots in Surf City and North Topsail Beach and the fact that interior lots are less susceptible to storm and erosion damages. This data supports the estimated value of $25.00 per square foot. Interior lot values are used to estimate the losses to land caused by long-term erosion. Sales data for interior lots is shown in Figure B-7.
Figure B- 7- Interior Lot Sales in Dollars per Square Foot
$-
$5.00
$10.00
$15.00
$20.00
$25.00
$30.00
$35.00
$40.00
$45.00
10/10/2006 4/28/2007 11/14/2007 6/1/2008 12/18/2008 7/6/2009 1/22/2010 8/10/2010
Lot V
alue
in D
olla
rs p
er S
quar
e Fo
ot
Date of Sale
Island Interior Lot Value Based on Sales

Surf City and North Topsail Beach, NC Final Feasibility Report and Draft Environmental Impact Statement
21
3.0 FUTURE ECONOMIC CONDITIONS (WITHOUT PROJECT)
3.01 Projected Population Growth Projected population growth for Pender and Onslow counties are found at the North Carolina State Demographer’s website. Figure B-8 shows both historical population from 1920 to 2000 and population projections for Pender and Onslow counties through 2029. Since all suitable lots are expected to be developed by the base year 2018, no additional growth in the number of residential or commercial structures is projected for the analysis. The assumptions used for structure replacement could result in fewer structures if storms destroyed a structure following its earlier replacement. According to the North Carolina demographics office, the population of this 45-county recreation day user demand area is expected to reach 4.3 million in 2010, 5.0 million in 2020, and over 5.6 million in 2029. Therefore it is reasonable to expect recreation visitation at Surf City and North Topsail Beach to increase over the next 25 to 50 years. Figure B- 8– Population Growth - Pender and Onslow Counties Actual 1920-
2000 and Projected to-2029
- 20,000 40,000 60,000 80,000
100,000 120,000 140,000 160,000 180,000 200,000
1920 1930 1940 1950 1960 1970 1980 1990 2000 2004 2009 2010 2019 2020 2029
Pender County Onslow County

Surf City and North Topsail Beach, NC Final Feasibility Report and Draft Environmental Impact Statement
22
3.02 Assumed Conditions at beginning of Period of Analysis Without Project Condition The period of analysis begins when the project improvement is in place and the benefits to the public begin to accrue. It is assumed that this condition could occur by FY2018. All suitable vacant lots are expected to be developed by the base year in 2018; however, no additional growth in the number of residential or commercial structures is projected during the period of analysis. For the buildable lots to be developed by the base year 2018, an average of about 60 structures in the study area would be required per year. North Carolina CAMA regulations preclude replacement of a structure only after the lot is deemed unbuildable when set back restrictions dictate that structures cannot be put back on the lot. 15A NCAC 07H .2501 allows for a great deal of latitude for meeting rebuilding criteria following damages due to hurricanes or tropical storms. Issuing emergency permits for rebuilding on lots meeting a minimal setback restriction is generally the rule, not the exception in North Carolina. Common practice and historical evidence allow for rebuilding structures lost in storms provided setback restrictions are met. However, the analysis presented in this report limits the number of replacements to one. After long-term erosion has claimed more distance on the oceanfront lot than the building requires to be put back, our storm damage model ceases to reinstate the same property. This assumption will prevent the overestimation of the without project coastal storm damages.
3.03 Assumed Replacement of Residential Structures During Period of Analysis It is assumed that all structures replaced in the study area as a result of coastal storm erosion damages will be similar to the existing distribution of residential and commercial use. It is assumed that residential structures removed by long-term erosion will not be replaced during the 50-year period of analysis. Likewise, it is assumed that residential structures destroyed by wave, flood, or storm erosion will be replaced in the economic damage model (GRANDUC) by a residential structure that meets the following building codes and standards in place by flood plain regulations. This includes a setback requirement of at least sixty feet from the established line of vegetation. A minimum lot depth of 100 feet is required to replace a structure. Because of uncertainty, a structure can be replaced only once in GRANDUC during the period of analysis. Replacement residential structures are assumed to have only parking, storage, and normal provision for access on the ground level. The first living floor will be elevated on pilings, well above the Base Flood Elevation or high enough to accommodate under-house parking, whichever is greater. Pilings for all first row replacement structures will be 16 feet below grade or 5 feet below mean sea level. These replacement

Surf City and North Topsail Beach, NC Final Feasibility Report and Draft Environmental Impact Statement
23
structures are assumed to have the same characteristics as the typical house now being built on vacant lots (Figure B-6).
3.04 Assumed Replacement of Commercial Structures During Period of Analysis Commercial structures that are replaced in the economic damage model during the per iod of analysis w ill be identical to the s tructure des troyed except for the first f loor elevation. The f irst f loor elevation of commercial structures will be set at t en f eet abov e “ ground” ( on-grade) el evation. Thi s as sumption i ncorporates the enf orcement of the dam age r eduction r egulations i ncluding f lood pl ain management and building codes now in force. When taken out, structure types 5-54 (flood damage curve numbers) are assumed to be replaced by the same type with the same value. These types include apartments (type 5), hotels (type 27), and motels (type 33), Condominiums are assigned to one of these three types. It is assumed that commercial or multi-family zoning will remain the same for the replacement structures.
3.05 Summary of Future Without Project Economic Conditions In s ummary, t he f uture ec onomic c onditions ar e as sumed t o hav e t he s ame distribution of r esidential us e and c ommercial d evelopment as t he e xisting condition. Structures that are significantly damaged or destroyed are assumed to be replaced by more damage-resistant structures of the same type but replaced no more than one t ime. All structures not damaged or destroyed are assumed to remain without any modification. No “teardowns” are built into the analysis where older structures are assumed to be torn down/demolished and replaced by more expensive units based on investment speculation related to the high demand for coastal real estate.
4.0 COASTAL STORM DAMAGES WITHOUT PROJECT
The accumulated present value of coastal storm damages over the 50-year period of analysis without a damage reduction project totals $400,850,000 in October 2010 price levels. These damages are shown by damage category and reach segment in Table B-6. Average annual damages (average annual equivalent amounts, 50-yrs, 4.125%) are calculated by using the 50-year interest and amortization factor as shown in Table B-7.

Surf City and North Topsail Beach, NC Final Feasibility Report and Draft Environmental Impact Statement
24
4.01 Damage Categories Defined Figure B- 9 graphically shows the impact of tides, storm surge, and wave action that may occur during minimal and major hurricanes. (USACE, Mobile District, 1999). It should be noted that hurricane wind speed, the deciding factor in storm category by FEMA, does not determine the level of damages in the storm damage model. The impact of wind is not shown in the figure and wind damage is not estimated in the storm damage model. The present value of damages in each of the four damage categories is presented in Table B-6 and in Figure B-12. Coastal storm damages are calculated under with and without project conditions for damages to structures and contents, roadways, and land lost due to long-term erosion. In many cases damages are calculated for more than one category since storms frequently generate flood inundation, waves, and storm erosion simultaneously. The damage model, GRANDUC, calculates damages in all the appropriate categories and selects the category with the greatest damage and ignores the other damages. This technique prevents the overestimation or double counting of damages.
Figure B- 9 Hurricane Surge and Wave Impacts

Surf City and North Topsail Beach, NC Final Feasibility Report and Draft Environmental Impact Statement
25
4.01_Damage Categories Defined (continued) 4.01.1 Storm Erosion Storm erosion damages result from the undermining of structure pilings and foundations due to hurricane and tropical storms. Damages due to storm induced erosion are the major damages that are generally computed by the economic damage model. The first element in determining the potential impact of storm induced erosion on the amount of damage to a coastal structure is how much of the protective beach (either existing or projected) remains in front of and under the structure during the storm. If the storm induced erosion only reaches the front of the building, damage due to storm erosion is assumed to be zero and any damage to the structure would be that caused by either wave impact or inundation. Earlier analyses for previous coastal storm damage studies along the coast of North Carolina, predicted that once the 0.5 foot point of erosion reaches the mid-point of the buildings supported on piles, all protective measures fronting the building have been removed exposing the building to the full brunt of the storm including direct wave impact and inundation. Due to the nature of the results obtained from the numerical storm erosion model (SBEACH), the landward extent of the impact of the storm erosion has been interpreted as the landwardmost point where the storm profile is 0.5 foot below the pre-storm profile. This particular standard for storm induced erosion or zone of influence was established by the developers of the SBEACH (Coastal & Hydraulics Laboratory formerly the Coastal Engineering Research Center) when the model was applied to the formulation of the storm damage reduction project for Panama City Beach, Florida. The analysis of Surf City and North Topsail Beach is founded on using an erosion indicator of 2.0 feet for both the with and without project beach profiles. The 0.5 foot erosion indicator is used rarely and only for structures with slab foundations or roadbeds. While the vertical scour around the ocean front piles may not cause the building to collapse, the open exposure caused by the storm induced erosion and lowering of the beach fronting the building is judged to be sufficient to result in complete loss of the economic value of the building even though the building may be left standing. The loss of the economic value of the building may come from the inability of the owner to reestablish a useable sewer system or obtain potable water. In these cases, the building will eventually have to be torn down. The damage associated with this condition has been broadly termed erosion damage, however, as demonstrated by the explanation provided above, the cause of the damage is not limited to erosion, rather it is due to the conditions created by the erosion that exposes the building to the maximum forces of the storm. A typical

Surf City and North Topsail Beach, NC Final Feasibility Report and Draft Environmental Impact Statement
26
new structure on the ocean front is required to be built with piling depths 16 feet below the surface of the ground or 5 feet below mean sea level whichever is a greater depth. Oceanfront structures built prior to 1986 are assumed to have piling depths of 8 feet below the ground. The storm damage structure inventory includes 160 homes on short pilings (8-foot depth), 141 homes on long pilings (16-foot depth or –5 feet m.s.l.), and 186 homes on concrete slab foundations. The remainder of the structures are built on pilings with varying sizes of enclosures. 4.01.2 Flood Flood damages are caused by inundation related to rises in tide and storm surge. Damages begin when flooding and overwash reaches the structure or enclosure. 4.01.3 Wave Wave damages result from waves over and above the storm surge making contact with the structures. Waves impacting the structure three feet or more above the first living area elevation are expected to result in total loss of the structure. Figure B-10 illustrates the effect of both flood from storm surge and waves.
4.01.4 Land lost or Long Term Erosion (LTE)
Land losses result from long-term erosion based on the analysis of historical erosion including rises in sea level. Land lost to long-term erosion is computed by multiplying the expected annual loss of land in acres by the value of nearshore interior lots. Fill material was also considered to reduce land losses due to long-term erosion. However, in the formulation of alternative plans, no suitable upland borrow sites were identified. Therefore, the cost of fill is not considered a practical limiting factor or substitute for the value of interior lots in the calculation of land lost or long term erosion. 4.01.5 Summary of Damages Examples of coastal storm erosion damage at Surf City and North Topsail Beach are shown in Figure B-10 The present value of coastal storm damages by damage category and reach is shown in table B-6 and figure B-11for the without project condition.

Surf City and North Topsail Beach, NC Final Feasibility Report and Draft Environmental Impact Statement
27
Figure B-10- Coastal storm damage after Hurricane Fran 1996

Surf City and North Topsail Beach, NC Final Feasibility Report and Draft Environmental Impact Statement
28
Table B-6 – Present Value of Coastal Storm Damages (Without Project)
Erosion Flood Wave Land Total Damage27 5,952,000$ 2,000$ -$ 220,000$ 6,174,000$ 294,000$ 28 282,000$ -$ -$ 110,000$ 392,000$ 19,000$ 29 6,688,000$ 2,000$ -$ 134,000$ 6,823,000$ 324,000$ 30 4,531,000$ 6,000$ -$ 223,000$ 4,760,000$ 226,000$ 31 2,627,000$ 1,000$ -$ 410,000$ 3,038,000$ 144,000$ 32 1,827,000$ 28,000$ -$ 671,000$ 2,526,000$ 120,000$ 33 3,539,000$ 25,000$ -$ 315,000$ 3,880,000$ 184,000$ 34 1,473,000$ 32,000$ -$ 118,000$ 1,624,000$ 77,000$ 35 4,431,000$ 58,000$ -$ 118,000$ 4,607,000$ 219,000$ 36 2,784,000$ 28,000$ 1,000$ 118,000$ 2,931,000$ 139,000$ 37 5,341,000$ 22,000$ -$ 126,000$ 5,489,000$ 261,000$ 38 8,291,000$ 27,000$ 83,000$ 137,000$ 8,539,000$ 406,000$ 39 7,195,000$ 74,000$ 32,000$ 402,000$ 7,703,000$ 366,000$ 40 9,579,000$ 64,000$ 196,000$ 581,000$ 10,419,000$ 495,000$ 41 8,679,000$ 18,000$ 10,000$ 402,000$ 9,109,000$ 433,000$ 42 6,479,000$ 7,000$ 4,000$ 406,000$ 6,896,000$ 328,000$ 43 11,281,000$ 16,000$ 39,000$ 477,000$ 11,814,000$ 562,000$ 44 10,592,000$ 112,000$ 225,000$ 1,181,000$ 12,110,000$ 576,000$ 45 9,217,000$ 171,000$ 1,000$ 1,065,000$ 10,454,000$ 497,000$ 46 6,893,000$ 154,000$ 5,000$ 1,071,000$ 8,124,000$ 386,000$ 47 12,860,000$ 179,000$ 129,000$ 1,411,000$ 14,578,000$ 693,000$ 48 14,691,000$ 170,000$ 78,000$ 1,785,000$ 16,724,000$ 795,000$ 49 17,408,000$ 51,000$ 18,000$ 1,995,000$ 19,472,000$ 926,000$ 50 11,500,000$ 41,000$ -$ 1,142,000$ 12,683,000$ 603,000$ 51 2,563,000$ 144,000$ 260,000$ 848,000$ 3,815,000$ 181,000$ 52 13,934,000$ 73,000$ 1,632,000$ 1,007,000$ 16,646,000$ 792,000$ 53 12,409,000$ 38,000$ 1,250,000$ 1,461,000$ 15,157,000$ 721,000$ 54 7,088,000$ 11,000$ 858,000$ 1,421,000$ 9,377,000$ 446,000$ 55 3,554,000$ 65,000$ 170,000$ 913,000$ 4,702,000$ 224,000$ 56 669,000$ 50,000$ 216,000$ 626,000$ 1,561,000$ 74,000$ 57 4,216,000$ 46,000$ 266,000$ 1,556,000$ 6,083,000$ 289,000$ 58 6,044,000$ 54,000$ 282,000$ 1,750,000$ 8,131,000$ 387,000$ 59 5,261,000$ 41,000$ 542,000$ 1,511,000$ 7,355,000$ 350,000$ 60 7,129,000$ 28,000$ 723,000$ 1,327,000$ 9,207,000$ 438,000$ 61 3,374,000$ 70,000$ 710,000$ 673,000$ 4,827,000$ 230,000$ 62 7,823,000$ 13,000$ 34,000$ 1,254,000$ 9,123,000$ 434,000$ 63 6,000,000$ 72,000$ 131,000$ 939,000$ 7,141,000$ 340,000$ 64 5,880,000$ 108,000$ 1,115,000$ 1,425,000$ 8,528,000$ 406,000$ 65 5,728,000$ 97,000$ 596,000$ 1,080,000$ 7,501,000$ 357,000$ 66 5,092,000$ 46,000$ 241,000$ 884,000$ 6,262,000$ 298,000$ 67 7,372,000$ 9,000$ 218,000$ 1,482,000$ 9,082,000$ 432,000$ 68 4,133,000$ 138,000$ 685,000$ 854,000$ 5,811,000$ 276,000$ 69 4,181,000$ 343,000$ 544,000$ 645,000$ 5,714,000$ 272,000$ 70 3,384,000$ 136,000$ 893,000$ 565,000$ 4,978,000$ 237,000$ 71 3,826,000$ 15,000$ 816,000$ 914,000$ 5,570,000$ 265,000$ 72 11,061,000$ 1,000$ 769,000$ 1,640,000$ 13,470,000$ 641,000$ 73 10,119,000$ 1,000$ 757,000$ 1,522,000$ 12,398,000$ 590,000$ 74 8,862,000$ 4,000$ 705,000$ 1,141,000$ 10,712,000$ 509,000$ 75 3,145,000$ 76,000$ 307,000$ 987,000$ 4,514,000$ 215,000$ 76 2,626,000$ 36,000$ 144,000$ 962,000$ 3,767,000$ 179,000$ 77 3,418,000$ 119,000$ 223,000$ 922,000$ 4,682,000$ 223,000$ 78 3,031,000$ 38,000$ 267,000$ 531,000$ 3,867,000$ 184,000$
Subtotal 336,062,000$ 3,160,000$ 16,175,000$ 45,458,000$ 400,850,000$ 19,061,000$ 107 3,743,000$ 15,000$ 802,000$ 900,000$ 5,460,000$ 260,000$ 108 10,867,000$ 1,000$ 748,000$ 1,614,000$ 13,230,000$ 629,000$ 114 9,920,000$ 1,000$ 738,000$ 1,495,000$ 12,154,000$ 578,000$ 115 8,704,000$ 3,000$ 686,000$ 1,125,000$ 10,518,000$ 500,000$
Total 369,296,000$ 3,180,000$ 19,149,000$ 50,592,000$ 442,212,000$ 21,028,000$
Present ValueDamages
Annual TotalReach

Surf City and North Topsail Beach, NC Final Feasibility Report and Draft Environmental Impact Statement
29
Figure B- 11 - Present Value of Coastal Storm Damages by Damage Category – Without Project Condition Table B-7 – Average Annual Coastal Storm Damages (Without Project) Base Condition Coastal Storm Damages - Average Annual Equivalent Amount
Reach Total Damage Storm Erosion Flood Wave Land Lost
27-78 $19,061,000 $ 15,980,000 $150,000 $769,000 $2,262,000
0
2
4
6
8
10
12
14
16
18
20
27 30 33 36 39 42 45 48 51 54 57 60 63 66 69 72 75 78
Hur
rica
ne &
Sto
rm D
amag
e in
$M
illio
n
Reaches
Hurricane & Coastal Storm DamageSurf City - North Topsail Beach Study Area
Storm Erosion Damage Inundation Damage Wave Damage Long-term Loss of Land

Surf City and North Topsail Beach, NC Final Feasibility Report and Draft Environmental Impact Statement
30
5.0. ECONOMIC VARIABLES, ASSUMPTIONS, AND METHODOLOGY APPLIED IN COASTAL STORM DAMAGE MODEL (GRANDUC)
In the Wilmington District Coastal Storm Damage Model the economic input includes a set of general global data that applies to the entire analysis, the estimated base year when damage reduction measures could be in place, flood damage curves, erosion damage curves, miscellaneous benefits to be included, and the variable inputs for each structure in the structure inventory data base or structure file. More information on the General Risk and Uncertainty – Coastal model (GRANDUC) is presented in Appendix D Coastal Engineering.
5.01 General Global Data Based on the general economic assumptions, the global values are as follows:
Interest Rate –4- 1/8 percent.
Price Level –October 2010 price level.
Economic Period of Analysis – 50 years beyond the base year.
Wave damage assumption – waves three feet above the first floor elevation will result in the total loss of the structure.
5.02 Base Year The Base Year is defined as the first year coastal storm damage reduction measures could be in effect. It is expected that damage reduction measures could be implemented by 2018.
5.03 Interior Lot Value per Square Foot Long term erosion damages or land losses are based on the estimated value of interior lots. The data on lots actually sold support a value of $25.00 per square foot at the October 2010 price level.

Surf City and North Topsail Beach, NC Final Feasibility Report and Draft Environmental Impact Statement
31
5.04 Initial Benefits The economic damage model (GRANDUC) allows the entry of initial benefits – such as “Benefits during Construction.” At the time of the scoping runs, the detailed construction schedule had not been developed. Therefore, no initial benefits were included in the analysis.
5.05 Other Annual Benefits GRANDUC also allows for the addition of other type of NED benefits – such as “Recreation.” The final determination of recreation benefits was not completed in time to include in the model runs. The recreation benefits were added external to the GRANDUC model calculation. The estimated recreation benefits are presented in Appendix O – Recreation. No other “Annual Benefits” for recreation were added to the GRANDUC model. This also supports the formulation of the NED Plan using coastal storm damage reduction benefits alone.
5.06 Flood Damage Curves Flood damages due to inundation are determined by the combined height of the storm still water level and a superimposed wave height. Based on the elevation of this combined height and the elevation of the structures first floor, the amount of inundation damage is determined from a standard set of inundation damage curves. Unless the predicted amount of storm induced erosion is sufficient to completely erode the ocean front dune, the residual height of the seaward edge of the beach is generally sufficient to limit the height of the wave that could be transmitted across the beach face without breaking. Accordingly, since the conditions necessary to cause a prediction of significant inundation related damages is rather severe, damages due to the inundation (combined storm still water level and wave height) rarely controls.
5.07 Erosion Damage Curves Based on the significant number of first row structures, sample erosion curves are shown by structure type in Figures 12, 13, 14, and 15. A complete set of erosion types and associated erosion curves are found in attachment B-2 to this appendix. The erosion-damage curves used for this analysis are compilations of curves assigned for each part of the structure. The enclosure is given a value of 40 percent of the entire structure and the rest of the structure is given a value of 60 percent of the entire structure value. These percentages were then used to weight the damage curves for the home and the enclosure and derive a composite damage curve.

Surf City and North Topsail Beach, NC Final Feasibility Report and Draft Environmental Impact Statement
32
Figures -12, 13, 14, and 15 Composite Erosion Damage Curves
5.08 Variables Specific to Structure File Table B- 8 - Sample Structure File
The structure file shown in Table B-8 describes the value of each structure, the horizontal and vertical location of the structure within the coastal damage
Erosion damage - all 2nd and 3rd row structures; all slab (non-piling)
foundation; all commercial;High and low elevation
00.20.40.60.8
11.2
0 0.2 0.4 0.6 0.8 1 1.2Erosion Through Footprint
Dam
age
Fact
or
Erosion Damage - 2-story, on Pilings, Small enclosure, Low elevation, long
pililng
0
0.2
0.4
0.6
0.8
1
1.2
0 0.2 0.4 0.6 0.8 1 1.2Erosion Through Footprint
Dam
age
Fact
or
Erosion Damage - 1-story, on Pilings, Small enclosure, Low elevation, Short
pilings
0
0.2
0.4
0.6
0.8
1
1.2
0 0.2 0.4 0.6 0.8 1 1.2Erosion Through Footprint
Dam
age
Fact
or
Erosion damage - 1-story on Pilings, Full enclosure (1PF), Low elevation,
Short pilings
00.20.40.60.8
11.2
0 0.2 0.4 0.6 0.8 1 1.2
Erosion Through Footprint
Dam
age
Fact
or

Surf City and North Topsail Beach, NC Final Feasibility Report and Draft Environmental Impact Statement
33
model, and specifies which flood damage curve and erosion damage curve is appropriate for the structure. As illustrated in Figure B-16, the lot distance (Col. 3) and structure distance (Col. 6) are measured from a “Reference Line” established in the coastal storm generation models and incorporated into the GRANDUC model. The structure length (Col. 7) defines the structure footprint used in the storm erosion estimates.
Fig B16 planeview
Figure B-16 Illustrations of Structure and Lot Distances Entered into
GRANDUC model (plane view and side view).

Surf City and North Topsail Beach, NC Final Feasibility Report and Draft Environmental Impact Statement
34
5.08.1 Structure Type – flood damage curve Structure type denotes the flood damage curve that is to be used with each sturucture. A description of all structure types, both residential and commercial are attached to this appendix, Attachment B-1. Residential structure types for all residential structures in the study area were based on visual observation by district personnel including documentation with digital photographs. Descriptions included the number of levels (1,1.5, or 2 story), type of foundation (P=on pilings, N=not on pilings), if piling foundation what is the size of enclosure (S=small <300SF; P=partial >300SF; F=full; or N=none). Commercial business types include hotels, motels, garages, etc. A complete list of the commercial and residential business types used is found in Attachment B-1 to this appendix. 5.08.2 Structure Value Structure values are entered in dollars based on the replacement cost less depreciation. Determinations of commercial structure values and description of the business type were made by district personnel with additional checking against tax records. Structure values represent the replacement value less depreciation at the current price levels. The district personnel consulted with local real estate agents, appraisers, business owners, and building contractors as needed. While some information on structures was obtained from the Pender County and Onslow County tax offices; replacement costs are based on site-specific building cost for Topsail Island.
5.08.3 Content Value Contents to residential structures include personal possessions, including furniture, clothing, dishes, cooking utensils, linens, jewelry, stereo equipment, etc. For homeowners’ insurance coverage, the standard coverage for contents is 50 percent of the dwelling coverage. For beach communities like Topsail Beach, Surf City, and North Topsail Beach, the estimated value of contents of an average residential structure would be less than 50 percent of the value of the structure. The main factor in this conclusion is that nearly 75 percent of the structures are not owner-occupied year round. Many of the seasonal 75 percent are rented to vacationers during the spring and summer beach season. Contents include beds, furniture, reclining chairs, color cable televisions, VCR’s and DVD players, microwave ovens, clothes washers and dryers, and telephones. Built-in appliances are included in the value of the structure. Contents for residential structures are estimated to be 40 percent of the structure value. This percentage is consistent with a detailed Residential Flood Damage survey taken in the Northern Gulf Coast (USACE, Mobile District, 1999). This area is similar to Topsail Island and is primarily single-family residential structures. Based on the 1999 survey, content damage was

Surf City and North Topsail Beach, NC Final Feasibility Report and Draft Environmental Impact Statement
35
reported in 81 of 192 cases, with a mean content-to-structure damage of about 35 percent.
Estimates of values of contents of commercial structures in the primary study area are based on interviews with businessmen and insurance agents familiar with the Topsail Island oceanfront, as well as empirical data collected for past studies. Businesses are entered into the damage model with a code for type of commercial activity. Each type of business has a unique content factor applied to its structural values. After weighing responses from motel managers and insurance agents in the study area, this is considered appropriate. It is also consistent with the commercial content data that originally came from a Galveston District study but were updated by the Wilmington District to reflect North Carolina beach data.
5.08.4 Elevation at ground Ground elevations for the vast majority of North Topsail Beach were taken from FEMA elevation certificates. Elevations for Surf City were established by surveys and in some cases were estimated from 2-foot contour maps. The Wilmington District contracted with the engineering and surveying firm of Greenhorne & O'Mara, Inc. to perform survey work on Topsail Island. The field surveys were completed during the week of May 19-23, 2003.
Figure B- 17 - Illustration of Residential Structure Elevations

Surf City and North Topsail Beach, NC Final Feasibility Report and Draft Environmental Impact Statement
36
5.08.5 Elevation at First Floor The first-floor elevations were taken from FEMA elevation certificates or surveyed by the location of the front entry threshold as shown in Figure B-18. First floor elevations were surveyed under contract with the engineering and surveying firm Greenhorne & O'Mara, Inc.for the Surf City and North Topsail Beach study area. Data collected by North Carolina State University students for FEMA following hurricane Fran in 1996 were also compared and used for missing structures. In these cases the first floor elevation was adjusted by one foot to get the top of the floor joist versus the bottom of floor joist measured by NCSU. In a few cases first floor elevations were estimated by adding 10 or 12 feet to the ground elevations. Likewise, this assumption was used to indicate the first floor elevation of all structures replaced during the period of analysis.
5.08.6 Erosion Type
The erosion type in the structure file directs which erosion curve is used to calculate storm erosion damages. Variables include type of foundation, depth of piling penetration, type of shoreline (see Figure B-18), and the size of any enclosures around the piling foundation. The type of foundation on Topsail Island is mostly residential built on pilings. Most commercial and some residential structures are built on a slab foundation.
The historical effects of long-term and storm related erosion on oceanfront structures along the beaches of North Carolina are not well documented. Very little data exists on how these structures react to storm forces of varying degrees of intensity. This lack of data has lead to the designing of erosion-damage curves comprised largely through professional judgment. The state of the art of modeling these relationships is improving, however, following the hurricanes of 1996-1999 along the North Carolina coast. Researchers like Spencer Rogers of North Carolina Sea Grant have begun collecting and analyzing data and publishing papers on this subject. In his report, “Erosion Damage Thresholds in North Carolina,” Mr. Rogers derived storm induced damage curves based on observed changes over time in coastal construction in North Carolina (Attachment B-4).
The curves used in this analysis are derived from these erosion-damage curves and are based on field data including the following structure characteristics:
Oceanfront or not Number of stories On piles or not, long or short piles Type of enclosure (none, finished, unfinished) Size of the under house enclosure (none, small, partial, fully enclosed)

Surf City and North Topsail Beach, NC Final Feasibility Report and Draft Environmental Impact Statement
37
High or low existing dune (potential to undermine 1st row structures) see illustration in Figure B-18. Structure type (commercial or residential)
For this analysis, these data were collected for every structure along the oceanfront and first row of development back from the oceanfront, along with their elevation and depreciated replacement value. The following further describes the four-character coding scheme of structure types used for this study, which was originally developed by a North Carolina State University team of researchers including Mr. Rogers. Descriptions included the number of levels (1,1.5, or 2 story), type of foundation (P=on pilings, N=not on pilings), if piling foundation what is the size of enclosure (S=small <300SF; P=partial >300SF; F=full; or N=none) and the quality of the enclosure (F=finished, N-unfinished, “blank”=unknown). These codes are assigned upon field inspection of each structure and matched with both an appropriate erosion-damage curve and an inundation-damage curve. The decision matrix used in the field is included in Attachment B-2.
Figure B-18 - Shoreline Types with High and Low Elevation

Surf City and North Topsail Beach, NC Final Feasibility Report and Draft Environmental Impact Statement
38
5.08.7 Erosion Indicator An indicator of erosion is measured as the vertical distance between the pre-storm and post-storm beach profile as shown in Figure B-19. The erosion damage curves are read based on how far the “erosion indicator” has proceeded through the structure footprint. In this analysis two erosion indicators were used. The most frequently used indicator is the 2-foot indicator. This indicator was chosen after consideration and interpretation of work by Spencer Rogers, North Carolina Sea Grant (Attachment B-4). For a limited number of structures built on concrete slab foundations and all street and roads, an erosion indicator of 0.5 feet was used. The work by Spencer Rogers, North Carolina Sea Grant, also introduces the possible use of a 4-foot erosion indicator. While use of the 4-foot indicator is not considered appropriate for the beach profiles of Surf City and North Topsail Beach, alternative analyses were run for the Topsail Beach General Re-evaluation Report and did not seriously impact the economic feasibility of the NED plan.
Figure B-19 - Illustration of erosion Indicator The report “Erosion Damage Thresholds in North Carolina” by Spencer Rogers of the North Carolina Sea Grant is attached to this appendix as Attachment B-4.

Surf City and North Topsail Beach, NC Final Feasibility Report and Draft Environmental Impact Statement
39
6.0. ALTERNATIVES TO REDUCE COASTAL STORM DAMAGES
Expected storm and erosion related damages are first computed for the without project condition, then again for the various plans of improvement over approximately 10 miles of the primary study area. Structural, non-structural, and no action alternatives were considered. Structural plans include beach fill plans which have potential to prevent the progressive erosion of the shoreline, reduce damages caused by erosion, flooding, and wave impact during coastal storms, decrease storm related emergency expenditures, and increase the quality of recreational opportunities in the area. No action is also an alternative. However, the no action plan does not preclude emergency measures of dealing with erosion, such as beach scraping and sandbagging, but, in the long run, these emergency measures are assumed to be ineffective.
6.01 Structural Plans Structural alternatives evaluated included various combinations of berm and dune heights. For example, Plan 1150 includes a dune height of 11 feet and a berm width of 50 feet. The initial array and the final array of plans are shown in Table B-9 below. The continuous section between reach 58 and reach 78 were found to be feasible for several beach and dune alternatives. The two separate groups, reaches 103 to 105 and reaches 113-115 were not incrementally feasible for beachfill and excluded from further study.

Surf City and North Topsail Beach, NC Final Feasibility Report and Draft Environmental Impact Statement
40
Table B-9 - Economic Comparisons, Accumulated Present Value Amounts
Initial Array of
Plans compared @ Dec 04 & 5-3/8%
Initial PV Net Benefits @ Dec
04 & 5-3/8%
Final Array of Plans
compared @ Jan 05 &
5-3/8%
Final PV Benefits @ Jan
05 & 5-3/8%
Final PV Costs @ Jan 05 & 5-3/8%
Final PV Net Benefits @ Jan 05 &
5-3/8
50 $127,918,906 100 $145,153,980 150 $150,997,603
1125 $139,831,147 1150 $143,834,869 1150 $ 232,736,623 $ 98,214,372 $134,522,251
1175 $148,539,323
1325 $171,819,955
1350 $170,998,193 1350 $ 263,768,009 $105,229,962 $158,538,047
1375 $167,426,693
1450 $ 271,728,277 $111,442,663 $160,285,614
1525* $178,870,873
1550 $174,056,978 1550 $ 280,191,291 $114,804,658 $165,386,633
1575 $168,701,068 1575 $ 284,257,490 $125,623,007 $158,634,483
1650 $ 280,577,629 $121,578,509 $158,999,120
1750 $ 285,877,003 $125,762,429 $160,114,574
*Net ben efits i n t his t able w ere b ased on us ing i dentical uni t c osts f or b orrow m aterial. However, it is e stimated that c osts for building a 2 5 ft dune a nd be rm pl an ar e at least 8% higher than f or bu ilding pl ans w ith b erm w idths of g reater than 25 ft. O ne of the pr imary reasons for the greater unit cost under a 25 ft plan is the additional equipment that is needed to move pipe along the beach as the dredge is pumping, s ince the narrow berm width does not allow pumping at one location for as long. Using the higher unit cost, the net benefit of the 1525 plan is about $167 million dollars. All beach nourishment plans shown have positive net NED benefits; however, the plan with the greatest net NED benefits is Plan 1550 (see footer for table B-9). The NED Plan is defined as the alternative that maximizes net NED benefits. Therefore, Plan 1550 is designated as the NED Plan.

Surf City and North Topsail Beach, NC Final Feasibility Report and Draft Environmental Impact Statement
41
6.02 Non-structural Plans The non-structural plans consist of retreats, relocations, and demolitions applied to threatened structures on an individual case-by-case basis. However, none of the non-structural plans were found to be feasible. Figure B-20 shows one of the rare non-structural projects involving the raising of a structure. A general description of the non-structural analysis is presented in the main report.
Figure B- 20 Topsail Island home raised on piling foundation 2004. 7.0 ECONOMICS OF NED PLAN (PLAN 1550)
7.01 Economic Damages – remaining with plan A major consideration in evaluating any plan is the estimated damages remaining with the project plan. The accumulated present value of remaining damages for Plan 1550 is presented in Table B-10. A summary of average annual equivalent remaining damages is shown in Table B-11.

Surf City and North Topsail Beach, NC Final Feasibility Report and Draft Environmental Impact Statement
42
Table B-10 – Present Value of Remaining Damages with NED Plan
Reach Erosion Flood Wave Land Total Damages27 278,000$ 24,000$ -$ -$ 302,000$ 28 37,000$ -$ -$ -$ 38,000$ 29 534,000$ 2,000$ -$ -$ 536,000$ 30 1,546,000$ 7,000$ -$ -$ 1,552,000$ 31 1,732,000$ 2,000$ -$ -$ 1,734,000$ 32 540,000$ 34,000$ -$ -$ 574,000$ 33 998,000$ 27,000$ -$ -$ 1,025,000$ 34 963,000$ 36,000$ -$ -$ 998,000$ 35 379,000$ 77,000$ -$ -$ 456,000$ 36 311,000$ 37,000$ -$ -$ 348,000$ 37 501,000$ 25,000$ -$ -$ 527,000$ 38 620,000$ 50,000$ 14,000$ -$ 685,000$ 39 558,000$ 104,000$ 9,000$ -$ 670,000$ 40 454,000$ 108,000$ 54,000$ -$ 616,000$ 41 947,000$ 26,000$ 5,000$ -$ 979,000$ 42 1,329,000$ 11,000$ 4,000$ -$ 1,345,000$ 43 1,328,000$ 24,000$ 18,000$ -$ 1,370,000$ 44 956,000$ 195,000$ 6,000$ -$ 1,158,000$ 45 240,000$ 183,000$ -$ -$ 423,000$ 46 166,000$ 204,000$ -$ -$ 370,000$ 47 701,000$ 235,000$ 4,000$ -$ 939,000$ 48 974,000$ 214,000$ 15,000$ -$ 1,202,000$ 49 846,000$ 112,000$ 2,000$ -$ 960,000$ 50 195,000$ 64,000$ -$ -$ 259,000$ 51 366,000$ 211,000$ 84,000$ -$ 662,000$ 52 2,108,000$ 122,000$ 824,000$ -$ 3,054,000$ 53 811,000$ 122,000$ 936,000$ -$ 1,869,000$ 54 490,000$ 95,000$ 577,000$ -$ 1,161,000$ 55 318,000$ 126,000$ 27,000$ -$ 470,000$ 56 175,000$ 77,000$ 43,000$ -$ 294,000$ 57 605,000$ 77,000$ 75,000$ -$ 758,000$ 58 575,000$ 142,000$ 83,000$ -$ 800,000$ 59 432,000$ 106,000$ 207,000$ -$ 745,000$ 60 786,000$ 48,000$ 322,000$ -$ 1,155,000$ 61 365,000$ 75,000$ 225,000$ -$ 665,000$ 62 1,107,000$ 30,000$ 5,000$ -$ 1,141,000$ 63 325,000$ 126,000$ 33,000$ -$ 484,000$ 64 464,000$ 190,000$ 338,000$ -$ 992,000$ 65 490,000$ 190,000$ 335,000$ -$ 1,015,000$ 66 572,000$ 55,000$ 165,000$ -$ 792,000$ 67 1,743,000$ 19,000$ 104,000$ -$ 1,867,000$ 68 396,000$ 235,000$ 259,000$ -$ 889,000$ 69 588,000$ 499,000$ 392,000$ -$ 1,479,000$ 70 493,000$ 185,000$ 392,000$ -$ 1,069,000$ 71 502,000$ 62,000$ 461,000$ -$ 1,024,000$ 72 743,000$ 62,000$ 536,000$ -$ 1,341,000$ 73 725,000$ 51,000$ 422,000$ -$ 1,198,000$ 74 539,000$ 47,000$ 400,000$ -$ 986,000$ 75 188,000$ 138,000$ 38,000$ -$ 364,000$ 76 199,000$ 55,000$ 111,000$ -$ 364,000$ 77 378,000$ 180,000$ 52,000$ -$ 611,000$ 78 627,000$ 91,000$ 95,000$ -$ 813,000$
34,243,000$ 5,217,000$ 7,672,000$ -$ 47,128,000$

Surf City and North Topsail Beach, NC Final Feasibility Report and Draft Environmental Impact Statement
43
Table B -11 – Remaining A verage A nnual Coastal Storm Da mages wit h Plan 1550 (NED Plan)
Remaining Coastal Storm Damages - Average Annual Equivalent Amount Reach Storm Erosion Flood Wave Land Total Damage
27-78 $1,628,000 $ 248,000 $365,000 $0 $2,241,000
7.02 Economic Benefits The primary benefits to the NED plan are the coastal storm damage reduction benefits. The total damage reduction benefits are computed by subtracting the remaining damages from the total without project damages. Coastal storm damage reduction benefits total $16,820,000 and are shown by type in Table B-12.
7.02.1 Coastal Storm Damage Reduction Benefits Table B-12 – Average Annual Coastal Storm Damage Reduction Benefits with Plan 1550 (NED Plan)
Category of Damages Reduced Total Benefits Storm
Erosion Flood-Inundation Wave Long-Term-Erosion
$14,352,000 ($98,000) $404,000 $2,162,000 $16,820,000 7.02.2 Reduced Emergency Costs Benefits Benefits from reduction of emergency costs are estimated to have an equivalent annual value of $99,000 for Surf City and $235,000 for North Topsail Beach, for a total of $334,000 over the entire project length based on records from hurricanes Bertha, Fran, Bonnie, and Floyd. This category of benefits is not very precise and is relatively minor compared to CSDR benefits (1 to 2%) and so, is dropped from the total. Emergency cost reductions refer to expected annual expenditures that residents and governments are experiencing under the without project condition that a project would preclude. Other damage reductions include storm damages that are not covered under the National Flood Insurance Program, but represent financial drains on public and private storm victims that a large beach nourishment project could reduce. The categories lumped into this benefit called emergency costs and other damages reduced include (1) beach scraping/pushing; (2) sandbagging: (3) emergency costs incurred by the North

Surf City and North Topsail Beach, NC Final Feasibility Report and Draft Environmental Impact Statement
44
Carolina Department of Transportation; (4) damages to public property; (5) damages to private property other than structures and contents; and, (6) post-storm recovery expenses. 7.02.3 Benefits During Construction Construction of NED Plan could begin following contract award 30 September 2014. Allowing for environmental constraints, construction could begin in December 2014 and continue for approximately six months for each consecutive environmental dredging window. Construction is assumed to continue through 30 April of each year of initial construction. This construction schedule would provide significant benefits from the project in 2018 (the base year). The project would be expected to be completed in 2018 prior to hurricane season and the peak recreation season.

Surf City and North Topsail Beach, NC Final Feasibility Report and Draft Environmental Impact Statement
45
Table B-13 Benefits During Construction for Plan 1550
7.02.4 Recreation Benefits Recreation benefits are based on the incremental change in demand with varying project conditions. Positive benefits derived from increased recreation visitation or improved recreation experience. The average annual equivalent recreation benefits for the NED plan were computed to be $12.7 million for Surf City and $7.9 million for North Topsail Beach for a total of $20.5 million. The recreation benefit analysis is presented in Appendix – O.
PERIODS MONTH Activity HSDR BenefitsHSDR Benefits REC Benefits
REC Benefits
Interest Factors
HSDR Benefits with Interest
REC Benefits with Interest
1 NOV MOB 1.165146 $0 $0
2 DEC Dredge 1.160914 $0 $0
3 JAN 1.156697 $0 $04 FEB 1.152495 $0 $05 MAR 1.148308 $0 $06 APR DE-MOB 1.144137 $0 $07 MAY Till, DP, WO $1,250,000 1.139981 $0 $1,424,9768 JUN $841,000 $1,250,000 1.135840 $955,241 $1,419,8009 JUL $841,000 25% REC $1,250,000 1.131714 $951,771 $1,414,642
10 AUG 25% HSDR $841,000 Benefits $1,250,000 1.127603 $948,314 $1,409,50311 SEP Benefits $841,000 1.123506 $944,869 $012 OCT $841,000 1.119425 $941,437 $013 NOV MOB 1.115359 $0 $014 DEC Dredge 1.111307 $0 $015 JAN 1.107270 $0 $016 FEB 1.103248 $0 $017 MAR 1.099240 $0 $018 APR DE-MOB 1.095247 $0 $019 MAY Till, DP, WO $2,500,000 1.091269 $0 $2,728,17220 JUN $1,682,000 $2,500,000 1.087304 $1,828,846 $2,718,26121 JUL $1,682,000 50% REC $2,500,000 1.083355 $1,822,203 $2,708,38722 AUG 50% HSDR $1,682,000 Benefits $2,500,000 1.079419 $1,815,583 $2,698,54823 SEP Benefits $1,682,000 1.075498 $1,808,988 $024 OCT $1,682,000 1.071591 $1,802,417 $025 NOV MOB 1.067699 $0 $026 DEC Dredge 1.063820 $0 $027 JAN 1.059956 $0 $028 FEB 1.056105 $0 $029 MAR 1.052269 $0 $030 APR DE-MOB 1.048447 $0 $031 MAY Till, DP, WO $3,750,000 1.044638 $0 $3,917,39332 JUN $2,523,000 $3,750,000 1.040843 $2,626,048 $3,903,16233 JUL $2,523,000 75% REC $3,750,000 1.037062 $2,616,508 $3,888,98434 AUG 75% HSDR $2,523,000 Benefits $3,750,000 1.033295 $2,607,004 $3,874,85735 SEP Benefits $2,523,000 1.029542 $2,597,533 $036 OCT $2,523,000 1.025802 $2,588,098 $037 NOV MOB 1.022075 $0 $038 DEC Dredge 1.018363 $0 $039 JAN 1.014663 $0 $040 FEB 1.010977 $0 $041 MAR 1.007305 $0 $042 APR DE-MOB 1.003646 $0 $0
43 MAY Till, DP, WOBASE YEAR BENEFITS $0 BASE Year 1.000000 $0 $0100 percent 100 percentHSDR Benefits Recreation
Benefits
Accumulated PV $26,854,859 $32,106,6844-1/8% I&A - 50yrs 0.047551 0.047551Ave Ann Benefits $1,276,975 $1,526,705During Construction $1,277,000 $1,527,000

Surf City and North Topsail Beach, NC Final Feasibility Report and Draft Environmental Impact Statement
46
7.02.5 Commercial and Recreational Fishing Impacts:
The economic impacts of the NED plan or other nourishment plans on commercial and recreational fishing during construction are not expected to be significant. Impacts on shore fishing would be limited to the area where material is being placed on the beach. This localized and temporary impact can easily be avoided by anglers in the area. Nearshore fishing boats can operate around the dredging equipment operating in the area. The beach nourishment plan is not expected to impact inside fishing or the operation of commercial fishing boats operating inside or going through New Topsail Inlet. Unless there is extreme weather, the ocean going dredge will operate continuously. Therefore, the economic impact of commercial and recreational fishing is not expected to change with the project construction. 7.02.6 Summary of Benefits to NED Plan
A summary of the coastal storm damage reduction benefits, and recreation benefits is shown in Table B-14. Benefits during construction were computed primarily because the plan is expected to be constructed during three and one-half dredging windows and each increment would be completed prior to hurricane and peak recreation season.
Table B-14 - Summary of Benefits to NED Plan
Benefit Category Average Annual Amount in Dollars
Hurricane & Storm Damage Reduction
$16.820,000
Reduced Emergency Costs None claimed
Benefits during Construction $2,804,000
Recreation (Appendix O) $20,505,000
Total Average Annual NED Benefits
$40,129,000
7.03 Project Costs for NED Plan Project first costs include the cost of construction, mobilization and demobilization, real estate, planning and engineering studies, supervision and administration, and interest during the four environmental dredging windows and construction period.

Surf City and North Topsail Beach, NC Final Feasibility Report and Draft Environmental Impact Statement
47
Determination of the economic costs of the plan consists of four basic steps. First, project First Costs are computed. First Costs include expenditures for project design and initial construction and related costs of supervision and administration. First Costs also include the lands, easements, and rights of way for initial project construction and periodic nourishment.
7.03.1 First Costs Total First Costs are estimated to be $123,135,000 as presented in Appendix N Cost Engineering.
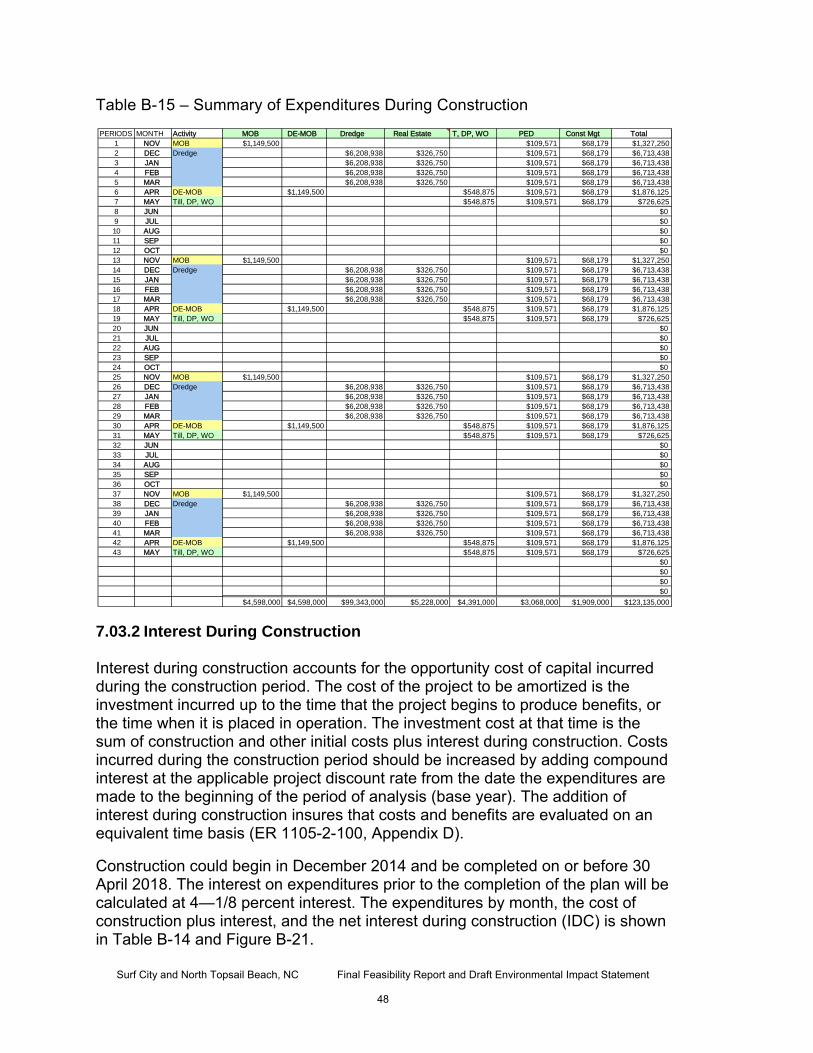
Surf City and North Topsail Beach, NC Final Feasibility Report and Draft Environmental Impact Statement
48
Table B-15 – Summary of Expenditures During Construction
7.03.2 Interest During Construction Interest during construction accounts for the opportunity cost of capital incurred during the construction period. The cost of the project to be amortized is the investment incurred up to the time that the project begins to produce benefits, or the time when it is placed in operation. The investment cost at that time is the sum of construction and other initial costs plus interest during construction. Costs incurred during the construction period should be increased by adding compound interest at the applicable project discount rate from the date the expenditures are made to the beginning of the period of analysis (base year). The addition of interest during construction insures that costs and benefits are evaluated on an equivalent time basis (ER 1105-2-100, Appendix D).
Construction could begin in December 2014 and be completed on or before 30 April 2018. The interest on expenditures prior to the completion of the plan will be calculated at 4—1/8 percent interest. The expenditures by month, the cost of construction plus interest, and the net interest during construction (IDC) is shown in Table B-14 and Figure B-21.
PERIODS MONTH Activity MOB DE-MOB Dredge Real Estate T, DP, WO PED Const Mgt Total1 NOV MOB $1,149,500 $109,571 $68,179 $1,327,2502 DEC Dredge $6,208,938 $326,750 $109,571 $68,179 $6,713,4383 JAN $6,208,938 $326,750 $109,571 $68,179 $6,713,4384 FEB $6,208,938 $326,750 $109,571 $68,179 $6,713,4385 MAR $6,208,938 $326,750 $109,571 $68,179 $6,713,4386 APR DE-MOB $1,149,500 $548,875 $109,571 $68,179 $1,876,1257 MAY Till, DP, WO $548,875 $109,571 $68,179 $726,6258 JUN $09 JUL $010 AUG $011 SEP $012 OCT $013 NOV MOB $1,149,500 $109,571 $68,179 $1,327,25014 DEC Dredge $6,208,938 $326,750 $109,571 $68,179 $6,713,43815 JAN $6,208,938 $326,750 $109,571 $68,179 $6,713,43816 FEB $6,208,938 $326,750 $109,571 $68,179 $6,713,43817 MAR $6,208,938 $326,750 $109,571 $68,179 $6,713,43818 APR DE-MOB $1,149,500 $548,875 $109,571 $68,179 $1,876,12519 MAY Till, DP, WO $548,875 $109,571 $68,179 $726,62520 JUN $021 JUL $022 AUG $023 SEP $024 OCT $025 NOV MOB $1,149,500 $109,571 $68,179 $1,327,25026 DEC Dredge $6,208,938 $326,750 $109,571 $68,179 $6,713,43827 JAN $6,208,938 $326,750 $109,571 $68,179 $6,713,43828 FEB $6,208,938 $326,750 $109,571 $68,179 $6,713,43829 MAR $6,208,938 $326,750 $109,571 $68,179 $6,713,43830 APR DE-MOB $1,149,500 $548,875 $109,571 $68,179 $1,876,12531 MAY Till, DP, WO $548,875 $109,571 $68,179 $726,62532 JUN $033 JUL $034 AUG $035 SEP $036 OCT $037 NOV MOB $1,149,500 $109,571 $68,179 $1,327,25038 DEC Dredge $6,208,938 $326,750 $109,571 $68,179 $6,713,43839 JAN $6,208,938 $326,750 $109,571 $68,179 $6,713,43840 FEB $6,208,938 $326,750 $109,571 $68,179 $6,713,43841 MAR $6,208,938 $326,750 $109,571 $68,179 $6,713,43842 APR DE-MOB $1,149,500 $548,875 $109,571 $68,179 $1,876,12543 MAY Till, DP, WO $548,875 $109,571 $68,179 $726,625
$0$0$0$0
$4,598,000 $4,598,000 $99,343,000 $5,228,000 $4,391,000 $3,068,000 $1,909,000 $123,135,000

Surf City and North Topsail Beach, NC Final Feasibility Report and Draft Environmental Impact Statement
49
Figure B-21 - Distribution of Initial Construction Costs
Initial Construction Costs
$0
$500,000
$1,000,000
$1,500,000
$2,000,000
$2,500,000
$3,000,000
$3,500,000
$4,000,000
$4,500,000
$5,000,000
NOVJA
NMAR
MAY JUL
SEPNOV
JAN
MARMAY JU
LSEP
NOVJA
NMAR
MAY JUL
SEPNOV
JAN
MARMAY

Surf City and North Topsail Beach, NC Final Feasibility Report and Draft Environmental Impact Statement
50
Table B-16 Calculation of Interest during Construction for NED Plan
IDC= $9,512,574PERIODS MONTHS Expenditures PW AMT.
1 1.155031276 $1,327,250 $1,533,0152 1.151074458 $6,713,438 $7,727,6663 1.147131194 $6,713,438 $7,701,1944 1.143201439 $6,713,438 $7,674,8115 1.139285147 $6,713,438 $7,648,5206 1.13538227 $1,876,125 $2,130,1197 1.131492764 $726,625 $822,1718 1.127616582 $0 $09 1.123753679 $0 $010 1.119904009 $0 $011 1.116067526 $0 $012 1.112244187 $0 $013 1.108433945 $1,327,250 $1,471,16914 1.104636756 $6,713,438 $7,415,91015 1.100852576 $6,713,438 $7,390,50516 1.097081359 $6,713,438 $7,365,18717 1.093323061 $6,713,438 $7,339,95618 1.089577637 $1,876,125 $2,044,18419 1.085845045 $726,625 $789,00220 1.08212524 $0 $021 1.078418177 $0 $022 1.074723814 $0 $023 1.071042107 $0 $024 1.067373012 $0 $025 1.063716487 $1,327,250 $1,411,81826 1.060072487 $6,713,438 $7,116,73027 1.056440972 $6,713,438 $7,092,35028 1.052821896 $6,713,438 $7,068,05429 1.049215219 $6,713,438 $7,043,84130 1.045620897 $1,876,125 $1,961,71631 1.042038888 $726,625 $757,17232 1.038469151 $0 $033 1.034911642 $0 $034 1.03136632 $0 $035 1.027833144 $0 $036 1.024312071 $0 $037 1.020803061 $1,327,250 $1,354,86138 1.017306071 $6,713,438 $6,829,62139 1.013821061 $6,713,438 $6,806,22440 1.01034799 $6,713,438 $6,782,90841 1.006886816 $6,713,438 $6,759,67242 1.0034375 $1,876,125 $1,882,57443 1 $726,625 $726,625
Totals $123,135,000 $132,647,574
IDC $9,512,574rounded $9,513,000

Surf City and North Topsail Beach, NC Final Feasibility Report and Draft Environmental Impact Statement
51
7.03.3 Total Investment Cost The total investment cost of the NED plan is equal to the initial construction plus interest during construction. Therefore, total investment cost is equal to $132,648,000 as shown in Table B-16. The cost of future nourishment is shown separately.
7.03.4 Present Value of Future Nourishment Costs The accumulated present value of all nourishment cost is calculated by discounting all cash flows in future years back to the base year 2018 at the appropriate interest rate. The accumulated present worth of all future nourishment is $80,696,000 as shown in Table B-18. Table B-17 Project Annual Costs – Plan 1550 NED (October 2010 price levels)
interest rate = 4.125% years of analysis = 50ITEM YEAR AMOUNT PRESENT
VALUE, 2014
Total Investment Cost 2014 $132,648,000 $132,648,000
Renourishment 2020 $20,866,000 $16,372,000Renourishment 2026 $27,724,000 $17,069,000Renourishment 2032 $27,724,000 $13,393,000Renourishment 2038 $27,724,000 $10,508,000Renourishment 2044 $27,724,000 $8,245,000Renourishment 2050 $27,724,000 $6,470,000Renourishment 2056 $46,053,000 $8,639,000
Total Investment Cost, Present Value $213,344,000
Annual Costs
Interest & Amortization @ 4-1/8% $10,145,000
Monitoring $505,000
OMRR&R $52,000 Total Annual Cost $10,702,000Cost level Oct-10

Surf City and North Topsail Beach, NC Final Feasibility Report and Draft Environmental Impact Statement
52
7.04 Average Annual Project Costs for NED Plan Average annual project costs are comprised of the interest and amortization of both the total investment (including interest during construction) and total accumulated present worth of the future nourishment. In addition to interest and amortization (I&A), annual costs include the operation and maintenance and the required annual monitoring cost. 7.04.1 I&A of Total Investment Total investment is converted to an average annual equivalent value by amortizing the investment over the 50-year period of analysis. The 50-year interest and amortization (I&A) factor at 4 – 1/8 percent is 0.047551. The annual interest and amortization of the total investment is $6,308,000 as shown in Table B-18. 7.04.2 Annual OMRR&R The non-Federal average annual repair cost refers to the sponsor's expense of repairing the berm, replacing any destroyed beach access walkways following storms, and replanting and fertilizing dune vegetation as necessary. The annual cost of operation and maintenance is estimated to be $52,000. 7.04.3 Annual Monitoring Monitoring is an additional annual cost that is estimated to be $505,000. 7.04.4 I&A of Future Nourishment The accumulated present value of future nourishment is converted to an average annual equivalent value by amortizing the present value over the 50-year period of analysis. The 50-year interest and amortization (I&A) factor at 4 – 1/8 percent is 0.047551. The annual interest and amortization of the future nourishment is $3,837,000 as shown in Table B-18.

Surf City and North Topsail Beach, NC Final Feasibility Report and Draft Environmental Impact Statement
53
Table B- 18 - Summary of Initial Construction & Annual Costs - NED Plan
Cost Elements Cost in Dollars – October 2010 price level
Initial Construction $123,135,000 (reference Appendix N) Interest during Construction $ 9,513,000 (Table B-14) Total Investment Cost $132,648,000 Interest & Amortization 50yr, 4-1/8% $6,308,000 Present Value Future Nourishment $80,696,000 Interest & Amortization 50yr, 4-1/8% $3,837,000 Annual Monitoring Costs $505,000 Annual OMRR&R $52,000 PV Initial and Future Construction $213,344,000
(Table B-17) Total Average Annual Cost $10,702,000
7.05 Benefit/Cost Comparison for NED Plan The Plan 1550 beachfill is expected to decrease the estimated annual expected coastal storm damages from $19,061,000 to $2,241,000. The difference of $16,820,000 is the Plan 1550 storm damage reduction benefits. The annual recreation benefits are estimated to be $20,505,000. Benefits during construction are $59,000,000 with an annual equivalent of $2,804,000. Total annual benefits summarized in Table B-19 are $40,129,000. The damage totals in Table B-19 are based on the selection of the highest of the three damage estimates added to the coastal storm damage total and the remaining two estimates are ignored to ensure no double counting of damages or benefits. The negative amount computed for flood in Table B-19 results from flood inundation damages to structures that were assumed to be destroyed by waves in the without-project condition This multi-step process ensures that damage and benefits are not overstated in the estimates and in no way should be interpreted that the with-project condition is inducing damages in one damage category.

Surf City and North Topsail Beach, NC Final Feasibility Report and Draft Environmental Impact Statement
54
Table B-19 Project Annual Benefits – Plan 1550 NED (October 2010 price levels) Benefit Category Expected Annual Benefit Coastal Storm Damage Reduction Storm Erosion $14,352,000 Flood* ($98,000) Wave $404,000 Land and Long Term Erosion $2,162,000 Subtotal, rounded $16,820,000 Recreation $20,505,000 Sub Total Annualized Benefits $37,325,000 Benefits During Construction, Annual Equivalent $2,804,000 Total Annual Benefits $40,129,000 * Note: Benefit reported as negative due to change in damage category. Total average annual equivalent benefits to the NED plan equal $40,129,000 including recreation benefits. When compared to the average annual cost of $10,702,000, the net benefits over cost equals $29,427,000. The benefit-to-cost ratio is 3.7 to 1.0 as shown in Table B-20. Table B-20 Annual Benefits, Costs, and Benefit-Cost Ratio – NED Plan
NED Plan Benefits1 Costs Net Benefits Benefit/Cost Ratio
1550 $40,129,000 $10,702,000 $29,427,000 3.7
8.0. REGIONAL ECONOMIC DEVELOPMENT (RED) IMPACTS
The following regional economic impacts will be addressed based on the interest of the local sponsor and the surrounding Pender and Onslow counties. Local governments seek to preserve the tax base and encourage the growth in overall property values, to create stability in the labor force and the employment of the labor force. The steady growth of the local community and surrounding region is considered a worthy goal by the state and local governments. Displacement of people, businesses and farms in the study area is not a desirable outcome that sometimes may result from either continued storm damages or even some types of construction.
1 Coastal storm damage reduction benefits plus recreation benefits.

Surf City and North Topsail Beach, NC Final Feasibility Report and Draft Environmental Impact Statement
55
8.01 Preserve Tax Base and, Property Values Real property, including land and structures, in the town of Surf City and North Topsail Beach is subject to property tax by Pender County or Onslow County and the town. The tax base and property values will be preserved with implementation of a coastal storm damage reduction plan. Land loss and long-term erosion eventually renders lots unbuildable with a significantly lower economic value. Typically, the tax valuation of the ocean front lots is severely reduced to reflect the diminished utility of the land. Lower tax valuations may result in lower county and town tax revenues unless there is offsetting development in other areas.
8.02 Employment Stability Tourism is highly valued as a source of employment and income. Employment related to recreation can be less than ideal because of the seasonal nature of recreation and tourism. Increased recreation visitation may improve the income of service industries in the two-county study area. It is unlikely that employment will be significantly impacted with or without storm damage reduction measures. Gains or losses in income or employment are considered regional impacts.
8.03 Community and Regional Growth Implementation of effective damage reduction measures will ensure that the current growth trends in population and recreation visitation will continue. Protection of the streets and highways in the study area preserve community cohesion and encourage the tourism industry on the island, including the towns of Surf City and North Topsail Beach.
8.04 Displacement of People, Businesses, and Farms
Implementation of damage reduction measures under consideration is not expected to displace people, businesses, or farms.

Surf City and North Topsail Beach, NC Final Feasibility Report and Draft Environmental Impact Statement
56
9.0 UNCERTAINTY AND SENSITIVITY OF ANALYSIS TO VARIATION OF VALUES AND ASSUMPTIONS
9.01 Coastal Storm Damage Reduction 9.01.1 Erosion indicators (Topsail Beach example) In order to illustrate the effect of using different erosion indicators, the results of the Topsail Beach NED plan is shown in Figure B-22 and Table B-21 for the Topsail Beach NED plan. Analyses prior to Topsail Beach used the 0.5-foot indicator exclusively. The storm erosion damages presented in this report are based on using the 2.0-foot erosion indicator for 98.5 percent of the structures. The 0.5-foot indicator was used to estimate storm erosion damages to streets, highway, and structures built on concrete slab foundations. The 2.0-foot erosion indicator was used for 597 structures including the 34 commercial structures. Support for this assumption was found in “Erosion Damage Thresholds in North Carolina” (Attachment B-4, pages 12-13) by Spencer Rogers, dated 21 April 2002. An erosion threshold of 2 feet or less may generate more realistic damage estimates than using an erosion threshold of 4 feet when using the SBEACH model. The 0.5-foot erosion indicator was used for 6 single-story homes built on slab foundations, 3 two-story homes built on slabs, and the 27 street segments. Likewise, Surf City and North Topsail Beach used the 2.0 foot indicator in virtually all cases except for structures built on concrete slabs.
Compare Erosion Distance using Different Indicators2.0-foot indicator used primarily in report analysis
0
100
200
300
400
500
600
Erosion Distance in Feet - Storm Frequency in Years
Eros
ion
Dis
tanc
e in
Fee
t
0.5 94 94 95.6 116.54 199.45 219.2 237.25 276.03
2.0 0 0 87.71 116.54 170.78 197.52 221.65 270.91
4.0 0 0 46.31 107.29 143.31 173.94 202.47 259.09
1 3 5 10 25 50 100 500

Surf City and North Topsail Beach, NC Final Feasibility Report and Draft Environmental Impact Statement
57
Figure B-22 – Compare Erosion Distance using Different Indicators
Table B- 21 – Sensitivity Analysis - Erosion Indicators
9.01.2 Erosion Damage Curves Erosion Damage curves, erosion distance, structure distance, and the erosion damage indicator combine to produce estimates of storm damage erosion. The risk and uncertainty of several parameters is addressed in the GRANDUC modeling procedures and included in Appendix D.
9.02 Exclude Recreation Benefits
When the $22,032,000 average annual recreation benefits are excluded, the benefit to cost ratio is reduced. In this case, the benefits to coastal storm damage reduction are $18,097,000 annually. Based on the average annual costs of $10,702,000, the remaining benefits would be $7,395,000 resulting in a BCR of 1.7 to 1.
9.03 Interest Rate In compliance with Executive Order 12893, all benefits and costs were computed using a 7.0 percent interest rate for comparison in the final report. When the average annual benefits to the NED plan at 7 percent are compared to the 4.125 percent total average annual benefits increased very slightly to $41,669,000 or less than 2 percent. Average annual costs increased to $14,227,000, resulting in net benefits of $27,442,000 and a benefit-to-cost ratio of 2.9 counting all NED benefits. The BCR at 4.125 percent was 3.7 to 1.
HSDR benefits Erosion Flood Wave Land Costs B/C RatioBase Totals 135,347,131$ 113,186,049$ 2,282,826$ 5,214,450$ 14,663,809$ -$ N/ABase_4ft_sel 130,866,658$ 110,113,473$ 2,129,122$ 5,203,235$ 13,420,826$ -$ N/A
Percentage change 3.31% 2.71% 6.73% 0.22% 8.48% #DIV/0!Base_4ft_all 116,875,279$ 95,403,732$ 2,240,801$ 5,910,281$ 13,320,463$ -$ N/A
Percentage change 13.65% 15.71% 1.84% -13.34% 9.16% #DIV/0!
RemD1550 Totals 13,226,516$ 7,351,470$ 3,555,428$ 2,316,568$ 3,045$ 55,892,000$ N/ARemD1550_4ft_sel 12,832,179$ 7,130,600$ 3,367,687$ 2,330,848$ 3,045$ 55,892,000$ N/A
Percentage change 2.98% 3.00% 5.28% -0.62% 0.00% 0.00%RemD1550_4ft_all 10,798,196$ 4,810,061$ 3,450,991$ 2,534,156$ 2,990$ 55,892,000$ N/A
Percentage change 18.36% 34.57% 2.94% -9.39% 1.81% 0.00%
Benefits1550 Totals 122,120,615$ 105,834,579$ (1,272,602)$ 2,897,882$ 14,660,764$ (55,892,000)$ 2.18Benefits1550_4ft_sel 118,034,479$ 102,982,873$ (1,238,565)$ 2,872,387$ 13,417,781$ (55,892,000)$ 2.11
Percentage change 3.35% 2.69% 2.67% 0.88% 8.48% 0.00%Benefits1550_4ft_all 106,077,083$ 90,593,671$ (1,210,190)$ 3,376,125$ 13,317,473$ (55,892,000)$ 1.90
Percentage change 13.14% 14.40% 4.90% -16.50% 9.16% 0.00%
Estimates presented in GRR (2.0 ft indicator with a few 0.5-ft indicators for slab const. and roads)Assume 4ft erosion indicator for selected structures (1st row post-1986 construction)Assume 4ft erosion indicator for ALL structures

Surf City and North Topsail Beach, NC Final Feasibility Report and Draft Environmental Impact Statement
58
9.04 Land Values Interior land values were based on actual sales data over a three-year period; however, recent market fluctuations raise the question of how sensitive the economic justification of the NED plan is to rising or falling land values. If the interior land values at Wrightsville Beach, a beach 30 miles south of the study area, were used the BCR for the plan would rise to 3.0 to 1 for CSDR benefits alone and up to 5.0 to 1 with all benefits including recreation. On the other hand, if land values dropped to $20.00 per square foot the result would be to lower the BCR to 1.2 to 1 for CSDR benefits alone and 3.4 to 1 including recreation benefits. The probability of values rising is greater than falling beyond the present market conditions.

West Onslow Beach and New River Inlet (Topsail Beach), NC Final General Reevaluation Report and Final Environmental Impact Statement Attachment B-1 to Appendix B - Flood Damage Curves - Page B-1-1
Structure Type Building inventory codes
Old Code Flood Curve Type
Content value factor
COMMERCIAL Apartments 001 5 1.4 Appliances 002 6 1.75 Auto Dealership 003 7 1.18 Auto Junk Yard 004 8 6 Auto Parts 005 9 3.33 Bait Stand 006 10 1.67 Bank 007 11 1.39 Barber Shop 008 12 1.118 Beauty Shop 009 46 1.375 Boat Stalls 010 13 2 Book Store 011 14 2.68 Bowling Alley 012 15 1.515 Business, Pole Shed (farm), Garage, Frame Tobacco Barn
013,071,011A,076
16 2.664,1.5,1.4,1.9
Church 014 17 1.47 Cleaners 015 18 2.385 Cleaners-sub 016 47 3.176 Clinic-medical 017 19 2.5 Clothing 018 50 3.575 Dentist Office 019 51 2.647 Depart.Store 020 20 2.765 Doctor's Office 021 21 1.845 Drug, Super 022 48 2.533 Funeral Home 023 22 1.176 Furniture 024 23 1.946 Garage, Stable, Animal Barn
025,077 24 1.606,1.4
Hall, Organiz, Pool House
026 25 1.176
Hardware 027 26 3.5 Hotel 028 27 2.724 Jewelry, Greenhouse 029,012A 28 8.5, 1.2 Laundry 030 29 2 Liquor 031 30 1.52 Lumber 032 31 2.198 Market, Super, Poultry Houses
033,078 32 2.7,2.8
Market, Drive 034 49 1.923 Motel 035 33 1.5 Newspaper 036 34 3.125 Office Bldg. 037 35 1.588

West Onslow Beach and New River Inlet (Topsail Beach), NC Final General Reevaluation Report and Final Environmental Impact Statement Attachment B-1 to Appendix B - Flood Damage Curves - Page B-1-2
Structure Type Building inventory codes
Old Code Flood Curve Type
Content value factor
Post Office, Fertilizer Tank, Swimming Pool, Tennis Courts
038,075,013A,014A
36 1.176,1.4,1.15,0
Private Club 039 37 1.32 Restaurant 040 38 2.66 Rest Home 041 39 2 School 042 40 1.294 Service Station 043 41 1.524 Theater 044 42 1.796 Theater, Drive In 045 52 1.376 TV Station 046 43 1.699 Tavern 047 44 1.416 Variety Store, Pierhouse 048 53 2.67 Wash-a-teria (bathhouse)
049 54 2.235
Warehouse, Storage Building (farm&res), Bulk Tobacco Barn (farm)
050,072,010A,074
45 3.47,1.5,1.5,1.5
Grain Bin 073 65 3.5
RESIDENTIAL Res type 1A 1NNN 1 * Res type 2A 1NF, 2NNN, 2NF,
3PF, 3NN 2 *
Res type 3A 3 * Res type 4A 4 * Res type 1H 1PN 55 * Res type 2H 2PN, 3PN 56 * Res type 4H&3H 57 * Res type 1B 58 * Res type 1HL 1PF, 1PP, 1PS 59 * Res type 2HL 2PF, 2PP, 2PS,
3PP, 3PS 60 *
Res type 4HL 61 * 5A Mobile Homes 62 * Upper floors 63 *
Highways 64

West Onslow Beach and New River Inlet (Topsail Beach), NC Final General Reevaluation Report and Final Environmental Impact Statement Attachment B-1 to Appendix B - Flood Damage Curves - Page B-1-3
Key to GRANDUC Residential
and Highway Structure Types
Structure Types - Coastal
Residential
plus Condos upper floors & Highways
Enter Type in Col. 9 of Structure File Enter GRANDUC
Flood Types for Acceptable
Flood Curve Types
Description
Floor Elevations
1 One story 0-6 feet 58 One story with Basement 0-9 feet 55 One story High-raised 4-15 feet 59 One story High-raised with 1/2 living area below 0-6 feet 2 Two story (essentially 2 full stories) 0-6 feet n/a Two story with Basement 0-9 feet 56 Two story High-raised 4-15 feet 60 Two story High-raised with 1/2 living area below 0-6 feet 3 Split level - All space in living area 0 n/a Split level - Garage on lowest level 0 n/a Split level - 1/2 garage 1/2 living area on lowest level 0-4 feet 4 1 1/2 story 0-6 feet n/a 1 1/2 story with Basement 0-9 feet 57 1 1/2 story High-raised 4-15 feet 61 1 1/2 story High-raised with 1/2 living area below 0-6 feet 62 Mobile Home 0-6 feet 63 Residential Condos - upper floors 64 Highways All residential structures have a set content percentage of 30 %, 40 %, or 50 %.

West Onslow Beach and New River Inlet (Topsail Beach), NC Final General Reevaluation Report and Final Environmental Impact Statement Attachment B-1 to Appendix B - Flood Damage Curves - Page B-1-4
FLOOD DAMAGE CURVES BY TYPE OF STRUCTURE
Flood Type
1
Inundation in feet
Structure Damage
Inundation in feet
Content Damage
-24 0 -24 0-7 0 -1 0-6 0.005 0 0.112-1 0.01 1 0.240 0.093 2 0.3641 0.136 3 0.4292 0.233 4 0.465 0.361 5 0.52
10 0.523 10 0.86515 0.725 15 0.95516 0.8 16 120 0.85 17 124 0.85 24 1
Flood Type
2
Inundation in feet
Structure Damage
Inundation in feet
Content Damage
-24 0 -24 0-7 0 -7 0-6 0.003 -1 0-1 0.006 0 0.0730 0.07 1 0.1781 0.091 2 0.2592 0.145 3 0.3035 0.25 4 0.4
10 0.36 5 0.515 0.54 10 0.5816 0.57 15 0.8220 0.675 16 0.8624 0.765 17 1
24 1

West Onslow Beach and New River Inlet (Topsail Beach), NC Final General Reevaluation Report and Final Environmental Impact Statement Attachment B-1 to Appendix B - Flood Damage Curves - Page B-1-5
Flood Type
3
Inundation in feet
Structure Damage
Inundation in feet
Content Damage
-24 0 -24 0-7 0 -1 0-6 0 0 0.034-1 0 1 0.1530 0.028 2 0.2131 0.048 3 0.2532 0.07 4 0.325 0.202 5 0.44
10 0.43 10 0.71615 0.618 15 0.90716 0.666 16 0.93620 0.776 17 0.94324 0.84 24 1
Flood Type
4
Inundation in feet
Structure Damage
Inundation in feet
Content Damage
-24 0 -24 0-7 0 -1 0-6 0.004 0 0.093-1 0.007 1 0.210 0.079 2 0.3121 0.109 3 0.3662 0.18 4 0.435 0.29 5 0.51
10 0.42 10 0.815 0.5 15 0.8716 0.505 16 0.8820 0.595 17 124 0.75 24 1

West Onslow Beach and New River Inlet (Topsail Beach), NC Final General Reevaluation Report and Final Environmental Impact Statement Attachment B-1 to Appendix B - Flood Damage Curves - Page B-1-6
Flood Type
5
Inundation in feet
Structure Damage
Inundation in feet
Content Damage
-24 0 -24 0-1 0 0 00 0.15 24 0.00011 0.195 2 0.212 3 0.23 4 0.254 5 0.289 6 0.318 7 0.346 9 0.42
11 0.505 13 0.58 14 0.61 24 1
Flood Type
6
Inundation in feet
Structure Damage
Inundation in feet
Content Damage
-24 0 -24 0-1 0 0 00 0.05 24 0.00011 0.14 2 0.23 3 0.315 4 0.38 5 0.44 6 0.505 7 0.56 9 0.63
10 0.655 12 0.71 14 0.75 24 1

West Onslow Beach and New River Inlet (Topsail Beach), NC Final General Reevaluation Report and Final Environmental Impact Statement Attachment B-1 to Appendix B - Flood Damage Curves - Page B-1-7
Flood Type
7
Inundation in feet
Structure Damage
Inundation in feet
Content Damage
-24 0 -24 0-1 0 0 00 0.035 24 0.00011 0.064 2 0.091 3 0.135 4 0.195 5 0.292 6 0.428 7 0.575 8 0.675
10 0.777 12 0.866 14 0.94 24 1
Flood Type
8
Inundation in feet
Structure Damage
Inundation in feet
Content Damage
-24 0 -24 0-1 0 0 00 0.07 24 0.00011 0.14 2 0.21 3 0.26 4 0.279 5 0.28 6 0.289 8 0.309 9 0.32
10 0.33 12 0.349 14 0.38 24 1

West Onslow Beach and New River Inlet (Topsail Beach), NC Final General Reevaluation Report and Final Environmental Impact Statement Attachment B-1 to Appendix B - Flood Damage Curves - Page B-1-8
Flood Type
9
Inundation in feet
Structure Damage
Inundation in feet
Content Damage
-24 0 -24 0-1 0 0 00 0.04 24 0.00011 0.105 2 0.19 3 0.268 4 0.324 5 0.369 6 0.41 8 0.49
10 0.55 12 0.61 13 0.64 14 0.667 24 1
Flood Type
10
Inundation in feet
Structure Damage
Inundation in feet
Content Damage
-24 0 -24 0-1 0 0 00 0.06 24 0.00011 0.1 2 0.124 3 0.16 4 0.232 5 0.37 6 0.54 7 0.74 8 0.832
10 0.9 12 0.93 14 0.936 24 1

West Onslow Beach and New River Inlet (Topsail Beach), NC Final General Reevaluation Report and Final Environmental Impact Statement Attachment B-1 to Appendix B - Flood Damage Curves - Page B-1-9
Flood Type
11
Inundation in feet
Structure Damage
Inundation in feet
Content Damage
-24 0 -24 0-1 0 0 00 0.01 24 0.00011 0.05 2 0.132 3 0.21 4 0.23 5 0.242 6 0.26 7 0.278 8 0.3
10 0.35 12 0.394 14 0.45 24 1
Flood Type
12
Inundation in feet
Structure Damage
Inundation in feet
Content Damage
-24 0 -24 0-1 0 0 00 0.04 24 0.00011 0.07 2 0.146 3 0.245 4 0.311 5 0.385 6 0.45 7 0.52 8 0.571
10 0.667 12 0.748 14 0.819 24 1

West Onslow Beach and New River Inlet (Topsail Beach), NC Final General Reevaluation Report and Final Environmental Impact Statement
Attachment B-1 to Appendix B - Flood Damage Curves - Page B-1-10
Flood Type
13
Inundation in feet
Structure Damage
Inundation in feet
Content Damage
-24 0 -24 0-1 0 0 00 0.05 24 0.00011 0.09 2 0.13 3 0.17 4 0.21 5 0.26 6 0.32 7 0.37 8 0.425
10 0.521 12 0.6 14 0.655 24 1
Flood Type
14
Inundation in feet
Structure Damage
Inundation in feet
Content Damage
-24 0 -24 0-1 0 0 00 0.09 24 0.00011 0.17 2 0.235 3 0.294 4 0.36 5 0.483 6 0.61 7 0.752 8 0.837
10 0.871 12 0.91 14 0.92 24 1

West Onslow Beach and New River Inlet (Topsail Beach), NC Final General Reevaluation Report and Final Environmental Impact Statement
Attachment B-1 to Appendix B - Flood Damage Curves - Page B-1-11
Flood Type
15
Inundation in feet
Structure Damage
Inundation in feet
Content Damage
-24 0 -24 0-1 0 0 00 0.24 24 0.00011 0.3 2 0.327 3 0.35 4 0.393 5 0.461 6 0.549 7 0.62 8 0.681
10 0.752 12 0.809 14 0.851 24 1
Flood Type
16
Inundation in feet
Structure Damage
Inundation in feet
Content Damage
-24 0 -24 0-1 0 0 00 0.037 24 0.00011 0.085 2 0.152 3 0.216 4 0.269 5 0.345 6 0.444 7 0.548 8 0.641
10 0.768 12 0.87 14 0.945 24 1

West Onslow Beach and New River Inlet (Topsail Beach), NC Final General Reevaluation Report and Final Environmental Impact Statement
Attachment B-1 to Appendix B - Flood Damage Curves - Page B-1-12
Flood Type
17
Inundation in feet
Structure Damage
Inundation in feet
Content Damage
-24 0 -24 0-1 0 0 00 0.12 24 0.00011 0.165 2 0.19 3 0.218 4 0.248 5 0.28 6 0.32 7 0.37 8 0.425
10 0.529 12 0.63 14 0.73 24 1
Flood Type
18
Inundation in feet
Structure Damage
Inundation in feet
Content Damage
-24 0 -24 0-1 0 0 00 0.05 24 0.00011 0.11 2 0.19 3 0.27 4 0.39 5 0.52 6 0.68 7 0.841 8 0.954
10 0.98 12 0.982 14 0.985 24 1

West Onslow Beach and New River Inlet (Topsail Beach), NC Final General Reevaluation Report and Final Environmental Impact Statement
Attachment B-1 to Appendix B - Flood Damage Curves - Page B-1-13
Flood Type
19
Inundation in feet
Structure Damage
Inundation in feet
Content Damage
-24 0 -24 0-1 0 0 00 0.07 24 0.00011 0.161 2 0.272 3 0.37 4 0.415 5 0.466 6 0.49 7 0.52 8 0.549
10 0.592 12 0.635 14 0.68 24 1
Flood Type
20
Inundation in feet
Structure Damage
Inundation in feet
Content Damage
-24 0 -24 0-1 0 0 00 0.15 24 0.00011 0.201 2 0.286 3 0.366 4 0.435 5 0.495 6 0.552 7 0.615 8 0.666
10 0.751 12 0.84 14 0.973 24 1

West Onslow Beach and New River Inlet (Topsail Beach), NC Final General Reevaluation Report and Final Environmental Impact Statement
Attachment B-1 to Appendix B - Flood Damage Curves - Page B-1-14
Flood Type
21
Inundation in feet
Structure Damage
Inundation in feet
Content Damage
-24 0 -24 0-1 0 0 00 0.02 24 0.00011 0.07 2 0.168 3 0.26 4 0.34 5 0.43 6 0.51 7 0.58 8 0.645
10 0.77 12 0.859 14 0.95 24 1
Flood Type
22
Inundation in feet
Structure Damage
Inundation in feet
Content Damage
-24 0 -24 0-1 0 0 00 0.17 24 0.00011 0.245 2 0.31 3 0.38 4 0.465 5 0.545 6 0.625 7 0.705 8 0.775
10 0.841 12 0.876 14 0.915 24 1

West Onslow Beach and New River Inlet (Topsail Beach), NC Final General Reevaluation Report and Final Environmental Impact Statement
Attachment B-1 to Appendix B - Flood Damage Curves - Page B-1-15
Flood Type
23
Inundation in feet
Structure Damage
Inundation in feet
Content Damage
-24 0 -24 0-1 0 0 00 0.147 24 0.00011 0.251 2 0.341 3 0.4 4 0.442 5 0.472 6 0.497 7 0.524 8 0.554
10 0.622 12 0.679 14 0.739 24 1
Flood Type
24
Inundation in feet
Structure Damage
Inundation in feet
Content Damage
-24 0 -24 0-1 0 0 00 0.03 24 0.00011 0.072 2 0.121 3 0.168 4 0.202 5 0.241 6 0.28 7 0.32 8 0.365
10 0.458 12 0.545 14 0.636 24 1

West Onslow Beach and New River Inlet (Topsail Beach), NC Final General Reevaluation Report and Final Environmental Impact Statement
Attachment B-1 to Appendix B - Flood Damage Curves - Page B-1-16
Flood Type
25
Inundation in feet
Structure Damage
Inundation in feet
Content Damage
-24 0 -24 0-1 0 0 00 0.015 24 0.00011 0.033 2 0.06 3 0.105 4 0.178 5 0.233 6 0.3 7 0.36 8 0.43
10 0.568 12 0.695 14 0.821 24 1
Flood Type
26
Inundation in feet
Structure Damage
Inundation in feet
Content Damage
-24 0 -24 0-1 0 0 00 0.04 24 0.00011 0.103 2 0.185 3 0.248 4 0.288 5 0.327 6 0.37 7 0.415 8 0.465
10 0.548 12 0.638 14 0.724 24 1

West Onslow Beach and New River Inlet (Topsail Beach), NC Final General Reevaluation Report and Final Environmental Impact Statement
Attachment B-1 to Appendix B - Flood Damage Curves - Page B-1-17
Flood Type
27
Inundation in feet
Structure Damage
Inundation in feet
Content Damage
-24 0 -24 0-1 0 0 00 0.11 24 0.00011 0.21 2 0.3 3 0.37 4 0.42 5 0.465 6 0.51 7 0.56 8 0.61
10 0.7 12 0.79 14 0.88 24 1
Flood Type
28
Inundation in feet
Structure Damage
Inundation in feet
Content Damage
-24 0 -24 0-1 0 0 00 0.07 24 0.00011 0.16 2 0.27 3 0.37 4 0.44 5 0.51 6 0.57 7 0.63 8 0.7
10 0.8 12 0.876 14 0.92 24 1

West Onslow Beach and New River Inlet (Topsail Beach), NC Final General Reevaluation Report and Final Environmental Impact Statement
Attachment B-1 to Appendix B - Flood Damage Curves - Page B-1-18
Flood Type
29
Inundation in feet
Structure Damage
Inundation in feet
Content Damage
-24 0 -24 0-1 0 0 00 0.05 24 0.00011 0.12 2 0.204 3 0.29 4 0.37 5 0.45 6 0.52 7 0.598 8 0.65
10 0.732 12 0.816 14 0.899 24 1
Flood Type
30
Inundation in feet
Structure Damage
Inundation in feet
Content Damage
-24 0 -24 0-1 0 0 00 0.08 24 0.00011 0.13 2 0.17 3 0.21 4 0.249 5 0.29 6 0.349 7 0.4 8 0.455
10 0.56 12 0.65 14 0.74 24 1

West Onslow Beach and New River Inlet (Topsail Beach), NC Final General Reevaluation Report and Final Environmental Impact Statement
Attachment B-1 to Appendix B - Flood Damage Curves - Page B-1-19
Flood Type
31
Inundation in feet
Structure Damage
Inundation in feet
Content Damage
-24 0 -24 0-1 0 0 00 0.03 24 0.00011 0.058 2 0.081 3 0.13 4 0.2 5 0.28 6 0.35 7 0.42 8 0.498
10 0.637 12 0.78 14 0.92 24 1
Flood Type
32
Inundation in feet
Structure Damage
Inundation in feet
Content Damage
-24 0 -24 0-1 0 0 00 0.06 24 0.00011 0.192 2 0.349 3 0.482 4 0.561 5 0.641 6 0.72 7 0.8 8 0.857
10 0.901 12 0.922 14 0.94 24 1
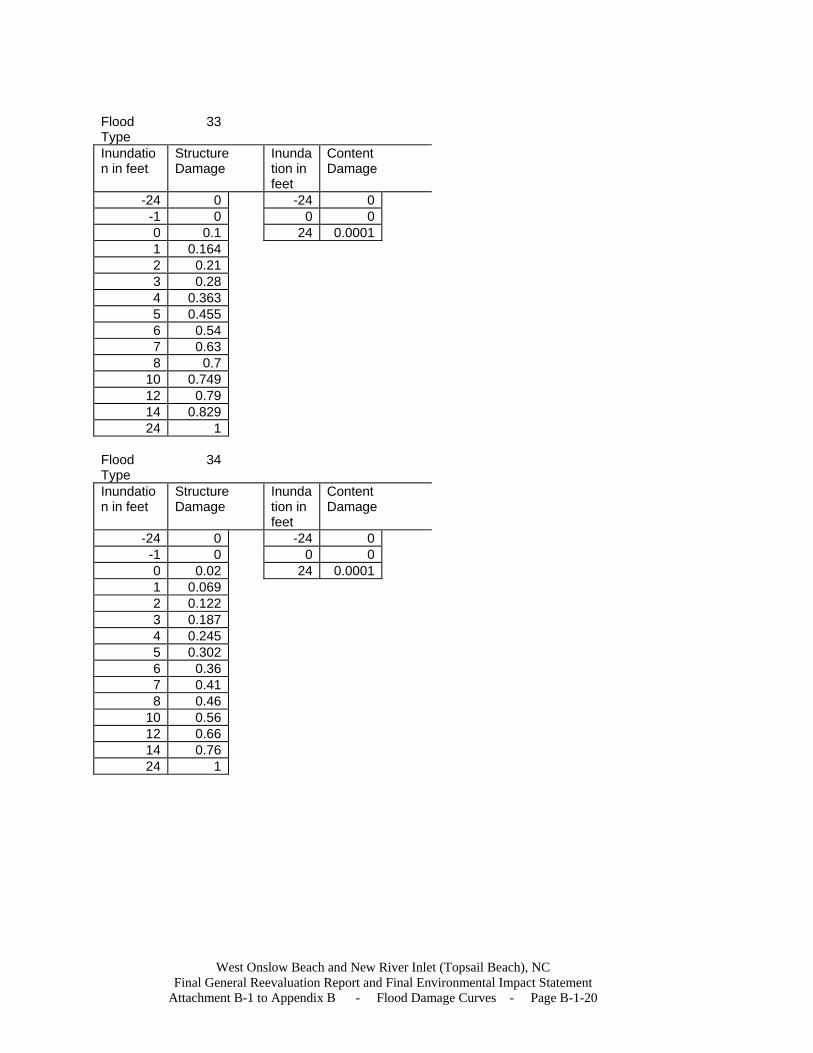
West Onslow Beach and New River Inlet (Topsail Beach), NC Final General Reevaluation Report and Final Environmental Impact Statement
Attachment B-1 to Appendix B - Flood Damage Curves - Page B-1-20
Flood Type
33
Inundation in feet
Structure Damage
Inundation in feet
Content Damage
-24 0 -24 0-1 0 0 00 0.1 24 0.00011 0.164 2 0.21 3 0.28 4 0.363 5 0.455 6 0.54 7 0.63 8 0.7
10 0.749 12 0.79 14 0.829 24 1
Flood Type
34
Inundation in feet
Structure Damage
Inundation in feet
Content Damage
-24 0 -24 0-1 0 0 00 0.02 24 0.00011 0.069 2 0.122 3 0.187 4 0.245 5 0.302 6 0.36 7 0.41 8 0.46
10 0.56 12 0.66 14 0.76 24 1

West Onslow Beach and New River Inlet (Topsail Beach), NC Final General Reevaluation Report and Final Environmental Impact Statement
Attachment B-1 to Appendix B - Flood Damage Curves - Page B-1-21
Flood Type
35
Inundation in feet
Structure Damage
Inundation in feet
Content Damage
-24 0 -24 0-1 0 0 00 0.26 24 0.00011 0.349 2 0.41 3 0.48 4 0.545 5 0.604 6 0.66 7 0.714 8 0.763
10 0.825 12 0.879 14 0.932 24 1
Flood Type
36
Inundation in feet
Structure Damage
Inundation in feet
Content Damage
-24 0 -24 0-1 0 0 00 0.05 24 0.00011 0.08 2 0.095 3 0.103 4 0.113 5 0.125 6 0.135 7 0.145 8 0.158
10 0.181 12 0.21 14 0.239 24 1

West Onslow Beach and New River Inlet (Topsail Beach), NC Final General Reevaluation Report and Final Environmental Impact Statement
Attachment B-1 to Appendix B - Flood Damage Curves - Page B-1-22
Flood Type
37
Inundation in feet
Structure Damage
Inundation in feet
Content Damage
-24 0 -24 0-1 0 0 00 0.06 24 0.00011 0.185 2 0.334 3 0.44 4 0.485 5 0.53 6 0.57 7 0.61 8 0.66
10 0.741 12 0.825 14 0.905 24 1
Flood Type
38
Inundation in feet
Structure Damage
Inundation in feet
Content Damage
-24 0 -24 0-1 0 0 00 0.08 24 0.00011 0.199 2 0.318 3 0.43 4 0.52 5 0.59 6 0.66 7 0.73 8 0.787
10 0.86 12 0.93 14 0.968 24 1

West Onslow Beach and New River Inlet (Topsail Beach), NC Final General Reevaluation Report and Final Environmental Impact Statement
Attachment B-1 to Appendix B - Flood Damage Curves - Page B-1-23
Flood Type
39
Inundation in feet
Structure Damage
Inundation in feet
Content Damage
-24 0 -24 0-1 0 0 00 0.12 24 0.00011 0.205 2 0.27 3 0.34 4 0.413 5 0.49 6 0.55 7 0.62 8 0.68
10 0.78 12 0.88 14 0.975 24 1
Flood Type
40
Inundation in feet
Structure Damage
Inundation in feet
Content Damage
-24 0 -24 0-1 0 0 00 0.04 24 0.00011 0.22 2 0.29 3 0.34 4 0.39 5 0.44 6 0.48 7 0.529 8 0.573
10 0.66 12 0.745 14 0.83 24 1

West Onslow Beach and New River Inlet (Topsail Beach), NC Final General Reevaluation Report and Final Environmental Impact Statement
Attachment B-1 to Appendix B - Flood Damage Curves - Page B-1-24
Flood Type
41
Inundation in feet
Structure Damage
Inundation in feet
Content Damage
-24 0 -24 0-1 0 0 00 0.065 24 0.00011 0.128 2 0.205 3 0.278 4 0.327 5 0.374 6 0.42 7 0.47 8 0.517
10 0.614 12 0.705 14 0.802 24 1
Flood Type
42
Inundation in feet
Structure Damage
Inundation in feet
Content Damage
-24 0 -24 0-1 0 0 00 0.02 24 0.00011 0.075 2 0.163 3 0.21 4 0.221 5 0.231 6 0.242 7 0.25 8 0.251
10 0.252 12 0.261 14 0.27 24 1

West Onslow Beach and New River Inlet (Topsail Beach), NC Final General Reevaluation Report and Final Environmental Impact Statement
Attachment B-1 to Appendix B - Flood Damage Curves - Page B-1-25
Flood Type
43
Inundation in feet
Structure Damage
Inundation in feet
Content Damage
-24 0 -24 0-1 0 0 00 0.03 24 0.00011 0.06 2 0.085 3 0.11 4 0.14 5 0.17 6 0.2 7 0.231 8 0.27
10 0.338 12 0.405 14 0.47 24 1
Flood Type
44
Inundation in feet
Structure Damage
Inundation in feet
Content Damage
-24 0 -24 0-1 0 0 00 0.03 24 0.00011 0.13 2 0.455 3 0.631 4 0.665 5 0.679 6 0.691 7 0.701 8 0.715
10 0.74 12 0.76 14 0.781 24 1
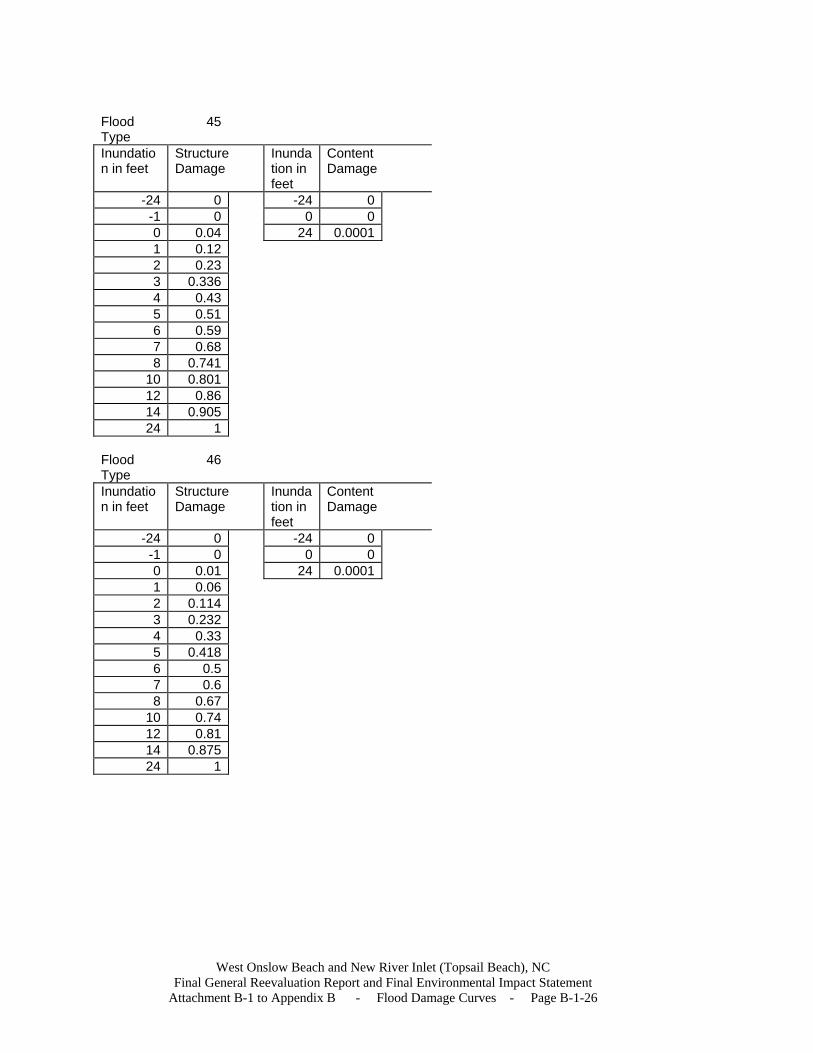
West Onslow Beach and New River Inlet (Topsail Beach), NC Final General Reevaluation Report and Final Environmental Impact Statement
Attachment B-1 to Appendix B - Flood Damage Curves - Page B-1-26
Flood Type
45
Inundation in feet
Structure Damage
Inundation in feet
Content Damage
-24 0 -24 0-1 0 0 00 0.04 24 0.00011 0.12 2 0.23 3 0.336 4 0.43 5 0.51 6 0.59 7 0.68 8 0.741
10 0.801 12 0.86 14 0.905 24 1
Flood Type
46
Inundation in feet
Structure Damage
Inundation in feet
Content Damage
-24 0 -24 0-1 0 0 00 0.01 24 0.00011 0.06 2 0.114 3 0.232 4 0.33 5 0.418 6 0.5 7 0.6 8 0.67
10 0.74 12 0.81 14 0.875 24 1

West Onslow Beach and New River Inlet (Topsail Beach), NC Final General Reevaluation Report and Final Environmental Impact Statement
Attachment B-1 to Appendix B - Flood Damage Curves - Page B-1-27
Flood Type
47
Inundation in feet
Structure Damage
Inundation in feet
Content Damage
-24 0 -24 0-1 0 0 00 0.04 24 0.00011 0.059 2 0.07 3 0.101 4 0.22 5 0.39 6 0.56 7 0.75 8 0.88
10 0.925 12 0.941 14 0.961 24 1
Flood Type
48
Inundation in feet
Structure Damage
Inundation in feet
Content Damage
-24 0 -24 0-1 0 0 00 0.05 24 0.00011 0.18 2 0.36 3 0.495 4 0.569 5 0.635 6 0.7 7 0.775 8 0.826
10 0.855 12 0.876 14 0.901 24 1

West Onslow Beach and New River Inlet (Topsail Beach), NC Final General Reevaluation Report and Final Environmental Impact Statement
Attachment B-1 to Appendix B - Flood Damage Curves - Page B-1-28
Flood Type
49
Inundation in feet
Structure Damage
Inundation in feet
Content Damage
-24 0 -24 0-1 0 0 00 0.02 24 0.00011 0.14 2 0.255 3 0.375 4 0.495 5 0.6 6 0.708 7 0.828 8 0.911
10 0.97 12 0.98 14 0.995 24 1
Flood Type
50
Inundation in feet
Structure Damage
Inundation in feet
Content Damage
-24 0 -24 0-1 0 0 00 0.05 24 0.00011 0.187 2 0.431 3 0.595 4 0.66 5 0.72 6 0.773 7 0.83 8 0.87
10 0.911 12 0.94 14 0.964 24 1

West Onslow Beach and New River Inlet (Topsail Beach), NC Final General Reevaluation Report and Final Environmental Impact Statement
Attachment B-1 to Appendix B - Flood Damage Curves - Page B-1-29
Flood Type
51
Inundation in feet
Structure Damage
Inundation in feet
Content Damage
-24 0 -24 0-1 0 0 00 0.02 24 0.00011 0.05 2 0.091 3 0.155 4 0.245 5 0.358 6 0.5 7 0.662 8 0.781
10 0.84 12 0.865 14 0.891 24 1
Flood Type
52
Inundation in feet
Structure Damage
Inundation in feet
Content Damage
-24 0 -24 0-1 0 0 00 0.01 24 0.00011 0.012 2 0.019 3 0.029 4 0.06 5 0.091 6 0.13 7 0.169 8 0.21
10 0.28 12 0.351 14 0.421 24 1

West Onslow Beach and New River Inlet (Topsail Beach), NC Final General Reevaluation Report and Final Environmental Impact Statement
Attachment B-1 to Appendix B - Flood Damage Curves - Page B-1-30
Flood Type
53
Inundation in feet
Structure Damage
Inundation in feet
Content Damage
-24 0 -24 0-1 0 0 00 0.045 24 0.00011 0.106 2 0.179 3 0.244 4 0.295 5 0.345 6 0.392 7 0.433 8 0.48
10 0.572 12 0.66 14 0.745 24 1
Flood Type
54
Inundation in feet
Structure Damage
Inundation in feet
Content Damage
-24 0 -24 0-1 0 0 00 0.06 24 0.00011 0.2 2 0.395 3 0.524 4 0.58 5 0.625 6 0.67 7 0.716 8 0.76
10 0.835 12 0.905 14 0.971 24 1

West Onslow Beach and New River Inlet (Topsail Beach), NC Final General Reevaluation Report and Final Environmental Impact Statement
Attachment B-1 to Appendix B - Flood Damage Curves - Page B-1-31
Flood Type
55
Inundation in feet
Structure Damage
Inundation in feet
Content Damage
-24 0 -24 0-14 0.01 -14 0.007
-5 0.035 -13 0.008-1 0.055 -6 0.060 0.093 -2 0.1251 0.136 -1 0.132 0.233 0 0.143 0.36 1 0.264 0.39 2 0.385 0.455 3 0.52
10 0.536 4 0.63515 0.735 5 0.7816 0.8 10 0.94520 0.85 14 124 1 24 1
Flood Type
56
Inundation in feet
Structure Damage
Inundation in feet
Content Damage
-24 0 -24 0-14 0.006 -14 0.011
-6 0.025 -13 0.012-2 0.033 -6 0.045-1 0.035 -1 0.0940 0.07 0 0.1011 0.091 1 0.1872 0.145 2 0.2863 0.229 3 0.384 0.253 4 0.455 0.29 5 0.534
10 0.369 10 0.63315 0.548 16 0.8620 0.675 17 124 1 24 1
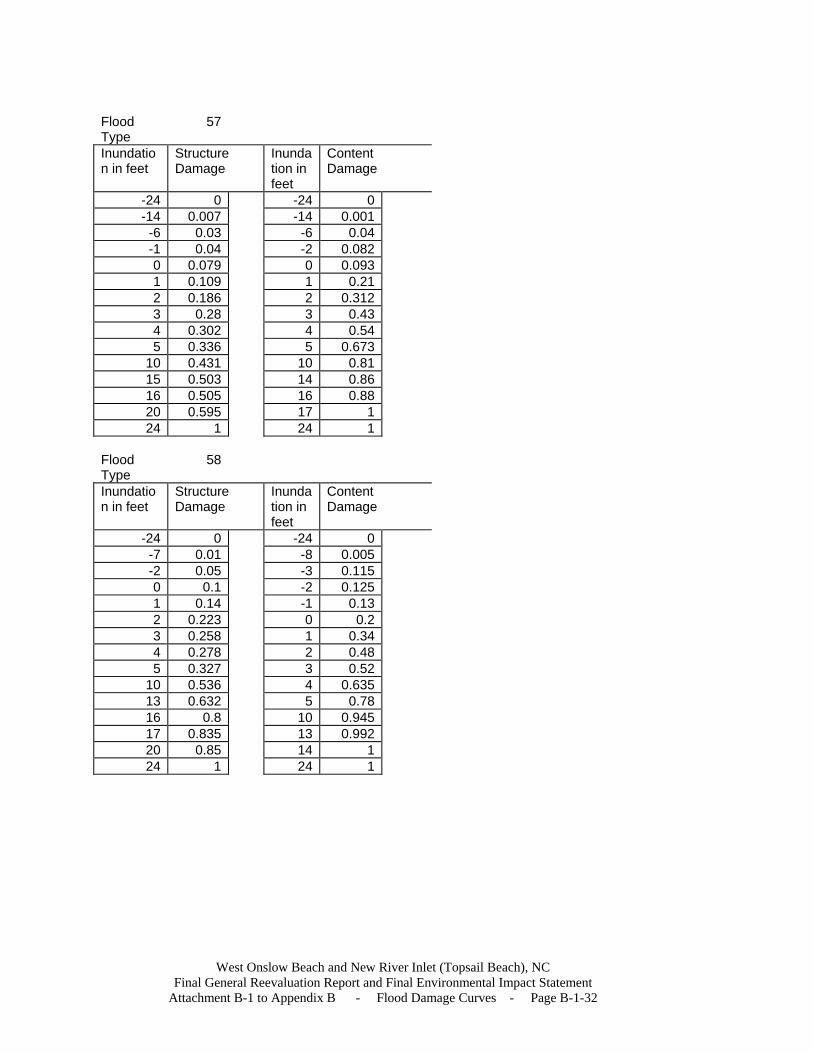
West Onslow Beach and New River Inlet (Topsail Beach), NC Final General Reevaluation Report and Final Environmental Impact Statement
Attachment B-1 to Appendix B - Flood Damage Curves - Page B-1-32
Flood Type
57
Inundation in feet
Structure Damage
Inundation in feet
Content Damage
-24 0 -24 0-14 0.007 -14 0.001
-6 0.03 -6 0.04-1 0.04 -2 0.0820 0.079 0 0.0931 0.109 1 0.212 0.186 2 0.3123 0.28 3 0.434 0.302 4 0.545 0.336 5 0.673
10 0.431 10 0.8115 0.503 14 0.8616 0.505 16 0.8820 0.595 17 124 1 24 1
Flood Type
58
Inundation in feet
Structure Damage
Inundation in feet
Content Damage
-24 0 -24 0-7 0.01 -8 0.005-2 0.05 -3 0.1150 0.1 -2 0.1251 0.14 -1 0.132 0.223 0 0.23 0.258 1 0.344 0.278 2 0.485 0.327 3 0.52
10 0.536 4 0.63513 0.632 5 0.7816 0.8 10 0.94517 0.835 13 0.99220 0.85 14 124 1 24 1

West Onslow Beach and New River Inlet (Topsail Beach), NC Final General Reevaluation Report and Final Environmental Impact Statement
Attachment B-1 to Appendix B - Flood Damage Curves - Page B-1-33
Flood Type
59
Inundation in feet
Structure Damage
Inundation in feet
Content Damage
-24 0 -24 0-6 0.002 -1 00 0.007 0 0.0211 0.035 1 0.1122 0.055 2 0.1577 0.165 3 0.1988 0.2 4 0.2439 0.208 5 0.282
10 0.317 7 0.32211 0.421 8 0.37712 0.452 10 0.54216 0.61 12 0.71717 0.625 13 0.8220 0.677 17 0.95224 1 24 1
Flood Type
60
Inundation in feet
Structure Damage
Inundation in feet
Content Damage
-24 0 -24 0-6 0.001 -1 00 0.004 0 0.0141 0.022 1 0.0686 0.099 2 0.0987 0.102 3 0.1268 0.126 4 0.1549 0.158 5 0.179
10 0.208 7 0.20512 0.317 8 0.25113 0.355 10 0.40216 0.433 12 0.53617 0.447 17 0.67420 0.548 22 0.86624 1 24 1

West Onslow Beach and New River Inlet (Topsail Beach), NC Final General Reevaluation Report and Final Environmental Impact Statement
Attachment B-1 to Appendix B - Flood Damage Curves - Page B-1-34
Flood Type
61
Inundation in feet
Structure Damage
Inundation in feet
Content Damage
-24 0 -24 0-7 0 -1 0-6 0.002 0 0.0160 0.005 3 0.1481 0.027 5 0.2117 0.125 7 0.2418 0.152 8 0.282
10 0.27 9 0.34311 0.346 10 0.44412 0.37 11 0.5413 0.406 12 0.62516 0.49 13 0.7317 0.513 17 0.8520 0.567 22 0.89524 1 24 1
Flood Type
62
Inundation in feet
Structure Damage
Inundation in feet
Content Damage
-24 0 -24 0-7 0 -1 0-6 0.005 0 0.06-3 0.01 1 0.215-1 0.03 2 0.3160 0.08 3 0.3651 0.272 4 0.52 0.417 5 0.633 0.6 6 0.744 0.93 7 0.825 0.96 8 1
10 0.978 24 111 0.98 24 1

West Onslow Beach and New River Inlet (Topsail Beach), NC Final General Reevaluation Report and Final Environmental Impact Statement
Attachment B-1 to Appendix B - Flood Damage Curves - Page B-1-35
Flood Type
63
Inundation in feet
Structure Damage
Inundation in feet
Content Damage
-24 0 -24 0-14 0 -10 0-13 0 -7 0
-2 0 -3 0-1 0 0 01 0 5 02 0 7 03 0 8 0
14 0 9 016 0 12 019 0 13 021 0 16 022 0 24 024 0
Flood Type
64
Inundation in feet
Structure Damage
Inundation in feet
Content Damage
-24 0 -24 0-1 0 0 00 0.0065 24 01 0.013 2 0.023 3 0.033 4 0.038 5 0.042 7 0.052
10 0.066 12 0.077 15 0.095 18 0.113 20 0.125 24 0.15

West Onslow Beach and New River Inlet (Topsail Beach), NC Final General Reevaluation Report and Final Environmental Impact Statement
Attachment B-1 to Appendix B - Flood Damage Curves - Page B-1-36
Flood Type
65
Inundation in feet
Structure Damage
Inundation in feet
Content Damage
-24 0 -24 0-1 0 0 00 0.028 24 01 0.085 2 0.152 3 0.216 5 0.345 7 0.548 8 0.641 9 0.708
10 0.768 11 0.826 15 1 20 1 24 1

West Onslow Beach and New River Inlet (Topsail Beach), NC Final General Reevaluation Report and Final Environmental Impact Statement
Attachment B-2 to Appendix B - Erosion Damage Curves - Page B-2-1
Attachment B-2 – Erosion Damage Curves
Decision tree for assigning Erosion Curves to Structures Ocean-
front Building
Code Ground Elevation Piling
Length Erosion Curve #
for short pilings high if ≥12 feet NGVD
for long pilings high if ≥16 feet NGVD
assume short if building date is prior 1986
Yes, or 1 1PF high both 1 Yes, or 1 1PF low short 2 Yes, or 1 1PF low long 3 Yes, or 1 2PF high both 4 Yes, or 1 2PF low short 5 Yes, or 1 2PF low long 6 Yes, or 1 3PF high both 7 Yes, or 1 3PF low long 8 Yes, or 1 3PF low short 9 Yes, or 1 1PP high both 10 Yes, or 1 1PP low long 11 Yes, or 1 1PP low short 12 Yes, or 1 2PP high both 13 Yes, or 1 2PP low long 14 Yes, or 1 2PP low short 15 Yes, or 1 3PP high both 16 Yes, or 1 3PP low short 17 Yes, or 1 3PP low long 18 Yes, or 1 1PS high both 19 Yes, or 1 1PS low long 20 Yes, or 1 1PS low short 21 Yes, or 1 2PS high both 22 Yes, or 1 2PS low short 23 Yes, or 1 2PS low long 24 Yes, or 1 3PS high both 25 Yes, or 1 3PS low long 26 Yes, or 1 3PS low short 27 Yes, or 1 1PN,2PN,3PN high both 28 Yes, or 1 1PN,2PN,3PN low long 29 Yes, or 1 1PN,2PN,3PN low short 30 No, or 0
Yes, or 1
Any
1NN, 2NN, 3NN, 1NF, 2NF, & all commercial structures
Any
Any
Any
Any
31
31
Yes, or 1 Upper Floors any both 32 Yes, or 1 mobile, utility, pools any both 33 Yes, or 1 highways any N/A 34 * if dune elevation ≥16 feet do not need to assign long or short pilings because they have the same erosion curve.

West Onslow Beach and New River Inlet (Topsail Beach), NC Final General Reevaluation Report and Final Environmental Impact Statement
Attachment B-2 to Appendix B - Erosion Damage Curves - Page B-2-2
1PF high dune Curve #1
Erosion factor
Value to enclosure
damage to enclosure
value to house
damage to house
composite damage
0 0.4 0.05 0.6 0.05 0.050.1 0.4 0.2 0.6 0.1 0.140.2 0.4 0.4 0.6 0.2 0.280.3 0.4 0.8 0.6 0.4 0.560.4 0.4 1 0.6 0.8 0.880.5 0.4 1 0.6 1 10.6 0.4 1 0.6 1 10.7 0.4 1 0.6 1 10.8 0.4 1 0.6 1 10.9 0.4 1 0.6 1 1
1 0.4 1 0.6 1 1
**Assume high dune Elevation equal or exceed 12 feet above NGVD.
1PF low elevation, short pilings Curve #2
Erosion factor
Value to enclosure
damage to enclosure
value to house
damage to house
composite damage
0 0.4 0.05 0.6 0.05 0.050.1 0.4 0.2 0.6 0.1 0.140.2 0.4 0.4 0.6 0.2 0.280.3 0.4 0.8 0.6 0.3 0.50.4 0.4 1 0.6 0.4 0.640.5 0.4 1 0.6 0.5 0.70.6 0.4 1 0.6 0.6 0.760.7 0.4 1 0.6 0.7 0.820.8 0.4 1 0.6 0.8 0.880.9 0.4 1 0.6 0.9 0.94
1 0.4 1 0.6 1 1
Erosion damage 1-story on Pilings with Full enclosure (1PF)
Only with high dune
0
0.2
0.4
0.6
0.8
1
1.2
0 0.2 0.4 0.6 0.8 1 1.2Piling Foundation - % piliings compromised
Dam
age
fact
or
Erosion damage - 1-story on Pilings, Full enclosure (1PF), Low dune, Stort pilings
0
0.2
0.4
0.6
0.8
11.2
0 0.2 0.4 0.6 0.8 1 1.2Piling foundation - % pilings compromised
Dam
age
Fact
or

West Onslow Beach and New River Inlet (Topsail Beach), NC Final General Reevaluation Report and Final Environmental Impact Statement
Attachment B-2 to Appendix B - Erosion Damage Curves - Page B-2-3
1PF low elevation, long piling Curve #3
Erosion factor
Value to enclosure
damage to enclosure
value to house
damage to house
composite damage
0 0.4 0.05 0.6 0 0.020.1 0.4 0.2 0.6 0.01 0.0860.2 0.4 0.4 0.6 0.02 0.1720.3 0.4 0.8 0.6 0.03 0.3380.4 0.4 1 0.6 0.04 0.4240.5 0.4 1 0.6 0.05 0.430.6 0.4 1 0.6 0.06 0.4360.7 0.4 1 0.6 0.07 0.4420.8 0.4 1 0.6 0.08 0.4480.9 0.4 1 0.6 0.09 0.454
1 0.4 1 0.6 0.1 0.46
*these graphs are for the appendices for the Bogue 933 project.
2PF high dune Curve #4
Erosion factor
Value to enclosure
damage to enclosure
value to house
damage to house
composite damage
0 0.2 0.05 0.8 0.05 0.050.1 0.2 0.2 0.8 0.1 0.120.2 0.2 0.4 0.8 0.2 0.240.3 0.2 0.8 0.8 0.4 0.480.4 0.2 1 0.8 0.8 0.840.5 0.2 1 0.8 1 10.6 0.2 1 0.8 1 10.7 0.2 1 0.8 1 10.8 0.2 1 0.8 1 10.9 0.2 1 0.8 1 1
1 0.2 1 0.8 1 1**Assume high dune
Erosion damage - 1-story, on Pilings, Full enclosure, Low dune, Long pilings
-0.3
0.2
0.7
1.2
0 0.2 0.4 0.6 0.8 1 1.2Piling Foundation - % of pilings compromisedD
amag
e Fa
ctor
Damage to House
00.20.40.60.8
11.2
0 0.5 1Erosion
Dam
age
Damage to Enclosure
0
0.2
0.4
0.6
0.8
1
1.2
0 0.1 0.2 0.3 0.4 0.5 0.6 0.7 0.8 0.9 1
Erosion
Dam
age
Erosion Damage - 2-story on Pilings, Full enclosure, high dune
00.20.40.60.8
11.2
0 0.2 0.4 0.6 0.8 1 1.2Piling Foundation % of pilings compromised
Dam
age
Fact
or

West Onslow Beach and New River Inlet (Topsail Beach), NC Final General Reevaluation Report and Final Environmental Impact Statement
Attachment B-2 to Appendix B - Erosion Damage Curves - Page B-2-4
2PF low elevation (<12) and short pilings (<=8Curve #5
Erosion factor
Value to enclosure
damage to enclosure
value to house
damage to house
composite damage
0 0.2 0.05 0.8 0.05 0.050.1 0.2 0.2 0.8 0.1 0.120.2 0.2 0.4 0.8 0.2 0.240.3 0.2 0.8 0.8 0.3 0.40.4 0.2 1 0.8 0.4 0.520.5 0.2 1 0.8 0.5 0.60.6 0.2 1 0.8 0.6 0.680.7 0.2 1 0.8 0.7 0.760.8 0.2 1 0.8 0.8 0.840.9 0.2 1 0.8 0.9 0.92
1 0.2 1 0.8 1 1
2PF Low elevation (<16) and long pilings (>=8Curve #6
Erosion factor
Value to enclosure
damage to enclosure
value to house
damage to house
composite damage
0 0.2 0.05 0.8 0 0.010.1 0.2 0.2 0.8 0.01 0.0480.2 0.2 0.4 0.8 0.02 0.0960.3 0.2 0.8 0.8 0.03 0.1840.4 0.2 1 0.8 0.04 0.2320.5 0.2 1 0.8 0.05 0.240.6 0.2 1 0.8 0.06 0.2480.7 0.2 1 0.8 0.07 0.2560.8 0.2 1 0.8 0.08 0.2640.9 0.2 1 0.8 0.09 0.272
1 0.2 1 0.8 0.1 0.28
Erosion Damage - 2-story, Short pilings, Low elevation
0
0.2
0.4
0.6
0.8
1
1.2
0 0.2 0.4 0.6 0.8 1 1.2Piling foundation % pilings compromised
Dam
age
Fact
or
Erosion Damage - 2-story, on Long Pilings, Low elevation
00.20.40.60.8
11.2
0 0.5 1 1.5Piling Foundation % Pilings compromised
Dam
age
Fact
or

West Onslow Beach and New River Inlet (Topsail Beach), NC Final General Reevaluation Report and Final Environmental Impact Statement
Attachment B-2 to Appendix B - Erosion Damage Curves - Page B-2-5
3PF high dune Curve #7
Erosion factor
Value to enclosure
damage to enclosure
value to house
damage to house
composite damage
0 0.13 0.05 0.87 0.05 0.050.1 0.13 0.2 0.87 0.1 0.1130.2 0.13 0.4 0.87 0.2 0.2260.3 0.13 0.8 0.87 0.4 0.4520.4 0.13 1 0.87 0.8 0.8260.5 0.13 1 0.87 1 10.6 0.13 1 0.87 1 10.7 0.13 1 0.87 1 10.8 0.13 1 0.87 1 10.9 0.13 1 0.87 1 1
1 0.13 1 0.87 1 1**Assume high dune
3PF low dune, long pilings Curve #8
Erosion factor
Value to enclosure
damage to enclosure
value to house
damage to house
composite damage
0 0.13 0.05 0.87 0 0.00650.1 0.13 0.2 0.87 0.01 0.03470.2 0.13 0.4 0.87 0.02 0.06940.3 0.13 0.8 0.87 0.03 0.13010.4 0.13 1 0.87 0.04 0.16480.5 0.13 1 0.87 0.05 0.17350.6 0.13 1 0.87 0.06 0.18220.7 0.13 1 0.87 0.07 0.19090.8 0.13 1 0.87 0.08 0.19960.9 0.13 1 0.87 0.09 0.2083
1 0.13 1 0.87 0.1 0.217
Erosion Damage - 3-story on pilings, Full enclosure, High dune
00.20.40.60.8
11.2
0 0.2 0.4 0.6 0.8 1 1.2Piling foundation % Pilings compromised
Dam
age
Fact
or
Erosion Damage - 3-story, Long Pilings, Full enclosure
0
0.2
0.4
0.6
0.8
1
1.2
0 0.2 0.4 0.6 0.8 1 1.2Piling Foundation % pilings compromised
Dam
age
Fact
or

West Onslow Beach and New River Inlet (Topsail Beach), NC Final General Reevaluation Report and Final Environmental Impact Statement
Attachment B-2 to Appendix B - Erosion Damage Curves - Page B-2-6
3PF low dune, short pilings Curve #9
Erosion factor
Value to enclosure
damage to enclosure
value to house
damage to house
composite damage
0 0.13 0.05 0.87 0.05 0.050.1 0.13 0.2 0.87 0.1 0.1130.2 0.13 0.4 0.87 0.2 0.2260.3 0.13 0.8 0.87 0.3 0.3650.4 0.13 1 0.87 0.4 0.4780.5 0.13 1 0.87 0.5 0.5650.6 0.13 1 0.87 0.6 0.6520.7 0.13 1 0.87 0.7 0.7390.8 0.13 1 0.87 0.8 0.8260.9 0.13 1 0.87 0.9 0.913
1 0.13 1 0.87 1 1
1PP High dune, long or short pilings Curve #10
Erosion factor
Value to enclosure
damage to enclosure
value to house
damage to house
composite damage
0 0.2 0.05 0.8 0.05 0.050.1 0.2 0.2 0.8 0.1 0.120.2 0.2 0.4 0.8 0.2 0.240.3 0.2 0.8 0.8 0.4 0.480.4 0.2 1 0.8 0.8 0.840.5 0.2 1 0.8 1 10.6 0.2 1 0.8 1 10.7 0.2 1 0.8 1 10.8 0.2 1 0.8 1 10.9 0.2 1 0.8 1 1
1 0.2 1 0.8 1 1
**Assume high dune
Erosion Damage - 3-story, on Short Pilings, Full enclosure, Low elevation
0
0.2
0.4
0.6
0.8
1
1.2
0 0.2 0.4 0.6 0.8 1 1.2Piling Foundation % pilings compromised
Dam
age
Fact
or
Erosion Damage - 1-story, on Pilings, High dune
0
0.2
0.4
0.6
0.8
1
1.2
0 0.2 0.4 0.6 0.8 1 1.2Piling Foundation % pilings compromised
Dam
age
Fact
or

West Onslow Beach and New River Inlet (Topsail Beach), NC Final General Reevaluation Report and Final Environmental Impact Statement
Attachment B-2 to Appendix B - Erosion Damage Curves - Page B-2-7
1PP Low elevation and long pilings Curve #11
Erosion factor
Value to enclosure
damage to enclosure
value to house
damage to house
composite damage
0 0.2 0.05 0.8 0 0.010.1 0.2 0.2 0.8 0.01 0.0480.2 0.2 0.4 0.8 0.02 0.0960.3 0.2 0.8 0.8 0.03 0.1840.4 0.2 1 0.8 0.04 0.2320.5 0.2 1 0.8 0.05 0.240.6 0.2 1 0.8 0.06 0.2480.7 0.2 1 0.8 0.07 0.2560.8 0.2 1 0.8 0.08 0.2640.9 0.2 1 0.8 0.09 0.272
1 0.2 1 0.8 0.1 0.28
1PP low elevation, short pilings Curve #12
Erosion factor
Value to enclosure
damage to enclosure
value to house
damage to house
composite damage
0 0.2 0.05 0.8 0.05 0.050.1 0.2 0.2 0.8 0.1 0.120.2 0.2 0.4 0.8 0.2 0.240.3 0.2 0.8 0.8 0.3 0.40.4 0.2 1 0.8 0.4 0.520.5 0.2 1 0.8 0.5 0.60.6 0.2 1 0.8 0.6 0.680.7 0.2 1 0.8 0.7 0.760.8 0.2 1 0.8 0.8 0.840.9 0.2 1 0.8 0.9 0.92
1 0.2 1 0.8 1 1
Erosion Damage - 1-story, on long Pilings, Low Elevation
0
0.2
0.4
0.6
0.8
1
1.2
0 0.2 0.4 0.6 0.8 1 1.2Piling Foundation % pilings compromised
Dam
age
Fact
or
Erosion damage - 1-story, on Pilings, Partial enclosure,Low dune, Short pilings
0
0.2
0.4
0.6
0.8
11.2
0 0.2 0.4 0.6 0.8 1 1.2Piling foundation % of pilings compromised
Dam
age
Fact
or

West Onslow Beach and New River Inlet (Topsail Beach), NC Final General Reevaluation Report and Final Environmental Impact Statement
Attachment B-2 to Appendix B - Erosion Damage Curves - Page B-2-8
2PP high elevation, short or long piling Curve #13
Erosion factor
Value to enclosure
damage to enclosure
value to house
damage to house
composite damage
0 0.1 0.05 0.9 0.05 0.050.1 0.1 0.2 0.9 0.1 0.110.2 0.1 0.4 0.9 0.2 0.220.3 0.1 0.8 0.9 0.4 0.440.4 0.1 1 0.9 0.8 0.820.5 0.1 1 0.9 1 10.6 0.1 1 0.9 1 10.7 0.1 1 0.9 1 10.8 0.1 1 0.9 1 10.9 0.1 1 0.9 1 1
1 0.1 1 0.9 1 1
**Assume high dune
2PP low elevation and long pilings Curve #14
Erosion factor
Value to enclosure
damage to enclosure
value to house
damage to house
composite damage
0 0.1 0.05 0.9 0 0.0050.1 0.1 0.2 0.9 0.01 0.0290.2 0.1 0.4 0.9 0.02 0.0580.3 0.1 0.8 0.9 0.03 0.1070.4 0.1 1 0.9 0.04 0.1360.5 0.1 1 0.9 0.05 0.1450.6 0.1 1 0.9 0.06 0.1540.7 0.1 1 0.9 0.07 0.1630.8 0.1 1 0.9 0.08 0.1720.9 0.1 1 0.9 0.09 0.181
1 0.1 1 0.9 0.1 0.19
Erosion Damage 2-story, on Pilings, High Elevation
0
0.2
0.4
0.6
0.8
1
1.2
0 0.2 0.4 0.6 0.8 1 1.2Piling Foundation % piling compromised
Dam
age
Fact
or
Erosion Damage - 2-story, on Long Pilings, Low elevation
00.20.40.60.8
11.2
0 0.2 0.4 0.6 0.8 1 1.2Piling Foundation % pilings compromised
Dam
age
Fact
or

West Onslow Beach and New River Inlet (Topsail Beach), NC Final General Reevaluation Report and Final Environmental Impact Statement
Attachment B-2 to Appendix B - Erosion Damage Curves - Page B-2-9
2PP low elevation and short pilings Curve #15
Erosion factor
Value to enclosure
damage to enclosure
value to house
damage to house
composite damage
0 0.1 0.05 0.9 0.05 0.050.1 0.1 0.2 0.9 0.1 0.110.2 0.1 0.4 0.9 0.2 0.220.3 0.1 0.8 0.9 0.3 0.350.4 0.1 1 0.9 0.4 0.460.5 0.1 1 0.9 0.5 0.550.6 0.1 1 0.9 0.6 0.640.7 0.1 1 0.9 0.7 0.730.8 0.1 1 0.9 0.8 0.820.9 0.1 1 0.9 0.9 0.91
1 0.1 1 0.9 1 1
3PP high dune, short or long pilings Curve #16
Erosion factor
Value to enclosure
damage to enclosure
value to house
damage to house
composite damage
0 0.06 0.05 0.94 0.05 0.050.1 0.06 0.2 0.94 0.1 0.1060.2 0.06 0.4 0.94 0.2 0.2120.3 0.06 0.8 0.94 0.4 0.4240.4 0.06 1 0.94 0.8 0.8120.5 0.06 1 0.94 1 10.6 0.06 1 0.94 1 10.7 0.06 1 0.94 1 10.8 0.06 1 0.94 1 10.9 0.06 1 0.94 1 1
1 0.06 1 0.94 1 1
**Assume high dune
Erosion Damage - 2-story, on Short PIlings, Partial enclosure, Low Elevation
0
0.2
0.4
0.6
0.8
1
1.2
0 0.2 0.4 0.6 0.8 1 1.2Piling Foundation % Pilings compromised
Dam
age
Fact
or
Erosion Damage - 3-story, on Pilings, Partial enclosure, High dune
0
0.2
0.4
0.6
0.8
1
1.2
0 0.2 0.4 0.6 0.8 1 1.2Piling Foundation % Pilings compromised
Dam
age
Fact
or

West Onslow Beach and New River Inlet (Topsail Beach), NC Final General Reevaluation Report and Final Environmental Impact Statement
Attachment B-2 to Appendix B - Erosion Damage Curves - Page B-2-10
3PP low elevation, short pilings Curve #17
Erosion factor
Value to enclosure
damage to enclosure
value to house
damage to house
composite damage
0 0.06 0.05 0.94 0.05 0.050.1 0.06 0.2 0.94 0.1 0.1060.2 0.06 0.4 0.94 0.2 0.2120.3 0.06 0.8 0.94 0.3 0.330.4 0.06 1 0.94 0.4 0.4360.5 0.06 1 0.94 0.5 0.530.6 0.06 1 0.94 0.6 0.6240.7 0.06 1 0.94 0.7 0.7180.8 0.06 1 0.94 0.8 0.8120.9 0.06 1 0.94 0.9 0.906
1 0.06 1 0.94 1 1
3PP low elevation, long pilings Curve #18
Erosion factor
Value to enclosure
damage to enclosure
value to house
damage to house
composite damage
0 0.06 0.05 0.94 0 0.0030.1 0.06 0.2 0.94 0.01 0.02140.2 0.06 0.4 0.94 0.02 0.04280.3 0.06 0.8 0.94 0.03 0.07620.4 0.06 1 0.94 0.04 0.09760.5 0.06 1 0.94 0.05 0.1070.6 0.06 1 0.94 0.06 0.11640.7 0.06 1 0.94 0.07 0.12580.8 0.06 1 0.94 0.08 0.13520.9 0.06 1 0.94 0.09 0.1446
1 0.06 1 0.94 0.1 0.154
Erosion Damage - 3-story, on Short pilings, Low elevation
0
0.2
0.4
0.6
0.8
1
1.2
0 0.2 0.4 0.6 0.8 1 1.2Piling Foundation % pilings compromised
Dam
age
Fact
or
Erosion Damage - 3-story, on Long Pilings, Partial enclosure, Low elevation
0
0.2
0.4
0.6
0.8
1
1.2
0 0.2 0.4 0.6 0.8 1 1.2Piling Foundation % pilings compromised
Dam
age
Fact
or

West Onslow Beach and New River Inlet (Topsail Beach), NC Final General Reevaluation Report and Final Environmental Impact Statement
Attachment B-2 to Appendix B - Erosion Damage Curves - Page B-2-11
1PS high dune Curve #19
Erosion factor
Value to enclosure
damage to enclosure
value to house
damage to house
composite damage
0 0.1 0.05 0.9 0.05 0.050.1 0.1 0.2 0.9 0.1 0.110.2 0.1 0.4 0.9 0.2 0.220.3 0.1 0.8 0.9 0.4 0.440.4 0.1 1 0.9 0.8 0.820.5 0.1 1 0.9 1 10.6 0.1 1 0.9 1 10.7 0.1 1 0.9 1 10.8 0.1 1 0.9 1 10.9 0.1 1 0.9 1 1
1 0.1 1 0.9 1 1
**Assume high dune
1PS low dune, long pilings Curve #20
Erosion factor
Value to enclosure
damage to enclosure
value to house
damage to house
composite damage
0 0.1 0.05 0.9 0 0.0050.1 0.1 0.2 0.9 0.01 0.0290.2 0.1 0.4 0.9 0.02 0.0580.3 0.1 0.8 0.9 0.03 0.1070.4 0.1 1 0.9 0.04 0.1360.5 0.1 1 0.9 0.05 0.1450.6 0.1 1 0.9 0.06 0.1540.7 0.1 1 0.9 0.07 0.1630.8 0.1 1 0.9 0.08 0.1720.9 0.1 1 0.9 0.09 0.181
1 0.1 1 0.9 0.1 0.19
Erosion Damage - 1-story, on Pilings, Small enclosure, High dune
00.20.40.60.8
11.2
0 0.2 0.4 0.6 0.8 1 1.2Piling foundation % Pilings Compromised
Dam
age
Fact
or
Erosion Damage - 1-story, on Pilings, Small enclosure, Low dune, Long pilings
00.20.40.60.8
11.2
0 0.2 0.4 0.6 0.8 1 1.2Piling Foundation % of pilings compromised
Dam
age
Fact
or

West Onslow Beach and New River Inlet (Topsail Beach), NC Final General Reevaluation Report and Final Environmental Impact Statement
Attachment B-2 to Appendix B - Erosion Damage Curves - Page B-2-12
1PS low dune, short pilings Curve #21
Erosion factor
Value to enclosure
damage to enclosure
value to house
damage to house
composite damage
0 0.1 0.05 0.9 0.05 0.050.1 0.1 0.2 0.9 0.1 0.110.2 0.1 0.4 0.9 0.2 0.220.3 0.1 0.8 0.9 0.3 0.350.4 0.1 1 0.9 0.4 0.460.5 0.1 1 0.9 0.5 0.550.6 0.1 1 0.9 0.6 0.640.7 0.1 1 0.9 0.7 0.730.8 0.1 1 0.9 0.8 0.820.9 0.1 1 0.9 0.9 0.91
1 0.1 1 0.9 1 1
2PS high dune, short or long pilings Curve #22
Erosion factor
Value to enclosure
damage to enclosure
value to house
damage to house
composite damage
0 0.05 0.05 0.95 0.05 0.050.1 0.05 0.2 0.95 0.1 0.1050.2 0.05 0.4 0.95 0.2 0.210.3 0.05 0.8 0.95 0.4 0.420.4 0.05 1 0.95 0.8 0.810.5 0.05 1 0.95 1 10.6 0.05 1 0.95 1 10.7 0.05 1 0.95 1 10.8 0.05 1 0.95 1 10.9 0.05 1 0.95 1 1
1 0.06 1 0.95 1 1.0
**Assume high dune
Erosion Damage - 1-story, on Pilings, Small enclosure, Low dune, Short pilings
0
0.2
0.4
0.6
0.8
1
1.2
0 0.2 0.4 0.6 0.8 1 1.2Piling Foundation % of pilings Compromised
Dam
age
Fact
or
Erosion Damage - 2-story, on Pilings, Small enclosure, high dune
00.20.40.60.8
11.2
0 0.2 0.4 0.6 0.8 1 1.2Piling Foundation % pilings compromised
Dam
age
Fact
or

West Onslow Beach and New River Inlet (Topsail Beach), NC Final General Reevaluation Report and Final Environmental Impact Statement
Attachment B-2 to Appendix B - Erosion Damage Curves - Page B-2-13
2PS low dune, short pilings Curve #23
Erosion factor
Value to enclosure
damage to enclosure
value to house
damage to house
composite damage
0 0.05 0.05 0.95 0.05 0.050.1 0.05 0.2 0.95 0.1 0.1050.2 0.05 0.4 0.95 0.2 0.210.3 0.05 0.8 0.95 0.3 0.3250.4 0.05 1 0.95 0.4 0.430.5 0.05 1 0.95 0.5 0.5250.6 0.05 1 0.95 0.6 0.620.7 0.05 1 0.95 0.7 0.7150.8 0.05 1 0.95 0.8 0.810.9 0.05 1 0.95 0.9 0.905
1 0.06 1 0.95 1 1.0
2PS Low elevation, long pilings Curve #24
Erosion factor
Value to enclosure
damage to enclosure
value to house
damage to house
composite damage
0 0.05 0.05 0.95 0 0.00250.1 0.05 0.2 0.95 0.01 0.01950.2 0.05 0.4 0.95 0.02 0.0390.3 0.05 0.8 0.95 0.03 0.06850.4 0.05 1 0.95 0.04 0.0880.5 0.05 1 0.95 0.05 0.09750.6 0.05 1 0.95 0.06 0.1070.7 0.05 1 0.95 0.07 0.11650.8 0.05 1 0.95 0.08 0.1260.9 0.05 1 0.95 0.09 0.1355
1 0.06 1 0.95 0.1 0.2
Erosion Damage 2-story, on Short pilings, Small enclosure, Low dune
0
0.2
0.4
0.6
0.8
1
1.2
0 0.2 0.4 0.6 0.8 1 1.2Piling Foundaton % pilings compromised
Dam
age
Fact
or
Erosion Damage - 2-story, on Pilings, Small enclosure, Low dune, long pililng
0
0.2
0.4
0.6
0.8
1
1.2
0 0.2 0.4 0.6 0.8 1 1.2Pilng Foundation % pilngs compromised
Dam
age
Fact
or

West Onslow Beach and New River Inlet (Topsail Beach), NC Final General Reevaluation Report and Final Environmental Impact Statement
Attachment B-2 to Appendix B - Erosion Damage Curves - Page B-2-14
3PS high elevation, long or short pilings Curve #25
Erosion factor
Value to enclosure
damage to enclosure
value to house
damage to house
composite damage
0 0.03 0.05 0.97 0.05 0.050.1 0.03 0.2 0.97 0.1 0.1030.2 0.03 0.4 0.97 0.2 0.2060.3 0.03 0.8 0.97 0.4 0.4120.4 0.03 1 0.97 0.8 0.8060.5 0.03 1 0.97 1 10.6 0.03 1 0.97 1 10.7 0.03 1 0.97 1 10.8 0.03 1 0.97 1 10.9 0.03 1 0.97 1 1
1 0.03 1 0.97 1 1
**Assume high dune
3PS low elevation, long pilings Curve #26
Erosion factor
Value to enclosure
damage to enclosure
value to house
damage to house
composite damage
0 0.03 0.05 0.97 0 0.00150.1 0.03 0.2 0.97 0.01 0.01570.2 0.03 0.4 0.97 0.02 0.03140.3 0.03 0.8 0.97 0.03 0.05310.4 0.03 1 0.97 0.04 0.06880.5 0.03 1 0.97 0.05 0.07850.6 0.03 1 0.97 0.06 0.08820.7 0.03 1 0.97 0.07 0.09790.8 0.03 1 0.97 0.08 0.10760.9 0.03 1 0.97 0.09 0.1173
1 0.03 1 0.97 0.1 0.127
Erosion Damage - 3-story. on Pilings, Small enclosure, High elevation
0
0.2
0.4
0.6
0.8
1
1.2
0 0.2 0.4 0.6 0.8 1 1.2Piling Foundation % pilings compromised
Dam
age
Fact
or
Erosion Damage - 3-story on Long Pilings, Small enclosure, Low elevation
0
0.2
0.4
0.6
0.8
1
1.2
0 0.2 0.4 0.6 0.8 1 1.2Piling Foundation % pilings compromised
Dam
age
Fact
or

West Onslow Beach and New River Inlet (Topsail Beach), NC Final General Reevaluation Report and Final Environmental Impact Statement
Attachment B-2 to Appendix B - Erosion Damage Curves - Page B-2-15
3PS low elevation, short pilings Curve #27
Erosion factor
Value to enclosure
damage to enclosure
value to house
damage to house
composite damage
0 0.03 0.05 0.97 0.05 0.050.1 0.03 0.2 0.97 0.1 0.1030.2 0.03 0.4 0.97 0.2 0.2060.3 0.03 0.8 0.97 0.3 0.3150.4 0.03 1 0.97 0.4 0.4180.5 0.03 1 0.97 0.5 0.5150.6 0.03 1 0.97 0.6 0.6120.7 0.03 1 0.97 0.7 0.7090.8 0.03 1 0.97 0.8 0.8060.9 0.03 1 0.97 0.9 0.903
1 0.03 1 0.97 1 1
1PN, 2PN, 3PN on high dune Curve #28
Erosion factor
Value to enclosure
damage to enclosure
value to house
damage to house
composite damage
0 0 0.05 1 0.05 0.050.1 0 0.2 1 0.1 0.10.2 0 0.4 1 0.2 0.20.3 0 0.8 1 0.4 0.40.4 0 1 1 0.8 0.80.5 0 1 1 1 10.6 0 1 1 1 10.7 0 1 1 1 10.8 0 1 1 1 10.9 0 1 1 1 1
1 0 1 1 1 1
**Assume high dune
Erosion Damage - 3-story, on Short pilings, Small enclosure, Low elevation
0
0.2
0.4
0.6
0.8
1
1.2
0 0.2 0.4 0.6 0.8 1 1.2Piling Foundation % pilings compromised
Dam
age
Fact
or
Erosion Damage - 1,2, or 3-story on Pilngs with High dune No enclosure
0
0.2
0.4
0.6
0.8
1
1.2
0 0.2 0.4 0.6 0.8 1 1.2Piling Foundation % pilings compromised
Dam
age
Fact
or

West Onslow Beach and New River Inlet (Topsail Beach), NC Final General Reevaluation Report and Final Environmental Impact Statement
Attachment B-2 to Appendix B - Erosion Damage Curves - Page B-2-16
1PN, 2PN, 3PN on low dune with long pilings Curve #29
Erosion factor
Value to enclosure
damage to enclosure
value to house
damage to house
composite damage
0 0 0.05 1 0 00.1 0 0.2 1 0.01 0.010.2 0 0.4 1 0.02 0.020.3 0 0.8 1 0.03 0.030.4 0 1 1 0.04 0.040.5 0 1 1 0.05 0.050.6 0 1 1 0.06 0.060.7 0 1 1 0.07 0.070.8 0 1 1 0.08 0.080.9 0 1 1 0.09 0.09
1 0 1 1 0.1 0.1
Curve #301PN, 2PN, 3PN low elevation and short pilings
Erosion factor
Value to enclosure
damage to enclosure
value to house
damage to house
composite damage
0 0 0.05 1 0.05 0.050.1 0 0.2 1 0.1 0.10.2 0 0.4 1 0.2 0.20.3 0 0.8 1 0.3 0.30.4 0 1 1 0.4 0.40.5 0 1 1 0.5 0.50.6 0 1 1 0.6 0.60.7 0 1 1 0.7 0.70.8 0 1 1 0.8 0.80.9 0 1 1 0.9 0.9
1 0 1 1 1 1
Erosion Damage - 1,2, or 3-story on Long Pilings, No enclosure, Low dune
0
0.2
0.4
0.6
0.8
1
1.2
0 0.2 0.4 0.6 0.8 1 1.2Piling Foundation % pilings compromised
Dam
age
Fact
or
Erosion Damage - 1,2, or 3-story on Short Pilings, No enclosure, Low elevation
0
0.2
0.4
0.6
0.8
1
1.2
0 0.2 0.4 0.6 0.8 1 1.2Piling Foundation % pilings compromised
Dam
age
Fact
or

West Onslow Beach and New River Inlet (Topsail Beach), NC Final General Reevaluation Report and Final Environmental Impact Statement
Attachment B-2 to Appendix B - Erosion Damage Curves - Page B-2-17
Curve #311NN, 2NN, 3NN, 1NF, 2NF, and all 2nd and 3rd row houses
and commercial properties
Erosion factor
Value to enclosure
damage to enclosure
value to house
damage to house
composite damage
0 0 0.05 1 0.05 0.050.1 0 0.2 1 0.2 0.20.2 0 0.4 1 0.4 0.40.3 0 0.8 1 0.6 0.60.4 0 1 1 0.8 0.80.5 0 1 1 1 10.6 0 1 1 1 10.7 0 1 1 1 10.8 0 1 1 1 10.9 0 1 1 1 1
1 0 1 1 1 1
This curve is applied at any elevation
Erosion damage - all 2nd and 3rd row structures; all slab (non-piling) foundation; all commercial;
High and low dune elevation
00.20.40.60.8
11.2
0 0.2 0.4 0.6 0.8 1 1.2Undermining of footprint or % of pilings
compromised
Dam
age
Fact
or

West Onslow Beach and New River Inlet (Topsail Beach), NC Final General Reevaluation Report and Final Environmental Impact Statement
Attachment B-2 to Appendix B - Erosion Damage Curves - Page B-2-18
Curve #33Mobile homes, utility buildings, oceanfront residential decks detached decks, gazebos, pools, detached garages, buried public utilities
Erosion factor
Value to enclosure
damage to enclosure
value to house
damage to house
composite damage
0 0 0 1 0 00.1 0 0 1 0.5 0.50.2 0 0 1 1 10.3 0 0 1 1 10.4 0 0 1 1 10.5 0 0 1 1 10.6 0 0 1 1 10.7 0 0 1 1 10.8 0 0 1 1 10.9 0 0 1 1 1
1 0 0 1 1 1
Highway erosion damages Curve #34erosion damage
0 00.033 0.25
0.1 0.60.5 0.8
0.75 11 1
Mobile Homes, Miscellaneous structures
0
0.2
0.4
0.6
0.8
1
1.2
0 0.2 0.4 0.6 0.8 1 1.2Foundation footprint % undermined
Dam
age
Fact
or
Highway erosion damages
00.20.40.60.8
11.2
0 0.2 0.4 0.6 0.8 1 1.2Erosion of Roadway Width
Dam
age
Fact
or

Attachment B-3to Appendix B - Economic Analysis
Surf City - North Topsail BeachFeasibility Study page 1of 51
Reach ID USACE_ID REF lot front
Lot length Lot width
REF struc front
Struc length AA Ratio Flood
Curve
Replacement Value of Structure in Dollars
Value of Contents in Dollars
G_elev FF_elev Active Erosion Curve Armor Erosion
Indicator
27 027S_SH3016A 0 107 140 57 35 1 59 113,001$ 40,355$ 20.3 31.6 1 1 -1 0.527 027S_SHHWY 110 64 1000 130 24 1 64 42,450$ -$ 16.22 16.2 1 34 -1 0.527 027BEEC0105A 280 80 90 269 30 1 1 84,005$ 30,000$ 10 13.6 1 31 -1 0.527 027BEEC0106A 280 80 90 284 40 1 59 224,013$ 80,000$ 9 17.5 1 31 -1 227 027HISP0105A 280 80 90 274 30 1 60 190,411$ 68,000$ 8 16.6 1 31 -1 227 027HISP0106A 280 80 90 281 35 1 59 235,213$ 84,000$ 8 16.4 1 31 -1 227 027OLEA0099A 186 174 77 213 45 1 59 600,000$ 180,000$ 22.2 28.3 1 31 -1 0.527 027OLEA0098A 190 174 77 210 40 1 56 809,000$ 242,700$ 20 32 1 31 -1 227 027OLEA0100A 190 174 77 210 40 1 56 740,000$ 222,000$ 20 32 1 31 -1 227 027S_SH2817A 186 174 77 223 55 1 59 252,014$ 90,000$ 19.5 29.3 1 31 -1 0.527 027S_SH2821A 186 174 77 196 55 1 59 246,414$ 88,000$ 19.4 28.8 1 31 -1 0.527 027S_SH2903A 186 174 77 196 25 1 59 87,365$ 31,200$ 19.1 24.9 1 31 -1 0.527 027S_SH2903G 276 74 77 249 30 1 24 23,396$ 8,355$ 14 14 1 31 -1 0.527 027S_SH2905A 186 174 77 216 35 1 59 302,417$ 108,000$ 20.3 29.5 1 31 -1 0.527 027S_SH2911A 186 94 90 200 40 1 56 400,000$ 120,000$ 24.6 26.2 1 31 -1 0.527 027S_SH3003A 186 94 90 178 40 1 59 120,967$ 43,200$ 20.5 25.6 1 31 -1 0.527 027S_SH3005A 186 94 90 174 35 1 59 84,005$ 30,000$ 20 25.2 1 31 -1 0.527 027S_SH3008A 0 125 90 83 20 1 60 50,000$ 10,000$ 19.4 24.7 1 28 -1 0.527 027S_SH3011A 186 94 90 191 25 1 1 1,000$ -$ 18.6 18.6 1 31 -1 0.527 027S_SH2819A 186 174 77 140 40 1 56 590,000$ 177,000$ 8 20 1 31 -1 227 027S_SHFF02A 186 94 90 120 40 1 56 315,125$ 109,150$ 8 20 1 31 -1 227 027S_SHFF03A 186 94 90 140 40 1 56 315,125$ 109,150$ 8 20 1 31 -1 227 027S_SHHWY 0 64 1000 115 34 1 64 105,868$ -$ 18.6 18.6 1 34 -1 0.5
-99928 028BLAN0109A 360 90 91 358 40 1 59 156,809$ 56,000$ 8 20.7 1 31 -1 228 028S_SH2719A 236 214 91 317 30 1 2 488,348$ 174,400$ 13.2 17.1 1 31 -1 0.528 028S_SH2719B 236 214 91 175 20 1 45 35,000$ 17,500$ 13.2 13.2 1 31 -1 228 028S_SH2721A 236 214 91 265 55 1 55 207,212$ 74,000$ 15 24 1 31 -1 228 028S_SH2723A 236 214 91 251 55 1 55 206,092$ 73,600$ 16.1 23.9 1 31 -1 228 028S_SH2725A 236 214 91 247 30 1 55 95,205$ 34,000$ 16.2 25.4 1 31 -1 228 028S_SH2735A 236 214 91 260 40 1 59 352,820$ 126,000$ 16.8 26.6 1 31 -1 228 028S_SH2805A 236 214 91 234 30 1 59 67,204$ 24,000$ 22.5 24.3 1 31 -1 228 028S_SH2807A 236 214 91 228 30 1 2 112,006$ 40,000$ 22.3 22.3 1 31 -1 0.528 028S_SHFF01A 210 450 91 265 40 1 56 315,125$ 109,150$ 16 28 1 24 -1 228 028S_SHFF02A 210 450 91 265 40 1 56 315,125$ 109,150$ 16 28 1 24 -1 228 028_S_SH0107 236 214 91 250 40 1 56 595,000$ 178,500$ 15 27 1 31 -1 228 028OLEA0098A 210 360 91 265 40 1 56 730,000$ 219,000$ 16 28 1 24 -1 2

Attachment B-3to Appendix B - Economic Analysis
Surf City - North Topsail BeachFeasibility Study page 2of 51
Reach ID USACE_ID REF lot front
Lot length Lot width
REF struc front
Struc length AA Ratio Flood
Curve
Replacement Value of Structure in Dollars
Value of Contents in Dollars
G_elev FF_elev Active Erosion Curve Armor Erosion
Indicator
28 028OLEA0100A 210 450 91 265 40 1 56 740,000$ 222,000$ 16 28 1 24 -1 228 028S_SHFF05A 210 450 91 265 40 1 56 315,125$ 109,150$ 16 28 1 31 -1 228 028S_SHHWY 0 64 1000 165 34 1 64 105,868$ -$ 16.6 16.6 1 34 -1 0.5
-99929 029CHAN0128A 240 160 100 279 30 1 56 113,001$ 40,355$ 11 14.5 1 31 -1 229 029S_SH2610A 0 180 83 103 30 1 59 201,611$ 72,000$ 17.8 26.3 1 10 -1 0.529 029S_SH2612A 0 180 83 112 20 1 59 235,213$ 84,000$ 17.4 26.1 1 10 -1 0.529 029S_SH2614A 0 180 83 118 25 1 59 162,409$ 58,000$ 17 25.5 1 10 -1 0.529 029S_SH2615A 240 160 100 301 35 1 60 113,001$ 40,355$ 13.2 24.7 1 31 -1 0.529 029S_SH2618A 0 180 83 136 20 1 60 332,659$ 118,800$ 16.3 25.4 1 4 -1 0.529 029S_SH2620A 0 180 83 138 25 1 60 113,001$ 40,355$ 15.6 25.6 1 4 -1 0.529 029S_SH2622A 0 180 83 129 25 1 60 254,254$ 90,800$ 13.7 22.2 1 4 -1 0.529 029S_SH2625A 240 160 100 256 35 1 60 220,653$ 78,800$ 16 24.7 1 31 -1 0.529 029S_SH2626A 0 180 83 137 30 1 59 224,013$ 80,000$ 14.3 23.8 1 19 -1 0.529 029S_SH2701A 240 160 100 266 30 1 55 49,283$ 17,600$ 15.2 22.8 1 31 -1 0.529 029S_SH2702A 0 180 83 136 25 1 59 189,291$ 67,600$ 16 25.6 1 10 -1 0.529 029S_SH2704A 0 180 83 133 30 1 59 123,207$ 44,000$ 16.1 25 1 10 -1 0.529 029S_SH2705A 240 160 100 280 25 1 60 280,016$ 100,000$ 14.7 25.1 1 31 -1 0.529 029S_SH2707A 240 160 100 285 25 1 60 268,815$ 96,000$ 14.6 25.6 1 31 -1 0.529 029S_SH2708A 0 180 83 125 40 1 59 145,608$ 52,000$ 15.9 25.3 1 10 -1 0.529 029S_SH2711A 240 160 100 271 40 1 56 580,000$ 174,000$ 17 25.4 1 31 -1 229 029S_SH2712A 0 180 83 144 20 1 60 201,611$ 72,000$ 16.7 26 1 22 -1 0.529 029S_SH2714A 0 180 83 151 25 1 59 151,209$ 54,000$ 16.1 26.3 1 19 -1 0.529 029S_SHFF01A 240 160 100 300 40 1 56 315,125$ 109,150$ 14 26 1 31 -1 0.529 029S_SHFF02A 240 160 100 300 40 1 56 315,125$ 109,150$ 14 26 1 31 -1 0.529 029S_SHFF03A 240 160 100 280 40 1 56 315,125$ 109,150$ 14 26 1 31 -1 0.529 029S_SHHWY 170 64 1000 185 34 1 64 105,868$ -$ 13.3 13.3 1 34 -1 0.5
-99930 030CHAN0102A 240 150 67 284 20 1 59 179,210$ 64,000$ 13 16 1 31 -1 0.530 030CHAN0104A 240 150 67 297 30 1 60 336,019$ 120,000$ 14 18.3 1 31 -1 0.530 030CHAN0130A 240 150 67 293 14 1 60 302,417$ 108,000$ 10 11.4 1 31 -1 230 030S_SH2419A 240 150 67 277 30 1 60 244,174$ 87,200$ 17.7 28.5 1 31 -1 0.530 030S_SH2421A 240 150 67 274 45 1 60 156,809$ 56,000$ 14.5 25.2 1 31 -1 0.530 030S_SH2420A 0 180 59 136 30 1 56 168,010$ 60,000$ 15.1 24.8 1 28 -1 0.530 030S_SH2423A 240 150 67 281 35 1 56 358,420$ 128,000$ 15.1 24.6 1 31 -1 0.530 030S_SH2422A 0 180 59 136 30 1 56 179,210$ 64,000$ 14.2 24.4 1 28 -1 0.530 030S_SH2424A 0 180 59 135 25 1 56 168,010$ 60,000$ 14.3 24.4 1 28 -1 0.5

Attachment B-3to Appendix B - Economic Analysis
Surf City - North Topsail BeachFeasibility Study page 3of 51
Reach ID USACE_ID REF lot front
Lot length Lot width
REF struc front
Struc length AA Ratio Flood
Curve
Replacement Value of Structure in Dollars
Value of Contents in Dollars
G_elev FF_elev Active Erosion Curve Armor Erosion
Indicator
30 030S_SH2425A 240 150 67 271 30 1 56 257,615$ 92,000$ 13 23.8 1 31 -1 0.530 030S_SH2426A 0 180 59 134 30 1 56 179,210$ 64,000$ 15.2 24.4 1 28 -1 0.530 030S_SH2427A 240 150 67 271 40 1 59 100,806$ 36,000$ 12.8 22.2 1 31 -1 0.530 030S_SH2428A 0 180 59 134 30 1 56 168,010$ 60,000$ 15.4 24.4 1 28 -1 0.530 030S_SH2430A 0 180 59 131 30 1 56 179,210$ 64,000$ 15.2 24.2 1 28 -1 0.530 030S_SH2501A 240 150 67 275 40 1 60 227,373$ 81,200$ 15.7 24.9 1 31 -1 0.530 030S_SH2502A 0 180 59 127 30 1 60 280,016$ 100,000$ 17.8 28 1 4 -1 0.530 030S_SH2503A 240 150 67 272 30 1 60 244,174$ 87,200$ 16.3 26 1 31 -1 0.530 030S_SH2504A 0 180 59 141 25 1 60 336,019$ 120,000$ 17.8 27.7 1 4 -1 0.530 030S_SH2505A 240 150 67 271 30 1 60 244,174$ 87,200$ 15.5 26.8 1 31 -1 0.530 030S_SH2506A 0 180 59 141 25 1 60 241,934$ 86,400$ 16.9 26.6 1 4 -1 0.530 030S_SH2507A 240 150 67 271 30 1 60 224,013$ 80,000$ 15.9 26.3 1 31 -1 0.530 030S_SH2508A 0 180 59 137 25 1 60 255,375$ 91,200$ 15.6 25.3 1 4 -1 0.530 030S_SH2510A 0 180 59 141 20 1 59 100,806$ 36,000$ 13.4 23.1 1 4 -1 0.530 030S_SH2512A 0 180 59 102 55 1 59 313,618$ 112,000$ 12.3 21.6 1 19 -1 0.530 030S_SH2514A 0 180 59 106 40 1 59 112,006$ 40,000$ 12.3 20.7 1 1 -1 0.530 030S_SH2602A 0 180 59 112 30 1 59 224,013$ 80,000$ 14.9 23.5 1 1 -1 0.530 030S_SH2604A 0 180 59 110 25 1 60 229,613$ 82,000$ 16.9 27.1 1 4 -1 0.530 030S_SH2608A 0 180 59 105 25 1 60 211,692$ 75,600$ 17.6 26.3 1 13 -1 0.530 030S_SHFF01A 240 150 67 280 40 1 56 315,125$ 109,150$ 12 24 1 31 -1 230 030KATE0102A 240 150 67 270 40 1 56 310,000$ 93,000$ 12 24 1 31 -1 230 030KATE0104A 240 150 67 275 40 1 56 300,000$ 90,000$ 12 24 1 31 -1 230 030S_SHFF04A 0 180 59 130 40 1 56 315,125$ 109,150$ 12 24 1 22 -1 230 030S_SHHWY 180 64 1000 195 34 1 64 105,868$ -$ 14.2 14.2 1 34 -1 0.5
-99931 031S_SH2309A 270 130 56 291 60 1 2 362,901$ 129,600$ 13.6 22 1 31 -1 0.531 031S_SH2310A 0 210 56 156 30 1 55 62,724$ 22,400$ 11.7 20.5 1 30 -1 231 031S_SH2311A 270 130 56 299 30 1 59 100,806$ 36,000$ 14 23.7 1 31 -1 0.531 031S_SH2312A 0 210 56 153 25 1 56 209,452$ 74,800$ 12.4 21.4 1 28 -1 0.531 031S_SH2313A 270 130 56 302 25 1 60 224,013$ 80,000$ 15.6 25.5 1 31 -1 0.531 031S_SH2314A 0 210 56 149 25 1 56 196,011$ 70,000$ 12.8 21.5 1 28 -1 0.531 031S_SH2316A 0 210 56 144 45 1 59 168,010$ 60,000$ 13.3 23.1 1 19 -1 0.531 031S_SH2317A 270 130 56 295 60 1 59 162,409$ 58,000$ 13.4 23.2 1 31 -1 0.531 031S_SH2318A 0 210 56 154 25 1 60 155,689$ 55,600$ 15.5 25.7 1 22 -1 0.531 031S_SH2319A 270 130 56 308 30 1 59 103,046$ 36,800$ 14 23.6 1 31 -1 0.531 031S_SH2320A 0 210 56 159 35 1 59 98,566$ 35,200$ 12.9 22 1 19 -1 0.531 031S_SH2321A 270 130 56 298 50 1 59 137,768$ 49,200$ 13.1 22.8 1 31 -1 0.5

Attachment B-3to Appendix B - Economic Analysis
Surf City - North Topsail BeachFeasibility Study page 4of 51
Reach ID USACE_ID REF lot front
Lot length Lot width
REF struc front
Struc length AA Ratio Flood
Curve
Replacement Value of Structure in Dollars
Value of Contents in Dollars
G_elev FF_elev Active Erosion Curve Armor Erosion
Indicator
31 031S_SH2322 0 210 56 160 40 1 56 560,000$ 168,000$ 14 26 1 28 -1 0.531 031S_SH2323A 270 130 56 304 30 1 59 136,648$ 48,800$ 15.6 27.7 1 31 -1 0.531 031S_SH2324A 0 210 56 163 35 1 55 86,245$ 30,800$ 13.7 21.4 1 28 -1 0.531 031S_SH2325A 270 130 56 296 45 1 59 94,085$ 33,600$ 15 24.5 1 31 -1 0.531 031S_SH2326A 0 210 56 153 35 1 59 100,806$ 36,000$ 14.5 22.8 1 10 -1 0.531 031S_SH2403A 270 130 56 320 35 1 59 145,608$ 52,000$ 14.6 25.3 1 31 -1 0.531 031S_SH2404A 0 210 56 157 25 1 60 392,022$ 140,000$ 14.4 24.3 1 4 -1 0.531 031S_SH2405A 270 130 56 298 35 1 59 112,006$ 40,000$ 15 25.1 1 31 -1 0.531 031S_SH2406A 0 210 56 148 40 1 59 156,809$ 56,000$ 19 23.5 1 19 -1 0.531 031S_SH2407A 270 130 56 302 30 1 60 190,411$ 68,000$ 13.9 25 1 31 -1 0.531 031S_SH2408A 0 210 56 159 40 1 59 179,210$ 64,000$ 14.2 23.4 1 19 -1 0.531 031S_SH2410A 0 210 56 156 35 1 55 112,006$ 40,000$ 15.1 24.1 1 28 -1 0.531 031S_SH2411A 270 130 56 297 35 1 59 190,411$ 68,000$ 14.1 23 1 31 -1 0.531 031S_SH2412A 0 210 56 159 15 1 60 201,611$ 72,000$ 15.1 24.3 1 4 -1 0.531 031S_SH2413A 270 130 56 300 35 1 60 280,016$ 100,000$ 12 24.6 1 31 -1 0.531 031S_SH2414A 0 210 56 160 25 1 56 134,408$ 48,000$ 16.2 25.8 1 28 -1 0.531 031S_SH2417A 270 130 56 288 30 1 60 244,174$ 87,200$ 15.9 26 1 31 -1 0.531 031S_SH2415A 270 130 56 291 30 1 60 358,420$ 128,000$ 17 25.8 1 31 -1 0.531 031S_SH2416A 0 210 56 156 25 1 60 168,010$ 60,000$ 15.6 25.8 1 4 -1 0.531 031S_SH2418A 0 210 56 141 35 1 55 156,809$ 56,000$ 16.2 25.3 1 28 -1 0.531 031S_SHFF05A 270 200 56 300 40 1 56 315,125$ 109,150$ 13 25 1 31 -1 231 031S_SHFF04A 270 200 56 320 40 1 56 315,125$ 109,150$ 13 25 1 31 -1 231 031S_SHFF01A 270 200 56 300 40 1 56 315,125$ 109,150$ 13 25 1 31 -1 231 031S_SHFF02A 0 200 56 175 40 1 56 315,125$ 109,150$ 13 25 1 22 -1 231 031S_SHFF03A 0 200 56 175 40 1 56 315,125$ 109,150$ 13 25 1 22 -1 231 031S_SHHWY 200 64 1000 215 34 1 64 105,868$ -$ 13.7 13.7 1 34 -1 0.5
-99932 032S_OA0025A 340 110 207 371 40 1 55 257,615$ 92,000$ 13 23.6 1 31 -1 0.532 032S_SH2109A 230 110 62 259 45 1 55 178,090$ 63,600$ 11.8 20.9 1 31 -1 232 032S_SH2110A 0 170 333 97 25 1 55 72,804$ 26,000$ 10 18.4 1 32 -1 232 032S_SH2119A 230 110 62 238 45 1 55 112,006$ 40,000$ 9.7 17.8 1 31 -1 232 032S_SH2203A 230 110 62 246 45 1 59 75,044$ 26,800$ 11.3 19.7 1 31 -1 232 032S_SH2205A 230 110 62 242 45 1 55 89,605$ 32,000$ 10.5 18.3 1 31 -1 232 032S_SH2207A 230 110 62 254 35 1 60 113,001$ 40,355$ 12 26.3 1 31 -1 0.532 032S_SH2209A 230 110 62 247 40 1 59 188,171$ 67,200$ 12.3 22.8 1 31 -1 0.532 032S_SH2209S 0 0 0 312 15 1 1 12,195$ 4,355$ 14 15.7 1 31 -1 0.532 032S_SH2211A 230 110 62 245 30 1 59 78,404$ 28,000$ 11.6 20.5 1 31 -1 2

Attachment B-3to Appendix B - Economic Analysis
Surf City - North Topsail BeachFeasibility Study page 5of 51
Reach ID USACE_ID REF lot front
Lot length Lot width
REF struc front
Struc length AA Ratio Flood
Curve
Replacement Value of Structure in Dollars
Value of Contents in Dollars
G_elev FF_elev Active Erosion Curve Armor Erosion
Indicator
32 032S_SH2216A 0 170 333 117 25 1 59 168,010$ 60,000$ 13.3 24.1 1 10 -1 0.532 032S_SH2301A 230 220 76 260 40 1 56 175,000$ 52,500$ 12.7 24.3 1 31 -1 232 032S_SH2308A 0 170 333 124 30 1 55 58,243$ 20,800$ 11.7 20.4 1 30 -1 232 032SAND0016A 340 110 207 349 40 1 56 308,018$ 110,000$ 13 20.4 1 31 -1 0.532 032SHEL0009A 340 110 207 359 40 1 56 313,618$ 112,000$ 11 20 1 31 -1 0.532 032S_SHFF01A 230 110 62 265 40 1 56 315,125$ 109,150$ 10 22 1 31 -1 232 032S_SHFF02A 230 110 62 265 40 1 56 315,125$ 109,150$ 10 22 1 31 -1 232 032S_SHFF03A 230 110 62 265 40 1 56 315,125$ 109,150$ 10 22 1 31 -1 232 032S_SHFF04A 230 220 76 275 40 1 56 315,125$ 109,150$ 10 22 1 31 -1 232 032S_SHFF05A 230 220 76 275 40 1 56 315,125$ 109,150$ 10 22 1 31 -1 232 032S_SH2305A 230 220 76 275 40 1 56 350,000$ 109,150$ 10 22 1 31 -1 232 032S_SHFF07A 230 220 76 285 40 1 56 315,125$ 109,150$ 10 22 1 31 -1 232 032S_SHFF08A 230 110 76 120 40 1 56 315,125$ 109,150$ 10 22 1 31 -1 232 032S_SH2306A 0 110 76 120 40 1 56 240,000$ 72,000$ 10 22 1 29 -1 232 032S_SH2304A 0 110 76 120 40 1 56 260,000$ 78,000$ 10 22 1 29 -1 232 032S_SH2302A 0 110 76 120 40 1 56 250,000$ 75,000$ 10 22 1 29 -1 232 032S_SH2216A 0 110 76 120 40 1 56 275,000$ 82,500$ 10 22 1 29 -1 232 032S_SH2214A 0 110 76 120 40 1 56 220,000$ 66,000$ 10 22 1 29 -1 232 032S_SH2212A 0 110 76 120 40 1 56 398,000$ 119,400$ 10 22 1 29 -1 232 032S_SH2210A 0 110 76 120 40 1 56 375,000$ 112,500$ 10 22 1 29 -1 232 032S_SH2208A 0 125 50 130 40 1 56 290,000$ 87,000$ 10 22 1 29 -1 232 032S_SH2206A 0 110 76 120 40 1 56 220,000$ 66,000$ 10 22 1 29 -1 232 032S_SH2204A 0 110 76 120 40 1 56 280,000$ 84,000$ 10 22 1 29 -1 232 032S_SH2202A 0 110 76 120 40 1 56 280,000$ 84,000$ 10 22 1 29 -1 232 032S_SH2116A 0 110 75 120 40 1 56 295,000$ 88,500$ 10 22 1 29 -1 232 032S_SH2114A 0 110 75 120 40 1 56 320,000$ 96,000$ 10 22 1 29 -1 232 032S_SH2112A 0 110 75 120 40 1 56 295,000$ 88,500$ 10 22 1 29 -1 232 032S_SHHWY 150 64 1000 165 34 1 64 105,868$ -$ 11.5 11.5 1 34 -1 0.5
-99933 033ELIZ0001A 345 50 100 348 25 1 60 212,812$ 76,000$ 12 20.8 1 31 -1 0.533 033S_SH1917A 240 200 57 310 30 1 60 257,615$ 92,000$ 9.1 20.3 1 31 -1 233 033S_SH1919A 240 120 57 304 30 1 60 336,019$ 120,000$ 9.1 20.1 1 31 -1 233 033S_SH1920A 0 80 71 141 40 1 59 224,013$ 80,000$ 9 18.9 1 2 -1 233 033S_SH1921A 240 200 57 302 30 1 60 336,019$ 120,000$ 8.9 20.1 1 31 -1 233 033S_SH1923A 240 200 57 315 35 1 59 125,447$ 44,800$ 8.7 20.7 1 31 -1 233 033S_SH1924A 0 80 71 131 35 1 59 380,822$ 136,000$ 10.3 19.9 1 11 -1 233 033S_SH1925A 240 200 57 310 20 1 59 144,488$ 51,600$ 11.8 21.3 1 31 -1 2

Attachment B-3to Appendix B - Economic Analysis
Surf City - North Topsail BeachFeasibility Study page 6of 51
Reach ID USACE_ID REF lot front
Lot length Lot width
REF struc front
Struc length AA Ratio Flood
Curve
Replacement Value of Structure in Dollars
Value of Contents in Dollars
G_elev FF_elev Active Erosion Curve Armor Erosion
Indicator
33 033S_SH1926A 0 80 71 138 40 1 56 290,000$ 87,000$ 10.3 19.6 1 29 -1 233 033S_SH1928A 0 80 71 125 40 1 56 475,000$ 142,500$ 10 22 1 29 -1 233 033S_SH2001A 240 200 57 304 45 1 59 168,010$ 60,000$ 12.5 22.1 1 31 -1 0.533 033S_SH2002A 0 80 71 134 35 1 59 134,408$ 48,000$ 9.9 18.9 1 12 -1 233 033S_SH2003A 240 200 57 317 25 1 60 190,411$ 68,000$ 13.3 22.8 1 31 -1 0.533 033S_SH2004A 0 80 71 126 30 1 55 140,008$ 50,000$ 13.9 20.2 1 28 -1 0.533 033S_SH2007A 240 200 57 290 25 1 59 210,572$ 75,200$ 11.6 21.3 1 31 -1 233 033S_SH2008A 0 80 71 121 20 1 60 224,013$ 80,000$ 17.8 23.4 1 13 -1 0.533 033S_SH2010A 0 80 71 125 35 1 59 112,006$ 40,000$ 10.1 19.6 1 21 -1 233 033S_SH2011A 240 200 57 274 35 1 59 112,006$ 40,000$ 9.7 20.6 1 31 -1 233 033S_SH2012A 0 80 71 124 35 1 59 134,408$ 48,000$ 9.9 19.5 1 2 -1 233 033S_SH2013A 240 200 57 276 40 1 59 114,247$ 40,800$ 9.1 17.1 1 31 -1 233 033S_SH2014A 0 80 71 118 40 1 59 100,806$ 36,000$ 10.4 21.2 1 21 -1 233 033S_SH2015A 240 200 57 251 40 1 56 300,000$ 90,000$ 8.7 17.2 1 31 -1 233 033S_SH2016A 0 80 71 115 40 1 59 156,809$ 56,000$ 10.5 19.8 1 12 -1 233 033S_SH2018A 0 80 71 110 40 1 59 168,010$ 60,000$ 10.3 19.8 1 2 -1 233 033S_SH2101A 240 200 50 271 30 1 60 235,213$ 84,000$ 12 21.9 1 31 -1 0.533 033S_SH2102A 0 200 71 108 40 1 56 100,000$ 30,000$ 11.6 20.7 1 29 -1 233 033S_SH2103A 240 200 50 267 30 1 60 227,373$ 81,200$ 11.4 21.6 1 31 -1 233 033S_SH2104A 0 80 71 104 25 1 60 179,210$ 64,000$ 11.5 21.4 1 5 -1 233 033S_SH2106A 0 80 71 102 20 1 55 72,804$ 26,000$ 12.4 15.5 1 28 -1 0.533 033S_SH2107A 240 200 50 266 35 1 59 190,411$ 68,000$ 16 25.9 1 31 -1 0.533 033S_SH2105A 240 200 50 271 25 1 59 239,694$ 85,600$ 12.8 23.3 1 31 -1 0.533 033SHEL0007A 345 200 100 359 30 1 56 190,411$ 68,000$ 9 21.7 1 31 -1 233 033S_SH1925A 240 200 57 310 40 1 56 560,000$ 168,000$ 9 21 1 31 -1 233 033S_SH2009A 240 200 57 280 40 1 56 250,000$ 75,000$ 9 21 1 31 -1 233 033S_SH2005A 240 200 57 300 40 1 56 240,000$ 72,000$ 9 21 1 31 -1 233 033S_SH2006A 0 80 71 110 40 1 56 240,000$ 72,000$ 13 25 1 28 -1 233 033S_SHHWY 160 64 1000 175 34 1 64 105,868$ -$ 10.5 10.5 1 34 -1 0.5
-99934 034PELI0108A 75 75 80 400 30 1 60 113,001$ 40,355$ 13 19.9 1 31 -1 0.534 034S_SH1811A 125 130 56 306 35 1 59 123,207$ 44,000$ 8.3 17.3 1 31 -1 234 034S_SH1813A 125 130 56 311 45 1 2 183,690$ 65,600$ 11 10.6 1 31 -1 234 034S_SH1814A 0 80 83 138 35 1 59 168,010$ 60,000$ 10.3 20.7 1 12 -1 234 034S_SH1815A 125 130 56 322 45 1 59 134,408$ 48,000$ 11 18.7 1 31 -1 234 034S_SH1816A 0 80 83 143 35 1 59 299,057$ 106,800$ 13 23.8 1 1 -1 0.534 034S_SH1820A 230 130 83 178 35 1 60 113,001$ 40,355$ 19 26.4 1 31 -1 0.5

Attachment B-3to Appendix B - Economic Analysis
Surf City - North Topsail BeachFeasibility Study page 7of 51
Reach ID USACE_ID REF lot front
Lot length Lot width
REF struc front
Struc length AA Ratio Flood
Curve
Replacement Value of Structure in Dollars
Value of Contents in Dollars
G_elev FF_elev Active Erosion Curve Armor Erosion
Indicator
34 034S_SH1821A 125 130 56 328 30 1 60 268,815$ 96,000$ 12 25.1 1 31 -1 0.534 034S_SH1822A 0 80 83 178 35 1 60 113,001$ 40,355$ 19 26.5 1 22 -1 0.534 034S_SH1824A 0 80 83 149 30 1 59 128,807$ 46,000$ 11.8 21.4 1 21 -1 234 034S_SH1825A 310 130 56 325 40 1 56 315,125$ 109,150$ 9.9 22 1 31 -1 234 034S_SH1826A 0 80 83 146 35 1 60 441,305$ 157,600$ 12.9 22.1 1 1 -1 0.534 034S_SH1827A 125 130 56 323 45 1 59 159,049$ 56,800$ 9.7 19.3 1 31 -1 234 034S_SH1829A 125 130 56 309 40 1 59 80,645$ 28,800$ 9.1 17.6 1 31 -1 234 034S_SH1830A 0 80 83 148 25 1 59 474,907$ 169,600$ 11.4 20 1 11 -1 234 034S_SH1831A 125 130 56 308 45 1 59 145,608$ 52,000$ 9.9 18.9 1 31 -1 234 034S_SH1834A 0 80 83 130 40 1 56 265,000$ 79,500$ 11 23 1 29 -1 234 034S_SH1901A 125 130 56 317 40 1 59 134,408$ 48,000$ 8.5 18.8 1 31 -1 234 034S_SH1902A 0 80 83 145 30 1 59 144,488$ 51,600$ 9 20.7 1 21 -1 234 034S_SH1905A 125 130 56 311 30 1 60 244,174$ 87,200$ 12 23.2 1 31 -1 0.534 034S_SH1906A 0 80 83 135 40 1 56 600,000$ 180,000$ 11 23 1 29 -1 234 034S_SH1908A 0 80 83 167 25 1 60 302,417$ 108,000$ 10.4 20.9 1 5 -1 234 034S_SH1909A 125 130 56 324 40 1 59 134,408$ 48,000$ 9.1 20.8 1 31 -1 234 034S_SH1912A 0 80 83 149 30 1 59 132,168$ 47,200$ 8.7 18.7 1 21 -1 234 034S_SH1914A 0 80 83 147 35 1 59 190,411$ 68,000$ 9.4 18.8 1 12 -1 234 034S_SH1916A 0 80 83 158 25 1 56 224,013$ 80,000$ 8.8 18.2 1 29 -1 234 034S_SHFF07A 125 130 56 320 40 1 56 315,125$ 109,150$ 10 22 1 31 -1 234 034S_SH1913A 125 130 56 320 40 1 56 329,000$ 98,700$ 10 22 1 31 -1 234 034S_SHFF05A 125 130 56 320 40 1 56 315,125$ 109,150$ 10 22 1 31 -1 234 034S_SHFF04A 125 130 56 320 40 1 56 315,125$ 109,150$ 10 22 1 31 -1 234 034S_SHFF03A 125 130 56 305 40 1 56 315,125$ 109,150$ 10 22 1 31 -1 234 034S_SHFF02A 125 130 56 320 40 1 56 315,125$ 109,150$ 10 22 1 31 -1 234 034S_SHFF01A 125 130 56 315 40 1 56 315,125$ 109,150$ 10 22 1 31 -1 234 034S_SHHWY 220 64 1000 235 34 1 64 105,868$ -$ 9.9 9.9 1 34 -1 0.5
-99935 035S_SH1618A 0 130 67 117 30 1 59 118,727$ 42,400$ 7.3 18.7 1 2 -1 235 035S_SH1619A 290 120 56 322 30 1 59 112,006$ 40,000$ 14 22.6 1 31 -1 0.535 035S_SH1622A 0 130 67 155 35 1 60 113,001$ 40,355$ 13 23.3 1 22 -1 0.535 035S_SH1622X 0 130 67 155 35 1 60 113,001$ 40,355$ 13 23.3 1 22 -1 0.535 035S_SH1623A 290 120 56 355 30 1 60 319,218$ 114,000$ 15 23.4 1 31 -1 0.535 035S_SH1625A 290 120 56 356 40 1 55 90,725$ 32,400$ 15 22.1 1 31 -1 0.535 035S_SH1701A 290 120 56 310 40 1 59 145,608$ 52,000$ 9.1 20.7 1 31 -1 235 035S_SH1702A 0 130 67 131 25 1 60 235,213$ 84,000$ 6.7 19.6 1 24 -1 235 035S_SH1703A 290 120 56 316 50 1 59 168,010$ 60,000$ 8.7 20.2 1 31 -1 2

Attachment B-3to Appendix B - Economic Analysis
Surf City - North Topsail BeachFeasibility Study page 8of 51
Reach ID USACE_ID REF lot front
Lot length Lot width
REF struc front
Struc length AA Ratio Flood
Curve
Replacement Value of Structure in Dollars
Value of Contents in Dollars
G_elev FF_elev Active Erosion Curve Armor Erosion
Indicator
35 035S_SH1704A 0 130 67 125 30 1 59 123,207$ 44,000$ 7 19.3 1 2 -1 235 035S_SH1706A 0 130 67 159 14 1 60 78,404$ 28,000$ 7.7 21.6 1 5 -1 235 035S_SH1707A 290 120 56 346 25 1 59 179,210$ 64,000$ 14 22.7 1 31 -1 0.535 035S_SH1708A 0 130 67 141 30 1 59 161,289$ 57,600$ 8.5 23.2 1 22 -1 235 035S_SH1709A 290 120 56 325 30 1 59 336,019$ 120,000$ 13 23.1 1 31 -1 0.535 035S_SH1710A 0 130 67 160 25 1 60 113,001$ 40,355$ 16 24.7 1 19 -1 0.535 035S_SH1711A 290 120 56 320 35 1 60 196,011$ 70,000$ 8.6 19.2 1 31 -1 235 035S_SH1713A 290 120 56 314 35 1 59 104,838$ 37,440$ 8.5 18.6 1 31 -1 235 035S_SH1715A 290 120 56 340 30 1 60 302,417$ 108,000$ 13 22.8 1 31 -1 0.535 035S_SH1716A 0 130 67 143 25 1 59 201,611$ 72,000$ 13.6 23.9 1 10 -1 235 035S_SH1801A 290 120 56 347 25 1 60 224,013$ 80,000$ 13 22.3 1 31 -1 0.535 035S_SH1802A 0 130 67 140 35 1 59 246,414$ 88,000$ 11.5 22 1 3 -1 235 035S_SH1803A 290 120 56 338 40 1 59 92,965$ 33,200$ 9.8 17.7 1 31 -1 235 035S_SH1806A 0 130 67 140 20 1 60 336,019$ 120,000$ 12.5 22.2 1 4 -1 235 035S_SH1806X 0 130 67 138 20 1 60 113,001$ 40,355$ 19 23.4 1 1 -1 0.535 035S_SH1807A 290 120 56 341 20 1 60 184,811$ 66,000$ 13 21.2 1 31 -1 0.535 035S_SH1812A 0 130 67 138 40 1 60 448,026$ 160,000$ 11.4 21.1 1 6 -1 235 035S_SHFF03A 0 130 67 165 40 1 56 315,125$ 109,150$ 7 19 1 24 -1 235 035S_SHFF05A 290 120 56 330 40 1 56 315,125$ 109,150$ 7 19 1 31 -1 235 035S_SH1627A 290 120 56 320 40 1 56 250,000$ 105,000$ 7 19 1 31 -1 235 035S_SHFF01A 290 120 56 340 40 1 56 315,125$ 109,150$ 7 19 1 31 -1 235 035S_SHFF07A 290 120 56 310 40 1 56 315,125$ 109,150$ 7 19 1 31 -1 235 035S_SH1712A 0 130 67 160 40 1 56 325,000$ 97,500$ 7 19 1 29 -1 235 035S_SHFF02A 290 120 56 340 40 1 56 315,125$ 109,150$ 7 19 1 31 -1 235 035S_SHHWY 220 64 1000 235 34 1 64 105,868$ -$ 8.5 8.5 1 34 -1 0.5
-99936 036S_SH1519A 310 125 59 356 35 1 59 156,809$ 56,000$ 16 23.9 1 31 -1 0.536 036S_SH1520A 0 150 77 172 30 1 60 179,210$ 64,000$ 11.7 22.6 1 23 -1 236 036S_SH1521A 310 125 59 354 30 1 60 263,215$ 94,000$ 15 23.5 1 31 -1 0.536 036S_SH1522A 0 150 77 163 30 1 60 224,013$ 80,000$ 8.8 19.2 1 6 -1 236 036S_SH1523A 310 125 59 349 35 1 60 332,659$ 118,800$ 15 14.7 1 31 -1 0.536 036S_SH1524A 0 150 77 163 45 1 59 336,019$ 120,000$ 10 19.5 1 3 -1 236 036S_SH1525A 310 125 59 355 20 1 60 240,814$ 86,000$ 15 23.9 1 31 -1 0.536 036S_SH1526A 0 150 77 190 30 1 60 285,616$ 102,000$ 14 21.6 1 22 -1 0.536 036S_SH1527A 310 125 59 345 30 1 60 241,486$ 86,240$ 14 24 1 31 -1 0.536 036S_SH1528A 0 150 77 189 25 1 60 301,073$ 107,520$ 15 21.7 1 22 -1 0.536 036S_SH1529A 310 125 59 347 35 1 1 77,284$ 27,600$ 10.7 10.7 1 31 -1 2

Attachment B-3to Appendix B - Economic Analysis
Surf City - North Topsail BeachFeasibility Study page 9of 51
Reach ID USACE_ID REF lot front
Lot length Lot width
REF struc front
Struc length AA Ratio Flood
Curve
Replacement Value of Structure in Dollars
Value of Contents in Dollars
G_elev FF_elev Active Erosion Curve Armor Erosion
Indicator
36 036S_SH1530A 0 150 77 211 25 1 60 113,001$ 40,355$ 14 21.9 1 22 -1 0.536 036S_SH1531A 310 125 59 334 45 1 1 98,566$ 35,200$ 10.7 10.7 1 31 -1 236 036S_SH1534A 0 150 77 177 25 1 60 616,035$ 220,000$ 11.6 23 1 6 -1 236 036S_SH1535A 310 125 59 341 45 1 59 96,325$ 34,400$ 11 23.6 1 31 -1 236 036S_SH1538A 0 150 77 129 40 1 59 168,010$ 60,000$ 9.6 19.7 1 2 -1 236 036S_SH1539A 310 125 59 347 35 1 55 291,217$ 104,000$ 9.1 22.5 1 31 -1 236 036S_SH1540A 0 150 77 145 45 1 59 145,608$ 52,000$ 11.7 19.9 1 21 -1 236 036S_SH1601A 310 125 59 358 45 1 59 294,577$ 105,200$ 19 25.4 1 31 -1 0.536 036S_SH1605A 310 125 59 344 25 1 60 196,011$ 70,000$ 11.6 22.9 1 31 -1 236 036S_SH1606A 0 150 77 140 35 1 59 128,807$ 46,000$ 11.2 21 1 21 -1 236 036S_SH1609A 310 125 59 336 40 1 56 197,131$ 70,400$ 18.1 18.1 1 31 -1 0.536 036S_SH1610A 0 150 77 145 45 1 59 526,430$ 188,000$ 8.2 21.3 1 11 -1 236 036S_SH1613A 310 125 59 334 30 1 60 227,373$ 81,200$ 10.1 20 1 31 -1 236 036S_SH1615A 310 125 59 322 30 1 60 392,022$ 140,000$ 14 23.1 1 31 -1 0.536 036S_SH1614A 0 150 77 125 40 1 56 600,000$ 180,000$ 7.8 19.1 1 29 -1 236 036S_SHFF01A 310 125 59 350 40 1 56 315,125$ 109,150$ 10 22 1 31 -1 236 036S_SHFF04A 310 125 59 360 40 1 56 315,125$ 109,150$ 10 22 1 31 -1 236 036S_SHFF03A 0 150 77 185 40 1 56 315,125$ 109,150$ 10 22 1 24 -1 236 036S_SH1604A 0 125 59 350 40 1 56 320,000$ 96,000$ 10 22 1 29 -1 236 036S_SHHWY 250 64 1000 270 24 1 64 105,868$ -$ 9.3 9.3 1 34 -1 0.5
-99937 037S_SH1403A 290 140 77 280 35 1 59 89,605$ 32,000$ 9.3 20.2 1 31 -1 237 037S_SH1405A 290 140 77 282 40 1 59 113,001$ 40,355$ 13 23 1 31 -1 0.537 037S_SH1404A 0 230 63 125 30 1 60 156,809$ 56,000$ 13 25.2 1 22 -1 0.537 037S_SH1407A 290 140 77 284 40 1 56 113,001$ 40,355$ 14 23 1 31 -1 0.537 037S_SH1406A 0 230 63 127 20 1 59 201,611$ 72,000$ 12.1 21.7 1 19 -1 0.537 037S_SH1410A 0 230 63 144 40 1 56 170,000$ 51,000$ 12.8 24 1 28 -1 0.537 037S_SH1408A 0 230 63 151 25 1 60 201,611$ 72,000$ 10.9 20.2 1 6 -1 237 037S_SH1411A 290 140 77 298 35 1 60 168,010$ 60,000$ 11 22.4 1 31 -1 237 037S_SH1412A 0 230 63 140 30 1 60 263,215$ 94,000$ 12 21.9 1 1 -1 0.537 037S_SH1414A 0 230 63 138 30 1 60 190,411$ 68,000$ 10.4 20.9 1 6 -1 237 037S_SH1416A 0 230 63 134 40 1 59 134,408$ 48,000$ 10.3 19.7 1 21 -1 237 037S_SH1420A 0 230 63 142 30 1 59 448,026$ 160,000$ 10.3 21.5 1 3 -1 237 037S_SH1421A 290 140 77 338 30 1 1 87,365$ 31,200$ 9.2 9.2 1 31 -1 237 037S_SH1502A 0 230 63 151 20 1 60 234,093$ 83,600$ 12.3 21.6 1 4 -1 0.537 037S_SH1504A 0 230 63 149 20 1 60 224,013$ 80,000$ 10.4 20.4 1 24 -1 237 037S_SH1505A 290 140 77 340 25 1 55 151,209$ 54,000$ 13.5 18.3 1 31 -1 0.5

Attachment B-3to Appendix B - Economic Analysis
Surf City - North Topsail BeachFeasibility Study page 10of 51
Reach ID USACE_ID REF lot front
Lot length Lot width
REF struc front
Struc length AA Ratio Flood
Curve
Replacement Value of Structure in Dollars
Value of Contents in Dollars
G_elev FF_elev Active Erosion Curve Armor Erosion
Indicator
37 037S_SH1506A 0 230 63 145 40 1 59 96,325$ 34,400$ 9.3 19 1 21 -1 237 037S_SH1507A 290 140 77 324 45 1 59 156,809$ 56,000$ 13.1 23.9 1 31 -1 0.537 037S_SH1508A 0 230 63 151 40 1 59 108,646$ 38,800$ 10.2 20.4 1 21 -1 237 037S_SH1509A 290 140 77 360 25 1 60 181,450$ 64,800$ 15.2 25.2 1 31 -1 0.537 037S_SH1510A 0 230 63 159 40 1 59 145,608$ 52,000$ 10.7 20.3 1 21 -1 237 037S_SH1511A 290 140 77 364 25 1 60 126,567$ 45,200$ 14.4 21.5 1 31 -1 0.537 037S_SH1512A 0 230 63 168 35 1 59 280,016$ 100,000$ 12.8 23.4 1 1 -1 0.537 037S_SH1515A 290 140 77 351 30 1 60 179,210$ 64,000$ 12.2 21.2 1 31 -1 0.537 037S_SH1516A 0 230 63 170 30 1 56 260,975$ 93,200$ 12.1 22.3 1 28 -1 0.537 037S_SH1517A 290 140 77 340 40 1 59 123,207$ 44,000$ 12 21 1 31 -1 0.537 037S_SH1518A 0 230 63 170 40 1 56 580,000$ 174,000$ 11.4 23 1 29 -1 237 037S_SHFF01A 290 140 77 290 40 1 56 315,125$ 109,150$ 10 22 1 31 -1 237 037S_SHFF02A 290 140 77 325 40 1 56 315,125$ 109,150$ 10 22 1 31 -1 237 037S_SHFF03A 0 125 70 135 40 1 56 315,125$ 109,150$ 10 22 1 31 -1 237 037S_SHHWY1 250 64 200 265 34 1 64 21,169$ -$ 8.8 8.8 1 34 -1 0.537 037S_SHHWY2 220 64 300 235 34 1 64 31,765$ -$ 8.8 8.8 1 34 -1 0.537 037S_SHHWY3 200 64 500 215 34 1 64 52,934$ -$ 8.8 8.8 1 34 -1 0.5
-99938 038KARE0104A 370 70 100 377 25 1 60 192,651$ 68,800$ 11 11.2 1 31 -1 238 038LORE0104A 370 70 100 374 25 1 56 184,811$ 66,000$ 14 24 1 31 -1 0.538 038ROSE0103A 370 70 100 375 30 1 59 178,090$ 63,600$ 11 10.5 1 31 -1 238 038S_SH1318A 0 210 56 143 35 1 55 123,207$ 44,000$ 13 21.8 1 28 -1 0.538 038S_SH1320A 0 210 56 128 45 1 59 240,814$ 86,000$ 10.7 24 1 3 -1 238 038S_SH1323A 270 100 67 303 25 1 60 268,815$ 96,000$ 8.8 17.8 1 31 -1 238 038S_SH1322A 0 210 56 113 40 1 59 252,014$ 90,000$ 10.4 20.2 1 3 -1 238 038S_SH1325A 270 100 67 307 35 1 59 134,408$ 48,000$ 8.1 16.9 1 31 -1 238 038S_SH1326A 0 210 56 152 35 1 60 267,695$ 95,600$ 13 22.2 1 4 -1 0.538 038S_SH1324A 0 210 56 128 35 1 59 224,013$ 80,000$ 8.9 17.5 1 3 -1 238 038S_SH1327A 270 100 67 316 25 1 59 156,809$ 56,000$ 7.9 17.3 1 31 -1 238 038S_SH1329A 270 100 67 294 25 1 60 240,814$ 86,000$ 8.7 20.6 1 31 -1 238 038S_SH1328A 0 210 56 104 30 1 60 201,611$ 72,000$ 14 20.8 1 4 -1 0.538 038S_SH1331A 270 100 67 290 40 1 59 184,811$ 66,000$ 9.1 19.6 1 31 -1 238 038S_SH1330A 0 210 56 123 45 1 59 194,891$ 69,600$ 11.2 20.9 1 3 -1 238 038S_SH1333A 270 100 67 308 25 1 56 222,893$ 79,600$ 9 19 1 31 -1 238 038S_SH1332A 0 210 56 136 35 1 60 138,888$ 49,600$ 12.5 23.3 1 4 -1 0.538 038S_SH1334A 0 210 56 124 45 1 59 112,006$ 40,000$ 10.3 18.8 1 21 -1 238 038S_SH1336A 0 210 56 125 35 1 60 140,008$ 50,000$ 11.1 24.1 1 23 -1 2
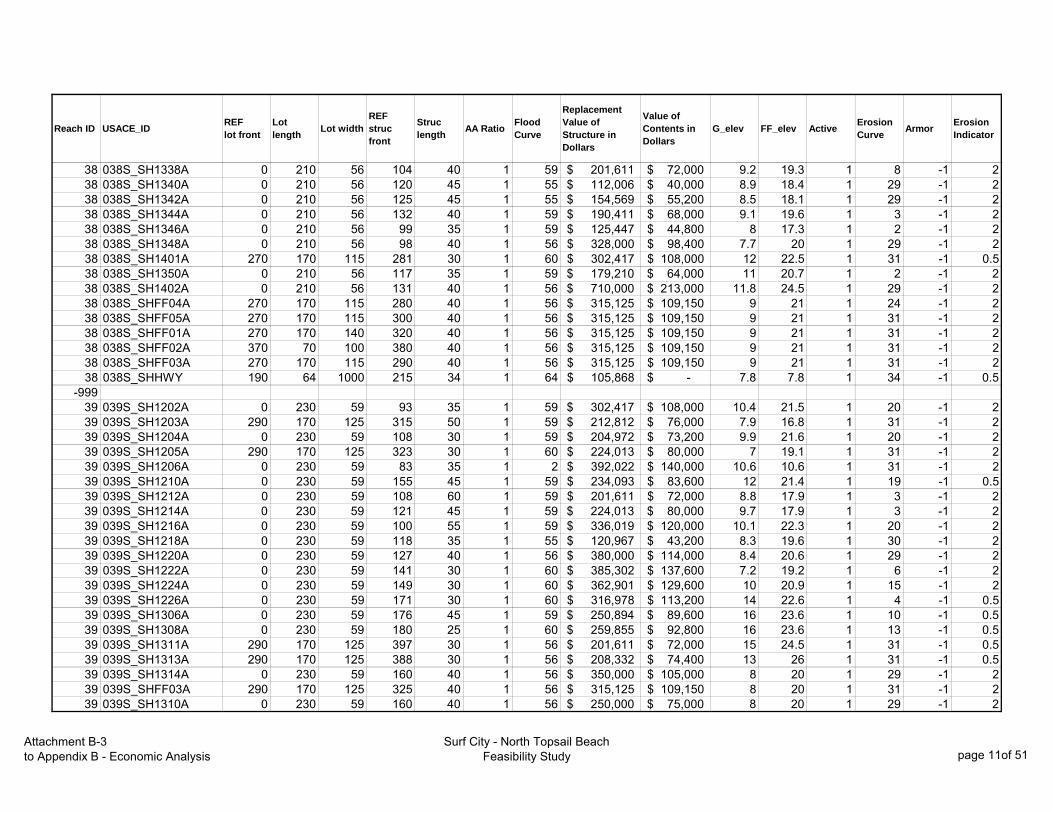
Attachment B-3to Appendix B - Economic Analysis
Surf City - North Topsail BeachFeasibility Study page 11of 51
Reach ID USACE_ID REF lot front
Lot length Lot width
REF struc front
Struc length AA Ratio Flood
Curve
Replacement Value of Structure in Dollars
Value of Contents in Dollars
G_elev FF_elev Active Erosion Curve Armor Erosion
Indicator
38 038S_SH1338A 0 210 56 104 40 1 59 201,611$ 72,000$ 9.2 19.3 1 8 -1 238 038S_SH1340A 0 210 56 120 45 1 55 112,006$ 40,000$ 8.9 18.4 1 29 -1 238 038S_SH1342A 0 210 56 125 45 1 55 154,569$ 55,200$ 8.5 18.1 1 29 -1 238 038S_SH1344A 0 210 56 132 40 1 59 190,411$ 68,000$ 9.1 19.6 1 3 -1 238 038S_SH1346A 0 210 56 99 35 1 59 125,447$ 44,800$ 8 17.3 1 2 -1 238 038S_SH1348A 0 210 56 98 40 1 56 328,000$ 98,400$ 7.7 20 1 29 -1 238 038S_SH1401A 270 170 115 281 30 1 60 302,417$ 108,000$ 12 22.5 1 31 -1 0.538 038S_SH1350A 0 210 56 117 35 1 59 179,210$ 64,000$ 11 20.7 1 2 -1 238 038S_SH1402A 0 210 56 131 40 1 56 710,000$ 213,000$ 11.8 24.5 1 29 -1 238 038S_SHFF04A 270 170 115 280 40 1 56 315,125$ 109,150$ 9 21 1 24 -1 238 038S_SHFF05A 270 170 115 300 40 1 56 315,125$ 109,150$ 9 21 1 31 -1 238 038S_SHFF01A 270 170 140 320 40 1 56 315,125$ 109,150$ 9 21 1 31 -1 238 038S_SHFF02A 370 70 100 380 40 1 56 315,125$ 109,150$ 9 21 1 31 -1 238 038S_SHFF03A 270 170 115 290 40 1 56 315,125$ 109,150$ 9 21 1 31 -1 238 038S_SHHWY 190 64 1000 215 34 1 64 105,868$ -$ 7.8 7.8 1 34 -1 0.5
-99939 039S_SH1202A 0 230 59 93 35 1 59 302,417$ 108,000$ 10.4 21.5 1 20 -1 239 039S_SH1203A 290 170 125 315 50 1 59 212,812$ 76,000$ 7.9 16.8 1 31 -1 239 039S_SH1204A 0 230 59 108 30 1 59 204,972$ 73,200$ 9.9 21.6 1 20 -1 239 039S_SH1205A 290 170 125 323 30 1 60 224,013$ 80,000$ 7 19.1 1 31 -1 239 039S_SH1206A 0 230 59 83 35 1 2 392,022$ 140,000$ 10.6 10.6 1 31 -1 239 039S_SH1210A 0 230 59 155 45 1 59 234,093$ 83,600$ 12 21.4 1 19 -1 0.539 039S_SH1212A 0 230 59 108 60 1 59 201,611$ 72,000$ 8.8 17.9 1 3 -1 239 039S_SH1214A 0 230 59 121 45 1 59 224,013$ 80,000$ 9.7 17.9 1 3 -1 239 039S_SH1216A 0 230 59 100 55 1 59 336,019$ 120,000$ 10.1 22.3 1 20 -1 239 039S_SH1218A 0 230 59 118 35 1 55 120,967$ 43,200$ 8.3 19.6 1 30 -1 239 039S_SH1220A 0 230 59 127 40 1 56 380,000$ 114,000$ 8.4 20.6 1 29 -1 239 039S_SH1222A 0 230 59 141 30 1 60 385,302$ 137,600$ 7.2 19.2 1 6 -1 239 039S_SH1224A 0 230 59 149 30 1 60 362,901$ 129,600$ 10 20.9 1 15 -1 239 039S_SH1226A 0 230 59 171 30 1 60 316,978$ 113,200$ 14 22.6 1 4 -1 0.539 039S_SH1306A 0 230 59 176 45 1 59 250,894$ 89,600$ 16 23.6 1 10 -1 0.539 039S_SH1308A 0 230 59 180 25 1 60 259,855$ 92,800$ 16 23.6 1 13 -1 0.539 039S_SH1311A 290 170 125 397 30 1 56 201,611$ 72,000$ 15 24.5 1 31 -1 0.539 039S_SH1313A 290 170 125 388 30 1 56 208,332$ 74,400$ 13 26 1 31 -1 0.539 039S_SH1314A 0 230 59 160 40 1 56 350,000$ 105,000$ 8 20 1 29 -1 239 039S_SHFF03A 290 170 125 325 40 1 56 315,125$ 109,150$ 8 20 1 31 -1 239 039S_SH1310A 0 230 59 160 40 1 56 250,000$ 75,000$ 8 20 1 29 -1 2

Attachment B-3to Appendix B - Economic Analysis
Surf City - North Topsail BeachFeasibility Study page 12of 51
Reach ID USACE_ID REF lot front
Lot length Lot width
REF struc front
Struc length AA Ratio Flood
Curve
Replacement Value of Structure in Dollars
Value of Contents in Dollars
G_elev FF_elev Active Erosion Curve Armor Erosion
Indicator
39 039S_SHFF05A 290 170 125 365 40 1 56 315,125$ 109,150$ 8 20 1 31 -1 239 039S_SHFF04A 0 230 59 170 40 1 56 315,125$ 109,150$ 8 20 1 24 -1 239 039S_SHFF02A 290 170 125 320 40 1 56 315,125$ 109,150$ 8 20 1 31 -1 239 039S_SHFF01A 290 170 125 320 40 1 56 315,125$ 109,150$ 0 20 1 31 -1 239 039N_TOHWY 350 64 600 365 34 1 64 63,519$ -$ 8.7 8.7 1 34 -1 0.539 039S_SHHWY1 220 64 200 335 34 1 64 21,169$ -$ 8.7 8.7 1 34 -1 0.539 039S_SHHWY2 250 64 200 265 34 1 64 21,169$ -$ 8.7 8.7 1 34 -1 0.539 039S_SHHWY3 240 64 600 255 34 1 64 63,519$ -$ 8.7 8.7 1 34 -1 0.5
-99940 040S_SH1105A 300 115 55 341 25 1 60 236,333$ 84,400$ 18.5 29.6 1 31 -1 0.540 040S_SH1108A 0 240 53 165 40 1 56 420,000$ 126,000$ 8.5 16.6 1 29 -1 240 040S_SH1107A 300 115 55 344 30 1 60 113,001$ 40,355$ 9 20.4 1 31 -1 240 040S_SH1110A 0 240 53 164 30 1 60 268,815$ 96,000$ 11 20 1 6 -1 240 040S_SH1111A 300 115 55 334 30 1 60 212,812$ 76,000$ 8 19.8 1 31 -1 240 040S_SH1112A 0 240 53 119 45 1 59 134,408$ 48,000$ 8.8 17.3 1 2 -1 240 040S_SH1113A 300 115 55 336 45 1 59 134,408$ 48,000$ 8.1 16.6 1 31 -1 240 040S_SH1114A 0 240 53 126 20 1 60 246,414$ 88,000$ 10.9 19.4 1 24 -1 240 040S_SH1117A 300 115 55 327 50 1 59 267,695$ 95,600$ 7.9 16 1 31 -1 240 040S_SH1115A 300 115 55 324 30 1 60 267,695$ 95,600$ 8 19.8 1 31 -1 240 040S_SH1116A 0 240 53 147 30 1 56 302,417$ 108,000$ 11 22.6 1 29 -1 240 040S_SH1118A 0 240 53 106 40 1 59 95,205$ 34,000$ 9 17.8 1 23 -1 240 040S_SH1119A 300 115 55 331 45 1 59 145,608$ 52,000$ 7.6 15.7 1 31 -1 240 040S_SH1120A 0 240 53 89 45 1 59 108,646$ 38,800$ 8.7 17.5 1 2 -1 240 040S_SH1121A 300 115 55 322 30 1 60 225,133$ 80,400$ 7 19 1 31 -1 240 040S_SH1122A 0 240 53 116 40 1 59 134,408$ 48,000$ 12.3 23.4 1 1 -1 0.540 040S_SH1123A 300 115 55 316 40 1 59 96,325$ 34,400$ 6.7 15.2 1 31 -1 240 040S_SH1124A 0 240 53 106 45 1 59 168,010$ 60,000$ 11.4 19.7 1 3 -1 240 040S_SH1126A 0 240 53 111 45 1 59 89,605$ 32,000$ 10.8 20.7 1 2 -1 240 040S_SH1127A 300 140 56 322 30 1 59 113,001$ 40,355$ 6.1 16.2 1 31 -1 240 040S_SH1128A 0 240 53 117 40 1 59 201,611$ 72,000$ 10.8 20.7 1 3 -1 240 040S_SH1129A 300 140 56 309 45 1 59 192,651$ 68,800$ 6.6 15.7 1 31 -1 240 040S_SH1130A 0 240 53 112 40 1 59 190,411$ 68,000$ 10.7 24.3 1 11 -1 240 040S_SH1132A 0 240 53 103 45 1 55 145,608$ 52,000$ 9.1 19.3 1 30 -1 240 040S_SH1136A 0 240 53 106 20 1 60 280,016$ 100,000$ 12 23.3 1 22 -1 0.540 040S_SH1138A 0 240 53 104 40 1 59 313,618$ 112,000$ 11.3 22.1 1 3 -1 240 040S_SH1139A 300 140 56 312 40 1 59 224,013$ 80,000$ 6.6 15.5 1 20 -1 240 040S_SH1140A 0 240 53 98 50 1 59 224,013$ 80,000$ 11.3 22.1 1 3 -1 2

Attachment B-3to Appendix B - Economic Analysis
Surf City - North Topsail BeachFeasibility Study page 13of 51
Reach ID USACE_ID REF lot front
Lot length Lot width
REF struc front
Struc length AA Ratio Flood
Curve
Replacement Value of Structure in Dollars
Value of Contents in Dollars
G_elev FF_elev Active Erosion Curve Armor Erosion
Indicator
40 040S_SH1142A 0 240 53 97 30 1 2 224,013$ 80,000$ 9.8 9.8 1 30 -1 240 040S_TO1126A 415 25 55 401 30 1 59 68,324$ 24,400$ 5 14.1 1 31 -1 240 040S_SH1334A 0 240 53 145 40 1 56 155,000$ 46,500$ 7 19 1 29 -1 240 040S_SHFF03A 300 115 55 320 40 1 56 315,125$ 109,150$ 7 19 1 31 -1 240 040S_SH1106A 0 240 53 150 40 1 56 360,000$ 108,000$ 7 19 1 29 -1 240 040S_SHFF02A 300 115 55 340 40 1 56 315,125$ 109,150$ 7 19 1 31 -1 240 040S_SHFF08A 300 140 56 330 40 1 56 315,125$ 109,150$ 7 19 1 31 -1 240 040S_SHFF04A 300 140 56 325 40 1 56 315,125$ 109,150$ 7 19 1 31 -1 240 040S_SHFF06A 300 140 56 330 40 1 56 315,125$ 109,150$ 7 19 1 31 -1 240 040S_SHFF07A 300 140 56 320 40 1 56 315,125$ 109,150$ 7 19 1 31 -1 240 040S_SHHWY 230 64 1000 245 34 1 64 105,868$ -$ 9.2 9.2 1 34 -1 0.5
-99941 041S_SH1003A 340 150 67 373 25 1 60 280,016$ 100,000$ 11.4 21.7 1 31 -1 241 041S_SH1004A 0 150 50 153 40 1 59 201,611$ 72,000$ 9.7 18.4 1 31 -1 241 041S_SH1007A 340 150 67 375 30 1 59 246,414$ 88,000$ 12.6 21.3 1 31 -1 0.541 041S_SH1008A 0 225 50 142 55 1 59 222,893$ 79,600$ 15.2 24.4 1 10 -1 0.541 041S_SH1010A 0 225 50 132 35 1 59 134,408$ 48,000$ 12.5 24.2 1 19 -1 0.541 041S_SH1011A 340 150 67 388 30 1 60 212,812$ 76,000$ 8.9 17.4 1 31 -1 241 041S_SH1012A 0 225 50 189 30 1 60 268,815$ 96,000$ 13 23.5 1 22 -1 0.541 041S_SH1013A 340 150 67 376 35 1 59 168,010$ 60,000$ 9.9 18.8 1 31 -1 241 041S_SH1014A 0 225 50 168 50 1 60 224,013$ 80,000$ 7.2 18.6 1 24 -1 241 041S_SH1015A 340 150 67 367 30 1 60 194,891$ 69,600$ 10.7 19.8 1 31 -1 241 041S_SH1016A 0 225 50 142 45 1 59 336,019$ 120,000$ 11 21.4 1 3 -1 241 041S_SH1018A 0 225 50 142 35 1 60 282,256$ 100,800$ 11 20.2 1 6 -1 241 041S_SH1019A 340 150 67 365 25 1 60 162,409$ 58,000$ 11.7 21.4 1 31 -1 241 041S_SH1020A 0 225 50 134 45 1 60 181,450$ 64,800$ 12.7 22.4 1 4 -1 0.541 041S_SH1022A 0 225 50 138 35 1 59 339,379$ 121,200$ 13.3 21.4 1 1 -1 0.541 041S_SH1023A 340 150 67 363 25 1 60 263,215$ 94,000$ 8 18.7 1 31 -1 241 041S_SH1024A 0 225 50 157 40 1 60 263,215$ 94,000$ 13.3 21.7 1 4 -1 241 041S_SH1025A 340 150 67 339 35 1 59 168,010$ 60,000$ 14 22.9 1 31 -1 0.541 041S_SH1026A 0 225 50 137 30 1 60 201,611$ 72,000$ 13 22.5 1 4 -1 0.541 041S_SH1026X 0 225 50 138 30 1 60 201,611$ 72,000$ 13 22.5 1 4 -1 0.541 041S_SH1027A 340 150 67 328 40 1 59 201,611$ 72,000$ 15.4 24.3 1 31 -1 0.541 041S_SH1032A 0 225 50 136 45 1 59 241,934$ 86,400$ 10.1 22.4 1 20 -1 241 041S_SH1100A 0 225 50 139 25 1 60 336,019$ 120,000$ 9.3 19.7 1 3 -1 241 041S_SH1102A 0 225 50 124 45 1 60 436,825$ 156,000$ 9.6 21.3 1 24 -1 241 041S_SH1103A 340 150 67 334 45 1 55 96,325$ 34,400$ 16.2 25.1 1 31 -1 0.5

Attachment B-3to Appendix B - Economic Analysis
Surf City - North Topsail BeachFeasibility Study page 14of 51
Reach ID USACE_ID REF lot front
Lot length Lot width
REF struc front
Struc length AA Ratio Flood
Curve
Replacement Value of Structure in Dollars
Value of Contents in Dollars
G_elev FF_elev Active Erosion Curve Armor Erosion
Indicator
41 041S_SH0918A 0 225 50 170 25 1 60 224,013$ 80,000$ 16 23.4 1 4 -1 0.541 041S_SH0919A 340 150 67 383 30 1 59 114,247$ 40,800$ 11.9 22 1 31 -1 241 041S_SH0920A 0 225 50 160 50 1 60 336,019$ 120,000$ 13.6 24.1 1 4 -1 0.541 041S_SH0922A 0 225 50 152 40 1 59 201,611$ 72,000$ 12.2 23.7 1 1 -1 0.541 041S_SH1006A 0 225 50 175 40 1 56 302,000$ 90,600$ 9 21 1 29 -1 241 041S_SHFF04A 340 150 67 370 40 1 56 315,125$ 109,150$ 9 21 1 31 -1 241 041S_SHFF05A 340 150 67 360 40 1 56 315,125$ 109,150$ 9 21 1 31 -1 241 041S_SH1002A 0 225 50 180 40 1 56 248,000$ 74,400$ 9 21 1 29 -1 241 041S_SHFF03A 340 150 67 370 40 1 56 315,125$ 109,150$ 9 21 1 31 -1 241 041S_SHFF06A 340 150 67 360 40 1 56 315,125$ 109,150$ 9 21 1 31 -1 241 041S_SHHWY 250 64 1000 265 34 1 64 105,868$ -$ 8.3 8.3 1 34 -1 0.5
-99942 042CROS0101A 350 70 77 445 40 1 60 113,001$ 40,355$ 9 18.7 1 31 -1 242 042CROS0107A 350 70 77 373 40 1 60 113,001$ 40,355$ 9 18.6 1 31 -1 242 042CROS0201A 350 80 77 369 40 1 60 113,001$ 40,355$ 9 18.1 1 31 -1 242 042S_SH0712A 0 200 71 166 30 1 60 280,016$ 100,000$ 14.7 24.9 1 4 -1 0.542 042S_SH0713A 350 180 77 383 45 1 59 138,888$ 49,600$ 16.5 25.7 1 31 -1 0.542 042S_SH0801A 350 180 77 371 30 1 60 201,611$ 72,000$ 17 27.2 1 31 -1 0.542 042S_SH0802A 0 200 71 151 40 1 56 525,000$ 157,500$ 16 25.2 1 28 -1 0.542 042S_SH0803A 350 180 77 382 30 1 60 224,013$ 80,000$ 18 28.1 1 31 -1 0.542 042S_SH0804A 0 200 71 144 50 1 59 179,210$ 64,000$ 15.5 24.8 1 19 -1 0.542 042S_SH0805A 350 180 77 377 30 1 60 224,013$ 80,000$ 18.9 29 1 31 -1 0.542 042S_SH0806A 0 200 71 179 30 1 60 291,217$ 104,000$ 15 24.5 1 1 -1 0.542 042S_SH0807A 350 180 77 381 35 1 59 123,207$ 44,000$ 19.4 28.1 1 31 -1 0.542 042S_SH0809A 350 180 77 391 30 1 60 263,215$ 94,000$ 8.9 18.6 1 31 -1 242 042S_SH0810A 0 200 71 178 30 1 60 268,815$ 96,000$ 11.5 20.8 1 14 -1 242 042S_SH0814A 0 200 71 217 30 1 60 301,073$ 107,520$ 13 21.3 1 4 -1 0.542 042S_SH0904A 0 230 71 164 40 1 60 716,841$ 256,000$ 10.4 18.8 1 20 -1 242 042S_SH0906A 0 230 71 166 40 1 60 716,841$ 256,000$ 10.5 18.9 1 20 -1 242 042S_SH0908A 0 230 71 167 40 1 60 716,841$ 256,000$ 10.4 18.6 1 20 -1 242 042S_SH0910A 0 200 71 168 40 1 60 716,841$ 256,000$ 10.2 18.4 1 20 -1 242 042S_SH0914A 0 230 71 219 35 1 60 113,001$ 40,355$ 13 21.4 1 4 -1 0.542 042S_SH0915A 350 370 77 379 35 1 56 113,001$ 40,355$ 9 18.7 1 31 -1 242 042S_SH0915X 350 100 77 378 35 1 56 113,001$ 40,355$ 10 18.7 1 31 -1 242 042S_SH0916A 0 200 71 160 70 1 59 278,896$ 99,600$ 11.6 20.5 1 11 -1 242 042S_SHFF01A 0 230 71 180 40 1 56 315,125$ 109,150$ 10 22 1 24 -1 242 042S_SH0812A 0 230 71 200 40 1 56 630,000$ 189,000$ 10 22 1 29 -1 2

Attachment B-3to Appendix B - Economic Analysis
Surf City - North Topsail BeachFeasibility Study page 15of 51
Reach ID USACE_ID REF lot front
Lot length Lot width
REF struc front
Struc length AA Ratio Flood
Curve
Replacement Value of Structure in Dollars
Value of Contents in Dollars
G_elev FF_elev Active Erosion Curve Armor Erosion
Indicator
42 042S_SHFF03A 350 200 77 40 40 1 56 315,125$ 109,150$ 10 22 1 31 -1 242 042S_SHFF04A 350 200 77 40 40 1 56 315,125$ 109,150$ 10 22 1 31 -1 242 042S_SHHWY 280 64 1000 295 34 1 64 105,868$ -$ 8.1 8.1 1 34 -1 0.542 042CROSHWY 420 64 300 435 34 1 64 42,966$ -$ 8.1 8.1 1 34 -1 0.5
-99943 043S_SH0506A 0 200 63 125 40 1 60 435,705$ 155,600$ 14 25.2 1 4 -1 0.543 043S_SH0507A 320 150 64 297 40 1 1 100,806$ 36,000$ 17.1 17.1 1 31 -1 0.543 043S_SH0508A 0 200 63 131 40 1 60 582,433$ 208,000$ 14 24.8 1 4 -1 0.543 043S_SH0510A 0 200 63 136 30 1 60 376,677$ 134,520$ 14 24.7 1 4 -1 0.543 043S_SH0512A 0 200 63 141 35 1 60 368,501$ 131,600$ 13 24.8 1 4 -1 0.543 043S_SH0608A 0 200 63 156 30 1 60 200,491$ 71,600$ 10.3 21.5 1 14 -1 243 043S_SH0609A 320 150 64 359 30 1 60 280,016$ 100,000$ 11.5 21.9 1 31 -1 243 043S_SH0610A 0 200 63 129 60 1 59 201,611$ 72,000$ 11.8 20.3 1 3 -1 243 043S_SH0612A 0 200 63 138 40 1 59 113,001$ 40,355$ 11.2 19.7 1 12 -1 243 043S_SH0612G 0 0 0 220 30 1 59 113,001$ 40,355$ 10 17.5 1 12 -1 243 043S_SH0613A 320 150 64 380 30 1 59 235,213$ 84,000$ 8 19 1 31 -1 243 043S_SH0614A 0 200 63 145 35 1 59 285,616$ 102,000$ 9 17.5 1 3 -1 243 043S_SH0701A 320 150 64 378 45 1 59 392,022$ 140,000$ 9 17 1 31 -1 243 043S_SH0702A 0 45 63 119 40 1 56 680,000$ 204,000$ 16.8 28 1 28 -1 0.543 043S_SH0703A 320 150 64 377 40 1 60 336,019$ 120,000$ 13.1 21.6 1 31 -1 0.543 043S_SH0704A 0 200 63 139 25 1 60 133,288$ 47,600$ 15.2 24 1 4 -1 0.543 043S_SH0706A 0 200 63 154 35 1 60 434,585$ 155,200$ 14.1 24.2 1 4 -1 0.543 043S_SH0708A 10 200 63 155 50 1 59 113,001$ 40,355$ 13.5 24.7 1 10 -1 0.543 043S_SH0709A 320 150 64 384 30 1 60 113,001$ 40,355$ 14.5 24.7 1 31 -1 0.543 043S_SH0710A 0 200 63 157 50 1 60 560,032$ 200,000$ 14.3 24.8 1 4 -1 0.543 043CHARFF01A 400 150 100 405 40 1 56 315,125$ 109,150$ 11 23 1 31 -1 243 043S_SHFF11A 320 150 64 380 40 1 56 315,125$ 109,150$ 11 23 1 31 -1 243 043S_SHFF01A 320 150 64 300 40 1 56 315,125$ 109,150$ 11 23 1 31 -1 243 043S_SHFF07A 0 200 63 150 40 1 56 315,125$ 109,150$ 11 23 1 24 -1 243 043S_SHFF04A 320 150 50 350 40 1 56 315,125$ 109,150$ 11 23 1 31 -1 243 043S_SHFF06A 320 150 64 350 40 1 56 315,125$ 109,150$ 11 23 1 31 -1 243 043S_SHFF10A 320 150 64 380 40 1 56 315,125$ 109,150$ 11 23 1 31 -1 243 043S_SHFF05A 0 200 63 150 40 1 56 315,125$ 109,150$ 11 23 1 24 -1 243 043S_SHFF03A 0 200 63 145 40 1 56 315,125$ 109,150$ 11 23 1 24 -1 243 043S_SHFF12A 320 150 64 380 40 1 56 315,125$ 109,150$ 11 23 1 31 -1 243 043S_SHFF08A 320 150 64 370 40 1 56 315,125$ 109,150$ 11 23 1 31 -1 243 043S_SHFF02A 320 150 50 330 40 1 56 315,125$ 109,150$ 11 23 1 31 -1 2

Attachment B-3to Appendix B - Economic Analysis
Surf City - North Topsail BeachFeasibility Study page 16of 51
Reach ID USACE_ID REF lot front
Lot length Lot width
REF struc front
Struc length AA Ratio Flood
Curve
Replacement Value of Structure in Dollars
Value of Contents in Dollars
G_elev FF_elev Active Erosion Curve Armor Erosion
Indicator
43 043S_SHFF01A 320 150 64 310 40 1 56 315,125$ 109,150$ 11 23 1 31 -1 243 043S_SHFF13A 320 150 64 390 40 1 56 315,125$ 109,150$ 11 23 1 31 -1 243 043S_SHHWY 220 64 1000 235 34 1 64 105,868$ -$ 7.3 7.3 1 34 -1 0.5
-99944 044DURH0103A 400 50 133 365 25 1 60 113,001$ 40,355$ 6 16.7 1 31 -1 244 044DURH0104G 360 50 75 371 25 1 1 12,195$ 4,355$ 6 6.5 1 31 -1 244 044DURH0104A 400 50 133 376 30 1 1 113,001$ 40,355$ 6 8.4 1 31 -1 244 044HIGH0105A 400 50 67 407 35 1 1 113,001$ 40,355$ 8 10.9 1 31 -1 244 044HIGH0105X 400 50 67 430 20 1 1 113,001$ 40,355$ 7 10.7 1 31 -1 244 044RALE0105A 400 50 133 411 40 1 1 113,001$ 40,355$ 7 8.7 1 31 -1 244 044RALE0106A 400 50 133 408 30 1 2 113,001$ 40,355$ 6 10.3 1 31 -1 244 044S_SH0301A 300 90 74 316 40 1 60 247,534$ 88,400$ 8 19 1 31 -1 244 044S_SH0302A 0 180 77 140 35 1 60 358,420$ 128,000$ 18 25.2 1 4 -1 0.544 044S_SH0303A 300 90 74 331 30 1 60 265,455$ 94,800$ 8 17.4 1 31 -1 244 044S_SH0304A 0 180 77 128 30 1 60 255,375$ 91,200$ 17 26.8 1 4 -1 0.544 044S_SH0305A 300 120 48 334 30 1 60 227,373$ 81,200$ 7 17.3 1 31 -1 244 044S_SH0306A 0 190 77 128 30 1 60 280,016$ 100,000$ 16 24.4 1 4 -1 0.544 044S_SH0307A 300 125 48 328 30 1 2 78,404$ 28,000$ 7 10.3 1 31 -1 0.544 044S_SH0309G 0 0 0 373 25 1 1 67,204$ 24,000$ 6 7.3 1 31 -1 0.544 044S_SH0309A 300 125 48 318 30 1 1 68,324$ 24,400$ 7 9.9 1 31 -1 0.544 044S_SH0310A 0 190 77 124 45 1 2 115,367$ 41,200$ 13 11 1 31 -1 0.544 044S_SH0311A 300 100 74 316 55 1 1 100,806$ 36,000$ 7 11 1 31 -1 0.544 044S_SH0312A 0 190 77 114 45 1 59 201,611$ 72,000$ 16 10.4 1 1 -1 0.544 044S_SH0313A 300 100 74 325 30 1 60 267,695$ 95,600$ 7 18.3 1 31 -1 244 044S_SH0401A 300 120 74 314 75 1 1 103,046$ 36,800$ 11.6 11.6 1 31 -1 0.544 044S_SH0402A 0 190 77 108 45 1 59 179,210$ 64,000$ 12.4 20.8 1 1 -1 0.544 044S_SH0404A 0 190 77 108 50 1 59 212,812$ 76,000$ 12.6 22.1 1 19 -1 0.544 044S_SH0403A 300 125 48 305 50 1 2 84,005$ 30,000$ 12.7 12.7 1 31 -1 0.544 044S_SH0405S 0 0 0 400 25 1 60 224,013$ 80,000$ 6 7.5 1 31 -1 244 044S_SH0406A 0 200 77 173 45 1 55 113,001$ 40,355$ 13 20.4 1 28 -1 0.544 044S_SH0408A 0 200 77 120 40 1 59 134,408$ 48,000$ 10.9 21 1 2 -1 244 044S_SH0405A 300 125 48 307 50 1 1 224,013$ 80,000$ 13.4 13.4 1 31 -1 0.544 044S_SH0410A 0 200 77 103 40 1 59 134,408$ 48,000$ 10.5 18.6 1 2 -1 244 044S_SH0412A 0 200 77 161 30 1 60 262,095$ 93,600$ 13 23.2 1 4 -1 0.544 044S_SH0413A 300 75 74 304 45 1 1 69,444$ 24,800$ 14.2 14.2 1 31 -1 0.544 044S_SH0501A 300 70 74 301 30 1 60 246,414$ 88,000$ 7 18.5 1 31 -1 244 044S_SH0503A 300 75 74 298 30 1 60 209,452$ 74,800$ 15.2 25.5 1 31 -1 0.5

Attachment B-3to Appendix B - Economic Analysis
Surf City - North Topsail BeachFeasibility Study page 17of 51
Reach ID USACE_ID REF lot front
Lot length Lot width
REF struc front
Struc length AA Ratio Flood
Curve
Replacement Value of Structure in Dollars
Value of Contents in Dollars
G_elev FF_elev Active Erosion Curve Armor Erosion
Indicator
44 044S_SH0504A 0 200 77 89 30 1 59 156,809$ 56,000$ 19 28.5 1 19 -1 0.544 044S_SH0505A 300 200 48 294 40 1 1 89,605$ 32,000$ 16 16 1 31 -1 0.544 044S_SHFF01A 300 125 48 320 40 1 56 315,125$ 109,150$ 10 22 1 31 -1 244 044S_SHFF03A 0 200 77 160 40 1 56 315,125$ 109,150$ 10 22 1 24 -1 244 044S_SHFF02A 290 75 74 300 40 1 56 315,125$ 109,150$ 10 22 1 31 -1 244 044S_SHHWY 230 64 1000 245 34 1 64 105,868$ -$ 8.5 8.5 1 34 -1 0.5
-99945 045HIGH0106A 395 50 84 399 30 1 60 113,001$ 40,355$ 8 18.8 1 31 -1 245 045N_SH0102A 0 110 133 151 40 1 38 422,264$ 150,800$ 19 18.7 1 28 -1 0.545 045ROLA0204X 330 210 45 376 30 1 1 113,001$ 40,355$ 13 12.8 1 31 -1 0.545 045ROLA0204A 330 210 45 398 65 1 1 113,001$ 40,355$ 14 12.8 1 31 -1 0.545 045ROLA0205A 430 100 180 427 80 1 1 113,001$ 40,355$ 9 7.9 1 31 -1 0.545 045S_SH0101A 0 110 100 137 40 1 38 113,001$ 40,355$ 18 18.8 1 28 -1 245 045S_SH0103A 325 55 108 356 30 1 55 67,204$ 24,000$ 9 11.3 1 31 -1 245 045S_SH0110A 0 120 51 169 45 1 59 201,611$ 72,000$ 15 27.1 1 22 -1 245 045S_SH0112A 0 120 51 197 40 1 59 113,001$ 40,355$ 13 19 1 13 -1 245 045S_SH0116A 0 60 96 133 30 1 59 112,006$ 40,000$ 18 16.5 1 10 -1 245 045S_SH0116X 200 50 48 215 25 1 59 112,006$ 40,000$ 13 15.8 1 31 -1 245 045S_SH0116Y 200 50 48 207 30 1 59 112,006$ 40,000$ 12 15.8 1 31 -1 245 045S_SH0120A 0 120 52 151 25 1 60 324,819$ 116,000$ 15 24.8 1 4 -1 245 045S_SH0122X 0 125 52 156 12 1 25 20,161$ 7,200$ 15 14.2 1 4 -1 245 045S_SH0002P 0 110 70 137 20 1 1 113,001$ 40,355$ 17 18.9 1 4 -1 245 045S_SH0202A 0 180 52 153 25 1 60 324,819$ 116,000$ 17 14.7 1 4 -1 245 045S_SH0204A 0 180 52 151 30 1 60 257,615$ 92,000$ 17 14.7 1 4 -1 245 045S_SH0205A 313 100 49 336 35 1 1 113,001$ 40,355$ 7 9.2 1 31 -1 0.545 045S_SH0205X 380 100 49 396 30 1 1 113,001$ 40,355$ 7 10.1 1 31 -1 0.545 045S_SH0206A 0 180 52 169 40 1 60 324,819$ 116,000$ 12 22 1 22 -1 245 045S_SH0207A 313 100 51 317 40 1 60 113,001$ 40,355$ 7 20 1 31 -1 245 045S_SH0208A 0 45 52 159 45 1 60 369,621$ 132,000$ 14 22.6 1 4 -1 0.545 045S_SH0209A 313 100 54 334 30 1 1 113,001$ 40,355$ 7 10.4 1 31 -1 0.545 045S_SH0210A 0 180 52 153 35 1 60 320,338$ 114,400$ 15 23.6 1 22 -1 245 045S_SH0211A 305 100 42 317 35 1 60 240,814$ 86,000$ 7 19 1 31 -1 245 045S_SH0212A 0 180 52 157 40 1 60 357,300$ 127,600$ 13 24.9 1 22 -1 245 045S_SH0213A 305 90 42 311 40 1 60 240,814$ 86,000$ 7 18.9 1 31 -1 245 045S_SH0214A 0 180 52 165 35 1 60 313,618$ 112,000$ 14 22.5 1 4 -1 0.545 045S_TO0116A 430 100 180 438 40 1 35 232,973$ 83,200$ 8 9.7 1 31 -1 0.545 045S_TO0210A 420 125 54 429 30 1 1 135,494$ 48,388$ 7 8.7 1 31 -1 0.5

Attachment B-3to Appendix B - Economic Analysis
Surf City - North Topsail BeachFeasibility Study page 18of 51
Reach ID USACE_ID REF lot front
Lot length Lot width
REF struc front
Struc length AA Ratio Flood
Curve
Replacement Value of Structure in Dollars
Value of Contents in Dollars
G_elev FF_elev Active Erosion Curve Armor Erosion
Indicator
45 045S_SHFF01A 325 60 108 340 40 1 56 315,125$ 109,150$ 12 24 1 31 -1 245 045S_SHFF02A 205 50 100 215 40 1 56 315,125$ 109,150$ 9 24 1 31 -1 245 045S_SHFF05A 325 100 108 340 40 1 56 315,125$ 109,150$ 9 24 1 31 -1 245 045S_TOFF01A 430 100 180 450 40 1 56 315,125$ 109,150$ 9 24 1 31 -1 245 045S_SHFF03A 0 125 51 200 40 1 56 315,125$ 109,150$ 9 24 1 24 -1 245 045S_SHFF06A 325 100 108 340 40 1 56 315,125$ 109,150$ 9 24 1 31 -1 245 045S_SHFF07A 325 100 108 330 40 1 56 315,125$ 109,150$ 9 24 1 31 -1 245 045S_SHFF08A 313 200 132 350 40 1 56 315,125$ 109,150$ 9 24 1 31 -1 245 045S_SHFF04A 0 125 51 190 40 1 56 315,125$ 109,150$ 9 24 1 24 -1 245 045S_SHHWY 250 64 1000 265 34 1 64 105,868$ -$ 8.2 8.2 1 34 -1 0.5
-99946 046GREE0203A 372 50 140 368 35 1 1 113,001$ 40,355$ 10 12 1 31 -1 0.546 046N_SH0107A 321 120 63 319 50 1 1 201,611$ 72,000$ 12 15.6 1 31 -1 0.546 046N_SH0107S 0 0 0 396 20 1 1 113,001$ 40,355$ 11 17 1 31 -1 0.546 046N_SH0108A 0 180 68 149 60 1 2 784,045$ 280,000$ 20 13.8 1 31 -1 0.546 046N_SH0111A 321 100 63 344 45 1 59 333,779$ 119,200$ 12 18.7 1 31 -1 246 046N_SH0114A 0 100 68 206 40 1 59 160,169$ 57,200$ 16 13.1 1 1 -1 246 046N_SH0121A 321 100 63 334 40 1 1 92,965$ 33,200$ 11 14.2 1 31 -1 0.546 046N_SH0123A 300 70 70 316 25 1 60 257,615$ 92,000$ 11 20.2 1 31 -1 246 046N_SH0124A 0 170 68 180 20 1 60 134,408$ 48,000$ 16 12.8 1 22 -1 246 046N_SH0202A 0 170 68 188 25 1 60 280,016$ 100,000$ 12 21.8 1 22 -1 246 046N_SH0204A 0 170 68 185 25 1 60 280,016$ 100,000$ 11 21.5 1 23 -1 246 046N_SH0206A 0 170 68 182 20 1 60 280,016$ 100,000$ 11 21.4 1 23 -1 246 046N_SH0207A 281 90 73 284 30 1 1 72,804$ 26,000$ 8 10.9 1 31 -1 0.546 046N_SH0208A 0 170 68 147 35 1 60 287,856$ 102,800$ 14 22.3 1 22 -1 246 046N_SH0209A 281 90 73 288 55 1 59 226,253$ 80,800$ 8 10 1 31 -1 246 046N_SH0211S 0 80 0 329 15 1 59 226,253$ 80,800$ 7 8.6 1 31 -1 246 046N_SH0211A 281 80 73 269 35 1 2 336,019$ 120,000$ 6 8.9 1 31 -1 0.546 046N_SH0212A 0 170 68 112 45 1 60 252,014$ 90,000$ 16 20.4 1 4 -1 246 046N_SH0213A 0 50 50 261 35 1 1 179,210$ 64,000$ 6 9.5 1 31 -1 0.546 046N_SH0213M 148 50 50 310 30 1 1 179,210$ 64,000$ 6 9.7 1 31 -1 0.546 046N_SH0214A 148 170 50 159 30 1 1 82,885$ 29,600$ 9 17.3 1 31 -1 0.546 046N_SH0214X 0 170 50 104 30 1 1 113,001$ 40,355$ 17 18.6 1 31 -1 0.546 046N_TO0106A 432 100 56 475 40 1 53 156,809$ 56,000$ 10 8.9 1 31 -1 0.546 046N_TO0114A 432 100 56 412 40 1 60 148,968$ 53,200$ 10 13.3 1 31 -1 246 046N_TO0118A 432 100 56 454 40 1 53 67,204$ 24,000$ 9 10.3 1 31 -1 246 046N_TO0206A 376 90 150 367 35 1 60 113,001$ 40,355$ 7 13.4 1 31 -1 2

Attachment B-3to Appendix B - Economic Analysis
Surf City - North Topsail BeachFeasibility Study page 19of 51
Reach ID USACE_ID REF lot front
Lot length Lot width
REF struc front
Struc length AA Ratio Flood
Curve
Replacement Value of Structure in Dollars
Value of Contents in Dollars
G_elev FF_elev Active Erosion Curve Armor Erosion
Indicator
46 046N_TOFF04A 432 100 56 440 40 1 56 315,125$ 109,150$ 11 23 1 31 -1 246 046S_SHFF02A 281 90 73 300 40 1 56 315,125$ 109,150$ 11 23 1 31 -1 246 046N_SHFF07A 321 100 63 350 40 1 56 315,125$ 109,150$ 11 23 1 31 -1 246 046N_TOFF07A 432 100 56 460 40 1 56 315,125$ 109,150$ 11 23 1 31 -1 246 046N_TOFF02A 422 80 70 440 40 1 56 315,125$ 109,150$ 11 23 1 31 -1 246 046N_SHFF12A 321 110 63 360 40 1 56 315,125$ 109,150$ 11 23 1 31 -1 246 046N_TOFF05A 432 100 56 440 40 1 56 315,125$ 109,150$ 11 23 1 31 -1 246 046N_TOFF06A 432 100 56 450 40 1 56 315,125$ 109,150$ 11 23 1 31 -1 246 046N_SHFF05A 321 100 63 340 40 1 56 315,125$ 109,150$ 11 23 1 31 -1 246 046S_SHFF03A 300 70 70 310 40 1 56 315,125$ 109,150$ 11 23 1 31 -1 246 046N_TOFF09A 432 100 56 480 40 1 56 315,125$ 109,150$ 11 23 1 31 -1 246 046N_TOFF08A 432 100 56 480 40 1 56 315,125$ 109,150$ 11 23 1 31 -1 246 046S_SHFF01A 0 170 68 155 40 1 56 315,125$ 109,150$ 11 23 1 24 -1 246 046N_TOFF03A 422 80 70 450 40 1 56 315,125$ 109,150$ 11 23 1 31 -1 246 046N_SHFF09A 321 110 63 350 40 1 56 315,125$ 109,150$ 11 23 1 31 -1 246 046N_SHFF08A 0 180 68 180 40 1 56 315,125$ 109,150$ 11 23 1 24 -1 246 046N_SHFF13A 321 110 63 350 40 1 56 315,125$ 109,150$ 11 23 1 31 -1 246 046N_SHFF11A 0 180 68 180 40 1 56 315,125$ 109,150$ 11 23 1 24 -1 246 046N_SHFF04A 0 180 68 180 40 1 56 315,125$ 109,150$ 11 23 1 24 -1 246 046N_SHFF06A 0 180 68 180 40 1 56 315,125$ 109,150$ 11 23 1 24 -1 246 046N_SHFF10A 0 180 68 180 40 1 56 315,125$ 109,150$ 11 23 1 24 -1 246 046GOLDFF01A 401 50 70 410 40 1 56 315,125$ 109,150$ 11 23 1 31 -1 246 046GRENFF01A 380 50 140 390 40 1 56 315,125$ 109,150$ 11 23 1 31 -1 246 046GOLDFF02A 357 50 70 365 40 1 56 315,125$ 109,150$ 11 23 1 31 -1 246 046N_TOFF01A 447 50 140 430 40 1 56 315,125$ 109,150$ 11 23 1 31 -1 246 046N_SHHWY 230 64 1000 245 34 1 64 105,868$ -$ 10.8 10.8 1 34 -1 0.5
-99947 047N_SH0302A 0 190 59 105 45 1 59 134,408$ 48,000$ 16 19.4 1 1 -1 247 047N_SH0302F 200 190 59 166 20 1 59 22,401$ 8,000$ 11 22.2 1 31 -1 247 047N_SH0302A 0 190 200 282 170 1 59 672,038$ 240,000$ 7 10.6 1 3 -1 247 047N_SH0304A 0 190 59 126 40 1 59 168,010$ 60,000$ 13 25.1 1 19 -1 247 047N_SH0305S 300 90 62 345 20 1 2 22,401$ 8,000$ 7 8.5 1 31 -1 0.547 047N_SH0306G 0 190 0 163 45 1 55 113,001$ 40,355$ 10 19.5 1 30 -1 247 047N_SH0306A 0 190 59 110 30 1 55 113,001$ 40,355$ 17 14.3 1 30 -1 247 047N_SH0307A 300 90 62 277 45 1 1 89,605$ 32,000$ 7 12.6 1 31 -1 0.547 047N_SH0308A 0 190 59 108 40 1 55 58,243$ 20,800$ 16 18.6 1 28 -1 247 047N_SH0311A 300 90 62 301 40 1 1 106,406$ 38,000$ 8 12.5 1 31 -1 0.5

Attachment B-3to Appendix B - Economic Analysis
Surf City - North Topsail BeachFeasibility Study page 20of 51
Reach ID USACE_ID REF lot front
Lot length Lot width
REF struc front
Struc length AA Ratio Flood
Curve
Replacement Value of Structure in Dollars
Value of Contents in Dollars
G_elev FF_elev Active Erosion Curve Armor Erosion
Indicator
47 047N_SH0312A 0 190 59 119 50 1 59 201,611$ 72,000$ 17 22.5 1 1 -1 247 047N_SH0313A 300 90 62 288 35 1 1 94,085$ 33,600$ 8 11.1 1 31 -1 0.547 047N_SH0314A 0 190 59 129 35 1 59 112,006$ 40,000$ 15 14.2 1 31 -1 247 047N_SH0315A 300 80 62 302 25 1 60 235,213$ 84,000$ 7 18.9 1 31 -1 247 047N_SH0316A 0 190 59 116 40 1 1 113,001$ 40,355$ 17 21.6 1 31 -1 0.547 047N_SH0316G 0 190 59 164 30 1 60 113,001$ 40,355$ 12 26.8 1 4 -1 247 047N_SH0317A 300 80 62 308 35 1 60 218,412$ 78,000$ 7 18 1 31 -1 247 047N_SH0318A 0 190 59 130 45 1 55 280,016$ 100,000$ 17 27.6 1 28 -1 247 047N_SH0320A 0 190 59 184 25 1 60 344,980$ 123,200$ 11 23.2 1 24 -1 247 047N_SH0322A 0 190 59 168 25 1 55 96,325$ 34,400$ 17 23.9 1 28 -1 247 047N_SH0324A 0 190 59 131 30 1 60 190,411$ 68,000$ 18 24.2 1 4 -1 247 047N_SH0326X 200 190 59 188 40 1 1 113,001$ 40,355$ 12 14.3 1 31 -1 0.547 047N_SH0326A 0 190 59 104 40 1 1 113,001$ 40,355$ 17 21 1 31 -1 0.547 047N_SH0327A 300 80 62 314 35 1 2 147,848$ 52,800$ 8 9.8 1 31 -1 0.547 047N_SH0328A 0 190 59 176 35 1 60 392,022$ 140,000$ 14 23.6 1 22 -1 247 047N_SH0330A 0 190 59 151 30 1 60 280,016$ 100,000$ 16 24.9 1 4 -1 247 047N_SH0331A 300 80 62 311 25 1 1 71,684$ 25,600$ 8 11 1 31 -1 0.547 047N_SH0332X 0 190 59 138 30 1 60 280,016$ 100,000$ 18 20.7 1 4 -1 247 047N_SH0332A 200 190 59 188 25 1 60 96,325$ 34,400$ 17 26.6 1 4 -1 247 047N_SH0333A 300 80 62 307 30 1 60 134,408$ 48,000$ 9 9.7 1 31 -1 247 047N_SH0334A 0 190 59 201 30 1 1 313,618$ 112,000$ 13 22.1 1 31 -1 0.547 047N_TO0306A 390 75 67 398 40 1 1 113,001$ 40,355$ 7 10.4 1 31 -1 0.547 047N_TO0312A 390 75 67 382 20 1 1 48,163$ 17,200$ 7 10 1 31 -1 0.547 047N_TO0314A 390 75 67 415 35 1 1 112,006$ 40,000$ 7 11 1 31 -1 0.547 047N_TO0316A 390 75 67 382 14 1 1 113,001$ 40,355$ 7 9.7 1 31 -1 0.547 047N_TO0322A 390 75 67 415 30 1 1 134,408$ 48,000$ 7 10.8 1 31 -1 0.547 047N_TO0324A 390 75 67 402 40 1 55 118,727$ 42,400$ 7 10.9 1 30 -1 247 047N_TO0326A 390 75 67 414 30 1 55 78,404$ 28,000$ 8 10.4 1 29 -1 247 047N_TO0328A 390 75 67 387 35 1 1 144,488$ 51,600$ 8 12.1 1 31 -1 0.547 047N_TO0330A 390 75 67 413 25 1 55 67,204$ 24,000$ 8 10.2 1 31 -1 247 047N_TO0334A 390 75 67 408 55 1 60 162,409$ 58,000$ 9 10.9 1 31 -1 247 047NEW_0201A 300 70 62 323 45 1 1 113,001$ 40,355$ 9 10.5 1 31 -1 0.547 047N_SHFF04A 300 80 62 320 40 1 56 315,125$ 109,150$ 8 20 1 31 -1 247 047N_SHFF03A 0 180 59 155 40 1 56 315,125$ 109,150$ 8 20 1 21 -1 247 047N_SHFF01A 300 80 62 340 40 1 56 315,125$ 109,150$ 8 20 1 31 -1 247 047N_SHFF02A 300 80 62 330 40 1 56 315,125$ 109,150$ 8 20 1 31 -1 247 047N_TOFF01A 390 80 67 410 40 1 56 315,125$ 109,150$ 8 20 1 31 -1 2

Attachment B-3to Appendix B - Economic Analysis
Surf City - North Topsail BeachFeasibility Study page 21of 51
Reach ID USACE_ID REF lot front
Lot length Lot width
REF struc front
Struc length AA Ratio Flood
Curve
Replacement Value of Structure in Dollars
Value of Contents in Dollars
G_elev FF_elev Active Erosion Curve Armor Erosion
Indicator
47 047N_TOFF02A 390 80 67 400 40 1 56 315,125$ 109,150$ 8 20 1 31 -1 247 047N_SHHWY 220 64 1000 235 34 1 64 105,868$ -$ 9.7 9.7 1 34 -1 0.547 047N_TOHWY 450 64 1000 465 34 1 64 105,868$ -$ 9.7 9.7 1 34 -1 0.5
-99948 048N_SH0401A 320 80 56 326 35 1 1 61,604$ 22,000$ 8 9.9 1 31 -1 0.548 048N_SH0402A 0 200 62 162 30 1 60 357,300$ 127,600$ 16 24.9 1 1 -1 248 048N_SH0403A 320 80 56 329 30 1 1 44,803$ 16,000$ 8 8.7 1 31 -1 0.548 048N_SH0404A 0 200 62 153 30 1 60 492,828$ 176,000$ 17 20.3 1 4 -1 248 048N_SH0405A 320 80 56 331 35 1 1 67,204$ 24,000$ 8 10.4 1 31 -1 0.548 048N_SH0406A 0 200 62 154 35 1 60 436,825$ 156,000$ 17 14.3 1 4 -1 248 048N_SH0408A 0 200 62 132 45 1 59 153,449$ 54,800$ 18 14 1 1 -1 248 048N_SH0409A 320 80 56 328 25 1 2 134,408$ 48,000$ 8 9.3 1 31 -1 0.548 048N_SH0411A 320 80 56 323 45 1 59 257,615$ 92,000$ 8 10.8 1 31 -1 248 048N_SH0412A 0 200 62 109 40 1 59 61,604$ 22,000$ 18 20.8 1 1 -1 248 048N_SH0413A 320 80 56 317 30 1 1 56,003$ 20,000$ 9 9.7 1 31 -1 0.548 048N_SH0414G 0 200 62 177 12 1 55 113,001$ 40,355$ 15 15 1 31 -1 248 048N_SH0414A 0 200 62 115 30 1 55 268,815$ 96,000$ 18 21 1 28 -1 248 048N_SH0414X 170 80 62 206 30 1 55 113,001$ 40,355$ 13 12.7 1 31 -1 248 048N_SH0415A 320 80 56 309 35 1 55 113,001$ 40,355$ 9 18.5 1 31 -1 248 048N_SH0415X 355 80 56 352 30 1 1 113,001$ 40,355$ 7 9.5 1 31 -1 0.548 048N_SH0416A 0 200 62 114 35 1 55 123,207$ 44,000$ 18 20.6 1 28 -1 248 048N_SH0416G 0 200 62 220 20 1 1 11,201$ 4,000$ 12 13.6 1 31 -1 0.548 048N_SH0417A 320 80 56 317 30 1 1 56,003$ 20,000$ 9 11.2 1 31 -1 0.548 048N_SH0418A 0 200 62 105 35 1 2 113,001$ 40,355$ 17 19.8 1 31 -1 0.548 048N_SH0418G 0 80 62 219 25 1 2 22,401$ 8,000$ 12 17.7 1 31 -1 0.548 048N_SH0419P 0 80 62 327 55 1 11 44,803$ 16,000$ 9 10.2 1 31 -1 248 048N_SH0420A 0 200 62 158 35 1 60 369,621$ 132,000$ 16 26.3 1 4 -1 248 048N_SH0422A 0 200 62 121 40 1 59 194,891$ 69,600$ 18 24.9 1 1 -1 248 048N_SH0424A 0 200 62 167 30 1 60 380,822$ 136,000$ 16 25.7 1 4 -1 248 048N_SH0426A 0 200 62 178 30 1 60 113,001$ 40,355$ 16 26 1 25 -1 248 048N_SH0502A 0 200 62 100 35 1 55 156,809$ 56,000$ 16 21.7 1 28 -1 248 048N_SH0504A 0 200 62 172 45 1 55 235,213$ 84,000$ 13 23.4 1 28 -1 248 048N_SH0508A 0 200 62 113 45 1 59 312,498$ 111,600$ 17 23.3 1 1 -1 248 048N_SH0509A 320 80 50 331 20 1 60 113,001$ 40,355$ 10 20.4 1 31 -1 248 048N_TO0402A 390 65 62 412 30 1 1 28,002$ 10,000$ 8 9.7 1 31 -1 0.548 048N_TO0404A 390 65 62 413 50 1 1 11,761$ 4,200$ 7 10.7 1 31 -1 0.548 048N_TO0406A 390 65 62 394 40 1 2 160,169$ 57,200$ 7 9.5 1 31 -1 0.5

Attachment B-3to Appendix B - Economic Analysis
Surf City - North Topsail BeachFeasibility Study page 22of 51
Reach ID USACE_ID REF lot front
Lot length Lot width
REF struc front
Struc length AA Ratio Flood
Curve
Replacement Value of Structure in Dollars
Value of Contents in Dollars
G_elev FF_elev Active Erosion Curve Armor Erosion
Indicator
48 048N_TO0408A 390 65 62 413 30 1 1 109,766$ 39,200$ 7 9.3 1 31 -1 0.548 048N_TO0410A 390 65 62 413 30 1 1 81,765$ 29,200$ 7 10.1 1 31 -1 0.548 048N_TO0412A 390 65 62 401 40 1 1 62,724$ 22,400$ 7 9.7 1 31 -1 0.548 048N_TO0414A 390 65 62 389 35 1 2 134,408$ 48,000$ 7 7.7 1 31 -1 0.548 048N_TO0418A 390 65 62 400 30 1 2 168,010$ 60,000$ 7 10.8 1 31 -1 0.548 048N_TO0420A 320 65 200 396 30 1 17 168,010$ 60,000$ 8 10.4 1 31 -1 248 048N_TO0420S 0 0 0 412 20 1 25 22,401$ 8,000$ 10 10.6 1 31 -1 248 048WILM0200A 320 125 200 341 80 1 24 280,016$ 100,000$ 11 13.2 1 31 -1 248 048N_SHFF01A 320 125 50 340 40 1 56 315,125$ 109,150$ 12 24 1 31 -1 248 048S_SHFF03A 320 200 56 325 40 1 56 315,125$ 109,150$ 12 24 1 31 -1 248 048N_SHFF02A 0 200 62 170 40 1 56 315,125$ 109,150$ 12 24 1 19 -1 248 048N_SHHWY 260 64 1000 275 34 1 64 105,868$ -$ 11.3 11.3 1 34 -1 0.5
-99949 049N_SH0511A 310 120 50 342 30 1 60 252,014$ 90,000$ 9 21.2 1 31 -1 249 049N_SH0512A 185 50 150 205 35 1 56 449,020$ 160,355$ 16 24.7 1 31 -1 249 049N_SH0513A 310 120 50 336 30 1 1 33,602$ 12,000$ 10 11.7 1 31 -1 0.549 049N_SH0514A 0 140 75 116 30 1 55 133,064$ 47,520$ 22 27.6 1 28 -1 249 049N_SH0516A 0 140 75 114 30 1 55 460,221$ 164,355$ 21 27.6 1 28 -1 249 049N_SH0518A 0 75 50 184 30 1 60 113,001$ 40,355$ 15 25.3 1 19 -1 249 049N_SH0519A 310 120 50 319 30 1 1 69,444$ 24,800$ 10 11.6 1 31 -1 0.549 049N_SH0519S 0 0 0 381 12 1 1 22,401$ 8,000$ 9 9.6 1 31 -1 0.549 049N_SH0520A 0 220 50 167 40 1 60 851,249$ 304,000$ 15 25.3 1 22 -1 249 049N_SH0521A 310 60 75 308 40 1 59 113,001$ 40,355$ 10 19.2 1 31 -1 249 049N_SH0522A 0 190 50 102 35 1 55 78,404$ 28,000$ 20 21.5 1 28 -1 249 049N_SH0602A 0 170 81 149 30 1 60 280,016$ 100,000$ 18 25.9 1 22 -1 249 049N_SH0605A 225 90 81 242 35 1 1 58,243$ 20,800$ 11 13.6 1 31 -1 0.549 049N_SH0606A 0 150 81 101 30 1 59 168,010$ 60,000$ 20 27.9 1 19 -1 249 049N_SH0607A 225 90 81 241 35 1 1 70,564$ 25,200$ 11 14.1 1 31 -1 0.549 049N_SH0608A 0 140 81 86 40 1 59 162,409$ 58,000$ 17 25.5 1 19 -1 249 049N_SH0610A 0 150 81 95 35 1 2 162,409$ 58,000$ 19 15.1 1 31 -1 0.549 049N_SH0611A 225 80 81 246 20 1 1 44,803$ 16,000$ 12 13.6 1 31 -1 0.549 049N_SH0611W 0 0 0 288 8 1 1 44,803$ 16,000$ 9 10.2 1 31 -1 0.549 049N_SH0614A 0 140 81 114 35 1 2 179,210$ 64,000$ 19 22.3 1 31 -1 0.549 049N_SH0616A 0 140 81 99 35 1 2 168,010$ 60,000$ 18 15 1 31 -1 0.549 049N_SH0617A 225 100 81 223 35 1 1 67,204$ 24,000$ 13 15.3 1 31 -1 0.549 049N_SH0618A 0 140 81 101 25 1 2 291,217$ 104,000$ 19 24.1 1 31 -1 0.549 049N_SH0620A 0 140 81 105 25 1 2 252,014$ 90,000$ 17 24.4 1 31 -1 0.5

Attachment B-3to Appendix B - Economic Analysis
Surf City - North Topsail BeachFeasibility Study page 23of 51
Reach ID USACE_ID REF lot front
Lot length Lot width
REF struc front
Struc length AA Ratio Flood
Curve
Replacement Value of Structure in Dollars
Value of Contents in Dollars
G_elev FF_elev Active Erosion Curve Armor Erosion
Indicator
49 049N_SH0702A 0 220 50 119 40 1 60 441,305$ 157,600$ 12 22.6 1 22 -1 249 049N_TO0515A 310 120 50 326 70 1 1 11,201$ 4,000$ 11 11 1 31 -1 0.549 049N_TO0522A 370 60 75 382 35 1 1 113,001$ 40,355$ 9 9.6 1 31 -1 0.549 049N_TO0606A 310 100 81 327 40 1 1 113,001$ 40,355$ 8 9.6 1 31 -1 0.549 049N_TO0608A 310 100 81 321 40 1 1 113,001$ 40,355$ 8 9.6 1 31 -1 0.549 049N_TO0610A 310 100 81 302 45 1 1 113,001$ 40,355$ 9 10.3 1 31 -1 0.549 049N_TO0612A 310 100 81 320 40 1 59 113,001$ 40,355$ 8 16.8 1 31 -1 249 049N_TO0618A 310 180 81 329 30 1 2 113,001$ 40,355$ 8 15.3 1 31 -1 0.549 049N_TO0620A 210 100 110 284 35 1 59 304,657$ 108,800$ 10 10.8 1 31 -1 249 049N_TO0710A 250 140 50 292 40 1 60 441,305$ 157,600$ 10 20.8 1 31 -1 249 049N_TOFF03A 310 80 81 350 40 1 56 315,125$ 109,150$ 10 22 1 31 -1 249 049N_SHFF01A 225 90 81 240 40 1 56 315,125$ 109,150$ 10 22 1 31 -1 249 049N_TOFF01A 310 100 81 320 40 1 56 315,125$ 109,150$ 10 22 1 31 -1 249 049N_TOFF02A 310 100 81 325 40 1 56 315,125$ 109,150$ 10 22 1 31 -1 249 049N_SHFF03A 225 85 81 250 40 1 56 315,125$ 109,150$ 10 22 1 31 -1 249 049N_TOFF04A 310 110 50 350 40 1 56 315,125$ 109,150$ 10 22 1 31 -1 249 049N_SHFF04A 225 100 81 270 40 1 56 315,125$ 109,150$ 10 22 1 31 -1 249 049N_SHFF02A 225 80 81 240 40 1 56 315,125$ 109,150$ 10 22 1 31 -1 249 049N_SHHWY1 250 64 200 265 34 1 64 21,169$ -$ 12 12 1 34 -1 0.549 049N_SHHWY2 200 64 150 215 34 1 64 15,883$ -$ 12 12 1 34 -1 0.549 049N_SHHWY3 150 64 650 165 34 1 64 68,817$ -$ 12 12 1 34 -1 0.549 049N_TOHWY 380 64 1000 395 34 1 64 105,868$ -$ 12 12 1 34 -1 0.5
-99950 050N_SH0706A 0 230 54 123 35 1 60 441,305$ 157,600$ 13 22.7 1 19 -1 0.550 050N_SH0710A 0 230 54 117 40 1 60 441,305$ 157,600$ 13 22.7 1 22 -1 0.550 050N_SH0714A 0 270 54 134 30 1 60 113,001$ 40,355$ 13 22.9 1 22 -1 0.550 050N_SH0716A 0 210 54 137 30 1 60 364,021$ 130,000$ 13 23.3 1 22 -1 0.550 050N_SH0718A 0 250 54 131 35 1 60 113,001$ 40,355$ 13 23.3 1 22 -1 0.550 050N_SH0720A 0 250 54 132 30 1 60 268,815$ 96,000$ 13 22.9 1 22 -1 0.550 050N_SH0726A 0 250 54 149 30 1 60 322,578$ 115,200$ 13 22.8 1 22 -1 0.550 050N_SH0728A 0 250 54 151 25 1 60 504,029$ 180,000$ 13 22.5 1 22 -1 0.550 050N_TO0017A 320 50 150 327 12 1 62 12,195$ 4,355$ 9 11.7 1 33 -1 250 050N_TO0018A 275 50 150 287 14 1 62 12,195$ 4,355$ 9 12.1 1 33 -1 250 050N_TO0019A 230 50 150 244 12 1 62 12,195$ 4,355$ 10 12.4 1 33 -1 250 050N_TO0020A 180 50 150 205 14 1 62 12,195$ 4,355$ 10 12.7 1 33 -1 250 050N_TO0022A 0 50 75 104 12 1 62 12,195$ 4,355$ 11 13.2 1 33 -1 250 050N_TO0023A 285 50 150 300 40 1 62 12,195$ 4,355$ 8 12.1 1 33 -1 2

Attachment B-3to Appendix B - Economic Analysis
Surf City - North Topsail BeachFeasibility Study page 24of 51
Reach ID USACE_ID REF lot front
Lot length Lot width
REF struc front
Struc length AA Ratio Flood
Curve
Replacement Value of Structure in Dollars
Value of Contents in Dollars
G_elev FF_elev Active Erosion Curve Armor Erosion
Indicator
50 050N_TO0024A 240 50 150 264 14 1 62 12,195$ 4,355$ 9 12.6 1 33 -1 250 050N_TO0025A 200 50 150 207 16 1 62 12,195$ 4,355$ 10 16.7 1 33 -1 250 050N_TO0026A 180 50 150 187 14 1 62 12,195$ 4,355$ 10 13.2 1 33 -1 250 050N_TO0027A 0 50 75 138 16 1 62 12,195$ 4,355$ 11 15.8 1 33 -1 250 050N_TO0028A 285 50 150 301 45 1 62 12,195$ 4,355$ 9 12 1 33 -1 250 050N_TO0029A 240 50 150 255 50 1 62 12,195$ 4,355$ 9 12 1 33 -1 250 050N_TO0030A 0 50 75 139 45 1 62 12,195$ 4,355$ 11 13.7 1 33 -1 250 050N_TO0031A 0 50 75 127 45 1 62 12,195$ 4,355$ 13 14.4 1 33 -1 0.550 050N_TO0702A 240 150 60 292 40 1 60 441,305$ 157,600$ 10 20.9 1 31 -1 250 050N_TO0706A 240 150 60 296 40 1 60 504,029$ 180,000$ 10 20.9 1 31 -1 250 050N_TO0804A 0 250 100 170 75 1 60 337,014$ 120,355$ 9 19.6 1 24 -1 250 050N_SHFF02A 0 250 54 290 40 1 56 315,125$ 109,150$ 9 21 1 24 -1 250 050N_SHFF01A 0 200 54 140 40 1 56 315,125$ 109,150$ 9 21 1 24 -1 250 050N_TOFF07A 240 110 60 300 40 1 56 315,125$ 109,150$ 9 21 1 31 -1 250 050N_SHFF03A 0 250 54 150 40 1 56 315,125$ 109,150$ 9 21 1 24 -1 250 050N_TOFF02A 240 110 60 290 40 1 56 315,125$ 109,150$ 9 21 1 31 -1 250 050N_TOFF05A 240 110 60 270 40 1 56 315,125$ 109,150$ 9 21 1 31 -1 250 050N_TOFF08A 240 110 60 290 40 1 56 315,125$ 109,150$ 9 21 1 31 -1 250 050N_TOFF09A 240 110 60 300 40 1 56 315,125$ 109,150$ 9 21 1 31 -1 250 050N_TOFF06A 240 110 60 290 40 1 56 315,125$ 109,150$ 9 21 1 31 -1 250 050N_TOFF04A 240 110 60 280 40 1 56 315,125$ 109,150$ 9 21 1 31 -1 250 050N_TOFF03A 240 110 60 290 40 1 56 315,125$ 109,150$ 9 21 1 31 -1 250 050N_TOFF01A 240 110 100 290 40 1 56 315,125$ 109,150$ 9 21 1 31 -1 250 050N_SHHWY2 250 64 350 265 34 1 64 37,052$ -$ 8 8 1 34 -1 0.550 050N_SHHWY1 210 64 200 225 34 1 64 21,169$ -$ 8 8 1 34 -1 0.550 050N_TOHWY 350 64 1000 365 34 1 64 105,868$ -$ 8 8 1 34 -1 0.5
-99951 051N_NE0918A 0 130 225 100 60 1 5 113,001$ 40,355$ 13 18.3 1 25 -1 0.551 051N_NE0918Z 200 250 225 194 200 1 5 113,001$ 40,355$ 10 17.7 1 31 -1 251 051N_NE0918T 0 130 225 102 60 1 5 113,001$ 40,355$ 15 18.8 1 25 -1 0.551 051N_NE0918Y 375 250 225 425 200 1 5 113,001$ 40,355$ 8 16.3 1 31 -1 251 051N_NE0918U 200 250 225 183 150 1 5 113,001$ 40,355$ 10 18.5 1 31 -1 251 051N_NE0918A 0 120 100 110 70 1 5 113,001$ 40,355$ 8 13.6 1 26 -1 251 051N_NE0918V 375 250 225 357 200 1 5 113,001$ 40,355$ 8 17.4 1 31 -1 251 051N_NE0918X 580 120 225 603 80 1 5 113,001$ 40,355$ 8 16.3 1 31 -1 251 051N_NE0918W 580 120 225 581 80 1 5 113,001$ 40,355$ 8 16.4 1 31 -1 251 051N_SH1003A 260 150 50 288 40 1 60 113,001$ 40,355$ 9 19.1 1 31 -1 2

Attachment B-3to Appendix B - Economic Analysis
Surf City - North Topsail BeachFeasibility Study page 25of 51
Reach ID USACE_ID REF lot front
Lot length Lot width
REF struc front
Struc length AA Ratio Flood
Curve
Replacement Value of Structure in Dollars
Value of Contents in Dollars
G_elev FF_elev Active Erosion Curve Armor Erosion
Indicator
51 051N_SH1004A 0 220 75 168 40 1 60 144,488$ 51,600$ 12 21.4 1 22 -1 251 051N_SH1005A 260 140 50 286 65 1 60 224,013$ 80,000$ 8 17.5 1 31 -1 251 051N_SH1006A 0 180 75 128 40 1 60 255,375$ 91,200$ 16 25.6 1 7 -1 251 051N_SH1007A 260 140 50 282 40 1 60 169,130$ 60,400$ 9 8.1 1 31 -1 251 051N_TO1004A 400 100 50 409 50 1 60 246,414$ 88,000$ 6 18.3 1 31 -1 251 051N_TO1006A 400 100 50 405 60 1 2 156,809$ 56,000$ 7 5.9 1 31 -1 0.551 051N_TO1008A 400 100 50 413 40 1 60 162,409$ 58,000$ 6 16.1 1 31 -1 251 051N_TO0808A 0 240 67 171 35 1 60 113,001$ 40,355$ 11 23.2 1 24 -1 251 051N_TO0810A 0 230 67 189 40 1 60 113,001$ 40,355$ 11 22.3 1 24 -1 251 051N_TO0812A 270 100 80 291 40 1 60 113,001$ 40,355$ 10 20.9 1 31 -1 251 051N_TO0814A 270 120 80 275 30 1 60 113,001$ 40,355$ 10 20.6 1 31 -1 251 051N_TO0818A 270 90 80 300 30 1 60 113,001$ 40,355$ 10 21 1 31 -1 251 051N_TO0820A 0 230 67 176 30 1 60 113,001$ 40,355$ 12 22.6 1 22 -1 251 051N_TO0822A 270 100 80 298 35 1 60 113,001$ 40,355$ 9 21.9 1 31 -1 251 051N_TO0824A 0 220 67 171 35 1 60 113,001$ 40,355$ 13 18.8 1 22 -1 0.551 051N_TO0826A 0 210 67 180 25 1 60 113,001$ 40,355$ 11 18.3 1 24 -1 251 051N_TO0828A 270 100 80 295 30 1 60 113,001$ 40,355$ 12 21.3 1 31 -1 251 051N_TOFF01A 0 220 67 220 40 1 56 315,125$ 109,150$ 8 0 1 24 -1 251 051N_SHHWY 370 64 100 390 34 1 64 10,585$ -$ 6.8 6.8 1 34 -1 0.551 051N_TOHWY 370 64 350 390 34 1 64 37,052$ -$ 6.8 6.8 1 34 -1 0.5
-99952 052N_SH1008A 0 150 77 131 35 1 59 145,160$ 51,840$ 14 18.1 1 19 -1 0.552 052N_SH1009A 260 130 56 286 50 1 59 217,292$ 77,600$ 9 17 1 31 -1 252 052N_SH1010A 0 150 77 138 30 1 60 263,215$ 94,000$ 14 19.3 1 4 -1 252 052N_SH1011A 260 130 56 298 40 1 60 168,010$ 60,000$ 8 16.8 1 31 -1 252 052N_SH1013A 260 130 56 291 40 1 59 166,890$ 59,600$ 8 16.6 1 31 -1 252 052N_SH1014A 0 150 77 129 40 1 1 156,809$ 56,000$ 16 20.3 1 31 -1 0.552 052N_SH1101A 260 130 56 297 45 1 59 96,325$ 34,400$ 9 16.5 1 31 -1 252 052N_SH1102A 0 150 77 128 40 1 59 144,488$ 51,600$ 18 20.8 1 19 -1 252 052N_SH1103A 260 130 56 296 60 1 59 134,408$ 48,000$ 9 16.6 1 31 -1 252 052N_SH1104A 0 150 77 120 30 1 55 100,806$ 36,000$ 17 18.7 1 28 -1 252 052N_SH1105A 260 130 56 299 40 1 60 145,608$ 52,000$ 9 19.5 1 31 -1 252 052N_SH1106A 0 150 77 130 30 1 60 221,773$ 79,200$ 13 19.4 1 19 -1 252 052N_SH1108A 0 150 77 138 40 1 59 92,965$ 33,200$ 14 18.7 1 19 -1 252 052N_SH1109A 260 130 56 299 30 1 2 190,411$ 68,000$ 9 17 1 31 -1 0.552 052N_SH1111A 260 130 56 292 45 1 59 156,809$ 56,000$ 9 16.9 1 31 -1 252 052N_SH1112A 0 150 77 140 40 1 55 106,406$ 38,000$ 15 19.6 1 28 -1 2

Attachment B-3to Appendix B - Economic Analysis
Surf City - North Topsail BeachFeasibility Study page 26of 51
Reach ID USACE_ID REF lot front
Lot length Lot width
REF struc front
Struc length AA Ratio Flood
Curve
Replacement Value of Structure in Dollars
Value of Contents in Dollars
G_elev FF_elev Active Erosion Curve Armor Erosion
Indicator
52 052N_SH1114A 0 150 77 130 35 1 55 224,013$ 80,000$ 16 19.7 1 28 -1 252 052N_SH1115A 260 130 56 288 50 1 60 324,819$ 116,000$ 9 16.6 1 6 -1 252 052N_SH1116A 0 150 77 138 30 1 55 62,724$ 22,400$ 13 18.2 1 28 -1 252 052N_SH1117A 260 130 56 288 45 1 59 96,325$ 34,400$ 9 16.6 1 31 -1 252 052N_SH1118A 0 150 77 168 30 1 60 168,010$ 60,000$ 15 17.7 1 22 -1 252 052N_SH1119A 260 130 56 287 45 1 55 96,325$ 34,400$ 9 16.3 1 31 -1 252 052N_SH1120A 0 150 77 126 40 1 56 250,000$ 75,000$ 16 28 1 28 -1 0.552 052N_SH1121A 260 130 56 286 45 1 55 96,325$ 34,400$ 9 16.4 1 31 -1 252 052N_SH1203A 260 100 56 284 30 1 60 284,496$ 101,600$ 10 20.3 1 31 -1 252 052N_SH1205A 260 100 56 278 30 1 59 179,210$ 64,000$ 9 15 1 31 -1 252 052N_SH1206A 0 150 77 139 45 1 55 106,406$ 38,000$ 18 18.2 1 28 -1 252 052N_SH1207A 260 100 56 271 35 1 59 72,804$ 26,000$ 9 14.4 1 31 -1 252 052N_TO1010A 390 100 56 420 40 1 59 162,409$ 58,000$ 6 16 1 31 -1 252 052N_TO1012A 390 100 56 431 40 1 2 125,447$ 44,800$ 6 14.4 1 31 -1 0.552 052N_TO1014A 390 100 56 417 45 1 55 134,408$ 48,000$ 7 14.6 1 31 -1 252 052N_TO1104A 390 110 56 415 50 1 2 168,010$ 60,000$ 8 14.7 1 31 -1 0.552 052N_TO1114A 390 110 56 407 45 1 59 96,325$ 34,400$ 8 15.7 1 31 -1 252 052N_TO1116A 390 110 56 431 40 1 56 179,210$ 64,000$ 8 18.2 1 31 -1 252 052N_TO1118A 390 110 56 411 45 1 59 235,213$ 84,000$ 8 19.1 1 31 -1 252 052N_TO1120A 390 120 56 413 30 1 60 166,890$ 59,600$ 8 16 1 31 -1 252 052N_TO1122A 390 120 56 422 35 1 60 190,411$ 68,000$ 8 16 1 31 -1 252 052N_TO1204A 390 110 56 400 50 1 59 156,809$ 56,000$ 11 15.4 1 31 -1 252 052N_TO1208A 390 110 56 392 40 1 55 101,590$ 36,280$ 9 14.7 1 31 -1 252 052N_SHFF02A 260 120 56 300 40 1 56 315,125$ 109,150$ 8 20 1 31 -1 252 052N_TOFF03A 390 115 56 420 40 1 56 315,125$ 109,150$ 8 20 1 31 -1 252 052N_TOFF07A 390 110 56 440 40 1 56 315,125$ 109,150$ 8 20 1 31 -1 252 052N_TOFF04A 390 110 56 415 40 1 56 315,125$ 109,150$ 8 20 1 31 -1 252 052N_SHFF01A 260 100 56 310 40 1 56 315,125$ 109,150$ 8 20 1 31 -1 252 052N_TOFF02A 390 110 56 410 40 1 56 315,125$ 109,150$ 8 20 1 31 -1 252 052N_TOFF06A 390 110 56 420 40 1 56 315,125$ 109,150$ 8 20 1 31 -1 252 052N_TOFF01A 390 110 56 410 40 1 56 315,125$ 109,150$ 8 20 1 31 -1 252 052N_SHFF03A 260 125 56 300 40 1 56 315,125$ 109,150$ 8 20 1 31 -1 252 052N_TOFF05A 390 110 56 420 40 1 56 315,125$ 109,150$ 8 20 1 31 -1 252 052N_SH1202A 0 150 50 115 40 1 56 315,125$ 109,150$ 8 20 1 31 -1 252 052N_SH1204A 0 150 50 115 40 1 56 315,125$ 109,150$ 8 20 1 31 -1 252 052N_SH1122A 0 150 50 115 40 1 56 315,125$ 109,150$ 8 20 1 31 -1 252 052N_SH1110A 0 150 50 115 40 1 56 315,125$ 109,150$ 8 20 1 31 -1 2

Attachment B-3to Appendix B - Economic Analysis
Surf City - North Topsail BeachFeasibility Study page 27of 51
Reach ID USACE_ID REF lot front
Lot length Lot width
REF struc front
Struc length AA Ratio Flood
Curve
Replacement Value of Structure in Dollars
Value of Contents in Dollars
G_elev FF_elev Active Erosion Curve Armor Erosion
Indicator
52 052MISCHWY 350 40 200 36 34 1 64 21,169$ -$ 9.2 9.2 1 34 -1 0.552 052N_SHHWY 200 64 1000 215 34 1 64 105,868$ -$ 9.2 9.2 1 34 -1 0.552 052N_TOHWY 480 64 1000 500 34 1 64 105,868$ -$ 9.2 9.2 1 34 -1 0.5
-99953 053JONE0104A 320 100 56 359 30 1 55 75,044$ 26,800$ 6 13.9 1 31 -1 253 053N_SH1209A 200 100 59 264 45 1 59 112,006$ 40,000$ 9 15.7 1 31 -1 253 053N_SH1211A 200 100 59 258 40 1 55 84,005$ 30,000$ 9 15.6 1 31 -1 253 053N_SH1212A 0 140 111 106 30 1 55 62,724$ 22,400$ 14 16.1 1 28 -1 253 053N_SH1213A 200 100 59 253 45 1 55 107,526$ 38,400$ 9 16.1 1 31 -1 253 053N_SH1214A 0 140 111 106 30 1 55 90,277$ 32,240$ 16 17.4 1 28 -1 253 053N_SH1215A 200 100 59 239 55 1 55 203,852$ 72,800$ 9 15.9 1 31 -1 253 053N_SH1216A 0 110 111 96 55 1 59 302,417$ 108,000$ 16 15.6 1 1 -1 253 053N_SH1217A 200 100 59 234 40 1 59 134,408$ 48,000$ 9 16.1 1 31 -1 253 053N_SH1218A 0 110 111 97 35 1 59 156,809$ 56,000$ 14 16.8 1 19 -1 253 053N_SH1219A 200 100 59 227 40 1 60 77,284$ 27,600$ 9 14.9 1 31 -1 253 053N_SH1222A 0 140 111 120 30 1 60 166,890$ 59,600$ 12 18.1 1 22 -1 253 053N_SH1223A 200 100 59 219 45 1 2 140,008$ 50,000$ 9 14.5 1 31 -1 0.553 053N_SH1225A 200 100 59 214 55 1 59 190,411$ 68,000$ 9 16.8 1 31 -1 253 053N_SH1226A 0 140 111 103 30 1 55 156,809$ 56,000$ 14 16.1 1 28 -1 253 053N_SH1301A 200 100 59 225 35 1 59 84,005$ 30,000$ 8 15.9 1 31 -1 253 053N_SH1303A 200 100 59 207 35 1 59 126,567$ 45,200$ 7 16 1 31 -1 253 053N_SH1304A 0 140 111 61 30 1 55 78,404$ 28,000$ 6 18.1 1 29 -1 253 053N_SH1305A 200 100 59 204 35 1 60 145,608$ 52,000$ 7 17.1 1 31 -1 253 053N_SH1307A 200 100 59 199 40 1 59 100,806$ 36,000$ 7 16.5 1 31 -1 253 053N_SH1309A 200 100 59 193 40 1 59 95,205$ 34,000$ 7 17 1 31 -1 253 053N_SH1310A 0 130 111 50 35 1 55 156,809$ 56,000$ 6 17.1 1 29 -1 253 053N_SH1311A 200 100 59 188 45 1 55 95,205$ 34,000$ 7 14.7 1 31 -1 253 053N_SH1313A 200 100 59 182 40 1 59 145,608$ 52,000$ 7 16.9 1 31 -1 253 053N_SH1314A 0 130 111 46 40 1 55 201,611$ 72,000$ 6 15.7 1 29 -1 253 053N_SH1317A 200 100 59 169 40 1 59 112,006$ 40,000$ 7 16.8 1 31 -1 253 053N_SH1318P 0 130 0 77 20 1 1 11,201$ 4,000$ 11 17.2 1 31 -1 0.553 053N_TO1210A 320 110 56 392 45 1 2 208,332$ 74,400$ 9 14.7 1 31 -1 0.553 053N_TO1212A 320 110 56 383 45 1 2 179,210$ 64,000$ 9 14.9 1 31 -1 0.553 053N_TO1216A 320 110 56 363 55 1 59 146,728$ 52,400$ 9 14.8 1 31 -1 253 053N_TO1218A 320 110 56 370 40 1 2 168,010$ 60,000$ 9 6.6 1 31 -1 0.553 053N_TO1222A 320 110 56 354 45 1 60 302,417$ 108,000$ 8 18.5 1 31 -1 253 053N_TO1224A 320 110 56 351 30 1 60 302,417$ 108,000$ 8 17.1 1 31 -1 2

Attachment B-3to Appendix B - Economic Analysis
Surf City - North Topsail BeachFeasibility Study page 28of 51
Reach ID USACE_ID REF lot front
Lot length Lot width
REF struc front
Struc length AA Ratio Flood
Curve
Replacement Value of Structure in Dollars
Value of Contents in Dollars
G_elev FF_elev Active Erosion Curve Armor Erosion
Indicator
53 053N_TO1226A 320 110 56 337 30 1 60 246,414$ 88,000$ 8 16.5 1 31 -1 253 053N_TO1306A 320 100 56 326 40 1 60 257,615$ 92,000$ 6 17 1 31 -1 253 053N_TO1308A 320 100 56 320 40 1 2 324,819$ 116,000$ 6 15.1 1 31 -1 0.553 053N_TO1310A 320 100 56 302 40 1 59 134,408$ 48,000$ 6 16.1 1 31 -1 253 053N_TO1312A 320 100 56 303 30 1 59 77,284$ 27,600$ 7 16.2 1 31 -1 253 053N_TO1314A 320 100 56 297 40 1 59 145,608$ 52,000$ 7 16.7 1 31 -1 253 053N_TO1316A 320 100 56 300 50 1 55 106,406$ 38,000$ 6 15.7 1 31 -1 253 053N_TO1320A 320 100 56 280 35 1 59 81,765$ 29,200$ 7 16 1 31 -1 253 053N_TOFF01A 320 100 56 300 40 1 56 315,125$ 109,150$ 9 21 1 31 -1 253 053N_TOFF03A 320 100 56 360 40 1 56 315,125$ 109,150$ 9 21 1 31 -1 253 053N_SHFF01A 200 90 59 190 40 1 56 315,125$ 109,150$ 9 21 1 31 -1 253 053N_TOFF02A 320 100 56 335 40 1 56 315,125$ 109,150$ 9 21 1 31 -1 253 053N_TOHWY 460 64 1000 475 34 1 64 105,868$ -$ 6.9 6.9 1 34 -1 0.553 053N_SHHWY 180 64 1000 195 34 1 64 105,868$ -$ 6.9 6.9 1 34 -1 0.5
-99954 054EASY1506A 300 90 59 336 30 1 60 212,812$ 76,000$ 8 15.8 1 31 -1 254 054LENO0103A 300 100 59 273 40 1 59 113,001$ 40,355$ 7 16 1 31 -1 254 054N_SH1319A 190 90 71 169 40 1 59 201,611$ 72,000$ 7 16.7 1 31 -1 254 054N_SH1401A 190 90 71 201 30 1 59 100,806$ 36,000$ 9 17.3 1 31 -1 254 054N_SH1409A 190 90 71 198 45 1 55 88,485$ 31,600$ 10 18.7 1 31 -1 254 054N_SH1411A 190 90 71 208 25 1 60 257,615$ 92,000$ 9 21.1 1 31 -1 254 054N_SH1413A 190 90 71 204 40 1 59 77,284$ 27,600$ 9 19.3 1 31 -1 254 054N_SH1417A 190 90 71 205 35 1 59 84,005$ 30,000$ 8 18.5 1 31 -1 254 054N_SH1419A 190 90 71 197 50 1 59 132,168$ 47,200$ 8 16.4 1 31 -1 254 054N_SH1420A 0 125 500 82 35 1 59 119,847$ 42,800$ 11 17.5 1 20 -1 254 054N_SH1421A 190 90 71 205 40 1 60 209,452$ 74,800$ 8 18.9 1 31 -1 254 054N_SH1422A 0 125 500 77 35 1 55 150,089$ 53,600$ 12 17.1 1 28 -1 0.554 054N_SH1501A 190 90 71 213 35 1 59 77,284$ 27,600$ 8 17.7 1 31 -1 254 054N_SH1503A 190 90 71 212 40 1 60 380,822$ 136,000$ 9 17.9 1 31 -1 254 054N_TO1402A 300 85 59 302 35 1 2 100,806$ 36,000$ 7 16.1 1 31 -1 0.554 054N_TO1404A 300 85 59 309 30 1 60 197,131$ 70,400$ 8 19.4 1 31 -1 254 054N_TO1406A 300 85 59 311 30 1 60 89,605$ 32,000$ 8 16.7 1 31 -1 254 054N_TO1408A 300 85 59 309 35 1 2 100,806$ 36,000$ 7 8.7 1 31 -1 0.554 054N_TO1410A 300 85 59 312 40 1 2 179,210$ 64,000$ 8 8.7 1 31 -1 0.554 054N_TO1412A 300 85 59 302 35 1 55 212,812$ 76,000$ 9 20.6 1 31 -1 254 054N_TO1416A 300 85 59 292 40 1 55 89,605$ 32,000$ 9 17.1 1 31 -1 254 054N_TO1418A 300 85 59 305 35 1 59 112,006$ 40,000$ 9 18.3 1 31 -1 2

Attachment B-3to Appendix B - Economic Analysis
Surf City - North Topsail BeachFeasibility Study page 29of 51
Reach ID USACE_ID REF lot front
Lot length Lot width
REF struc front
Struc length AA Ratio Flood
Curve
Replacement Value of Structure in Dollars
Value of Contents in Dollars
G_elev FF_elev Active Erosion Curve Armor Erosion
Indicator
54 054N_TO1420A 300 85 59 305 25 1 60 222,893$ 79,600$ 8 19.3 1 31 -1 254 054PEND0201A 300 80 59 297 45 1 2 113,001$ 40,355$ 8 16.2 1 31 -1 0.554 054N_SHFF04A 0 90 71 210 40 1 56 315,125$ 109,150$ 9 21 1 24 -1 254 054N_TOFF04A 300 80 59 320 40 1 56 315,125$ 109,150$ 9 21 1 31 -1 254 054N_SHFF01A 0 80 71 210 40 1 56 315,125$ 109,150$ 9 21 1 24 -1 254 054N_TOFF03A 300 80 59 320 40 1 56 315,125$ 109,150$ 9 21 1 31 -1 254 054N_SHFF02A 0 80 71 210 40 1 56 315,125$ 109,150$ 9 21 1 24 -1 254 054N_SHFF03A 0 90 71 210 40 1 56 315,125$ 109,150$ 9 21 1 24 -1 254 054N_TOFF05A 300 80 59 310 40 1 56 315,125$ 109,150$ 9 21 1 31 -1 254 054EASYFF01A 300 90 59 330 40 1 56 315,125$ 109,150$ 9 21 1 31 -1 254 054EASYFF02A 300 90 59 340 40 1 56 315,125$ 109,150$ 9 21 1 31 -1 254 054N_TOHWY 380 64 1000 375 34 1 64 105,868$ -$ 8.3 8.3 1 34 -1 0.554 054N_SHHWY 120 64 1000 135 34 1 64 105,868$ -$ 8.3 8.3 1 34 -1 0.5
-99955 055EASY1512A 315 90 78 324 50 1 49 179,210$ 64,000$ 8 16.3 1 31 -1 255 055EASY1514A 315 90 78 329 35 1 59 134,408$ 48,000$ 9 16.2 1 31 -1 255 055EASY1516A 315 90 78 328 35 1 59 134,408$ 48,000$ 9 15.9 1 31 -1 255 055EASY1518A 315 90 56 314 50 1 2 207,212$ 74,000$ 9 16 1 31 -1 0.555 055N_NE1702A 375 100 76 446 60 1 38 113,001$ 167,474$ 9 10 1 31 -1 0.555 055N_NE1702S 375 140 76 467 30 1 38 113,001$ 40,355$ 9 8.4 1 31 -1 0.555 055N_NE1708S 0 0 0 397 40 1 59 113,001$ 40,355$ 10 8.5 1 31 -1 255 055N_NE1708A 375 140 76 444 40 1 1 113,001$ 40,355$ 9 7.4 1 31 -1 0.555 055N_NE1712A 375 140 76 434 40 1 59 113,001$ 40,355$ 9 14.7 1 31 -1 255 055N_NE1710A 375 140 76 439 45 1 59 113,001$ 40,355$ 9 15.2 1 31 -1 255 055N_SH1701A 0 125 70 135 40 1 56 315,125$ 109,150$ 9 21 1 31 -1 255 055N_SH1703A 0 125 70 135 40 1 56 315,125$ 109,150$ 9 21 1 31 -1 255 055N_SH1705A 0 125 70 135 40 1 56 315,125$ 109,150$ 9 21 1 31 -1 255 055N_SH1505A 0 100 78 220 35 1 60 204,972$ 73,200$ 9 21.8 1 31 -1 255 055N_SH1507A 0 100 78 232 45 1 59 100,806$ 36,000$ 9 17.3 1 31 -1 255 055N_SH1511A 0 100 78 222 45 1 59 190,411$ 68,000$ 9 16.8 1 31 -1 255 055N_SH1513A 0 100 78 219 25 1 59 134,408$ 48,000$ 9 16.9 1 31 -1 255 055N_SH1515A 0 100 78 224 40 1 59 336,019$ 120,000$ 9 18 1 31 -1 255 055N_SH1601A 0 60 78 219 30 1 60 145,608$ 52,000$ 9 19.1 1 31 -1 255 055N_SH1603A 0 100 78 202 40 1 55 89,605$ 32,000$ 9 16.7 1 31 -1 255 055N_SH1707A 0 140 63 276 30 1 55 67,204$ 24,000$ 10 15.9 1 31 -1 255 055N_SH1709A 0 140 63 272 40 1 59 113,001$ 40,355$ 10 19.7 1 31 -1 255 055N_SH1711A 0 140 63 265 45 1 59 113,001$ 40,355$ 9 19.1 1 31 -1 2

Attachment B-3to Appendix B - Economic Analysis
Surf City - North Topsail BeachFeasibility Study page 30of 51
Reach ID USACE_ID REF lot front
Lot length Lot width
REF struc front
Struc length AA Ratio Flood
Curve
Replacement Value of Structure in Dollars
Value of Contents in Dollars
G_elev FF_elev Active Erosion Curve Armor Erosion
Indicator
55 055NEPT0106A 315 45 100 314 25 1 59 190,411$ 68,000$ 9 18.9 1 31 -1 255 055NEPTFF01A 365 50 100 360 40 1 56 315,125$ 109,150$ 9 21 1 31 -1 255 055EASYFF01A 315 90 78 330 40 1 56 315,125$ 109,150$ 9 21 1 31 -1 255 055EASYFF02A 315 90 78 340 40 1 56 315,125$ 109,150$ 9 21 1 31 -1 255 055BROAFF01A 315 100 78 330 40 1 56 315,125$ 109,150$ 9 21 1 31 -1 255 055N_SHFF04A 0 100 78 225 40 1 56 315,125$ 109,150$ 9 21 1 29 -1 255 055N_SH1701A 0 190 63 300 40 1 56 244,300$ 73,200$ 9 21 1 29 -1 255 055N_SH1703A 0 190 63 280 40 1 56 244,300$ 73,200$ 9 21 1 29 -1 255 055N_SH1705A 0 190 63 320 40 1 56 244,300$ 73,200$ 9 21 1 29 -1 255 055N_SH1707A 0 190 63 320 40 1 56 244,300$ 73,200$ 9 21 1 29 -1 255 055N_SHHWY 130 64 1000 145 34 1 64 105,868$ -$ 8.7 8.7 1 34 -1 0.5
-99956 056N_NE1714A 380 130 59 446 40 1 59 113,001$ 40,355$ 9 15.7 1 31 -1 256 056N_NE1718A 380 130 59 439 40 1 59 113,001$ 40,355$ 9 16.4 1 31 -1 256 056N_NE1720A 380 130 59 421 45 1 2 113,001$ 40,355$ 8 7 1 31 -1 0.556 056N_NE1802A 380 130 59 438 30 1 55 113,001$ 40,355$ 9 14.9 1 31 -1 256 056N_NE1804A 380 130 59 417 30 1 55 113,001$ 40,355$ 8 17.9 1 31 -1 256 056N_NE1806A 380 130 59 423 40 1 59 113,001$ 40,355$ 9 18.6 1 31 -1 256 056N_NE1810A 380 130 59 412 40 1 59 113,001$ 40,355$ 9 16.3 1 31 -1 256 056N_NE1812A 380 130 59 413 50 1 59 113,001$ 40,355$ 9 17.3 1 31 -1 256 056N_NE1814A 380 130 59 413 45 1 2 113,001$ 40,355$ 9 15.3 1 31 -1 0.556 056N_NE1816A 380 130 59 430 35 1 60 113,001$ 40,355$ 9 17.7 1 31 -1 256 056N_NE1818A 380 130 59 421 40 1 59 113,001$ 40,355$ 9 14.9 1 31 -1 256 056N_NE1820A 380 130 59 411 45 1 59 113,001$ 40,355$ 8 14.8 1 31 -1 256 056N_NE1822A 380 130 59 404 40 1 60 113,001$ 40,355$ 8 15.4 1 31 -1 256 056N_NE1824A 380 150 59 394 55 1 55 113,001$ 40,355$ 9 15.8 1 31 -1 256 056N_SH1713A 245 130 59 260 60 1 59 113,001$ 40,355$ 9 17 1 31 -1 256 056N_SH1714A 0 130 500 96 40 1 55 113,001$ 40,355$ 11 17.6 1 30 -1 256 056N_SH1717A 245 130 59 269 35 1 59 113,001$ 40,355$ 9 17.1 1 31 -1 256 056N_SH1719A 245 130 59 268 45 1 59 113,001$ 40,355$ 9 16.5 1 31 -1 256 056N_SH1801A 245 130 59 266 35 1 59 113,001$ 40,355$ 9 15.5 1 31 -1 256 056N_SH1804A 0 130 500 128 40 1 55 113,001$ 40,355$ 12 19.1 1 30 -1 0.556 056N_SH1805A 245 130 59 275 35 1 60 113,001$ 40,355$ 9 18.7 1 31 -1 256 056N_SH1807A 245 130 59 315 35 1 60 113,001$ 40,355$ 9 16.7 1 31 -1 256 056N_SH1809A 245 130 59 281 30 1 59 113,001$ 40,355$ 9 16.7 1 31 -1 256 056N_SH1811A 245 130 59 268 45 1 59 113,001$ 40,355$ 9 16.6 1 31 -1 256 056N_SH1813A 245 130 59 269 40 1 59 113,001$ 40,355$ 9 15.3 1 31 -1 2

Attachment B-3to Appendix B - Economic Analysis
Surf City - North Topsail BeachFeasibility Study page 31of 51
Reach ID USACE_ID REF lot front
Lot length Lot width
REF struc front
Struc length AA Ratio Flood
Curve
Replacement Value of Structure in Dollars
Value of Contents in Dollars
G_elev FF_elev Active Erosion Curve Armor Erosion
Indicator
56 056N_SH1815A 245 130 59 267 40 1 60 113,001$ 40,355$ 9 17.3 1 31 -1 256 056N_SH1817A 245 130 59 263 45 1 60 113,001$ 40,355$ 9 17.4 1 31 -1 256 056N_SH1819A 245 130 59 284 50 1 55 113,001$ 40,355$ 10 20.9 1 31 -1 256 056N_SH1821A 245 130 59 277 40 1 60 113,001$ 40,355$ 11 22 1 31 -1 256 056N_SH1825A 245 130 59 267 40 1 59 113,001$ 40,355$ 9 16.4 1 31 -1 256 056N_SHFF03A 0 140 59 290 40 1 56 315,125$ 109,150$ 9 21 1 31 -1 256 056N_NEFF03A 380 135 59 430 40 1 56 315,125$ 109,150$ 9 21 1 31 -1 256 056N_NEFF02A 380 130 59 415 40 1 56 315,125$ 109,150$ 9 21 1 31 -1 256 056N_SHFF02A 245 130 59 280 40 1 56 315,125$ 109,150$ 9 21 1 31 -1 256 056N_NEFF01A 0 100 59 270 40 1 56 315,125$ 109,150$ 9 21 1 24 -1 256 056N_SHFF01A 245 120 59 415 40 1 60 315,125$ 109,150$ 9 21 1 31 -1 256 056N_SHHWY 180 64 1000 195 34 1 64 105,868$ -$ 7.5 7.5 1 34 -1 0.5
-99957 057N_NE1902A 360 120 59 399 40 1 59 113,001$ 40,355$ 9 16 1 31 -1 257 057N_NE1904A 360 120 59 397 40 1 55 113,001$ 40,355$ 9 16.6 1 31 -1 257 057N_NE1906A 360 120 59 403 45 1 59 113,001$ 40,355$ 9 16.4 1 31 -1 257 057N_NE1908A 360 120 59 404 45 1 59 113,001$ 40,355$ 9 15.9 1 31 -1 257 057N_NE1914A 360 120 59 388 45 1 59 113,001$ 40,355$ 9 15.9 1 31 -1 257 057N_NE1916A 360 120 59 377 55 1 59 113,001$ 40,355$ 9 15.7 1 31 -1 257 057N_NE1918A 360 120 59 382 50 1 59 113,001$ 40,355$ 9 16.1 1 31 -1 257 057N_NE1920A 360 120 59 375 50 1 59 113,001$ 40,355$ 9 16.1 1 31 -1 257 057N_NE1922A 360 120 59 389 40 1 59 113,001$ 40,355$ 9 15.5 1 31 -1 257 057N_NE2002A 360 110 59 389 40 1 2 113,001$ 40,355$ 9 7.9 1 31 -1 0.557 057N_NE2008A 360 110 59 382 40 1 2 113,001$ 40,355$ 9 15.5 1 31 -1 0.557 057N_NE2010A 360 110 59 386 40 1 59 113,001$ 40,355$ 9 7.8 1 31 -1 257 057N_NE2012A 360 110 59 381 40 1 2 113,001$ 40,355$ 9 17 1 31 -1 0.557 057N_SH1901A 0 120 59 275 45 1 59 113,001$ 40,355$ 9 16.4 1 31 -1 257 057N_SH1903A 0 120 59 271 30 1 59 113,001$ 40,355$ 9 17.8 1 31 -1 257 057N_SH1905A 0 120 59 263 50 1 59 113,001$ 40,355$ 9 15.4 1 31 -1 257 057N_SH1907A 0 120 59 269 45 1 59 113,001$ 40,355$ 9 18.9 1 31 -1 257 057N_SH1909A 0 120 59 264 45 1 59 113,001$ 40,355$ 9 16 1 31 -1 257 057N_SH1911A 0 120 59 264 55 1 59 113,001$ 40,355$ 9 15.7 1 31 -1 257 057N_SH1913A 0 120 59 266 45 1 55 113,001$ 40,355$ 9 15.5 1 31 -1 257 057N_SH1915A 0 120 59 266 45 1 59 113,001$ 40,355$ 9 15.7 1 31 -1 257 057N_SH1917A 0 120 59 269 40 1 59 113,001$ 40,355$ 9 15.9 1 31 -1 257 057N_SH1919A 0 120 59 271 40 1 59 113,001$ 40,355$ 9 16.6 1 31 -1 257 057N_SH2001A 245 120 59 266 35 1 55 113,001$ 40,355$ 9 16.7 1 31 -1 2

Attachment B-3to Appendix B - Economic Analysis
Surf City - North Topsail BeachFeasibility Study page 32of 51
Reach ID USACE_ID REF lot front
Lot length Lot width
REF struc front
Struc length AA Ratio Flood
Curve
Replacement Value of Structure in Dollars
Value of Contents in Dollars
G_elev FF_elev Active Erosion Curve Armor Erosion
Indicator
57 057N_SH2003A 245 110 59 276 30 1 55 113,001$ 40,355$ 9 16.5 1 31 -1 257 057N_SH2004A 0 135 200 117 30 1 56 113,001$ 40,355$ 13 17.9 1 28 -1 0.557 057N_SH2005A 245 110 59 277 30 1 59 113,001$ 40,355$ 9 18.9 1 31 -1 257 057N_SH2006A 0 135 200 123 30 1 60 113,001$ 40,355$ 13 17.5 1 22 -1 0.557 057N_SH2007A 245 110 59 274 25 1 60 113,001$ 40,355$ 10 18.8 1 31 -1 257 057N_SH2008A 0 135 200 123 30 1 60 113,001$ 40,355$ 13 17.7 1 22 -1 0.557 057N_SH2009A 245 110 59 267 25 1 60 113,001$ 40,355$ 9 16.5 1 31 -1 257 057N_SH2010A 0 135 200 120 25 1 55 113,001$ 40,355$ 16 17 1 28 -1 0.557 057N_SH2011A 245 110 59 271 35 1 59 113,001$ 40,355$ 9 16.8 1 31 -1 257 057N_SH2012A 0 135 200 117 30 1 56 113,001$ 40,355$ 16 19.2 1 28 -1 0.558 058N_SH2014A 0 135 200 120 25 1 56 315,125$ 40,355$ 9 21 1 30 -1 257 057N_SHFF01A 0 110 59 270 40 1 56 315,125$ 109,150$ 9 21 1 24 -1 257 057N_NEFF03A 360 110 59 400 40 1 56 315,125$ 109,150$ 9 21 1 31 -1 257 057N_NEFF02A 360 110 59 390 40 1 56 315,125$ 109,150$ 9 21 1 31 -1 257 057N_NEFF04A 360 110 59 400 40 1 56 315,125$ 109,150$ 9 21 1 31 -1 257 057N_NEFF01A 360 110 59 390 40 1 56 315,125$ 109,150$ 9 21 1 31 -1 257 057N_SHHWY 180 64 1000 180 34 1 64 113,001$ -$ 6.6 6.6 1 34 -1 0.5
-99958 058E_NI9001A 375 50 140 390 30 1 60 113,001$ 40,355$ 9 16.6 1 31 -1 258 058E_NI9002A 330 125 95 307 185 1 38 168,010$ 60,000$ 8 9.5 1 31 -1 258 058E_NI9005A 300 50 140 304 40 1 60 113,001$ 40,355$ 9 17.1 1 31 -1 258 058N_NE2016A 350 100 54 380 35 1 60 113,001$ 40,355$ 8 16.1 1 31 -1 258 058N_NE2018A 350 110 54 382 35 1 59 113,001$ 40,355$ 9 18.2 1 31 -1 258 058N_NE2108A 0 120 225 322 30 1 33 280,016$ 100,000$ 8 9.4 1 31 -1 258 058N_NE2112A 330 120 42 352 55 1 38 168,010$ 60,000$ 8 8.2 1 31 -1 258 058N_SH2013A 230 110 50 261 35 1 60 113,001$ 40,355$ 9 16.8 1 31 -1 258 058N_SH2014A 0 120 530 123 30 1 56 113,001$ 40,355$ 15 19.9 1 28 -1 0.558 058N_SH2015A 230 130 50 250 40 1 59 113,001$ 40,355$ 9 18.1 1 31 -1 258 058N_SH2017A 200 150 80 233 35 1 59 113,001$ 40,355$ 10 15.9 1 31 -1 258 058N_SH2020A 0 120 140 73 45 1 59 113,001$ 40,355$ 10 18.4 1 21 -1 258 058N_SH2021A 230 100 125 211 40 1 35 113,001$ 40,355$ 10 10.9 1 31 -1 258 058N_SH2111A 0 120 73 223 55 1 35 113,001$ 40,355$ 9 7.6 1 31 -1 258 058N_SHFF04A 200 120 73 230 40 1 56 315,125$ 109,150$ 8 20 1 24 -1 258 058N_SHFF03A 200 120 73 230 40 1 56 315,125$ 109,150$ 8 20 1 24 -1 258 058N_SHFF02A 200 120 73 225 40 1 56 315,125$ 109,150$ 8 20 1 24 -1 258 058N_NEFF01A 350 120 54 380 40 1 56 315,125$ 109,150$ 8 20 1 31 -1 258 058N_SHFF01A 200 120 73 240 40 1 56 315,125$ 109,150$ 8 20 1 24 -1 2

Attachment B-3to Appendix B - Economic Analysis
Surf City - North Topsail BeachFeasibility Study page 33of 51
Reach ID USACE_ID REF lot front
Lot length Lot width
REF struc front
Struc length AA Ratio Flood
Curve
Replacement Value of Structure in Dollars
Value of Contents in Dollars
G_elev FF_elev Active Erosion Curve Armor Erosion
Indicator
58 058N_SHHWY1 170 64 150 185 34 1 64 15,883$ -$ 10.1 10.1 1 34 -1 0.558 058N_SHHWY2 120 64 500 135 34 1 64 52,934$ -$ 10.1 10.1 1 34 -1 0.558 058ISLAFF01A 0 412 60 110 40 1 56 315,125$ 94,537$ 11 23 1 31 -1 258 058ISLAFF02A 0 412 60 110 40 1 56 315,125$ 94,537$ 11 23 1 31 -1 258 058ISLAFF03A 0 412 60 200 40 1 56 315,125$ 94,537$ 11 23 1 31 -1 258 058ISLAFF04A 0 412 60 205 40 1 56 315,125$ 94,537$ 11 23 1 31 -1 258 058ISLAFF05A 0 412 60 200 40 1 56 315,125$ 94,537$ 11 23 1 31 -1 258 058S_SHHWY 137 64 827 152 34 1 64 87,555$ -$ 10.12 10.12 1 34 -1 0.5
-99959 059ISLAFF01A 0 420 88 195 40 1 56 315,125$ 94,537$ 8 20 1 31 -1 259 059ISLAFF02A 0 420 88 200 40 1 56 315,125$ 94,537$ 8 20 1 31 -1 259 059ISLAFF03A 0 420 88 190 40 1 56 315,125$ 94,537$ 8 20 1 31 -1 259 059ISLAFF04A 0 420 88 185 40 1 56 315,125$ 94,537$ 8 20 1 31 -1 259 059ISLAFF06A 216 115 130 240 40 1 56 315,125$ 94,537$ 8 20 1 31 -1 259 059ISLAFF07A 332 106 108 370 40 1 56 315,125$ 94,537$ 8 20 1 31 -1 259 059ISLAFF08A 216 115 130 235 40 1 56 315,125$ 94,537$ 8 20 1 31 -1 259 059ISLAFF09A 332 106 108 375 40 1 56 315,125$ 94,537$ 8 20 1 31 -1 259 059ISLAFF10A 216 115 130 235 40 1 56 315,125$ 94,537$ 8 20 1 31 -1 259 059ISLAFF11A 332 106 108 370 40 1 56 315,125$ 94,537$ 8 20 1 31 -1 259 059ISLAFF12A 216 115 130 240 40 1 56 315,125$ 94,537$ 8 20 1 31 -1 259 059ISLAFF13A 332 106 108 375 40 1 56 315,125$ 94,537$ 8 20 1 31 -1 259 059ISLAFF14A 332 106 108 375 40 1 56 315,125$ 94,537$ 8 20 1 31 -1 259 059SEA_0196A 0 181 108 105 36 1 56 134,679$ 36,073$ 8.1 20.6 1 30 -1 259 059SEA_0198A 0 181 108 105 36 1 56 134,679$ 36,073$ 8.4 20.4 1 31 -1 259 059SEA_0200A 0 181 108 108 36 1 56 134,679$ 36,073$ 8.5 20.8 1 30 -1 259 059SEA_0202A 0 181 108 110 36 1 56 134,679$ 36,073$ 8.1 20.6 1 30 -1 259 059SEA_0206A 0 181 108 96 40 1 59 65,229$ 17,471$ 7.8 20.7 1 21 -1 259 059SEA_0209A 216 115 130 266 31 1 60 213,668$ 57,229$ 6.1 13.2 1 31 -1 259 059SEA_0210A 0 181 108 99 44 1 59 80,711$ 21,618$ 0 17.8 1 12 -1 259 059SEA_FF0215 A 332 106 108 280 40 1 60 315,125$ 94,537$ 7.6 19.2 1 31 -1 259 059S_SHHWY 182 64 535 197 34 1 64 56,642$ -$ 4.21 4.21 1 34 -1 0.5
-99960 060ISLA2372A 353 95 73 368 32 1 59 49,340$ 13,215$ 6.5 18.5 1 31 -1 260 060ISLA2376A 353 95 73 403 32 1 60 93,353$ 25,004$ 6.5 16 1 31 -1 260 060ISLAFF01A 353 95 73 395 40 1 56 315,125$ 94,537$ 6.5 18.5 1 31 -1 260 060SEA_0219A 244 186 87 289 40 1 59 71,162$ 19,060$ 7.4 17 1 31 -1 260 060SEA_0220A 0 179 83 115 40 1 2 98,912$ 26,493$ 10.4 19.5 1 31 -1 0.5

Attachment B-3to Appendix B - Economic Analysis
Surf City - North Topsail BeachFeasibility Study page 34of 51
Reach ID USACE_ID REF lot front
Lot length Lot width
REF struc front
Struc length AA Ratio Flood
Curve
Replacement Value of Structure in Dollars
Value of Contents in Dollars
G_elev FF_elev Active Erosion Curve Armor Erosion
Indicator
60 060SEA_0224A 0 179 83 110 46 1 60 127,001$ 34,016$ 7.4 16 1 6 -1 260 060SEA_0225A 244 186 87 316 61 1 2 90,808$ 24,322$ 7.6 16.2 1 31 -1 0.560 060SEA_0231A 244 186 87 286 43 1 60 213,831$ 57,273$ 7 17.5 1 31 -1 260 060SEA_0231G 0 0 0 406 43 1 60 213,831$ 57,273$ 6.5 18.5 1 31 -1 260 060SEA_0232A 0 179 83 136 30 1 59 100,949$ 27,039$ 7.3 17.3 1 2 -1 260 060SEA_0236A 0 179 83 107 40 1 59 69,977$ 18,743$ 7.8 17.4 1 12 -1 260 060SEA_0237A 244 186 87 288 33 1 2 251,047$ 67,241$ 7.2 15.8 1 31 -1 0.560 060SEA_0242A 0 179 83 107 40 1 59 70,842$ 18,975$ 9 18 1 21 -1 260 060SEA_0243A 244 186 87 287 33 1 60 434,701$ 116,431$ 7.2 16.2 1 31 -1 260 060SEA_0248A 0 179 83 105 40 1 59 58,053$ 15,549$ 8.5 17.8 1 20 -1 260 060SEA_0252A 0 179 83 107 40 1 59 97,105$ 26,009$ 7.4 16.9 1 3 -1 260 060SEA_0253A 244 186 87 284 34 1 60 277,398$ 74,299$ 7.8 21.3 1 31 -1 260 060SEA_0256A 0 179 83 107 46 1 59 128,056$ 34,299$ 8.5 17.8 1 3 -1 260 060SEA_0266A 0 179 83 121 32 1 60 201,678$ 54,018$ 6.5 18.5 1 6 -1 260 060SEA_0274A 0 179 83 106 46 1 59 40,778$ 10,922$ 11.7 17.7 1 20 -1 260 060SEA_0283A 260 93 73 277 32 1 59 135,946$ 36,412$ 8 17.1 1 31 -1 260 060SEA_0284A 0 179 83 45 40 1 56 315,125$ 94,537$ 8 20 1 31 -1 260 060SEA_0292A 0 179 83 45 40 1 56 315,125$ 94,537$ 8 20 1 31 -1 260 060SEA_0288A 0 179 83 123 24 1 60 125,464$ 33,605$ 11.2 12.2 1 15 -1 260 060SEA_0296A 0 179 83 110 52 1 59 101,059$ 27,068$ 6.7 17.7 1 3 -1 260 060SEA_FF02A 260 93 73 285 40 1 56 315,125$ 94,537$ 6.5 18.5 1 31 -1 260 060SEA_FF03A 260 93 73 285 40 1 56 315,125$ 94,537$ 6.5 18.5 1 31 -1 260 060WICK2006A 244 186 87 268 50 1 60 212,775$ 56,990$ 6.5 18.5 1 31 -1 260 060WICK2006X 244 186 87 352 50 1 60 226,728$ 60,727$ 6.5 18.5 1 31 -1 260 060WICK2006Y 244 186 87 281 45 1 60 221,765$ 59,398$ 6.5 18.5 1 31 -1 260 060S_SHHWY 200 64 1000 215 34 1 64 105,868$ -$ 6.95 6.95 1 34 -1 0.5
-99961 061ISLA2398A 338 113 78 391 40 1 1 48,848$ 13,083$ 7 19 1 31 -1 0.561 061ISLA2414A 338 113 78 399 26 1 59 44,616$ 11,950$ 7 19 1 31 -1 261 061ISLA2416A 338 113 78 388 26 1 60 169,400$ 45,372$ 7.2 18.2 1 31 -1 261 061ISLA2422A 248 113 78 385 40 1 60 230,235$ 61,667$ 9 15 1 15 -1 261 061ISLA2426A 338 113 78 363 42 1 55 91,672$ 24,553$ 7 19 1 31 -1 261 061ISLA2430A 248 214 220 279 60 1 62 45,085$ 12,075$ 7 19 1 31 -1 261 061ISLAFF01A 248 113 78 385 40 1 56 315,125$ 94,537$ 7 19 1 31 -1 261 061ISLAFF02A 248 113 78 385 40 1 56 315,125$ 94,537$ 7 19 1 31 -1 261 061ISLAFF03A 248 113 78 385 40 1 56 315,125$ 94,537$ 7 19 1 31 -1 261 061ISLAFF04A 248 113 78 390 40 1 56 315,125$ 94,537$ 7 19 1 31 -1 2

Attachment B-3to Appendix B - Economic Analysis
Surf City - North Topsail BeachFeasibility Study page 35of 51
Reach ID USACE_ID REF lot front
Lot length Lot width
REF struc front
Struc length AA Ratio Flood
Curve
Replacement Value of Structure in Dollars
Value of Contents in Dollars
G_elev FF_elev Active Erosion Curve Armor Erosion
Indicator
61 061ISLAFF05A 248 113 78 390 40 1 56 315,125$ 94,537$ 7 19 1 31 -1 261 061SEA_0299A 248 90 78 273 32 1 59 46,053$ 12,335$ 8.4 16.3 1 31 -1 261 061SEA_0300A 0 188 100 96 40 1 59 87,842$ 23,528$ 7 15.5 1 11 -1 261 061SEA_0303A 248 90 78 284 20 1 59 50,417$ 13,504$ 8.7 14.2 1 31 -1 261 061SEA_0304A 0 188 100 99 42 1 59 70,062$ 18,766$ 6.9 15.4 1 20 -1 261 061SEA_0307A 248 90 78 259 28 1 60 86,756$ 23,237$ 8.5 17.2 1 31 -1 261 061SEA_0310A 0 188 100 110 51 1 60 171,878$ 46,036$ 8.6 17.4 1 6 -1 261 061SEA_0311A 248 90 78 265 30 1 60 113,001$ 30,266$ 9.3 18.6 1 31 -1 261 061SEA_0315A 248 90 78 265 25 1 59 47,465$ 12,713$ 7 19 1 31 -1 261 061SEA_0316A 0 188 100 118 28 1 60 229,593$ 61,494$ 8.6 17.2 1 24 -1 261 061SEA_0319A 248 90 78 276 38 1 60 130,142$ 34,858$ 8.7 19.2 1 31 -1 261 061SEA_0326A 0 188 100 119 30 1 59 66,608$ 17,841$ 7 16.8 1 2 -1 261 061SEA_0330A 0 75 100 60 40 1 56 315,125$ 94,537$ 8 20 1 31 -1 261 061SEA_0331A 248 90 78 268 54 1 59 122,365$ 32,774$ 7.5 17.3 1 31 -1 261 061SEA_0333A 248 90 78 269 45 1 59 182,371$ 48,847$ 7.7 19 1 31 -1 261 061SEA_0335A 248 90 78 260 36 1 59 53,727$ 14,390$ 6.4 7.5 1 31 -1 261 061SEA_0338A 0 188 100 125 34 1 60 188,609$ 50,517$ 8.9 21.4 1 14 -1 261 061SEA_0339A 248 90 78 278 56 1 59 162,515$ 43,528$ 6.6 13.8 1 31 -1 261 061SEA_0342A 0 188 100 137 26 1 60 100,909$ 27,028$ 6.8 19.3 1 24 -1 261 061SEA_0346A 0 188 100 123 34 1 60 202,169$ 54,149$ 6.8 19.8 1 6 -1 261 061SEA_0350A 0 188 100 124 21 1 56 103,748$ 27,788$ 6.9 19.9 1 29 -1 261 061SEA_0354A 0 188 100 125 24 1 56 117,487$ 31,468$ 6.7 19.7 1 29 -1 261 061S_SHHWY 193 64 655 208 34 1 64 69,343$ -$ 6.57 6.57 1 34 -1 0.5
-99962 062S_PE0100A 350 138 67 399 36 1 2 241,885$ 64,787$ 8.4 16.1 1 31 -1 0.562 062S_PE0101A 0 155 143 159 60 1 25 113,001$ 30,266$ 10 22 1 31 -1 262 062S_PE0102A 350 138 67 388 26 1 60 200,663$ 53,746$ 8.3 18.3 1 31 -1 262 062S_PE0103A 0 155 143 154 38 1 60 378,255$ 101,312$ 9.8 18.6 1 5 -1 262 062S_PE0104A 350 138 67 387 34 1 60 195,295$ 52,308$ 8.5 17.5 1 31 -1 262 062S_PE0106A 350 138 67 414 24 1 60 151,900$ 40,685$ 10 22 1 31 -1 262 062S_PE0107A 0 155 143 151 32 1 60 238,399$ 63,853$ 10.6 20.5 1 6 -1 262 062S_PE0108A 350 138 67 401 28 1 60 160,221$ 42,914$ 10 22 1 31 -1 262 062S_PE0109A 157 76 91 265 25 1 60 1,044$ 280$ 11 20.1 1 31 -1 262 062S_PE0112A 350 138 67 380 35 1 60 202,416$ 54,215$ 10.1 19.4 1 31 -1 262 062S_PE0113A 157 76 91 240 42 1 60 380,769$ 101,986$ 9.8 18.9 1 31 -1 262 062S_PE0114A 350 138 67 374 45 1 60 258,394$ 69,209$ 10.3 19.8 1 31 -1 262 062S_PE0115A 0 155 143 158 36 1 60 188,065$ 50,372$ 11.6 20 1 15 -1 2

Attachment B-3to Appendix B - Economic Analysis
Surf City - North Topsail BeachFeasibility Study page 36of 51
Reach ID USACE_ID REF lot front
Lot length Lot width
REF struc front
Struc length AA Ratio Flood
Curve
Replacement Value of Structure in Dollars
Value of Contents in Dollars
G_elev FF_elev Active Erosion Curve Armor Erosion
Indicator
62 062S_PE0116A 350 138 67 373 42 1 60 309,049$ 82,776$ 11.1 20.3 1 31 -1 262 062S_PE0117A 157 76 91 249 28 1 60 154,689$ 41,432$ 10.2 20.7 1 31 -1 262 062S_PE0118A 350 138 67 365 33 1 59 167,312$ 44,813$ 15.7 26.4 1 31 -1 0.562 062S_PE0120A 350 138 67 369 26 1 60 153,822$ 41,200$ 14.9 22 1 31 -1 0.562 062S_PE0122A 350 138 67 380 30 1 60 376,341$ 100,800$ 14.8 25.6 1 31 -1 0.562 062S_PE0125A 157 76 91 226 26 1 60 248,226$ 66,486$ 11.8 21.7 1 31 -1 262 062S_PE0126A 350 138 67 386 29 1 56 143,192$ 38,353$ 9.6 20 1 31 -1 262 062S_PE0127A 0 155 143 158 30 1 60 251,338$ 67,319$ 12.3 23.6 1 6 -1 0.562 062S_PE0128A 350 138 67 402 43 1 56 216,778$ 58,062$ 9.8 19.1 1 31 -1 262 062S_PE0129A 157 76 91 238 28 1 60 184,015$ 49,287$ 14.7 24.2 1 31 -1 0.562 062S_PE0133A 157 76 91 250 30 1 60 1,044$ 280$ 15 23.5 1 31 -1 0.562 062S_PE0135A 0 155 143 177 28 1 60 224,190$ 60,047$ 17.1 23.2 1 16 -1 0.562 062S_PE0137A 157 76 91 234 30 1 60 203,794$ 54,585$ 13 22.6 1 31 -1 0.562 062S_PEFF01A 0 76 91 235 40 1 56 315,125$ 94,537$ 10 22 1 31 -1 262 062S_PEFF02A 0 76 91 245 40 1 56 315,125$ 94,537$ 10 22 1 31 -1 262 062S_PEFF03A 350 138 67 375 40 1 56 315,125$ 94,537$ 10 22 1 31 -1 262 062S_PEFF05A 0 155 143 185 40 1 56 315,125$ 94,537$ 10 22 1 31 -1 262 062S_PEFF06A 157 76 91 260 40 1 56 315,125$ 94,537$ 10 22 1 31 -1 262 062S_PEFF07A 350 138 67 390 40 1 56 315,125$ 94,537$ 10 22 1 31 -1 262 062S_PEFF08A 0 155 143 280 40 1 56 315,125$ 94,537$ 10 22 1 31 -1 262 062S_PEFF09A 157 76 91 255 40 1 56 315,125$ 94,537$ 10 22 1 31 -1 262 062S_PE0137A 0 50 50 55 40 1 56 315,125$ 94,537$ 10 22 1 31 -1 262 062S_PE0131A 0 50 50 55 40 1 56 315,125$ 94,537$ 10 22 1 31 -1 262 062S_PE0117A 0 50 50 55 40 1 56 315,125$ 94,537$ 10 22 1 31 -1 262 062S_PEHWY 318 64 905 333 34 1 64 95,810$ -$ 6.6 6.6 1 34 -1 0.5
-99963 063ISLAFF01A 373 150 60 400 40 1 56 315,125$ 94,537$ 8 20 1 31 -1 263 063ISLAFF02A 373 150 60 400 40 1 56 315,125$ 94,537$ 8 20 1 31 -1 263 063ISLAFF03A 373 150 60 400 40 1 56 315,125$ 94,537$ 8 20 1 31 -1 263 063ISLAFF04A 373 150 60 400 40 1 56 315,125$ 94,537$ 8 20 1 31 -1 263 063ISLAFF05A 373 150 60 400 40 1 56 315,125$ 94,537$ 8 20 1 31 -1 263 063N_PE0102A 0 237 67 170 40 1 60 113,001$ 30,266$ 10 18.8 1 14 -1 263 063N_PE0103A 385 134 70 399 36 1 60 189,211$ 50,679$ 7.2 18.4 1 31 -1 263 063N_PE0104A 240 113 85 255 28 1 60 184,015$ 49,287$ 7.7 18.1 1 31 -1 263 063N_PE0105A 385 134 70 396 30 1 60 180,592$ 48,370$ 7.8 19.4 1 31 -1 263 063N_PE0106A 0 237 67 139 34 1 2 303,319$ 81,242$ 9.2 19.1 1 8 -1 0.563 063N_PE0107A 385 134 70 400 30 1 2 113,001$ 30,266$ 8 18.4 1 31 -1 0.5

Attachment B-3to Appendix B - Economic Analysis
Surf City - North Topsail BeachFeasibility Study page 37of 51
Reach ID USACE_ID REF lot front
Lot length Lot width
REF struc front
Struc length AA Ratio Flood
Curve
Replacement Value of Structure in Dollars
Value of Contents in Dollars
G_elev FF_elev Active Erosion Curve Armor Erosion
Indicator
63 063N_PE0108A 240 113 85 240 30 1 60 113,001$ 30,266$ 10.1 21.2 1 5 -1 263 063N_PE0109A 385 134 70 400 32 1 60 232,372$ 62,239$ 8 20 1 31 -1 263 063N_PE0110A 0 237 67 150 24 1 60 216,337$ 57,944$ 10 19 1 5 -1 263 063N_PE0111A 385 134 70 388 24 1 60 204,918$ 54,886$ 5.7 16.5 1 31 -1 263 063N_PE0112A 240 113 85 247 30 1 60 191,217$ 51,216$ 8.8 18.2 1 31 -1 263 063N_PE0113A 385 134 70 443 435 1 60 113,001$ 30,266$ 8 20 1 31 -1 263 063N_PE0114A 0 237 67 145 26 1 60 214,830$ 57,541$ 8.8 16 1 15 -1 263 063N_PE0115A 385 134 70 447 34 1 60 257,927$ 69,084$ 16.1 18.1 1 31 -1 0.563 063N_PE0116A 240 113 85 240 30 1 60 1,194$ 320$ 9.8 16.4 1 31 -1 263 063N_PE0117A 385 134 70 453 34 1 60 142,110$ 38,063$ 5.2 14.1 1 31 -1 263 063N_PEFF0119 A 385 134 70 385 40 1 56 315,125$ 94,537$ 6.5 18.3 1 31 -1 263 063N_PE0120A 240 113 85 250 41 1 60 229,313$ 61,420$ 7.4 17.5 1 31 -1 263 063N_PE0122A 0 237 67 156 45 1 60 181,752$ 48,681$ 10.1 19.5 1 15 -1 263 063N_PE0124A 240 113 85 253 28 1 60 162,137$ 43,427$ 8 20 1 31 -1 263 063N_PE0126A 0 237 67 172 30 1 60 272,536$ 72,996$ 8.6 18.6 1 23 -1 263 063N_PE0128A 0 220 100 166 24 1 60 192,444$ 51,544$ 8.8 18.6 1 23 -1 263 063N_PEFF01A 240 113 85 260 40 1 56 315,125$ 94,537$ 8 20 1 31 -1 263 063N_PEFF02A 385 134 70 405 40 1 56 315,125$ 94,537$ 8 20 1 31 -1 263 063N_PEFF04A 0 237 67 185 40 1 56 315,125$ 94,537$ 8 20 1 31 -1 263 063N_PEFF05A 223 70 100 245 40 1 56 315,125$ 94,537$ 8 20 1 31 -1 263 063N_PEFF06A 293 80 100 310 40 1 56 315,125$ 94,537$ 8 20 1 31 -1 263 063OCEA0408A 0 210 200 66 58 1 56 9,596$ 2,570$ 6.9 14.5 1 31 -1 263 063OCEAFF01A 213 160 60 285 40 1 56 315,125$ 94,537$ 8 20 1 31 -1 263 063OCEAFF02A 213 160 60 285 40 1 56 315,125$ 94,537$ 8 20 1 31 -1 263 063OCEAFF03A 213 160 60 285 40 1 56 315,125$ 94,537$ 8 20 1 31 -1 263 063OCEAFF04A 0 160 60 285 40 1 56 315,125$ 94,537$ 8 20 1 31 -1 263 063OCEAFF05A 0 160 60 285 40 1 56 315,125$ 94,537$ 8 20 1 31 -1 263 063N_PEHWY 339 64 821 354 34 1 64 86,917$ -$ 5.21 5.21 1 34 -1 0.5
-99964 064GREE3003A 380 99 59 423 28 1 59 28,212$ 7,556$ 5.3 6.3 1 31 -1 264 064GREE3003X 0 0 0 381 35 1 60 11,201$ 3,000$ 8 18 1 31 -1 264 064ISLA2656A 380 99 59 420 28 1 60 81,612$ 21,859$ 8 18 1 31 -1 264 064ISLA2660A 380 99 59 408 40 1 55 63,036$ 16,884$ 8 18 1 31 -1 264 064ISLA2672A 380 99 59 404 48 1 1 40,943$ 10,966$ 8 18 1 31 -1 0.564 064ISLA2676A 380 99 59 401 32 1 59 83,468$ 22,356$ 8.1 8.1 1 31 -1 264 064ISLA2684A 380 99 59 401 30 1 2 75,828$ 20,310$ 7.4 14 1 31 -1 0.564 064ISLA2688A 380 99 59 430 25 1 1 50,226$ 13,452$ 6.9 9.1 1 31 -1 0.5

Attachment B-3to Appendix B - Economic Analysis
Surf City - North Topsail BeachFeasibility Study page 38of 51
Reach ID USACE_ID REF lot front
Lot length Lot width
REF struc front
Struc length AA Ratio Flood
Curve
Replacement Value of Structure in Dollars
Value of Contents in Dollars
G_elev FF_elev Active Erosion Curve Armor Erosion
Indicator
64 064ISLA2692A 380 99 59 385 36 1 59 99,197$ 26,569$ 8 18 1 31 -1 264 064ISLA2704A 380 99 59 377 37 1 59 50,106$ 13,420$ 8 18 1 31 -1 264 064ISLAFF01A 380 99 59 390 40 1 56 315,125$ 94,537$ 8 18 1 31 -1 264 064ISLAFF02A 380 99 59 395 40 1 56 315,125$ 94,537$ 8 18 1 31 -1 264 064ISLAFF03A 380 99 59 395 40 1 56 315,125$ 94,537$ 8 18 1 31 -1 264 064ISLAFF04A 380 99 59 395 40 1 56 315,125$ 94,537$ 8 18 1 31 -1 264 064ISLAFF05A 380 99 59 395 40 1 56 315,125$ 94,537$ 8 18 1 31 -1 264 064ISLAFF06A 380 99 59 405 40 1 56 315,125$ 94,537$ 8 18 1 31 -1 264 064ISLAFF07A 380 99 59 410 40 1 56 315,125$ 94,537$ 8 18 1 31 -1 264 064ISLAFF08A 380 99 59 400 40 1 56 315,125$ 94,537$ 8 18 1 31 -1 264 064OCEA0442A 0 207 91 113 26 1 55 35,665$ 9,553$ 9.1 16.1 1 30 -1 264 064OCEA0448A 0 207 91 111 35 1 60 129,155$ 34,593$ 9.7 17.9 1 14 -1 264 064OCEA0454A 0 207 91 109 32 1 2 102,538$ 27,464$ 8.4 16 1 31 -1 0.564 064OCEA0457A 271 109 63 282 38 1 59 69,355$ 18,576$ 8.3 8.3 1 31 -1 264 064OCEA0460A 0 207 91 101 30 1 2 58,688$ 15,719$ 8.7 16 1 31 -1 0.564 064OCEA0462A 0 207 91 106 24 1 2 63,741$ 17,072$ 10 16.4 1 31 -1 0.564 064OCEA0464A 0 207 91 111 38 1 55 60,765$ 16,275$ 8.5 18.3 1 29 -1 264 064OCEA0465A 271 109 63 283 24 1 2 52,538$ 14,072$ 8.1 15.6 1 31 -1 0.564 064OCEA0469A 271 109 63 285 42 1 59 77,548$ 20,771$ 8.2 16.7 1 31 -1 264 064OCEA0470A 0 207 91 109 26 1 55 52,837$ 14,152$ 8.3 16.4 1 30 -1 264 064OCEA0473A 271 109 63 285 24 1 59 67,474$ 18,072$ 8.4 12 1 31 -1 264 064OCEA0476A 0 207 91 107 28 1 59 95,307$ 25,527$ 8.5 16.7 1 12 -1 264 064OCEA0477A 271 109 63 289 36 1 59 43,877$ 11,752$ 7.9 19.7 1 31 -1 264 064OCEA0481A 271 109 63 295 36 1 2 89,353$ 23,932$ 7.7 12 1 31 -1 0.564 064OCEA0485A 271 109 63 285 28 1 2 47,036$ 12,598$ 7.9 14.8 1 31 -1 0.564 064OCEA0486A 0 207 91 96 34 1 59 55,221$ 14,791$ 8.6 16.4 1 20 -1 264 064OCEA0489A 271 109 63 291 40 1 59 88,498$ 23,703$ 8.5 16.5 1 31 -1 264 064OCEA0492A 0 207 91 99 30 1 59 98,532$ 26,391$ 8.4 16 1 20 -1 264 064OCEA0493A 271 109 63 294 30 1 1 25,189$ 6,747$ 8.2 10.2 1 31 -1 0.564 064OCEAFF01A 0 109 63 285 40 1 56 315,125$ 94,537$ 8 18 1 31 -1 264 064OCEAFF02A 0 109 63 285 40 1 56 315,125$ 94,537$ 8 18 1 31 -1 264 064OCEAFF03A 0 109 63 285 40 1 56 315,125$ 94,537$ 8 18 1 31 -1 264 064OCEAFF04A 271 109 63 285 40 1 56 315,125$ 94,537$ 8 18 1 31 -1 264 064OCEAFF05A 271 109 63 285 40 1 56 315,125$ 94,537$ 8 18 1 31 -1 264 064OCEAFF06A 271 109 63 285 40 1 56 315,125$ 94,537$ 8 18 1 31 -1 264 064OCEAFF07A 0 207 91 145 40 1 56 315,125$ 94,537$ 8 18 1 31 -1 264 064OCEAFF08A 271 109 63 310 40 1 56 315,125$ 94,537$ 8 18 1 31 -1 2

Attachment B-3to Appendix B - Economic Analysis
Surf City - North Topsail BeachFeasibility Study page 39of 51
Reach ID USACE_ID REF lot front
Lot length Lot width
REF struc front
Struc length AA Ratio Flood
Curve
Replacement Value of Structure in Dollars
Value of Contents in Dollars
G_elev FF_elev Active Erosion Curve Armor Erosion
Indicator
64 064OCEAHWY 205 64 1000 220 34 1 64 105,868$ -$ 7.36 7.36 1 34 -1 0.5-999
65 065GREY3200A 326 82 56 349 32 1 1 35,855$ 9,604$ 8.1 15.7 1 31 -1 0.565 065ISLA2708A 326 82 56 399 32 1 55 47,124$ 12,622$ 8 20 1 31 -1 265 065ISLA2712A 326 82 56 390 24 1 2 56,518$ 15,138$ 8 20 1 31 -1 0.565 065ISLA2716A 326 82 56 389 22 1 56 117,102$ 31,365$ 7.3 0 1 31 -1 265 065ISLA2720A 326 82 56 376 28 1 60 104,071$ 27,874$ 8 20 1 31 -1 265 065ISLA2728A 326 82 56 360 28 1 60 79,814$ 21,378$ 8 20 1 31 -1 265 065ISLA2734A 326 82 56 369 44 1 2 78,689$ 21,076$ 8 20 1 31 -1 0.565 065ISLA2752A 326 82 56 330 24 1 59 64,192$ 17,193$ 8 20 1 31 -1 265 065ISLA2768A 326 82 56 289 38 1 59 50,999$ 13,659$ 8.3 16 1 31 -1 265 065ISLA2772A 326 82 56 278 38 1 2 67,475$ 18,073$ 8.1 8.1 1 31 -1 0.565 065ISLA2776A 326 82 56 270 40 1 2 101,552$ 27,200$ 8 8 1 31 -1 0.565 065ISLA2780A 326 82 56 273 28 1 60 133,965$ 35,882$ 8 20 1 31 -1 265 065ISLA2784A 326 82 56 290 30 1 60 113,001$ 30,266$ 8 20 1 31 -1 265 065ISLAFF01A 326 82 56 390 40 1 56 315,125$ 94,537$ 8 20 1 31 -1 265 065ISLAFF02A 326 82 56 350 40 1 56 315,125$ 94,537$ 8 20 1 31 -1 265 065ISLAFF03A 326 82 56 325 40 1 56 315,125$ 94,537$ 8 20 1 31 -1 265 065ISLAFF04A 326 82 56 315 40 1 56 315,125$ 94,537$ 8 20 1 31 -1 265 065ISLAFF05A 326 82 56 315 40 1 56 315,125$ 94,537$ 8 20 1 31 -1 265 065OCEA0508A 0 171 333 155 40 1 59 80,451$ 21,548$ 8.1 18.1 1 11 -1 265 065OCEA0509A 235 91 59 306 35 1 59 39,532$ 10,588$ 7.7 12 1 31 -1 265 065OCEA0512A 0 82 56 85 40 1 56 315,125$ 94,537$ 8 20 1 31 -1 265 065OCEA0516A 0 171 333 105 32 1 55 67,647$ 18,119$ 8 20 1 29 -1 265 065OCEA0521A 235 91 59 288 36 1 59 54,576$ 14,618$ 7.8 16.1 1 31 -1 265 065OCEA0533A 235 91 59 255 38 1 59 65,798$ 17,623$ 9.1 17.4 1 31 -1 265 065OCEA0538A 0 171 333 126 44 1 59 74,876$ 20,055$ 7 15.8 1 12 -1 265 065OCEA0539A 235 91 59 229 35 1 59 113,001$ 30,266$ 8 20 1 31 -1 265 065OCEA0549A 235 91 59 237 36 1 59 67,212$ 18,002$ 7.7 17 1 31 -1 265 065OCEA0553A 235 91 59 240 25 1 55 113,291$ 30,344$ 9.7 17.9 1 31 -1 265 065OCEA0559A 235 91 59 211 37 1 60 141,633$ 37,935$ 8.3 16.7 1 31 -1 265 065OCEA0563A 235 91 59 186 40 1 59 64,972$ 17,402$ 7.6 8.6 1 31 -1 265 065OCEA0569A 235 91 59 182 47 1 2 45,066$ 12,070$ 8.7 8.7 1 31 -1 0.565 065OCEA0569S 235 93 56 220 10 1 60 12,195$ 3,266$ 8 20 1 31 -1 265 065OCEA0575A 235 91 59 182 28 1 59 93,407$ 25,018$ 8.8 8.8 1 31 -1 265 065OCEAFF01A 235 91 59 315 40 1 56 315,125$ 94,537$ 8 20 1 31 -1 265 065OCEAFF02A 235 91 59 310 40 1 56 315,125$ 94,537$ 8 20 1 31 -1 2

Attachment B-3to Appendix B - Economic Analysis
Surf City - North Topsail BeachFeasibility Study page 40of 51
Reach ID USACE_ID REF lot front
Lot length Lot width
REF struc front
Struc length AA Ratio Flood
Curve
Replacement Value of Structure in Dollars
Value of Contents in Dollars
G_elev FF_elev Active Erosion Curve Armor Erosion
Indicator
65 065OCEAFF03A 235 91 59 295 40 1 56 315,125$ 94,537$ 8 20 1 31 -1 265 065OCEAFF04A 235 91 59 298 40 1 56 315,125$ 94,537$ 8 20 1 31 -1 265 065OCEAFF05A 235 91 59 290 40 1 56 315,125$ 94,537$ 8 20 1 31 -1 265 065OCEAFF06A 235 91 59 190 40 1 56 315,125$ 94,537$ 8 20 1 31 -1 265 065OCEAFF07A 235 91 59 190 40 1 56 315,125$ 94,537$ 8 20 1 31 -1 265 065OCEAHWY 201 64 1006 216 34 1 64 106,507$ -$ 7.06 7.06 1 34 -1 0.5
-99966 066ISLA0627A 205 102 58 211 38 1 59 66,653$ 17,852$ 11.3 11.3 1 31 -1 266 066ISLA0631A 205 102 58 221 30 1 60 111,260$ 29,800$ 11.5 11.9 1 31 -1 266 066ISLA0641A 205 102 58 230 32 1 55 39,125$ 10,479$ 9.4 18.4 1 31 -1 266 066ISLA0645A 205 102 58 234 32 1 59 36,618$ 9,808$ 9.3 17.7 1 31 -1 266 066ISLA0649A 205 102 58 233 33 1 55 45,513$ 12,190$ 9.1 18.8 1 31 -1 266 066ISLA0653A 205 102 58 230 38 1 55 53,353$ 14,290$ 9.9 19.1 1 31 -1 266 066ISLA0657A 205 102 58 237 32 1 56 73,966$ 19,811$ 9.4 17.5 1 31 -1 266 066ISLA0665A 205 102 58 232 25 1 59 72,124$ 19,318$ 8.8 17.9 1 31 -1 266 066ISLA2794A 257 72 95 267 32 1 60 65,439$ 17,527$ 9 17.2 1 31 -1 266 066ISLA2798A 257 72 95 264 24 1 2 53,940$ 14,448$ 9 21 1 31 -1 0.566 066ISLA2806A 257 72 95 265 38 1 59 82,249$ 22,029$ 9 21 1 31 -1 266 066ISLA2810A 257 72 95 269 30 1 2 39,470$ 10,572$ 9 21 1 31 -1 0.566 066ISLA2865A 427 114 125 476 18 1 60 15,838$ 4,242$ 9 21 1 31 -1 266 066ISLAFF01A 257 72 95 280 40 1 56 315,125$ 94,537$ 9 21 1 31 -1 266 066ISLAFF02A 427 114 125 450 40 1 56 315,125$ 94,537$ 9 21 1 31 -1 266 066ISLAFF03A 427 114 125 440 40 1 56 315,125$ 94,537$ 9 21 1 31 -1 266 066ISLAFF04A 427 114 125 440 40 1 56 315,125$ 94,537$ 9 21 1 31 -1 266 066ISLAFF05A 427 114 125 425 40 1 56 315,125$ 94,537$ 9 21 1 31 -1 266 066ISLAFF06A 427 114 125 420 40 1 56 315,125$ 94,537$ 9 21 1 31 -1 266 066ISLAFF07A 427 114 125 415 40 1 56 315,125$ 94,537$ 9 21 1 31 -1 266 066ISLAFF08A 427 114 125 425 40 1 56 315,125$ 94,537$ 9 21 1 31 -1 266 066ISLAFF09A 0 102 59 235 40 1 56 315,125$ 94,537$ 9 21 1 31 -1 266 066OCEA0597A 205 52 59 189 37 1 59 61,168$ 16,383$ 9.3 16.6 1 31 -1 266 066OCEA0603A 205 52 59 189 36 1 2 72,561$ 19,435$ 9.4 9.4 1 31 -1 0.566 066OCEA0607A 205 52 59 196 26 1 59 55,123$ 14,764$ 11 17.3 1 31 -1 266 066OCEA0611A 205 52 59 193 28 1 59 47,608$ 12,752$ 10.2 17.6 1 31 -1 266 066OCEA0615A 205 52 59 212 34 1 59 56,149$ 15,039$ 9 21 1 31 -1 266 066OCEA0623A 205 52 59 207 30 1 59 69,191$ 18,532$ 10.7 18.7 1 31 -1 266 066OCEAFF01A 0 168 1000 100 40 1 56 10$ 3$ 9 21 1 31 -1 266 066OCEAFF02A 205 52 59 195 40 1 56 315,125$ 94,537$ 9 21 1 31 -1 2

Attachment B-3to Appendix B - Economic Analysis
Surf City - North Topsail BeachFeasibility Study page 41of 51
Reach ID USACE_ID REF lot front
Lot length Lot width
REF struc front
Struc length AA Ratio Flood
Curve
Replacement Value of Structure in Dollars
Value of Contents in Dollars
G_elev FF_elev Active Erosion Curve Armor Erosion
Indicator
66 066OCEAFF03A 205 52 59 200 40 1 56 315,125$ 94,537$ 9 21 1 31 -1 266 066OCEAHWY 137 64 1000 152 34 1 64 105,868$ -$ 9.96 9.96 1 34 -1 0.566 066ISLAHWY 316 64 1003 331 34 1 64 106,182$ -$ 9.96 9.96 1 34 -1 0.5
-99967 067ISLA0671A 0 285 167 227 44 1 2 82,618$ 22,128$ 9.6 10.5 1 31 -1 0.567 067ISLA2928A 0 285 167 156 20 1 56 128,743$ 34,483$ 11.1 21.4 1 30 -1 267 067ISLAFF01A 0 285 167 225 40 1 56 315,125$ 94,537$ 9 21 1 31 -1 267 067ISLAFF02A 368 128 193 405 40 1 56 315,125$ 94,537$ 9 21 1 31 -1 267 067LATE0301A 368 128 193 403 30 1 60 113,001$ 30,266$ 9 21 1 31 -1 267 067LATE0309A 438 70 250 457 30 1 60 113,001$ 30,266$ 9 16.3 1 31 -1 267 067LATEFF01A 368 70 250 0 40 1 56 315,125$ 94,537$ 9 21 1 31 -1 267 067OCEA0210A 0 285 167 187 24 1 60 118,256$ 31,674$ 9 21 1 23 -1 267 067OCEA0224A 0 285 167 146 34 1 60 232,539$ 62,284$ 8.8 19.4 1 23 -1 267 067OCEA0236A 0 285 167 166 35 1 60 232,899$ 62,380$ 9.4 19.4 1 23 -1 267 067OCEA0202A 0 100 50 90 40 1 56 315,125$ 94,537$ 9 21 1 31 -1 267 067OCEA0206A 0 100 50 90 40 1 56 315,125$ 94,537$ 9 21 1 31 -1 267 067OCEA0212A 0 100 50 90 40 1 56 315,125$ 94,537$ 9 21 1 31 -1 267 067OCEA0216A 0 100 50 90 40 1 56 315,125$ 94,537$ 9 21 1 31 -1 267 067OCEA0230A 0 100 50 90 40 1 56 315,125$ 94,537$ 9 21 1 31 -1 267 067PORT0200A 368 128 193 399 40 1 60 113,001$ 30,266$ 9 21 1 31 -1 267 067ISLAHWY1 240 64 568 255 34 1 64 60,136$ -$ 5.77 5.77 1 34 -1 0.567 067ISLAHWY2 296 64 1000 311 34 1 64 105,868$ -$ 5.77 5.77 1 34 -1 0.5
-99968 06824TH4503A 365 189 62 424 42 1 59 86,229$ 23,096$ 6 18 1 31 -1 268 068ERNE0200A 0 283 83 133 34 1 56 94,860$ 25,408$ 6.1 17.8 1 30 -1 268 068ERNE0202A 0 283 83 127 30 1 55 181,019$ 48,484$ 6.5 18.3 1 30 -1 268 068ERNE0204A 0 283 83 144 34 1 56 49,695$ 13,310$ 2.7 5.7 1 30 -1 268 068ISLA2950A 0 283 83 149 35 1 53 113,001$ 168,483$ 5.4 18.1 1 30 -1 268 068ISLA2978A 0 283 83 153 40 1 60 106,366$ 28,489$ 9.8 14.8 1 5 -1 268 068ISLA2998A 0 283 83 145 24 1 55 52,642$ 14,100$ 6 18 1 31 -1 268 068ISLA2999A 365 189 62 166 30 1 60 49,173$ 13,171$ 6.9 13.7 1 31 -1 268 068ISLA3000A 0 283 83 164 20 1 60 169,857$ 45,495$ 10.1 21.4 1 5 -1 268 068ISLA3004A 0 283 83 146 30 1 60 114,705$ 30,723$ 7.2 19 1 5 -1 268 068ISLA3010A 0 283 83 205 32 1 60 141,932$ 38,015$ 6 18 1 23 -1 268 068ISLA3017A 365 189 62 437 28 1 1 67,419$ 18,058$ 4.8 7.2 1 31 -1 0.568 068ISLA3021A 365 189 62 430 154 1 59 101,409$ 27,162$ 5.5 13.3 1 31 -1 268 068ISLA3028A 0 283 83 205 32 1 60 120,925$ 32,389$ 6 18 1 5 -1 2

Attachment B-3to Appendix B - Economic Analysis
Surf City - North Topsail BeachFeasibility Study page 42of 51
Reach ID USACE_ID REF lot front
Lot length Lot width
REF struc front
Struc length AA Ratio Flood
Curve
Replacement Value of Structure in Dollars
Value of Contents in Dollars
G_elev FF_elev Active Erosion Curve Armor Erosion
Indicator
68 068ISLAFF01A 365 189 62 390 40 1 56 315,125$ 94,537$ 6 18 1 31 -1 268 068ISLAFF02A 365 189 62 390 40 1 56 315,125$ 94,537$ 6 18 1 31 -1 268 068ISLAFF03A 365 189 62 395 40 1 56 315,125$ 94,537$ 6 18 1 31 -1 268 068ISLAFF04A 365 189 62 395 40 1 56 315,125$ 94,537$ 6 18 1 31 -1 268 068ISLAFF05A 365 189 62 405 40 1 56 315,125$ 94,537$ 6 18 1 31 -1 268 068ISLAFF06A 0 283 83 205 40 1 56 315,125$ 94,537$ 6 18 1 31 -1 268 068ISLAFF07A 0 283 83 215 40 1 56 315,125$ 94,537$ 6 18 1 31 -1 268 068SUMM0101A 365 86 220 375 25 1 56 132,542$ 35,500$ 5.2 14.2 1 31 -1 268 068SUMM0102A 365 86 220 370 32 1 60 110,255$ 29,531$ 4.7 14.4 1 31 -1 268 068SUMM0111A 451 103 220 459 32 1 2 118,357$ 31,701$ 6 18 1 31 -1 0.568 068SUMMFF01A 451 103 220 470 40 1 56 315,125$ 94,537$ 6 18 1 31 -1 268 068ISLAHWY 280 64 1000 295 34 1 64 105,868$ -$ 5.91 5.91 1 34 -1 0.5
-99969 06922ND4903A 362 172 111 509 14 1 62 23,657$ 6,336$ 5 8 1 31 -1 269 06923RD4701A 362 172 111 441 40 1 59 55,900$ 14,972$ 5 13.6 1 31 -1 269 06923RD4706A 362 172 111 509 26 1 59 66,250$ 17,744$ 5.5 14 1 31 -1 269 06924TH4502A 362 172 111 417 31 1 59 57,860$ 15,497$ 4.5 12.8 1 31 -1 269 069ISLA3032A 0 279 67 198 30 1 56 126,155$ 33,790$ 0 0 1 30 -1 269 069ISLA3041A 362 172 111 425 30 1 59 53,016$ 14,200$ 4.9 13.4 1 31 -1 269 069ISLA3044A 0 279 67 201 20 1 56 199,389$ 53,405$ 4.9 13.1 1 30 -1 269 069ISLA3045A 362 172 111 432 30 1 59 52,655$ 14,103$ 4.9 13.1 1 31 -1 269 069ISLA3060A 0 279 67 206 32 1 60 256,931$ 68,817$ 12.4 20.8 1 13 -1 0.569 069ISLA3064A 0 279 67 208 32 1 60 254,622$ 68,198$ 7.6 20.6 1 5 -1 269 069ISLA3068A 0 279 67 187 64 1 59 125,632$ 33,650$ 8.8 18.4 1 12 -1 269 069ISLAFF01A 0 279 67 210 40 1 56 315,125$ 94,537$ 5 17 1 31 -1 269 069ISLAFF02A 0 279 67 205 40 1 56 315,125$ 94,537$ 5 17 1 31 -1 269 069ISLAFF03A 0 279 67 210 40 1 56 315,125$ 94,537$ 5 17 1 31 -1 269 069ISLAFF04A 0 279 67 215 40 1 56 315,125$ 94,537$ 5 17 1 31 -1 269 069TOPS0110A 0 279 67 139 32 1 60 137,501$ 36,829$ 7.1 18.9 1 15 -1 269 069TOPS0114A 0 279 67 209 24 1 60 131,358$ 35,183$ 11 23 1 23 -1 269 069TOPS0115A 362 172 111 361 30 1 59 87,627$ 23,470$ 8.3 17.2 1 21 -1 269 069TOPS0122A 0 279 67 211 34 1 60 166,065$ 44,479$ 9.5 21.6 1 5 -1 269 069TOPS0128A 0 279 67 169 30 1 60 114,375$ 30,635$ 8.1 20.1 1 5 -1 269 069TOPSFF01A 0 279 67 210 40 1 56 315,125$ 94,537$ 5 17 1 31 -1 269 069TOPSFF02A 0 279 67 215 40 1 56 315,125$ 94,537$ 5 17 1 31 -1 269 069TOPSFF03A 362 172 111 365 40 1 56 315,125$ 94,537$ 5 17 1 31 -1 269 069TOPSFF04A 362 172 111 375 40 1 56 315,125$ 94,537$ 5 17 1 31 -1 2

Attachment B-3to Appendix B - Economic Analysis
Surf City - North Topsail BeachFeasibility Study page 43of 51
Reach ID USACE_ID REF lot front
Lot length Lot width
REF struc front
Struc length AA Ratio Flood
Curve
Replacement Value of Structure in Dollars
Value of Contents in Dollars
G_elev FF_elev Active Erosion Curve Armor Erosion
Indicator
69 069ISLAHWY 325 64 627 340 34 1 64 66,375$ -$ 6.86 6.86 1 34 -1 0.569 069TOPSHWY 287 64 341 302 34 1 64 36,100$ -$ 6.86 6.86 1 34 -1 0.5
-99970 07018TH5605A 398 72 82 390 10 1 62 6,958$ 1,864$ 7 19 1 31 -1 270 07018TH5611A 291 107 57 315 32 1 1 127,557$ 34,165$ 7 19 1 31 -1 0.570 070ISLA3184A 398 72 82 386 66 1 62 20,828$ 5,579$ 7 19 1 31 -1 270 070ISLA3188A 398 72 82 386 10 1 62 16,306$ 4,368$ 7 19 1 31 -1 270 070ISLAFF01A 398 72 82 430 40 1 56 315,125$ 94,537$ 7 19 1 31 -1 270 070ISLAFF02A 398 72 82 430 40 1 56 315,125$ 94,537$ 7 19 1 31 -1 270 070ISLAFF03A 398 72 82 425 40 1 56 315,125$ 94,537$ 7 19 1 31 -1 270 070ISLAFF04A 398 72 82 420 40 1 56 315,125$ 94,537$ 7 19 1 31 -1 270 070ISLAFF05A 398 72 82 420 40 1 56 315,125$ 94,537$ 7 19 1 31 -1 270 070ISLAFF06A 398 72 82 415 40 1 56 315,125$ 94,537$ 7 19 1 31 -1 270 070TOPS0142A 0 249 125 193 28 1 60 124,069$ 33,231$ 7 19 1 15 -1 270 070TOPS0151A 328 141 65 346 31 1 60 235,199$ 62,996$ 9.7 20.1 1 31 -1 270 070TOPS0153A 328 141 65 330 30 1 60 188,412$ 50,464$ 8.6 19.3 1 31 -1 270 070TOPS0154A 0 249 125 190 41 1 60 155,201$ 41,569$ 11.3 23.1 1 23 -1 270 070TOPS0155A 291 107 57 326 36 1 59 87,932$ 23,552$ 7.6 16.7 1 31 -1 270 070TOPS0159A 291 107 57 325 40 1 60 277,270$ 74,264$ 3.8 15.6 1 31 -1 270 070TOPS0160A 0 249 125 187 28 1 60 138,701$ 37,150$ 7 19 1 23 -1 270 070TOPS0163A 291 107 57 336 34 1 2 257,625$ 69,003$ 6.5 15.1 1 31 -1 0.570 070TOPS0167A 291 107 57 336 36 1 2 287,946$ 77,124$ 6 15.3 1 31 -1 0.570 070TOPS0168A 0 249 125 151 32 1 60 83,345$ 22,323$ 7.7 19.2 1 15 -1 270 070TOPS0171A 291 107 57 326 34 1 2 257,187$ 68,885$ 6.2 15.5 1 31 -1 0.570 070TOPS0174A 0 249 125 162 28 1 56 94,715$ 25,368$ 7.5 19.7 1 30 -1 270 070TOPS0180A 0 249 125 160 22 1 60 183,586$ 49,172$ 8.1 21 1 23 -1 270 070TOPS0183A 291 107 57 340 25 1 59 64,554$ 17,290$ 5.6 13.7 1 31 -1 270 070TOPS0191A 291 107 57 320 30 1 60 113,001$ 30,266$ 10.2 0 1 31 -1 270 070TOPS0193A 291 107 57 289 28 1 60 144,722$ 38,763$ 7 19 1 31 -1 270 070TOPS0194A 0 249 125 162 28 1 56 87,317$ 23,387$ 8.3 22.1 1 30 -1 270 070TOPS0204A 0 249 125 150 30 1 56 67,426$ 18,059$ 7.1 19 1 30 -1 270 070TOPS0205A 291 107 57 294 12 1 62 8,887$ 2,380$ 7.1 9 1 31 -1 270 070TOPS0213A 291 107 57 272 78 1 1 64,941$ 17,394$ 7.1 9 1 31 -1 0.570 070TOPSFF01A 328 141 65 370 40 1 56 315,125$ 94,537$ 6 18 1 31 -1 270 070TOPSFF02A 328 141 65 365 40 1 56 315,125$ 94,537$ 6 18 1 31 -1 270 070TOPSFF03A 291 107 57 320 40 1 56 315,125$ 94,537$ 6 18 1 31 -1 270 070TOPSFF04A 291 107 57 325 40 1 56 315,125$ 94,537$ 6 18 1 31 -1 2

Attachment B-3to Appendix B - Economic Analysis
Surf City - North Topsail BeachFeasibility Study page 44of 51
Reach ID USACE_ID REF lot front
Lot length Lot width
REF struc front
Struc length AA Ratio Flood
Curve
Replacement Value of Structure in Dollars
Value of Contents in Dollars
G_elev FF_elev Active Erosion Curve Armor Erosion
Indicator
70 070TOPSFF05A 0 100 57 190 40 1 56 315,125$ 94,537$ 6 18 1 31 -1 270 070TOPSFF06A 0 100 57 190 40 1 56 315,125$ 94,537$ 6 18 1 31 -1 270 070TOPSHWY 248 64 1000 263 34 1 64 105,868$ -$ 10.27 10.27 1 34 -1 0.5
-99971 07113TH6602A 345 51 100 330 40 1 59 82,413$ 22,074$ 8.1 10.3 1 31 -1 271 07113TH6604A 297 48 100 293 12 1 62 4,758$ 1,274$ 8.2 10.8 1 31 -1 271 07114TH6400A 345 51 100 358 14 1 62 12,195$ 3,266$ 7.7 11.4 1 31 -1 271 07114TH6404A 297 48 100 296 40 1 59 59,005$ 15,804$ 8.3 16.1 1 31 -1 271 07114TH6411A 226 105 63 205 12 1 62 6,780$ 1,816$ 10.1 11.5 1 31 -1 271 07114TH6412A 226 105 63 188 33 1 55 52,936$ 14,179$ 9.8 17.1 1 31 -1 271 07114TH6503A 345 51 100 343 14 1 62 12,195$ 3,266$ 8.4 10.3 1 31 -1 271 07114TH6504A 297 48 100 293 22 1 1 32,782$ 8,780$ 8.4 10.3 1 31 -1 0.571 07115TH6200A 331 92 60 336 44 1 59 112,842$ 30,224$ 7.7 9.9 1 31 -1 271 07115TH6201A 345 51 100 363 14 1 62 32,398$ 8,677$ 7.7 11 1 31 -1 271 07115TH6205A 297 48 100 320 46 1 62 10,510$ 2,815$ 8.4 10.3 1 31 -1 271 07115TH6210A 226 105 63 239 38 1 60 109,584$ 29,351$ 8 20 1 31 -1 271 07115TH6211A 226 105 63 221 22 1 55 25,563$ 6,847$ 9.4 16.5 1 31 -1 271 071ISLA3192A 331 92 60 394 14 1 62 13,607$ 3,644$ 8 10 1 31 -1 271 071ISLA3200A 331 92 60 385 30 1 60 164,803$ 44,141$ 7 19.1 1 31 -1 271 071ISLA3210A 331 92 60 358 60 1 59 12,195$ 3,266$ 8 20 1 31 -1 271 071ISLA3212A 0 0 0 363 38 1 59 124,171$ 33,258$ 7.7 15 1 31 -1 271 071ISLA3222A 331 92 60 338 42 1 59 99,072$ 26,536$ 7.2 17.6 1 31 -1 271 071ISLAFF01A 331 92 60 385 40 1 56 315,125$ 94,537$ 8 20 1 31 -1 271 071ISLAFF02A 331 92 60 365 40 1 56 315,125$ 94,537$ 8 20 1 31 -1 271 071ISLAFF03A 331 92 60 345 40 1 56 315,125$ 94,537$ 8 20 1 31 -1 271 071TOPS0213S 226 105 63 300 40 1 60 5,600$ 1,500$ 8 20 1 31 -1 271 071TOPS0220A 0 174 250 158 24 1 56 113,001$ 30,266$ 6.9 20.8 1 30 -1 271 071TOPS0221A 226 105 63 269 62 1 59 32,829$ 8,793$ 6.6 9.1 1 31 -1 271 071TOPS0229A 226 105 63 273 24 1 60 161,409$ 43,232$ 9 18.4 1 31 -1 271 071TOPS0230A 0 174 250 144 26 1 55 88,628$ 23,738$ 6.6 19.7 1 30 -1 271 071TOPS0233A 226 105 63 268 32 1 60 216,130$ 57,889$ 9.3 19.4 1 31 -1 271 071TOPS0237A 226 105 63 281 26 1 60 134,400$ 35,998$ 9.1 16.4 1 31 -1 271 071TOPS0238A 0 174 250 141 20 1 55 90,145$ 24,144$ 6.4 18 1 30 -1 271 071TOPS0241A 226 105 63 277 26 1 60 116,431$ 31,185$ 8.9 18 1 31 -1 271 071TOPS0247A 226 105 63 248 32 1 59 51,126$ 13,694$ 8.8 17.7 1 31 -1 271 071TOPS0265A 226 105 63 220 28 1 59 59,128$ 15,837$ 9.3 18.6 1 31 -1 271 071TOPS0269A 226 105 63 200 28 1 59 36,584$ 9,798$ 9.3 17 1 31 -1 2
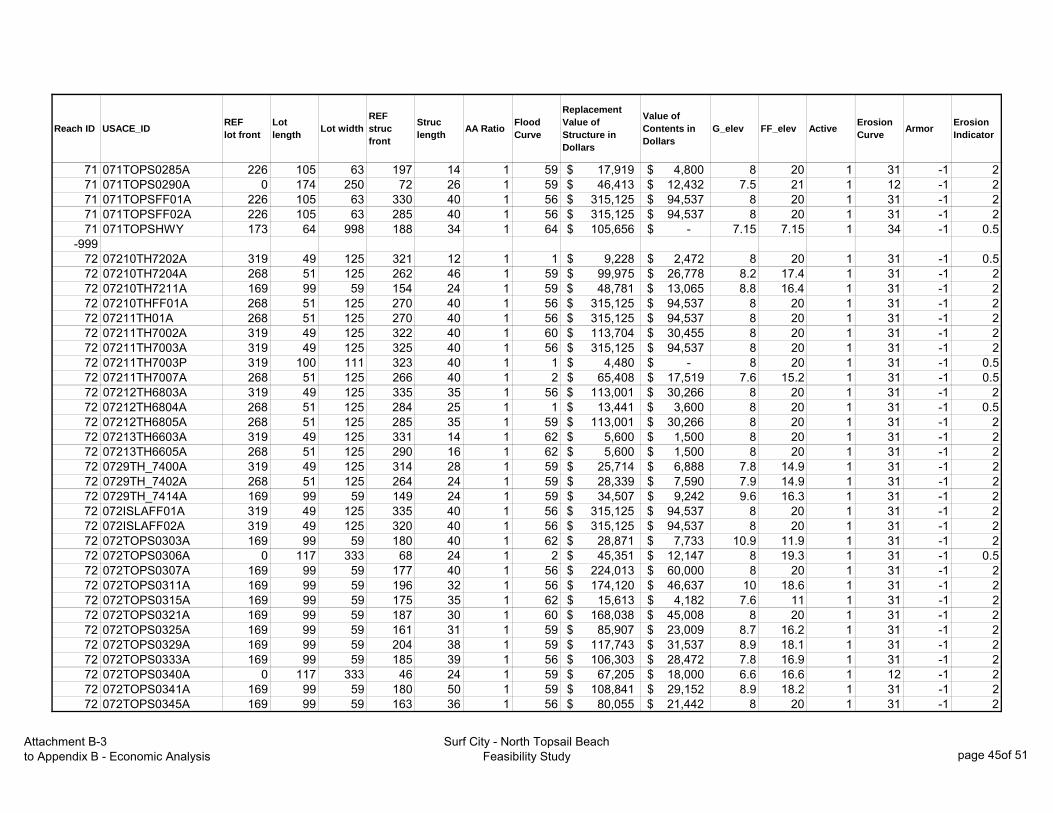
Attachment B-3to Appendix B - Economic Analysis
Surf City - North Topsail BeachFeasibility Study page 45of 51
Reach ID USACE_ID REF lot front
Lot length Lot width
REF struc front
Struc length AA Ratio Flood
Curve
Replacement Value of Structure in Dollars
Value of Contents in Dollars
G_elev FF_elev Active Erosion Curve Armor Erosion
Indicator
71 071TOPS0285A 226 105 63 197 14 1 59 17,919$ 4,800$ 8 20 1 31 -1 271 071TOPS0290A 0 174 250 72 26 1 59 46,413$ 12,432$ 7.5 21 1 12 -1 271 071TOPSFF01A 226 105 63 330 40 1 56 315,125$ 94,537$ 8 20 1 31 -1 271 071TOPSFF02A 226 105 63 285 40 1 56 315,125$ 94,537$ 8 20 1 31 -1 271 071TOPSHWY 173 64 998 188 34 1 64 105,656$ -$ 7.15 7.15 1 34 -1 0.5
-99972 07210TH7202A 319 49 125 321 12 1 1 9,228$ 2,472$ 8 20 1 31 -1 0.572 07210TH7204A 268 51 125 262 46 1 59 99,975$ 26,778$ 8.2 17.4 1 31 -1 272 07210TH7211A 169 99 59 154 24 1 59 48,781$ 13,065$ 8.8 16.4 1 31 -1 272 07210THFF01A 268 51 125 270 40 1 56 315,125$ 94,537$ 8 20 1 31 -1 272 07211TH01A 268 51 125 270 40 1 56 315,125$ 94,537$ 8 20 1 31 -1 272 07211TH7002A 319 49 125 322 40 1 60 113,704$ 30,455$ 8 20 1 31 -1 272 07211TH7003A 319 49 125 325 40 1 56 315,125$ 94,537$ 8 20 1 31 -1 272 07211TH7003P 319 100 111 323 40 1 1 4,480$ -$ 8 20 1 31 -1 0.572 07211TH7007A 268 51 125 266 40 1 2 65,408$ 17,519$ 7.6 15.2 1 31 -1 0.572 07212TH6803A 319 49 125 335 35 1 56 113,001$ 30,266$ 8 20 1 31 -1 272 07212TH6804A 268 51 125 284 25 1 1 13,441$ 3,600$ 8 20 1 31 -1 0.572 07212TH6805A 268 51 125 285 35 1 59 113,001$ 30,266$ 8 20 1 31 -1 272 07213TH6603A 319 49 125 331 14 1 62 5,600$ 1,500$ 8 20 1 31 -1 272 07213TH6605A 268 51 125 290 16 1 62 5,600$ 1,500$ 8 20 1 31 -1 272 0729TH_7400A 319 49 125 314 28 1 59 25,714$ 6,888$ 7.8 14.9 1 31 -1 272 0729TH_7402A 268 51 125 264 24 1 59 28,339$ 7,590$ 7.9 14.9 1 31 -1 272 0729TH_7414A 169 99 59 149 24 1 59 34,507$ 9,242$ 9.6 16.3 1 31 -1 272 072ISLAFF01A 319 49 125 335 40 1 56 315,125$ 94,537$ 8 20 1 31 -1 272 072ISLAFF02A 319 49 125 320 40 1 56 315,125$ 94,537$ 8 20 1 31 -1 272 072TOPS0303A 169 99 59 180 40 1 62 28,871$ 7,733$ 10.9 11.9 1 31 -1 272 072TOPS0306A 0 117 333 68 24 1 2 45,351$ 12,147$ 8 19.3 1 31 -1 0.572 072TOPS0307A 169 99 59 177 40 1 56 224,013$ 60,000$ 8 20 1 31 -1 272 072TOPS0311A 169 99 59 196 32 1 56 174,120$ 46,637$ 10 18.6 1 31 -1 272 072TOPS0315A 169 99 59 175 35 1 62 15,613$ 4,182$ 7.6 11 1 31 -1 272 072TOPS0321A 169 99 59 187 30 1 60 168,038$ 45,008$ 8 20 1 31 -1 272 072TOPS0325A 169 99 59 161 31 1 59 85,907$ 23,009$ 8.7 16.2 1 31 -1 272 072TOPS0329A 169 99 59 204 38 1 59 117,743$ 31,537$ 8.9 18.1 1 31 -1 272 072TOPS0333A 169 99 59 185 39 1 56 106,303$ 28,472$ 7.8 16.9 1 31 -1 272 072TOPS0340A 0 117 333 46 24 1 59 67,205$ 18,000$ 6.6 16.6 1 12 -1 272 072TOPS0341A 169 99 59 180 50 1 59 108,841$ 29,152$ 8.9 18.2 1 31 -1 272 072TOPS0345A 169 99 59 163 36 1 56 80,055$ 21,442$ 8 20 1 31 -1 2

Attachment B-3to Appendix B - Economic Analysis
Surf City - North Topsail BeachFeasibility Study page 46of 51
Reach ID USACE_ID REF lot front
Lot length Lot width
REF struc front
Struc length AA Ratio Flood
Curve
Replacement Value of Structure in Dollars
Value of Contents in Dollars
G_elev FF_elev Active Erosion Curve Armor Erosion
Indicator
72 072TOPS0349A 169 99 59 155 37 1 59 88,655$ 23,746$ 8.6 16.3 1 31 -1 272 072TOPS0353A 169 99 59 175 44 1 60 109,168$ 29,240$ 9.4 17.4 1 31 -1 272 072TOPS0364A 0 117 333 46 24 1 59 73,170$ 19,598$ 6.3 16.8 1 12 -1 272 072TOPSFF01A 169 99 59 175 40 1 56 315,125$ 94,537$ 8 20 1 31 -1 272 072TOPSFF01A 169 99 59 220 40 1 56 315,125$ 94,537$ 8 20 1 31 -1 272 072TOPSFF02A 169 99 59 180 40 1 56 315,125$ 94,537$ 8 20 1 31 -1 272 072TOPSHWY 119 64 999 134 34 1 64 105,756$ -$ 7.8 7.8 1 34 -1 0.5
-99973 0735TH_8202A 308 54 125 335 35 1 56 113,001$ 30,266$ 9 21 1 31 -1 273 0735TH_8210A 163 98 62 204 26 1 2 70,156$ 18,791$ 8.5 12.8 1 31 -1 0.573 0735TH_FF01A 261 47 125 275 40 1 56 315,125$ 94,537$ 9 21 1 31 -1 273 0736TH_8000A 308 54 125 314 14 1 1 24,189$ 6,479$ 8.8 11.8 1 31 -1 0.573 0736TH_8003A 308 54 125 330 40 1 56 315,125$ 94,537$ 9 21 1 31 -1 273 0736TH_8003S 0 0 0 323 8 1 60 504$ 135$ 9 21 1 31 -1 273 0736TH_8004A 261 47 125 269 50 1 1 39,462$ 10,570$ 9.3 11.8 1 31 -1 0.573 0736TH_8004S 0 0 0 265 12 1 60 1,344$ 360$ 9 21 1 31 -1 273 0736TH_8005A 261 47 125 261 53 1 55 76,509$ 20,492$ 12.9 15.2 1 31 -1 0.573 0736TH_8011A 163 98 62 169 32 1 60 54,639$ 14,635$ 9.7 19.2 1 31 -1 273 0737TH_7800A 308 54 125 326 32 1 59 70,395$ 18,855$ 8.7 10.7 1 31 -1 273 0737TH_7800S 334 0 111 325 12 1 60 952$ 255$ 9 21 1 31 -1 273 0737TH_7803A 308 54 125 308 34 1 59 96,221$ 25,772$ 9.1 20.4 1 31 -1 273 0737TH_7806A 261 47 125 262 34 1 59 67,465$ 18,070$ 8.9 16.6 1 31 -1 273 0737TH_7807A 261 47 125 261 30 1 59 69,415$ 18,592$ 9.8 11.7 1 31 -1 273 0737TH_7812A 163 98 62 157 41 1 59 78,904$ 21,134$ 8.5 16.2 1 31 -1 273 0738TH_7605A 261 47 125 268 30 1 59 76,990$ 20,621$ 9 21 1 31 -1 273 0738TH_7605S 308 54 125 328 12 1 60 1,680$ 450$ 9 21 1 31 -1 273 0738TH_7612A 163 98 62 163 40 1 60 96,554$ 25,861$ 9.3 17.3 1 31 -1 273 0738TH_FF01A 261 47 125 275 40 1 56 315,125$ 94,537$ 9 21 1 31 -1 273 0739TH_7401A 308 54 125 313 42 1 60 107,468$ 28,785$ 5.2 7.4 1 31 -1 273 0739TH_7405A 261 47 125 266 24 1 59 47,997$ 12,856$ 9 21 1 31 -1 273 0739TH_7415A 163 98 62 164 48 1 60 100,908$ 27,027$ 9.3 16.4 1 31 -1 273 073ISLAFF01A 308 54 125 330 40 1 56 315,125$ 94,537$ 9 21 1 31 -1 273 073TOPS0383A 163 98 62 162 57 1 1 19,597$ 5,249$ 8.8 11.8 1 31 -1 0.573 073TOPS0387A 163 98 62 180 30 1 59 54,026$ 14,471$ 9.4 16.7 1 31 -1 273 073TOPS0403A 163 98 62 191 24 1 60 158,061$ 42,335$ 9.1 17.1 1 31 -1 273 073TOPS0419A 163 98 62 175 36 1 59 55,637$ 14,902$ 9.7 19.2 1 31 -1 273 073TOPS0423A 163 98 62 181 40 1 59 59,171$ 15,848$ 11.2 18.7 1 31 -1 2

Attachment B-3to Appendix B - Economic Analysis
Surf City - North Topsail BeachFeasibility Study page 47of 51
Reach ID USACE_ID REF lot front
Lot length Lot width
REF struc front
Struc length AA Ratio Flood
Curve
Replacement Value of Structure in Dollars
Value of Contents in Dollars
G_elev FF_elev Active Erosion Curve Armor Erosion
Indicator
73 073TOPS0425A 163 98 62 181 26 1 59 44,579$ 11,940$ 11 19.5 1 31 -1 273 073TOPSFF01A 0 116 1000 62 40 1 56 315,125$ 94,537$ 9 21 1 31 -1 273 073TOPSFF02A 163 98 62 185 40 1 56 315,125$ 94,537$ 9 21 1 31 -1 273 073TOPSFF03A 163 98 62 165 40 1 56 315,125$ 94,537$ 9 21 1 31 -1 273 073TOPSFF04A 163 98 62 180 40 1 56 315,125$ 94,537$ 9 21 1 31 -1 273 073TOPSFF05A 163 98 62 180 40 1 56 315,125$ 94,537$ 9 21 1 31 -1 273 073TOPSFF06A 163 98 62 185 40 1 56 315,125$ 94,537$ 9 21 1 31 -1 273 073TOPSHWY 115 64 1000 130 34 1 64 105,868$ -$ 8.93 8.93 1 34 -1 0.5
-99974 0742ND_8800A 296 53 143 298 34 1 1 26,382$ 7,066$ 9 21 1 31 -1 0.574 0742ND_8800G 0 0 0 317 12 1 1 1,344$ 360$ 9 21 1 31 -1 274 0742ND_8801A 296 53 143 291 40 1 59 88,832$ 23,793$ 9 21 1 31 -1 274 0742ND_8804A 245 51 143 247 40 1 1 113,001$ 30,266$ 9 21 1 31 -1 0.574 0742ND_8804G 0 0 0 247 25 1 1 5,600$ 1,500$ 9 21 1 31 -1 274 0742ND_8805A 245 51 143 244 24 1 55 17,388$ 4,657$ 9 21 1 31 -1 274 0742ND_8805S 0 0 0 265 30 1 1 2,240$ 600$ 9 21 1 31 -1 274 0742ND_8806A 146 99 59 166 30 1 55 113,001$ 30,266$ 9 21 1 31 -1 274 0742ND_8811A 146 99 59 151 32 1 55 43,849$ 11,745$ 9 21 1 30 -1 274 0742ND_8904A 437 92 125 460 28 1 55 89,029$ 23,846$ 9 21 1 31 -1 274 0743RD_8603A 245 51 143 310 30 1 60 113,001$ 30,266$ 9 21 1 23 -1 274 0743RD_8607A 245 51 143 241 36 1 59 87,675$ 23,483$ 9 21 1 31 -1 274 0743RD_8610A 146 99 59 185 30 1 60 113,001$ 30,266$ 9 21 1 15 -1 274 0744TH_8404A 245 51 143 275 32 1 56 113,001$ 30,266$ 9 21 1 31 -1 274 0744TH_8409A 245 51 143 264 46 1 1 42,817$ 11,468$ 9 21 1 31 -1 0.574 0744TH_8411A 146 99 59 177 32 1 59 113,252$ 30,334$ 9 21 1 31 -1 274 0745TH_8203A 296 53 143 304 38 1 59 66,993$ 17,943$ 9 21 1 31 -1 274 0745TH_8205A 245 51 143 253 42 1 59 105,488$ 28,254$ 7.2 16.3 1 31 -1 274 0745TH_8211A 146 99 59 173 40 1 59 51,404$ 13,768$ 8.3 15.8 1 31 -1 274 0746TH_8803A 296 53 143 315 40 1 56 315,125$ 94,537$ 9 21 1 31 -1 274 074ISLA3504A 146 99 59 157 32 1 60 252,987$ 67,760$ 8.6 18.7 1 23 -1 274 074ISLA3507A 437 92 125 434 32 1 60 195,931$ 52,478$ 4 14.2 1 31 -1 274 074ISLAFF01A 296 53 143 320 40 1 56 315,125$ 94,537$ 9 21 1 31 -1 274 074ISLAFF02A 296 53 143 315 40 1 56 315,125$ 94,537$ 9 21 1 31 -1 274 074ISLAFF03A 296 53 143 318 40 1 56 315,125$ 94,537$ 9 21 1 31 -1 274 074TOPS0464A 0 100 500 64 18 1 55 63,515$ 17,012$ 6 20.9 1 30 -1 274 074TOPS0465A 146 99 59 171 32 1 60 41,268$ 11,053$ 7.1 15.6 1 31 -1 274 074TOPS0469A 146 99 59 205 28 1 60 132,579$ 35,510$ 8.4 9.2 1 31 -1 2

Attachment B-3to Appendix B - Economic Analysis
Surf City - North Topsail BeachFeasibility Study page 48of 51
Reach ID USACE_ID REF lot front
Lot length Lot width
REF struc front
Struc length AA Ratio Flood
Curve
Replacement Value of Structure in Dollars
Value of Contents in Dollars
G_elev FF_elev Active Erosion Curve Armor Erosion
Indicator
74 074TOPS0479A 146 99 59 185 30 1 59 1,044$ 280$ 9.9 17.1 1 31 -1 274 074TOPS0486A 0 100 500 39 24 1 59 42,608$ 11,412$ 7.2 18.2 1 2 -1 274 074TOPS0499A 146 99 59 185 35 1 55 224,013$ 60,000$ 9.1 21.1 1 31 -1 274 074TOPS0503A 146 99 59 178 40 1 55 77,702$ 20,812$ 9.9 18 1 30 -1 274 074TOPS0517A 146 99 59 151 30 1 55 37,075$ 9,930$ 11.1 17.8 1 31 -1 274 074TOPS0523A 146 99 59 152 66 1 60 99,322$ 26,603$ 10.4 14.9 1 31 -1 274 074TOPS0527A 146 99 59 149 34 1 59 113,704$ 30,455$ 9.8 18.2 1 31 -1 274 074TOPS0527G 0 0 0 200 40 1 60 12,195$ 3,266$ 9 21 1 31 -1 274 074TOPSFF01A 146 99 59 175 40 1 56 315,125$ 94,537$ 9 21 1 31 -1 274 074TOPSFF02A 146 99 59 180 40 1 56 315,125$ 94,537$ 9 21 1 31 -1 274 074TOPSFF03A 146 99 59 175 40 1 56 315,125$ 94,537$ 9 21 1 31 -1 274 074TOPSHWY 102 64 892 117 34 1 64 94,433$ -$ 8.06 8.06 1 34 -1 0.5
-99975 075CALI0101A 440 119 111 471 30 1 60 392,497$ 105,127$ 6.6 17 1 31 -1 275 075CALI0105A 440 119 111 486 30 1 60 392,659$ 105,170$ 6 18 1 31 -1 275 075HERO0101A 440 119 111 466 30 1 60 100,689$ 26,969$ 6.2 16.3 1 31 -1 275 075HERO0105A 440 119 111 466 30 1 60 100,689$ 26,969$ 6 18 1 31 -1 275 075ISLA3512A 0 353 67 159 28 1 60 155,643$ 41,688$ 7.8 18.1 1 5 -1 275 075ISLA3518A 0 353 67 165 34 1 60 257,807$ 69,052$ 8.9 21.4 1 5 -1 275 075ISLA3522A 0 353 67 182 25 1 60 228,462$ 61,192$ 7.9 19.7 1 5 -1 275 075ISLA3530A 0 353 67 163 32 1 60 207,752$ 55,644$ 16.1 16.3 1 5 -1 0.575 075ISLA3536A 0 353 67 215 30 1 55 164,033$ 43,935$ 6 18 1 30 -1 275 075ISLA3541A 440 119 111 484 30 1 60 113,738$ 30,464$ 5.4 14 1 31 -1 275 075ISLA3542A 0 353 67 135 40 1 60 71,398$ 19,124$ 6.9 19 1 15 -1 275 075ISLA3546A 0 353 67 198 28 1 60 97,027$ 25,988$ 11.2 24.4 1 23 -1 275 075ISLA3560A 0 353 67 264 26 1 60 126,875$ 33,983$ 6 18 1 23 -1 275 075ISLA3562A 0 353 67 133 47 1 60 213,694$ 57,236$ 6.6 21.1 1 5 -1 275 075ISLA3575A 440 119 111 530 24 1 59 49,265$ 13,195$ 6.1 14.2 1 31 -1 275 075ISLA3584A 0 353 67 227 32 1 60 223,159$ 59,772$ 6 18 1 23 -1 275 075ISLA3585A 440 119 111 528 32 1 55 48,554$ 13,005$ 6.1 13.9 1 31 -1 275 075ISLA3586A 0 353 67 239 33 1 59 177,097$ 47,434$ 9.8 0 1 12 -1 275 075ISLA3588A 0 353 67 227 52 1 60 317,694$ 85,092$ 7.1 22.4 1 5 -1 275 075ISLA3588G 0 0 0 264 30 1 60 12,195$ 3,266$ 6 18 1 31 -1 275 075ISLAFF01A 440 119 111 450 40 1 56 315,125$ 94,537$ 6 18 1 31 -1 275 075ISLAFF02A 0 353 67 260 40 1 56 315,125$ 94,537$ 6 18 1 31 -1 275 075ISLAFF03A 0 353 67 260 40 1 56 315,125$ 94,537$ 6 18 1 31 -1 275 075ISLAFF04A 440 119 111 450 40 1 56 315,125$ 94,537$ 6 18 1 31 -1 2

Attachment B-3to Appendix B - Economic Analysis
Surf City - North Topsail BeachFeasibility Study page 49of 51
Reach ID USACE_ID REF lot front
Lot length Lot width
REF struc front
Struc length AA Ratio Flood
Curve
Replacement Value of Structure in Dollars
Value of Contents in Dollars
G_elev FF_elev Active Erosion Curve Armor Erosion
Indicator
75 075ISLAFF05A 0 353 67 400 40 1 56 315,125$ 94,537$ 6 18 1 31 -1 275 075_210HWY 353 64 1000 368 34 1 64 105,868$ -$ 6.87 6.87 1 34 -1 0.5
-99976 076ISLA3592A 0 360 71 233 65 1 60 267,991$ 71,779$ 6.9 11.6 1 23 -1 276 076ISLA3600A 0 360 71 278 28 1 2 77,984$ 20,888$ 8 20 1 31 -1 0.576 076ISLA3605A 449 145 167 509 38 1 59 65,724$ 17,604$ 5.7 13.3 1 31 -1 276 076ISLA3606A 0 360 71 226 40 1 59 283,726$ 75,993$ 14.3 24.1 1 10 -1 0.576 076ISLA3612A 0 360 71 171 26 1 60 172,622$ 46,236$ 9.2 12.2 1 5 -1 276 076ISLA3618A 0 360 71 172 32 1 60 134,143$ 35,929$ 7.6 19.2 1 15 -1 276 076ISLA3622A 0 360 71 177 30 1 60 106,771$ 28,598$ 8.1 18.9 1 5 -1 276 076ISLA3632A 0 360 71 255 24 1 60 174,913$ 46,849$ 8.4 18 1 23 -1 276 076ISLA3634A 0 360 71 258 24 1 56 177,843$ 47,634$ 8.4 17.9 1 30 -1 276 076ISLA3638A 0 360 71 261 28 1 56 285,638$ 76,506$ 8 20 1 30 -1 276 076ISLA3644A 0 360 71 162 32 1 60 220,343$ 59,017$ 8.7 15.2 1 5 -1 276 076ISLA3648A 0 360 71 248 24 1 60 179,403$ 48,052$ 17 21.1 1 13 -1 0.576 076ISLA3655A 449 145 167 482 27 1 2 106,235$ 28,454$ 8 20 1 31 -1 0.576 076ISLA3655G 0 0 0 500 40 1 1 113,704$ 30,455$ 8 20 1 31 -1 276 076ISLA3658A 0 360 71 181 32 1 60 104,859$ 28,086$ 8.1 10.2 1 17 -1 276 076ISLAFF01A 465 145 167 510 40 1 56 315,125$ 94,537$ 8 20 1 31 -1 276 076ISLAFF02A 449 145 167 510 40 1 56 315,125$ 94,537$ 8 20 1 31 -1 276 076ISLAFF03A 449 145 167 495 40 1 56 315,125$ 94,537$ 8 20 1 31 -1 276 076ISLAFF04A 449 145 167 480 40 1 56 315,125$ 94,537$ 8 20 1 31 -1 276 076ISLAFF05A 0 360 71 220 40 1 56 315,125$ 94,537$ 8 20 1 31 -1 276 076_210HWY 362 64 1000 377 34 1 64 105,868$ -$ 6.43 6.43 1 34 -1 0.5
-99977 077ISLA3674A 0 318 71 192 42 1 56 131,103$ 35,115$ 11.4 12.1 1 30 -1 277 077ISLA3720A 0 318 71 201 34 1 59 314,031$ 84,111$ 7 19 1 12 -1 277 077ISLA3730A 0 318 71 202 36 1 60 155,075$ 41,536$ 7 18.5 1 15 -1 277 077ISLA3734A 0 318 71 475 40 1 60 163,722$ 43,852$ 7 19 1 27 -1 277 077ISLA3735A 421 162 111 199 35 1 56 113,001$ 30,266$ 7 19 1 31 -1 277 077ISLA3740A 0 318 71 124 25 1 60 164,795$ 44,139$ 5.4 18.9 1 15 -1 277 077ISLA3744A 0 318 71 119 28 1 60 210,300$ 56,327$ 8.3 16.4 1 5 -1 277 077ISLA3748A 0 318 71 187 50 1 60 137,118$ 36,726$ 7 19 1 15 -1 277 077ISLAFF01A 0 318 71 200 40 1 56 315,125$ 94,537$ 7 19 1 31 -1 277 077ISLAFF02A 405 162 111 480 40 1 56 315,125$ 94,537$ 7 19 1 31 -1 277 077ISLAFF03A 0 318 71 215 40 1 56 315,125$ 94,537$ 7 19 1 31 -1 277 077ISLAFF04A 405 162 111 485 40 1 56 315,125$ 94,537$ 7 19 1 31 -1 2

Attachment B-3to Appendix B - Economic Analysis
Surf City - North Topsail BeachFeasibility Study page 50of 51
Reach ID USACE_ID REF lot front
Lot length Lot width
REF struc front
Struc length AA Ratio Flood
Curve
Replacement Value of Structure in Dollars
Value of Contents in Dollars
G_elev FF_elev Active Erosion Curve Armor Erosion
Indicator
77 077ISLAFF05A 0 318 71 220 40 1 56 315,125$ 94,537$ 7 19 1 31 -1 277 077ISLAFF06A 405 162 111 475 40 1 56 315,125$ 94,537$ 7 19 1 31 -1 277 077ISLAFF07A 0 318 71 215 40 1 56 315,125$ 94,537$ 7 19 1 31 -1 277 077ISLAFF08A 405 162 111 470 40 1 56 315,125$ 94,537$ 7 19 1 31 -1 277 077ISLAFF09A 0 318 71 475 40 1 56 315,125$ 94,537$ 7 19 1 31 -1 277 077ISLAFF10A 405 162 111 425 40 1 56 315,125$ 94,537$ 7 19 1 31 -1 277 077ISLAFF11A 0 318 71 205 40 1 56 315,125$ 94,537$ 7 19 1 31 -1 277 077ISLAFF12A 405 162 111 465 40 1 56 315,125$ 94,537$ 7 19 1 31 -1 277 077ISLAFF13A 0 318 71 195 40 1 56 315,125$ 94,537$ 7 19 1 31 -1 277 077ISLAFF14A 405 162 111 440 40 1 56 315,125$ 94,537$ 7 19 1 31 -1 277 077ISLAFF15A 405 162 111 440 40 1 56 315,125$ 94,537$ 7 19 1 31 -1 277 077_210HWY 318 64 1000 333 34 1 64 105,868$ -$ 4.89 4.89 1 34 -1 0.5
-99978 078ISLA3752A 0 322 56 183 24 1 56 113,722$ 30,460$ 7 19 1 30 -1 278 078ISLA3756A 0 322 56 187 26 1 60 120,166$ 32,185$ 7 19 1 23 -1 278 078ISLA3759A 408 183 100 450 35 1 60 113,001$ 30,266$ 7 19 1 31 -1 278 078ISLA3760A 0 322 56 185 40 1 59 104,715$ 28,047$ 7 19 1 12 -1 278 078ISLA3764A 0 322 56 200 30 1 60 1,044$ 280$ 7 19 1 15 -1 278 078ISLA3767A 408 183 100 450 30 1 60 113,001$ 30,266$ 7 19 1 31 -1 278 078ISLA3768A 0 322 56 200 30 1 60 1,044$ 280$ 7 19 1 15 -1 278 078ISLA3775A 408 183 100 450 35 1 60 113,001$ 30,266$ 7 19 1 31 -1 278 078ISLA3776A 0 322 56 195 32 1 56 94,689$ 25,362$ 7.4 15.9 1 31 -1 278 078ISLA3801A 408 183 100 450 35 1 60 113,001$ 30,266$ 7 19 1 31 -1 278 078ISLA3802A 0 322 56 227 33 1 56 84,302$ 22,580$ 7 19 1 30 -1 278 078ISLA3803A 408 183 100 450 35 1 60 113,001$ 30,266$ 7 19 1 31 -1 278 078ISLA3804A 0 322 56 203 48 1 56 172,820$ 46,288$ 8 17.5 1 30 -1 278 078ISLA3805A 408 183 100 429 34 1 60 83,304$ 22,312$ 5.9 14.6 1 31 -1 278 078ISLA3808A 0 322 56 119 40 1 59 83,703$ 22,419$ 6.6 11.4 1 12 -1 278 078ISLA3814A 0 322 56 197 40 1 56 126,815$ 33,966$ 7 19 1 30 -1 278 078ISLA3824A 0 322 56 138 32 1 60 193,948$ 51,947$ 7.3 13.7 1 5 -1 278 078ISLA3825A 408 183 100 488 40 1 55 58,126$ 15,569$ 7 19 1 31 -1 278 078ISLA3828A 0 322 56 148 32 1 55 60,259$ 16,140$ 8.4 19.3 1 30 -1 278 078ISLAFF01A 408 183 100 450 40 1 56 315,125$ 94,537$ 7 19 1 31 -1 278 078ISLAFF02A 408 183 100 455 40 1 56 315,125$ 94,537$ 7 19 1 31 -1 278 078ISLAFF03A 0 322 56 200 40 1 56 315,125$ 94,537$ 7 19 1 31 -1 278 078ISLAFF04A 0 322 56 225 40 1 56 315,125$ 94,537$ 7 19 1 31 -1 278 078ISLAFF05A 0 322 56 240 40 1 56 315,125$ 94,537$ 7 19 1 31 -1 2

Attachment B-3to Appendix B - Economic Analysis
Surf City - North Topsail BeachFeasibility Study page 51of 51
Reach ID USACE_ID REF lot front
Lot length Lot width
REF struc front
Struc length AA Ratio Flood
Curve
Replacement Value of Structure in Dollars
Value of Contents in Dollars
G_elev FF_elev Active Erosion Curve Armor Erosion
Indicator
78 078ISLAFF08A 0 80 50 175 40 1 56 315,125$ 94,537$ 7 19 1 31 -1 278 078MYRT0209A 0 322 56 188 40 1 55 113,001$ 30,266$ 7 19 1 31 -1 278 078MYRT0211A 0 322 56 191 35 1 59 113,001$ 30,266$ 7 19 1 31 -1 278 078MYRTFF01A 0 322 56 220 40 1 56 113,704$ 30,455$ 7 19 1 31 -1 278 078SEA_0100A 408 90 100 433 33 1 60 80,180$ 21,475$ 7 19 1 31 -1 278 078SEA_0110A 498 93 100 534 35 1 60 80,180$ 21,475$ 7 19 1 31 -1 278 078_210HWY 322 64 998 337 34 1 64 105,656$ -$ 4.69 4.69 1 34 -1 0.5
-999

1
April 21, 2002Erosion Damage Thresholds
in North Carolina
by Spencer M. Rogers Jr.North Carolina Sea Grant
INTRODUCTION
As the coast of North Carolina developed over the last century, coastal construction hasexperienced significant damage from hurricanes and other coastal storms, as well as long-termerosion. Construction practices have evolved due to changes in public perception of storm riskand several construction regulation programs. Several important changes in practice did notoccur as a gradual process but instead in a series of identifiable steps in time. Significant eventsaffecting construction practice include: a series of severe hurricanes and coastal storms in the1950s; the mid-1960s adoption and later revision of the North Carolina State Building Code, thesecond oldest hurricane-resistant building code in the U.S.; and the 1978 implementation andlater revisions of the NC Coastal Area Management Act. The evolution of coastal constructionpractice and general thresholds for damage has been described by Rogers (2001). This reportapplies to those observed changes to develop methods to estimate damage to coastal structuresdue to storm-induced erosion in North Carolina. A comprehensive inventory of buildingconstruction details and other structures can be combined with commonly unmeasurableconstruction details that can be inferred from the construction date and the known evolution ofgeneral construction practices.
The effect of construction regulations is always limited by the effectiveness of localenforcement and the speed of adoption as general construction practice. Experience from severestorms and long-term erosion in North Carolina has shown that the building code and regulatoryenforcement has been generally good; regulatory compliance in coastal communities has beenconsistently high; and the adoption of new standards by local contractors timely. The use ofconstruction dates to estimate hidden construction parameters affecting erosion resistance istherefore a reasonable assumption and an improvement over previous methods to estimateerosion damage.
North Carolina’s buildings and other development have evolved due to a unique stormand regulatory history. The recommendations in this report will not directly apply to othercoastal areas. However, locally-customized construction factors can be developed for anyshoreline that could be used to significantly improve erosion damage predictions over previouslyused methods.
The most accurate method to predict future damage is to perform a building by buildingdamage evaluation of historical severe storms on shorelines with similar development andconstruction standards. At this time detailed studies do not exist. Therefore, the damage thresholdssuggested for North Carolina and the erosion damage curves in Appendix A are based on theopinion of the author, formed over 27 years of building damage evaluations, following most ofthe worst storms on the East and Gulf coasts, and for most of that time, observations of the NorthCarolina coast on a daily basis. A resume is included as Appendix B.

2
GENERAL APPROACH
To improve erosion damage estimates, buildings can be separated into two generalclasses: small buildings (primarily single family houses) and larger commercial buildings. Eachclass is further separated by construction details determined by a local building inventory andassumed local construction practice based on construction date. The erosion resistance of abuilding can seldom be determined by construction details alone. The local ground elevationsignificantly affects the effectiveness of the construction standards. Local topographical datacan be used to separate shorelines into two general types with high or low elevation buildingsites.
SHORELINE TYPES
On ocean shorelines, zones of storm damage have been observed that can separated byground elevation into two types (Rogers, 1990) shown in Figure 1. The high elevation type isdefined as sufficiently elevated to prevent wave effects unless subject to erosion (Figure 1-A). The seaward of two damage zones is defined by the area subject to erosion. Buildings in theerosion zone are subject to combined damage from erosion, wave impacts and flooding. Thehigh elevation of the more landward zone protects the buildings from erosion, waves andflooding. Both zones are subject to storm winds.
Low elevation shorelines with overtopped dunes have four building damage zones(Figure 1B). The seaward zone is defined as the area experiencing erosion but also subject towaves, and flooding. The next landward zone is defined as the area subject to breaking wavescapable of destroying solid building walls and foundations. It includes the area subject tooverwash deposition. The National Flood Insurance Program has traditionally identified thethreshold for destructive wave heights as 3 feet (Corps of Engineers, 1975). More recentresearch indicates that a breaking wave of 1.5 feet will destroy common solid walls andfoundations (Tung et al, 1999) . The next landward zone is defined by flooding but nosignificant wave damage. The landward-most zone has sufficient elevation to avoid erosion,waves and flooding but like the more seaward zones, may be subject to high winds.

3
Figure 1: SHORELINE TYPES
A. High dune, no overtopping1. Erosion zone with waves and flooding2. High ground (no erosion, waves or flooding)
HIGH GROUND EROSION, WAVES & FLOODING
B. Small overtopped dune1. Erosion zone with waves and flooding 2. Waves zone with overwash deposition and flooding3. Stable ground elevation with flooding4. High ground: (no erosion, waves or flooding)
HIGH GROUND FLOODING WAVES EROSION
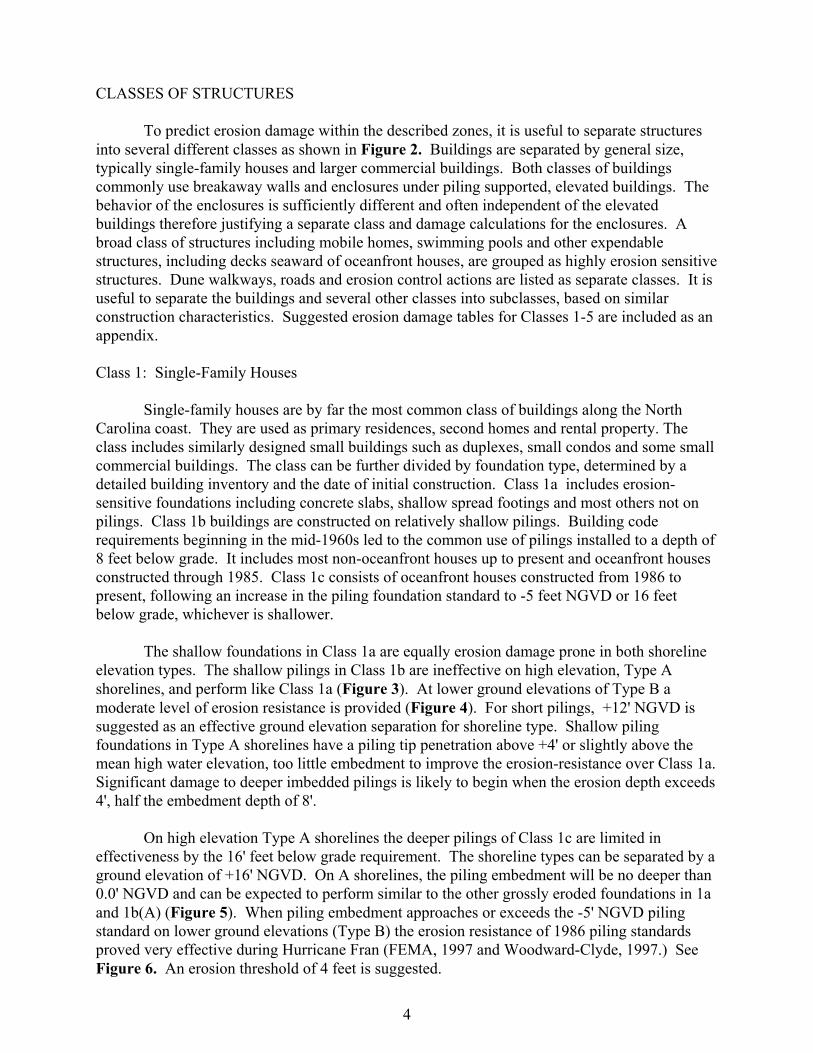
4
CLASSES OF STRUCTURES
To predict erosion damage within the described zones, it is useful to separate structuresinto several different classes as shown in Figure 2. Buildings are separated by general size,typically single-family houses and larger commercial buildings. Both classes of buildingscommonly use breakaway walls and enclosures under piling supported, elevated buildings. Thebehavior of the enclosures is sufficiently different and often independent of the elevatedbuildings therefore justifying a separate class and damage calculations for the enclosures. Abroad class of structures including mobile homes, swimming pools and other expendablestructures, including decks seaward of oceanfront houses, are grouped as highly erosion sensitivestructures. Dune walkways, roads and erosion control actions are listed as separate classes. It isuseful to separate the buildings and several other classes into subclasses, based on similarconstruction characteristics. Suggested erosion damage tables for Classes 1-5 are included as anappendix.
Class 1: Single-Family Houses
Single-family houses are by far the most common class of buildings along the NorthCarolina coast. They are used as primary residences, second homes and rental property. Theclass includes similarly designed small buildings such as duplexes, small condos and some smallcommercial buildings. The class can be further divided by foundation type, determined by adetailed building inventory and the date of initial construction. Class 1a includes erosion-sensitive foundations including concrete slabs, shallow spread footings and most others not onpilings. Class 1b buildings are constructed on relatively shallow pilings. Building coderequirements beginning in the mid-1960s led to the common use of pilings installed to a depth of8 feet below grade. It includes most non-oceanfront houses up to present and oceanfront housesconstructed through 1985. Class 1c consists of oceanfront houses constructed from 1986 topresent, following an increase in the piling foundation standard to -5 feet NGVD or 16 feetbelow grade, whichever is shallower.
The shallow foundations in Class 1a are equally erosion damage prone in both shorelineelevation types. The shallow pilings in Class 1b are ineffective on high elevation, Type Ashorelines, and perform like Class 1a (Figure 3). At lower ground elevations of Type B amoderate level of erosion resistance is provided (Figure 4). For short pilings, +12' NGVD issuggested as an effective ground elevation separation for shoreline type. Shallow pilingfoundations in Type A shorelines have a piling tip penetration above +4' or slightly above themean high water elevation, too little embedment to improve the erosion-resistance over Class 1a. Significant damage to deeper imbedded pilings is likely to begin when the erosion depth exceeds4', half the embedment depth of 8'.
On high elevation Type A shorelines the deeper pilings of Class 1c are limited ineffectiveness by the 16' feet below grade requirement. The shoreline types can be separated by aground elevation of +16' NGVD. On A shorelines, the piling embedment will be no deeper than0.0' NGVD and can be expected to perform similar to the other grossly eroded foundations in 1aand 1b(A) (Figure 5). When piling embedment approaches or exceeds the -5' NGVD pilingstandard on lower ground elevations (Type B) the erosion resistance of 1986 piling standardsproved very effective during Hurricane Fran (FEMA, 1997 and Woodward-Clyde, 1997.) SeeFigure 6. An erosion threshold of 4 feet is suggested.

5
Figure 2: CLASSES OF COASTAL BUILDINGS AND OTHER STRUCTURES
1. Single-family house (includes duplexes & small condos )a. Slab foundation or shallow perimeter footing and interior piersb. Shallow piling foundation (~ 8' below grade: oceanfront, 1965 thru 1985 and
farther inland, all dates.)c. Deeper piling foundation (piling penetration to -5' NGVD or 16' below grade,
whichever is shallower, 1986 and later, oceanfront only)
2. Commercial or large multi-family buildingsa. Slab or other on-grade foundationb. Second floor and above piling supported, lowest floor on grade (common in
hotel and condos)c. Fully piling supported, deep pilings, [some wood-frame, pre-1985 oceanfront
condos may have shallow pilings as in 1b above]d. Building specific evaluation (fishing piers, etc.)
3. Underhouse enclosures: may be unfinished or finished interiorUnfinished enclosures have fixed cost per either SF or linear wall footageFinished enclosure valued as ratio of total finished floor area
a. None (parking slab?)b. Small (<300 SF)c. Partial (>300 SF, < full)d. Full enclosure
4. Mobile homes, utility buildings, detached garages, decks seaward of oceanfront houses,
gazebos, pools etc
5. Dune walkwaysa. Housesb. Public/commercial
6. Paved roads and parking lotsa. Damageb. Overwash excavationc. Sand sifting operations
7. Erosion control structures and actionsa. Beach scrapingb. Emergency sandbags

6
Figure 3: Short piling foundation failures (Class 1b) on high-elevation shoreline(Type A). Location: Kure Beach NC after Hurricane Fran.
Figure 4: Short piling foundation (Class 1b) near failure on low-elevation shoreline(Type B). Location: Surf City NC after Hurricane Fran.

7
Figure 6: Houses on 1996 pilings (Class 1c) on low-elevation shoreline (Type B). Location: Topsail Island after Hurricane Fran.
Figure 5: House under construction with piling 16 feet below grade (Class 1c) on high-elevation dune (Type A). Dune elevation above +16 feet NGVD makes erosion failuremore likely. Location: Emerald Isle NC.

8
Figure 7: Slab foundation failure (Class 1a & 2a) beside commercial/deep-pilingstructure (Class 2c) on high-elevation shoreline (Type A). Location: Surf City NCafter Hurricane Fran.
Figure 8: Piling-supported hotel with lower floor on unsupported slab (Class 2b)on low-elevation shoreline (Type B). Location: Wrightsville Beach NC afterHurricane Fran.

9
Figure 9: Piling-supported hotel after failureof unsupported, first-floor slab (Class 2b) onlow-elevation shoreline (Type B). Location: Horry County after Hurricane Hugo.
Class 2: Large Commercial Buildings
The class of large buildings includeshotels, large condos, restaurants, and most othercommercial buildings. These generally largerbuildings are constructed to a separateperformance building code that does not includethe specific piling depth requirements found inClass 1. The large mass of the buildingstypically dictates, that where used, pilingembedment depths are significantly greater thanfor small buildings. Class 2a buildings areconstructed on shallow, erosion-sensitivefoundations, typical of older commercialbuildings (Figure 7). Class 2c is fullysupported on a piling foundation and has anerosion tolerance as good or better than the bestsmall buildings (Figure 7.) Class 2b is a hybridfoundation common in hotel construction. Allof the building walls and all floors above thefirst floor are supported on pilings and buriedgrade beams that are relatively erosion tolerant(Figure 8). The lowest finished floor issupported on a slab foundation supported ongrade between the foundation pilings (Figure9). The lowest floor is therefore highly erosionsensitive. Wave and erosion damage occurs tothe lowest floor where much of the value of the building is concentrated, but higher floors arerelatively undamaged. It is suggested that total erosion damage be estimated by treating thelowest floor as a slab (Class 1a and 2a)but weighted for twice the average square-foot value forthe building, and added to damage in higher floors as applied in Class 1c and 2c.
Class 3: Under-building Enclosures
Many buildings of all ages enclose part or all of the area under piling-supported elevatedbuildings. Present regulations allow lower level enclosures for the purposes of parking, storageor access to the elevated building. Any enclosure must be unfinished and include no equipmentsuch as a heat pump, water heater, washer or dryer. In some communities it is common forpiling-supported houses constructed prior to adoption of minimum floor elevation requirements,to have fully finished underhouse enclosures supported on a slab foundation. Althoughprohibited in more recent construction, small finished enclosures and unauthorized equipmentare not uncommon. Erosion or waves frequently destroy the lower level and equipment, leavingthe elevated floors in place.
Some near-ocean buildings are required to use specific designs for breakaway enclosurewalls. More recent research has shown that standard wood framing adequately functions tobreakaway from the piling foundation and elevated building, negating the need for a specific

10
breakaway design (Tung et al, 1999). Whether it was designed to breakaway is a moot issue. Waves and/or erosion will predictably cause all enclosure walls to breakaway.
Enclosures are common in both Class 1 and Class 2 buildings. Enclosures are supportedon slab foundations that behave quite differently in erosion than the rest of a piling-supportedbuilding. Recent building inventory collections have included separate descriptions of the sizeand finish of the enclosures. Therefore overall damage calculations can be simplified andimproved by considering enclosures as Class 4 structures, separate from the rest of the elevatedbuildings. The National Flood Insurance premium rating system serves to encourage enclosuresizes into four groups as outlined in Figure 2. Open buildings with no enclosures may still haveparking slabs that are subject to erosion damage. In NFIP V-zones, enclosures smaller than 300SF can be rated by local flood insurance agents. Larger enclosures must submit information toWashington for rating. Full enclosures are common near some shorelines particularly in A-zones where flood insurance rates are not affected by the size or presence of the enclosures.
The value of the enclosure will vary depending on whether it is finished or unfinished. Finished areas can be reasonably valued at the SF rate of the elevated building. Unfinishedenclosures are obviously lower in value.
Class 4: Mobile Homes and Other Expendable Structures
Mobile homes and a group of other expendable structures are highly erosion sensitive,failing quickly after only partial undermining. Mobile homes in this class use shallow,mortarless concrete block piers, tied down with screw anchors. A small number of mobilehomes have recently been installed on traditional piling foundations and should be evaluated asClass 1 structures. North Carolina has historically considered expendable structures to includesmall utility buildings, parking surfaces, gazebos, swimming pools and tennis courts. Alsoincluded are the open decks seaward of most oceanfront houses. Building setback linesgenerally apply to the roofed building, but expendable decks of limited size are allowed to beconstructed contiguous to the building, seaward of the setback line. The building code allowsthe common practice of using short pilings on the decks compared to required depth for thebuilding (FEMA, 1997.) Oceanfront decks are therefore far more erosion-sensitive than theadjacent buildings and are more accurately grouped with Class 4. Detached garages are morecommon in older development and are affected similarly by erosion.
Class 5: Dune walkways
Dune walkways are permitted as expendable structures and restricted in piling depth torequire erosion damage rather than interfering with access along the beach. Walkway damagediffers from Class 4 only in the rate that erosion damage progresses. The relatively long, shoreperpendicular structures can be assumed to experience a linear increase in damage with thepercentage of erosion rather than a quick total loss as in Class 4. Houses and commercial/publicwalkways differ primarily in value per linear foot of walkway . Commercial/public walkwaystend to be a few feet wider and use heavier materials, therefore have a higher value per unitlength.

11
Class 6: Paved Roads and Parking Areas
On-grade paving is destroyed by shallow erosion, requiring replacement and/orrelocation. In contrast overwash deposits bury the paving without significant damage. Damagevalues result from the effort required to excavate the surface, returning it to its intended function. Road repair and replacement costs should be available from the NC Department ofTransportation. Overwash excavation costs may also be available from the same source forHighway 12 or from local governments. Most near-ocean overwash deposits that are excavatedfrom roads or developed areas are required to be replaced on or near the beach. In our recenthurricanes, the abundance of construction debris excavated with overwash sand has led to majorsand sifting projects before being returned to the beach. The cost of handling has been estimatedin some communities to have exceed $15/CY of excavated sand. The cost of past efforts shouldbe available from local governments or NC Emergency Management since they are included inFEMA Public Assistance reimbursements.
Class 7: Erosion control structures and responses
Most erosion control structures on the oceanfront are prohibited by NC regulations. However emergency sandbag revetments and several other practices are pre-authorized bygeneral permits and are in common use. Most permanent structures, including buildings, areeligible for an emergency sand bag permit if erosion moves the vegetation line closer than 20feet from the building. Roads and septic tanks are included. Mobile homes and detachedgarages would also qualify but most other expendable structures in Class 4, including oceanfrontdecks, would not be eligible. The emergency sandbag revetments are limited in time (two tofive years, depending on building size, longer if beach nourishment is under study) and in size. The size limit is approximately 6 feet high and 20 feet wide. Typical practice uses bags filled toroughly 2 feet high by four feet wide in a sloping revetment three bags high and three wide for atotal of 6 rows of bags. A property owner on Topsail Island recently received three bids ofapproximately $20 per linear foot of row of bags or $120 per linear foot for a typical 6-bag crosssection. Cooperating adjacent owners pay for their oceanfront lot width. Isolated owners mustpay for extra bags to protect the one or both sides of their structures.
Beach scraping, excavating sand from the berm or foreshore and pushing it to justlandward of the vegetation line or erosion scarp is the most common erosion control response inuse on the NC coast. Funding and permitting varies by community. Work is contracted byindividual property owners, or in some cases by local government or homeowners associationsfor longer shorelines under their management. Several research projects have concluded thatbeach scraping within the limits of the state permit conditions has no significant positive ornegative impact on the local erosion rate. Although proven to be of little benefit, beach scrapingis a common and real cost, directly by the property owner or indirectly through government orhomeowner association assessments. The frequency and cost of beach scraping can usually bedetermined by contacting the local government or building inspector.

12
USING SBEACH TO PREDICT BUILDING DAMAGE
SBEACH erosion model was developed to predict two-dimensional beach profilechanges with varying storm surge, wave and sediment size conditions. It is intended to predictbar movement, overwash and shoreline recovery better than previously available models. It wasnot developed to predict erosion damage to buildings and has limitations if directly used for thatpurpose. Most of the model calibration came from large scale wave tank data and field studiesfollowing storms with moderate surge elevations. Calibration for design level storms (50 to 100-year events) appears to have been minimal.
Since SBEACH was designed to better model dune overtopping and overwash depositionit should better represent low elevation shorelines where dunes are flattened and overwash isdeposited farther landward. The predicted overwash terrace should provide a better profile forpredicting depth limited wave heights around buildings on the second row and farther inland. For predicting erosion threats to typical oceanfront buildings it is suspected that the modelunderestimates erosion depth. It may not be a significant issue on shallow foundations, such asslabs, but becomes a particular problem when predicting the erosion failure threshold for shallowpilings. Reasonable results are likely to be obtained by using a modeled erosion depth thresholdthat is shallower (2' maybe?) than observed in the field (on the order of 4' for 8' pilings in severestorms.) Several sections of Topsail Island that lost 150+ similar buildings on short pilings inFran would be useful area to calibrate SBEACH for the erosion failure threshold for lowelevation shorelines with overtopped dunes.
During extreme storms, those most likely to cause erosion damage to buildings, highdunes or unconsolidated bluffs are observed to retreat with near vertical erosion scarps. Slopessteeper than 75 degrees appear common. There is sufficient soil moisture in the dune sands toallow the steep slope to remain stable for a period of days to weeks. Eventually the bluff facewill dry and avalanche to a slope flatter than the angle of repose for the sand. The severe erosiondepth caused by the retreat of the bluff during the storm places extreme conditions on bothshallow and deep piling foundations. However, after the storm there is usually sufficient time tostabilize the top of the bluff, avoiding the additional horizontal erosion that would otherwiseoccur by avalanching.
In contrast, SBEACH adjusts the erosion scarp by continuously avalanching the erodedscarp (SBEACH Report #1 VI, page 171.) When the slope exceeds 28 degrees the modelretreats the top of the erosion scarp and redistributes the sand volume to a slope of 10 degrees ateach time step. The assumptions appear to be coded into the software and are not variableparameters. The theoretical slope may approach 28 degrees, much flatter than observedfollowing severe storms. However, a few sample runs in dunes higher than the wave runup limit, consistently resulted in slopes of only 8 to 9 degrees, far flatter than the roughly 75 degreesobserved in the field. The model profile output gives the appearance of a steep eroded dune facebut is misleading due to the horizontal to vertical distortions in the default profile scales. Theaffect is not unique to SBEACH. Report #1 VII p. 217-9 indicates the Kriebel model predictseven flatter slopes.
There is no obvious method to adjust SBEACH to generate a more realistic erosionscarp or to adjust the observed erosion threshold depths of the different foundation types to fitthe model. Selection of an erosion threshold in the model is necessary to determine the

13
Figure 10: Second-row dune left after Hurricane Fran providedprotection during Hurricanes Bonnie, Dennis and Floyd. Location NorthTopsail Beach after Hurricane Floyd.
percentage of structure erosion in Figure 2 before the percentage of damage can be estimated. Calibration tests in SBEACH Report #4 appear to indicate the model underestimates thehorizontal dune retreat more often than overestimates. The best vertical erosion depth for themodel is likely to be lower than observed for actual damage. For shallow foundation classes anerosion threshold of 0.5' to 1' appears reasonable. For the piling foundation classes, an erosionthreshold of 4' is realistic in the field but 2' or less in SBEACH may generate more realisticdamage estimates. It may be feasible to calibrate the damage estimates using the high groundelevations of Kure Beach during Hurricane Fran when 15 to 20 building were destroyed. Thechoice of an erosion threshold depth on the flat eroded dune slope from SBEACH is likely toresult in extreme variations in the percentage of damage for each class of structure. It is likelyadditional calibration will be necessary to select an arbitrary erosion threshold depth forreasonable damage estimates. The selected threshold for piling supported buildings is likely tobe considerably different than observed in the field, a necessary correction due to limitations inthe model.
SUGGESTED HURRICANE FRAN CALIBRATION AREAS FOR SBEACH
Kure Beach, NC in the vicinity of Avenue E Figure 3
1226 N. Shore Drive & Jones Avenue, Surf City, NC Figure 4Area includes: Severely leaning house on short pilings Post-1986 house on long piles, undamagedMultiple pre-1986 houses destroyed.
341 Topsail Road & 11th Avenue, North Topsail Beach, NC Figure10 Second-row house has been protected by overwash deposit left in place after Hurricane Fran.

14
References
Corps of Engineers, 1975. “Guidelines for Identifying Coastal High Hazard Zones.” US ArmyCorps of Engineers, Galveston District.
Federal Emergency Management Agency, 1997. “Building Performance Assessment: HurricaneFran in North Carolina.” FEMA 290.
Rogers, Spencer, 2001. “Evaluating Potential Hurricane and Erosion Damage to Buildings inCoastal North Carolina,” North Carolina Sea Grant, UNC-SG-01-04.
Rogers, Spencer M. Jr., 1990. "Designing for Storm Surge and Wave Damage in CoastalBuildings." Coastal Engineering Conference, Delft, The Netherlands. ASCE. pp. 2908-2921.
Tung, C.C., B. Kasal, Spencer M. Rogers, Jr., and S.C. Yeh, 1999. "Behavior of Breakaway WallSubjected to Wave Forces: Analytical and Experimental Studies." NC Sea Grant (UNC-SG-99-03).
Woodward-Clyde Federal Services, 1997. “Pile Damage Assessment: Topsail Island, NorthCarolina.” Federal Emergency Management Agency, Region IV, EMW-95-C-4678, Task Order# 111.

APPENDIX A: Erosion-Damage Curves
Contents damage assumed to be the same curve as structural damage
Class 1 Structures: Single-family residential buildings, duplexes and small condos
Structure Class 1a. Slab 1b. Short Pilings 1c. Long PilingsShoreline Type A & B A: High Dune B: Low Elevation A: High Dune B: Low Elevation
All ground ground el >12' ground el <12' ground el >16' ground el <16' elevations piling tip > el +4' piling tip < el +4 piling tip > el 0 piling tip < el 0'
Erosion depth 0.5 feet 4 feet 4 feetthreshold
% Erosion % Damage0 0.05 0.05 0.05 0.05 0
0.1 0.2 0.1 0.1 0.1 0.010.2 0.4 0.2 0.2 0.2 0.020.3 0.6 0.4 0.3 0.4 0.030.4 0.8 0.8 0.4 0.8 0.040.5 1 1 0.5 1 0.050.6 1 1 0.6 1 0.060.7 1 1 0.7 1 0.070.8 1 1 0.8 1 0.080.9 1 1 0.9 1 0.091 1 1 1 1 0.1
Class 2 Structures: Commercial buildings, hotels, large condos
Structure Class 2a 2b 2cnon-piling foundation piling foundation full piling foundation
lowest floor slabSame as 1a f(# floors) * below Same as Type B-1c
Erosion depththreshold 0.5 feet 0.5 feet 4 feet
% erosion % Damage0 0.05 * 0
0.1 0.2 * 0.010.2 0.4 * 0.020.3 0.8 * 0.030.4 1 * 0.040.5 1 * 0.050.6 1 * 0.060.7 1 * 0.070.8 1 * 0.080.9 1 * 0.091 1 * 0.1
* Class 2b: % damage = [2 x (% erosion) / (# floors)] + (% damage Class 2c)
Class 3 Structures: Underhouse enclosures below piling supported buildings, equipment, utilities, etc.
Non-piling foundationSame as 1a Erosion depth threshold = 0.5 feet
% erosion % Damage0 0.05
0.1 0.20.2 0.40.3 0.80.4 10.5 10.6 10.7 10.8 10.9 11 1
A-1

Class 4 Structures: Mobile homes, utility buildings, oceanfront residential decks, detached decks, gazebos,pools, detached garages, buried public utilities
Shallow foundations% erosion % Damage Erosion depth threshold = 0.5 feet
0 00.1 0.50.2 10.3 10.4 10.5 10.6 10.7 10.8 10.9 11 1
Class 5 Structures: Dune walkways
Shallow foundations% erosion % Damage Erosion depth threshold = 2 feet
0 00.1 0.10.2 0.20.3 0.30.4 0.40.5 0.50.6 0.60.7 0.70.8 0.80.9 0.91 1
A-2

B- 1
APPENDIX B: BUILDING DAMAGE ASSESSMENT EXPERIENCE Spencer McMath Rogers, Jr. ADDRESS: North Carolina Sea Grant Coastal Services
5001 Masonboro Loop Road & 233 Marsh Hen Drive Wilmington, NC 28409 Wilmington, NC 28409 910-962-2491 910-799-6654
EDUCATION: M.S. Coastal & Oceanographic Engineering, 1975, University of Florida, Gainesville, FL B.S. Engineering, 1973, University of Virginia, Charlottesville, Virginia
EMPLOYMENT: 1978 to Present: Job title: Coastal Engineering Specialist, NC Sea Grant. Work through
the NC Sea Grant Marine Advisory Service to advise private property owners, builders, designers, and governmental agencies on hurricane-resistant construction methods, shoreline erosion alternatives and marine construction techniques. Faculty: University of North Carolina - Wilmington, Center for Marine Science. Adjunct faculty: North Carolina State University, Department of Civil Engineering in Raleigh NC.
1975-78: Coastal Engineer for the Bureau of Beaches and Shores, Florida Department
of Natural Resources, Tallahassee. Conducted evaluations of proposed Atlantic and Gulf front development for variances of the coastal construction setback line. Evaluated erosion control alternatives and impacts.
AFFILIATIONS: National Association of Coastal Engineers
American Society of Civil Engineers National Society of Professional Engineers Professional Engineers of North Carolina Association of State Floodplain Managers
REGISTRATIONS: Registered Geologist, State of North Carolina, # 684
APPOINTMENTS:
North Carolina Coastal Resources Advisory Council, 1992 to present. Representing marine science and technology. The Council advises the NC Coastal Resources Commission on coastal management regulations in North Carolina.
NC Science Panel on Coastal Hazards, 1997 to present.
NC university coastal engineers and geologists advising the NC Coastal Resources Commission on technical issues related to coastal processes.
PERTINENT PUBLICATIONS: 35 selected from 47 Rogers, Spencer M. Jr. and Chris Jones, 2002. “Selecting Erosion Setbacks For Balanced Multi-hazard Risk.” Solutions to Coastal Disasters Conference, San Diego CA, ASCE. Jones, Chris and Spencer Rogers, 2002. “Establishing Standards for Building Setbacks: Incorporation of Erosion Rate Variability.” Solutions to Coastal Disasters Conference, San Diego CA, ASCE. Rogers, Spencer, 2001. “Evaluating Potential Hurricane and Erosion Damage to Buildings in Coastal North Carolina.” North Carolina Sea Grant, UNC-SG-01-04. Rogers, Spencer M. Jr., 2000. "Beach Nourishment For Hurricane Protection: North Carolina: Project Performance in Hurricanes Dennis and Floyd." National Beach Preservation Conference. August 2000.

B- 2
Kriebel, David, Larry Buss and Spencer Rogers, 2000. “Impact Loads from Flood-bourne Debris” ASCE report for FEMA. Other research on floating debris is in progress. Rogers, Spencer M. Jr., 1999. "Design and Construction Guidance for Breakaway Walls Below Elevated Coastal Buildings in accordance with the National Flood Insurance Program." FEMA Technical Bulletin, FIA-TB 9-99. Yeh, S. C., Spencer M. Rogers, Jr., C. C. Tung, and B. Kasal, 1999. " Behavior of Breakaway Walls Under Wave Action." Journal of Structural Engineering. ASCE. October 1999. pp. 1162-1169. Tung, C. C., B. Kasal, S. C.Yeh, and Spencer M. Rogers, Jr., 1999. "Ultimate Capacity of Nailed Connections for Design of Breakaway Walls." Forest Products Journal. Vol. 49. No. 10. October 1999. pp. 76-81. Tung, C.C., B. Kasal, Spencer M. Rogers, Jr., and S.C. Yeh, 1999. "Behavior of Breakaway Wall Subjected to Wave Forces: Analytical and Experimental Studies." NC Sea Grant (UNC-SG-99-03). February 2. Work, Paul A., Spencer M. Rogers, Jr., and Robert Osborne, 1999. "Flood Retrofit of Coastal Residential Structures: Outer Banks, North Carolina." Journal of Water Resources Planning and Management. March/April 1999. Pratt, Anthony P., Christopher P. Jones, Spencer M. Rogers, Jr., and Darryl J. Hatheway, 1998. "Delaware Coastal Vulnerability and Construction Standards Study." Association of State Floodplain Managers Conference Proceedings. Rogers, Spencer M., Jr. and Sam Houston, 1997. “Hurricane Surge and Wave Conditions: Research Needs.” Waves ‘97 Conference Proceedings, ASCE. Jones, Christopher P., Spencer M. Rogers, Jr., and Darryl Hatheway, 1997. "Coastal Vulnerability and Construction Standards Study." Delaware Department of Natural Resources and Environmental Control. Dewberry & Davis. September 17, 1997. Clark, Walter, and Spencer M. Rogers, Jr., 1996. "Questions and Answers on Purchasing Coastal Real Estate in North Carolina." NC Sea Grant & NC Real Estate Commission. (UNC-SG-96-10). Rogers, Spencer M., Jr., 1996. “Corrosion Protection for Metal Connectors in Coastal Areas,” Technical Bulletin TB 8-96, FEMA. Rogers, Spencer M., Jr., 1995. “The Effects of Corrosion on Sheet-Metal Connectors in Coastal Buildings: A Summary of Present Knowledge,” FEMA. Rogers, Spencer M., Jr. 1995. "Getting the Most from Oceanfront Setback Lines" Coastal Zone '95, Tampa, FL, ASCE. Rogers, Spencer, M. 1995. "Preliminary Summary of Conditions and Damages: Hurricane Emily". Shore & Beach, Journal of the American Shore and Beach Preservation Association, Berkeley, CA. January 1995. Rogers, Spencer M. Jr., 1995. "Coastal Hazard Analysis for North Carolina Aquarium/Fort Fisher." NC Sea Grant. Rogers, Spencer M. Jr., 1994. "Hurricane Andrew & the South Florida Building Code: Relevance to the North Carolina Building Code." NC Sea Grant.

B- 3
Rogers, Spencer, M. Jr. 1993. "Relocating Erosion-Threatened Buildings: A Study of NC Housemoving". Coastal Zone '93, New Orleans, LA, ASCE. Rogers, Spencer M. Jr., 1991. "Foundations and Breakaway Walls of Small Coastal Buildings in Hurricane Hugo." Coastal Zone '91, Long Beach, CA, ASCE. Also published in National Hazard Center Quick Response Report, #37. Rogers, Spencer, M., Jr. 1991. "Flood Insurance Construction Standards: Can They Work on the Coast?". Coastal Zone '91, Long Beach, CA, ASCE, and Natural Hazards Research Center, U. of Colorado, 1990. Rogers, Spencer M. Jr. 1990. "Designing for Storm Surge and Wave Damage in Coastal Buildings." Coastal Engineering Conference, Delft, The Netherlands, ASCE. Rogers, Spencer M., Jr., 1990. "Performance of Building Resistance to Water, Waves and Erosion." Proceedings from "Hugo: One Year After." Charleston, SC, ASCE. Rogers, Spencer M., and Peter R. Sparks, 1991. "Damage to Buildings: Hurricane Hugo". Shore & Beach, Journal of the American Shore and Beach Preservation Association, Berkeley, CA. Oct. 1990. Rogers, Spencer M. Jr., 1990. "The Cost of Oceanfront Erosion in North Carolina: An Analysis of Flood Insurance Claim Payments 1977-1989." NC Sea Grant. Rogers, Spencer M., Jr., 1986. "Coastal Erosion Issues in Flood Hazard Mapping,". Report to the Coastal Committee, Association of State Floodplain Managers. Rogers, Spencer M., Jr., Sparks, Peter R. and Sparks, Katharine M., 1985. "A Study of the Effectiveness of Building Legislation in Improving the Wind Resistance of Residential Construction", National Conference on Wind Engineering, Lubbock, TX, Wind Engineering Council. Rogers, Spencer M., Jr., 1985. "Hurricane Diana: Impact on Coastal Development." Coastal Zone '85, Baltimore, MD, ASCE. Stutts, Alan T., Chrystos D. Siderelis, and Spencer M. Rogers. 1985. "Effect of Ocean Setback Standards on the Location of Permanent Structures in Coastal North Carolina." Coastal Zone '85, Baltimore, ASCE. Cox, John W., with Spencer M. Rogers, Jr., 1984. "Performance of Offshore and Coastal Structures During Alicia", Alicia: One Year Later, Galveston, TX, ASCE. Rogers, Spencer M. Jr., 1982. "Coastal Environment and Site Characteristics." Coastal Residential Construction Workshop. FEMA, Emmitsburg, MD. Rogers, Spencer M. Jr., 1982. "Coastal Flood Forces", Proceedings from Intergovernmental Seminar on Flood-Loss Reduction Through Improved Building Practices, FEMA, Emmitsburg, MD. Tayfun, M. Aziz, Spencer M. Rogers, Jr. and Jay Langfelder, 1979. "Delineation of an Ocean Hazard Zone for North Carolina Department of Marine Science and Engineering", NC State University.

B- 4
POST-STORM BUILDING DAMAGE ASSESSMENTS (not including northeasters or other storms) Named Storm Year Location Support Hurricane Floyd 1999 NC NC Sea Grant Hurricane Dennis 1999 NC NC Sea Grant Hurricane Bonnie 1997 NC NC Sea Grant Hurricane Fran 1996 NC FEMA Building Performance Assessment Team Hurricane Bertha 1996 NC NC Sea Grant Hurricane Opal 1995 FL Florida State Emergency Response Team Hurricane Emily 1993 NC FEMA Damage Assessment Team Hurricane Andrew 1992 FL NC Sea Grant Hurricane Hugo 1989 SC/NC Natural Hazards Research Center Hurricane Gloria 1985 NC NC Sea Grant Hurricane Diana 1984 NC NC Sea Grant Hurricane Alicia 1983 TX NC Sea Grant Hurricane Fredric 1979 AL/MS NC Sea Grant Hurricane David 1978 NC NC Sea Grant Hurricane Eloise 1975 FL Florida Bureau of Beach and Coastal Systems OTHER WORK Project member for FEMA’s 2001 revisions of the Coastal Construction Manual. Flood Hazard Committee, HAZUS Flood Loss Estimation Model, National Institute of Building Sciences. Committee is guiding development of a flood damage assessment model to estimate economic losses from future floods. Member, ASCE Standards Committee: Flood Damage Resistant Design and Construction, 1995 to 1999. Project committee member, "Compatibility of Flood Loss Reduction Standards of the National Flood Insurance Program with the National Model Building Codes and Standards," National Institute of Building Sciences, Washington, D.C., 1992. Congressional Testimony, on "Issues Relating to Erosion, Erosion Management and Erosion Insurance H.R. 3456, H.R. 4461 and Managing Coastal Erosion by the National Research Council". Before the Committee on Banking, Finance and Urban Affairs, Subcommittee on Policy Research and Insurance. Rehoboth, DE, July 1990. Technical Consultant, "Property Eligibility Requirements for Wind Storm Coverage" Property Insurance Underwriting Association, State of New York, 1988. NY now requires existing buildings to be retrofitted to minimum storm resistance standards for coverage through the state-sponsored wind insurance pool for high risk coastal buildings. Technical Editor, America's Vanishing Coastlines: A New Concern For The Voluntary And Residual Property Insurance Markets, National Committee on Property Insurance, 1988. Co-author, "Coastal and Flood Plain Construction Standards," NC State Building Code, NC Dept. of Insurance, 1986.


![Ntop Howto [Ubuntu 8.04]](https://static.fdocuments.in/doc/165x107/620650028c2f7b17300687c4/ntop-howto-ubuntu-804.jpg)
