and diphenolics processable carbohydrate pulp · PDF fileReductive fractionation of...
28
1 Electronic Supplementary Information Reductive fractionation of lignocellulose into soluble lignin derived mono- and diphenolics processable carbohydrate pulp S. Van den Bosch, a,1 W. Schutyser, a,1 R. Vanholme, b,c T. Driessen, a S. Koelewijn, a T. Renders, a B. De Meester, b,c W.J.J. Huijgen, f W. Dehaen, e C.M. Courtin, d B. Lagrain a , W. Boerjan, b,c B.F. Sels *,a a Center for Surface Chemistry and Catalysis, KU Leuven, Kasteelpark Arenberg 23, 3001 Heverlee, Belgium. *E-mail: [email protected] b Department of Plant Systems Biology, VIB, Technologiepark 927, 9052 Ghent, Belgium. c Department of Plant Biotechnology and Bioinformatics, Ghent University, Technologiepark 927, 9052 Ghent, Belgium. d Center for Food and Microbial Technology, KU Leuven, Kasteelpark Arenberg 22, 3001 Heverlee, Belgium. e Molecular Design en Synthesis, KU Leuven, Celestijnenlaan 200f, 3001 Leuven. f Energy Research Centre of the Netherlands (ECN), Biomass & Energy Efficiency, Westerduinweg 3, 1755 LE, Petten, The Netherlands. 1 Authors contributed equally to this work. Part A: Experimental procedures Part B: Tables Part C: Figures Part D: References Electronic Supplementary Material (ESI) for Energy & Environmental Science. This journal is © The Royal Society of Chemistry 2015
Transcript of and diphenolics processable carbohydrate pulp · PDF fileReductive fractionation of...

1
Electronic Supplementary Information
Reductive fractionation of lignocellulose into soluble lignin derived mono- and diphenolics processable carbohydrate pulp
S. Van den Bosch,a,1 W. Schutyser,a,1 R. Vanholme,b,c T. Driessen,a S. Koelewijn,a T. Renders,a B. De Meester,b,c W.J.J. Huijgen,f W. Dehaen,e C.M. Courtin,d B. Lagraina, W. Boerjan,b,c B.F. Sels*,a
a Center for Surface Chemistry and Catalysis, KU Leuven, Kasteelpark Arenberg 23, 3001 Heverlee, Belgium. *E-mail: [email protected] Department of Plant Systems Biology, VIB, Technologiepark 927, 9052 Ghent, Belgium.
c Department of Plant Biotechnology and Bioinformatics, Ghent University, Technologiepark 927, 9052 Ghent, Belgium.
d Center for Food and Microbial Technology, KU Leuven, Kasteelpark Arenberg 22, 3001 Heverlee, Belgium.
e Molecular Design en Synthesis, KU Leuven, Celestijnenlaan 200f, 3001 Leuven.
f Energy Research Centre of the Netherlands (ECN), Biomass & Energy Efficiency, Westerduinweg 3, 1755 LE, Petten, The Netherlands.
1 Authors contributed equally to this work.
Part A: Experimental procedures
Part B: Tables
Part C: Figures
Part D: References
Electronic Supplementary Material (ESI) for Energy & Environmental Science.This journal is © The Royal Society of Chemistry 2015

2
A. Experimental procedures
Chemicals and materials
All commercial chemicals were analytic reagents and were used without further purification. 5% Ru on Carbon, guaiacol (2-methoxyphenol, 98%), 4-n-propylguaiacol (>99%), syringol (2,6-dimethoxyphenol, 99%), 4-methylsyringol (>97%), methyl 3-(4-hydroxyphenyl)propionate (97%), methyl 3-(4-hydroxy-3-methoxyphenyl)propionate (>98%), methyl β-D-xylopyranoside (99%), 2-isopropylphenol (>98%), mannitol (98%), xylitol (99%), threitol (99%) and glycerol (>99%) were purchased from Sigma Aldrich. 4-Ethylguaiacol (98%), ethylene glycol (>99%) and 1,2-propanediol (99%) were purchased from Acros organics. Methanol (>99%) and dichloromethane (>99%) were purchased from Fischer Chemical Ltd. 4-n-Propanolguaiacol (3-(4-hydroxy-3-methoxyphenyl)-1-propanol, >98%) and meso-erythritol (>99%) were purchased from TCI chemicals. Myo-inositol (>99%) and arabitol (>99%) were purchased from Fluka. Isoeugenol (2-methoxy-4-propenylphenol, >98%) was purchased from Alfa Aesar and Sorbitol (99%) was purchased from Janssen Chimica. Birch (Betula pendula), poplar (Populus x canadensis) and softwood (pine/spruce) sawdust samples were obtained from a local sawmill (Ecobois, Ghent, Belgium), while miscanthus grass (Miscanthus giganteus) was provided by Cradle Crops and the birch ethanol organosolv lignin was delivered by the Energy Research center of the Netherlands (ECN).
Arabidopsis plant material
The origin of the genetically engineered lines, comt-1, f5h1-2, and F5H1 over-expression (C4H:F5H1) is described by Vanholme et al.1,2 Thirty biological replicates of each of the four Arabidopsis genotype (comt-1, f5h1-2, C4H:F5H1 and the wild type) were grown simultaneously. Plants were first grown under short-day conditions (8 h light/ 16 h dark, 21 °C, and 55% humidity) during 2 months and then transferred to long-day conditions (16 h light/ 8 h dark, 21 °C, and 55% humidity) to allow the development of an inflorescence stem. For all biological repeats, the inflorescences were harvested just above the rosette when the plant was completely senesced and dry. Once harvested, siliques and cauline leaves were removed, leaving the main and axillary inflorescence stems. The stems were weighed and chopped in 2-mm pieces. Biological repeats were pooled per ten to obtain 3 biological replicates for each line. These pooled samples were used for lignin analyses (Klason and thioacidolysis) and hydrogenolysis.
Determination of the Klason lignin content
Product yields in lignin depolymerization literature are typically based on the amount of acid insoluble lignin, also called Klason lignin, in the lignocellulose sample. The determination of the Klason lignin content of all lignocellulose samples in this paper, was based on a procedure from Lin & Dence.3 The lignocellulose samples were sieved and the fraction of 0.25-0.50 mm was used for analysis. A Soxtec extraction was first executed to remove any extractives like fats, waxes, resins and terpenoids/steroids,4 that can influence the Klason lignin determination. 10 g of oven dried substrate was therefore divided over 4 fritted glass extraction thimbles and extracted in a Soxtec 2055 Avanti with a 2:1 toluene:ethanol mixture. Prior to a 3 h standard extraction, a wet step was introduced for 15 min in which the samples were completely submersed in the toluene:ethanol solution to improve the speed of extraction and thus to reduce the total extraction time needed. After cooling, the samples were washed with ethanol and dried in an oven at 353 K for one night. Triplicate samples of extracted substrate (1 g) were transferred to 50 mL beakers after which 15 mL of a 72 wt% H2SO4-solution was added. The mixture was left at room temperature for 2 h while continuously stirred with a magnetic rod. Afterwards the content of each beaker was transferred to a round-bottom-flask which already contained 300 to 400 mL of water. The beakers were rinsed and additional water was added until a H2SO4 concentration of 3 wt% was reached. The diluted solution was boiled for 4 h under reflux conditions, to maintain a constant volume and acid concentration. After filtration of the hot solution, a brown lignin precipitate was retained. The precipitate was washed with hot water to remove any leftover acid and the obtained residue was dried in an oven at 353 K for one night. The reported Klason lignin content was determined relative to the oven dried substrate by averaging the measured weight of the residues and correcting for the amount of lost extractives. For
3
determination of the Klason lignin content of the Arabidopsis thaliana (Arabidopsis) genotypes, triplicate samples (100 mg) were added to 10 mL vials together with 1.5 mL of a 72 wt% H2SO4-solution. After stirring at room temperature for 2 h with a magnetic rod, the content of each vial was transferred to a round-bottom-flask containing 30-40 mL of water and extra water was added to reach a H2SO4 concentration of 3 wt%. The solution was boiled for 4 h under reflux conditions, filtered, washed with hot water and the lignin precipitate (Klason lignin) was dried in an oven at 353 K.
Thioacidolysis
Thioacidolysis was performed largely as described in Van Acker et al.5 Basically, aliquots of 5 mg stem pieces were subjected to a sequential extraction to obtain a purified cell wall residue (CWR). The extractions were done in 2 mL vials, each time for 30 min, at near-boiling temperatures for water (98 °C), ethanol (76 °C), chloroform (59 °C), and acetone (54 °C). The remaining CWR was dried under vacuum. The lignin composition was investigated with thioacidolysis as previously described by Robinson et al.6 The monomers involved in β–O–4-ether bonds, released upon thioacidolysis, were detected via (GC-MS) as their trimethylsilyl (TMS) ether derivatives on a Hewlett-Packard HP 6890 Series GC system (Agilent, Santa Clara, CA, USA) coupled with a HP-5973 mass selective detector. The GC conditions were as described by Robinson et al.6 The quantitative evaluation was carried out based on the specific prominent ions for each compound. Response factors for H, G, and S units were taken from literature.7 For the minor lignin unit, 5H, a response factor of 0.50 was used, which is the average of the response factors of G and S units.7
Determination of the carbohydrate content and composition
The carbohydrate content and composition in the lignocellulose samples as well as in the obtained carbohydrate pulps after hydrogenolysis were determined, using a standard total sugar determination procedure, adapted with hydrolysis conditions for cellulose-rich materials.8-10 Samples of 10 mg were pre-hydrolyzed in a 13 M H2SO4-solution (1 mL) at RT for 2 h and subsequently hydrolyzed in a diluted 2 M H2SO4-solution (6.5 mL) at 373 K for 2 h. The resulting monosaccharides were reduced to alditols and acetylated to increase their volatility for GC analysis. First, internal standard (1 mL of a 1 mg/mL β-D-allose solution of 1:1 benzoic acid:water) was added to 3 mL of the hydrolyzed sample. NH3 25% in water (1.5 mL) was added, as well as droplets of 2-octanol to avoid excessive gas production. Reduction was catalyzed with NaBH4 (0.2 mL of a 200 mg NaBH4/mL 2 M NH3 solution) for 30 min at 313 K and the reaction was stopped by adding 0.4 mL acetic acid. 1-methylimidazole (0.5 mL) was added to 0.5 mL of the reduced samples to catalyze the formation of alditol acetates after addition of acetic acid anhydride (5 mL). After 10 min, 1 mL of ethanol was added and 5 minutes later, the reaction was quenched by adding 10 mL of water. The reaction vials were placed in an ice bath and bromophenol blue (0.5 mL of a 0.4 g/L water solution) as well as KOH (2 x 5 mL of a 7.5 M solution) were added to color the aqueous phase blue. The yellow ethyl acetate phase, containing the acetylated monosaccharides, could then easily be separated with a Pasteur pipette and was dried with anhydrous Na2SO4 before putting in a vial. GC analysis was performed on a Supelco SP-2380 column with helium as carrier gas in a Agilent 6890 series chromatograph equipped with an autosampler, splitter injection port (split ratio 1:20) and flame ionization detector (FID). Separation was executed at 498 K with injection and detection temperatures at 543 K. Calibration samples, containing known amounts of the expected monosaccharides were included in each analysis. To calculate the carbohydrate content in the analyzed samples, a correction factor was used to compensate for the addition of water during hydrolysis. Each substrate was analyzed in threefold and the average values were used in the calculation of the carbohydrate retention and the sugar polyol yields.
Lignin product analysis
To analyze the lignin monomers after hydrogenolysis, a weighed amount of external standard (2-isopropylphenol) was added and mixed in the reactor. The reactor content was filtered and a sample of the filtrate was used for GC analysis. First 1 mL of the filtrate was dried under a N2-flow (~ 30 min) after which the lignin- and sugar-derived components in the oil were separated through 3-fold liquid-liquid extraction using 1 mL of dichloromethane (DCM) and 1 mL water. The separation was performed to avoid any detrimental effects of non-volatile sugar products on GC analysis. The DCM phases, containing all

4
lignin products from the filtrate, were combined and approximately 2 mL of the DCM was evaporated. The remaining solution (~ 1 mL) was analyzed on a GC (Agilent 6890 series) equipped with a HP5-column and a flame ionization detector (FID). The following operating conditions were used: injection temperature of 573 K, column temperature program: 323 K (2 min), 15 K/min to 423 K, 10 K/min to 493 K and 20 K/min to 563 K (12 min), detection temperature of 573 K. Sensitivity factors of the products were obtained by calibration with commercial standards or obtained by ECN-based calculations11 due to lack of commercial standards. The product yield and the product selectivity were defined as followed:
𝑌𝑖𝑒𝑙𝑑 𝑝𝑟𝑜𝑑𝑢𝑐𝑡 𝐴 (𝐶%) = 𝑚𝑝𝑟𝑜𝑑𝑢𝑐𝑡 𝐴 ×
𝑤𝑡%𝐶𝑝𝑟𝑜𝑑𝑢𝑐𝑡 𝐴
100
𝑚𝑙𝑖𝑔𝑛𝑜𝑐𝑒𝑙𝑙𝑢𝑙𝑜𝑠𝑒 𝑠𝑢𝑏𝑠𝑡𝑟𝑎𝑡𝑒 ×𝑤𝑡% 𝐾𝑙𝑎𝑠𝑜𝑛 𝑙𝑖𝑔𝑛𝑖𝑛
100×
𝑤𝑡%𝐶𝐾𝑙𝑎𝑠𝑜𝑛 𝑙𝑖𝑔𝑛𝑖𝑛
100
𝑥 100%
𝑤𝑡%𝐶𝑝𝑟𝑜𝑑𝑢𝑐𝑡 𝐴 = 𝐶𝑝𝑟𝑜𝑑𝑢𝑐𝑡 𝐴 ×𝑀𝑊𝐶 ( = 12
𝑔𝑚𝑜𝑙)
𝑀𝑊𝑝𝑟𝑜𝑑𝑢𝑐𝑡 𝐴× 100%
𝑤𝑡%𝐶𝐾𝑙𝑎𝑠𝑜𝑛 𝑙𝑖𝑔𝑛𝑖𝑛 = 𝐶𝑙𝑖𝑔𝑛𝑖𝑛 𝑚𝑜𝑛𝑜𝑚𝑒𝑟, 𝑎𝑣𝑒𝑟𝑎𝑔𝑒 ×𝑀𝑊𝐶 ( = 12
𝑔𝑚𝑜𝑙)
𝑀𝑊𝑙𝑖𝑔𝑛𝑖𝑛 𝑚𝑜𝑛𝑜𝑚𝑒𝑟, 𝑎𝑣𝑒𝑟𝑎𝑔𝑒× 100%
𝑆𝑒𝑙𝑒𝑐𝑡𝑖𝑣𝑖𝑡𝑦 𝑝𝑟𝑜𝑑𝑢𝑐𝑡 𝐴 (𝐶%) = 𝑚𝑝𝑟𝑜𝑑𝑢𝑐𝑡 𝐴 ×
𝑤𝑡%𝐶𝑝𝑟𝑜𝑑𝑢𝑐𝑡 𝐴
100
∑𝑖
𝑚𝑝𝑟𝑜𝑑𝑢𝑐𝑡 𝑖 ×𝑤𝑡%𝐶𝑝𝑟𝑜𝑑𝑢𝑐𝑡 𝑖
100
𝑥 100%
In these definitions, mproduct A is the weight of product A, wt% Cproduct A is the weight percentage of carbon in product A, mlignocellulose substrate is the weight of the lignocellulose substrate, wt% Klason lignin is the weight percentage of Klason lignin in the lignocellulose substrate, wt%CKlason lignin is the weight percentage of carbon in the Klason lignin, Cproduct A is the number of C-atoms in 1 molecule of product A, MWproduct A is the molecular weight of product A, Clignin monomer, average is the average number of C-atoms in 1 lignin monomer and MWlignin monomer, average is the average MW of a lignin monomer. For the various substrates, MWlignin monomer, average and Clignin monomer, average were estimated, taking into account the relative distribution of the main building blocks in the lignin. The chemical structures of p-hydroxyphenyl-, guaiacyl- and syringyl-units in Klason lignin were herein represented by respectively p-coumaryl, coniferyl and sinapyl alcohol units with respective molecular weights of 150, 180 and 210 g/mol and respective Clignin monomer values of 9, 10 and 11. For example for birch with a S:G ratio of 74:26 (determined with 2D HSQC-NMR of the lignin oil, see Table S4), this resulted in a MWlignin monomer, average of 202.3 g/mol and a Clignin monomer, average of 10.74, corresponding to 63.7 wt%CKlason lignin.
The dimer yield was analyzed in the same way as the monomer yield, yet a derivatization step was added to increase their volatility before GC analysis. Therefore, the same liquid-liquid extraction procedure as described earlier was followed to obtain 1 mL of a DCM phase, containing all the lignin-derived products, from 1 mL of the filtrate. The DCM phase was dried and mixed with 0.5 mL of pyridine and 0.5 mL of N-methyl-N-(trimethylsilyl)trifluoroacetamide. The vial was sealed and put in an oven at 353 K for 30 min. After this the lignin products were analyzed with GC analysis as described above.
Identification of the monomer and dimer signals was performed with GC-MS using an Agilent 6890 series GC equipped with a HP1-MS capillary column and an Agilent 5973 series Mass Spectroscopy detector. The following operating conditions were used: injection temperature of 523 K, column temperature program: 333 K (2 min), 10 K/min to 553 K (13 min), detection temperature of 563 K.
5
GC analysis of the gaseous phase was performed on an Interscience Trace GC equipped with HayeSep Q and RTX-1 columns and a FID and TCD.
To get more insight in the degree of lignin depolymerization, the distribution of the molar mass of the lignin products was investigated using gel permeation chromatography (GPC). The filtered methanol product phase, without any external standard, was first evaporated to obtain a brownish oil. The soluble lignin- and sugar-derived components in the oil were separated through 3-fold liquid-liquid extraction using dichloromethane (DCM) and water. The DCM phase was then separated and subsequently dried to obtain a lignin oil (DCM lignin oil). A sample of the lignin oil was solubilized in THF (~ 2-5 mg/mL) and subsequently filtered with a 0.2 µm PTFE membrane to remove any particulate matter to prevent plugging of the columns. GPC analyses were performed at 30 °C on a Shimadzu SCL-10A VP with a D-column 5 μm (mixed), using THF as the solvent (1 mL/min) and UV detection at 280 nm with a SPD-10A VP UV-Vis detector. The system was calibrated using polystyrene standards.
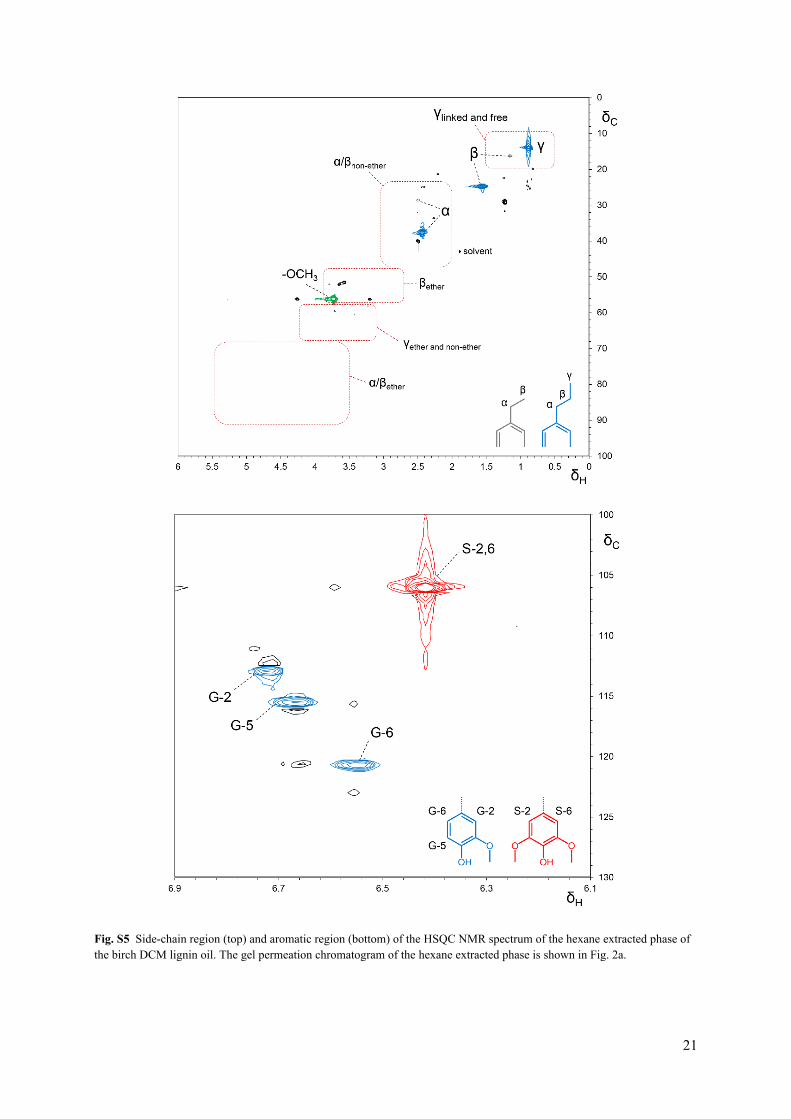
In addition with GC/MS and GPC analyses, the structural features of the lignin dimers and oligomers were analyzed with NMR. 1H, 13C NMR135, DEPT and HSQC spectra were acquired on a Bruker Avance 400 MHz. A sample of the DCM lignin oil (100 mg) was dissolved in 0.7 mL of DMSO-d6. The solvent peak was used as an internal reference (δC 39.5, δH 2.49 ppm). HSQC experiments had the following parameters: spectral width of 20 ppm in F2 (1H dimension) by using 2048 data points for an acquisition time (AQ) of 128 ms, 219 ppm in F1 (13C dimension) by using 512 increments (AQ of 11.6 ms), 20 scans with a 1.5 s interscan delay (D1). The monomer composition of the lignin oils was obtained by integration of the C2,6-H2,6 hydroxyphenyl (H2,6) (δC 129.7, δH 7.01 ppm), C2-H2 guaiacyl (G2) (δC 113.1, δH 6.76 ppm) and the C2,6-H2,6 syringyl (S2,6) (δC 106.2, δH 6.45 ppm) correlation signals.12 ChemDraw Ultra 12.0 was used for predicting NMR spectra and analyzing mass fragmentation.
For characterization of the oligomer fraction in the birch DCM lignin oil, most of the oligomers were removed via liquid-liquid extraction of the lignin oil with hexane-water. Therefore, 2 mL of hexane, 2 mL of H2O and a magnetic stirring rod were added to 0.638 g of DCM lignin oil in a glass vial and the vial was placed in a cupper block at 80 °C for 30 min under magnetic stirring. Subsequently, the hexane phase was removed from the vial, 2 mL of fresh hexane was added to the vial and the same procedure was followed. In this way, the lignin oil was extracted 4 times with 2 mL of hexane. The hexane phases were combined and the hexane was removed via evaporation, yielding the hexane extract (0.355 g, 56 wt%). The residue after hexane extraction was obtained by evaporation of the H2O (0.278 g, 44 wt%).
Theoretical maximum monomer yield
Lignin is a complex 3-dimensional irregular polymer with randomly cross-linked phenolic building blocks. To estimate the theoretical maximum monomer yield for a certain substrate, a simplified linear lignin polymer is imagined, in which each building block is linked to two other units, either by a C-C bond or an ether-bond. In a hydrogenolysis reaction, the ether bonds are cleaved to depolymerize the lignin structure. When a unit is now on both sides connected with an ether bond, the cleavage of the ether bonds will result in a monomer. Mathematically, the maximum amount of monomers coincides with the square of the fraction of ether bonds in the lignin structure.13-15 Reported values for the ether content of birch lignin typically range around 67-76%,16,17 which implicates a theoretical maximum monomer yield, varying from 45% to 58% for birch. The here obtained monomer yields of around 50% are thus close to the theoretic maximum.
Recuperation of the Ru/C Catalyst
Ru/C was separated from the carbohydrate fraction in the pulp (obtained after reaction 10, Table 1) by a liquid-liquid extraction in methanol and decane. The apolar Ru/C catalyst was recovered from the decane phase, while the more polar carbohydrate pulp is located at the bottom of the methanol phase.

6
Determination of the OH-content in the lignin oligomer fraction
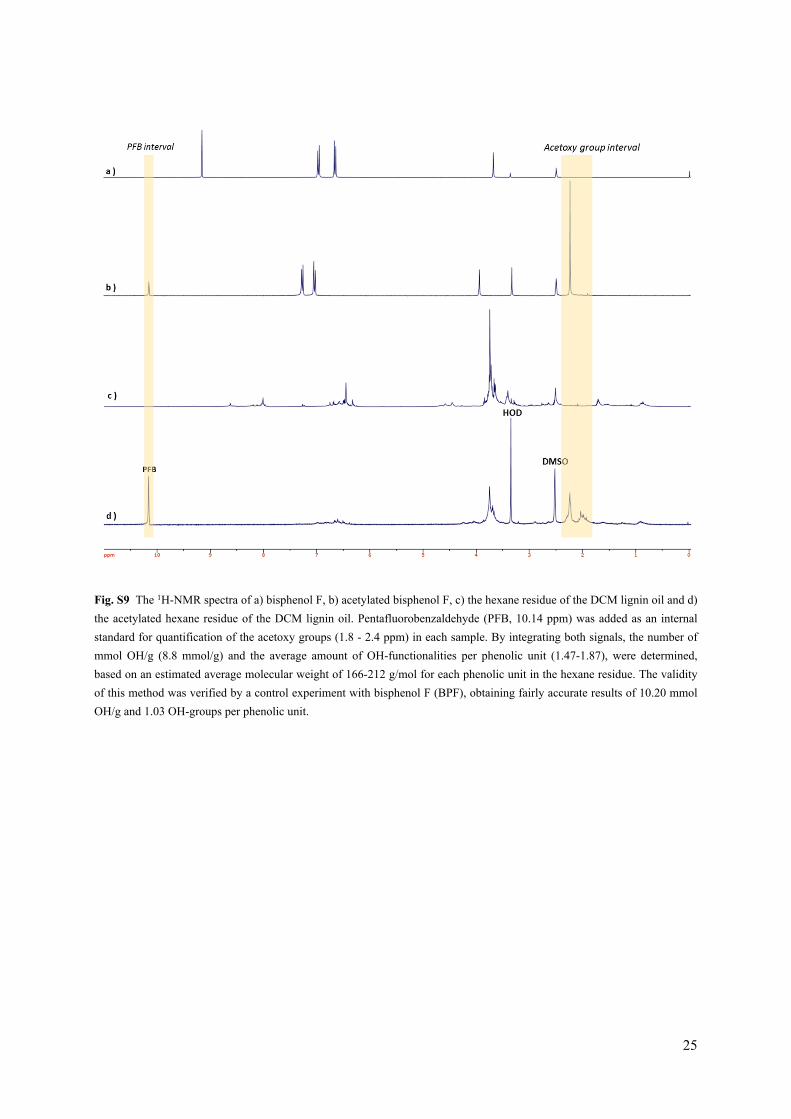
The average number of OH-functionalities per phenolic moieties is an important parameter for potential applications in the polymer industry. To examine this, the residue after hexane extraction of the birch DCM lignin oil, containing most of the produced lignin oligomers, was derivatized via acetylation of the OH-groups and subsequently analyzed by 1H-NMR.18 Therefore, 200 mg of the hexane residue was dissolved in 4 mL pyridine to form a homogeneous solution. Then, 4 mL of acetic anhydride was added and stirred for 24 h at 313 K. The crude reaction solution was added dropwise to ice water (150 mL) while stirring. A precipitate was formed, collected via filtration and washed with ice water (150 mL), after which it was dried overnight under vacuum. The same procedure was performed for bisphenol F as a control reaction. 1H-NMR spectra of the acetylated products were recorded on a Bruker Advance 300 MHz spectrometer in DMSO-d6 at room temperature (128 scans). Pentafluorobenzaldehyde (PFB, 10.14 ppm) was added as an internal standard for quantification of the acetoxy groups (1.8 −2.4 ppm) in each sample. By integrating both signals, the average amount of OH-functionalities per phenolic moieties can be determined.
Sugar polyol analysis
After hydrolytic hydrogenation of the obtained carbohydrate pulp from hydrogenolysis of birch wood, the product mixture was centrifuged, and the supernatant was mixed with an internal standard (myo-inositol), dried and subsequently derivatized (see lignin dimer analysis). The trimethylsilylated sugar products were analyzed on a GC (Hewlett Packard 5890) equipped with an HP 7673 autosampler, a 60 m HP-1 column, and an FID.
Ball mill procedure
Ball-milling of the carbohydrate pulp obtained after hydrogenolysis of birch, containing also the used Ru/C catalyst, was carried out with a Retsch PM100 planetary mill, a 50 mL ZrO2 pot and 10 ZrO2 balls (Ø 10 mm) for 6 h of milling time at 500 rpm (10 min cool down after every hour). The recommended filling ratio of about 1:3 was maintained.

7
B. Tables
Table S2 Analysis of the gas phase after birch wood hydrogenolysis at 523 K.a
gas phase composition Vol %
N2 2.16H2 93.68CH4 1.42CO 2.16Methanol in the gas phase 0.48
amount of CH4 and CO in the gas phase and MeOH in the liquid phaseb n (mmol)
CH4 1.59CO 2.41Methanol in liquid phase 988.51
loss of methanol as CO and CH4c mol%
maximum loss of methanol as CH4 0.16
maximum loss of methanol as CO 0.24maximum loss of methanol as CO and CH4 0.40
a Reaction conditions: 2 g birch sawdust, 0.3 g 5% Ru/C, 40 mL methanol, 3 MPa H2 at RT, 523 K, 3 h. b molar amounts were calculated using N2 as internal standard. c Values represent the maximum possible
Table S1 A more detailed phenolic monomer distribution of all reactions indicated in Table 1 and additional reactions mentioned in the text.a
Entry t (h) T (K)
4-et
hylg
uaia
col
4-n-
prop
ylgu
aiac
ol
isoe
ugen
ol
4-n-
prop
anol
guai
acol
syrin
gol
4-m
ethy
lsyr
ingo
l
4-et
hyls
yrin
gol
4-n-
prop
ylsy
ringo
l
4-pr
op-1
-eny
lsyr
ingo
l
4-n-
prop
anol
syrin
gol
Tot
al m
onom
ers
S% G%
1 6 523 0.2 10.4 0.0 2.3 0.3 0.4 0.7 30.5 4.4 2.3 51.5 75 252b 6 523 1.2 2.8 0.3 0.1 1.5 1.4 3.5 13.8 0.0 0.3 24.6 83 183c 3 523 0.2 0.2 1.7 0.0 0.6 0.3 0.5 0.7 2.8 0.5 7.6 73 274 6 473 0.1 7.4 0.0 1.7 0.1 0.2 0.3 25.8 1.7 5.8 43.0 79 215 3 523 0.2 9.8 0.0 1.3 0.3 0.4 0.8 32.1 1.9 3.2 50.0 77 236 0.5 523 0.1 7.5 0.0 1.1 0.1 0.3 0.6 25.1 0.6 3.4 38.9 78 227d 3 523 0.2 10.3 0.2 0.4 0.2 0.6 1.0 37.0 0.4 1.0 51.4 78 228e 3 523 0.5 8.2 0.6 0.0 0.0 1.1 1.1 26.5 1.3 0.6 39.9 77 239f 3 523 0.3 9.9 0.6 0.8 0.5 0.3 1.3 33.8 0.5 2.4 50.4 77 2310g 3 523 0.0 9.6 0.4 3.3 0.0 0.0 1.3 31.8 1.5 4.6 52.6 75 25
a Unless specified otherwise, the reaction conditions are as follows: 2 g birch sawdust (0.25-0.50 mm), 0.3 g 5% Ru/C, 40 mL methanol, 3 MPa H2 at RT. b 40 mL water is used as the solvent. c no catalyst used. d 1 MPa H2 at RT. d atm. Pressure of N2 at RT. f 10 g of birch sawdust was used. g large particle fraction of birch sawdust (>1.5 mm, see Fig S1)

8
loss of MeOH as CH4 and CO, since these gasses can also originate from birch wood, through decarbonylation, hydrogenolysis or hydrogenation reactions.
9
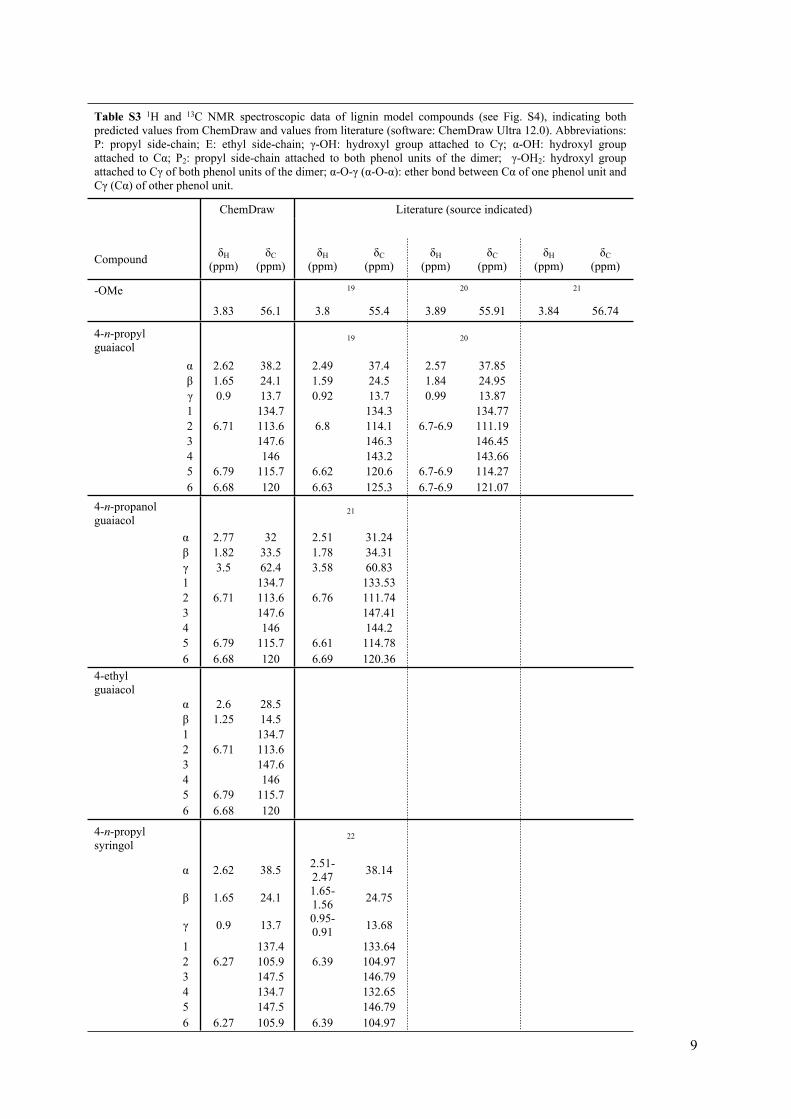
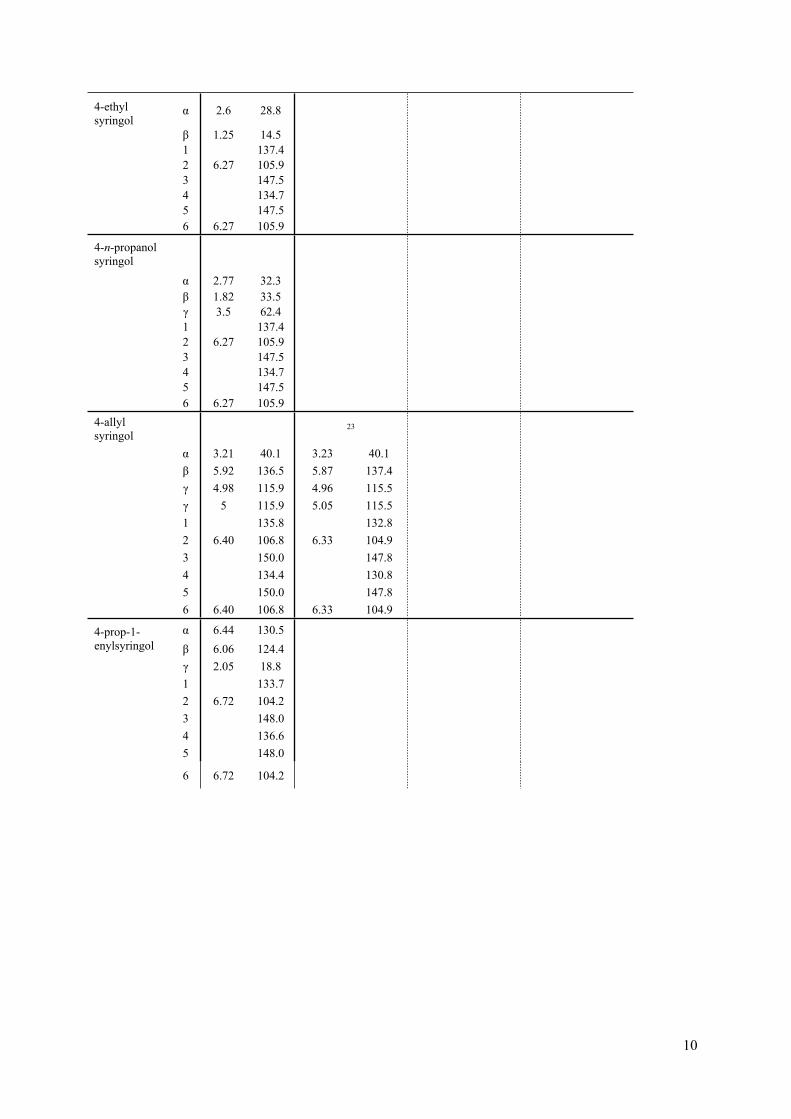
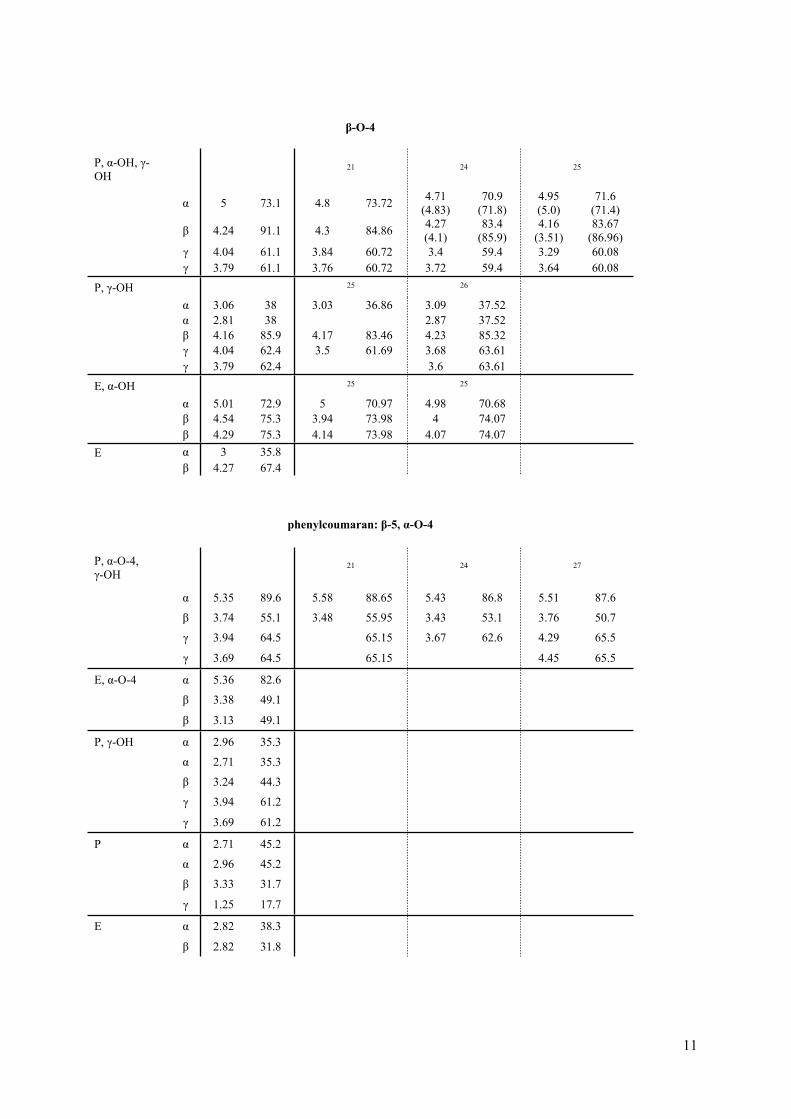
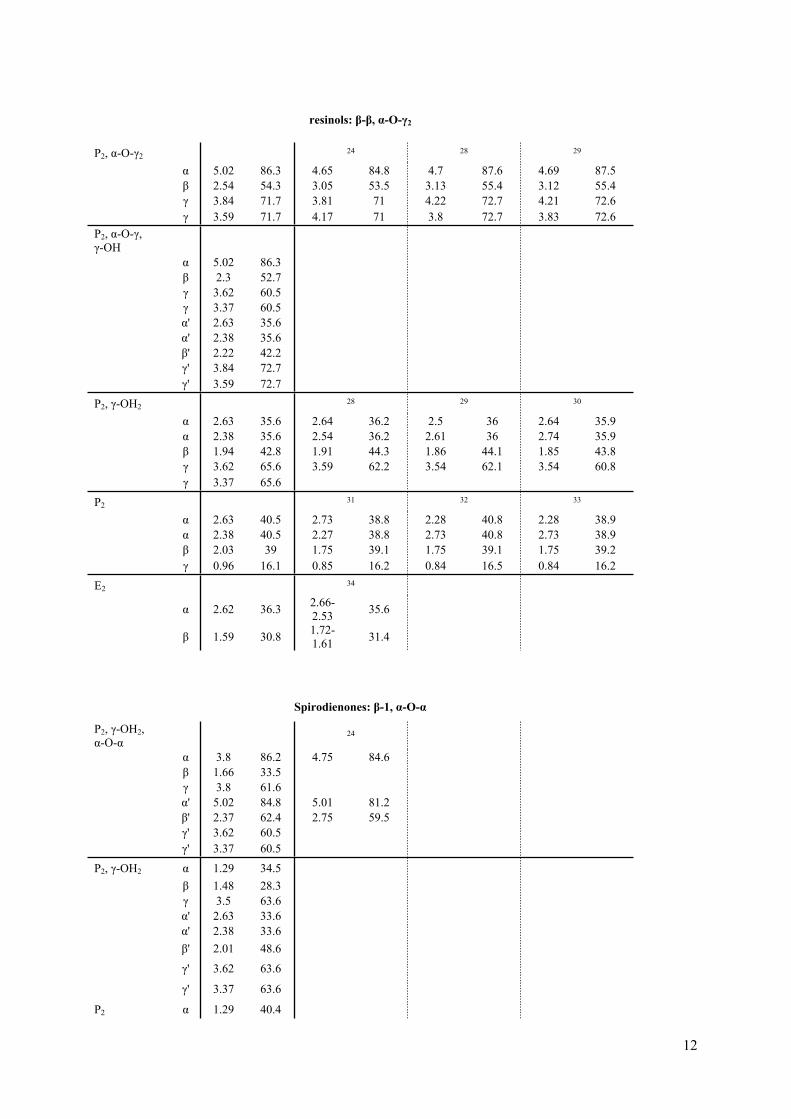
Table S3 1H and 13C NMR spectroscopic data of lignin model compounds (see Fig. S4), indicating both predicted values from ChemDraw and values from literature (software: ChemDraw Ultra 12.0). Abbreviations: P: propyl side-chain; E: ethyl side-chain; γ-OH: hydroxyl group attached to Cγ; α-OH: hydroxyl group attached to Cα; P2: propyl side-chain attached to both phenol units of the dimer; γ-OH2: hydroxyl group attached to Cγ of both phenol units of the dimer; α-O-γ (α-O-α): ether bond between Cα of one phenol unit and Cγ (Cα) of other phenol unit.
ChemDraw Literature (source indicated)
Compound δH (ppm)
δC (ppm)
δH (ppm)
δC (ppm)
δH (ppm)
δC (ppm)
δH (ppm)
δC (ppm)
-OMe 19 20 21
3.83 56.1 3.8 55.4 3.89 55.91 3.84 56.74
4-n-propyl guaiacol 19 20
α 2.62 38.2 2.49 37.4 2.57 37.85β 1.65 24.1 1.59 24.5 1.84 24.95γ 0.9 13.7 0.92 13.7 0.99 13.871 134.7 134.3 134.772 6.71 113.6 6.8 114.1 6.7-6.9 111.193 147.6 146.3 146.454 146 143.2 143.665 6.79 115.7 6.62 120.6 6.7-6.9 114.27
6 6.68 120 6.63 125.3 6.7-6.9 121.074-n-propanol guaiacol 21
α 2.77 32 2.51 31.24β 1.82 33.5 1.78 34.31γ 3.5 62.4 3.58 60.831 134.7 133.532 6.71 113.6 6.76 111.743 147.6 147.414 146 144.25 6.79 115.7 6.61 114.78
6 6.68 120 6.69 120.364-ethyl guaiacol
α 2.6 28.5β 1.25 14.51 134.72 6.71 113.63 147.64 1465 6.79 115.7
6 6.68 120
4-n-propyl syringol
22
α 2.62 38.5 2.51-2.47 38.14
β 1.65 24.1 1.65-1.56 24.75
γ 0.9 13.7 0.95-0.91 13.68
1 137.4 133.642 6.27 105.9 6.39 104.973 147.5 146.794 134.7 132.655 147.5 146.79
6 6.27 105.9 6.39 104.97
10
4-ethyl syringol
α 2.6 28.8
β 1.25 14.51 137.42 6.27 105.93 147.54 134.75 147.5
6 6.27 105.9
4-n-propanol syringol
α 2.77 32.3β 1.82 33.5γ 3.5 62.41 137.42 6.27 105.93 147.54 134.75 147.5
6 6.27 105.94-allyl syringol
23
α 3.21 40.1 3.23 40.1β 5.92 136.5 5.87 137.4γ 4.98 115.9 4.96 115.5γ 5 115.9 5.05 115.51 135.8 132.82 6.40 106.8 6.33 104.93 150.0 147.84 134.4 130.85 150.0 147.8
6 6.40 106.8 6.33 104.9
α 6.44 130.54-prop-1-enylsyringol β 6.06 124.4
γ 2.05 18.81 133.72 6.72 104.23 148.04 136.65 148.0
6 6.72 104.2
11
β-O-4
P, α-OH, γ-OH
21 24 25
α 5 73.1 4.8 73.72 4.71 (4.83)
70.9 (71.8)
4.95 (5.0)
71.6 (71.4)
β 4.24 91.1 4.3 84.86 4.27 (4.1)
83.4 (85.9)
4.16 (3.51)
83.67 (86.96)
γ 4.04 61.1 3.84 60.72 3.4 59.4 3.29 60.08 γ 3.79 61.1 3.76 60.72 3.72 59.4 3.64 60.08
P, γ-OH 25 26
α 3.06 38 3.03 36.86 3.09 37.52α 2.81 38 2.87 37.52β 4.16 85.9 4.17 83.46 4.23 85.32γ 4.04 62.4 3.5 61.69 3.68 63.61
γ 3.79 62.4 3.6 63.61
E, α-OH 25 25
α 5.01 72.9 5 70.97 4.98 70.68β 4.54 75.3 3.94 73.98 4 74.07
β 4.29 75.3 4.14 73.98 4.07 74.07E α 3 35.8 β 4.27 67.4
phenylcoumaran: β-5, α-O-4
P, α-O-4, γ-OH 21 24 27
α 5.35 89.6 5.58 88.65 5.43 86.8 5.51 87.6
β 3.74 55.1 3.48 55.95 3.43 53.1 3.76 50.7
γ 3.94 64.5 65.15 3.67 62.6 4.29 65.5
γ 3.69 64.5 65.15 4.45 65.5
E, α-O-4 α 5.36 82.6
β 3.38 49.1
β 3.13 49.1
P, γ-OH α 2.96 35.3
α 2.71 35.3
β 3.24 44.3
γ 3.94 61.2
γ 3.69 61.2
P α 2.71 45.2
α 2.96 45.2
β 3.33 31.7
γ 1.25 17.7
E α 2.82 38.3
β 2.82 31.8
12
resinols: β-β, α-O-γ2
P2, α-O-γ2 24 28 29
α 5.02 86.3 4.65 84.8 4.7 87.6 4.69 87.5β 2.54 54.3 3.05 53.5 3.13 55.4 3.12 55.4γ 3.84 71.7 3.81 71 4.22 72.7 4.21 72.6
γ 3.59 71.7 4.17 71 3.8 72.7 3.83 72.6P2, α-O-γ, γ-OH
α 5.02 86.3β 2.3 52.7γ 3.62 60.5γ 3.37 60.5α' 2.63 35.6α' 2.38 35.6β' 2.22 42.2γ' 3.84 72.7
γ' 3.59 72.7
P2, γ-OH228 29 30
α 2.63 35.6 2.64 36.2 2.5 36 2.64 35.9α 2.38 35.6 2.54 36.2 2.61 36 2.74 35.9β 1.94 42.8 1.91 44.3 1.86 44.1 1.85 43.8γ 3.62 65.6 3.59 62.2 3.54 62.1 3.54 60.8
γ 3.37 65.6
P231 32 33
α 2.63 40.5 2.73 38.8 2.28 40.8 2.28 38.9α 2.38 40.5 2.27 38.8 2.73 40.8 2.73 38.9β 2.03 39 1.75 39.1 1.75 39.1 1.75 39.2
γ 0.96 16.1 0.85 16.2 0.84 16.5 0.84 16.2
E234
α 2.62 36.3 2.66-2.53 35.6
β 1.59 30.8 1.72-1.61 31.4
Spirodienones: β-1, α-O-α
P2, γ-OH2, α-O-α
24
α 3.8 86.2 4.75 84.6β 1.66 33.5γ 3.8 61.6α' 5.02 84.8 5.01 81.2β' 2.37 62.4 2.75 59.5γ' 3.62 60.5
γ' 3.37 60.5
P2, γ-OH2 α 1.29 34.5β 1.48 28.3γ 3.5 63.6α' 2.63 33.6α' 2.38 33.6β' 2.01 48.6
γ' 3.62 63.6
γ' 3.37 63.6
P2 α 1.29 40.4

13
β 1.33 18.8
γ 0.9 14.9
α' 2.63 39.8
α' 2.38 39.8
β' 2.1 42.2
γ' 0.96 16.4
β-1
P, γ-OH α 2.96 35
α 2.71 35
β 3.24 50.5
γ 3.94 60.9
γ 3.69 60.9
P α 2.96 44.9
α 2.71 44.9
β 3.33 37.3
γ 1.25 17.4
E 19 35
α/β 2.82 38 2.85 38.4 2.7 37.6
Table S4 Overview of the lignin monomer distribution, the total Klason lignin content, the extractives and the amount of C6 and C5 sugars for birch, poplar, softwood and miscanthus.
Monomer productsa Lignin oilb
Substrate %H %G %S %H %G %S
Klason lignin
(wt%)Extractives
(wt%)C6-sugar
(C%)C5-sugar
(C%)
Birch 0 23 77 0 26 74 19.1 2.5 39.3 20.7Poplar 0 37 63 0 45 55 21.2 4.2 44.0 14.7Softwoodc 0 96 4 0 98 2 27.0 4.5 53.8 6.1Miscanthus 27 47 25 14 61 25 24.3 1.8 39.1 22.1
a Distribution of the monomer building blocks in the monomer product fraction after protolignin hydrogenolysis. b Distribution of the monomer building blocks in the lignin oil, determined with 2D HSQC-NMR as described in the procedure section. c The traces of S-units in the softwood sample likely originate from hardwood impurities.

14
Table S5 A more detailed phenolic monomer yield distribution of all reactions in table 2a
Entry 4-et
hylp
heno
l
4-et
hylg
uaia
col
4-n-
prop
ylgu
aiac
ol
4-n-
prop
anol
guai
acol
syrin
gol
4-m
ethy
lsyr
ingo
l
4-et
hyls
yrin
gol
4-n-
prop
ylsy
ringo
l
4-pr
op-1
-eny
lsyr
ingo
l
4-n-
prop
anol
syrin
gol
H-e
ster
c
G-e
ster
d
Tot
al m
onom
ers
Birch - 0.2 9.8 1.3 0.3 0.4 0.8 32.1 1.9 3.2 - - 50.0EOLb - 0.1 0.4 0.1 0.2 0.3 0.2 1.3 - 0.3 - - 2.9Poplar - 0.5 12.8 2.4 0.4 2.4 0.9 20.4 0.5 3.7 - - 43.9Softwood - 0.5 16.3 2.8 - - 0.2 0.7 - 0.0 - - 20.5Miscanthus 1.5 0.5 6.3 2.1 0.2 0.2 0.3 5.5 - 1.4 5.2 3.6 26.8
a Unless specified otherwise, the reaction conditions are as follows: 2 g substrate (0.25-0.50 mm), 0.3 g 5% Ru/C, 40 ml methanol, 3 h, 523 K, 3 MPa H2 at RT. b 1 g of ethanol organosolv lignin (EOL) is used as substrate; obtained under the following conditions: : 1.4 kg of birch wood chips (<10 mm), 14 L of 50 wt% aqueous ethanol, 200 °C, 0.5 h, 5 mM H2SO4, 20 L autoclave.36 c Methyl 3-(4-hydroxyphenyl)propionate. d Methyl 3-(4-hydroxy-3-methoxyphenyl)propionate.
Table S6 Overview of %G and %S units released as monomers upon catalytic hydrogenolysis, lignin monomer distribution measured via thioacidolysis and the total Klason lignin content for each of the Arabidopsis thaliana lines. Numbers are averages ± standard deviation of three biological repeats. H: hydroxyphenyl, 5H: 5-hydroxyguaiacyl
Monomer products Thioacidolysis method Klason lignin
(wt%)
Substrate %G %S %H %G %5H %S f5h1-2 97.0 ± 0.8 2.5 ± 0.8 0.4 ± 0.0 99.1 ± 0.7 0.0 ± 0.0 0.4 ± 0.7 19.5 ± 0.7comt-1 95.0 ± 1.8 5.0 ± 1.8 1.1 ± 0.9 97.0 ± 2.0 0.4 ± 0.3 1.4 ± 1.4 17.6 ± 0.7wild type 58.0 ± 2.1 42.0 ± 2.1 0.5 ± 0.1 65.5 ± 0.7 0.1 ± 0.0 33.9 ± 0.7 18.6 ± 0.7C4H:F5H1 13.8 ± 0.5 86.2 ± 0.5 1.2 ± 0.2 5.3 ± 0.5 0.5 ± 0.1 93.0 ± 0.8 11.7 ± 0.4

15
Table S7 Detailed phenolic monomer yield distribution of the hydrogenolysis reactions on the Arabidopsis thaliana genotypes indicated in Fig. 4b.a
Substrate 4-et
hylg
uaia
col
4-n-
prop
ylgu
aiac
ol
Isoe
ugen
ol
4-n-
prop
anol
guai
acol
4-et
hyls
yrin
gol
4-n-
prop
ylsy
ringo
l
4-pr
ope-
1-ny
lsyr
ingo
l
4-n-
prop
anol
syrin
gol
G-e
ster
b
Tot
al m
onom
ers
f5h1-2 1.5 1.6 1.8 2.4 - 0.2 - - 0.1 7.8 ± 1.75comt-1 1.8 1.8 2.0 2.7 - 0.3 0.1 0.1 0.0 9.0 ± 0.92wild type 1.6 1.6 1.8 2.4 1.1 2.5 0.7 1.3 0.4 13.30 ± 1.57C4H:F5H1 1.4 1.1 1.2 1.2 4.6 15.9 3.1 6.8 0.1 35.2 ± 1.19
a The reaction procedure was downscaled for the Arabidopsis samples and repeated three times to ensure the reproducibility of the downscaled procedure. Reaction conditions: 0.1 g substrate, 0.3 g 5% Ru/C, 40 mL methanol, 3 h, 523 K, 3 MPa H2 at RT. b Methyl 3-(4-hydroxy-3-methoxyphenyl)propionate.

16
C. Figures
Fig. S1 Comparison between fine-milled birch sawdust (0.25-0.50 mm), the standard reaction substrate, and the larger fraction (> 1.5 mm) of birch sawdust, which was tested with regard to its potentially reduced milling cost.
Fig. S2 Artificial HSQC spectrum of lignin model structures (vide infra) obtained by plotting the δH-δC chemical shift pairs of all C-H entities in the model compounds derived from ChemDraw predicted 1H and 13C spectra (software: ChemDraw Ultra 12.0).

17
Fig. S3 Indication of the domains of Cα-Hα (α), Cβ-Hβ (β) and Cγ-Hγ (γ) correlation signals of the side chains of lignin model compounds in the artificial HSQC spectrum derived from the ChemDraw predictions (Fig. S2). The α, β and γ correlation signals of side-chains involved in ether-bonds (α-O-4, β-O-4, α-O-γ or α-O-α) are indicated with an “e” in subscript.

18
19
20
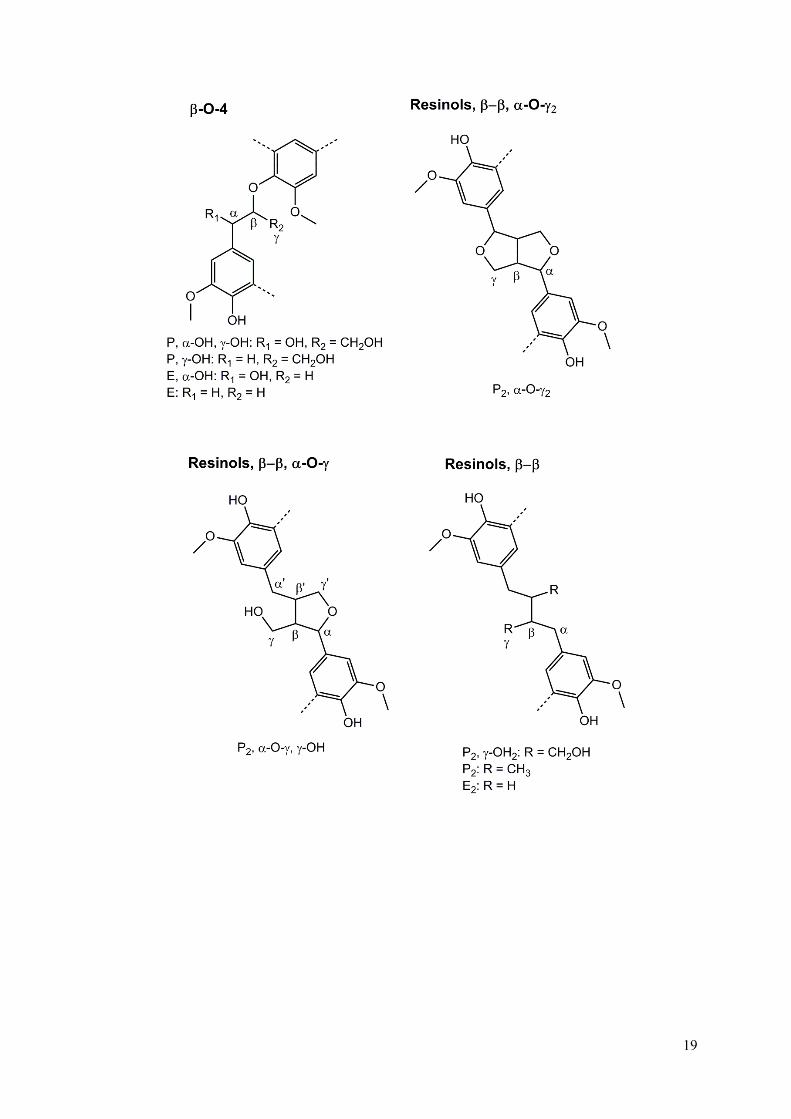
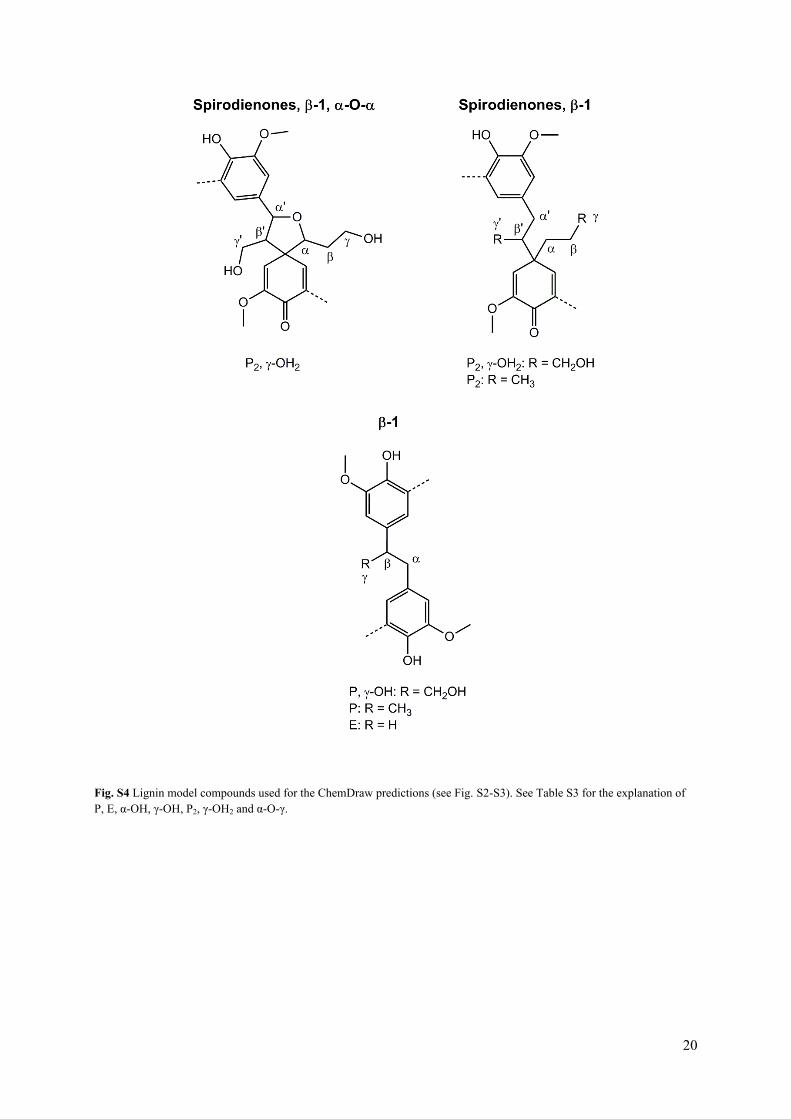
Fig. S4 Lignin model compounds used for the ChemDraw predictions (see Fig. S2-S3). See Table S3 for the explanation of P, E, α-OH, γ-OH, P2, γ-OH2 and α-O-γ.
21
Fig. S5 Side-chain region (top) and aromatic region (bottom) of the HSQC NMR spectrum of the hexane extracted phase of the birch DCM lignin oil. The gel permeation chromatogram of the hexane extracted phase is shown in Fig. 2a.
22
7.0 6.5 6.0 5.5 5.0 4.5 4.0 3.5 3.0 2.5 2.0 1.5 1.0 0.5 ppm
150 140 130 120 110 100 90 80 70 60 50 40 30 20 10 ppm
102030405060708090100110120130 ppm
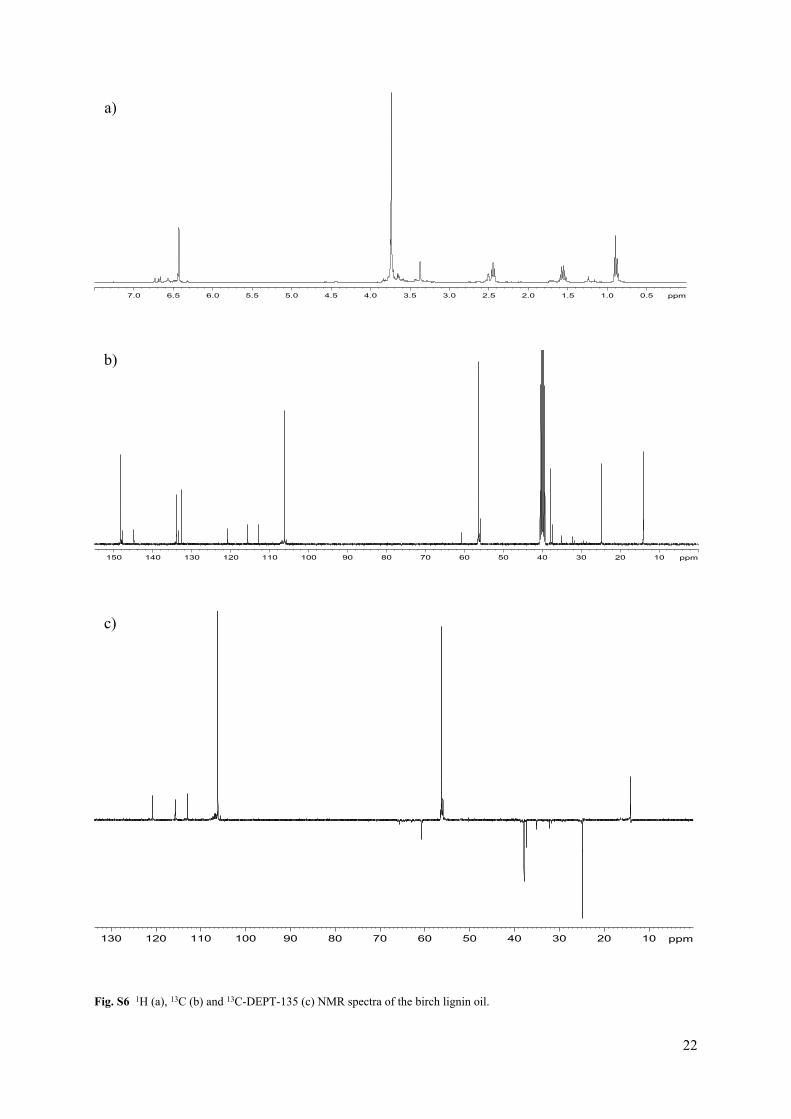
Fig. S6 1H (a), 13C (b) and 13C-DEPT-135 (c) NMR spectra of the birch lignin oil.
a)
b)
c)

23
7.0 6.5 6.0 5.5 5.0 4.5 4.0 3.5 3.0 2.5 2.0 1.5 1.0 0.5 ppm
150 140 130 120 110 100 90 80 70 60 50 40 30 20 10 ppm
130 120 110 100 90 80 70 60 50 40 30 20 10 ppm
Fig. S7 1H (a), 13C (b) and 13C-DEPT-135 (c) NMR spectra of the residue after hexane extraction.
c)
a)
b)
24
7.0 6.5 6.0 5.5 5.0 4.5 4.0 3.5 3.0 2.5 2.0 1.5 1.0 0.5 ppm
150 140 130 120 110 100 90 80 70 60 50 40 30 20 10 ppm
102030405060708090100110120 ppm
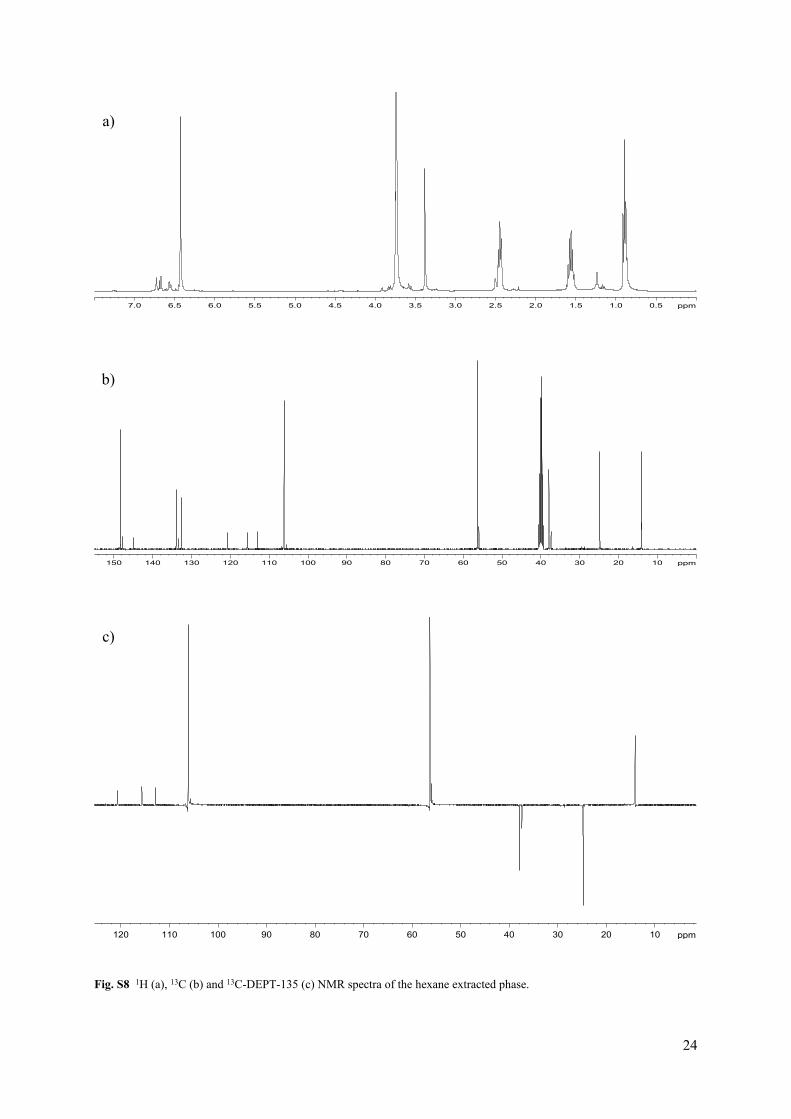
Fig. S8 1H (a), 13C (b) and 13C-DEPT-135 (c) NMR spectra of the hexane extracted phase.
a)
b)
c)
25
Fig. S9 The 1H-NMR spectra of a) bisphenol F, b) acetylated bisphenol F, c) the hexane residue of the DCM lignin oil and d) the acetylated hexane residue of the DCM lignin oil. Pentafluorobenzaldehyde (PFB, 10.14 ppm) was added as an internal standard for quantification of the acetoxy groups (1.8 - 2.4 ppm) in each sample. By integrating both signals, the number of mmol OH/g (8.8 mmol/g) and the average amount of OH-functionalities per phenolic unit (1.47-1.87), were determined, based on an estimated average molecular weight of 166-212 g/mol for each phenolic unit in the hexane residue. The validity of this method was verified by a control experiment with bisphenol F (BPF), obtaining fairly accurate results of 10.20 mmol OH/g and 1.03 OH-groups per phenolic unit.
26
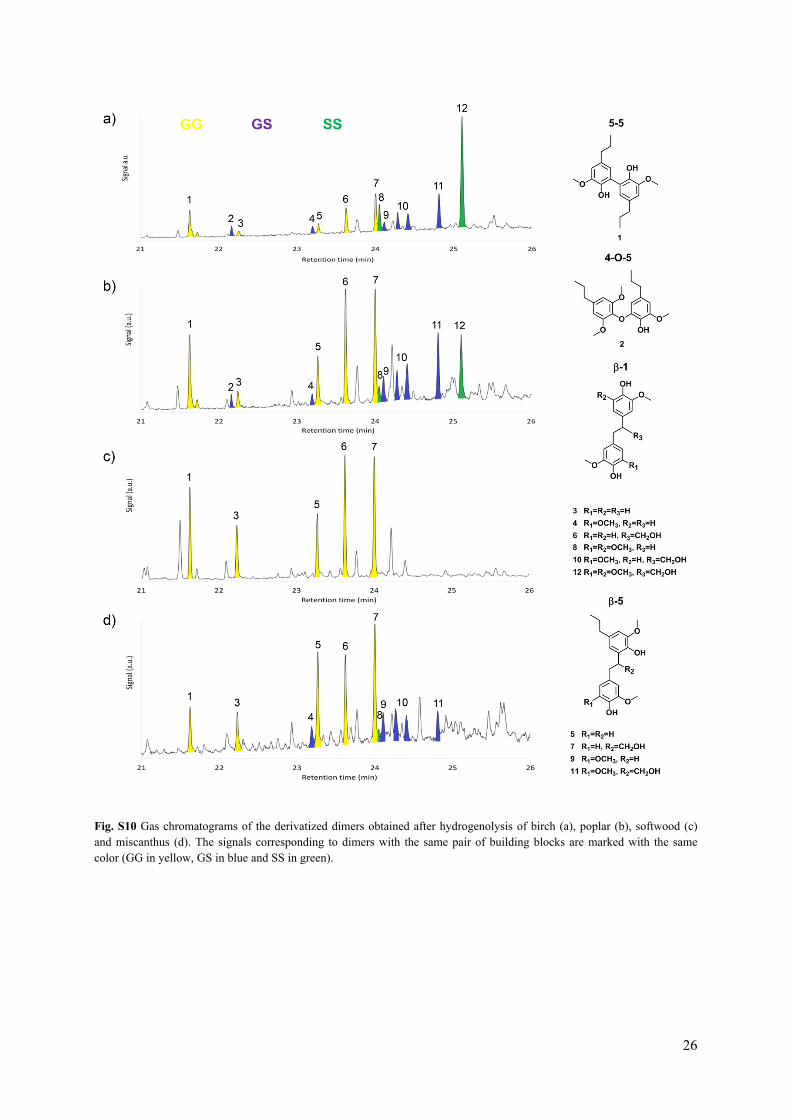
Fig. S10 Gas chromatograms of the derivatized dimers obtained after hydrogenolysis of birch (a), poplar (b), softwood (c) and miscanthus (d). The signals corresponding to dimers with the same pair of building blocks are marked with the same color (GG in yellow, GS in blue and SS in green).

27
OO
O O
O
O O
OHO
O O
OH
OO
Coumaric acid Ferulic acid Methylester products
Ru/C, H2MeOH
Fig. S11 Methyl esterification and side-chain hydrogenation of coumaric acid and ferulic acid results in two specific monomer products (methyl 3-(4-hydroxyphenyl)propionate and methyl 3-(4-Hydroxy-3-methoxyphenyl)propionate), only observed after the hydrogenolysis reaction with Miscanthus giganteus as the substrate (Table 2, Entry 5).
Fig. S12 X-ray diffraction patterns of birch sawdust (top), the carbohydrate fraction after hydrogenolysis of birch sawdust (middle) and the ball milled product of this carbohydrate fraction (bottom). The peaks in the top and middle pattern indicate the presence of crystalline cellulose before and after hydrogenolysis. The bottom pattern shows the influence of ball milling on the crystallinity of the carbohydrate fraction. Powder X-ray diffraction patterns were recorded at room temperature by using a STOE STADI P Combi diffractometer. The diffracted intensity of the CuKα radiation (λ=0.154 nm) was measured in a 2θ range between 0° and 62.5°.

28
D. References
1. R. Vanholme, J. Ralph, T. Akiyama, F. Lu, J. R. Pazo, H. Kim, J. H. Christensen, B. Van Reusel, V. Storme, R. De Rycke, A. Rohde, K. Morreel and W. Boerjan, The Plant Journal, 2010, 64, 885-897.
2. R. Vanholme, V. Storme, B. Vanholme, L. Sundin, J. H. Christensen, G. Goeminne, C. Halpin, A. Rohde, K. Morreel and W. Boerjan, Plant Cell, 2012, 24, 3506-3529.
3. C. W. Dence, in Methods in Lignin Chemistry, eds. S. Lin and C. Dence, Springer Berlin Heidelberg, 1992, ch. 3, pp. 33-61.
4. S. Burkhardt, L. Kumar, R. Chandra and J. Saddler, Biotechnology for Biofuels, 2013, 6, 90.5. R. Van Acker, R. Vanholme, V. Storme, J. C. Mortimer, P. Dupree and W. Boerjan, Biotechnology for
Biofuels, 2013, 6.6. A. R. Robinson and S. D. Mansfield, Plant Journal, 2009, 58, 706-714.7. F. Yue, F. Lu, R.-C. Sun and J. Ralph, Journal of Agricultural and Food Chemistry, 2012, 60, 922-928.8. C. M. Courtin, H. Van den Broeck and J. A. Delcour, Journal of Chromatography A, 2000, 866, 97-104.9. C. Gourson, R. Benhaddou, R. Granet, P. Krausz, B. Verneuil, P. Branland, G. Chauvelon, J. F. Thibault and L.
Saulnier, Journal of Applied Polymer Science, 1999, 74, 3040-3045.10. J. Snelders, E. Dornez, B. Benjelloun-Mlayah, W. J. J. Huijgen, P. J. de Wild, R. J. A. Gosselink, J. Gerritsma
and C. M. Courtin, Bioresour. Technol., 2014, 156, 275-282.11. L. A. Colón and L. J. Baird, in Modern Practice of Gas Chromatography, John Wiley & Sons, Inc., 2004, pp.
275-337.12. H. Kim and J. Ralph, Organic & biomolecular chemistry, 2010, 8, 576-591.13. N. Yan, C. Zhao, P. J. Dyson, C. Wang, L. T. Liu and Y. Kou, Chemsuschem, 2008, 1, 626-629.14. M. V. Galkin and J. S. M. Samec, Chemsuschem, 2014, 7, 2154-2158.15. Q. Song, F. Wang, J. Y. Cai, Y. H. Wang, J. J. Zhang, W. Q. Yu and J. Xu, Energy & Environmental Science,
2013, 6, 994-1007.16. J. Zakzeski, P. C. A. Bruijnincx, A. L. Jongerius and B. M. Weckhuysen, Chem Rev, 2010, 110, 3552-3599.17. J. Rencoret, J. del Río, A. Gutiérrez, Á. Martínez, S. Li, J. Parkås and K. Lundquist, Wood Sci Technol, 2012,
46, 459-471.18. H. Chung and N. R. Washburn, ACS Applied Materials & Interfaces, 2012, 4, 2840-2846.19. F. Alonso, P. Riente and M. Yus, Tetrahedron, 2009, 65, 10637-10643.20. J. M. Brunel, Tetrahedron, 2007, 63, 3899-3906.21. L. Li and N. P. Seeram, Journal of Agricultural and Food Chemistry, 2011, 59, 7708-7716.22. C. Li, M. Zheng, A. Wang and T. Zhang, Energy & Environmental Science, 2012, 5, 6383-6390.23. F. Rudroff, J. Rydz, F. H. Ogink, M. Fink and M. D. Mihovilovic, Advanced Synthesis & Catalysis, 2007, 349,
1436-1444.24. J. C. del Rio, J. Rencoret, P. Prinsen, A. T. Martinez, J. Ralph and A. Gutierrez, Journal of Agricultural and
Food Chemistry, 2012, 60, 5922-5935.25. S. R. Ralph, J. Ralph and L. L. Landucci, NMR Database of Lignin and Cell Wall Model Compounds,
http://ars.usda.gov/Services/docs.htm?docid=10491.26. A. Holmgren, G. Brunow, G. Henriksson, L. Zhang and J. Ralph, Organic & biomolecular chemistry, 2006, 4,
3456-3461.27. I. Kilpelainen, J. Sipila, G. Brunow, K. Lundquist and R. M. Ede, Journal of Agricultural and Food Chemistry,
1994, 42, 2790-2794.28. S.-S. Moon, A. A. Rahman, J.-Y. Kim and S.-H. Kee, Bioorganic & Medicinal Chemistry, 2008, 16, 7264-7269.29. L. H. Xie, T. Akao, K. Hamasaki, T. Deyama and M. Hattori, Chemical & Pharmaceutical Bulletin, 2003, 51,
508-515.30. Q. Wang, Y. Yang, Y. Li, W. Yu and Z. H. Hou, Tetrahedron, 2006, 62, 6107-6112.31. Y. Li, W. Cheng, C. Zhu, C. Yao, L. Xiong, Y. Tian, S. Wang, S. Lin, J. Hu, Y. Yang, Y. Guo, Y. Yang, Y. Li, Y. Yuan,
N. Chen and J. Shi, Journal of Natural Products, 2011, 74, 1444-1452.32. J. R. Hwu, W. N. Tseng, J. Gnabre, P. Giza and R. C. C. Huang, Journal of Medicinal Chemistry, 1998, 41,
2994-3000.33. N. Nakatani, K. Ikeda, H. Kikuzaki, M. Kido and Y. Yamaguchi, Phytochemistry, 1988, 27, 3127-3129.34. B. G. Harvey, C. M. Sahagun, A. J. Guenthner, T. J. Groshens, L. R. Cambrea, J. T. Reams and J. M. Mabry,
Chemsuschem, 2014, 7, 1964-1969.35. B. G. Harvey, A. J. Guenthner, H. A. Meylemans, S. R. L. Haines, K. R. Lamison, T. J. Groshens, L. R. Cambrea,
M. C. Davis and W. W. Lai, Green Chemistry, 2015.36. J. Wildschut, A. T. Smit, J. H. Reith and W. J. J. Huijgen, Bioresour. Technol., 2013, 135, 58-66.