AND DEEP CORPORATE DATA Plunkett Research, Ltd. · Plunkett Research Ltd. | . Build Custom Reports...
12
Plunkett Research, Ltd. Plunkett Research, Ltd. Plunkett Research, Ltd. PLUNKETT RESEARCH ONLINE: BUSINESS AND INDUSTRY RESEARCH PLUNKETT RESEARCH, LTD. | P. O. Drawer 541737, Houston, Texas 77254-1737 USA VOICE: 713.932.0000 | FAX: 713.932.7080 | WWW.PLUNKETTRESEARCH.COM EMAIL: [email protected] INSTANT ONLINE ACCESS TO MARKET RESEARCH INDUSTRY DATA AND DEEP CORPORATE DATA
Transcript of AND DEEP CORPORATE DATA Plunkett Research, Ltd. · Plunkett Research Ltd. | . Build Custom Reports...

Plunkett Research, Ltd.Plunkett Research, Ltd.Plunkett Research, Ltd.
PLUNKETT RESEARCH ONLINE: BUSINESS AND INDUSTRY RESEARCH
PLUNKETT RESEARCH, LTD. | P. O. Drawer 541737, Houston, Texas 77254-1737 USAVOICE: 713.932.0000 | FAX: 713.932.7080 | WWW.PLUNKETTRESEARCH.COM EMAIL: [email protected]
INSTANT ONLINE ACCESS
TO MARKET RESEARCH
INDUSTRY DATA AND DEEP CORPORATE DATA

• Industry Analysis and Statistics
• Market Research
• Company Profiles
• In-Depth Company Financials
• Company Rankings and Benchmarks
• Business Contact List Exports
Special features and our Unique data giveyou an unparalleled online reference package.

• Easy-to-use Research Tools
• Fast Access to Relevant Data
• Industry-Specific Organization Saves Time
• Video Overview of Each Sector
Organized in unique Industry Research Centers, each covering a vital industry sector, so that researchers can immediately find exactly the information they want.

• Trends Analysis
• Competitive Intelligence
• Technologies Analysis
• Regulatory Environment Review
• Market Size
• Export Custom PDFs
The only source for proprietary, point-by-point analysis of industry trends.
MARKETRESEARCH TRENDSANALYSIS
AND
Major Trends Affecting the Health Care Industry:
1) Introduction to the Health Care Industry2) Continued Rise in Health Care Costs3) Employers Push Health Care Costs onto Employees4) Medicare and Medicaid Spending Continue to Surge/Oldest Baby Boomers Hit 65+ Years of Age5) Health Care Reform Act of 2010 Set to Bring Big Changes6) Concierge Care/Direct Primary Care Are on the Rise7) Insurance Companies Change Strategies Due to Health Care Reform Act8) Vast Number of Uninsured and Underinsured Americans9) Few New Blockbusters: Major Drug Patents Expire While Generic Sales Growth Continues10) Biotech and Orphan Drugs Pick Up the Slack as Blockbuster Mainstream Drugs Age11) Quality of Care and Health Care Outcomes Data Become Available Online12) Malpractice Suits Are Blamed for Rising Health Care Costs/Tort Reform Is Capping Awards for Damages13) Obesity Sparks Government Action/Snack Foods Get Healthier14) Health Care Goes Offshore, Medical Tourism and Clinical Trials Thrive in China, India and Elsewhere15) Clinics Open in Retail Store Settings and Employer Sites16) Health Care Industry Grows Rapidly in China and India
1) Introduction to the Health Care Industry
VIDEO TIPFor our brief video introduction to the HealthCare industry, see www.plunkettresearch.com/video/healthcare.
Health Expenditures and Services in the U.S.:Health care costs continue to rise rapidly in the U.S. and throughout the developed world. Total U.S. health care expenditures were estimated to be $2.8 trillion in 2012, and are projected to soar to $3.5 trillion in 2016.The health care market in the U.S. in 2012 included the major categories of hospital care (about $884.7 billion), physician, dental and clinical services ($735.4 billion), prescription drugs ($367.4 billion), along with nursing home and home health ($232.7 billion). Registered U.S. hospitals totaled 5,754 properties in 2010, according to an American Hospital Association survey, containing 941,995 beds serving 35.9 million admitted patients during the year.
Medicare, the U.S. federal government’s health care program for Ameri-cans 65 years or older, provided coverage to 50.7 million seniors in 2012. National expenditures on Medicare for fiscal 2012 were projected to be $590.8 billion, including premiums paid by beneficiaries. By 2030, the number of people covered by Medicare will balloon to about 78.0 million due to the massive number of Baby Boomers entering retirement age.
Medicaid is the federal government’s health care program for low-income and disabled persons (including children), as well as certain groups of seniors in nursing homes. National expenditures on Medicaid totaled an estimated $458.9 billion in 2012. The majority of that expense is paid for by the federal government. However, the states pick up a significant share of the cost, which is a massive burden on state budgets.
Health spending in the U.S., at about 17.9% of Gross Domestic Product (GDP) in 2012, is projected to grow steadily unless significant reforms take place. Health care spending in America accounts for a larger share of GDP than in any other country by a wide margin. Despite the incredible invest-ment America continues to make in health care, 15.7% of people in the U.S. (48.6 million) lacked health care coverage for the entire year of 2011. For some, insurance was unavailable or unaffordable. In other cases, a lack of insurance was due to a personal decision not to pay for it. A large number of the uninsured are illegal immigrants. A Kaiser Family Foundation study, “Medicaid and the Uninsured,” dated February 2007, estimated that one-fourth of the uninsured are eligible for public programs but are not enrolled. These are largely low-income children, and in some cases their parents.

• Thousands of Statistical Tables
• Time Series
• Projections and Forecasts
• Essential Data at your Fingertips
• Export Data to Spreadsheets, Reports and PDFs
The best source for vital statistics that can be hard to find without Plunkett Research.
INDUSTRYSTATISTICS
Source: U.S. Department of Energy, U.S. Energy Information Administration
Plunkett Research Ltd. | www.plunkettresearch.com
Source: U.S. Department of Energy, U.S. Energy Information Administration
Plunkett Research Ltd. | www.plunkettresearch.com

Build Custom Reports on-the-fly for coursework, industry summaries, sales guidesor briefing books.
Your custom report can include:
• Trends Analysis
• Statistics
• Companies
• Industry Glossary
• Industry Associations
BUILD-A-REPORT
Use this tool to create customized reports, drawing from the various research areas of this industry
into a single, convenient PDF document that you can view, email, save, print or download.
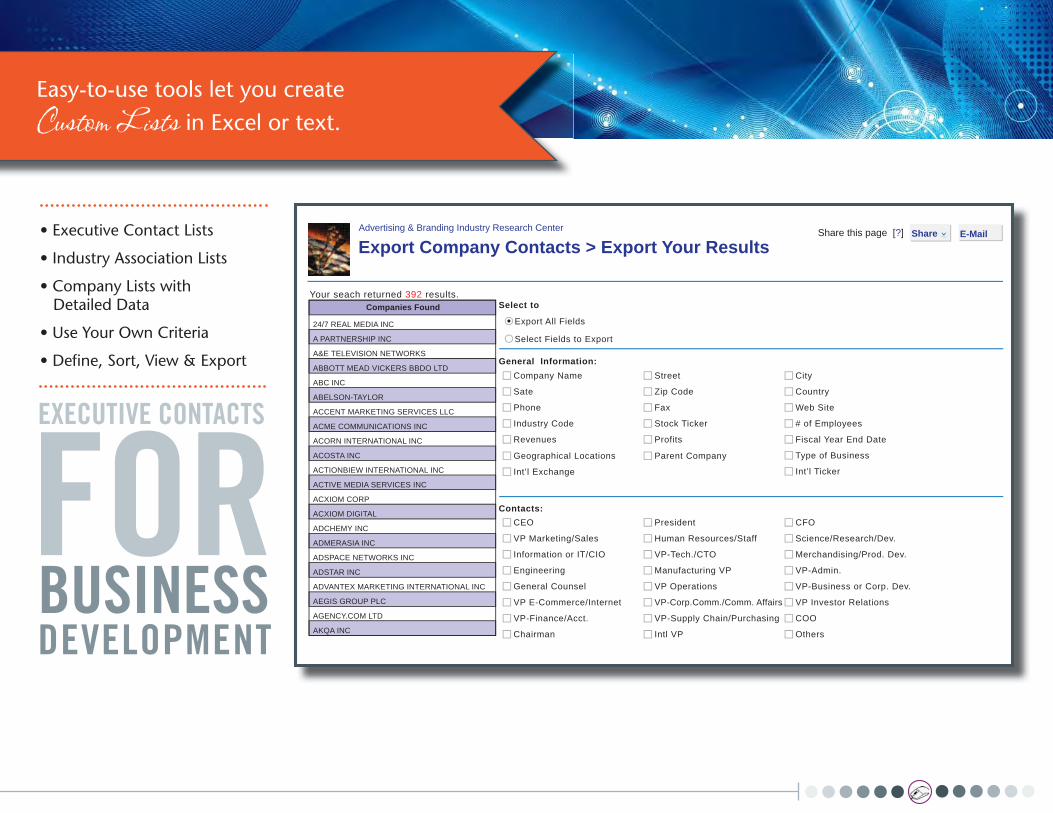
Advertising & Branding Industry Research Center
Export Company Contacts > Export Your ResultsShare this page [?] Share E-Mail
24/7 REAL MEDIA INC
A PARTNERSHIP INC
A&E TELEVISION NETWORKS
ABBOTT MEAD VICKERS BBDO LTD
ABC INC
ABELSON-TAYLOR
ACCENT MARKETING SERVICES LLC
ACME COMMUNICATIONS INC
ACORN INTERNATIONAL INC
ACOSTA INC
ACTIONBIEW INTERNATIONAL INC
ACTIVE MEDIA SERVICES INC
ACXIOM CORP
ACXIOM DIGITAL
ADCHEMY INC
ADMERASIA INC
ADSPACE NETWORKS INC
ADSTAR INC
ADVANTEX MARKETING INTERNATIONAL INC
AEGIS GROUP PLC
AGENCY.COM LTD
AKQA INC
Companies FoundYour seach returned 392 results.
Company Name Street City
Sate Zip Code Country
Phone Fax Web Site
Industry Code Stock Ticker # of Employees
Revenues Profits Fiscal Year End Date
Type of BusinessGeographical Locations Parent Company
Int’l TickerInt’l Exchange
CEO President CFO
VP Marketing/Sales Human Resources/Staff Science/Research/Dev.
Information or IT/CIO VP-Tech./CTO Merchandising/Prod. Dev.
Engineering Manufacturing VP VP-Admin.
General Counsel VP Operations VP-Business or Corp. Dev.
VP E-Commerce/Internet VP-Corp.Comm./Comm. Affairs VP Investor Relations
VP-Finance/Acct. VP-Supply Chain/Purchasing COO
Chairman Intl VP Others
Select Fields to Export
Export All Fields
Select to
General Information:
Contacts:
• Executive Contact Lists
• Industry Association Lists
• Company Lists with Detailed Data
• Use Your Own Criteria
• Define, Sort, View & Export
Easy-to-use tools let you create
Custom Lists in Excel or text.
EXECUTIVE CONTACTS
BUSINESSDEVELOPMENT
FOR

• Public Companies, Private,
Subsidiaries, U.S. and Non-U.S.
• Thorough Descriptions
• Executives
• Competitors Lists
• Financials
The Best Source for up-to-date data on emerging industries and emerging growth companies.
EXACTINGCOMPANYPROFILES

As on Report
Plunkett Research®, Ltd.Market Research, Industry Statistics, Trendsand In-depth Analysis of Top Companies
Home/Industry List Contact & Support MyResearchAccount Administrator Terms of Use FAQs Logout
Visit Plunkett Research
Annual
Company FinancialsInternational Business Machines Corp (http://www.ibm.com)
Industry NAICS code: 334111 (Computer Hardware)
Statement Type Date Type
Income Statement Balance Sheet
Fiscal Year ends in DecemberUS$ Thousands, except marked * or %
Income StatementCash Flow Ratios
Total Revenue
Cost of Revenue
Gross Profit
Operating Expenses
Total Operating Expenses
Operating Income
SGA Expense
R&D Expense
Interest Income
Pre-Tax Income
Income Taxes
Net Income from Continuous Operations
Net Income for Common Stockholders
Earnings per Share
Basic Earnings per Share
Diluted Earnings per Share
Weighted Average Shares (in Thousands)
Basic Average Shares
Diluted Averge Shares
Common Dividend
Dec 2011 Dec 2010 Dec 2009 Dec 2008 Dec 2007
106,916,000
56,778,000
50,138,000
29,852,000
20,286,000
23,594,000
6,258,000
-
21,003,000
5,148,000
15,855,000
-
13.25
13.06
1,196,951
1,213,768
2.90
99,871,000
53,857,000
46,014,000
27,863,000
18,151,000
21,837,000
6,026,000
-
19,723,000
4,890,000
14,833,000
-
11.69
11.52
1,268,789
1,287,355
2.50
99,758,000
51,973,000
43,785,000
26,772,000
17,013,000
20,952,000
5,820,000
-
18,138,000
4,713,000
13,425,000
-
10.12
10.01
1,327,157
1,341,353
2.15
103,630,000
57,969,000
45,661,000
29,723,000
15,938,000
23,386,000
6,337,000
-
16,715,000
4,381,000
12,334,000
-
9.07
8.93
1,359,770
1,381,773
1.90
98,786,000
57,057,000
41,729,000
28,213,000
13,516,000
22,060,000
6,153,000
565,000
14,489,000
4,071,000
10,418,000
10,418,000
7.32
7.18
1,423,040
1,450,571
1.50
• Deep Financials, with Tools that Compare a Company to its Industry Averages
• Operating Ratios for a Company and its Industry
• Build Custom Financial Data Tables
Complete financial tables, analysis, ratios and industry comparisons.
COMPANYDATAFINANCIALS
AND

Market Cap
Total Revenue
3-Year Revenue Growth (%)
Return on Assets (%)
Employee Count
Net Income
3-Year Income Growth (%)
Return on Equity (%)
Industry Ranks for International Business Machines Corp
NAIC: 334111: Computer Hardware, Manufacturing
1. Apple2. IBM3. Hewlett-Packard4. Dell5. Teradata6. NICE-Systems7. Super Micro Computer8. Omnicell9. A Clean Slate10. Silicon Graphics Intrntl
354,351,900,000206,105,000,000
44,607,410,00025,797,190,000
8,960,922,0001,949,455,000
506,898,700456,600,300454,773,300376,362,100
1. Hewlett-Packard2. Apple3. IBM4. Dell5. Teradata6. Super Micro Systems7. NICE-Systems8. Silicon Graphics Intrntl9. Omnicell10. Cray
1. Apple2. HPC POS System3. Super Micro Computer4. Silicon Graphics Intrntl5. Teradata6. NICE-Systems7. UQM Technologies8. Xata9. Hewlett-Packard10. IBM
1. TN-K Energy Group2. Apple3. Teradata4. IBM
1. IBM2. Hewlett-Packard3. NEC Corporation4. Dell5. Apple6. SUN MICROSYSTEMS INC7. ASUSTEK COMPUTER INC (ASUS)8. CASIO COMPUTER CO LTD9. FUJITSU TECHNOLOGY SOLUTIONS (HOLDING) BV10. ACER INC
1. Apple2. IBM3. Hewlett-Packard4. Dell5. Teradata6. NICE-Systems7. Super Micro Computer8. Cray9. Omnicell10. TN-K Energy Group
1. Apple2. Super Micro Computer3. Teradata4. Dell5. NICE-Systems6. IBM7. TN-K Energy Group8. Hewlett-Packard9. Omnicell
1. IBM2. Dell3. Apple4. Teradata
127,245,000,000108,249,000,000
106,916,000,00062,071,000,000
2,362,000,000942,582,000689,451,000629,568,000245,535,000236,046,000
0.490.440.200.180.100.100.060.050.020.01
1.230.270.160.14
426,751349,600115,840103,300
60,40029,00018,85011,52210,500
7,757
25,922,000,00015,855,000,000
7,074,000,0003,492,000,000
353,000,00048,707,00040,213,00014,329,00010,389,000
2,644,267
0.750.170.120.120.090.090.06
-0.05-0.07
0.730.420.420.26
• Quick Ranks for 8 Categories, Including Growth Rates
• Special Tables for Operating Ratios
• Build Custom Reports
• Export to Excel or PDF
Rank companies within their industries, Compare Operating Ratios and more.
INDUSTRYRANKS

• 5-Minute Video Introduction to Each Industry
We provide a Unique Introductory Video to each industry. Use it in the classroom, in sales meetings and in training to bring the industry to life.
INDUSTRYVIDEOS

• Set up a free trial access period • Get a quote on our value-packed prices [email protected]
713.932.0000 USA
These videos will help you appreciate the tremendous value offered by Plunkett Research Online:
“How to use Plunkett Research Online”
“How top business librarians use Plunkett Research”
The only source for proprietary, point-by-point analysisof Industry Trends, Companies and Statistics.
NEXTSTEPS
Plunkett Research, Ltd. | www.plunkettresearch.com
Voice: 713.932.0000 | Fax: 713.932.7080 | Email: [email protected]. O. Drawer 541737 | Houston, Texas 77254-1737 USA
Copyright © 2012, Plunkett Research, Ltd. All Rights Reserved.