AND BITUMEN K. M. Butler of Petroleum T2N 1N4web.anl.gov/PCS/acsfuel/preprint...
30
VAPOUR EXTRACTION OF HEAVY OIL AND BITUMEN Swapan K. Das and Roger M. Butler Department of Chemical and Petroleum Engineering The University of Calgary, Canada, T2N 1N4 Key Words : Heavy oil and Bilurnen, Vapour fitmetion, In Silu Vpgnuiing. Introducfion The world's total estimated proved reserve of conventional oil is one trillion bbl and the world average of the reserves-to-production ratio is only 46 years at 1990 production levelsl'l. This excludes the reserves of heavy oil, tar sands and bitumen that amounts to 6 trillion barrels of oil in place which are not economically recoverable with present technologies. If the proper technology is developed for extracting these resources it can supply the fuel demand for the next few centuries. Heavy oil and bitumen have high viscosity and low API gravity. In some reservoirs, such as Athabasca, the oil viscosity is in millions of mPa.s at reservoir conditions making conventional recovery impossible. Flooding techniques cannot enhance recovery substantially, due to the adverse mobility ratio. The viscosities of the heavy oil and bitumen decrease drastically with increase in temperature. Among the thermal recovery processes applied to produce these crudes, the Steam Assisted Gravity Drainage12] proved to be very successful. In this process steam is injected through a horizontal well and the hot oil being less viscous drains by gravity to the horizontal production well. Using long horizontal wells, very high production rates can be achieved in this process. In steam processes the energy efficiency is poor due largely to heat losses to the underburden and overburden (specially in thin reservoirs). Enormous amount of effluent is to treated, a huge source for the supply of fresh water is required, clay swelling due to contact with fresh water from the condensed steam causes formation damage. However, instead of steam, if solvent is used to dilute bitumen some of these problems can be eliminated. Butler and Mok~ys[~] studied the extraction of bitumen with toluene in a line source Hele-Shaw cell. On the basis of the magnitude of different physical properties affecting the production rates, it was concluded that the solvent leaching would be slower than the thermal processes. It was anticipated that vaporized solvent in combination with deasphalting may enhance the rate considerably. Concept of the Vapex Pmcess In the Vapex (vapour extraction) process vaporized hydrocarbon solvents are injected in the reservoir through a horizontal injection well. The solvent initially dissolves in bitumen around the injection well until diluted oil breaks through the horizontal production well placed vertically below the injection well. Solvent vapour rises slowly to form a vapour chamber in the extracted sand matrix above the injection well. Solvent vapour dissolves in bitumen at the solvent bitumen interface, diffuses through the bulk of bitumen and the diluted oil drains to the production well by gravity. The use of vaporized solvent produces higher driving force in gravity drainage and also reduces the residual amount of solvent in the extracted reservoir. The concept of the process is shown schematically in Figure 1. Several other configurations of injector and producer wells are also possible. Selection of Solvent and Conditions In this process production rate is directly related to the amount of solvent dissolved and diffused into bitumen. One important aspect of this process is deasphalting that yields in situ upgraded oil reducing many down stream problems. The extent of deasphalting also depends on the amount of solvent. The solubility of a vaporized solvent is maximum near its dew point pressure. Hence, the solvent pressure should be as close as possible to its vapoiir pressure at the reservoir temperature. If the dew point pressure of the solvent is lower than the reservoir pressure solvent liquefies and fill the extracted sand matrix with liquid solvent. Thus a barrel of oil is replaced by a barrel of liquid solvent which is not economic. Hence, to be suitable for the process, the solvent should have a dew point pressure slightly higher than the reservoir pressure so that it can be safely injected without liquefaction and the maximum solubility can be achieved at the same time. This criteria 962
Transcript of AND BITUMEN K. M. Butler of Petroleum T2N 1N4web.anl.gov/PCS/acsfuel/preprint...

VAPOUR EXTRACTION OF HEAVY OIL AND BITUMEN
Swapan K. Das and Roger M. Butler Department of Chemical and Petroleum Engineering
The University of Calgary, Canada, T2N 1N4
Key Words : Heavy oil and Bilurnen, Vapour fitmetion, In Silu Vpgnuiing.
Introducfion The world's total estimated proved reserve of conventional oil is one trillion bbl and
the world average of the reserves-to-production ratio is only 46 years at 1990 production levelsl'l. This excludes the reserves of heavy oil, tar sands and bitumen that amounts to 6 trillion barrels of oil in place which are not economically recoverable with present technologies. If the proper technology is developed for extracting these resources it can supply the fuel demand for the next few centuries.
Heavy oil and bitumen have high viscosity and low API gravity. In some reservoirs, such as Athabasca, the oil viscosity is in millions of mPa.s at reservoir conditions making conventional recovery impossible. Flooding techniques cannot enhance recovery substantially, due to the adverse mobility ratio.
The viscosities of the heavy oil and bitumen decrease drastically with increase in temperature. Among the thermal recovery processes applied to produce these crudes, the Steam Assisted Gravity Drainage12] proved to be very successful. In this process steam is injected through a horizontal well and the hot oil being less viscous drains by gravity to the horizontal production well. Using long horizontal wells, very high production rates can be achieved in this process.
In steam processes the energy efficiency is poor due largely to heat losses to the underburden and overburden (specially in thin reservoirs). Enormous amount of effluent is to treated, a huge source for the supply of fresh water is required, clay swelling due to contact with fresh water from the condensed steam causes formation damage. However, instead of steam, if solvent is used to dilute bitumen some of these problems can be eliminated.
Butler and Mok~ys [~ ] studied the extraction of bitumen with toluene in a line source Hele-Shaw cell. On the basis of the magnitude of different physical properties affecting the production rates, it was concluded that the solvent leaching would be slower than the thermal processes. It was anticipated that vaporized solvent in combination with deasphalting may enhance the rate considerably.
Concept of the Vapex Pmcess In the Vapex (vapour extraction) process vaporized hydrocarbon solvents are injected
in the reservoir through a horizontal injection well. The solvent initially dissolves in bitumen around the injection well until diluted oil breaks through the horizontal production well placed vertically below the injection well. Solvent vapour rises slowly to form a vapour chamber in the extracted sand matrix above the injection well. Solvent vapour dissolves in bitumen at the solvent bitumen interface, diffuses through the bulk of bitumen and the diluted oil drains to the production well by gravity. The use of vaporized solvent produces higher driving force in gravity drainage and also reduces the residual amount of solvent in the extracted reservoir. The concept of the process is shown schematically in Figure 1. Several other configurations of injector and producer wells are also possible.
Selection of Solvent and Conditions In this process production rate is directly related to the amount of solvent dissolved
and diffused into bitumen. One important aspect of this process is deasphalting that yields in situ upgraded oil reducing many down stream problems. The extent of deasphalting also depends on the amount of solvent. The solubility of a vaporized solvent is maximum near its dew point pressure. Hence, the solvent pressure should be as close as possible to its vapoiir pressure at the reservoir temperature. If the dew point pressure of the solvent is lower than the reservoir pressure solvent liquefies and fill the extracted sand matrix with liquid solvent. Thus a barrel of oil is replaced by a barrel of liquid solvent which is not economic. Hence, to be suitable for the process, the solvent should have a dew point pressure slightly higher than the reservoir pressure so that it can be safely injected without liquefaction and the maximum solubility can be achieved at the same time. This criteria
962

combined with the abundant reservoir pressures and the cost and availability of the solvents limits the choice of solvent to ethane, propane and butane. In our experiments it was observed that performance of the process with ethane is inferior to that for propane and butane. Propane and butane yields comparable rates. However, propane upgrades the oil by dasphalting which is less prominent with butane. There are many heavy oil and bitumen reservoirs where the pressure is in the range of propane dew point pressure. In shallow reServoirs butane may be suitable. Theory
process using vaporized solvents predicts the production rates as The pseudo-steady state model developed by Butler and Mok~ys[~’ modified for the
where
and
q = 2 ~ a K
a = ,/-
H L q = production rate k = Permeability g 6 = porosity ASo p A p 0, c,, ci, c,,, = rn = cementation factor
= height of the reservoir = length of horizontal well
= acceleration due to gravity
= change in oil saturation = viscosity of mixture at solvent concentration, cs = density difference between solvent and bitumen = intrinsic diffusivity of propane in bitumen
mole fraction of solvent at different points in the boundary layer (Fig. 1)
Since the production rates are directly proportional to the vapex parameter, ‘a’, it can be used to evaluate the performance of the process at different conditions14]. Both the production rates and ‘a’ are proportional to the square root of permeability and this relation can .be used to scale up the production for different permeabilities.
Experiments in Hele-Shaw cell and Packed Visual Model Several experiments were carried out in Hele-Shaw cell by Das and Butler to assess
the impact of asphaltene deposition on the performance of the process. The experimental set up, procedures and the method of analysing data were described else whereI41. The photograph of the Hele-Shaw cell at the end of one interesting experiment carried out with Lloydminster heavy oil and propane is shown in Figure 2. The propane pressure in this experiment was varied by approximately 10 psi by varying the temperature of the propane supply cylinder between 19 and 22OC as shown in Figure 3. It was observed that at higher pressure, close to the dew point of the solvent, asphaltenes were deposited and at a lower pressure diluted oil drained without asphaltene precipitation. The alternate dark bands (deposited asphaltenes) and white bands (clean swept area) in Figure 2 clearly show the history of the pressure cycles. The corresponding vapex parameters, plotted in Figure 3, shows that the production rate is enhanced when asphaltene precipitation takes place. This due to the tremendous reduction of viscosity caused by deasphalting. Results of some experiments carried out in Hele-Shaw cell with different permeabilities are presented in Table 1. These show that under identical temperature of cell and propane, vapex parameters are proportional to the square roots of permeability,
Several experiments were carried out in visual packed cell using sands of different permeabilities and butane as a solvent. Experimental set up and procedure are described elsewherer5]. Cumulative productions from one of this experiment carried out with Peace River bitumen is shown in Figure 4, which is similar to the production profile in all of these packed cell experiments. As expected it is observed that the solvent vapour initially rises to form the solvent chamber, chamber grows to the top of the packed cell and then spreads sideways.
Comparison of Hele-Shaw and Packed Cell Res& /
963 i rU
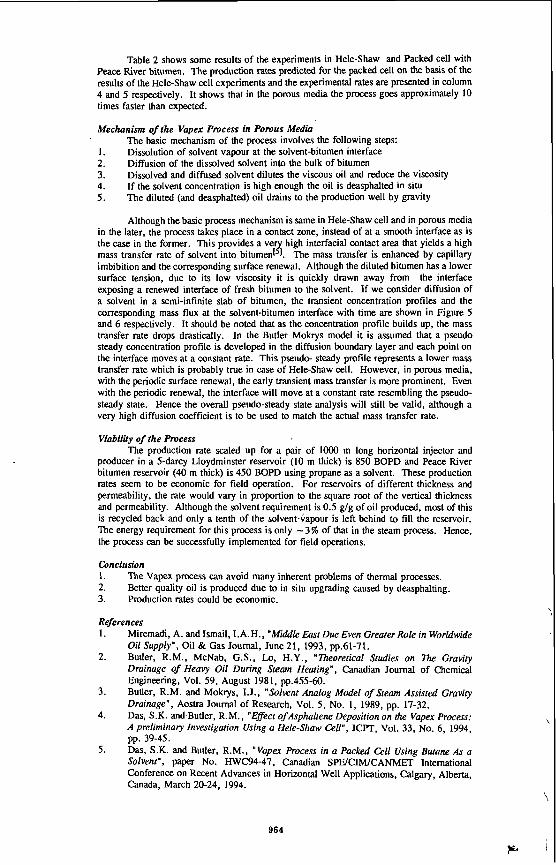
Table 2 shows some results of the experiments in Hele-Shaw and Packed cell with Peace River bitumen. The production rates predicted for the packed cell on the basis of the results of the Hele-Shaw cell experiments and the experimental rates are presented in column 4 and 5 respectively. It shows that in the porous media the process goes approximately 10 times faster than expected.
Mechanism of the Vapex Process in Porous Media
1. 2. 3. 4. 5.
The basic mechanism of the process involves the following steps: Dissolution of solvent vapour at the solvent-bitumen interface Diffusion of the dissolved solvent into the bulk of bitumen Dissolved and diffused solvent dilutes the viscous oil and reduce the viscosity If the solvent concentration is high enough the oil is deasphalted in situ The diluted (and deasphalted) oil drains to the production well by gravity
Although the basic process mechanism is same in Hele-Shaw cell and in porous media in the later, the process takes place in a contact zone, instead of at a smooth interface as is the case in the former. This provides a ve high interfacial contact area that yields a high mass transfer rate of solvent into bitumenlq. The mass transfer is enhanced by capillary imbibition and the corresponding surface renewal. Although the diluted bitumen has a lower surface tension, due to its low viscosity it is quickly drawn away from the interface exposing a renewed interface of fresh bitumen to the solvent. If we consider diffusion of a solvent in a semi-infinite slab of bitumen, the transient concentration profiles and the corresponding mass flux at the solvent-bitumen interface with time are shown in Figure 5 and 6 respectively. It should be noted that as the concentration profile builds up, the mass transfer rate drops drastically. In the Butler Mokrys model it is assumed that a pseudo steady concentration profile is developed in the diffusion boundary layer and each point on the interface moves at a constant rate. This pseudo- steady profile represents a lower mass transfer rate which is probably true in case of Hele-Shaw cell. However, in porous media, with the periodic surface renewal, the early transient mass transfer is more prominent. Even with the periodic renewal, the interface will move at a constant rate resembling the pseudo- steady state. Hence the overall pseudo-steady state analysis will still be valid, although a very high diffusion coefficient is to be used to match the actual mass transfer rate.
Viabilify of the Process The production rate scaled up for a pair of loo0 m long horizontal injector and
producer in a 5-darcy Lloydminster reservoir (10 m thick) is 850 BOPD and Peace River bitumen reservoir (40 m thick) is 450 BOPD using propane as a solvent. These production rata Seem to be economic for field operation. For reservoirs of different thickness and permeability, the rate would vary in proportion to the square root of the vertical thickness and permeability. Although the solvent requirement is 0.5 glg of oil produced, most of this is recycled back and only a tenth of the solvent-Gapour is left behind to fill the reservoir. The energy requirement for this process is only - 3 % of that in the steam process. Hence, the process can be successfully implemented for field operations.
Conclusion 1. 2. 3.
References 1.
2.
The Vapex process can avoid many inherent problems of thermal processes. Better quality oil is produced due to in situ upgrading caused by deasphalting. Production rates could be economic.
Miremadi, A. and Ismail, I.A.H., "Middle EatDue Even Greater Role in Worldwide Oil Supply", Oil & Gas Journal, June 21, 1993, pp.61-71. Butler, R.M., McNab, G.S., Lo, H.Y., "Theoretical Studies on n2e Gravity Drainage of Heavy Oil During Sleam Heating", Canadian Journal of Chemical Engineering, Vol. 59, August 1981, pp.455-60. Butler, R.M. and Mokrys, I.J., "Solvent Analog Model of Steam Assisted Gravity Drainage", Aostra Journal of Research, Vol. 5, No. 1, 1989, pp. 17-32. Das, S.K. and Butler, R.M., "Effect ofAsphaltene Deposition on the Vapex Process: A preliminary Investigation Using a Hele-Shaw Cell", JCPT, Vol. 33, No. 6, 1994,
Das, S.K. and Butler, R.M., "Vapex Process in a Packed Cell Using Butane As a Solvent", paper No. HWC94-47, Canadian SPUCIMKANMET International Conference on Recent Advances in Horizontal Well Applications, Calgary, Alberta, Canada, March 20-24, 1994.
3.
4.
pp. 39-45. 5.
964

Vapour Extraction of Heavy oil and Bitumen
Figure 1 . Concept 01 the Vapex Process Figure 2. Pressure variation in HeleShaw cell (Lloydminster oil and propane).
I 25
10 L! s0 100 lk 2dO 250 300 358
lima (mi".)
Figure 3. Pressure cycles and corresponding \ ; Vapex parameters. /
300
200 s 7 0 m* wr. ""d R-YYI~ n Bul.W T.T. - 20d.C
100 C.u 1.v. - n.o'c
'0 20 40 60 80 100 0
Time (hr.)
Figure 4. Extraction of Peace River bitumen in 27d sand.
965
Table 1. Effect of Permeability on the Vapex parameter
Vapex parameter (cm' 'hr)
PR and propane 25.0 121.7 5376 2.47
PR and propane 25.0 120.8 5376 1.76
LM and propane 25.0 / 20.8 1344 1.66 5376 3.56
0 a: 0
I PIRulETERS : TIME (si
.........................
.......................
....
....
....
....
... 1
:I ._
4 5
Figure 5. Transient Concentration Profiles Figure 6. Transient mass flux at the interlacs
966
I
EFFECT OF POLYOLEFINS ON THERMAL CRACKING OF HEAVY RESIDUES
M. Stanciulescu, H. Seoud and J.F. Kelly CANMET, Energy Research Laboratories
Natural Resources Canada Ottawa, Ontario, Canada KIA OGI
Keywords: polyolefins, plastic wastes conversion, fuels, thermal cracking.
INTRODUCTION
Polyolefins, like polyethylene (PE), polypropylene (PP) and Polystyrene (ps) represent a major source of plastic waste. Annually in Canada, appdmately 50 Wlograms of organic wade per person Is post consumer plastic and over 40% of this plastic is PE. Less than 5% of the latter is recovered or recyded. However, the PE as well as the PP are the richest polyolefins in hydrogen content; they have the highest WC mU0, both In term of atomic (1.96) and weight ratio (0.17) of all polymers. This represents a tremendous waste of resoums. In an effort to use these resources many different pibsses are at various stages of development and new innovations continue to be introduced in plastic waste conversion (1-5). Most of them are pyrolytic processes which involve the conversion of polymeric wastes to monomers, chemicals, liquid and gaseous fuels and coke by heating the polymeric material to high temperature without oxygen or in a limited oxygen atmosphere. The decomposition temperatures for PE, PP and PS range from 400% to 45OOC (6). Thermal decomposition of PE and PP is a radical mechanlsm. Random rupture of G C bonds in the backbone of the chain yields free radicals (7). PS decomposes thermally by a mechanism which involves a hydrogen transfer at the site of scission. The bond scission is random and yields one saturated and one unsaturated molecule (8).
The objective of this present work was to determine the effect of these radicals produced from polyolefins on the aromatic radicals produced from the heavy residues (vacuum bottoms and bitumen) by analyzing the final effects on thermal cracking products. distillates and coke. A series of experiments has been undertaken using a tubing bomb reactor of 100 mL capadty. The experiments were conducted at 46OOC or 470'C for 10 min under an inert atmosphere (N2).
EXPERIMENTAL
Feedstocks Cold Lake vacuum bottoms (CLVB) and Athabasca bitumen were used as heavy
residues. The polyolefins used as additives were PE, PP and PS, pure resins. The elemental and proximate analyses are given in Table 1, Distillation of the heavy oils to determine pitch content (+52%) was canied out using an automated DY 160 unit.
Batch reactor unit The reaction vessel was a IOOrnL stainless steel tubing bomb reactor. The reactor
was charged with 20 g or 30 g of heavy residue mixed with polyolefins at various concentrations. The air from the reactor was purged using high pressure nitrogen. Subsequently, the reactor was depressurized to latm at room temperature and then the reactor was immersed in a fluldized sand bed preheated to 5OO0C. At 460°C or 470% the reaction was continued for 10 min. The reaction time was denned as the residence time at the desired temperature neglecting the preheating periods that increased with polyolefins concentrations from 6 to 10 min. During reaction, the system Is agitated by a pneumatic vibrator which assured good mixing. After 10 rnin the readion was stopped by rapidly cooling the reactor.by spraying with mid water mists. The gases were vented to a gas sampling bag. The remaining slurry was weighed and distilled or extracted with solvent, toluene or tetrahydrofuran (THF).
Product analysis Process gases were analyzed by gas chromatography (GC) for H2. H2S, CO, (x= 1 or
2) and hydrocarbons up to C,. The Slurry products were distilled using an ASTM D- 1160 apparatus to obtain the overall distillable and residue products at a cut point of 525% (9noF). The overall distillable has been fractioned to determine the amount of naphtha (lBP-185%), lighl'gas oil (LGO, 185-335%) and heavy gas oil (HGO: 335- 525%). The residue (+525'%) fraction from D-1 160 distillation was extracted by THF for d8terminatiOn of coke which is reported as tetrahydrofuran insolubles (THFI).
967
The liquid products were analyrad by GC using a capillary gas chromatograph (Perkin- Elmer, Sigma 2000), with a flame ionization detector (FID) and capillary column. Toluene solubles (TS), toluene insolubles (TI), tetrahydrofuran solubles (THFS) and tetrahydrofuran insolubles (THFI) were separated by soxhlet extraction.
RESULTS AND DISCUSSION The significant feature of this study is the conversion of waste Plastics (PE, p p and
Ps) into transportation fuels, Le.. gasoline or diesel fuel in the presence of heavy residues, through a thermal cracking route. The objectives were to Increase the distillate yield, to reduce the amount of residue and to reduce the formation of coke during the thermal cracking process at high temperatures and short residence times. The selected operating conditions must fevor the cracking of both feedstocks and additives (polyolefins). Without an external hydrogen source and any hydrogenation catalyst, coke fomatlon would be lnevltable at high temperature (460% or 470'C) even If the reaction tlme Is short (10 mln). Any increase In distillate yield or suppression of coke formation can be explained In terms of radical Interactions during thermal cracking. The Interactions of long aliphatic radicals with aromatic radicals from heavy oils compete with coke formation and other retrogressive reactions. The hydrogen donw ability of polyolefins wwkl convert heavy oil lo distillate. The qualilies of the distillates produced varied depending on the combination of polyolefinslheavy oils, but this aspect Is no1 addressed in this paper.
Heavy oil feedstocks and polyolefins Two different feedstocks were used for this study. One is CLVB, which contains a
high amount of pitch, 83.2%, high microcarbon residue and high content of sulphur. The WC atomic ratio is 1.42 and the metals content is low. The second one, Athabasca bitumen, has 52.4% pitch and a lower microcarbon residue. It's WC atomic ratio is 1.57. The polyolefins were pure, with no additives. The PE (HDPE) has a HIC atomic ratio of 1.96 that is very close to that of its monomer (2.00 for GH,). The PP has H/C ratio of 2.00 and PS a WC ratio of 1.01.
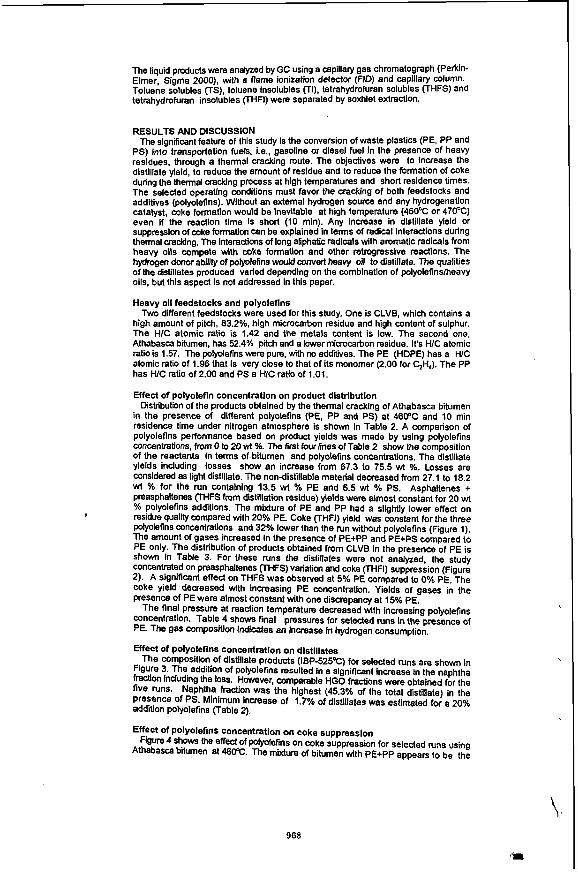
Effect of polyolefin concentration on product distribution Distribution of the products obtained by the thermal cracking of Athabasca bitumen
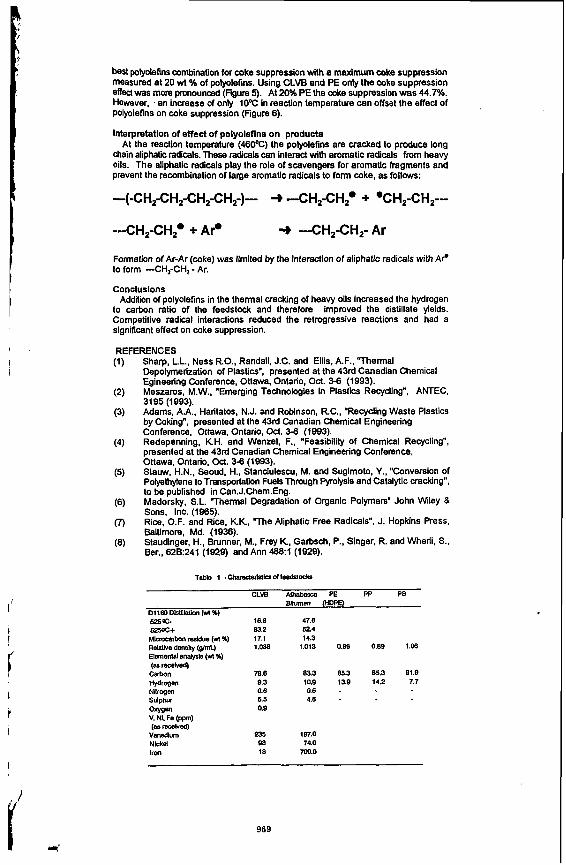
in the presence of different polyolefins (PE, PP and PS) at 460°C and 10 min residence time under nitrogen atmosphere is shown In Table 2. A comparison of polyolefins performance based on product yields was made by using polyolefins concentrations, from 0 to 20 wt I. The rint four lines of Table 2 show (he composition of the reactants In terms of bitumen and polyolefins concentrations. The distillate yields including losses show an inmase from 67.3 to 75.5 wl %. Losses are considered as ligM distillate. The non-distillable material decreased from 27.1 to 18.2 wt % for the run containing 13.5 wt X PE and 6.5 wl % PS. Asphaltenes t preasphaltenes (VIFS h m distillation residue) yields were almost constant for 20 wl % polyolefins additions. The mixture of PE and PP had a slightly lower effect on residue quality compared with 20% PE. Coke (lHFI) yield was constant for the three plyolefins concentrations and 32% lower than the run without polyolefins (Figure 1). The amount of gases increased in the presence of PE+PP and PE+PS compared to PE only. The distribution of products obtained from CLVB in the presence of PE is shown in Table 3. For these runs the distillates were not analyzed, the study concentrated on preasphaltenes (THFS) variation and coke (THFI) suppression (Figure 2). A significant effect on THFS was observed at 5% PE compared to 0% PE. The coke yield decreased with Increasing PE concentration. Yields of gases in the presence of PE were almost constant with one discrepancy at 15% PE.
The final pressure at reaction temperature decreased with Increasing polyolefins concentration. Table 4 shows final pressures for selected runs in the presence of PE. The gas composition indicates an increase in hydrogen consumption.
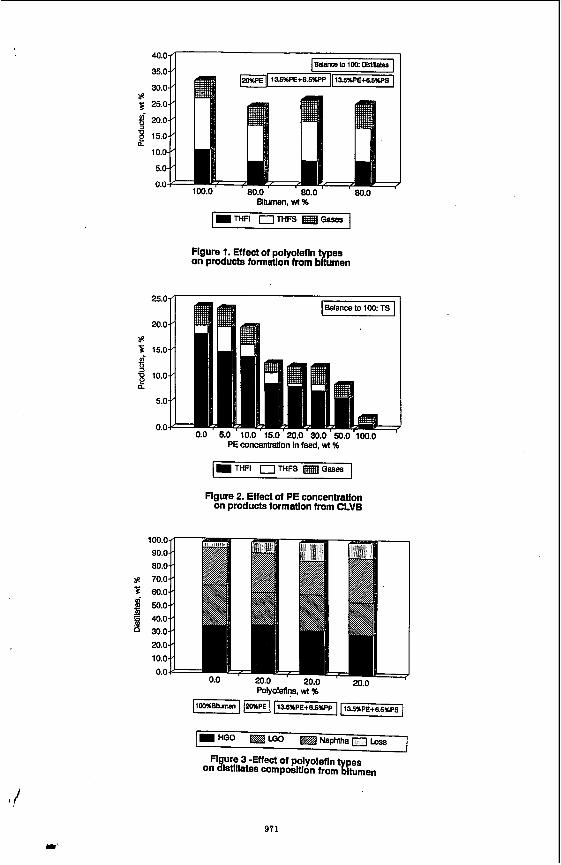
Effect of polyolefins concentration on distillates The composition of distillate products (IBP-525%) for selected runs are shown in
figure 3. The addifion Of PolYolefinS resulted In a slgniflcant Increase in the naphtha ffadion lnduding the loss. However, comparable HGO fractions were obtained for the five runs. Naphtha fraction was the highest (45.3% of the total distillate) in the Presence Of PS. Minimum Increase of 1.7% of dlstillates was estimatd for a 20% addition polyolefins (Table 2).
Effect of PolYOlefins concentration on coke suppression Figure 4 shows the effed Of Poblefins on coke suppression for selected runs using
Athabas- bitumen at em. The mixture of bitumen with PEtPP appean to be the
968
I'
1
best polyolefins combination for coke suppression with a maximum coke suppression measured at 20 wt I of polyolefins. Using CLVB and PE only the coke suppression effect was more pronounced (F~ure 5). At 20% PE the coke suppression was 44.7%. However, an increase of only 10°C In reaction temperature can offset the effect of Polyolefins on coke suppression (Figure 6).
hterpretatlon of effect of polyolefins on products At the reaction temperature (460%) the polyolefins are cracked to produce long
chain aliphatic radicals. These radicals can interact with aromatic radicals from heavy oils. The aliphatic radicals play the role of scavengers for aromatic fragments and prevent the recombination of large aromatic radicals to form coke, as follows:
-(-CH2-CH&H,-CH2-)- + -CH&H,O + 'CH2-CH,---
---CH,-CH,. + Ar. 3 -CH,-CH2- Ar
Fonnation of Ar-Ar (coke) was limited by the interaction of aliphatk radicals with AP to form -CH,-CH, - Ar.
Concluslons Addition of polyolefins in the thermal cracking of heavy oils increased the hydrogen
to carbon ratio of the feedstock and therefore improved the distillate yields. Competitive radical interactions reduced the retrogressive reactions and had a significant effect on coke suppression.
REFERENCES Sharp, L.L.. Ness R.O.. Randall, J.C. and Ellis, A.F., "Thermal Depolymerization of Plastics", presented at the 43rd Canadian Chemical Egineering Conference, Ottawa, Ontario, Oct. 3-6 (1993). Meszaros, M.W., "Emerging Technologies in Plastics Recycling", AMEC, 3195 (1993). Adam;, A.A:. Haritatos, N.J. and Robinson, R.C., "Recycling Waste Plastics by Coking", presented at the 43rd Canadian Chemical Engineering Conference, Ottawa, Ontario, Oct. 3-6 (1893). Redepenning, KH. and Wenzel, F., "Feasibility of Chemical Recycling", presented at the 43rd Canadian Chemical Engineering Conference. Ottawa. Ontario, Oct. 3-6 (1993). Siauw, H.N., Seoud, H., Stanclulescu, M. and Suglmoto, Y., "Conversion of Polyethylene to Transportation Fuels Through Pyrolysis and Catalytic cracking", to be published in Can.J.Chem.Eng. Madorsky, S.L. 'Thermal Degradation of Organic Polymers" John Wiley 8 Sons, Inc. (1965). Rice, O.F. and Rice, KK, "The Aliphatic Free Radicals", J. Hopkins Press, Baltimore, Md. (1936). Staudinger, H., Brunner, M.. Frey K, Garbsch. P.. Singer, R. and Wherli, S.. Ber., 62B:241 (1929) and Ann 4681 (1929).
Table 1 - C ~ w d f ~ &
CLVB A t h a b e PE PP PS Bltumen WPQ
01 180 DMOlsHon (nl%) 525@ 1e.8 47.8 625oc+ 83.2 52.4 Mlnaarbonraaidue(wl%) 17.1 14.3 R W e den% (erW 1 . a 1.013 0.W 0.89 1.00 Elemenld anal@ (Ma) P -w Carbon 78.8 €3.3 85.3 85.3 91.9 W m g W Nnmgen 0.6 0.6 - Sulphur 5.5 4.8 . WW 0.9 V. NI. Fe (Ppm) (- raco
VaMQUm 235 187.0
Iron 18 700.0
9.3 10.9 13.9 14.2 7.7
Nlckel 93 74.0
969

THFl 11.0 Resldue:THFS+THFI 27.1 18.8 20.3 182 18.9
avBvtx IMO ow 90.0 em 80.0 70.0 sa0 0.0
PEW% 0.0 5.0 10.0 15.0 M.0 30.0 50.0 lW.O
ywd.wlx
Ts 7~ 70.7 80.3 87.3 87.9 81.0 91.4 81.7
THFS 1.7 4.8 23 zi 0.6 1.4 a2 0.2
THFl 183 14.8 14.0 8.1 8.2 7.3 5.8 1.0
Gas.. 3.7 3.8 3.4 1.8 b3 1 4 2s 1.1
1 5.6 1 a8 7.3
Loss 3.0 10.4 a7 Total 97.0 83.7 63.8 81.3 m8
Table 4- Final pmaure id readon temperature d PE wim heavy o b ana hLdroeen mncentratlon In gases Initial pressure: 1 atm at room temperature (nltrogen)
PE. wt % 0.0 10.0 15.0 20.0 50.0 100.0
w(% 100.0 90.0 89.0 80.0 50.0 0.0 flnal Pressure
PSI 980.0 950.0 925.0 1080.0 900.0 620.0 Atm 66.8 64.8 63.1 73.6 61.3 42.3 HZwl %' 9.2 9.1 9.2 9.2 6.7 18.3 H2- mnsump. - 1.0 2 3 1.8 7.1 - FEEd: Bitumen, wt% 100.0 90.0 85.0 130.0 m.0 0.0
Final pressure
PSI 1468.0 1417.0 1100.0 W . 0 874.0 620.0 MPa 100.1 96.8 75.0 59.1 45.9 423 H2,wl%* 8.5 6.4 6.4 9.1 12.1 18.3 H2- mnsump. - 1.3 1.8 0 . 3 0.3 - I
~ t-iydrogen concamrailon In gases ** - Based on 1 w9( polyoleiins
970
5 25.0
8 15.0 n
10.0
5.0
0.0
Bltumen. wi %
10.0
5.0
0.0
Flgure 1. Effect of polyolefln on products formatlon from b p A n
PE concentration in feed, wi %
Flgure 2. Effect of PE concentration on products formatlon from CLVB
1m.o 90.0 80.0
8 70.0 5 60.0 f 50.0 1 40.0
a 30.0 20.0 10.0
0.0
POlYOlefIns. wt %
971

16.0
14.6
10 3b 40 50 60 70 80 90 100 0.0 T
Polyoleflns. wt %
I-=- a m e n + PE -I- Bmrmen+PE PP(1:l) -*c BItumn+PE PS(1:l) I
Figure 4 -Effect of polyoleflns concentratlon on coke formdon
10 ae
0 0 10 20 $0 40 50 60 70 80 90 100
PE concentration In feed, w i %
+ coke formation -e- coke suppresslon
Rgure 5 -Effect of PE concentration on suppression of coke from CLVB
2 o . o L
7 0.04 I , , , , , , I
0 10 20 30 40 50 60 70 80 90 ~~ ..
PE concentration in feed. wt %
I + THFI at 460% --e THFI at 4709: I FIgure 6 -Effect of temperature on
suppression of coke from CLVB
912

EXTRAHEAVY CRUDE OIL UPGRADING IN THE PRESENCE OF NATURAL GAS AS HYDROGEN SOURCE. CONTINUOUS FLOW EXPERIMENTS AND ECONOMIC EVALUATION Cesar Ovalles, Ely Saul Arias. Anronia Hamana, Carmcn B. BadclI and Gustavo Gonzalez, Department
of Pemleurn Chemistry, INTEVEP, S. A.. Apdo. 76343. Caracas 1070A. Venezuela
Key Words: Upgrading, Exwheavy audc Oil, Methane, Economic Evaluations
INTRODUCTION The presence of vast ~ S C N C S of natural gas available in di f€mt pans of the world has
motivated continuous research efforts in new routes for the utilization of this raw material [l- 81. Spcifically. the direct use of methane as a source of hydrogen for coal and crude oil upgrading has received the attention of several research p u p s during the last few ycars [5-8].
Sundaraa and coworkers [5] employed natural gas (methane) as hydrogen source for coal liquefaction and found a 73% conversion of a Illinois #6 coal at 425OC and 1000 psi using tewlin as a donor solvent. When employing nitrogen instcad of methane, lower conversion was found (67%) indicating that. most probably, methanc was involved ia h e IiqucfaCtiOa process
Egiebor and Gray reponed [q -70% conversion to liquid pmducts for the liquefaction of Highvale coal using methanc armDsphere in the presence or not of a d y s t eq with tewlia as a donor solvent at 4 W C and a pnssure of 27&350 psi. The chammimion of the hydmmbon products by IH-NMR showed similar spectra for the hydrogen and methane reactions. and by GC and GC-MS analysis of the donor solvent. methyl and dimthy1 substimted products were detected.
(Hamata. API 8.69 using mthanc as a source of hydrogen under thamal conditions. in the presence of water as additive. The reaction of Hamaca crude oil (warn content 4.4%) with mtham at 3 8 W and 1600 psi for4 h, led to a dcmasc in two orders of magnitude in the viscosity of the upgraded product (from 500.000 to 1990 CP at 3 m . a parentage of conversion of the WC+ M o n of 60% and 11.3% of HDS. with respcct to the original crude. compar#l to the Cl+mntaining expaimcnt. a naction carried out under nitrogen as an inat gas (conml expaiwnt) led to a product with higher viscosity (2600 cP), Iowa conversion of the heavy M o n (54%) and lower HDS (8.3%). Thee results indicated [7] that methane was involved in the upgrading reactions and, most probably. was behaving as a source of hydrogen for the thamal processes
According to the IH- and WNMR data [7] , the most probable pathway is a radical chain mec- which involves inanpmion of mthanc to the hydrocarbon molecUlcJ via the production of mahyl radicals. The pmposcd mchanism is as follows:
WCS and coworken studied [7-81 the Upgrading Of O d e B e l t urtraheavy crude oil
.- R-R' -+ R' + R*
R*+HzO 4 R H + O H $ (2)
R*+W -+ RH+CH3' (3) OH* + W -+ H2O + CH3' (4)
CH3' + R-R' -+ RCH3 (RCH3) + R'(R*) (5)
R' + CH3' + RCH3
CHf + a i 3 0 + CH3cH3 R' + R* -+ R - R
Where R and R am hydrocarbons. Rcacb'ons carried out using a dehydrated crude oil (less lhan 1% of H20) under mthane
and nimgcn ampsphau gave approximately similar mults (2400 cP. 45% of CQIVQsion and 8% of HDS), indicating that the prcscncc of warn is necessary in d e r to achieve methane incorporatioa into the upgraded produce. The beneficial effcca of water in the w+maiaing
4) with the concomitant production of methyl radicals to condnue tk chain proass [q.
(a)
0 (8)
upgrading rtactioas of binrmcns can be rationalized by the leaaioo of ow with mnhanc (eq.
973
this papa the upgrading of exnahcavy crude oil (Hamata. API 8.6'9 was demonstrated m a continuous flow system using natural gas as a source of hydrogen in the presence of water as additive. The &ects of the naaual gas pressure (1600,800 and 200 psi), residence timc (30 and 45 min) and percentage of water (10 and 20% w/w) were studied using a 0.11 barreWday hydrovisbreaking unit d e d to use nand gas. From now on, we refer to this profess as Methanetreatment for comparative reasons.
Due to the vast r e m e s of Orinoca Belt extraheavy crude oil and the diffculties in its uansportation we evaluate the feasibility of using Methanetreatment for this purpose due to availability of nafural gas and low cost energy in the vicinities of the production web. For these muons, a conceptual engincuing design and an economic evaluation were conducted for a 100 MBPD module. Fmally. comparisons with conventional technologies were c a n i d OUL
EXPERIMENTAL The urwbeavy crude oil employed in this work came 6um the Hamaca oil field in the
Orinoco Belt and its analysis can be found in Table 1. The percentages of volatile material were determined by the method reported by Ceballo and coworkers [9] using a Hewlet-Packard gas- chromatograph, model 5880. The pcmntage of conversion of the residue >5OOOC was defined as:
('KO of residue XWC+ in crude oil) - (46 of residue 5009c+ in upgraded product) x 100 __-______-_-----________________________---------------------------
('KO of residue XWC+ in crude oil)
The Viscosities of the crude oils wae measured in a Brookfield apparatus. model RVTDV- II. The water concenaations were determined by the Karl F h method according with the ASTM standard test D-1744-83. The composition of the natural gas can be found in Table 1. The Coluadson carbon contents werc measured by the ASTM standard test D-189.
The upgmding reactions were carried out in a 0.11 bamlslday hyhvisbrraldng unit modified to use natural gas. The plant consists of three d o n s : preheating. reaction and separation zone. In the preheating section. the hydrocarbons. water and nahlral gas were mixed and heated near the reaction tempemure ( 3 2 W at the d o n pressure (1600.800 or 200 psi). The d o n zone included a coil and a soaker reactors C O M C C ~ ~ in series with a volume of 0.285 and 4.7 litas. respectively. Both reactors were kept at the sa^ temperam (390 and 4 1 m duting each e-
'Ibe products of the upgrading reactions were Wed by separating the gases from the liquid using a m unit at 150T. The umacted natural gas wasrapmprcssed and -led with a ratio of= to 1 with respect to the purge gas. The 4uids were stripped with nitrogen at 1WC and top ploducts w a t condensed. From the last stream, wata and light hydrocarbons were separated d the Lam compounds were mixal with the bottoms of the stripped unit to obtain the rcconstitUted aude oil Mass balances were taken every 10-12 hours without formation of coke in the soaka reactor.
The conceplud engineering designs for Visbrealdng, Methaneacatmnt and H y h v i s b m b g processes as well as for mole conventional mnhods for h9 oil WnSpOrtation such as Heating and Dilution, were carried out. Technical bases for all altmacives were the same (Crude properties. flowme. pipelenghk etc.). Invesrment costs
datahe and rccent vendor quotations. Operating costs w a e eaimatd from INTEvEp's recent experiences in similarprojects and from fecdback from our Operating affiliates.
(orda ofmagninde, 25% contingency and grass mot) were e.5timataJ using m w s own
RESULTS AND DISCUSSION
"be reactiOa ofextraheavy Qude oil (MI = 8.69 with l600psiof natural gar at41OT with a concenwtioa of wata of 10% w/w and a residence tim of 30 ain (Table 2 exp. I), led to an haease h the API gtavity h 8.e to 12* in the upgraded product, a decnare in two ordcfsof~tudcintheviscosity(from500.ooOto 1700cPat?@C)andamvasioaof the e residue of358. with respect to the origihal crude. Duringa lodays run, mas balanc*, WQC taken may 12 hours without formation of coke in the soaker reactor after the experiment Similar d u e of viscoSity (1990 cP) was obtained [7] using a 300 ml-batch WIIX undcr
1600 @ of mcrbanc at 3 8 K for 4 h. Higher percentage of c011vcrsioa (60%) waq found for
974

the later rn lhaa that in continuous flow experiment and can be attributed to the longer residencetime.
An w i n the ~ n c c t i m e to 45 toin (Table 1. exp. 2) did not further elevate the API gravity of the upgraded nconstitucad crude oil . However. the viscosity of the pToduct decreased (1 100 cP) and the percentage of conversion of the residue i n d (49%) due to the longer residence time. On the other hand, the amount of Conradson carbon in the reconstituted crude oil increased from 16.5 to 18% as the residence tLm was raised fmm 30 to 45 min. These results indicate that coke was been produced during the crude oil upgrading and is Consistent with other thenually upgrading p e s s e s as for example ViSbrcaLing and Hydmvisbmking (14111.
An expaiment (Table 1, exp. 3) carried out with 20 % whv water concentration led to an upgraded product with slightly better properties (1590 cP,. 36% conversion of the nsidue and 16.2% of Conradson carbon) in comparison with those obtaimd with 10% wam content (exp. 1). The effect of water as additive for vkbmhng type of d o n is very well known in the literature [ 121. Its beneficial Proparies an amibuted to the reduction of coke formation and to its hydrogen donor capabilities p.121.
The effect of the pressure of n a n d gas on the viscosity of the upgraded reconstituted crude oilscan be seen in Fig. 1. The reactions w m carried out at 39oec with 30 tnin residence timc and the results are the average of 10 h mass balaac*r for up to 30 h. In general. it can be seen that theviscosilyof the upgraded product in the tempmtmrange 3Gm dccnasod as theoaturalgaspresSUrc i n d These R S u l t s i n d i c a t e t h c i n V ~ O f natural gas during the mdc oil upgrading reaction. Possible explanations can be atuibuwd to the need of high pressure in order to carry out the methane activation reactions as shown in cq. 3 and 4.
From these nsults, it can be concluded that the process of upgrading exuahcavy crude oil using natural gas as a source of hydmgen looks as a technically feasible option for the industriabation of these abundant raw materials.
In order to assess the Methanenearment process as an up-g technology to be used with wnsponaa ‘on purposes. an economic evaluation was conducted. Comparisons with similarprocesscs as VisbreaLing and HydrovisbnaLing were madc as well as with conventional technologies as Heating and Dilution. The basis for the ecowmic evaluations wae as follows:
100.ooO bamls pa day plant located at the orinof0 Oil Belt equipped with a 300 Km oil pipe line from the Orinoco reservoir to the Caribbean Sea
me opaation costs (for the k t uimester 1993 Veneplelan based) included: labor, main- in¶uana and utilities An evdpation puiod of 17 years and an intara rate of 10% wae considacd
In-ls and Opaating cost were estimated on 1993 tmsii A crrdit was added U) the technologies with crude oil upgrading (Viibreaking,
Methancaeatmnt and Hydrovisbreaking). Cash tlows for the evaluation period wcrc obtained considaing the invcsnncnts and
annual balanc*l bawcen operating costs and credits for crude oil upgrading when applicable. Net present value analysis was performed m arder to compare the diffnent altcnlatives.
The mults of the study arc shown in Table 3. It can be seen that the conventional aspon ethnologies (Heating and Dilution) present the lowest invcsmmts (145 and 143 MMUSS. Itspcctively) and opetation costs (1 1 and 10 MMUSf) that those dcdatcd for Visbrrakin& Methanemat and Hydmvisbmbg upgrading praxssrr lhereforr thc pnsmt net cost for the first two technologies (216 and 212 MMUSS) are Iowa than those f o u d for the lam three ( 2 4 25s and 330 MMUSS).
Oa the otha hand the VisbrraLing tcchnoiogy offcn the lowest hvcs?mcnI, opaation cost and p n m t net cost among the crude oil up@g processg However. the present net cost for the Methane-nt is relatively close (255 MMUSS) to that calculapd for the ViSbreaLing (246 MMUSO). due to the higher credits (hi- amvasias and lower viscositia of the products) of the forma in cornpariwn with the Later.
In conclusion, conventional wnsport technologies of Heating and Dilution have economical advantages over Visbrcalring, Methanemmmt and HydmisbrraLing upgrading processes used for wnsponation pupoxs. &twcen the l a m thne technologis visbtmking is d y slightly Wac economically amactive than the m*mproc*u
975
REFERENCES
1) Pitchai. R and mer. K. C a d Rev.-Sci. Eng., 2& 13 (1986) and refmnces thmh 2) Lee, J. S. and Oyama S. T. Catal. Rev.-Sci. Eng., 3Q., 249 (1988) and references thcrein.
Eng., 2 163 (1990) and references therein. 4) Preprints of the Symposium on M e w e and Alkane convasion Chemis@y, Division of Petroleum chemistry, 207th National Meeting. Amrican QKmical Sociery. San Diego. CA, March 13-18.1994. 5) a) Sundaram, M. U.S. Patent 4.687.570. (1987). b) Sundaram. M and Stcinberg, M ACS Fuel Chem Reprints, ZS. 77 (1986). 6) Egiebor, N. 0. a nd Gray, M. R Fuel, 6% 1276 (1990). 7) Ovalles C. Hamana. A.. Roja I. Bolivar, R. Proaxdm . gs of 1993 Eastern Oil Shale Symposium and submited to Fuel (1994). 8) Ovalles. C., Hamana, A.. Rajas, I, Bolivar. R., US F’atent 5269,909. (1993) 9) Ceballo, C D.. BeIler, A.. Arangunn. S. and Herrera. M. Rev. Tec. JNTEVEP, 2, 81 (1987). 1O)Del Biaaco, A, Panariti. Prandini. B., Beltramh P. L. Ciuniti. P.. Fuel, 22 81 (1993).
on Heavy Oil and Residue Upgrading and Utilization. Fushum. Lieanin& China, May 5-8. 1992. 12) Me, M G.. Ferguson. D. F. Oil Gas J., 1954. March 22nd. 166.
3) AmenOmi~a, Y.. Bins V., GolCdAIl~~ski M, Gal~szka. J. and Sang-, A. &tal. Rev.-Sci
11) Paies. J. P.. des Courieres. TIL. Espei i , M.. Roccdm . gs of Intanational symposium
976

Table 1. Analysis of theHamacaaude Oil andComposicm of the NanwlGas used for the upgrading Reactions
Asphaltenes (% wlw) 12.5
sulfur (%w/w) 3.71 Nitrogen (ppm) 7500
Nickel (ppm) 102 vanadium (ppm) 450 % of residue S O O W 57% Viscosity at u)pc (cP) 500,OOO
carboadioxide 11.2 Ethane 8.8 Ropane 3.65 Butanes 0.77 &ntancs+ 0.12 Nitrogen 0.02 Hydrogen 0.04
Table 2. Effects of the Residence Tune and the Percentage of Warn on the pr0pCnic.s of the Upgraded Reconstituted crude Oilsa
~ ~ ~~~
Enp. Residence %H20 O A P I ViscogitY %Conv. Comatison tim(min)b (w/w)c at3OT(cPP Rcsiduec carbon
(* 1%) (% WIW)
oude 8.6 m.Oo0 13.4 1 30 10 12.0 1700 35 16.5 2 45 10 12.0 1100 49 18.0 3 30 20 11.8 1590 36 16.2
m e reactions w m canid out in 0.1 1 bamVday conMwus flow plant at 41oOC. 1600 psi of aatural gas of final prrssrm. ll~e rcsultsan the average of 12 h mass balaoces for up to 36 h. b Residence time in minutes for the coil and soaker mctors. c Pacent of warn by weight in the
Pacentage of volatile mataid in the m d e oil 54% whv. feedstock. dvalues f 100 CP. ~Paceotage of aMvQsion m is defimd in the experimental Suxlon.
Table 3. Invesrmcnts and Net &sent Value (in million of US$) for the Technologies Used in the Transportatton of Extraheavy crude 0i.P
cam Visbreakingb Mcthanetreaunentb Hyd~~isbrraLin~ Healing Diluent Total ~n-sites 180 244 348 Total &-si- 127 172 247 oilpipcline 88 86 87 145 143 sy- Total Investment (In 3 YCaTs) 395 502 582 14F 143C Annualopaadon costs (21) (23) (40) (11) (10) -uP*g M O 46 64 97 NetRescntValue (246) (255) (330) (216) (212)
the bgsi of the study see text Calculus bascd on 1993 USS over a 17 yean life of ttw plant. bA topping step was added p i o u s to the upgrading KCXUX. 'Total Investment in a two yean paioa
977
R'

v i i i b
25 30 35 40 45 50 55 60 65
Temp. Crude Oil (‘c)
Ag. 1. Eff- of the Ressure of Natural Gas on the V i t y of the Upgraded Reconstituted Cmde Oils
978

t
I .
LIGHT OLEFlN PRODUCTION, SKELETAL OLEFlN lSOMERlZATlON AND ETHERlFlCATlON FOR OXYGENATED FUEL PRODUCTlON
Anne M. Gaffney ARCO Chemical Company 3801 West Chester Pike
Newtown Square, PA 19073 (215) 359-2271
Keywords: olefin production; olefin isomerization; SUPERFLEXsM; P, H-ZSM-5; catalytic cracking; MTBE
ARCOs newly developed SUP€RFLE#M process offers opportunities to product high yields of light olefins from a variety of readily available refinery and petrochemical feedstocks. The process is unique in that it employs a catalytic reactor system which is lower in capital and operating costs than conventional steam cracking reactors. The SUPERFLEX process is also more selective for production of propylene and butylenes (including isobutylene) than conventional steam cracking operations. The C4 product stream from the SUPERFLEXprocess contains about 20 to 30 percent isobutylene. The SUPERFLEX C4 product is, therefore, an excellent feedstock for producing MTBE via reaction of the contained isobutylene with methanol. After MTBE production, the isobutylene depleted C4 stream may be recycled to the SUPERFLEX process to produce additional isobutylene and propylene. This paper will focus on the chemistry and mechanism of catalytic cracking and skeletal olefin isomerization. In addition, there will be some discussion on catalyst activation, life and characterization.
Ught Oleffn Soumes There are several commercial routes to light olefins. Traditional routes are steam cracking( I), fluid catalytic cracking(Z), dehydrogenation(3) and metathesis(4). Recen I ARCO Chemical company has developed a new technology known as SUPERFLEAh which catalytically cracks higher paraffins and olefins in high selectivity to propylene and isobutylene(5). Unlike steam cracking, the propylene to ethylene ratio is high. In addition the butylenes and pentenes are isomerized to their thermodynamic distribution. This technology offers an alfernafe, low capital route to light olefins. It may be readily integrated into an olefins plant or refinery. Its scale-up is simplified by its analogy to the FCC process. Analogies in operating conditions are given in Table 1.
Super lkdM Tech o The SUPERFLE$ehnology has been demonstrated with olefin plant and refinery streams and with pure components such as isobutylene, butene-1, isopentane, n- pentane, cyclopentane and octane. An integrated pilot unit designed to simulate commercial operation has operated for two years. During this operation catalyst life was confirmed under simulated commercial operation, including recycle. In addition the catalyst was produced on commercial scale. Catalytic activity is sufficient to approach olefin equilibrium in 5 to 15 seconds. Selectivity to aromatics and paraffins is minimal. Catalyst attrition is low with less than 15 wt % loss on the 5 to 15 hour portion of the ASTM 0-32.02 TG 06 Jet Attrition Test. Catalyst hydrothermal stability is good with less than 7 % activity loss per day. The active catalyst component is a modified ZSM-A It is formulated into a fluidizable catalyst by combining it with a matrix of silica and kaolin and spray drying. The catalyst working environment is given in figure 1.
Catalyst Evaluation Numerous zeolites were synthesized, characterized and evaluated in catalytic cracking reactions to light olefins. H-ZSM-5 was found to be most active and selective. Others of noteworthy.activity are listed in Table I/. The WAl ratio of H-ZSM-5 was varied from 20 to 100. A ratio of approximately 40 was found to be optimal. An inexpensive, non- template H-ZSM-5 performed similar to that of a template one.
Catalyst evaluations were run with 60 to 100 mesh fixed beds consisting of active catalyst diluted in alpha alumina to adjust conversion to reasonable levels. The beds were held in quartz reactors of 6.5 mm bd. containing a 2 mm 0.d. thermowell. Bed lengths were typically 4 cm and bed volumes 1.4 ml. Results were obtained at 550 to 600 OC and 1 atm total pressure. The WHSVs are with respect to the active Component of the bed (not including diluent alumina).
979
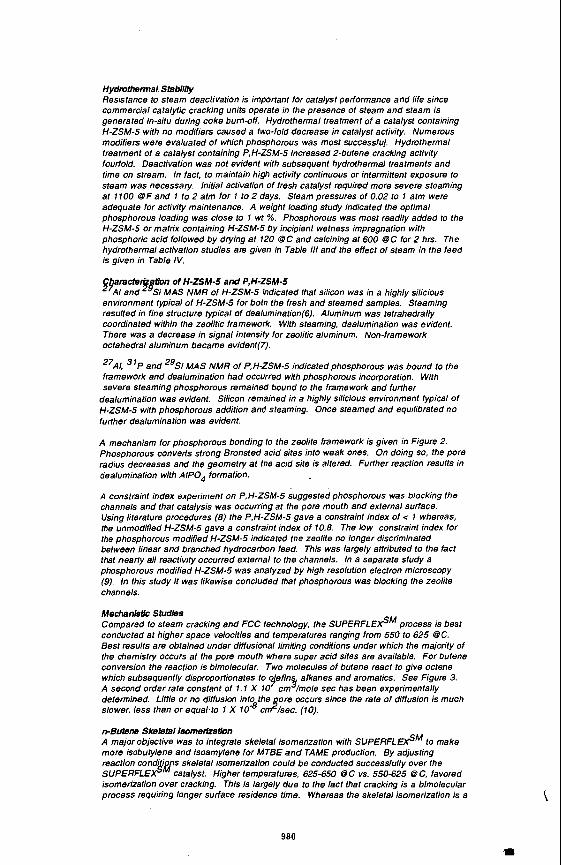
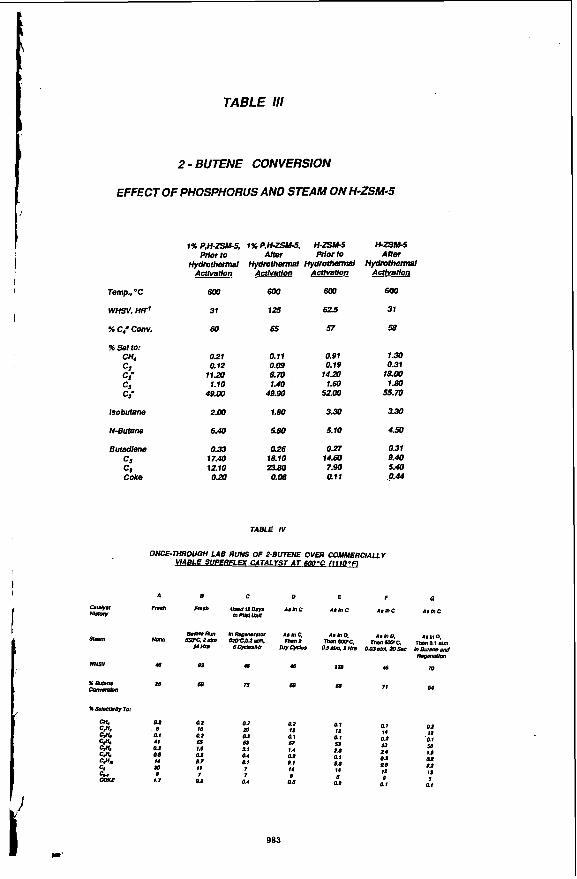
Hydmthennal. Stability Resistance to steam deactivation is important for catalyst performance and life since commercial catalyiic cracking units operate in the presence of steam and steam is generated in-situ during coke bum-off. Hydrothermal treatment of a catalyst containing H-ZSM-5 with no modifiers caused a two-fold decrease in catalyst activity. Numerous modifiers were evaluated of which phosphorous was most successfu!. Hydrothermal treatment of a catalyst containing P, H-ZSM-5 increased ,?-butene cracking activity fourfold. Deactivation was not evident with subsequent hydrothermal treatments and time on stream. In fact, to maintain high activity continuous or intermittent exposure to steam was necessary. Initial activation of fresh catalyst required more severe steaming at 1100 O F and 1 to 2 atm for 1 to 2 days. Steam pressures of 0.02 to 1 atm were adequate for activity maintenance. A weight loading study indicated the optimal phosphorous loading was close to 1 wt %. Phosphorous was most readi/y added to the H-ZSM-5 or matrix containing H-ZSM-5 by incipient wetness impregnation with phosphoric acid followed by drying at 120 @C and calcining at 600 OC for 2 hrs. The hydrothermal activation studies are given in Table 111 and the effect of steam in the feed is given in Table lV.
"A/ and"& MAS NMR of H-ZSM-5 indicated lhat silicon was in a highly silicious environment typical of H-ZSM-5 for both the fresh and steamed samples. Steaming resulted in fine structure fypical of dealumination(6). Aluminum was tetrahedrally coordinated within the zeolitic framework. With steaming, dealumination was evident. There was a decrease in signal intensity for zeolitic aluminum. Non-framework octahedral aluminum became evident(7).
"AI, 31P and "Si MAS NMR of P,H-ZSM-5 indicated phosphorous was bound to the framework and dealumination had occurred with phosphorous incorporation. With severe steaming phosphorous remained bound to the framework and further
am& tion of H-ZSM-5 and P,H-ZSM-5
dealurnination was evident. Silicon remained in a highly silicious environment typical of H-ZSM-5 with phosphorous addition and steaming. Once steamed and equilibrated no further dealumination was evident.
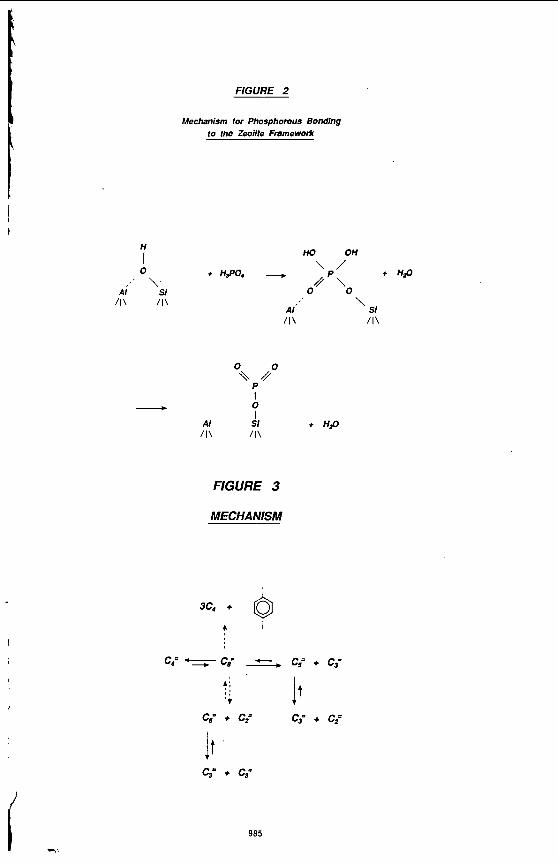
A mechanism for phosphorous bonding to the zeolite framework is given in Figure 2. Phosphorous converts strong Wronsted acid sites into weak ones. On doing so. the pore radius decreases and the geometry at the acid site is altered. Further reaction results in dealumination with AlP04 formation.
A constraint index experiment on P, H-ZSM-5 suggested phosphorous was blocking the channels and that catalysis was occurring at the pore mouth and external surface. Using literature procedures (8) the P,H-ZSM-5 gave a constraint index of c 1 whereas, the unmodified H-ZSM-5 gave a constraint index of 10.8. The low constraint index for the phosphorous modified H-ZSM-5 indicated the zeolite no longer discriminated between linear and branched hydrocarbon feed. This was largely attributed to the fact that nearly all reactivity occurred external to the channels. In a separate study a phosphorous modified H-ZSM-5 was analyzed by high resolution electron microscopy (9). In this study it was likewise concluded that phosphorous was blocking the zeolite channels.
Mechanistic Studies Compared to steam cracking and FCC technology, the SUPERFLE#M process is best conducted at higher space velocities and temperatures ranging from 550 to 625 8 C . West results are obtained under diffusional limiting conditions under which the majority of the chemistry occurs at the pore mouth where super acid sites are available. For butene conversion the reaction is bimolecular. Two molecules of butene react to give octene which subsequently disproportionates to efin alkanes and aromatics. See Figure 3. A second order rate constant of 1.1 X 10 cm /mole sec has been experimentally determined. Liftle or no diffusion into the ore occurs since the rate of diffusion is much slower, less than or equal-to 1 X
+Butene Skeletal Isomeri;rat&n A major objective was to 'integrate skeletal isomerization with SUPERFL€flM to make more isobutylene and isoamylene for MTWE and TAME production. By adjusting reaction condi I SUPERFLE isomerization over cracking. This is largely due to the fact that cracking is a bimolecular process requiring longer surface residence time. Whereas the skeletal isomerization is a
% ' 3 cg/sec. (10).
s skeletal isomerization could be conducted successfully over the catalyst. Higher temperatures, 625-650 8 C vs. 550-625 8 C, favored $7
980

I
uni-molecular process. By a similar argument, increased pressure favored cracking. Due to the fact that steam generates more Bronsted acid sites, under these conditions cracking was favored. Whereas, with no steam, Lewls acid sites predominated and skeletal isomerization was favored. /so-olefin selectivities increased with gas velocity due to increased mass transfer rates.
The SUPERFL€#M catalyst ran in a pilot fluid bed unit and gave 15% isobutylene yield under optimal isomerization conditions while meeting productivity, life, attrition and cost targets. Results from the lab and pilot unit are given in Table V. In addition, a catalyst Consisting of Mg-APSO-31 was found to b effective for skeletal isomerization (1 1). lt was more selective than the S U P € R F L d M catalyst due to lower acidity yet was lower in activity and more expensive. See Table V for results.
Etlmtitbbion A process scheme for converting the iso-olefins produced from an isomerization unit to ethers was proposed and patented (12). The process scheme could potentially utilize the approximately 350,000 BBUday of C5= olefins produced at U.S. refineries. The combined mole fraction of 2-methyl-2-butene and 2-methyl-1 -butene at equilibrium exceeds 0.80 at 300 OF. These olefins may be converted to TAA and/or TAME.
Conclusions A new technology for producing light olefins in high yields has been developed which uses a phosphorous modified H-ZSM-5. The catalyst has been extensively evaluated in a pilot unit and found to withstand hydrothermal and attrition testing. By modifying the reaction conditions skeletal olefin isomerization may be conducted with the same catalyst. Finally, an iso-olefin etherification step may be carried out for oxygenated fuel production.
Literatun, Cited (1)Hydrocarbon Processing, Special Report: 1987 Petrochemical Handbook, November
(2)Occelli. M.L., "Fluid Catalytic Cracking, " ACS Symposium Series 375, Division of
(3)De Witt 1990 Petrochem. Rev., "Catalytic Dehydrogenation Performance of the Catofin
(4)Bailey. G.C., Catalysis Reviews 9 (1). 37-60 (1969). (5)Leyshon, D. W., and Cozzone, G. E., U.S. Patent 5,043,522. (6)Fyfe, C.A., "Solid State NMR for Chemists,' pp. 337-361, C.EC. Press, P.O. Box 1720.
(7)Samoson, A. Lippmaa, E., Engelhardt, G., Lohse. U. Jerschkewitz. H.G., Chem. Phys.
(8)Frillette. V.J., Haag, W.O., and Lago, R.M., J. Catal. E 218 (1981). (9)Alfredsson, V., Terasaki, O., and Bovin, J.O.. "Zeolites for the Nineties,' Eth
(lO)Voogd, P.. and Van Bekkum, H., "Zeolites as Catalysts, Sorbents and Detergent
( 1 1)Gaffney. A.M.. and Jones, C.A.. U.S. Patent 5,107,050. (12)Gaffney. A.M., and Piel, W.J., U.S. Patent 5,136,108.
1987.
Petroleum Chemistry, New Orleans, LA., 1987.
Process,' Houston, TX, 1990.
Guelph, Ontario, Canada, N1H 629, 1983.
Lett. m, 589 (1987). .
lnternational Zeolite Conference, Amsterdam, p. 227, July 10-14, 1989.
Builders, " pp. 519-531, Elsevier Science Publishers 8. V., Amsterdam, The Netherlands, 1989.
981
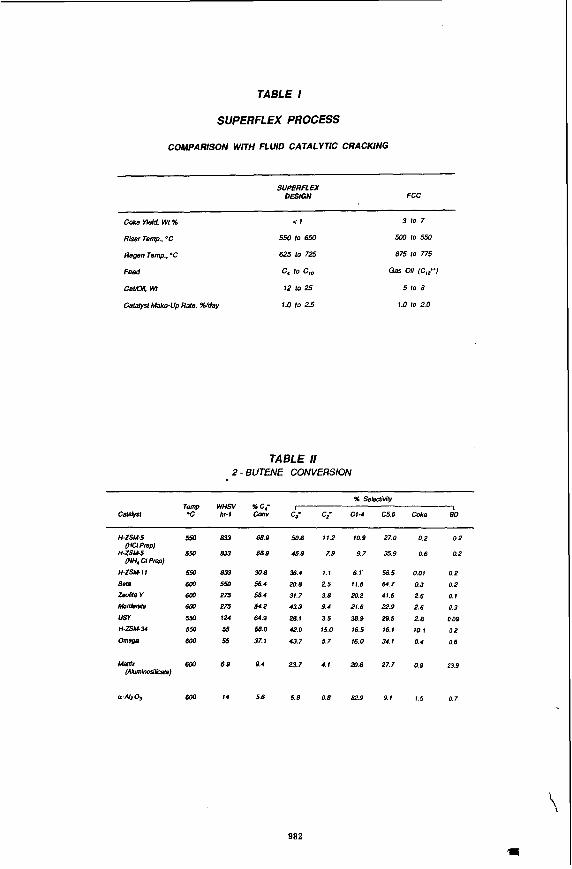
TABLE I
SUPERFLEX PROCESS
COMPARISON WITH FLUID CATALYTIC CRACKING
SUFERU EX DESIGN FCC
Coke yield. Wt % < 1
R h Temp., OC
Regen Temp., "C
550 IO 653
625 10 725
Feed c< to c14
CabtN, W 12 lo 25
Calalysl Make-up Rale. %/day 1.0 to 2.5
3 10 7
Mo to 550
675 lo 775
Gas Oil &++)
5 to 8
1.0 IO 2.0
TABLE II 2 - BUT€N€ CONV€RS/ON
% SeMinly Temp WHSV %C; I 1
Cararyrf 'C hr-1 CMV C; C; C I J C5.6 Coke 80
5 5 0 8 3 3
5 5 0 8 1 3
5 5 0 8 3 3 6 L m m 6Lm 275
bn, 275
55Ll 124
550 55
m a 5 5
6Lm 6.9
Mu) 14
68.9
bs. 9
308 56.4
58.4
542 643 58. 0
37.1
9.4
5.6
50.6
15.9
3s. 4
20.8
31.7
433 28.1
42 0
43 7
23.7
5. B
11.2
7.9
1.1
2.5
3.8
9.4
3.5
15.0
5.7
4.1
0.8
10.9
9.7
6. I'
11.8
20.2
21.6
38.9
16.5
16.0
20.6
82 9
27.0 0.2 0 2
359 0.6 0.2
56.5 0.01 02
64.7 0.3 0.2
41.6 2.6 0.1
229 2.6 0.3 295 2.8 0.09
16.1 10.1 0.2
34.1 0.4 0 6
27.7 0.9 23.9
9. I 1.5 0 7
982
I
f
TABLE Ill
2 - BUTENE CONVERSION
EFFECT OF PHOSPHORUS AND STEAM ON H-ZSM-5
Temp.. "C
WHSV, HR'
% C4- Conv.
% sei to: CH4 c2 c2- C¶ c¶=
lsobutane
N-Butane
Buradlena c5 c, Coke
0.21 0.11 0.91 1.30
11.20 8. m 14.Z 18.00 1.10 1.40 1.60 1.80
4800 49.90 5200 s . m 2.00 1.80 3.30 3.30
6.40 SBO 5.10 4.50
0.33 0.26 0.27 om 17.40 18.10 14.60 9.40 1210 ps(l 7.90 5.40 o a 0.06 air .O.M
0.12 0.09 0.19 0.31
TABLE IV
ONCE-THROUGH LAB RUNS OF 2-BUTENE OVER COMMERCLALLY
A
Fn.h
Nmr,
40
2a
01 d
Q1 41 OI QS I4 lo d
1.7
QI QI 0.2 18 m I t 12 I4 I t
Q1 02 'Ql 51 63 66 25 2 4 IS QI Qa QI 0.8 0.8 dP I4 I2 I t
0 5 QZ QI Q I
QI Q2 QZ
01 01 Q I m 01 57 1.0 ti 1.4 01 Q4 Q1
11 7 I 7 dl n. f
11 7
Q2 Ql QI 7 5 e
983

TABLE V
H YIELD % H SELECTlYrry% n-C,- CONVERSION %
TEMPERANRE, OC
WHSV, hr-'
LfFE
FLUIDITY
ATTRITION RESISTANCE
n-C,' SKELETAL ISOMERIZATION
SUPERFLEX Calafvsl Ma-APSO-31
LAB - LAB - PfLOT - 15 19 30 25 47 80 60 41 38
650 625 575
250 296 46
GOOD - TO BE DETERMINED
GOOD
57%
NGURE 1
CATALYST WORKING ENVIRONMENT
I: m r Reoenerator
Temp. 'C 550-650 550-650 550-650 Residenm Time 2 to 6 secs 4 m 5 min 4 to 6 min % steam Negl. 25 lo 50 5 to 20
ACTIVITY TOO LOW
PROBABLY GOOD
I
d l
984
.e
H I
FIGURE 2
Mechanism for Phosphorous Bonding to the Zeolite Framework
HO OH
/I\ /I\
I - 0 I
AI SI /I\ /I\
FIGURE 3
MECHANISM
3c4 + Q b I
AI, /I\
e,= '--c e,. a c,. + e,-
985
' SI /I\
SHAPE-SELECTIVE ISOPROPYLATION OF NAPHTHALENE OVER DEALUMINATED MORDENITES
M e w D. and Chunshan Song
Department of Materials Science and Engineering Fuel Science Program, 209 Academic Projects Building
Pennsylvania State University, University Park, PA 16802
Keywords: naphthalene, shape-selective alkylation, zeolite
INTRODUCTION In effort to enhance the economic feasibility of coal liquefaction we are continuing the
invdgation of non-fuel applications for coal-derived liquids (CDL). Conversion of a small fraction of the naphthalene can significantly increase value, while the majority of the CDL is used as transportation &el. This study is aimed at the regioselective alkylation of naphthalene. Of particular interest is 2,6-diisopropylnaphthalene (2,6-DIPN) that, when oxidized to the corresponding diacid, can be polymerized to produce high-value engineering plastics and liquid crystalline polymers. ' Mordenites having high selectiviy for 2,6-DIPN production have been reported in a patent by Fellmann et al. at Catalytica, Inc. However, iimdamentals of the alkylation process are poorly understood.
Our research is directed at optimizing .2,6-DIPN selectivity through control of reaction parameters. Eff's of temperature, identity of the alkylating agent, naphthalene to catalyst ratio, and addition of water are discussed. An understanding of catalyst physical and chemical properties is pertinent to the design of shape-selective catalysts. Beyond chemical analysis, X-ray powder diffraction has been used to measure crystallinity, cell constants, and crystallite size.
EXPERIMENTAL Materials. All chemicals were used as supplied. Naphthalene (99 %) and isopropyl alcohol
(99.5+ %) were obtained from Aldrich Chemical, Inc. 2.6-Diisopropylnaphthalene (GR) was obtained from TCI, Ltd. Propylene (99.5 % minimum,p.'pnerprify) was obtained from Matheson, Inc. and delivered to the reactor in vapor form.
Catalysts. Sodium and hydrogen mordenites were supplied as 9-10 pm average particle size powders (The PQ Corporation, Inc.). Properties of these materials are listed in Table 1. The H-form of NaM14 was obtained by sodium-exchange with 1 M NH,CI, followed by wash, dry and calcine procedures. Dealumination ofHM14 was accomplished by stirring in aqueous hydrochloric or nitric acid at reflux temperature. Time and acid concentration were varied to control the extent of aluminum removal as summarized in Table 2. Following the acid treatment, the catalysts were washed extensively with hot deionized water, dried, and calcined (5 .5 h at 465 "C unless otherwise specified). Samples were dissolved using lithium metaborate fkion and analyzed for silicon, aluminum and sodium by ICP-AES.
Catalyst Evaluation. A 30 cm3, stainless-steel tubing bomb, batch reactor was used for all experiments. The standard reactor charge was 0.10 g catalyst, 1.0 g (7.8 mmol) naphthalene, and 0.66 g (15.6 mmol) propylene. For runs with added deionized water, the catalyst amount was increased to 0.15 g. The reactor was mounted on a holder and immersed in a fluidized sand-bath heater. During the run, the reactor was agitated at 3.3 cps. Test conditions were typically a 2 h run at 200 "C. At the end ofthe test, the reaction was quenched in cold water. The reaction products were collected in acetone solution and analyzed by GC-MS and GC-FID for qualitative and quantitative analyses, respectively. The GC column was 30 m x 0.25 mm DB-17 (J&W Scientific).
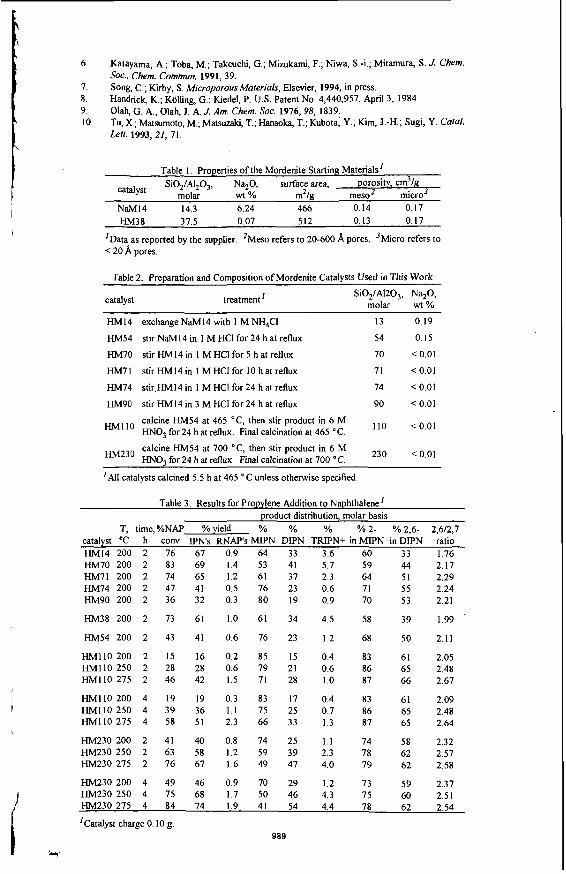
RESULTS AND DISCUSSION Catalysis Test Results. Activity, selectivity and regioselectivity are compared in Table 3 for
all ofthe catalysts in 2 h mns at 200 "C. Hh41 IO and HM230 were tun both 2 and 4 h, at 200, 250 and 275 " C . The first five lines of Table 3 detail the results for dealumination of m 1 4 , while the other tests refer t o HM38, and HM54 and its dealumination. Isopropyl-substituted naphthalenes (IPN's) constituted 95-99+ % of the products. The major side products were alkyl-substituted naphthalenes @NAP'S) other than solely isopropyl-substituted naphthalenes. Disproportionation of IPN's and reaction between naphthalene and propylene dimer (or oligomer) are likely the main sources for RNAP's. Mass balances of less 100 % were primarily due to material loss as carbonaceous deposits on the catalysts, and to a lesser extent, uncharacterized minor products.
Comparing the 2 W200 "C data, naphthalene conversion increases slightly or remains unchanged with mild dealumination, but decreases markedly at higher levels of dealumination. HM230 shows higher activity than what is predicted by the trend observed for HM'IO-HMl IO, but this may be due to structural changes as discussed below. Similar volcano lots of activity vs. Si04AI,03 ratio have been reported for reactions of aromatics over mordenites.f4 One explanation for this behavior involves the number and nature of acid sites. Acid site density decreases, and acid
986
,1

strength increases, with aluminum removal leading to an increase in activity. Ultimately, activity is SUPPrWed by gross depletion ofacid sites at high levels of dealumination. Other justifications focus on factors that effect diffusion: changes in mesopore volume, changes in channel structure and dimensions (or channel collapse at high levels of dealumination), and differing rates of fouling. Regardless, the height and position ofthe activity maximum is dependent upon the reactant, reaction conditions and catalyst prepa~ation.~
Dealumination increases the regioselectivity for P-alkylation (% P-alkylation): % 2-isomer in the monoisopropyl (MIPN) product and % 2,6-isomer in the diisopropyl @IPN) product both increase. Third (TRIPN) and fourth (TEIPN) isopropylations are also generally diminished, substantially in some cases. Changes in the polyalkylated product with dealumination are nicely illustrated in Figure ](a)-(c). The larger unlabeled peaks on either side of 2.7- and 2.6-DIPN are isomeric DIPN's. There are ten possible isomers. Fellmann et al. have observed similar changes in DIPN and TRIPN+ distributions with dealumination.2 The main DIPN products are the 2,6- and 2,7- isomers. Non-selective catalysts produce nearly equal amounts of these isomers.2v5 As observed here and el~ewhere,~.~,' the 2,6/2,7 ratio greatly exceeds unity for shape-selective catalysts. It has been suggested by Song et al. that 2,6-DIPN is slightly smaller and may diffuse more rapidly than 2,7- DIPN.' Interestingly, the 2,6/2,7 ratio reaches a maximum at SiO,/Al,O, ca. 71 for 200 " C runs, even though %P-alkylation continues to increase at higher dealumination levels.
Alkylation regioselectivity depends on the nature of the catalyst, catalyst charge, temperature, time and water content. Typically, % 2- in MIF'N does not exceed 90% unless the catalyst and reaction conditions are optimized.*"'* For naphthalene substitution by isopropyl bromide over mordenite at 200 "C, Moreau et al. report nearly 100 % selectivity for the 2-isomer in the MIF'N product.' They used a naphthalendcatalyst (N/C) mass ratio of 0.64. We tested HM38 with N/C = 0.62 at 200 "C, and compared the results with our standard run conditions (N/C = 10) at comparable conversion. As shown in Table 4, decreasing N/C dramatically increases %P-alkylation. However, there is a concurrent 11 % decrease in the 2,6/2,7 ratio.
At 25 "C, the equilibrium M P N isomer distribution is 98.5 % 2-isomer.' Substitution at the more active a-positions of naphthalene leads to the kinetic product. Fellmann et al. obtained the following equilibrium product distriubtion over amorphous SiO,-AI,O, at 275 "C: 37 % 2,6- in DIPN with 2,6/2,7 of 1 .O. Our results for N/C = 0.62 follow the trends discussed by Fellmann et al. with N/C = 90. Conversion increases, while both the % 2,6- in DIPN and the 2,6/2,7 ratio decrease over time. These changes are apparently equilibrium driven. Whereas Fellmann et al. do not comment on changes in the MIPN isomer ratio, we observe an increase in the relative amount of the 2-isomer with time. This may be due to either a higher rate for 1-MIPN - 2-MPN isomerization than for alkylation of 2-MIPN, or transalkylation between 2,6-DIPN and naphthalene.
With N/C = IO, there simply are not enough appropriate acid sites available for rapid isomerization ofthe kinetic 1-MIF'N product. The %2- in MIPN is low, and consecutive alkylation does not give a DIPN product distribution enriched in the 2,6-isomer. From Table 3 (N/C = IO), conversion increases with time over HMI 10 and HM230, while %P-alkylation and the 2,6/2,7 ratio remain approximately constant with time. Although not shown here, the same trends were observed for HM38 with N/C = 10.
Increasing the reaction temperature to 250 or 275 ' C (Table 3) causes a substantial increase in conversion. The 2,6/2,7 ratio increases markedly, and %P-alkylation is mildly increased. It may be concluded that 2,6-DIPN is thermodynamically more stable, and 2,7-DIPN is the kinetic product.
In separate experiments, we examined the fate of 2,6-DIPN over three mordenites in 2 h, 200 " C reactions. Table 5 shows that the principle reaction is alkylation. At low propylene pressure, isomerization does occur overHM14 and HM38, principally to DIPN isomers other than 2,7-DIPN. Higher propylene pressures retard isomerization-an effect also demonstrated in propylene addition
remains high, while other DIPN isomers react to form higher alkylates. Over aluminum-deficient mordenites, 2,6-DIPN is apparently less reactive toward alkylation than other DIPN isomers. This is not the case for HM14 and HM38 where 10-30 % of 2,6-DIPN is converted, mostly to higher alkylates. Structural analysis of $e TRIF'N isomeric products, from isotopically labeled DIPN if necessary, would aid the interpretation of these results.
In related work on the isopropylation of naphthalene over HM38 and other zeolites, we have obsewed higher 0-alkylation selectivities and higher 2,6/2,7 ratios for isopropyl alcohol, rather than propylene addition7 Byproduct water is inherent when alcohols are used. To test the hypothesis that the presence of water enhances regioselectivity, a series of experiments were performed where the amount ofcatalyst, naphthalene, and propylene in the reactor were held constant. Water was added
I
I
1,
f
I
to biphenyl." Dealuminated mordenite, HM74, gives almost no isomerization. The % 2.6-DIPN
I I 1
987 i c\
in various amounts. Catalyst mass in the reactor was increased to 0.15 g for these experiments to amplify the changes brought about by water addition. Changes in the polyalkylated product distribution with added water are illustrated in Figure I(d)-(9 and Table 6. A small amount of water poisons the catalyst, but larger amounts bolster activity up to an apparent saturation limit. The maximum in activity is approximately at 160 mg added water-very close to the mass of catalyst in the reactor. A possible explanation is that at low partial pressures, water adsorbs on catalytic acid- sites and impairs adsorption of reactants. Higher partial pressures of water lead to the genesis of new Bransted acid catalytic sites, leading to higher conversion. Ultimately, high moisture levels reduce conversion due to impeded reactant diffusion. This proposition may also explain the increase in p- alkylation selectivity and 2,6/2,7 ratio with added water. Adsorption of water impedes reaction on the non-selective external surface of the catalyst. A higher percentage of the naphthalene molecules react within the shape-selective confines of the mordenite channels. Adsorption of water within the mordenite channels impedes diffusion. More so in the case of the larger a-, u,P-, and a,a- substituted products. The result again is higher % p-alkylation. It is unclear why the 2,6/2,7 ratio drops sharply above 160 mg added water, even though % 0-alkylation does not. However, throughout this work there is a positive correlation between the 2,6/2,7 ratio and conversion. Our preliminary data show that the regioselectivity enhancement resulting from added water is even more pronounced for less shape-selective mordenites.
Catalyst Characterization by XRD. Four of the catalysts have been examined by XRD (Cu K, radiation): HM14, HM74, H M I IO and HM230. Overall, XRD shows that dealumination following calcination at 700 "C causes a patial structure collapse that is not observed for samples calcined at 465 "C. Estimates of mean crystallite dimension were made using the Scherrer equation, assuming Cauchy .profiles. Average results for measurements on the six strongest, well-resolved reflections are reported here. Natural sodalite was used as a standard for instrumental line broadening. Within error of measurement, HM14, HM74 and HMI 10 are of the same crystallite size, 230 f- 20 nm. However, HM230 crystallites are smaller, 140 f I O nm.
Comparison of the area sum for the six peaks allows an estimate of relative crystallinity. HM230 is approximately only two-thirds crystalline material; whereas, the other three samples are of the same relative crystallinity (assumed 100%).
Least-squares regression analyses were used to obtain precision measurements of the cell constants from the diffraction data. It is only possible to compare relative differences between the samples at this time (see Figure 2), since the data have not been zero- nor background-corrected. As summarized by Mishin et al., dealumination of mordenites results in a lattice contraction that is generally anisotropic.' Our data show that changes in the a-dimension are the largest. Decreases in band c are similar, but smaller than for a. HM230 showed the largest magnitude lattice contraction. HM74 and HMI I O show the same overall cell volume decrease. The contraction is isotropic for HM74; whereas, for HMI 10 and HM230, it is not.
CONCLUSIONS We have succeeded in identifying several important parameters that govern selectivity in the
addition of propylene to naphthalene. The naphthalendcatalyst ratio (N/C) has significant impact on the resulting p-alkylation selectivity. For a given N/C, the 2,6/2,7 ratio closely parallels naphthalene conversion. field of 2,6-DIPN was inherently higher for N/C = 0.62, but both % 2,6- in DIPN, and the 2,6/2,7 DIPN isomer ratio decrease over time. Increasing N/C to IO requires shape-selective dealuminated mordenites and reaction temperatures in excess of 200 " C to obtain good 2,6-DIPN yields. Longer reaction times increase conversion and DIPN yield, wihile MIPN and DIPN isomer distributions do not change. The 2,6/2,7 ratio increases with temperature, indicating that 2,6-DIPN is thermodynamically more stable. With N/C = IO, 2,6-DIPN is neither isomerized nor alkylated to any appreciable extent over high-silica mordenites. We have also found that addition of water to the reactor, in amounts up to approximately the mass of catalyst, results in substantial gains in regioselectivity.
ACKNOWLEDGEMENTS: We would like to thank Professor Harold Schobert at the Pennsylvania State University for
his encouragement and support. We would also like to thank the PQ Corporation, Inc. and Vicki Schillinger at PQ for providing the mordenite samples (NaM14 and HM38), and Lany Royer, also of PQ, for providing detailed analytical data for the samples we received.
REFERENCES 1. 2.
3 .
4. 5 .
Song, C.; Schobert, H.H. FuelProc. Tech. 1993, 34, 157. Fellmann, J.D.; Saxton, R.J.; Weatrock, P.R.; Derouane, E.G.; Massioni, P. U.S. Patent No. 5,026,942, June 25, 1991. Mishin, I. V.; Bremer, H.; Wendlandt, K.-P. in "Catalysis On Zeolites," (Kallo, D.; Minachev, Kh. M., Eds.); H. Stillman Publishers, Inc.: Boca Raton, FL, 1988, p 23 1. Seddon, Duncan Appl. Cafal. 1983, 7,327. Moreau, P.; Finiels, A,; Geneste, P. Solofo, J. J. Catal. 1992, 136, 487.
988
6.
7. 8. 9. 10.
Katayama, A,; Toba, M.; Takeuchi, G.; Mizukami, F.; Niwa, S.-i.; Mitamura, S. J. Chem. sot., Chem. Commun. 1991,39. Song, C.; Kirby, S. MicroporousMaterials, Elsevier, 1994, in press. Handrick, K.; Kolling, G.; Kiedel, P. U.S. Patent No. 4,440,957, April 3, 1984. Olah, G. A.; Olah, J . A. J. Am. Chem. Soc. 1976, 98, 1839, Tu, X.; Matsumoto, M.; Matsuzaki, T.; Hanaoka, T.; Kubota, Y.; Kim, J.-H.; Sugi, Y. Catd. Lett. 1993, 21, 71.
,
Table 1. Properties of the Mordenite Starting Materials'
catalyst molar wt % m2/g meso' micro3 NaM14 14.3 6.24 466 0.14 0.17 HM38 37.5 0.07 512 0.13 0.17
'Data as reported by the supplier. 'Meso refers to 20-600 A pores. 'Micro refers to < 20 A pores.
Si02/A120,, Na20, surface area, porosity, cm3/g
Table 2. Preparation and Composition ofMordenite Catalysts Used in This Work
catalyst treatment' Si0,/AIZ03, Na,O, molar wt %
HM14 exchange NaM14 with 1 M NH&I 13 0 19
HM54 stir NaM14 in 1 M HCI for 24 hat reflux 54 0 15
HM70 stir HM14 in 1 M HCI for 5 h at reflux 70 < 0 0 1
HM71 stir HM14 in 1 M HCI for I O h at reflux 71 < O O l
HM74 stir HM14 in 1 M HCI for 24 h at reflux 74 < O O l
HM90 stir HM14 in 3 M HCI for 24 h at reflux 90 <0.01
110 <0.01 HMI calcine HM54 at 465 "C, then stir product in 6 M HNO, for 24 hat reflux. Final calcination at 465 "C.
HM230 calcine HM54 at 700 "C, then stir product in 6 M HNO, for 24 hat reflux. Final calcination at 700 "C. 230 CO.01
'AI1 catalysts calcined 5.5 h at 465 C unless otherwise specified
Table 3. Results for Propylene Addition to Naphthalene' product distribution, molar basis
T, time,%NAP %yield % % % % 2- % 2,6- 2,6/2,7 catalyst "C h conv IPN's RNAP's MIF'N DIPN T m N + in MIPN in DIPN ratio HM14 200 2 76 67 0.9 64 33 3.6 60 33 1.76 HM70 200 2 83 69 1.4 53 41 5.7 59 44 2.17 HM71 200 2 74 65 1.2 61 37 2.3 64 51 2.29 HM74 200 2 47 41 0.5 76 23 0.6 71 55 2.24 HM90 200 2 36 32 0.3 80 19 0.9 70 53 2.21
HM38 200 2 73 61 1.0 61 34 4.5 58 39 1.99
HM54 200 2 43 41 0.6 76 23 1.2 68 50 2.11
HMllO 200 2 15 16 0.2 85 15 0.4 83 61 2.05 H M l l O 250 2 28 28 0.6 79 21 0.6 86 65 2.48 HMlIO 275 2 46 42 1.5 71 28 1.0 87 66 2.67
HMllO 200 4 19 19 0.3 83 17 0.4 83 61 2.09 HMllO 250 4 39 36 1.1 75 25 0.7 86 65 2.48 HMllO 275 4 58 51 2.3 66 33 1.3 87 65 2.64
HM230 200 2 41 40 0.8 74 25 1 . 1 74 58 2.32 HM230 250 2 63 58 1.2 59 39 2.3 78 62 2.57 HM230 275 2 76 61 1.6 49 47 4.0 79 62 2.58 HM230 200 4 49 46 0.9 70 29 1.2 73 59 2.37 HM230 250 4 75 68 1.7 50 46 4.3 75 60 2.51 HM230 275 4 84 74 1.9 41 54 4.4 78 62 2.54 'Catalyst charge 0.10 g.
989
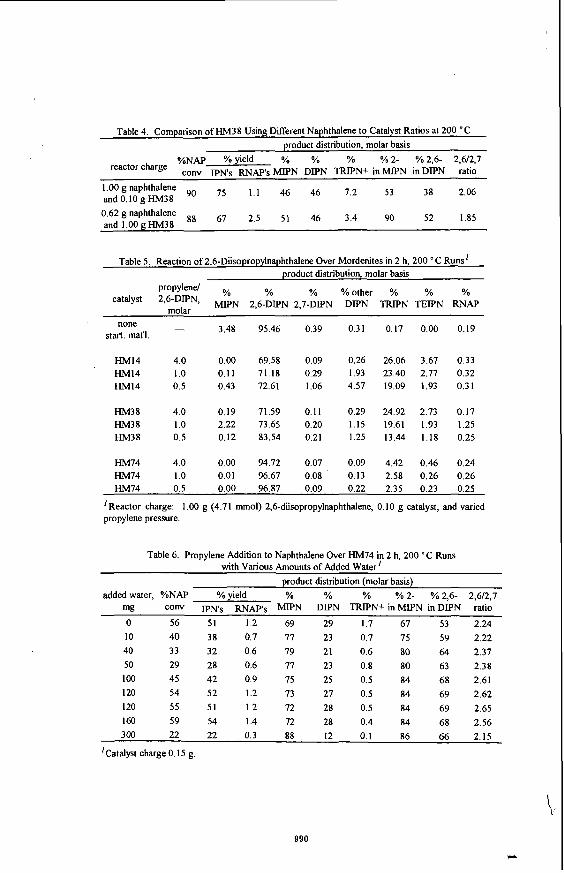
Table 4. Comparison ofHM38 Using Different Naphthalene to Catalyst Ratios at 200 "C product distribution, molar basis
%NAP %yield % % % % 2- % 2,6- 2,6/2,7 conv IpNs RNAp's MIPN DIPN TRIPN+ in MIF'N in D P N ratio reactor charge
1.00 g naphthalene m d 0 , 1 0 g H M 3 8 9 0 75 1.1 46 46 7.2 53 38 2.06
88 67 2.5 51 46 3.4 90 52 1.85 0.62 g naphthalene and l.OOgHM38
Table 5. Reaction of 2,6-Diisopropylnaphthalene Over Mordenites in 2 h, 200 "C Runs' product distribution, molar basis
% % % %other % % % propylenel
2'6-DpN' MlPN 2,6-DPN 2,7-DIPN DIPN TRIPN TEJPN RNAP molar catalyst
- none start. mat'l. 3.48 95.46 0.39 0.31 0.17 0.00 0.19
HM14 4.0 0.00 69.58 0.09 0.26 26.06 3.67 0.33 HM14 1 .o 0.11 71.18 0.29 1.93 23.40 2.77 0.32 Hh414 0.5 0.43 72.61 1.06 4.57 19.09 1.93 0.31
HM3 8 4.0 0.19 71.59 0.11 0.29 24.92 2.73 0.17 HM3 8 1 .o 2.22 73.65 0.20 1.15 19.61 1.93 1.25 Hh438 0.5 0.12 83.54 0.21 1.25 13.44 1.18 0.25
HM74 4.0 0.00 94.72 0.07 0.09 4.42 0.46 0.24 HM74 1 .o 0.01 96.67 0.08 0.13 2.58 0.26 0.26 HM74 0.5 0.00 96.87 0.09 0.22 2.35 0.23 0.25
'Reactor charge: 1.00 g (4.71 mmol) 2,6-diisopropylnaphthalene, 0.10 g catalyst, and varied propylene pressure.
Table 6. Propylene Addition to Naphthalene Over HM74 in 2 h, 200 " C Runs with Various Amounts of Added Water'
product distribution (molar basis) added water, %NAP YO yield % % % % 2- % 2,6- 2,6/2,7
mg conv p~~ R N A ~ ' ~ MIPN DIPN TRIPN+ inMIF'N inDIPN ratio 0 56 51 1.2 69 29 1.7 67 53 2.24 10 40 38 0.7 77 23 0.7 75 59 2.22 40 33 32 0.6 79 21 0.6 80 64 2.37 50 29 28 0.6 77 23 0.8 80 63 2.38 100 45 42 0.9 75 25 0.5 84 68 2.61 1 20 54 52 1.2 73 27 0.5 84 69 2.62 120 55 51 1.2 72 28 0.5 84 69 2.65 160 59 54 1.4 72 28 0.4 84 68 2.56 300 22 22 0.3 88 12 0.1 86 66 2.15
'Catalyst charge 0.15 g.
990

Figure 1. Comparison of the polyalkylated naphthalene region of the gas chromatograms for 2 h catalytic runs at 200 "C, 1 g naphthalene, and propylendnaphthalene = 0.5. Parts (a) through (c) are neat runs with 0.10 g catalyst charge: (a) HM14, (b) HM71, and (c) HM230. Parts (d) through (0 compare 0.15 g HM74 charge with (d) no added water, (e) 40 mg added water, and (0 120 mg added water.
1.80
0.00
a
HM74 0 HMllO 0 HM230
0.75
0.42 05J
1.09 1.09 r l l ~ r 0 4 ' 036
1.81
b C cell volume
dimension
igure 2. Percentage decreases in cell constants and cell volumes as a result of dealumination. Calculations relative to the cell dimensions determined for HM74.
991