Ancillary Revenue and Price Fairness: An Exploratory Study ...
23
Publications 6-2013 Ancillary Revenue and Price Fairness: An Exploratory Study Pre & Ancillary Revenue and Price Fairness: An Exploratory Study Pre & Post Flight Post Flight Blaise P. Waguespack Embry-Riddle Aeronautical University, [email protected] Tamilla Curtis Embry-Riddle Aeronautical University, [email protected] Follow this and additional works at: https://commons.erau.edu/publication Part of the Behavioral Economics Commons, Marketing Commons, and the Tourism and Travel Commons Scholarly Commons Citation Scholarly Commons Citation Waguespack, B. P., & Curtis, T. (2013). Ancillary Revenue and Price Fairness: An Exploratory Study Pre & Post Flight. , (). Retrieved from https://commons.erau.edu/publication/70 This Conference Proceeding is brought to you for free and open access by Scholarly Commons. It has been accepted for inclusion in Publications by an authorized administrator of Scholarly Commons. For more information, please contact [email protected].
Transcript of Ancillary Revenue and Price Fairness: An Exploratory Study ...

Publications
6-2013
Ancillary Revenue and Price Fairness: An Exploratory Study Pre & Ancillary Revenue and Price Fairness: An Exploratory Study Pre &
Post Flight Post Flight
Blaise P. Waguespack Embry-Riddle Aeronautical University, [email protected]
Tamilla Curtis Embry-Riddle Aeronautical University, [email protected]
Follow this and additional works at: https://commons.erau.edu/publication
Part of the Behavioral Economics Commons, Marketing Commons, and the Tourism and Travel
Commons
Scholarly Commons Citation Scholarly Commons Citation Waguespack, B. P., & Curtis, T. (2013). Ancillary Revenue and Price Fairness: An Exploratory Study Pre & Post Flight. , (). Retrieved from https://commons.erau.edu/publication/70
This Conference Proceeding is brought to you for free and open access by Scholarly Commons. It has been accepted for inclusion in Publications by an authorized administrator of Scholarly Commons. For more information, please contact [email protected].

#263 - Waguespack & Curtis
1
17TH ATRS WORLD CONFERENCE
Ancillary Revenue and Price Fairness: An Exploratory Study Pre & Post Flight
Dr. Blaise Waguespack & Dr. Tamilla Curtis Embry Riddle Aeronautical University
600 Clyde Morris Blvd Daytona Beach, FL USA
386-226-7235 [email protected]
Presenter & Corresponding Author: Blaise Waguespack; Ph.D. Abstract: The growing impact of Ancillary Revenue on consumer choice and shopping behavior continues to be a highly debated issue. In the US, the Department of Transportation (DOT) has stepped into the debate and is investigating the possibility of new rules on how airlines must report and display such ancillary offerings. While the DOT collects data, reports on the amount of ancillary revenue earned by the airlines continue to rise. Examining past research on price fairness from the marketing literature and the impact of revenue management on price fairness from the aviation literature, this article joins new research appearing on the impact of a la carte pricing and ancillary revenue on perceptions of price fairness. This study focuses on the issue of price fairness pre and post flight and how ancillary price offerings are communicated to consumers when purchasing airline services. Keywords: ancillary revenue, a la carte pricing, price fairness ================================================================
Little doubt exists about the importance the role of ancillary revenue now plays in
the global airline industry in driving profitability for many airlines. With each new
announcement from various consulting firms or reports by government agencies across the
globe where figures are available, ancillary revenue totals continue to increase. One
estimate of the total value of global ancillary revenues states the estimated value of such
income at $32.5 billion (USD) for 2011, an increase from $22.6 billion (USD) in 2010,
representing growth of 43.8% in one calendar year (Amadeus, 2012). Recent reports
(Mayeroritz, 2013) from the US Bureau of Transportation Statistics states the value of all
fees collected by the 15 largest U.S. carriers for baggage at $3.5 billion (USD) and
reservation changes fees at $2.6 billion (USD) for 2012. With the growth in revenue from
the various sources included in ancillary revenue both government agencies and consumer
interest groups are now focusing their reporting of business practices that potentially
increase the sources of ancillary revenue (Lowy, 2012; Rosenbloom, 2012). Regulators
and consumer watchdogs are tracking the various pricing schemes for both bundled and
unbundled a la carte services utilized to generate ancillary revenue that increase the final

#263 - Waguespack & Curtis
2
price paid often much higher than the price shown for the base fare and taxes paid by
passenger.
Ancillary Revenue: Defined & Common Sources
Ancillary Revenue has been defined as “revenue generated from non-ticket sources
or services that differ from or enhance the main services or product lines of an airline such
as baggage fees and onboard food and services” but has expanded even beyond those
options (Vasigh, et al.; 2012). At first uniquely identified with Low Cost Carriers (Gillen
& Lall, 2004; O’Toole, 2004; McDonald, 2009; Shaw, 2011) the range of items and
services now included as possible ancillary revenue opportunities has grown beyond just
additional flight services added to the base airline fare for just the opportunity to board the
aircraft but includes cross–selling possibilities the airline is able to offer a shopper to
purchase including items such as rental car and hotel bookings, or other shopping items
(ex: show tickets at a destination) a visitor to an airline web site can buy through the portal
or purchase onboard the aircraft that allow the airline to earn sales commissions on the
items offered.
A recent Amadeus report (2011) on the growth of ancillary revenues identified four
categories of ancillary services:
1) a la carte – a variety of service features, mainly trip related, that passengers may select and pay extra for including onboard food and beverage; check baggage, assigned seats / seat upgrades; lounge access; priority check-in, screening and boarding; onboard entertainment access; and WiFi access.
2) Commission based – cross selling opportunities airlines can offer including
hotel accommodations; car rental sales; travel insurance; and destination events 3) Frequent Flier point / miles sales – offering to the business marketplace the
opportunity for other firms to purchase airline miles or points as incentives to be used in the purchasing firms promotional or loyalty based marketing activities
4) Advertising – revenue generated from the inflight magazine; advertising sold
in or on the aircraft or in the airline lounge; or fee based product placement samples.
While many articles about trends on ancillary revenue tend to focus on a la carte issues
(Elliot, 2013; Rosenbloom 2012) the Amadeus report breaks down the three main
components of ancillary revenue for major US major carriers as 30% from services (a la
carte offerings and commission based sales) 20% from baggage fees and 50% from
frequent flyer sales.

#263 - Waguespack & Curtis
3
US DOT Involvement
With the growth in the sources of ancillary revenues and the accompanying
complaints by consumers and public interest groups (Gelles, 2013; Lowy, 2012) the U.S.
Department of Transportation (DOT) has begun to investigate the various sources of
ancillary revenue and the impact on consumer choice and buying behavior. In 2011 the
DOT issued a Notice of Proposed Rulemaking (Federal Register; 14 CFP Parts 234 and
214; 2011) with the expressed intent to get both better information on the various sources
of ancillary revenue and determine how the information is presented to consumers during
the purchasing process. To the DOT this is just a continuation of their ongoing overview
of the airline industry and trying to offer what the agency considers protection for
consumers from past actions by the airlines that were not in consumers’ best interest. This
process continues the actions the agency began with the “Tarmac Rule” (Waguespack;
2012) and the recent pricing–fare display rules now in place that mandate US airline web
sites and online travel agencies must show ticket prices including not only the base fare,
but any taxes and airport fees included with the service to be purchased.
The proposed rule has sparked controversy due to the nature of the manner in
which the DOT wants the information reported. As is currently required, only two
ancillary revenue sources are clearly presented in the Bureau of Transportation Statistics
database: (1) baggage fees and (2) cancellation charges / reservation changes. The rule
proposes that 19 separate categories of ancillary services and the associated revenue
received be reported, with baggage fees being further broken down by baggage number
and type of baggage. In total that leads to 25 different reporting items airlines must
provide under the new rule. While the DOT has held a follow-up meeting on the proposed
rule (Federal Register, 14 CFR Parts 234 and 241; 2012) and discussions continue with the
airlines and various airline interest groups, no final rule or policy has yet to be announced
for further review.
Ancillary Revenue Research in the Aviation Field
While the trade and popular press focusing on the growth in ancillary revenues and
the means by which airlines have attempted to find new methods of earning ancillary
revenue, the research on the subject in aviation journals has investigated two broad areas:
(1) ancillary revenue and the practice of revenue management and (2) issues related to the
distribution of a la carte fare products that drive ancillary revenue opportunities.
#263 - Waguespack & Curtis
4
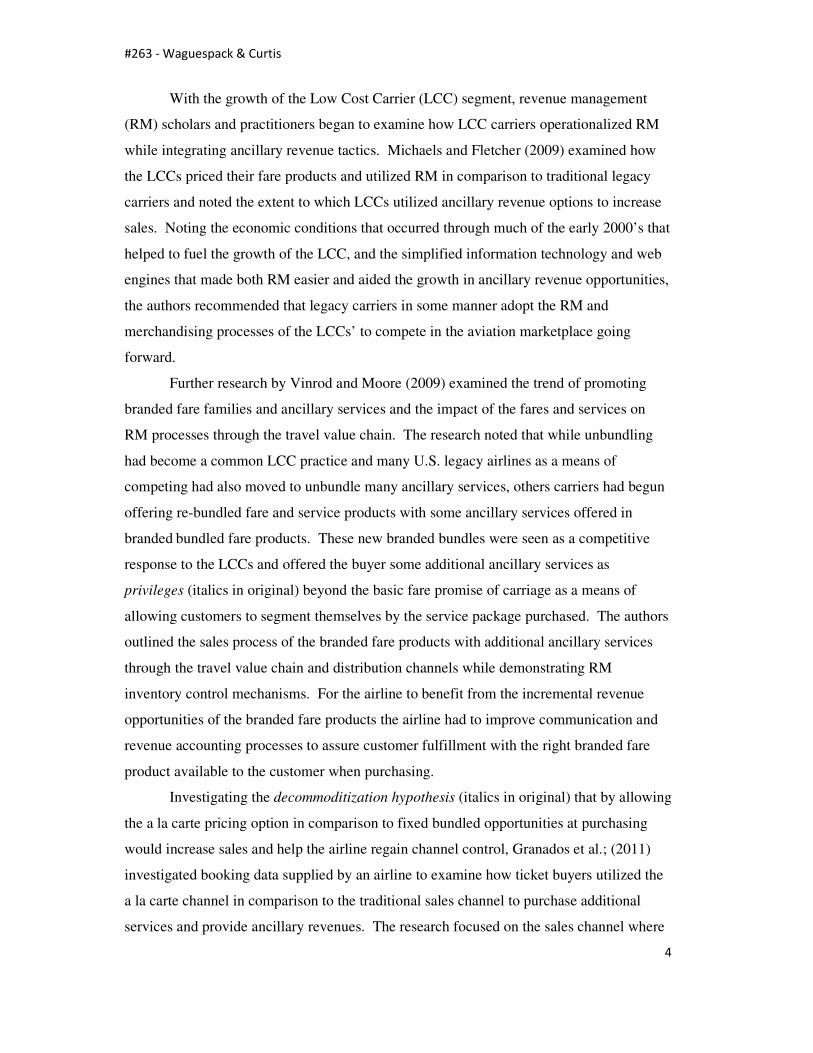
With the growth of the Low Cost Carrier (LCC) segment, revenue management
(RM) scholars and practitioners began to examine how LCC carriers operationalized RM
while integrating ancillary revenue tactics. Michaels and Fletcher (2009) examined how
the LCCs priced their fare products and utilized RM in comparison to traditional legacy
carriers and noted the extent to which LCCs utilized ancillary revenue options to increase
sales. Noting the economic conditions that occurred through much of the early 2000’s that
helped to fuel the growth of the LCC, and the simplified information technology and web
engines that made both RM easier and aided the growth in ancillary revenue opportunities,
the authors recommended that legacy carriers in some manner adopt the RM and
merchandising processes of the LCCs’ to compete in the aviation marketplace going
forward.
Further research by Vinrod and Moore (2009) examined the trend of promoting
branded fare families and ancillary services and the impact of the fares and services on
RM processes through the travel value chain. The research noted that while unbundling
had become a common LCC practice and many U.S. legacy airlines as a means of
competing had also moved to unbundle many ancillary services, others carriers had begun
offering re-bundled fare and service products with some ancillary services offered in
branded bundled fare products. These new branded bundles were seen as a competitive
response to the LCCs and offered the buyer some additional ancillary services as
privileges (italics in original) beyond the basic fare promise of carriage as a means of
allowing customers to segment themselves by the service package purchased. The authors
outlined the sales process of the branded fare products with additional ancillary services
through the travel value chain and distribution channels while demonstrating RM
inventory control mechanisms. For the airline to benefit from the incremental revenue
opportunities of the branded fare products the airline had to improve communication and
revenue accounting processes to assure customer fulfillment with the right branded fare
product available to the customer when purchasing.
Investigating the decommoditization hypothesis (italics in original) that by allowing
the a la carte pricing option in comparison to fixed bundled opportunities at purchasing
would increase sales and help the airline regain channel control, Granados et al.; (2011)
investigated booking data supplied by an airline to examine how ticket buyers utilized the
a la carte channel in comparison to the traditional sales channel to purchase additional
services and provide ancillary revenues. The research focused on the sales channel where

#263 - Waguespack & Curtis
5
the purchasing of ancillary services occurred via the a la carte option and delved into how
business and leisure passengers purchased ancillaries in the a la carte channel. While
many purchasers in the a la carte channel started with the deeply discounted fare product,
many bought additional ancillary services utilizing the al la carte channel allowing the
ticket buyer to decommoditize the product being bought and provide additional revenue to
the airline. The research further supports Vinrod and Moore (2009) in that the offering of
a branded fare product with selected service ancillaries in the a la carte channel does
increase airline revenue in comparison to the bundled product sold in the traditional airline
channel.
Price Fairness / Unfairness in the Marketing Literature
Fairness is the evaluation of whether an outcome or the process is reasonable,
acceptable, or just (Bolton, et al., 2003; Chung, 2010; Xia, et al., 2004). Price fairness is “a
consumer’s assessment and associated emotions of whether the difference or lack of
difference between seller’s price and the price of a comparative other party is reasonable,
acceptable, or justifiable” (Chung, 2010 p. 7; Xia, et al., 2004, p. 3). Price fairness is
based on the evaluation either of the actual price or the perception to the reference price.
The reference point could include the price previously paid, a competitor’s price, or the
expected price based on the perceived cost as well as the consumer’s psychological aspect.
Price fairness / unfairness as a concept has been gaining attention in the marketing
literature due to recent global economic conditions and the increasing influence of
technology and concerns about consumer opinion now being shared may hasten the
negative outcomes when pricing unfairness is perceived. Recent articles have looked at
the possible consequences of pricing unfairness in multiple product areas and countries in
an attempt to implement to investigate earlier proposed models.
Much of the recent research traces the development of models and the possible
impact of pricing unfairness to two different sources. Campbell (1999a; 1999b) reported
on a series of experimental manipulations investigating the inferred motives for possible
price increases that would lead to perceptions of price unfairness and the possible role of
the reputation of the firm played in the inferences made by customers. The experiments
brought forth evidence that consumers do make inferences for why price increases occur
especially in the absence of any information and that firms with poor reputations do not
get any ‘benefit of the doubt’ that the increase is for anything but profit maintenance or

#263 - Waguespack & Curtis
6
profit seeking. Furthermore, inferring that firms with poor reputations are unfairly pricing
will lead consumers to state negative attitudinal and behavioral intentions toward the firms
with perceived poor reputations.
Xia, et al., (2004) presents a conceptual model of the factors that lead to price
unfairness along with the role of moderating influences such as transaction similarity,
trust, attributes of responsibility, consumer knowledge, and beliefs and social norms of the
purchase process during the purchasing process. Building upon the work of Campbell
(1999) and Bolton et al., (2003) the research integrates the principles of distributive justice
and Equity Theory along with cognitive processes and the impact of affect (emotions) on
the formation of price unfairness perceptions. Besides building the conceptual foundation
that may lead to price unfairness, the model proposes how lesser perceived notions of
value and negative emotions that accompany price unfairness can lead to actions from the
customer including “revenge” (page 7) that consumers may take against the firm in the
form of negative word of mouth and / or legal actions. Many of the articles that are
emerging from the marketing literature and investigating the role of price fairness are often
addressing some aspect of the overall conceptual model put forth in this article as no
model verification was presented.
Price Fairness / Unfairness and Revenue Management
Price fairness / unfairness has been investigated in the aviation literature more
commonly when examining the impact of the Revenue Management (RM) process on
variable pricing on consumer’s perception of whether the RM process is perceived as fair
to consumers. Mathies and Gurdergan (2007) investigated the impact of RM on what the
authors termed ‘customer centric marketing.’ Utilizing focus group research to gather
opinions of both airline passengers and hotel customers, the research investigated the
interactions between utilizing RM for pricing while at the same time practicing customer
centric marketing, also known as customer relationship management. The research
investigated if airlines are sending out conflicting messages to the airlines best customers.
While trying to utilize loyalty programs and other inducements and rewards to build
lifetime value, airlines also use RM to control possible rewards (frequent flier
redemptions) and segment demand thus creating feelings of unfairness in the customer.
The comments from the focus groups with frequent flier members did in fact reveal that
members were well aware of RM practices and the potential impact of RM while not

#263 - Waguespack & Curtis
7
always understanding the rational for the practice which did lead to some unfairness
perceptions. Many frequent flier members felt the programs at times could be ‘one-way
streets’ where the airline benefits from the fliers continuing purchases while controlling
rewards and seat availability for redemptions which lessens the value of the program.
McMahon-Beattie (2011) continues the investigation into the issues of RM and
fairness and trust noting there is the sense that “RM is something that is done to customers
rather than something that is done for the customer (page 44; italics in original). Arguing
that more research needs to be done in the area of pricing policies and perceptions of trust
and fairness, the research also indicates that variable pricing in itself does not cause
mistrust, but customers’ level of knowledge of the ‘rules’ of variable pricing that
influences the trust /distrust perception and therefore fairness. Proposing that a construct
of “Rule Familiarity” needs to be operationalized to determine the knowledge level of
customers in the buyer-seller relationship when variable pricing occurs may determine the
impact on trust and fairness perceptions.
Chapuis (2013) continues the investigation in pricing variations brought on by RM
and the impact on trust and fairness utilizing a cross-cultural approach. The research
concludes for international passengers, home country cultural orientation does not
influence the perceptions of dynamic pricing. However, findings across all groups are
consistent in that RM practices do provide a negative influence on perceptions of fairness
and trust and ultimately lowers overall customer satisfaction.
Ancillary Revenue and Price Fairness
Within the past year research has appeared that has begun to link the growing
offerings involved in ancillary revenue and the issue of price fairness. Wittmer, et al.;
(2012) while not directly addressing price fairness, examined fliers’ price attitudes towards
a variety of possible a la carte ancillary offerings. Investigating the attitudes of German
speaking passengers in Switzerland to possible ancillary offerings when either flying a
Full Service Carrier or a Low Cost Carrier the research asked about the fliers’ willingness
to use and willingness to pay for a series of a la carte ancillary services. Respondents in
the study were directly asked to provide a price range they would be willing to pay for the
service and then a price that would be the upper limit for the service creating a price
fairness limit for the respondents. While the exact monetary units or amounts are not
presented, the percentages are presented on when an offering would exceed the relative

#263 - Waguespack & Curtis
8
price surcharge willing to pay and then the absolute price surcharge beyond which the
respondents believe an ancillary charge becomes potentially unfair.
One stream of research has begun directly incorporating the concept of price
fairness with the purchasing of ancillary services (Chung, 2010; Chung & Petrick, 2012)
derived from the conceptual model of Xia, et al (2004). In this research utilizing scales
developed through the marketing literature, a model is derived that attempts to
operationalize the antecedents of price fairness and the potential impacts on behavior when
prices are perceived as unfair. Further providing evidence supporting the work of
Campbell (1999a; 1999b), the model finds that issue of controllability and locus of
causality (the firm controls the reason for the price changes) does impact perceptions of
price fairness / unfairness. When fliers perceived the extra fees to be unacceptable and an
attempt by the airline to get additional revenue / profits because the airline can and not due
to any external factor, the fees are considered unfair. While the research notes
investigating the purchasing of ancillary services and therefore the fees charged, the
survey shown does not specifically question what ancillary items may have been bought,
but asks the respondent about the difference in the airfare paid compared to the additional
fees charged. Therefore while respondents are given the chance to express their views on
the additional fees for ancillary services, the actual services utilized and the dollar amount
paid for the ancillary services selected are not presented.
THIS STUDY
The main goal of this study is to examine perceptions of price fairness in regards to
the offering of ancillary services and the accompanying fees in the U.S. domestic market.
More specifically, this study focuses on differences in consumer perception of ancillary
fees between two groups of passengers: those who have recently completed a commercial
flight and those who will be traveling in the future.
H0: There are differences in the perception of price fairness between passengers who have recently traveled, and passengers with an upcoming intent to travel.
Methodology
The survey instrument was composed of four main sections. The first section
included questions about flight check-in, baggage check-in and a presentation of a la carte
services the respondents could have or planned to purchase. The second section of 10

#263 - Waguespack & Curtis
9
items measured two constructs: (1) an 8 item scale on price fairness based on the Chung
(2010) dissertation instrument and (2) a two item scale on information availability about
the charges for the ancillary offerings. The third section contained additional questions
about the respondents’ general flight experience, preferred method for purchasing tickets,
airline selection and frequent flight status. The last section inquired about the socio-
demographic profiles of the respondents. There were two versions of the survey: the first
version surveyed respondents who recently completed a commercial flight, whereas the
second version was sculpted for respondents who intended to fly in the near future.
Data was collected face-to-face during the spring of 2013 both before the regularly
scheduled “Spring Break” and as the students begun summer term courses. The timing
was selected in an attempt to get more students who had booked ahead of Spring Break as
respondents or possible summer trips upon the conclusion of the first of two possible
summer academic terms. Participants included students taking classes at a private
university located in the southeast section of the United States. The survey participants
were asked first whether they had flown recently or intended to fly in the near future.
Based on the answer, the researchers distributed the appropriate version of the survey,
either in the past or future tense. Respondents were then asked to complete the survey in
relation to their personal experience either in regards to their most recent commercial
flight, or in regards to their experience with the anticipated flight. A total of 233 paper-
and-pencil surveys were completed as the survey was conducted during class. The SPSS
19 software package was utilized for the statistical analysis.
Data Analysis
Due to the nature of the university environment, the majority of survey respondents
were young males, and the largest group was with articulated household income of
$100,000 or more (see Table 1).
Table 1 - Demographic Profiles of Respondents (n=233)
Age Mean = 23 Min = 18 Max = 60
No. Percentage
Gender Male 197 84.5% Female 36 15.50
Household income Less than $20,000 15 6.4% $20,001-$40,000 26 11.2%

#263 - Waguespack & Curtis
10
$40,001-$60,000 32 13.70% $60,001-$80,000 23 9.90% $80,001-$100,000 24 10.30% $100,000 and more 47 20.20% Decline to respond 66 28.30%
The most common airlines that respondents had either flown or planned to fly were
Delta Air Lines: 26.6% had flown - 9.9% planned to fly; Southwest: 7.7% had flown –
2.6% planned to fly; and JetBlue: 6.4% had flown – 3.4% planned to fly. When checking-
in with the airlines, the clear preference is to utilize online check-in options with 78 past
fliers (33.5% of the total respondents) utilizing the online option, while 49 future fliers
(21% of the respondents) noting online as the likely check-in method. The majority
respondents, 42.5% indicated that they did not belong to any Frequent Flyer Programs
(FFP), while 17.2% indicated that they belong to multiple plans. The most frequent airline
FFP memberships acknowledge were Delta’s Skymiles at 10% and Jet Blue’s TrueBlue at
4.3% of all respondents.
As checked baggage is one of the main sources of ancillary revenue a series of
questions about baggage check-in were immediately asked. Table 2 presents the
breakdown of the number of bags checked by past versus future passengers and the
average amount spent when checking baggage.
Table 2 – Baggage Checked (n = 233) Past Future No. % No. %
Number of Bags Checked: 0 28 12% 21 9% 1 84 36.1% 48 20.6% 2 33 14.2% 12 5.2% 3 or More 4 1.8% 3 1.3%
Past (n= 57) Future (n=37)
Avg Amount Spent Checking Bags: $48.25 $54.05
When examining Table Two one can see that 121 of the past fliers had checked a bag, but
only 57 reported having to pay a baggage fee. When asking the past fliers who did not pay
extra for checked baggage if they knew why they did not pay the main reasons given was
that the baggage service was still bundled with the price of the airfare (n=38) while many
selected ‘other’ as could not recall a specific reason. When asking future fliers why they

#263 - Waguespack & Curtis
11
did not expect to pay for a checked bag the leading response given was also the belief the
baggage service would be included in the ticket price (n=18). Only a few respondents in
either group indicated the fee was dismissed due to either credit card benefit or frequent
flyer status.
An additional attempt to examine if the baggage service fees now in place are
impacting fliers asked if the presence of additional baggage charges discourage the flier
from checking or planning to check bags. The question was asked in a nominal yes / no
response format. Conducting a Chi-Square cross tabulation on the data, a significant
impact is found that the presence of baggage fees discourages the checking of bags. The
data for the Chi-Square analysis is presented below in Table Three.
Table Three: Do additional charges discourage you from checking bags?
Flier
Do Bags Fee Discourage You from Checking Bags
Past
(n=149)
Future
(n=84)
No 70 21
Yes 79 63
Pearson Chi-Square Value: 10.93* sig. 001 *0 cells less than 5 count; minimum expected is 32.81
After enquiring about baggage check-in and fees, a list of possible a la carte
ancillary services were presented to the respondents. Appendix One presents a table of the
items and the number of respondents between the two groups studied, past versus future
fliers and the pattern of responses. For none of the items asked did a majority of
passengers pay for the ancillary service. Examining the mean dollar amount spent or
planning to spend for the items we find:
Seat Selection: Fourteen past passengers did pay for seat selection with the average
price of $25.71, whereas 6 future passengers anticipate the fee will be little less and priced
around $22.50.
#263 - Waguespack & Curtis
12
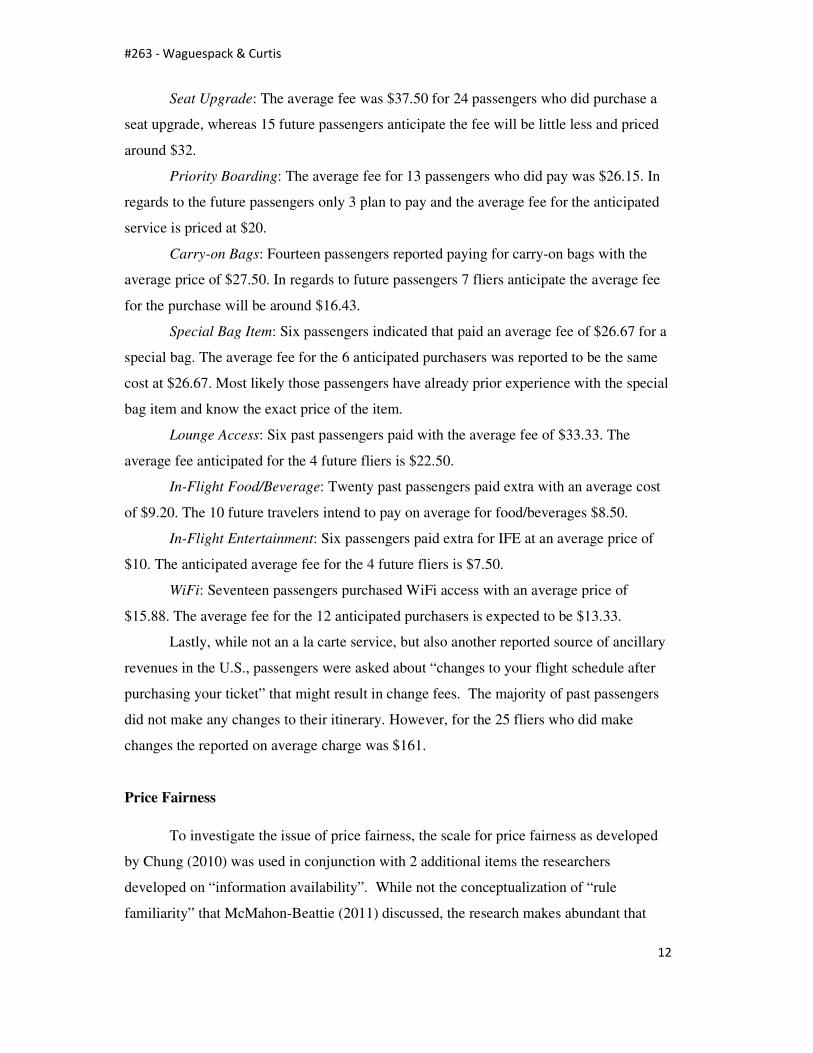
Seat Upgrade: The average fee was $37.50 for 24 passengers who did purchase a
seat upgrade, whereas 15 future passengers anticipate the fee will be little less and priced
around $32.
Priority Boarding: The average fee for 13 passengers who did pay was $26.15. In
regards to the future passengers only 3 plan to pay and the average fee for the anticipated
service is priced at $20.
Carry-on Bags: Fourteen passengers reported paying for carry-on bags with the
average price of $27.50. In regards to future passengers 7 fliers anticipate the average fee
for the purchase will be around $16.43.
Special Bag Item: Six passengers indicated that paid an average fee of $26.67 for a
special bag. The average fee for the 6 anticipated purchasers was reported to be the same
cost at $26.67. Most likely those passengers have already prior experience with the special
bag item and know the exact price of the item.
Lounge Access: Six past passengers paid with the average fee of $33.33. The
average fee anticipated for the 4 future fliers is $22.50.
In-Flight Food/Beverage: Twenty past passengers paid extra with an average cost
of $9.20. The 10 future travelers intend to pay on average for food/beverages $8.50.
In-Flight Entertainment: Six passengers paid extra for IFE at an average price of
$10. The anticipated average fee for the 4 future fliers is $7.50.
WiFi: Seventeen passengers purchased WiFi access with an average price of
$15.88. The average fee for the 12 anticipated purchasers is expected to be $13.33.
Lastly, while not an a la carte service, but also another reported source of ancillary
revenues in the U.S., passengers were asked about “changes to your flight schedule after
purchasing your ticket” that might result in change fees. The majority of past passengers
did not make any changes to their itinerary. However, for the 25 fliers who did make
changes the reported on average charge was $161.
Price Fairness
To investigate the issue of price fairness, the scale for price fairness as developed
by Chung (2010) was used in conjunction with 2 additional items the researchers
developed on “information availability”. While not the conceptualization of “rule
familiarity” that McMahon-Beattie (2011) discussed, the research makes abundant that

#263 - Waguespack & Curtis
13
knowledge for the and about pricing issues can impact price fairness perceptions. The two
items the authors created were intermingled in the section of the survey where the items on
price fairness where presented. Examining the reliability of the scales utilized, the price
fairness scale has a reported Cronbach’s alpha of .864 and the information availability
scale has reported Cronbach’s alpha of .801, well within acceptable values for exploratory
research (Field, 2009).
Independent t-test where then conducted on the overall scores obtained on the
price fairness and information availability scales to test the hypothesis put forth that there
are differences in the perception of price fairness between passengers who have recently
traveled, and passengers with an upcoming intent to travel. For the price fairness t-test a t-
value of -1.736 is found with significance (2-tailed) of .084. Examining the mean scores
for the two groups, those who flew in the past did have a slightly lower mean score of
23.99 to a mean score of 25.18 for future passengers. Those who flew in the past did have
a lower mean price fairness score but the difference between the groups is not statistically
significant.
Due to the role of information availability on price changes that has discussed in
past research a t-test was also conducted on the information availability scores of the two
groups. For this t-test a t-value of -2.043 is found with significance (2 tailed) of .042
supporting there exist some degree of information availability difference between the two
groups. An examination of the mean scores of the groups found the past fliers with a
lower mean score of 6.18 to the future fliers mean score of 6.67 on information
availability. While statistical significance was not found for the price fairness scores, the
finding that the future fliers perceived more availability of information may lead to the
reason for the future fliers’ higher price fairness scores. In general, future passengers had
more positive expectations of price fairness in regards to ancillary fees than recent
travelers and perceived more availability of information.
To investigate further, t-test were conducted on the scores on each of the individual
items. Appendix Two presents the individual item mean scores by group analysis and the
t-values and significance levels found. In general, future passengers had more positive
expectations of price fairness in regards to ancillary fees than recent travelers when
examining the statements individually. Only one statement; “All passengers were treated
equally by the airline's pricing policy,” had a slightly higher mean after the actual flight
experience. The individual t-test results indicate that two-tailed p-value is greater than 0.05

#263 - Waguespack & Curtis
14
for the price fairness statements with the exemption of "The additional charges were
acceptable." Therefore, we can conclude that there was no statistical significant difference
between the means of the two samples for seven of the eight price fairness items. Price
fairness is perceived equally by both passengers with recent flight experience as well as
passengers with the intent to travel in the near future in this case. Based on the
independent t-test results we can conclude the following:
1. The additional charges were clearly understandable.
On average, the future passengers experienced greater agreement with this
statement (M=3.20, SE=0.089) than the passengers with actual experience,
majority of whom were neutral about this statement (M=3.00, SE=0.080).
However, this difference was not significant t(231)= -1.604, p>0.05.
2. The airline's pricing decision procedures were fair.
On average, the future passengers experienced greater agreement with this
statement (M=3.15, SE=0.084) than the passengers with actual experience
(M=2.98, SE=0.074). However, this difference was not significant t(231)= -1.495,
p>0.05.
3. I think the additional charges were based on cost.
On average, the future passengers experienced greater agreement with this
statement (M=3.17, SE=0.081) than the passengers with actual experience
(M=3.05, SE=0.076). However, this difference was not significant t(231)= -1.010,
p>0.05.
4. The additional charges were fair.
On average, the future passengers disagreed slightly less with this statement
(M=2.89, SE=0.091) than the passengers with actual experience (M=2.70,
SE=0.095). However, this difference was not significant t(185)= -1.652, p>0.05
5. The airline's pricing procedures were reasonable.
On average, the future passengers experienced greater agreement with this
statement (M=3.23, SE=0.085) than the passengers with actual experience
(M=3.05, SE=0.075). However, this was not significant t(231)= -1.456, p>0.05.

#263 - Waguespack & Curtis
15
6. The additional charges were acceptable.
On average, the future passengers experienced greater agreement with this
statement (M=3.04, SE=0.093) than the passengers with actual experience,
majority of whom disagree with this statement (M=2.78, SE=0.071). This
difference was significant t(231)= -2.181, p<0.05.
7. The airline's pricing procedures were acceptable.
On average, the future passengers experienced greater agreement with this
statement (M=3.23, SE=0.087) than the passengers with actual experience
(M=3.09, SE=0.071). However, this difference was not significant t(231)= -1.214,
p>0.05.
8. All passengers were treated equally by the airline's pricing policy.
This is the only price fairness statement out of 10 that on average, the passengers
with actual flight experience indicated greater agreement with this statement
(M=3.34, SE=0.078) than the future passengers (M=3.27, SE=0.098). However,
this difference was not significant t(231)= .536, p>0.05.
For the two items that composed the information availability scale the individual t-test
find:
1. Information about additional airline charges was easily accessible.
On average, the future passengers experienced greater agreement with this
statement (M=3.35, SE=0.099) than the passengers with actual experience
(M=3.13, SE=0.081). However, this difference was not significant t(231)= -1.660,
p>0.05.
2. It was easy to find information on additional charges before purchasing my ticket.
On average, the future passengers experienced greater agreement with this
statement (M=3.32, SE=0.093) than the passengers with actual experience
(M=3.05, SE=0.082). This difference was significant t(231)= -2.068, p<0.05.

#263 - Waguespack & Curtis
16
CONCLUSIONS & IMPLICATIONS
This research investigated if there exist different levels of price fairness /
unfairness between past and future airline passengers. By focusing in on a variety of well-
known ancillary revenue generating offerings by the airlines and questioning the
respondents on their past or future use of the ancillary services provided the opportunity to
examine if such ancillary service purchasing brought about perceptions of price unfairness.
While this study did not find statistical significance between the past and future passengers
on price fairness, some support for differences in information availability between past and
future fliers concerning knowledge of airline ancillary offerings was found and is believed
to have increased the potential price fairness perceptions of future passengers and
impacted the findings of this study.
The results of this study though must be reviewed in light of the limitations. Due
to the sample group utilized, the overwhelmingly majority of fliers are young, college age,
leisure fliers. In reviewing the results with some of the participants, one of the researchers
found it was not uncommon for the respondent to not have been the one who actually
purchased the ticket. That while providing the information needed to derive the itinerary
(date and times) the actual purchaser may have been made by parent or other relatives. As
recipients of a ‘gift’ trip the respondents had to accept the ticket as is and therefore not
likely to add ancillary services as those would either have to come out of the recipients
limited funds or as the trip of a short duration (time of flight and /or time away from the
university) why bother with any additional services.
One aspect of the findings though lead to some speculation and perhaps evidence
of unintended consequences by the researchers. The US airlines and supporting interest
groups fought a recent DOT rule, also known as the ‘Total Price Rule’ (Richey, 2013) that
now make it a requirement to have all taxes and fees included in any ticket prices shown to
the public through various promotional, communication and sales channels. However,
having to meet this rule and the additional focus airlines have brought to pricing elements
during the shopping process in an attempt to provide better pricing knowledge to hold off
more possible regulation may have had an unintended side effect of lessening perceptions
of price unfairness. This study does support that future fliers had higher perceptions of
information availability than past fliers. Has the Total Price Rule actually aided the
airlines in some manner the industry would rather not admit as the rule was forced upon
the industry by government regulation?

#263 - Waguespack & Curtis
17
With the ongoing DOT investigation into ancillary pricing activities, the current
scrutiny on the airline industry being brought to bear by the latest merger occurring among
legacy US carriers and now combined with discussions on IATA’s New Distribution
Capability (Gelles, 2013) and the potential impact on airline distribution systems, the issue
of ancillary revenue and the ongoing bundling and unbundling of ancillary offerings is not
likely to soon fade away. With consumer and trade groups use of social media and savvy
grass roots communication strategies being utilized to get a message of consumer
discontent into the public realm, the role and use of ancillary revenue options by the
airlines will continue to focused upon in the news and researched by many stakeholders in
the industry.
References
Amadeus (2011), “The Ancillaries Landscape: How Ancillaries are Changing the Economic Landscape for Airlines”, at http://2013.amadeusblog.com/wp-content/uploads/2011/10/amadeus_data_centre_inforgraphic1.jpg Amadeus (2012), “Airline Ancillary Revenue Soars to $32.5 Billion Worldwide in 2011”, Press Release, online at www.amadeus.com Bolton, L.E., Warlop, L., Alba, J.W. (2003), “Consumer Perceptions of Price (Un)Fairness”, Journal of Consumer Research, vol. 29, no. 4, pp.474-491. Campbell, M.C. (1999a), “Pricing Strategy & Practice: “Why did you do that?” The Important Role of Inferred Motive in Perceptions of Price Fairness”, Journal of Product & Brand Management, vol. 8, no.2, pp. 145-252. Campbell, M.C. (1999b), “Perceptions of Price Unfairness: Antecedents and Consequences”, Journal of Marketing Research, vol. 36, no.2, pp.187-199. Chapuis, J.M. (2013), “A Cross-Cultural Analysis of Passengers Reactions to Revenue and Pricing Management”, vol. 12, no. 1, pp. 16-25. Chung, J.Y. (2010), “The Antecedents and Consequences of Price Fairness in Tourism”, Dissertation; Texas A&M University Chung, J.Y. and Petrick, J.F. (2012), “Price Fairness of Airline Ancillary Fees: An Attributional Approach”, Journal of Travel Research, vol. 52, no.2, pp. 186-181. Elliot, C. (2013), “The Navigator: Fee Happy Airlines Raise the Bar Again”, The Washington Post, May 9, 2012, online at www.washingtonpost.com

#263 - Waguespack & Curtis
18
Federal Register (2011), “Reporting Ancillary Airline Passenger Revenues – Notice of Proposed Rule Making”, 14 CFR Parts 234 and 241, RIN 2139-AA13, July 15, 2011, vol.76, no.136, pp.41726-41731. Federal Register (2012), “Reporting Ancillary Airline Passenger Revenues – Notice of Public Meeting”, 14 CFR Parts 234 and 241, RIN 2139-AA13, April 27, 2012, vol.77, no.82, pp. 25105-25106. Field, A. (2011), “Discovering Statistics using SPSS”, Sage Publications, London, England. ISBN: 978-1-84787-906-6 Gelles, J. (2013), “Big Data: Will this Fly? There’s Concern that Airlines’ Proposal May Lead to Fliers Pay More”, Philadelphia Inquirer, May, 2, 2013, pp. 15 Gillen, D. and Lall, A. (2004), “Competitive Advantage of Low Costs Carriers: Some Implications for Airports”, Journal of Air Transport Management, vol. 10, pp.41-50. Granados, N.F., Kauffman, R.J., Lai, H., and Lin, H.G. (2011), “Decommodization, resonance Marketing and Information Technology: An Empirical Study of Air Travel Services Amid Chanel Conflict”, Journal of Management Information Systems, vol. 28, no. 2, pp. 39-74. Lowy, J. (2012), “Airlines: Fees undermine Ability to Compare Fares”, The Charleston Gazette, December 27, 2012, pp. C.2. Mathies, C. and Gudergan, S. (2007), “Revenue Management and Customer Centric Marketing – How do They Influence Travllers’ Choices?”, Journal of Revenue and Pricing Management, vol.6, no. 4, pp. 331-346. Mayerowitz, S. (2013), “Airlines Collected Record Baggage fees in 2012”, Today in the Sky (blog), April 29, 2013, USAToday.com. McDonald, M (2009), “Tapping the Ancillary Revenue Well”, Air Transport World, March 2009, pp.59-61. McMahon-Beattie, U. (2011), “Trust, Fairness and Justice in Revenue Management: Creating Value for the Consumer”, Journal of Revenue and Pricing Management, vol. 10, no. 1, pp. 44-46. Michaels, L. and Fletcher, S. (2009), “Competing in an LCC World”, Journal of Revenue and Pricing Management, vol. 8, no. 5, pp. 410-423. O’Toole, K. (2004), “A New Vision”, Airline Business, vol. 20, no. 3, pp.26-29. Rosenbloom, S. (2012), “Fleeced by Fees?”, New York Times, September 23, 2012, pp. TR.1. Shaw, S. (2011), “Airline Marketing and Management”, 7th edition; Ashgate Publishing; Surry, England; ISBN: 978-1-4094-0149-0
#263 - Waguespack & Curtis
19
Vasigh, B., Taleghani, R., and Jenkins, D. (2012), “Aircraft Finance: Strategies for Managing Capital Costs in a Turbulent Industry”, J. Ross Publishing, Ft. Lauderdale, FL., ISBN: 978-1-60427-0716 Vinrod, B. and Moore, K. (2009), “Promoting Branded Fare Families and Ancillary Services: Merchandising and Its Impact on the Travel Value Chain”, Journal of Revenue and Pricing Management, vol. 8, no. 2/3, pp. 174-186. Richy, W. (2013), “Supreme Court Refuses Case Challenging Full Price Disclosure for Airlines”, The Christian Science Monitor, April, 1, 2013, pp. 8. Waguespack, B. (2012), “A Longitudinal Exploration of Cancellations, Departures and the Tarmac Rule”, Proceedings of 16th ATRS World Conference, June 2012. Wittmer, A., Boksberger, P. and Gerber, A. (2012), “The Future of Ancillary Service Fees in Air Travel – An Exploratory Investigation of Budget Air Travellers”, International Journal of Aviation Management, vol. 1, no. 4, pp. 231-231. Xia, L., Monroe, K.B., and Cox, J.L. (2004), “The Price is Unfair! A Conceptual Framework of Price Fairness Perceptions”, Journal of Marketing, vol. 68 no.1, pp. 1 – 15.

#263 - Waguespack & Curtis
20
Appendix One: A La Carte Ancillary Services
As checked baggage fees were asked about immediately at the beginning of the survey and reported earlier, that ancillary offering is not repeated below. As more airlines have added charges for carry-on bags and special items (ex: golf clubs) and the DOT has listed these as separate reporting items in the proposed ancillary reporting regulations, those services were asked about separately in the survey and listed here. The dollar amount shown underneath the number who purchased is the average amount spent or expected to be spent for the ancillary item.
Past n=149 Future n=84
Included Did Not Buy
Purchased Included Did Not Buy
Purchased
Seat
Selection
64 71
14
$25.71
46 32
6
$22.50
Seat
Upgrade
7 117
24
$37.50
4 65
15
$32.00
Priority
Boarding
18 118
13
$26.15
11 70
13
$20.00
Carry-on
Bag
89 46
14
$27.50
61 16
7
$16.43
Special Bag
Item
29 114
6
$26.67
9 69
6
$27.67
Lounge Access
11 132
6
$33.33
9 71
4
$22.50
In-Flight Food &
Beverage 73 56
20
$9.20
45 29
10
$8.50
In-Flight
Entertainment 49 94
6
$10.00
33 47
4
$7.50
WiFi
11 121
17 $15.88
12 59 12
$13.33

#263 - Waguespack & Curtis
21
Appendix Two: Price Fairness & Information Availability t-Test
Item / Variable Name - Scale Statement
Price Fairness ChargeUnder The additional charges were clearly understandable. PriceProdFair The airline's pricing decision procedures were fair. Cost I think the additional charges were based on cost. AddFair The additional charges were fair. PriceProdReas The airline's pricing procedures were reasonable. AddAcc The additional charges were acceptable. PriceProdAcc The airline's pricing procedures were acceptable. Equally All passengers were treated equally by the airline's pricing policy. Information Availability Find It was easy to find information on additional charges before purchasing my ticket. Access Information about additional airline charges was easily accessible
Group Statistics
Version Code N Mean Std. Deviation Std. Error Mean
ChargeUnder 0 149 3.00 .980 .080 1 84 3.20 .818 .089
PriceProdFair 0 149 2.98 .904 .074 1 84 3.15 .768 .084
Cost 0 149 3.05 .932 .076 1 84 3.17 .742 .081
AddFair 0 149 2.70 .913 .075 1 84 2.89 .836 .091
Access (Info Avail) 0 149 3.13 .988 .081 1 84 3.35 .912 .099
PriceProdReas 0 149 3.05 .914 .075 1 84 3.23 .782 .085
AddAcc 0 149 2.78 .869 .071 1 84 3.04 .857 .093
PriceProdAcc 0 149 3.09 .862 .071 1 84 3.23 .797 .087
Equally 0 149 3.34 .957 .078 1 84 3.27 .896 .098
Find (Info Avail) 0 149 3.05 .999 .082 1 84 3.32 .853 .093

#263 - Waguespack & Curtis
22
Levene's Test for Equality of Variances
t-test for Equality of Means
95% Confidence
Interval
F Sig. t df Sig. (2-tailed)
Mean Difference
Std. Error Difference
Lower Upper
ChargeUnder Equal variances assumed
-.202 .175 -1.604 231 .110 -.202 .126 -.451 .046
Equal variances not assumed
-.202
-1.686 198.606 .093 -.202 .120 -.439 .034
PriceProdFair Equal variances assumed
-.175 .406 -1.495 231 .136 -.175 .117 -.405 .056
Equal variances not assumed
-.175
-1.564 196.125 .120 -.175 .112 -.395 .046
Cost Equal variances assumed
-.120 .109 -1.010 231 .314 -.120 .119 -.353 .114
Equal variances not assumed
-.120
-1.075 205.352 .283 -.120 .111 -.339 .100
AddFair Equal variances assumed
-.195 .016 -1.612 231 .108 -.195 .121 -.433 .043
Equal variances not assumed
-.195
-1.652 185.178 .100 -.195 .118 -.428 .038
Access Equal variances assumed
-.218 .635 -1.660 231 .098 -.218 .131 -.476 .041
Equal variances not assumed
-.218
-1.697 184.100 .091 -.218 .128 -.471 .035
PriceProdReas Equal variances assumed
-.172 .082 -1.456 231 .147 -.172 .119 -.406 .061
Equal variances not assumed
-.172
-1.520 195.195 .130 -.172 .113 -.396 .051
AddAcc Equal variances assumed
-.257 .097 -2.181 231 .030 -.257 .118 -.490 -.025
Equal variances not assumed
-.257
-2.189 174.304 .030 -.257 .117 -.489 -.025
PriceProdAcc Equal variances assumed
-.139 .919 -1.214 231 .226 -.139 .114 -.364 .087
Equal variances not assumed
-.139
-1.241 183.709 .216 -.139 .112 -.360 .082
Equally Equal variances assumed
.068 .286 .536 231 .592 .068 .128 -.183 .320
Equal variances not assumed
.068
.546 181.820 .586 .068 .125 -.179 .316
Find Equal variances assumed
-.268 .261 -2.068 231 .040 -.268 .129 -.523 -.013
Equal variances not assumed
-.268
-2.161 195.469 .032 -.268 .124 -.512 -.023