ANALYZING THE (MIS)FIT BETWEEN INSTITUTIONAL AND...
30
ANALYZING THE (MIS)FIT BETWEEN INSTITUTIONAL AND ECOLOGICAL NETWORKS OF THE CORAL TRIANGLE This publication was prepared with funding from the United States Agency for International Development’s Coral Triangle Support Partnership (CTSP) and contributions from the Stockholm Resilience Center (November 2013)
Transcript of ANALYZING THE (MIS)FIT BETWEEN INSTITUTIONAL AND...

ANALYZING THE (MIS)FIT BETWEEN INSTITUTIONAL AND ECOLOGICAL NETWORKS
OF THE CORAL TRIANGLE
This publication was prepared with funding from the United States Agency for International Development’s Coral Triangle Support Partnership (CTSP) and contributions from the Stockholm
Resilience Center (November 2013)

Cover photo: Diver swimming above a gorgonian fan coral during a wall dive. Photo: © Jürgen Freund / WWF-Canon

ANALYZING THE (MIS)FIT BETWEEN INSTITUTIONAL AND ECOLOGICAL NETWORKS OF THE CORAL TRIANGLE
November 2013
USAID Project Number GCP LWA Award # LAG-A-00-99-00048-00
Authors: EA Tremi, O Bodin, P Fidelman, S Kininmonth, J Ekstrom
Key Contributors: Yoland Bosiger and George Freduah, University of the Sunshine Coast, and Maurice Knight, USAID Coral Triangle Support Partnership
For more information on the six-nation Coral Triangle Initiative, please contact:
Coral Triangle Initiative on Coral Reefs, Fisheries, and Food SecurityInterim Regional SecretariatMinistry of Marine Affairs and Fisheries of the Republic of IndonesiaMina Bahari Building II, 17th FloorJalan Medan Merdeka Timur No 16Jakarta Pusat 10110 Indonesiawww.thecoraltriangleintitiave.org
This is a publication of the Coral Triangle Initiative on Coral Reefs, Fisheries, and Food Security (CTI-CFF). Funding for the preparation of this document was provided by the USAID-funded Coral Triangle Support Partnership (CTSP). CTSP is a consortium led by the World Wildlife Fund, The Nature Conservancy, and Conservation International with funding support from the United States Agency for International Development’s Regional Asia Program.
© 2013 Coral Triangle Support Partnership. All rights reserved. Reproduction and dissemination of material in this report for educational or other non-commercial purposes are authorized without any prior written permission from the copyright holders provided the source is fully acknowledged. Reproduction of material in this information product for resale or other commercial purposes is prohibited wihout written permission of the copyright holders.
Disclaimer: This document is made possible by the generous support of the American people through the United States Agency for International Development. The contents are the responsibility of the Coral Triangle Support Partnership (CTSP) and do not necessarily reflect the views of USAID or the United States Government.


ANALYSING THE (MIS)FIT BETWEEN INSTITUTIONAL AND ECOLOGICAL NETWORKS OF THE CORAL TRIANGLE 3
FORWARD ................................................................................................................................................................... 1
OVERVIEW ................................................................................................................................................................... 5
INTRODUCTION ...................................................................................................................................................... 7 The Institutional-Ecological Problem of Fit ................................................................................................... 7
METHODOLOGY ...................................................................................................................................................... 9 Ecological networks .................................................................................................................................................... 9 Institutional networks ....................................................................................................................................... 9 Network analysis ................................................................................................................................................ 11
KEY FINDINGS ........................................................................................................................................................... 12 Thematic institutional fit ................................................................................................................................... 12 Ecological connectivity ...................................................................................................................................... 12 Institutional linkages .......................................................................................................................................... 13 Ecological-institutional (mis)fit ........................................................................................................................ 13
DISCUSSION AND CONCLUSIONS .................................................................................................................... 14
FUTURE WORK AND CONSIDERATIONS ........................................................................................................ 16
REFERENCES ............................................................................................................................................................... 17
CONTENTS


ANALYSING THE (MIS)FIT BETWEEN INSTITUTIONAL AND ECOLOGICAL NETWORKS OF THE CORAL TRIANGLE 5
The marine resources of the Coral Triangle (CT) region are the most biologically diverse in the world and sustain the livelihoods of a massive and growing population. The region currently has an estimated population of 394.7 million, one third of which (131.5 million) are estimated to be directly depending on marine and coastal resources for their livelihoods and wellbeing (Table 1).
Local sustainability of this biodiversity hotspot, currently experiencing intense population pressure, is dependent on (1) maintaining ecological linkages among seascapes and across the region (i.e., dispersal among sites, and self-seeding within sites), and (2) minimizing local-to-regional threats through international policy and local governance. The governance structure within the CT region is however highly complex, forming a network of cross-institutional interactions at international (or regional) and sub-national levels. As a result, a key challenge for effective management in the region is in quantifying and accommodating the regional governance structures, the key ecological processes across the seascape, and the alignments and misalignments between these social and ecological systems (i.e. social-ecological system).
Here, we combined a novel approach for mapping governance/institutional linkages related to marine resource management at international levels in conjunction with a marine ecological connectivity model to discover where, and to what degree, the social-ecological system of the CT is in alignment. We developed a new framework for visualizing and analyzing the integrated ecological-institutional networks thereby identifying important geopolitical fit and misfit between the region’s ecology and governance. Although this initial analysis was necessarily confined to country-level patterns in governance (primarily due to the costs of discovering, translating, and assimilating local-scale policies), the same framework would be effective at analyzing local-scale management (e.g., provincial governments, local communities).
Specifically, we examine how countries are linked to one another based on their participation in international environmental agreements. Using a database of 200 documents, we identified all unique country-to-country policy linkages pertaining to marine governance in the region. Aggregating all linkages across all countries into a single network produced the first regional map of international marine governance for the CT. Individual networks were developed for specific marine governance ‘topics’ such as ‘Marine Protected Areas’ and ‘Fisheries Management’ allowing for a more targeted analysis. Ecological connectivity was quantified throughout the region for three ‘classic’ coral reef organisms (e.g., coral, benthic reef fish, pelagic reef fish) using a computer model integrating ocean currents, maps of coral reef habitat, and the unique biological characteristics of the reef organisms. These models produce realistic maps of larval dispersal revealing the geographic structure of marine corridors and the ecological connectivity among management units. The marine governance/institutional networks and the ecological networks were overlaid to evaluate the level of ecological-institutional fit and misfit between countries.
Overall, the six CT countries appear to be aligned in terms of international policies on MPAs and marine connectivity, but less so for policies related to fisheries (Figure 6). Focusing on the network linkages representing significant misfit (orange and red linkages in Figure 6), the greatest degree
OVERVIEW

ANALYSING THE (MIS)FIT BETWEEN INSTITUTIONAL AND ECOLOGICAL NETWORKS OF THE CORAL TRIANGLE 6
of ecological-institutional misfit occurs between Indonesia and Timor-Leste (red linkage in Figure 6), followed by linkages between Vietnam and Malaysia and with neighboring countries. Here, the international policy linkages do not match the ecological connectivity, suggesting that efforts may be needed to develop and strengthen linkages along these important ecological corridors. Throughout most of the remaining CT region and across the thematic areas of MPAs and Fisheries, there appears to be a better fit between ecological connectivity and institutional linkages.
Misfit between the ecological and governance structures is important because it can, for example, decouple costs and benefits of resource use, and thus reduce incentives for sustainable management. Hence, in these areas of high misfit, the likelihood for long-term ecological and social benefits may be severely reduced. In the Coral Triangle, this indicates that important reefs and the trans-national ocean corridors utilized by dispersing marine species may lack institutional arrangements to support adequate levels of protection, leaving them at risk to local and international threats. Regional governance structures such as the CTI are well positioned to address these misfits, indeed, it is these sorts of international issues that the CTI was intended to identify and help to resolve.

ANALYSING THE (MIS)FIT BETWEEN INSTITUTIONAL AND ECOLOGICAL NETWORKS OF THE CORAL TRIANGLE 7
The reefs of the Indo-Pacific Ocean are characterized by exceptionally high levels of biodiversity (Roberts et al., 2002; Carpenter et al., 2011) and support the livelihoods of more than 138 million local people (Burke et al., 2011). This region (Figure 1), encompassing the Coral Triangle (Veron et al., 2009), is a global center of marine biodiversity (Roberts et al., 2002). Unfortunately, it is under immediate threat with an estimated 95% of the coral reefs being impacted by human activities (Burke et al., 2002). As a result, these threatened ecosystems have become an international priority for conservation and management; awareness of this threat inspired the regionally-organized Coral Triangle Initiative on Coral Reefs, Fisheries and Food Security (CTI-Secretariat, 2009). The Coral Triangle Initiative (CTI) has put forward a Regional Plan of Action (RPOA) and six corresponding National Plans of Action for improving the health of the marine environment and wellbeing of the local communities (CTI-CFF, 2009). The RPOA sets forth regional and national priorities to achieve five long-term goals: “(1) Priority seascapes are designated and effectively managed; (2) An ecosystem approach to fisheries management and other marine resources is fully applied; (3) Marine protected areas (MPAs) are established and effectively managed; (4) Climate change adaptation measures are achieved, and (5) The status of threatened species is improving” (CTI-CFF, 2009).
Halpern et al. (2012) interpret the action plan as prescribing a hierarchical management strategy in which MPAs are used in balancing the objectives of biodiversity protection with resource use. Due to the complex social, political, and ecological structures, and the enormous geographic extent of the Coral Triangle, analyzing how well the regional institutions1 fit the ecology has been difficult, but is urgently needed.
According to Fidelman & Ekstrom (2012), the structure of marine governance throughout the Coral Triangle is incredibly complex, fragmented, and characterized by jurisdictional overlaps, but not unlike any other large-scale system. Further, the multidimensional governance architecture of the Coral Triangle reveals significant variability in institutional arrangements among countries and topics of interest (e.g., fisheries, threatened species, MPAs, etc.). The authors argue that inter-institutional coordination and assistance may improve regional effectiveness and would depend, in part, on the fit or misfit between governance and the biophysical system to which they apply. This institutional-ecological fit is the primary focus of this research.
The Institutional-Ecological Problem of FitResearch on sustainability is increasingly focused on transcending the boundaries between the social- and natural sciences in order to embrace a more integrative systems perspective that acknowledges the numerous links between the social and ecological domains (Berkes et al., 2003). These different types of links are intertwined forming complex social-ecological interdependencies (Cumming et al., 2006). Different governance challenges and opportunities thus arise as a consequence of how the social and ecological domains are integrated. This perspective of coupled Social-Ecological Systems (SES), often referred to as “the problem of fit”, has received considerable interest (Young, 2002;
1 In this report, institutions or institutional arrangements refer to the rules (e.g., policies, legislation, property rights, decision-making procedures) that govern the use and management of marine resources (Ostrom, 2005).
INTRODUCTION

ANALYSING THE (MIS)FIT BETWEEN INSTITUTIONAL AND ECOLOGICAL NETWORKS OF THE CORAL TRIANGLE 8
Brown, 2003; Crowder et al., 2006; Folke et al., 2007; Galaz et al., 2008; Brondizio et al., 2009; Ekstrom & Young, 2009). The interest stems from the basic assumption that the sustainability of SES relies on ecological and the governance processes being well aligned. This perspective encapsulates many different dimensions of “fit” (e.g. functional-, spatial-, and institutional fit, see (Cash et al., 2006).
At focus for this study is the level of fit between the geographical and/or functional scales at which key ecological processes occur and the governance structures relating to the management of these processes. Misfit between the ecological and governance structures can, for example, decouple costs and benefits of resource use, and thus reduce incentives for sustainable management (Prugh, 1999; Cumming et al., 2006). Hence, “bad” alignment (high degree of misfit) may lead to “bad” governance, which implies that the likelihood for long-term ecological and social benefits is severely reduced. In the context of coral reefs in the Coral Triangle, this means that key reefs and the trans-national ocean corridors utilized by dispersing marine species, would be lacking institutional arrangements to support adequate levels of protection since their role in the larger region is neither collectively acknowledged nor actively managed in an appropriate multi-national governance context.
In this study we operationalize this concept of fit in terms of ecological marine connectivity on one hand, and relevant institutional linkages on the other. Ecological connectivity is defined as the “ability of a species to move across the landscape/seascape to different areas of suitable habitats” (cf.)(Taylor et al., 1993). It is captured here by the abilities of different marine species to disperse between different areas of coral reefs (Cowen et al., 2006; Treml et al., 2012). An institutional linkage occurs when two countries take part in a common treaty, convention, agreement, or memorandum of understanding, addressing issues of concerns directly or indirectly related to ecological connectivity. There are naturally many issues of concern that relate to ecological connectivity, thus we have for this study investigated a range of different issues.
The explicit goals of this research were to (1) develop and analyze a database describing the international institutional arrangements pertaining to the governance of the region’s coral reefs, i.e., map and quantify a regional institutional network, (2) recast the structure of coral reef connectivity in terms of the potential ecological linkages among countries to define the regional ecological network, and (3) analyze the integrated institutional-ecological networks to identify the degree of fit (key alignments and misalignments) to help illustrate and improve the region’s marine governance.

ANALYSING THE (MIS)FIT BETWEEN INSTITUTIONAL AND ECOLOGICAL NETWORKS OF THE CORAL TRIANGLE 9
The geographic focus of this study is the Indo-Pacific Ocean, encompassing the six Coral Triangle Initiative countries (CT6) and their neighbors (Figure 1). Based on preliminary assessment we removed two countries from the analysis: Taiwan due to the lack of international recognition as a sovereign state; and Singapore due to the relatively small marine jurisdictional footprint (< 825km2) and limited marine resources (<100km2 coral reef habitat). The final analysis included 13 countries, including all of the CT6 (see Table 2).
To assess the extent of fit and misfit between the ecological connectivity and the relevant environmental institutions, the analysis was based on results of two types of network analysis (ecological connectivity and institutions). Then for several topics (e.g., fisheries and MPAs), we tested how well the resulting topic-based network of institutions fits with the ecological network. Both the ecological and institutional networks are described below, followed by a description of how we calculated the degree of fit between these networks and identified misfit.
Ecological networksThe ecological network is defined by ecologically significant connectivity between individual coral reefs of the region, aggregated up to the level of single countries. Ecological connectivity is defined as the likelihood that, for a particular species, larvae originating at a source coral reef are capable of dispersing and reaching downstream reef habitat. We modeled this ecological connectivity for three ‘typical’ coral reef taxa as in Treml & Halpin (2012). Although fine-scale structure of ecological connectivity can be quite sensitive to individual biological parameters such as spawning time, reproductive output, and the time spent dispersing, the pairwise source-destination reefs of these linkages often remain consistent between similar species. For this reason, and for computational tractability, we define the region’s ecological connectivity based on three generalized marine taxa: a broadcast spawning coral, a benthic reef fish, and pelagic-spawning reef fish. For each taxon, dispersal was modeled (Treml et al., 2012) and the ecological connectivity among reef was quantified as the probability of dispersal linkages over two generations. These reef-based connectivity matrices were aggregated up to the country level and simplified to show where strong ecological connectivity exists between countries (link = 1) and where no ecological connectivity exists (link = 0). The networks for the three taxa were added resulting in a final multi-species ecological network among countries were connection values rang from zero (a lack of ecological connectivity across taxa) to 3 (strong ecological connectivity for all three species). This multi-species network is used throughout to represent the region’s ecologically relevant coral reef connectivity.
Institutional networksThe approach to capture the institutional networks is drawn from recent research on trans-boundary governance in the Coral Triangle region (Fidelman & Ekstrom, 2012). A total of 200 documents pertaining to international environmental arrangements involving two or more of the 13 countries of interest were identified and collected between May and June 2013. The English language documents were identified and gathered primarily from the ECOLEX database (www.ecolex.org) by searching each of the CTI countries in this database. This database included
METHODOLOGY

ANALYSING THE (MIS)FIT BETWEEN INSTITUTIONAL AND ECOLOGICAL NETWORKS OF THE CORAL TRIANGLE 10
conventions, treaties, plans, policy declarations, resolutions and memoranda of understanding with varying geographical and jurisdictional focus (bi-lateral, multilateral, regional and global) and legal status (binding and non-binding). The documents were analyzed in MINOE v1.10, a software tool to analyse documents as they relate to the management of ecological systems (Ekstrom et al., 2010), drawing on the approach employed in Fidelman & Ekstrom (2012). The analysis consisted of counting the number of times key terms appeared in the compilation of documents.
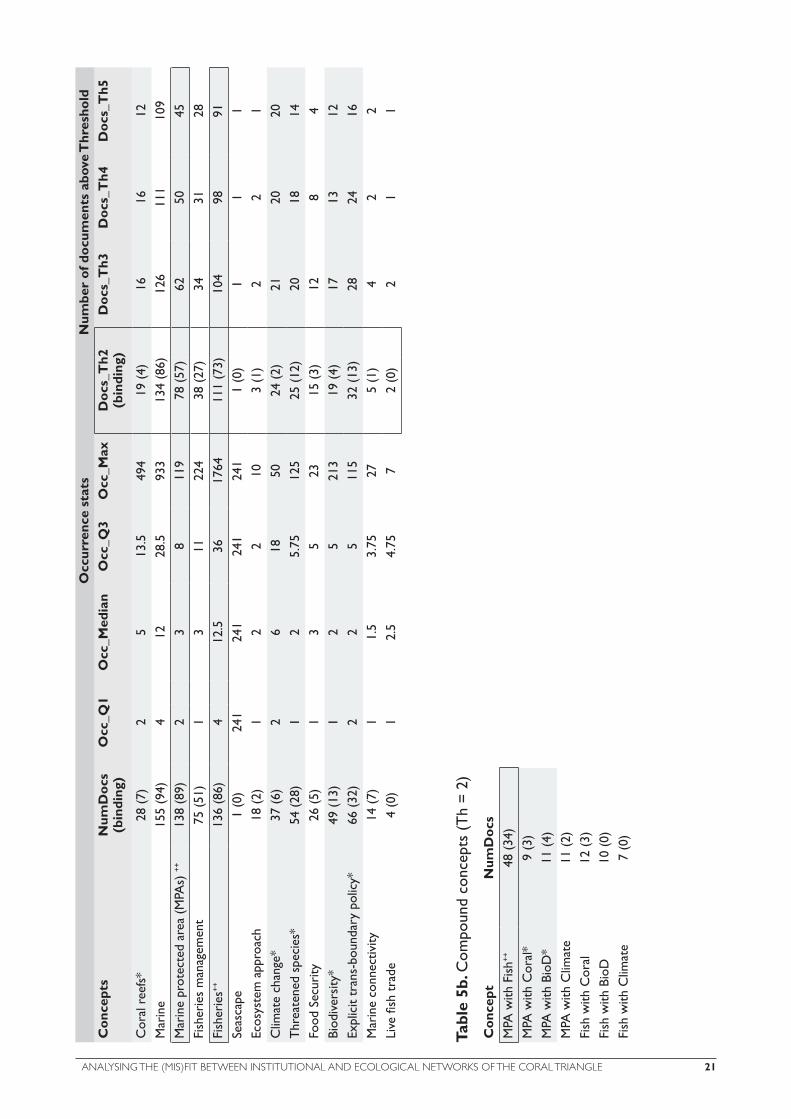
This term frequency was used as a proxy indicator of the extent to which the documents related to one or more ecological topics of interest (defined through specific key terms). For this purpose, key terms were organized and aggregated into ‘concepts’ defining the key topics of interest (Table 3) relating to the ecological connectivity and goals of the CTI. This analysis resulted in two data matrices: 1) a document by term data matrix storing the term frequency per document, and 2) a document by country data matrix indicating each country’s participation in each arrangement represented by the documents. These two data matrices were integrated to quantify the unique linkages among countries. Here, an individual institutional linkage between two countries was counted if there were more than two occurrences (a range in minimum-occurrence thresholds were explored) of a particular search concept within a document where these two countries were participants. This minimum occurrence threshold was chosen to eliminate those instances where the key term is mentioned infrequently indicating the topic may not have been dealt with substantially within the document. As a result, each document can generate many linkages where multiple terms are found and multiple countries are involved. The linkage data for the region were represented as institutional networks where the nodes consisted of individual countries and the ties among them showed the strength of the linkage (i.e., the number of linkages in common between a pair of countries) for each concept.
A key challenge of this research was to define which issues were of relevance for protecting ecological connectivity. Effective connectivity between distant coral reef communities relies, in part, on the existence of coral reef stepping-stones spread throughout the region. If, for example, there are large areas devoid of reefs, very few reef species will be able to disperse through this “wasteland”. If, however, patches of high quality reef were scattered throughout the area, more species would be able to disperse through the area over multiple generations (Bodin & Norberg, 2007; Treml et al., 2008). However, reefs that make up such ‘corridors’ for dispersal need to be maintained and protected from ecologically detrimental activities such as destructive fishing practices, overfishing, pollution and climate change. In order to capture pertinent institutional arrangements relevant for ecological connectivity, we thus focused on arrangements regarding protection (i.e. conservation), and/or fisheries. Although all relevant concepts (Table 3) were analyzed, we present results for the three that are most central to marine connectivity and conservation issues: Marine Protected Areas (MPAs), Fisheries, and a composite [MPAs + Fisheries] network. Institutional linkage strengths were reclassified based on the relative strengths defined by the quantiles across the entire network: High/strong institutional arrangement (4th quantile), Medium-high/strong institutional arrangement (3rd quantile), Medium-low institutional arrangement (2nd quantile), and No/Weak institutional arrangement (1st quantile).
To explore the non-spatial yet broad-scale institutional fit (alignments), we also used a principle components analysis and plot of the document database. This technique for visualizing highly multivariate data transforms and reduces the data to show the relationships that best explain (and highlight) the variance. In this way, objects (countries and documents) in the plot that are

ANALYSING THE (MIS)FIT BETWEEN INSTITUTIONAL AND ECOLOGICAL NETWORKS OF THE CORAL TRIANGLE 11
closer together are more similar. Herein, each country is shown as a vector where the length and direction represents that country’s institutional arrangements in relation to all other countries/documents, giving an alternative picture of the region’s institutional landscape.
Network analysisThe primary objective with this study was to assess the different institutional and ecological networks as complimentary systems to evaluate their fit. Specifically, we sought to reveal cases in which two countries are linked ecologically, whether these same countries also connected through shared participation in international agreements. Thus, we developed a typology of combined ecological- and institutional linkages based on the union of the two networks (Table 4, and see Bergsten et al., in progress, for a similar approach). This typology was developed to be consistent across all ecological-institutional networks and be quickly/easily interpreted (For a schematic, see Figure 2). Four categories were of greatest interest:
• Very high level of misalignment: Red linkages show where ecological connectivity exists for all three species and institutional linkages are lacking or weak. This represents misalignment since strong ecological connectivity is not paired with joint institutional arrangements, which suggest weak governance and could result in loss of critical ecological connectivity.
• High level of misalignment: Orange linkages show where there is a significant mismatch between the ecological connectivity and the strength of institutional arrangements (i.e. the ecological connectivity is not paired with institutional linkages of comparable strength).
• Medium level of misalignment: Green linkages represent a slight mismatch between the strength of ecological connectivity and the relative strength of institutional arrangements.
• Low level of misalignment: These gray linkages represent connections where some ecologically-significant connectivity exists yet the strength of institutional linkages appear to be strong. These instances would represent good alignment since ecological connectivity is paired with institutional connectivity, which potentially increases the likelihood for the long-term preservation of ecological connectivity.
Note: for visual clarity, all linkages representing various institutional arrangements where no ecological connectivity exists have been removed from ecological-institutional networks (Figure 6). For many of these networks, the number of these institutional-only linkages removed can be quite high. These situations where relevant institutional arrangements exist yet there is limited ecological connectivity are more ambiguous to interpret. On one hand, institutional connectivity implies some level of international collaboration that is likely beneficial (or at least has the potential to produce benefits). On the other hand, and from a strict ecological connectivity perspective, it might not be the most efficient use of limited resources in developing joint institutional arrangements.

ANALYSING THE (MIS)FIT BETWEEN INSTITUTIONAL AND ECOLOGICAL NETWORKS OF THE CORAL TRIANGLE 12
In the 200 policy documents included in the database, 117 were legally binding. Using a minimum threshold of 3 occurrences per document (effectively ignoring potential institutional linkages where the specific search term/concept was used 2 or fewer times), 169 unique documents remain (103 binding), contained 659 institutional linkages (347 binding), of which 145 are considered compound institutional linkages of two or more concepts (64 binding). All subsequent analyses were performed on all binding and non-binding documents, using a minimum search term threshold of 3 occurrences per document. Table 5a and 5b shows document, concept, and threshold statistics for the complete database. As described above, we focused on the key concepts of: Marine Protected Areas (MPAs), Fisheries, and the combined MPAs + Fisheries linkages. Below we present the following results: (1) patterns of the countries’ participation in the international agreements; (2) ecological networks linking countries based on their ecological connectivity; (3) networks of countries based on their involvement in the set of international agreements; and (4) the degree of fit and identified gaps between countries for how well the institutional network reflects the ecological connectivity in the region between countries.
Thematic institutional fitThe alignment of thematic institutional ‘interests’ among countries are shown in Figure 3. While the examination of the documents defined by terms such as 'MPA' is informative for congruence to ecological processes, there is merit in analyzing the general international relationship that exists for all countries that have participated in any of the 200 documents. We used a principal components analysis to highlight how each country aligned with any other country in participating in institutional arrangements represented by the documents (by a singular value decomposition of the document-by-country data matrix). Each document was essentially allocated into the abstract multidimensional space defined by the 13 countries. The two dimensions with the strongest explanation of the variance across the 200 documents were then plotted. The red arrows indicate the association strength that each country has for the documents (shown as +) and importantly the direction of the arrows indicates the broad similarity in the participating patterns of the countries. For example, Australia, Papua New Guinea and US-Northern Mariana Islands (AUS, PNG MNP) tend to participate in the same documents/institutional arrangements. Importantly Malaysia, Indonesia and Philippines (MYS, IDN, PHL) tend to participate in a different suite of documents/arrangements to Palau, Micronesia and Solomon Islands (PLW, FSM, SLB). This analysis provides a background appreciation of the diverse institutional processes in the region.
Ecological connectivityThe three individual taxa and the composite multi-species networks showing the ecologically significant linkages among countries show strong geographic patterns (Figure 4). The pattern of linkages within these networks illustrates the ecological neighbors among countries (Treml & Halpin, 2012), following major ocean current corridors. Although directionality is preserved, only the direction of the strongest connection between a pair of countries is shown, the thickness directly proportional to the strength of connectivity. Across species, the core of the Coral Triangle countries appears to be strongly connected while embedded, to various degrees, within the region.
KEY FINDINGS

ANALYSING THE (MIS)FIT BETWEEN INSTITUTIONAL AND ECOLOGICAL NETWORKS OF THE CORAL TRIANGLE 13
Within the multi-species network, connections common to a single species are colored in gray, those common to two species are shown in orange, and connections common across all species are highlighted in red (all independent of the direction of connectivity). This multi-species network shows that all countries within the Coral Triangle are strongly ecologically connected. Japan (JPL) is only weakly connected to the Coral Triangle (via Taiwan, not shown) and the US Mariana Islands and Guam (MNP) are ecologically isolated for these species.
Institutional linkagesThe institutional linkage networks and their link-weight histograms are shown in Figure 5 for the three key networks: MPAs linkages, Fisheries linkages, and MPAs + Fisheries compound linkages (see the Appendix, for the remaining networks). Across all networks, thick black lines represent the upper quantile (i.e., very strong linkages), the orange color represents the middle quantiles (Q2 & Q3), and the thick red lines show the lower quantile (Q1, weak linkages). The size of country nodes is in proportion to the relative number of document-term linkages each country is involved in. The position of all nodes is tied to their relative geographic location (as in the ecological networks). Although all networks are using a minimum threshold of three occurrences per document, those networks involving a relatively high number of documents are robust to significant variability in this threshold value (see Table 5 for document statistics across thresholds). All three topic-based networks have some similarities: universally weak connections with Timor-Leste (TLS as small node with a starburst of red linkages), some weak ties with Malaysia (MYS), and some weak or variable linkages with Micronesia (FSM) and the Solomon Islands (SLB). In addition, the frequency and spatial coverage of gray and orange linkages (strong and moderate, respectively) clearly show some regional cohesiveness in arrangements across these concept areas.
Ecological-institutional (mis)fitIn integrating the multi-species ecological network with the institutional linkage networks, the ecological-institutional linkages can be easily identified across the entire alignment-to-misalignment spectrum (see Table 4 for categories, risk levels, and color key). The three key networks are shown in Figure 6 along with their geographic interpretation. Here, red linkages represent a very high level of misalignment (high ecological connectivity and weak or no institutional linkages), orange connections are high levels of misalignment, green as medium levels, and gray linkages illustrate where ecological connectivity occurs yet the strength of institutional arrangements appears to be strong. All institutional linkages where ecological connectivity is absent have been removed for clarity (these linkages are all shown in Figure 5). Focusing on the high/very high level of misalignment (red & orange), the greatest degree of misalignment occurs between Indonesia (IDN) and Timor-Leste (TLS), followed by connections with Vietnam (VNM) and Malaysia (MYS) with Indonesia and the Philippines (PHL). Throughout most of the regional network, there appears to be higher levels of alignment between the ecological connectivity and the strength of institutional linkages. The Mariana Islands and Guam (MNP) are ecologically disconnected from the rest of the region for the three species, and therefore appears as an isolated node in the networks (for the institutional linkages, see Figure 4).

ANALYSING THE (MIS)FIT BETWEEN INSTITUTIONAL AND ECOLOGICAL NETWORKS OF THE CORAL TRIANGLE 14
Overall, the CT countries appear to have high levels of alignment in terms of international institutional arrangements on MPAs and marine connectivity. This means that countries that are connected ecologically also share participation in MPA-related international agreements. However, the analysis on fisheries-related agreements shows a much lower degree of fit (alignment) with the ecological connectivity. Across the three focal (mis)fit networks (Figure 6) and focusing on the network linkages representing high levels of misalignment (red & orange), the greatest degree of ecological-institutional misalignment occurs between Indonesia (IDN) and Timor-Leste (TLS). The second-greatest misalignments were found in the lack of connections from Vietnam (VNM) and Malaysia (MYS) to their neighboring countries. Here, the ecological connectivity is not matched with international institutional arrangements, suggesting that efforts may be needed to develop new arrangements to strengthen ties along these ecological corridors. Throughout most of the remaining Coral Triangle and across the thematic areas of MPAs and Fisheries, there appears to be adequate alignment between ecological connectivity and the strength of institutional linkages.
Some of this lack of fit might be explained in a number of potential ways. For example, since Timor-Leste is a very young country still in the process of nation-building and defining its sovereignty and role in the region, policies on ecological issues have likely received low priority. However, the ecological connectivity analysis shows us that Timor-Leste is a potential source for coral and fish larvae to Australia and at the same time is a recipient of larvae from Indonesia. Therefore, it could be especially in Australia’s best interest for supporting its own reefs to continue to develop their relationship with Timor-Leste. Likewise, Timor-Leste might benefit from engaging more with the other Coral Triangle countries (and Australia) on such matters. Such engagement could, over time, contribute to increasingly ecologically-aligned linkages.
On a larger geographic scale reaching beyond the CTI countries, Vietnam appears strongly ecologically linked to this core region (Figure 4), yet this strong ecological tie is not matched with equally strong institutional arrangements. Thus, one possible conclusion would be that efforts are needed to develop new arrangements involving the CTI countries and Vietnam to address this misalignment. Alternatively, if Vietnam were to sign some of the existing fisheries agreements in which the other CT6 countries participate, this would also fill this gap. Considering the apparent similarity in institutional arrangement trends between Vietnam and other CT6 countries (i.e., Vietnam is close to the Philippines, Indonesia, and Malaysia in Figure 3), the level of effort required for this realignment may be relatively low.
Finally, the number of links is noticeably high in the institutional networks (see Figure 5 and those in the appendix), often much higher than the relative level of ecological connectivity as defined here (corresponding to all white or gray cells in Table 4). This (mis)alignment is harder to interpret, and it would likely be misleading to define it as a mismatch, because joint environmental institutional arrangements are needed and beneficial for many issues of concern not directly related to marine connectivity (e.g. climate change). However, one possible use of the framework developed here is that it can be used to highlight pairs of countries (or clusters of countries) where the usefulness of joint arrangements needs to be assessed and justified on issues not directly related to marine
DISCUSSION AND CONCLUSIONS

ANALYSING THE (MIS)FIT BETWEEN INSTITUTIONAL AND ECOLOGICAL NETWORKS OF THE CORAL TRIANGLE 15
connectivity. Given that joint agreements take considerable time and effort to develop, implement, and maintain, such an assessment could be useful for a cost-benefit analysis on where to direct limited international governance efforts.
Throughout our analysis, we have had to make a number of explicit and implicit assumptions. In addition to those stated earlier, several others should be mentioned. First, this interpretation assumes that the institutional linkage database is representative of the ‘real’ policy/governance activities in the region, or at least captures the important/major elements. Second, we have necessarily ignored all within-country international arrangements. A more hierarchical and in-depth approach would be needed to resolve these local-scale arrangements. Finally, we do not know the extent to which the institutional arrangements have been implemented, and if so, how effective they are. Some level of ground-truthing is needed to establish the degree to which our proxy for institutional linkages truly reflects coordination between countries. Nonetheless, this approach could be used to help shed light on the alignment of governance structures and the biophysical systems they aim to manage, including terrestrial and aquatic resources (Bodin & Tengo, 2012), in additional to large marine regions as presented here.

ANALYSING THE (MIS)FIT BETWEEN INSTITUTIONAL AND ECOLOGICAL NETWORKS OF THE CORAL TRIANGLE 16
This study focused on institutional arrangements at the international level. Additional work on ecological-institutional fit (alignment) in the Coral Triangle region at national and sub-national (i.e., provinces, villages, local communities) levels would be beneficial, since considerable resource management in the region occurs at these levels. Data requirements, processing time, and the need for local knowledge/partnerships would increase dramatically. The CTI, with its staff, technical working groups, Priority Geographies, partner NGOs, and National Coordinating Committees, may be a good candidate to lead this type of coordinated data collection effort.
In addition, the CTI Thematic Working Groups could encourage stronger international linkages where misfits are strongest. These efforts could be based on newly developed regional policy frameworks on MPAs and Fisheries, including the Coral Triangle Initiative Marine Protected Area System Framework and Action Plan (CTI-CFF, 2013) and the EAFM Regional Framework (CTI-CFF, in prep.). Efforts that spatially document ecological and social resources, such as the Coral Triangle Atlas (ctatlas.reefbase.org) could also play a strong role in highlighting the need to address misalignments and improve international environmental connectivity.
This sort of a coordinated effort at regional, national and sub-national scales could support long-term monitoring and evaluation of how improving institutional fit to the ecosystem can in fact improve the health and sustainability of the marine ecosystem and the services it provides.
Additional analyses into the resilience of the ecological-institutional networks to climate change and other social and environmental threats would also be beneficial. Countries are not equal in their capacity to legislate, protect, and fund resource management, and the potential impact of this heterogeneity among and within Coral Triangle nations should be explored. A network-based resilience study quantifying the impact and importance of each country to the overall ecological-governance stability would identify key focal areas for intervention.
Finally, adding more species to the ecological connectivity analysis would add a greater degree of confidence in the ability to capture community-level connectivity for these ecosystems. In particular, adding key pelagic species (e.g., tuna), and other economically important species such as coral trout, grouper, or sea urchins would be important. This would involve a much higher computational investment and further analysis including a great geographic extent in terms of the dispersal/migration routes and in terms of the extent of the institutional arrangements.
FUTURE WORK AND CONSIDERATIONS

ANALYSING THE (MIS)FIT BETWEEN INSTITUTIONAL AND ECOLOGICAL NETWORKS OF THE CORAL TRIANGLE 17
REFERENCESBergsten, A., Galafassi, D. & Bodin, O. (in progress) The problem of spatial fit: Comparing social and ecological connectivity
in land-use planning using a spatially explicit network approach.
Berkes, F., Folke, C. & J, C. (2003) Navigating Social-Ecological Systems: Building Resilience for Complexity and Change.
Cambridge University PressBerkes.
Bodin, O. & Norberg, J. (2007) A network approach for analyzing spatially structured populations in fragmented landscape.
Landscape Ecology, 22, 31-44.
Bodin, O. & Tengo, M. (2012) Disentangling intangible social-ecological systems. Global Environmental Change-Human and
Policy Dimensions, 22, 430-439.
Brondizio, E.S., Ostrom, E. & Young, O.R. (2009) Connectivity and the Governance of Multilevel Social-Ecological Systems:
The Role of Social Capital. Annual Review of Environment and Resources, pp. 253-278. Annual Reviews, Palo Alto.
Brown, K. (2003) Integrating conservation and development: a case of institutional misfit. Frontiers in Ecology and the
Environment, 1, 479-487.
Burke, L., Selig, E. & Spalding, M. (2002) Reefs at risk in Southeast Asia. World Resources Institute.
Burke, L., Reytar, K., Spalding, M.D. & Perry, A. (2011) Reefs At Risk Revisited. In, p. 130. World Resources Institute,
Washington, D.C.
Carpenter, K.E., Barber, P.H., Crandall, E.D., Ablan-Lagman, M.C.A., Ambariyanto, Mahardika, G.N., Manjaji-Matsumoto,
B.B., Juinio-Menez, M.A., Santos, M.D., Starger, C.J. & Toha, A.H.A. (2011) Comparative phylogeography of the coral
triangle and implications for marine management. Journal of Marine Biology, 2011, 1-14.
Cash, D.W., Adger, W.N., Berkes, F., Garden, P., Lebel, L., Olsson, P., Pritchard, L. & Young, O. (2006) Scale and cross-scale
dynamics: Governance and information in a multilevel world. Ecology and Society, 11
Coral Triangle Initiative on Coral Reefs, Fisheries and Food Security (CTI-CFF). (2013) Regional Plan of Action. Jakarta,
Indonesia: CTI-CFF.
Coral Triangle Initiative on Coral Reefs, Fisheries and Food Security (CTI-CFF). (2013) Coral Triangle Marine Protected
Area System Framework and Action Plan. CTI-CFF, United States Agency for International Development Coral Triangle
Support Partnership and US National Oceanic and Atmospheric Administration, Cebu City, Philippines.
Coral Triangle Initiative on Coral Reefs, Fisheries and Food Security (CTI-CFF). (in prep.) Ecosystem Approach to
Fisheries Management in the Coral Triangle--Framework and Action Plan.
Cowen, R.K., Paris, C.B. & Srinivasan, A. (2006) Scaling of Connectivity in Marine Populations. Science, 311, 522-527.
Crowder, L.B., Osherenko, G., Young, O.R., Airame, S., Norse, E.A., Baron, N., Day, J.C., Bouvere, F., Ehler, C.N., Halpern,
B.S., Langdon, S.J., McLeod, K.L., Ogden, J.C., Peach, R.E., Rosenberg, A.A. & Wilson, J.A. (2006) Sustainability - Resolving
mismatches in US ocean governance. Science, 313, 617-618.
Cumming, G.S., Cumming, D.H.M. & Redman, C.L. (2006) Scale mismatches in social-ecological systems: Causes,
consequences, and solutions. Ecology and Society, 11.
Ekstrom, J.A. & Young, O.R. (2009) Evaluating Functional Fit between a Set of Institutions and an Ecosystem. Ecology and
Society, 14.
Ekstrom, J.A., Lau, G.T., Spiteri, D.J., Cheng, J.C.P. & Law, K.H. (2010) MINOE: A Software Tool to Analyze Ocean
Management Efforts in the Context of Ecosystems. Coastal Management, 38, 457-473.

ANALYSING THE (MIS)FIT BETWEEN INSTITUTIONAL AND ECOLOGICAL NETWORKS OF THE CORAL TRIANGLE 18
Fidelman, P. & Ekstrom, J.A. (2012) Mapping seascapes of international environmental arrangements in the Coral Triangle.
Marine Policy, 36, 993-1004.
Folke, C., Pritchard, L., Jr., Berkes, F., Colding, J. & Svedin, U. (2007) The problem of fit between ecosystems and institutions:
Ten years later. Ecology and Society, 12.
Galaz, V., Olsson, P., Hahn, T., Folke, C. & Svedin, U. (2008) The Problem of Fit among Biophysical Systems, Environmental and
Resource Regimes, and Broader Governance Systems: Insights and Emerging Challenges.
Halpern, B.S., Diamond, J., Gaines, S., Gelcich, S., Gleason, M., Jennings, S., Lester, S., Mace, A., McCook, L., McLeod, K.,
Napoli, N., Rawson, K., Rice, J., Rosenberg, A., Ruckelshaus, M., Saier, B., Sandifer, P., Scholz, A. & Zivian, A. (2012) Near-
term priorities for the science, policy and practice of Coastal and Marine Spatial Planning (CMSP). Marine Policy, 36,
198-205.
Ostrom, E. (2005) Understanding institutional diversity. Princeton University Press, Princeton.
Prugh, T. (1999) Natural capital and human economic survival. CRC Press.
Roberts, C.M., McClean, C.J., Veron, J.E.N., Hawkins, J.P., Allen, G.R., McAllister, D.E., Mittermeier, C.G., Schueler, F.W.,
Spalding, M., Wells, F., Vynne, C. & Werner, T.B. (2002) Marine biodiversity hotspots and conservation priorities for
tropical reefs. Science, 295, 1280-1284.
Taylor, P.D., Fahrig, L., Henein, K. & Merriam, G. (1993) Connectivity is a vital element of landscape structure. Oikos, 68,
571-573.
Treml, E., Halpin, P., Urban, D. & Pratson, L. (2008) Modeling population connectivity by ocean currents, a graph-theoretic
approach for marine conservation. Landscape Ecology, 23, 19-36.
Treml, E.A. & Halpin, P.N. (2012) Marine population connectivity identifies ecological neighbors for conservation planning
in the Coral Triangle. Conservation Letters, 5, 441-449.
Treml, E.A., Roberts, J.J., Chao, Y., Halpin, P.N., Possingham, H.P. & Riginos, C. (2012) Reproductive Output and Duration
of the Pelagic Larval Stage Determine Seascape-Wide Connectivity of Marine Populations. Integrative and Comparative
Biology, 52, 525-537.
US Central Intelligence Agency (US CIA). World Fact Book. https://www.cia.gov/library/publications/the-world-
factbook/. Accessed November 10, 2013.
Veron, J.E.N., Devantier, L.M., Turak, E., Green, A.L., Kininmonth, S., Stafford-Smith, M. & Peterson, N. (2009) Delineating
the Coral Triangle. Galaxea, Journal of Coral Reef Studies, 11, 91-100.
Young, O.R. (2002) The institutional dimensions of environmental change: fit, interplay, and scale. MIT Press, Cambridge,
Massachusetts, USA.

ANALYSING THE (MIS)FIT BETWEEN INSTITUTIONAL AND ECOLOGICAL NETWORKS OF THE CORAL TRIANGLE 19
TABLES
Table 1. Countries of the Coral Triangle: 2013 estimates of Population, Growth Rates, and World Ranking for Growth Rates (US CIA 2013).
Country Population Growth Rate World Ranking (Growth Rate)Indonesia 251,160,124 0.99% 117Malaysia 29,628,392 1.51 80Papua New Guinea 6,431,902 1.89 62Philippines 105,720,644 1.84 64Solomon Islands 597,248 2.12 46Timor-Leste 1,172,390* 2.47 32
*Date for Timor-Leste population estimate not provided; other estimates range as low as 800,000
Table 2. Country abbreviations. *indicates Coral Triangle Initiative country (CT6)
Abbr CountryFSM MicronesiaMNP Northern Mariana Islands and Guam (United States of America)AUS AustraliaMYS Malaysia*CHN ChinaJPL JapanIDN Indonesia*TLS Timor-Leste*SLB Solomon Islands*PLW PalauPNG Papua New Guinea*VNM VietnamPHL Philippines*
Table 3. Concepts and search terms used in the institutional linkage analysis.
Concept Terms used in MINOE term count analysisCoral reefs coral* reef* seagrass* mangrove*Marine marine ocean nearshore "near-shore" coastal coast sea*Marine protected area (MPAs)
"marine protected area" "marine protected areas" "marine reserve" "marine reserves" "marine park" "marine parks" "marine sanctuary" "marine sanctuaries" "protected area" no-take MPA*
Fisheries management "fisheries management" "manage fisheries" by-catch "stock assessment" "destructive fishing"
Fisheries fish fishery fisheries fishing fishers overfish* over-fish* tunaSeascape seascape* ecoregion* "regional sea"Ecosystem approach "ecosystem approach" "ecosystem management" ecosystem-based
"ecosystem services"Climate change "climate change" acidification "sea level rise" bleachingThreatened species "threatened species" "species threatened" "endangered species" "species
endangered", "endangered fauna" "sea turtle" shark* "marine mammal" seabird* "sea bird" grouper*

ANALYSING THE (MIS)FIT BETWEEN INSTITUTIONAL AND ECOLOGICAL NETWORKS OF THE CORAL TRIANGLE 20
Concept Terms used in MINOE term count analysisFood Security "food security" "food fish"Biodiversity "biological diversity" biodiversityExplicit trans-boundary policy
cross-border "trans-shipment" "trans-boundary" bilateral multilateral transnational trans-national
Marine connectivity migration dispersal connectivityLive fish trade "live fish trade" ornamentals "live reef fish" "live reef food fish" "aquarium
fish"
Table 4. Alignment/misalignment typology based on the union between the institutional linkage networks (columns) and the ecological network (rows). Each cell in this table represents a uniquely possible ecological-institutional linkage between two countries. As described in the text, institutional linkages are categorized based on the linkage strength quantiles (Q1, Q2, etc.) and the ecological linkages are based on the number of species with high ecological connectivity. In all ecological-institutional networks the same color scheme is used with white linkages (no ecological connectivity) being removed for simplicity. Gray linkages show where ecological linkages exist yet there is a low level of misalignment.
Institutional Linkages (strengths)
Eco
logi
cal L
inka
ges
No/weak institutional
arrangements (Q1)
Medium-Low institutional
arrangements (Q2)
Medium-high institutional
arrangements (Q3)
High institutional arrangements (Q4)
0 species Alignment
Low risk
Misalignment
Low risk (?)Ambiguous Ambiguous
1 species Medium level
Misfit
Alignment
Low risk
Misalignment
Low risk (?)Ambiguous
2 speciesHigh level Misfit
Medium level
Misfit
Alignment
Low risk
Misalignment
Low risk (?)
3 speciesVery high level
Misfit High level MisfitMedium level
Misfit
Alignment
Low risk
Table 5a. Descriptive statistics of institutional linkage data. For each concept, the number of documents (and quantiles) in which the concept is mentioned is shown. In addition, the number of documents that mention the concept more than a given threshold (Th2 = more than 2 times) are highlighted. Concepts with (++) are the primary focus and those with (*) are presented in the Appendix.
ANALYSING THE (MIS)FIT BETWEEN INSTITUTIONAL AND ECOLOGICAL NETWORKS OF THE CORAL TRIANGLE 21
Occ
urre
nce
stat
sN
umbe
r of
doc
umen
ts a
bove
Thr
esho
ldC
once
pts
Num
Doc
s (b
indi
ng)
Occ
_Q1
Occ
_Med
ian
Occ
_Q3
Occ
_Max
Doc
s_T
h2
(bin
ding
)D
ocs_
Th3
Doc
s_T
h4D
ocs_
Th5
Cor
al r
eefs
*28
(7)
25
13.5
494
19 (
4)16
1612
Mar
ine
155
(94)
412
28.5
933
134
(86)
126
111
109
Mar
ine
prot
ecte
d ar
ea (
MPA
s) ++
138
(89)
23
811
978
(57
)62
5045
Fish
erie
s m
anag
emen
t75
(51
)1
311
224
38 (
27)
3431
28Fi
sher
ies++
136
(86)
412
.536
1764
111
(73)
104
9891
Seas
cape
1 (0
)24
124
124
124
11
(0)
11
1Ec
osys
tem
app
roac
h18
(2)
12
210
3 (1
)2
21
Clim
ate
chan
ge*
37 (
6)2
618
5024
(2)
2120
20T
hrea
tene
d sp
ecie
s*54
(28
)1
25.
7512
525
(12
)20
1814
Food
Sec
urity
26 (
5)1
35
2315
(3)
128
4Bi
odiv
ersi
ty*
49 (
13)
12
521
319
(4)
1713
12Ex
plic
it tr
ans-
boun
dary
pol
icy*
66 (
32)
22
511
532
(13
)28
2416
Mar
ine
conn
ectiv
ity14
(7)
11.
53.
7527
5 (1
)4
22
Live
fish
tra
de4
(0)
12.
54.
757
2 (0
)2
11
Tabl
e 5b
. Com
poun
d co
ncep
ts (
Th
= 2)
Con
cept
Num
Doc
sM
PA w
ith F
ish++
48 (
34)
MPA
with
Cor
al*
9 (3
)M
PA w
ith B
ioD
*11
(4)
MPA
with
Clim
ate
11 (
2)Fi
sh w
ith C
oral
12 (
3)Fi
sh w
ith B
ioD
10 (
0)Fi
sh w
ith C
limat
e7
(0)

ANALYSING THE (MIS)FIT BETWEEN INSTITUTIONAL AND ECOLOGICAL NETWORKS OF THE CORAL TRIANGLE 22
FIGURES
Figure 1. The study region of the Indo-Pacific Ocean, including the Coral Triangle Initiative focus area (darker blue shading). All countries considered are labeled by their 3-letter abbreviation (listed in Table 2) and the exclusive economic zones (EEZ) boundaries are shown in dark blue (disputed zones are hatched).
Figure 2. Schematic of the ecological-institutional arrangement network overlay. Ecological connectivity is quantified among countries (Eco Conn in green) and overlaid with the connectivity defined by institutional arrangements (Policy Conn in blue). The union of the two networks allows the ecological-institutional misfit (or alignment) to be quantified and mapped (note the moderate level of misfit in yellow and the high level of misfit in red).

ANALYSING THE (MIS)FIT BETWEEN INSTITUTIONAL AND ECOLOGICAL NETWORKS OF THE CORAL TRIANGLE 23
Figure 3. Trends in country-level institutional arrangements, showing the institutional alignment among countries with respect to the documents each is involved in. Countries at right angles to each other may have very different marine governance behavior or capacity, e.g., Malaysia (MYS) and China (CHN) or Japan (JPL), whereas countries aligned in opposite directions have opposing tendencies (often involved in different governance documents). Plus symbols (+) refer to the 200 unique documents.
Figure 4. Ecological networks. All connections shown in these networks are ecologically-significant, the dark/heavy linkages are highly significant (i.e., strong marine connectivity between countries), whereas thin lines represent significant, yet weak or intermittent ecological connectivity are shown in lighter shades. The direction of the linkage is for the strongest connectivity between any two countries. In the multi-species network (d), the dark blue connections are common to all three species, the light blue are common to two species, and the thin gray lines are unique to a single species.

ANALYSING THE (MIS)FIT BETWEEN INSTITUTIONAL AND ECOLOGICAL NETWORKS OF THE CORAL TRIANGLE 24
Figure 5. Institutional networks. In all networks, the strength of policy linkages is depicted using: thin black lines to represent the upper quantile (i.e., very strong linkages), orange to represent the middle quantiles (Q2 & Q3), and thick red lines show the lower quantile (Q1, weak linkages). The size of country nodes is in proportion to the relative number of linkages each country is involved in. The position of all nodes is tied to the relative geographic location.

ANALYSING THE (MIS)FIT BETWEEN INSTITUTIONAL AND ECOLOGICAL NETWORKS OF THE CORAL TRIANGLE 25
Figure 6. Ecological-Institutional Fit/Misfit Networks. The linkages in the ecological-institutional networks showing the alignment and misalignment as: red representing very high ecological-institutional misalignment (high ecological connectivity and weak or no institutional arrangements), orange connections for high risk of misalignment, green as medium risk, and gray linkages illustrate where ecological connectivity occurs yet the strength of institutional arrangements are at or above adequate levels (see Table 4 for additional typology details). All institutional linkages where ecological connectivity is absent have been removed for clarity.


![EIZO MIS File chemSHERPA-AI File Entry Manual€¦ · Saving MIS file Save the MIS file. ↓ Finish Closes the MIS file. [4] Launch of MIS file 4-1 Save the MIS File sent from EIZO](https://static.fdocuments.in/doc/165x107/5f595142b57ac474ba4cd907/eizo-mis-file-chemsherpa-ai-file-entry-manual-saving-mis-file-save-the-mis-file.jpg)